transition towards a decarbonised electricity sector … · 2019-10-02 · eapp eastern africa...
TRANSCRIPT

TRANSITION TOWARDS A DECARBONISED ELECTRICITY SECTOR – A FRAMEWORK OF ANALYSIS FOR POWER SYSTEM TRANSFORMATION

AUTHORS:NewClimate Institute: Gustavo De Vivero, Marie-Jeanne Kurdziel, Markus Hagemann
Re-Expertise: Karsten Burges
CONTACT:Marie-Jeanne Kurdziel [email protected]
ACKNOWLEDGEMENTS: The compilation of this report was supported by discussion and inputs from a number of experts. We would like to extend special thanks to Dimitri Pescia (Agora Energiewende), Xander van Tilburg (ECN part of TNO), Frauke Röser and Keno Riechers (NewClimate Institute) for reviewing and providing valuable feedback.
SUGGESTED CITATION: De Vivero, G., Burges, K., Kurdziel, M. and Hagemann, M. (2019) Transition towards a decarbonised electricity sector – A framework of analysis for power system transformation. NewClimate Institute, Re-expertise.
Project number: Registered under number 215025
The report can be downloaded at http://ambitiontoaction.net/outputs/
© Ambition to Action
This project is part of the International Climate Initiative (IKI). The Federal Ministry for the Environment, Nature Conservation and Nuclear Safety (BMU) supports this initiative on the basis of a decision adopted by the German Bundestag.
Supported by:
based on a decision of the German Bundestag

3
CONTENTS Abbreviations ___________________________________________________ 4
Glossary _______________________________________________________ 5
01 Introduction ___________________________________________________ 8
02 Power system transformation in the context of the Paris Agreement __ 10
03 Characteristics and challenges of variable renewable energy sources __11
04 Phases of power system transformation __________________________ 13
05 Country characteristics impacting power system transition __________ 17
06 Policies and measures guiding power system transformation ________ 20 6.1. Policies supporting the uptake of variable renewable energy sources _____________________________________________ 20 6.2. Measures supporting the integration of variable renewable energy sources _____________________________________ 21
07 Consolidation of results ________________________________________ 30
08 Country factsheets ____________________________________________ 31 8.1. Argentina __________________________________________________ 32 8.2. Germany __________________________________________________ 35 8.3. India ______________________________________________________ 38 8.4. Ireland ____________________________________________________ 41 8.5. Spain _____________________________________________________ 44 8.6. Turkey ____________________________________________________ 47 8.7. Kenya _____________________________________________________ 50 8.8. Uruguay ___________________________________________________ 53
References ____________________________________________________ 56

ABBREVIATIONS
AC Alternating Current AGC Automatic Generation Control BMU The Federal Ministry for the Environment,
Nature Conservation and Nuclear Safety (Bundesministerium für Umwelt, Naturschutz und Nukleare Sicherheit)
CAES Compressed Air Energy Storage CAMMESA Administrative Company of the Wholesale
Electricity Market (Compañía Administradora Del Mercado Mayorista Eléctrico Sociedad Anónima)
CCGT Combined Cycle Gas Turbines CECRE The Special Regime Control Centre
(Centro de Control del Régimen Especial) CESI European Confederation of Independent
Trade Unions (Confédération Européene des Syndicats Indépendants)
CO2 Carbon Dioxide COP Conference of the Parties DC Direct Current DER Distributed Energy Resources DISCOMMs Distribution Companies dRES Dispatchable Renewable Energy Sources DS3 Delivering a Secure, Sustainable Electricity
System Programme DSO Distribution System Operator EAPP Eastern Africa Power Pool ENTSO-E European Network of Transmission System
Operators for Electricity ESMAP Energy Sector Management Assistance
Programme ETS Emissions Trading System FIP Feed-In Premium FIT Feed-In Tariff FRT Fault Ride Through GHG Greenhouse Gas GIZ German Corporation for International
Cooperation (Gesellschaft für Internationale Zusammenarbeit)
GW Gigawatt GWh Gigawatt hours HVDC High Voltage Direct Current ICT Information and Communication Technology IEA International Energy Agency
IKI International Climate Initiative (Internationale Klimainitiative)
IRENA International Renewable Energy Agency KETRACO Kenya Electricity Transmission
Company Limited kV Kilovolt kW Kilowatt kWh Kilowatt hours LCPDP Least Cost Power Development Plan LDC Load Duration Curve MINEM Ministry of Energy and Mining MW Megawatt MWh Megawatt hours MtCO2eq Metric tons of carbon dioxide equivalent NDC Nationally Determined Contribution OECD Organisation for Economic Co-Operation and
Development PHS Pumped Hydro Storage PV Photovoltaic REE Spanish TSO (Red Eléctrica de España) REN21 Renewable Energy Policy Network
for the 21st Century RES Renewable Energy Sources RES-E Electricity from Renewable Energy Sources RO Renewable Obligations RPO Renewable Energy Purchase Obligations RPS Renewable Portfolio Standards SNSP System Non-Synchronous Penetration SONI System Operator for Northern Ireland TFC Total Final Electricity Consumption TW Terawatt TWh Terawatt hours REC Renewable Energy Certificates TSO Transmission System Operator UNDESA United Nations Department of Economic and
Social Affairs UNFCCC United Nations Framework Convention on
Climate Change vRES Variable Renewable Energy Sources
4

5
GLOSSARY
AGGREGATORSAggregators are companies that aggregate a number of grid-connected units (such as end-users and distributed resources), provide services to the grid and participate in the market on behalf of the aggregated units as one single entity. From the system operation point of view, an aggregator acts as intermediator between end users and other power system participants.
CURTAILMENTCurtailment describes an intended, temporary reduction of the power output of variable renewable energy plants compared to the actual potential offered by the resource. This may be motivated by network congestion, operational restrictions of the generation mix (e.g. minimum must run capacity from dispatchable plants) or other reasons.
DISPATCHABLE GENERATORSThe electricity production of dispatchable generators does not depend on fluctuating resources like wind and solar. Generally speaking, dispatchable generators are controllable and their availability can be scheduled.
DISTRIBUTED ENERGY RESOURCES (DER) Distributed energy resources (DER) are small- to medium-scale resources that are mainly connected to the lower voltage levels (distribution grids) of the system or near the end users. DER can consist of one or several of the following elements: distributed generation, energy storage and demand response.
DYNAMIC LINE RATINGDynamic line rating describes an approach of operating overhead lines allowing some overloading in case of favourable conditions instead of fixed maximum loading according to datasheets or standards. Overhead lines are heated by the current flowing through the wires. The maximum temperature is determined by the manufacturers’ component specifications and by the resulting sag of the line (minimum clearing distance to ground). However, in case of low ambient temperature or strong wind, the conductors of an overhead line are effectively cooled and, hence, with the same current their temperature is lower than under conditions assumed in standards and manufacturers’ specifications.
FAULTAn electrical fault is an abnormal condition in a power system resulting in a parameter (e.g. current or voltage) exceeding s ults need to be managed and, hence, proper planning and design of electrical power systems needs to consider realistic fault scenarios (see also protection).
FLEXIBILITY PARAMETERS OF DISPATCHABLE GENERATORSIn power systems, flexibility can be understood as the capability of the system to cope with sudden changes and uncertainty at different time scales in an efficient manner. Some parameters determining the flexibility that dispatchable generators can provide are ramp rates, start-up times, minimum loads and cycling. Ramp rates refer to the rate of change in a power plant’s output from maximum to minimum generation (i.e. ramp-down), or vice-versa (i.e. ramp-up). Start-up time is the period that a power plant takes from being offline to injecting power into the grid. Minimum operating load is the lowest output a power plant can generate in a reliable and efficient way. Cycling is referred to as the start-up and subsequent shut-down of a power plant. Factors influencing the cycling of power plants include their economic viability, equipment’s lifetime, maintenance, and the minimum time required to be operating once plants have started generating (or time required to be offline when they have shut-down).
HIGH VOLTAGE DIRECT CURRENT (HVDC) LINKSIf power is transmitted over very long distances, the costs of alternating current (AC) overhead lines and their resulting losses increase considerably. In these cases, high-voltage direct current (HVDC) lines are an efficient and economical alternative. With dedicated converter stations, AC power is converted to DC, transported for very long distances with HVDC links and converted back to AC. DC links allow the coupling of systems that do not operate in synchrony (i.e. at different nominal frequency levels). However, some benefits of synchronous connection (e.g. inertial response) are lost when using HVDC links.

6
IMBALANCEFrom a system operation point of view, imbalance describes the difference between generation and load at a given point in time. From a market perspective, imbalance describes the difference between the energy committed ahead in the dispatch by a market participant and its actual energy delivered in real time. Such imbalances in the market are typically reflected in additional costs.
INERTIA Inertia refers to the kinetic energy stored in the rotating mass of synchronous generators and their drive trains. Synchronous generators are the standard technology in thermal and hydroelectric power plants. Immediately after a contingency event (e.g. sudden shortfall in power), system inertia supports system frequency before reserves pick up. As vRES displace generation from synchronous machinery with power electronic converters that do not provide inertia, overall system inertia will be reduced in the long term.
MARGINAL COSTSMarginal cost is the incremental cost of generation when the output of electricity is being increased marginally. In the short-run, marginal cost is typically determined by variable costs (in particular fuel cost). Once installed, vRE generators can generate electricity with little additional costs, which makes their marginal costs equal to zero (or near zero). At the system level, the system marginal cost is determined by the variable cost of the marginal unit generating at a given moment in time.
MESHED VS RADIAL NETWORKSThe spatial structure of networks, i.e. their topology, varies depending on geographical features, generation and load characteristics, reliability requirements, voltage levels, grid investment costs and environmental impact. In general, a distinction can be drawn between meshed and radial networks. Meshed networks are redundant and offer multiple paths (i.e. branches) to reach loads from nearby nodes. As a consequence, not every fault forces a supply interruption for the connected customers. A meshed topology is most common in transmission grids (i.e. high voltage). Radial networks resemble a tree shape where power flows in a uni-directional way. A single failure often results in supply interruptions for some costumers connected to the affected branch. A radial topology is most common in distribution grids (i.e. low voltage).
MUST-RUN CAPACITYIn many power systems, the term must-run-capacity is used for power plants which generate power although the merit order does not require them to be operational for the energy-only market. Reasons for keeping them online may be their importance for providing ancillary services or their operational inflexibility/ prohibitive costs for shut-down and restart. The definition of must-run capacity is driven by technical restrictions but determined by regulation and energy policy.
NOWCASTNowcast refers to the shortest-term forecast of vRES availability and generation. A nowcast provides information on a very short time period in the future (for the coming 2 to 10 hours) and with high temporal granularity (i.e. forecasts for fractions of an hour). The information provided by nowcasts is valuable for variable renewable energy generators, system operators and market players.
POWER ELECTRONIC CONVERTERSPower electronic converters take the electrical energy from a power source, i.e. DC current in the case of solar PV and wind power, and convert it into a suitable form needed by the system, i.e. AC current. Power electronic converters use power semiconductors to regulate and shape the exported current in the required form. As the shape of the current solely depends on the control of the power electronic converter and not on the rotational speed of the generator (as opposed to synchronous generators), generation using power electronic converters is called non-synchronous.
Power electronic converters behave differently than synchronous generators in some respects:n They represent a current source and are not able to energise
a network without some existing voltage; n They have a lower short circuit capacity than synchronous
generators; n They have no inertia so that system frequency changes
more rapidly when responding to power imbalances.
GLOSSARY
7
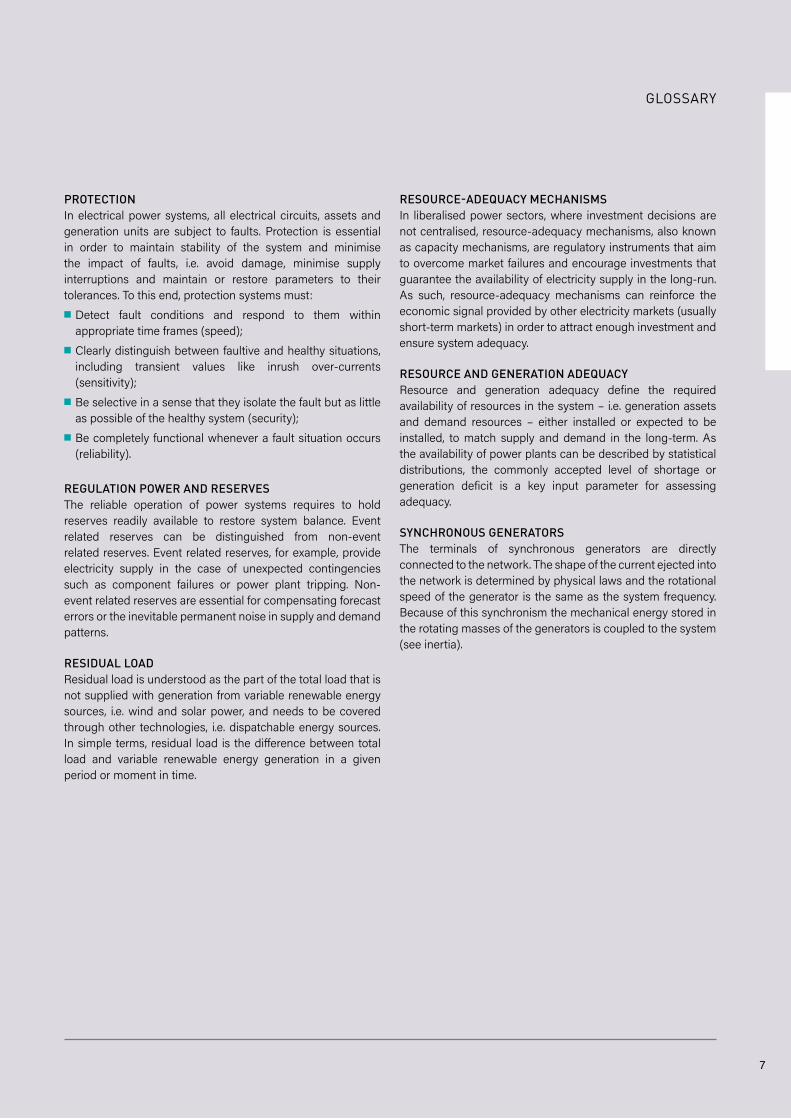
PROTECTIONIn electrical power systems, all electrical circuits, assets and generation units are subject to faults. Protection is essential in order to maintain stability of the system and minimise the impact of faults, i.e. avoid damage, minimise supply interruptions and maintain or restore parameters to their tolerances. To this end, protection systems must: n Detect fault conditions and respond to them within
appropriate time frames (speed);n Clearly distinguish between faultive and healthy situations,
including transient values like inrush over-currents (sensitivity);
n Be selective in a sense that they isolate the fault but as little as possible of the healthy system (security);
n Be completely functional whenever a fault situation occurs (reliability).
REGULATION POWER AND RESERVESThe reliable operation of power systems requires to hold reserves readily available to restore system balance. Event related reserves can be distinguished from non-event related reserves. Event related reserves, for example, provide electricity supply in the case of unexpected contingencies such as component failures or power plant tripping. Non-event related reserves are essential for compensating forecast errors or the inevitable permanent noise in supply and demand patterns.
RESIDUAL LOADResidual load is understood as the part of the total load that is not supplied with generation from variable renewable energy sources, i.e. wind and solar power, and needs to be covered through other technologies, i.e. dispatchable energy sources. In simple terms, residual load is the difference between total load and variable renewable energy generation in a given period or moment in time.
RESOURCE-ADEQUACY MECHANISMSIn liberalised power sectors, where investment decisions are not centralised, resource-adequacy mechanisms, also known as capacity mechanisms, are regulatory instruments that aim to overcome market failures and encourage investments that guarantee the availability of electricity supply in the long-run. As such, resource-adequacy mechanisms can reinforce the economic signal provided by other electricity markets (usually short-term markets) in order to attract enough investment and ensure system adequacy.
RESOURCE AND GENERATION ADEQUACY Resource and generation adequacy define the required availability of resources in the system – i.e. generation assets and demand resources – either installed or expected to be installed, to match supply and demand in the long-term. As the availability of power plants can be described by statistical distributions, the commonly accepted level of shortage or generation deficit is a key input parameter for assessing adequacy.
SYNCHRONOUS GENERATORSThe terminals of synchronous generators are directly connected to the network. The shape of the current ejected into the network is determined by physical laws and the rotational speed of the generator is the same as the system frequency. Because of this synchronism the mechanical energy stored in the rotating masses of the generators is coupled to the system (see inertia).
GLOSSARY

8
01INTRO- DUC- TION
The global energy sector is undergoing a rapid and radical transition in the way energy is produced, distributed and
consumed, a shift is motivated by the urgency to ensure secure energy supply, achieve sustainable development and limit climate change. Around two thirds of global greenhouse gases (GHG) and 90% of carbon dioxide (CO2) emissions stem from energy production and use (OECD/IEA, 2018a). Hence, the transition to a cleaner and more efficient energy system is key to achieving the global goal of the Paris Agreement: to limit global temperature rise to well below 2°C, aiming for 1.5°C.
An important step toward a comprehensive transformation of the energy system is decarbonising the power sector. Unabated fossil-based electricity generation must be phased out, and the introduction of low-carbon technologies accelerated. Power systems around the world have already initiated the transformation process, which has been accompanied by rapid cost reductions in power generation technologies (IRENA, 2019). Reflecting this development, the International Energy Agency (IEA) refers to “power system transformation”, describing the creation of a policy and market environment that encourages innovative and sustainable technology solutions for electricity production, distribution and consumption (OECD/IEA, 2018b).
A major concern in the context of power sector transformation is the smooth integration of large amounts of variable renewable energy capacity (i.e. wind and solar) into existing power systems. These variable sources have specific features that differ from those of conventional energy sources, posing fundamental challenges to the operation and governance of a power system. It is important these challenges are recognised and understood in order to identify adequate and timely measures to address them.
The objective of this work is to support a deeper understanding of a country’s position in the power system transformation process, focusing on the technical configuration of its power system, the specific country context and the resulting challenges posed by the integration of variable renewable energy sources. Measures are identified that can help to address and resolve these challenges. At a policy level, more general guidance is provided for policy makers and technical experts in the energy sector on how to facilitate the design and implementation of a smooth transition towards a Paris-compatible power sector.
Figure 1 shows an overview of the structure of this work and how the different aspects that can determine the power system transformation process in a country are related to each other.

9
FIGURE 1: Overview of the paper structure and how different aspects of the power system transformation process are related to each other.
0 A B C D E
GENERAL CHALLENGESfor vRES Integration
MEASURES to address challenges
Relevance of intervention from a
perspective
Country dimension Filter 1
Time dimension Filter 2
How can the country contextshape the challenges?
COUNTRY CHARACTERISTICS
When are challenges likely to appear?
PHASES
POWER SYSTEM TRANSFORMATION IN THE CONTEXT OF THE PARIS AGREEMENT
COUNTRY FACTSHEETS
Illustration of methodology and facilitation of peer learning
CHARACTERISTICSof vRES
technical
policy
market
��������������������������
�������������� ����������������������
��������������������
������������������������������������
������������������������������������
������
����� �����������������������������������
01 INTRODUCTION
ARGENTINACHARACTERISTICS
STATUS OF POWER SYSTEM TRANSFORMATION
GEOGRAPHY, POPULATION AND FLEXIBILITY
CONTRIBUTION OF RES IN COVERING ANNUAL LOAD AND SPECIFIC CO2 EMISSIONS – PAST TREND AND 2016 STATUS
1.0
0 100 200 300 4000
POPULATION DISTRIBUTION [million]
SOLAR RATIO WINTER / SUMMER
POPULATION DENSITY [Inh./km2]
largest cityother citiesrural & smaller cities
Argentina has 17 cities with more than 300,000 inhabitants, but more than 30% of the country’s population lives in the Greater Buenos Aires area. The population density outside the 17 cities is extremely low, with about seven inhabitants per km2 (UNDESA, 2018).
The solar resource is very favourable in the north of Argentina. While the average solar ratio1 is about 0.3 for the whole country, the solar value in the north-west is close to 1 (DTU, 2019a). The wind resource, on the other hand, is very favourable in the south and on the coast (DTU, 2019b).
7 outside larger cities0.3
ARGE
NTI
NA
Buenos Aires
1 The average solar ratio is calculated as the ratio between the average daily solar energy yield of the darkest three months (winter) and the sunniest three months (summer). The closer the value is to 1, the smaller is the variation between winter and summer months and the steadier is the solar resource.
Between 2005 and 2016, per capita electricity consumption grew in line with the economy and reached about 3000 kWh per person and year in 2016. The total population also grew slightly, and electricity access reached 100% (World Bank, 2019a).
Together, these factors resulted in a significant growth of total final electricity consumption from 90 TWh in 2005 to 132 TWh in 2016, equivalent to an increase of 46% (IEA, 2018). Between 2016 and 2030, the Ministry of Energy expects a further increase of total consumption of around 3.4% per year, reaching 211 TWh in 2030 (MINEM, 2017).
IMPACT OF COUNTRY CHARACTERISTICSDue to the concentration of the population in the larger cities and the large distances to the hydro capacity, the transmission network is sparse. The degree of meshing is low, especially in the rural parts of the country.
Large-scale deployment of the remote solar and wind resources will inevitably trigger network reinforcements.
Argentina is a net importer of electricity (IEA/OECD, 2018).
Argentina and Uruguay together form a synchronous electrical island. Interconnections to Brazil are based on non-synchronous, HVDC technology.
Source for both graphs (IEA, 2018b)
COUNTRY CHARACTERISTICS
By 2016, RES supply has been exclusively hydro and, hence, dispatchable. Favourable resources allowed for significant capacity of 11 to 12 GW. Since 2000, the hydro capacity has been relatively constant. However, due to growing load, the share of hydro in generation decreased from more than 30% in 2005 to about 26% in 2016
(IEA, 2018b). By 2030, the scenarios of the Ministry of Energy foresee an additional expansion of Argentina’s hydro capacity of about 3 GW (MINEM, 2017).
Expansion of vRES capacity is just starting to take off and has seen significant growth rates. At the end of 2018, about 1000 MW of vRES was operational. For 2019, another
Generation
Load
0 2% 4% 6% 8%-2%
Share with regard to generation/ load [%]
ImportExport
14.7
18.3
10.9
3,000
2,500
2,000
1,500
1,000
500
0
Consumption per capita and population w/access to electricity
2000 2016
[kWh/capita]
95%with electricityacces
100%with electricityacces
160,000
140,000
120,000
100,000
80,000
60,000
40,000
20,000
0
-20,000
Generation Mix[GWh]
2000 20162014201220102008200620042002
Export dRES
vRESResidual load
Import
Load
Losses
100%
80%
60%
40%
20%
0
Emission trends in relation to RES sharesAnnual RES share [%]
Emission intensity [kg/kWh]
0.0 1.00.80.60.40.2
2000-2015 2016
SPAINCHARACTERISTICS
STATUS OF POWER SYSTEM TRANSFORMATION
GEOGRAPHY, POPULATION AND FLEXIBILITY
CONTRIBUTION OF RES IN COVERING ANNUAL LOAD AND SPECIFIC CO2 EMISSIONS – PAST TREND AND 2016 STATUS
1.0
0 100 200 300 4000
POPULATION DISTRIBUTION [million]
SOLAR RATIO WINTER / SUMMER
POPULATION DENSITY [Inh./km2]
largest cityother citiesrural & smaller cities
The largest city in Spain is Madrid. The agglomeration accounts for almost 14% of the total population. There are other large urban centres that concentrate large shares of population. However, outside the largest cities, the population density is moderate (UNDESA, 2018), so the existing network is not very dense and links the main load centres.
Spain is rich in solar resource, which is largely evenly distributed across the country. Ignoring the extreme north, solar irradiation only slightly increases from north to south (DTU, 2019a). Wind resources are very attractive at the coasts and in the north. The centre of the country has extended regions with a reasonable wind potential (DTU, 2019b).
58 outside larger cities0.2
SPAI
N
Madrid
After many years of sustained growth, electricity demand plummeted in 2008 as result of a strong economic crisis and has not fully recovered. Total electricity consumption has slightly decreased and stagnated at levels below those of 2008 (REE, 2019b), while total population has remained constant, so electricity consumption per capita decreased slightly in the same period.
Spain exchanges just over 5% of its electricity generation and load with its neighbours. Exports and imports are balanced (IEA, 2018a).
Together with Portugal, the Iberic system is considered an isolated system. The interconnection with the rest of Europe (through France) is limited compared to its peak demand and balancing needs.
RES supply currently covers around 40% of total annual power generation (IEA, 2018b). The share of renewables has increased in recent decades, led by a significant growth of vRES capacity between 2000-2010, mainly wind power. As result, wind power generation become the main renewable power source since 2008 – 18% of total electricity generation in 2017 – and the second source of power generation after nuclear – 21 % in 2017 (REE, 2018).
In the mainland system, hourly generation from renewable sources has reached record levels greater than 80% in load coverage, and wind power generation alone has reached levels close to 70% (REE, 2018).
As both demand and generation mix have largely remained constant since the uptake of vRES (coincidentally, the economic crisis that led to demand stagnation and the deployment of wind power occurred at the same time), the CO2 emission intensity per kWh has remained relatively constant over the last decade.
IMPACT OF COUNTRY CHARACTERISTICSvRES installations are evenly distributed across the country (REE, 2019c). Due to the geographical distribution of generation resources and main load centres, the existing network is meshed and dense around largest load centres. The relative interconnection with the rest of Europe is still very limited and the Iberic system is virtually operated as an isolated system.
After 2008, a decreasing and eventually stagnating demand led to considerable oversupply of electricity in the system. This led to a reduced (or null) utilisation of Combined Cycle Gas Turbine (CCGT) plants that were originally intended to operate as baseload units (Eurelectric, 2011).
The Spanish load profile changes substantially from winter to summer, shifting peak hours from night-hours to noon-hours. This makes the load-solar ratio favourable in the summer but challenging in the winter, when the annual peak demand usually occurs.
COUNTRY CHARACTERISTICS
6.2
29.2 11.0
Generation
Load
-6%-8% -4% -2% 0% 2% 4% 6%-10%
Share with regard to generation/ load [%]
ImportExport
5,100
5,000
4,900
4,800
4,700
4,600
4,500
Consumption per capita and population w/access to electricity
2000 2016
[kWh/capita]
100%with electricityacces
100%with electricityacces
Source for both graphs (IEA, 2018b)
300,000
250,000
200,000
150,000
100,000
50,000
0
-50,000
Generation Mix[GWh]
2000 20162014201220102008200620042002
Export dRES
vRESResidual load
Import
Load
Losses
100%
80%
60%
40%
20%
0
Emission trends in relation to RES sharesAnnual RES share [%]
Emission intensity [kg/kWh]
0.0 1.00.80.60.40.2
2000-2015 2016
ARGENTINACHARACTERISTICS
STATUS OF POWER SYSTEM TRANSFORMATION
GEOGRAPHY, POPULATION AND FLEXIBILITY
CONTRIBUTION OF RES IN COVERING ANNUAL LOAD AND SPECIFIC CO2 EMISSIONS – PAST TREND AND 2016 STATUS
1.0
0 100 200 300 4000
POPULATION DISTRIBUTION [million]
SOLAR RATIO WINTER / SUMMER
POPULATION DENSITY [Inh./km2]
largest cityother citiesrural & smaller cities
Argentina has 17 cities with more than 300,000 inhabitants, but more than 30% of the country’s population lives in the Greater Buenos Aires area. The population density outside the 17 cities is extremely low, with about seven inhabitants per km2 (UNDESA, 2018).
The solar resource is very favourable in the north of Argentina. While the average solar ratio1 is about 0.3 for the whole country, the solar value in the north-west is close to 1 (DTU, 2019a). The wind resource, on the other hand, is very favourable in the south and on the coast (DTU, 2019b).
7 outside larger cities0.3
ARGE
NTI
NA
Buenos Aires
1 The average solar ratio is calculated as the ratio between the average daily solar energy yield of the darkest three months (winter) and the sunniest three months (summer). The closer the value is to 1, the smaller is the variation between winter and summer months and the steadier is the solar resource.
Between 2005 and 2016, per capita electricity consumption grew in line with the economy and reached about 3000 kWh per person and year in 2016. The total population also grew slightly, and electricity access reached 100% (World Bank, 2019a).
Together, these factors resulted in a significant growth of total final electricity consumption from 90 TWh in 2005 to 132 TWh in 2016, equivalent to an increase of 46% (IEA, 2018). Between 2016 and 2030, the Ministry of Energy expects a further increase of total consumption of around 3.4% per year, reaching 211 TWh in 2030 (MINEM, 2017).
IMPACT OF COUNTRY CHARACTERISTICSDue to the concentration of the population in the larger cities and the large distances to the hydro capacity, the transmission network is sparse. The degree of meshing is low, especially in the rural parts of the country.
Large-scale deployment of the remote solar and wind resources will inevitably trigger network reinforcements.
Argentina is a net importer of electricity (IEA/OECD, 2018).
Argentina and Uruguay together form a synchronous electrical island. Interconnections to Brazil are based on non-synchronous, HVDC technology.
Source for both graphs (IEA, 2018b)
COUNTRY CHARACTERISTICS
By 2016, RES supply has been exclusively hydro and, hence, dispatchable. Favourable resources allowed for significant capacity of 11 to 12 GW. Since 2000, the hydro capacity has been relatively constant. However, due to growing load, the share of hydro in generation decreased from more than 30% in 2005 to about 26% in 2016
(IEA, 2018b). By 2030, the scenarios of the Ministry of Energy foresee an additional expansion of Argentina’s hydro capacity of about 3 GW (MINEM, 2017).
Expansion of vRES capacity is just starting to take off and has seen significant growth rates. At the end of 2018, about 1000 MW of vRES was operational. For 2019, another
Generation
Load
0 2% 4% 6% 8%-2%
Share with regard to generation/ load [%]
ImportExport
14.7
18.3
10.9
3,000
2,500
2,000
1,500
1,000
500
0
Consumption per capita and population w/access to electricity
2000 2016
[kWh/capita]
95%with electricityacces
100%with electricityacces
160,000
140,000
120,000
100,000
80,000
60,000
40,000
20,000
0
-20,000
Generation Mix[GWh]
2000 20162014201220102008200620042002
Export dRES
vRESResidual load
Import
Load
Losses
100%
80%
60%
40%
20%
0
Emission trends in relation to RES sharesAnnual RES share [%]
Emission intensity [kg/kWh]
0.0 1.00.80.60.40.2
2000-2015 2016

10
02POWER SYSTEM TRANSFOR-MATION IN THE CONTEXT OF THE PARIS AGREEMENT
T he Paris Agreement creates a new imperative for global efforts to limit climate change and foster sustainable
development. To achieve its objectives, scientists agree that total global greenhouse gas emissions must be reduced to net-zero by the end of this century. This creates a need to reach full decarbonisation of the global energy system and net-zero CO2 emissions by around 2050 (Rogelj et al., 2015).
An important step in the transition of the energy system is the
decarbonisation of the power sector. It is expected that the power sector must decarbonise earlier than other sectors, given that it is the only sector where market-ready carbon-free technology solutions already exist today, and certain diffusion rates have been achieved. Moreover, the feasibility of deep emissions cuts in other sectors, for example through increased electrification, heavily depends on a successfully decarbonised power sector.
In this study, decarbonisation of the power sector, or “power system transformation”, is understood as a process aiming to achieve a 100% renewable energy-based electricity production in the long-term. Renewable energy sources
(RES) refer to wind, solar, hydro, geothermal, biomass and wave and tidal power. 1
In many countries around the world, the transformation of the power sector has sped up due to the rapid development and deployment of RES, especially wind and solar, at decreasing costs. Yet, there is an intense debate on the feasibility and viability of a full power system transformation resulting in a 100% renewable-based power system (see e.g. Heard et al., 2017; Brown et al., 2018). Although many countries have embarked on the transition process, to date no country has achieved a full power sector transformation. Those countries that register a larger share of RES today can count on natural resource endowments that serve as dispatchable renewable energy sources, such as hydro or geothermal power. The advancement and deployment of variable renewable energy sources (vRES), on the other hand, faces high perceived technology and finance risks as well as technical and economic challenges, due to a number of specific features of vRES that have implications for their integration into existing power systems.
1 While nuclear power is a low-carbon technology, it is not considered a renewable energy source. The role that nuclear power can play in the power system transformation process in countries that have an existing fleet (e.g. France, Japan, South Korea) needs further consideration which however goes beyond the scope of this report.
NET-ZERO CO2 emissions
by 2050
100% renewable electricity

11
02 03CHARACTER-ISTICS AND CHALLENGES OF VARIABLE RENEWABLE ENERGY SOURCES
A round the world, massive generation capacity from vRES will be needed to decarbonise the power sector. While
vRES rely on mature power conversion technologies that offer cost effective electricity generation, the integration of vRES gives rise to specific challenges in power system planning and operation that must be tackled adequately during the power system transformation process. Many challenges can be attributed to specific characteristics of vRES, including:
n Fluctuating nature of wind and solar resources.
n Limited forecasting accuracy for fluctuating resources.
n Large renewable capacity is often installed in remote locations.
n Substantial vRES capacity is small scale, dispersed and connected to lower voltage levels.
n Wind and solar technologies use (static) power electronic converters instead of synchronous generators (rotating machinery), i.e. vRES technologies are non-synchronous generators.
n Small scale and dispersed generation is not permanently operated and maintained by professionally trained staff.
n vRES technologies can generate electricity at very little (near zero) marginal cost.2
Key technical challenges that result from these characteristics and are typically encountered during the integration of vRES in existing power systems, include:
n Load balancing and reserves challenges: referring to the limitations of the system to cope with additional variability and uncertainty introduced by an increasing penetration of vRES. Traditionally, dispatchable generators were the main source of flexibility to respond to imbalances in the system and mainly served to react to imbalances in the demand side load. An increasing penetration of vRES demands a re-evaluation of the current practices around reserves management. A system unable to cope with load balancing and reserves challenges may face the emergence of other challenges, such as non-served demand or excessive vRES curtailment.
n Monitoring and control challenges: the reliable operation of a power system requires visibility and control of its generation resources to be able to respond to contingencies. Conventional power systems were designed to operate with a unidirectional power flow, from centralised, controllable power plants to decentralised consumers. The increased participation of descentralised vRES generation requires an adjustment of concepts for monitoring, control and protection of power systems. This refers to short to real-time challenges in system operations, as well as to longer-term challenges in planning and development of a power system.
2 Under an economic dispatch, vRES technologies are always among the first plants to be dispatched to meet the demand, displacing technologies with higher variable generating costs (i.e. conventional generators). The market shares of conventional generators are reduced, which affects the cost structure of the system. However, a thorough analysis of the cost structure of vRES and its implications is beyond the scope of this report.

12
n System Non-Synchronous Penetration (SNSP)-related challenges: vRE technologies are non-synchronous and rely on power electronic converters. In contrast to traditional synchronous generators, these converters do not directly contribute to system inertia and put safe and reliable system operation at risk. Massive replacement of synchronous generation by non-synchronous generation changes the behaviour of the entire power system. This challenge is particularly relevant for non-interconnected systems with little inertia (e.g. small isolated systems) that cannot rely on their links with synchronised systems to provide the required inertia.
n Network congestion and restrictions from network operation: the capacity of the network and its operation play a key role in keeping the system in balance. Many challenges, including non-served energy or vRES curtailment, can be linked to network-related limitations. Together with supply-side flexibility, network congestion is one of the first challenges countries encounter when embarking on the power system transformation process.
n Reduced utilisation of dispatchable plants needed to provide flexibility: increasing shares of vRES have an impact on the operation of conventional generators: on the one hand, dispatchable generators must provide flexibility to accommodate the increased variability and uncertainty in the system; on the other hand, an increasing share of vRES in the
system, with lower variable costs, reduces wholesale electricity prices and displaces dispatch from thermal generators, impacting their profitability. Conventional generators are consequently forced to reduce their electricity output while increasing the provision of flexibility needed by the system.
n System balance and negative residual load: in systems with very high shares of vRES penetration, the instantaneous generation potential will regularly exceed the load in the area. Negative residual load means the system is not able to absorb all the power generated. If no structural changes occur in the system, a substantial growth of vRES capacity will lead to significant vRES curtailment. While in early phases of the power system transformation process, temporary and moderate curtailment of vRES can be a source of flexibility or even a reliability measure for the safe operation of the system3, curtailment in later phases of the transformation process may be a result of vRES oversupply and may not be economically viable. If unsolved, vRES curtailment implies that further penetration of vRES will not translate into higher renewable shares but rather into greater curtailment levels. The challenge of curtailment is exacerbated when more expensive and polluting technologies continue generating instead.
Table 1 captures the relationship between vRES characteristics and challenges, which later facilitates the identification of key measures to overcome them.
3 vRES curtailment are a structural part of planning and operation of power systems with enhanced shares of renewables. In early phases of vRES system integration, curtailment are typically a response to limited supply side flexibility and network congestions.
TABLE 1: Simplified presentation of interactions between specific features of vRES and challenges
Features of vRES
Challenges
Fluctua- ting
resources and
generation
Limited forecast
and sched-uling
accuracyElectrically
remote
Small-scale,
dispersed and
connected to lower voltage levels
Electronic power
converters instead of synchro-
nous generators
Not per-manently operated
and main-tained by profes-
sional staff
Very little (near zero) marginal
costInter-
vention
Load balancing and reserves x x
Monitoring, communica-tion and control (plan-
ning and development/ system operations)
x x x xSNSP-related
challenges x xNetwork congestion
and restrictions from network operation
x xReduced utilisation
of dispatchable plants needed to balance
fluctuationsx
System balance and negative residual load x

13
04PHASES OF POWER SYSTEM TRANS- FORMATION
C ountries undergo different phases in the power system transformation process that mark the steps
of increasing shares of vRES in their power mix and the specific configuration of the power system along with this transformation process.
Six phases of power system transformation can be distinguished with different implications for power system planning and operation. A careful analysis of each phase allows for understanding, structuring and addressing a number of challenges resulting from increased vRES penetration in a power system4.
The different phases of power system transformation are affected by changes of load and generation. This can be depicted through changes in the load duration curve (LDC) as shown in Table 2. The LDC is traditionally used to illustrate different load levels over one year (8,760 hours) in a descending order. The load is represented by the total coloured area below the curve. With increasing vRES capacity, a growing share of the load is covered by vRES (area in light blue) while the area below the LDC not covered by vRES (dark blue) decreases. The latter part of the load needs to be supplied by other sources than vRES and is called the residual load.
The development of renewable sources over time shows similar patterns in different countries, represented in Table 2 in phases 0 to E, with each phase presenting specific challenges.
Most countries with frameworks in place that stimulate vRES find themselves in phase B or C. Few countries already moved into phase D, and some are clearly faced with SNSP restrictions, representing a major obstacle to move to the next phase. Examples are the Irish All Island and the Great Britain power systems.
If considering the integration of vRES exclusively (ignoring, for the moment, the availability of dRES), phase D has only been achieved in island systems and microgrids at a small scale.
4 Please note that the focus is placed on the integration of vRES into a power system, momentarily ignoring the possible availability of dRES in a country. How the availability of dRES as well as other country characteristics can facilitate or complicate the integration of vRES into a power system is being discussed in chapter 5.
BOX: Phases of power system transformation
The approach taken here is very similar to the six phases of vRES integration identified by the IEA (IEA, 2019; OECD/IEA, 2018c). Yet the phased approach described below places a focus on the necessary changes in the configuration of the power system, looking at specific parameters and how they change from one phase to the other, and outlines concrete challenges per phase. The role of the country context and how certain characteristics can shape the challenges and either accentuate or alleviate them is also analysed in detail.

14
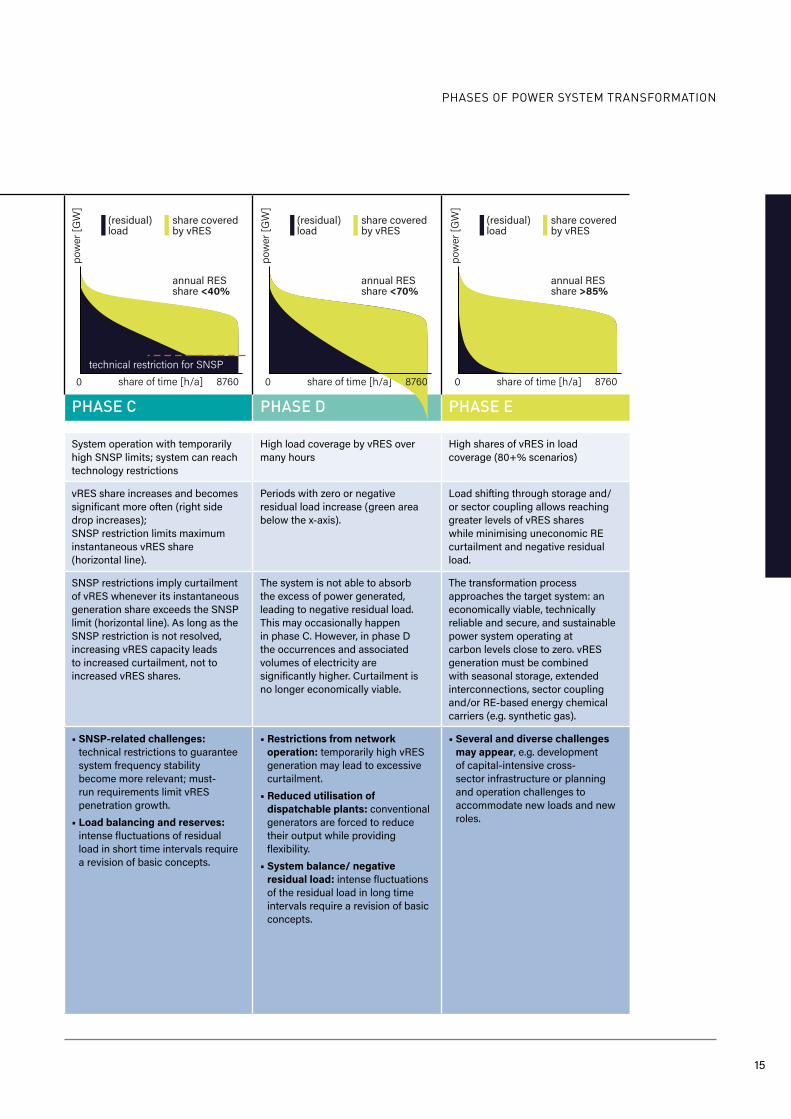
TABLE 2: Demonstration of different phases of power system transformation, their impact on the LDC and related challenges.
PHASE 0 PHASE A PHASE B PHASE C PHASE D PHASE E
Phase description
Negligible amounts of vRES and no systemic effects
First systemic effects of vRES can be observed
Temporarily substantial shares of load are covered by vRES
System operation with temporarily high SNSP limits; system can reach technology restrictions
High load coverage by vRES over many hours
High shares of vRES in load coverage (80+% scenarios)
Impact on the Load Duration
Curve (LDC)
Negligible changes. vRES starts to contribute to load (area in light blue), residual load starts to decrease (area in dark blue).
vRES share in load becomes significant at certain times (right side of the graph), while remaining low in others (left side).
vRES share increases and becomes significant more often (right side drop increases); SNSP restriction limits maximum instantaneous vRES share (horizontal line).
Periods with zero or negative residual load increase (green area below the x-axis).
Load shifting through storage and/or sector coupling allows reaching greater levels of vRES shares while minimising uneconomic RE curtailment and negative residual load.
Impact on system
configu-ration and operation
Negligible challenges. Standard concepts of power operation are still sufficient. Power system planning needs to anticipate the upcoming transition.
Due to the fluctuating character of vRES, the share in load coverage at particular time differs. At this point, changes in hourly generation become more extreme.
SNSP restrictions imply curtailment of vRES whenever its instantaneous generation share exceeds the SNSP limit (horizontal line). As long as the SNSP restriction is not resolved, increasing vRES capacity leads to increased curtailment, not to increased vRES shares.
The system is not able to absorb the excess of power generated, leading to negative residual load. This may occasionally happen in phase C. However, in phase D the occurrences and associated volumes of electricity are significantly higher. Curtailment is no longer economically viable.
The transformation process approaches the target system: an economically viable, technically reliable and secure, and sustainable power system operating at carbon levels close to zero. vRES generation must be combined with seasonal storage, extended interconnections, sector coupling and/or RE-based energy chemical carriers (e.g. synthetic gas).
General challenges
Small local network challenges. • Load balancing and reserves: changes in the system may become noticeable (stronger fluctuation in residual load, adjustments in reserve requirements); regular concepts are not affected.
• Network congestion/restrictions from network operation: first issues may arise depending on location of vRES capacity and the existing network.
• Load balancing and reserves: Changes at lower network levels may become noticeable
• Monitoring, communication and control: invisible distributed generation may compromise smooth system operation. An increasing number of actors leads to increasing complexity of processes.
• SNSP-related challenges: changing system needs may require revision of technical codes and protection schemes.
• Network congestion/ restrictions from network operation: more substantial power flows across regions and network levels may require network reinforcements.
• SNSP-related challenges: technical restrictions to guarantee system frequency stability become more relevant; must-run requirements limit vRES penetration growth.
• Load balancing and reserves: intense fluctuations of residual load in short time intervals require a revision of basic concepts.
• Restrictions from network operation: temporarily high vRES generation may lead to excessive curtailment.
• Reduced utilisation of dispatchable plants: conventional generators are forced to reduce their output while providing flexibility.
• System balance/ negative residual load: intense fluctuations of the residual load in long time intervals require a revision of basic concepts.
• Several and diverse challenges may appear, e.g. development of capital-intensive cross-sector infrastructure or planning and operation challenges to accommodate new loads and new roles.
(residual)load
share coveredby vRES
0 share of time [h/a]
pow
er [G
W]
8760
annual RESshare <5%
(residual)load
share coveredby vRES
0 share of time [h/a]po
wer
[GW
]8760
annual RESshare <15%
(residual)load
share coveredby vRES
0 share of time [h/a]
pow
er [G
W]
8760
annual RESshare <25%
(residual)load
share coveredby vRES
0 share of time [h/a]
pow
er [G
W]
8760technical restriction for SNSP
annual RESshare <40%
(residual)load
share coveredby vRES
0 share of time [h/a]
pow
er [G
W]
8760
annual RESshare <70%
(residual)load
share coveredby vRES
0 share of time [h/a]
pow
er [G
W]
8760
annual RESshare >85%
(residual)load
share coveredby vRES
0 share of time [h/a]
pow
er [G
W]
8760
annual RESshare <5%
(residual)load
share coveredby vRES
0 share of time [h/a]
pow
er [G
W]
8760
annual RESshare <15%
(residual)load
share coveredby vRES
0 share of time [h/a]
pow
er [G
W]
8760
annual RESshare <25%
(residual)load
share coveredby vRES
0 share of time [h/a]
pow
er [G
W]
8760technical restriction for SNSP
annual RESshare <40%
(residual)load
share coveredby vRES
0 share of time [h/a]
pow
er [G
W]
8760
annual RESshare <70%
(residual)load
share coveredby vRES
0 share of time [h/a]
pow
er [G
W]
8760
annual RESshare >85%
15
PHASE 0 PHASE A PHASE B PHASE C PHASE D PHASE E
Phase description
Negligible amounts of vRES and no systemic effects
First systemic effects of vRES can be observed
Temporarily substantial shares of load are covered by vRES
System operation with temporarily high SNSP limits; system can reach technology restrictions
High load coverage by vRES over many hours
High shares of vRES in load coverage (80+% scenarios)
Impact on the Load Duration
Curve (LDC)
Negligible changes. vRES starts to contribute to load (area in light blue), residual load starts to decrease (area in dark blue).
vRES share in load becomes significant at certain times (right side of the graph), while remaining low in others (left side).
vRES share increases and becomes significant more often (right side drop increases); SNSP restriction limits maximum instantaneous vRES share (horizontal line).
Periods with zero or negative residual load increase (green area below the x-axis).
Load shifting through storage and/or sector coupling allows reaching greater levels of vRES shares while minimising uneconomic RE curtailment and negative residual load.
Impact on system
configu-ration and operation
Negligible challenges. Standard concepts of power operation are still sufficient. Power system planning needs to anticipate the upcoming transition.
Due to the fluctuating character of vRES, the share in load coverage at particular time differs. At this point, changes in hourly generation become more extreme.
SNSP restrictions imply curtailment of vRES whenever its instantaneous generation share exceeds the SNSP limit (horizontal line). As long as the SNSP restriction is not resolved, increasing vRES capacity leads to increased curtailment, not to increased vRES shares.
The system is not able to absorb the excess of power generated, leading to negative residual load. This may occasionally happen in phase C. However, in phase D the occurrences and associated volumes of electricity are significantly higher. Curtailment is no longer economically viable.
The transformation process approaches the target system: an economically viable, technically reliable and secure, and sustainable power system operating at carbon levels close to zero. vRES generation must be combined with seasonal storage, extended interconnections, sector coupling and/or RE-based energy chemical carriers (e.g. synthetic gas).
General challenges
Small local network challenges. • Load balancing and reserves: changes in the system may become noticeable (stronger fluctuation in residual load, adjustments in reserve requirements); regular concepts are not affected.
• Network congestion/restrictions from network operation: first issues may arise depending on location of vRES capacity and the existing network.
• Load balancing and reserves: Changes at lower network levels may become noticeable
• Monitoring, communication and control: invisible distributed generation may compromise smooth system operation. An increasing number of actors leads to increasing complexity of processes.
• SNSP-related challenges: changing system needs may require revision of technical codes and protection schemes.
• Network congestion/ restrictions from network operation: more substantial power flows across regions and network levels may require network reinforcements.
• SNSP-related challenges: technical restrictions to guarantee system frequency stability become more relevant; must-run requirements limit vRES penetration growth.
• Load balancing and reserves: intense fluctuations of residual load in short time intervals require a revision of basic concepts.
• Restrictions from network operation: temporarily high vRES generation may lead to excessive curtailment.
• Reduced utilisation of dispatchable plants: conventional generators are forced to reduce their output while providing flexibility.
• System balance/ negative residual load: intense fluctuations of the residual load in long time intervals require a revision of basic concepts.
• Several and diverse challenges may appear, e.g. development of capital-intensive cross-sector infrastructure or planning and operation challenges to accommodate new loads and new roles.
PHASES OF POWER SYSTEM TRANSFORMATION
(residual)load
share coveredby vRES
0 share of time [h/a]
pow
er [G
W]
8760
annual RESshare <5%
(residual)load
share coveredby vRES
0 share of time [h/a]
pow
er [G
W]
8760
annual RESshare <15%
(residual)load
share coveredby vRES
0 share of time [h/a]
pow
er [G
W]
8760
annual RESshare <25%
(residual)load
share coveredby vRES
0 share of time [h/a]
pow
er [G
W]
8760technical restriction for SNSP
annual RESshare <40%
(residual)load
share coveredby vRES
0 share of time [h/a]
pow
er [G
W]
8760
annual RESshare <70%
(residual)load
share coveredby vRES
0 share of time [h/a]
pow
er [G
W]
8760
annual RESshare >85%
(residual)load
share coveredby vRES
0 share of time [h/a]
pow
er [G
W]
8760
annual RESshare <5%
(residual)load
share coveredby vRES
0 share of time [h/a]
pow
er [G
W]
8760
annual RESshare <15%
(residual)load
share coveredby vRES
0 share of time [h/a]
pow
er [G
W]
8760
annual RESshare <25%
(residual)load
share coveredby vRES
0 share of time [h/a]
pow
er [G
W]
8760technical restriction for SNSP
annual RESshare <40%
(residual)load
share coveredby vRES
0 share of time [h/a]
pow
er [G
W]
8760
annual RESshare <70%
(residual)load
share coveredby vRES
0 share of time [h/a]
pow
er [G
W]
8760
annual RESshare >85%

16
Elements of phase E are investigated and demonstrated in various countries5, but large-scale deployment is still pending.
Overview of phases and how they relate to challenges
Table 3 provides an overview of how the challenges related to an increased share of vRES in a power system interact with
the different phases of the power system transition. While most challenges are likely to be marginal or only show first signs in phase B, they become more central in phase C. Other challenges, such as reduced utilisation of dispatchable plants and negative residual loads, are especially pronounced once a country has entered phase E.
TABLE 3: Interaction of challenges with the time dimension/ phases
5 See, for example: https://gridchangeagent.com/uk-one-step-closer-to-first-large-scale-power-to-gas-project/; http://www.powertogas.info/power-to-gas/pilotprojekte-im-ueberblick/audi-e-gas-projekt/; https://www.euroheat.org/news/vattenfall-centrepiece-europes-largest-power-heat-system-delivered-berlin-spandau/.
Negligible amounts of vRES and no systemic eects
First systemic eects of vRES can be observed
Temporarily substantial shares of load are covered by vRES
System operationwith temporarilyhigh system non-synchronouspenetration (SNSP),technology restrictions
High load coverageby vRES over manyconsecutive hoursto entire days
High shares of RES-Ein load coverage(80+% RES-Escenarios)
PHASE 0
PHASE A
PHASE B
PHASE C
PHASE D
PHASE E
Definition of phases
Challenges
Load balancing
and reserves
Monitoring and
control
SNSPrelated
challenges
Network congestion and restric-tions from network
operation
Reduced utilisation of dispat-
chable plants
System balance
and negative residual
loads
Starting
Starting
Essential Essential
Essential
Critical
Constant system adjustment
Annual RES share: <5%
Annual RES share: <15%
Annual RES share: <25%
Annual RES share: <40%
Annual RES share: <70%
Annual RES share: >85%

17
6 A detailed description of the indicators and data used for the quantitative analysis of each characteristic can be found in Annex I.
7 Assuming that dRES generation remains roughly constant and does not decrease as is the case for hydropower in some countries, as a result of climate change.
05COUNTRY CHARACTER- ISTICS IMPACT-ING POWER SYSTEM TRANSITION
C ountry-specific geographical and socio-economic characteristics may determine the starting point,
speed and scale of power system transformation process. The individual country characteristics discussed below are relatively constant but differ from country to country.
A set of five relevant characteristics is identified in the broader areas of geography, population and economy, and flexibility, and analysed with respect to their effect on power systems and the transformation process. For each characteristic, the impact on the integration of electricity from renewable energy sources (RES-E), specifically from vRES, and related challenges are outlined.6
1 Availability and potential of dispatchable renewable energy sources (dRES)
Dispatchable renewable energy sources (dRES) include hydro, geothermal, biomass and waste. The respective technologies offer similar operational flexibility as thermal power plants relying on fossil fuels. In most cases they rely on synchronous generators, so they do not contribute to SNSP restriction.
Impact on RES-E integration and related challenges
Systems with high shares of dRES facilitate the integration of vRES by enabling the system to cope with their short-term variability and exploiting valuable seasonal complementarities between dRES and vRES to ensure greater power system reliability. For example, several power systems in Latin America (hydro-dominated systems) have evidenced complementarities between hydropower and vRES.
The more dRES a country has in its system, the less vRES are needed to decarbonise the power sector.7 Allocation of regulation power and reserves depends on dispatchable generation, as does system inertia. For countries with little or no dRES capacity, it is more challenging to replace dispatchable fossil-fuel based capacity, while systems with high dRES capacity can facilitate the integration of vRES by providing flexibility and exploiting seasonal complementarities between dRES and vRES.

18
2Patterns of renewable resources in time (seasonal ratio of solar)
Given that both vRES generation and load profiles are largely inflexible, their correlation can be interpreted as a country-specific characteristic. On the one hand, vRES generation profiles follow site-specific weather patterns, while on the other hand, load profiles respond to regional climate patterns and socio-economic factors of the country. The solar resource, for example, follows a natural annual variation, a variation that is limited in areas close to the equator but can be significant for regions at higher latitudes. Generally, the load in regions close to the equator is also subject to only minor seasonal variation.
Impact on RES-E integration and related challenges
For scenarios with high vRES contributions, the matching of seasonal fluctuations of vRES with typical load patterns becomes a key challenge. A low correlation between load and vRES generation limits the direct contribution to cover the load. Additional measures may be required to manage the security of supply in periods when high levels of demand coincide with low vRES availability (e.g. winter for some countries with large penetration of solar power). Simultaneously, an inverse low correlation may lead to significant curtailment in periods when demand is low but vRES availability is high (e.g. in summer for some countries with large penetration of solar power).8
3 Trend of load growth
Many regions in the world are experiencing a significant growth in electricity consumption. Assuming the increasing electrification of key sectors (e.g. transport), further significant increases can be expected in the future.
Impact on RES-E integration and related challenges
Countries with significant load growth may favour the expansion of vRES capacity to meet growing demand. In relative terms, countries with increasing electricity consumption require high growth rates for renewables to keep the RES share of total electricity generation constant over time. This intense growth means that tackling technical challenges and planning risks, as well as managing investment security, are even more critical than in countries with stable consumption. At the same time, significant load growth leads to increased energy flows in the network. In response, countries need to reinforce networks to cope with congestion. This can be a win-win situation for RES integration, if the grid reinforcements are well aligned with vRES integration for their benefit.
The focus here is placed on technical integration challenges resulting from load growth rather than on the economic implications of planning a new system vs. the need to replace existing power plants, often referred to as the “brownfield/ greenfield” debate.
8 The challenge applies to the daily cycle as well. The daily correlation between vRES generation and load profiles raises flexibility challenges regarding the system’s responsiveness to abrupt variations in the residual load. For instance, countries with high generation from solar power and with a load peak shifted towards the night perceive more pronounced variations in the residual load (i.e. the reduced generation from solar resources after the sunset coincides with increasing demand at night; this is known as the ‘duck curve’).

19
4 Density and distribution of population
From a demographic point of view, the density and distribution of population across a country affects the planning and operation of its power system. This affects generation, transmission and distribution as well as operational procedures.
Impact on RES-E integration and related challenges
In densely populated areas it may be difficult to find the space to install large renewable energy generation plants. Limited public acceptance for extension of the transmission infrastructure regularly causes delays and uncertainties in network planning and implementation. At the same time, smaller distances between new generation sites and load centres may limit the need for additional transmission infrastructure.
More sparsely populated areas may have the space to easily install large-scale renewable energy generation plants; however, the distance between new generation sites and load centres is likely to be larger, indicating challenges for the planning, expansion and operation of transmission networks.
5 Interconnection to directly neighbouring countries
Interconnections allow the exchange of power with neighbouring systems, helping a country to balance the system in case of oversupply (through power export) or a supply deficit (through power import). Synchronous connections rely on three-phase alternating current (AC) lines, mechanically tying systems together. High Voltage Direct Current (HVDC) lines also allow the export or import of power but mechanically decouple the connected systems and contribute to SNSP.
Impact on RES-E integration and related challenges
Interconnections are an important source of flexibility. On average, a country with high interconnection capacity can more easily cope with the variability and uncertainty of vRES while demanding less flexibility from its dispatchable generation assets. A country with limited interconnection capacity, in contrast, faces greater challenges to balance power generation from vRES.
9 The interaction between country characteristics and challenges is country specific and is reflected in the country factsheets in Chapter 8.
COUNTRY CHARACTERISTICS IMPACTING POWER SYSTEM TRANSFORMATION
Impact of country characteristics on the integration of vRES
Individual country characteristics can shape the way in which the challenges related to an increased share of vRES in a power system influence the further integration of vRES. Certain characteristics may be very favourable for the integration of vRES, while others may be only moderately favourable or even unfavourable for the integration of vRES. In other words, certain country characteristics may accentuate or alleviate the respective challenges related to the share of vRES in the system. For instance, low availability of dRES may increase load balancing and reserve challenges, while the presence of interconnectors may ease this challenge.9
20
06POLICIES AND MEASURES GUIDING POWER SYSTEM TRANSFOR- MATION
T he power sector transformation process must be accompanied and stimulated by country-specific policy
frameworks and implemented through targeted measures. At early stages of the power sector transformation process – and in some cases still at later stages – supportive policies are required to create an enabling environment for the development and uptake of vRES in a country. The challenge here lies primarily in stimulating investments, for example through the design of supportive RES financing or de-risking mechanisms. A different set of policies is needed to guide the implementation of the necessary measures to support the technical integration of vRES into the existing grid. While various enabling policies have proven successful in supporting the first step (development and uptake of vRES), there is less clarity on universally applicable policy frameworks to accompany the second step (successful integration of vRES). Yet many of the mostly technical challenges encountered during the integration process may be comparable across countries, depending on their characteristics, and may call for similar measures to ensure a smooth power sector transition.
6.1 Policies supporting the uptake of variable renewable energy sources
Many studies have analysed enabling policies for the uptake of RES in general, and particularly of vRES in the early stages of power system transformation (see, for example, GIZ, 2018; IRENA, IEA, & REN21, 2018). At a very high level, these policies can be broken down into:
n Enabling policies that contribute to the creation of a favourable environment for the development of vRES and set the scene for initial power sector transformation. Typical policy instruments include RES targets, specific grants for research and development of new technologies, and the definition of quality and technical standards for these technologies;
n Direct support mechanisms that support the development and deployment of vRES through mandating certain actions (e.g. electricity quotas to mandate the use of certain technologies) or providing financial incentives; and
n Indirect support mechanisms that are implicit payments or actions favouring and incentivising the development of vRES (e.g. positive discriminatory rules, carbon pricing).
The decision to adopt one or several of the policies or instruments, as well as their level of success, largely depends on the country context, the maturity of the technology and the design of a policy package accompanying the implementation of a specific policy or instrument.

21
06Considering the evolution of vRES in the system, the policies and instruments adopted to encourage their uptake at early stages of the power system transformation must be continuously adjusted, as the share of vRES increases and the technologies become more mature. Most support schemes, regardless of the technology supported, cause disruptions to the operation of the system and markets, for instance by providing out-of-market compensation or favouring the market access of vRES through targeted support schemes. However, as vRES technologies become more competitive and their shares increase, such disruptions must be mitigated, and support mechanisms should be adjusted to the actual conditions and needs of the system. An example is the shift from flat feed-in tariffs to feed-in premiums that encourage vRES generation when demand is high, partially exposing vRES generators to dynamic market prices.
6.2 Measures supporting the integration of variable renewable energy sources
Measures that support the integration of vRES into an existing power system need to target different components of a system, including a system’s technical capabilities, operation, regulatory design, market design (if applicable), and the institutional framework.
Whereas measures implemented at the early phases of power system transformation involve few of these components (e.g.,
adopting technological improvements or adjusting system operation practices), the implementation of measures at later phases is often more difficult, because it typically requires deeper involvement of several components.
Table 6 presents a set of potential measures for each of the challenges identified in Chapter 3. These measures do not provide a one-size-fits-all recipe for vRES integration. Rather, the applicability and effectiveness of the measures must be assessed on an individual country and system basis. Furthermore, measures may differ widely with regards to the framework conditions required for their successful implementation. While some measures are highly technical in nature and can be implemented quickly through a targeted technical intervention, other measures may require a more fundamental change in the structure of the power system. These structural changes, including market reforms, are likely to generate resistance and controversial debates. In this case, targeted policy interventions are required to support the implementation of the respective measures.
In order to facilitate the understanding of the measures and to support the identification of areas where action is needed, the last column of Table 5 highlights three areas of intervention and their respective relevance10: i) technical, ii) policy and iii) system operation or market design. The meaning of each area of intervention is explained in Table 4.
10 Note that the relevance of different areas of interventions and the effort required to implement a measure are highly sytem-specific. For example, a policy measure might be more or less difficult to implement depending on the policy framework present in a country. Against this backdrop, the assessment of the type of intervention presented in Table 6 aims to provide a generic understanding and highlights those dimensions that typically require most attention.
TABLE 4: Assessment framework for relevant areas of intervention
Area of intervention Definition
Technical intervention Involving changes regarding the system’s technical capabilities (i.e. switch of hardware).
Policy interventionInvolving the restructuring of the policy framework, including new/changed roles and responsibilities of system participants.
System operation and/or market design intervention
Involving changes in the way the system is operated. Including restructuration of the market design, if appropriate.
POLICIES AND MEASURES GUIDING POWER SYSTEM TRANSFORMATION
22
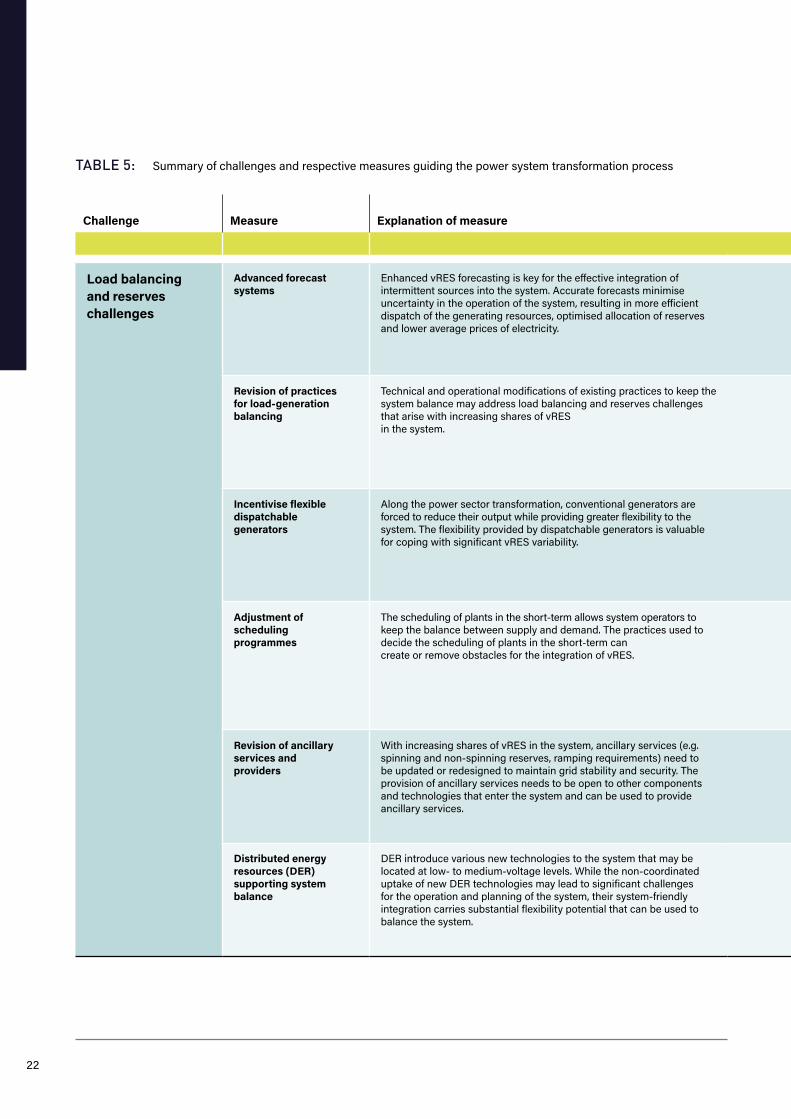
TABLE 5: Summary of challenges and respective measures guiding the power system transformation process
Challenge Measure Explanation of measure Intervention Area of intervention (technical/policy/market)Relevance of area of intervention:
low medium high
Load balancing and reserves challenges
Advanced forecast systems
Enhanced vRES forecasting is key for the effective integration of intermittent sources into the system. Accurate forecasts minimise uncertainty in the operation of the system, resulting in more efficient dispatch of the generating resources, optimised allocation of reserves and lower average prices of electricity.
Improve forecast techniques through:• Including meteo models in energy dispatch decisions• Increasing the time and spatial resolution of vRES
measurements
Revision of practices for load-generation balancing
Technical and operational modifications of existing practices to keep the system balance may address load balancing and reserves challenges that arise with increasing shares of vRES in the system.
Increase flexibility in the system, in the long and short term through:• Modification of operating practices and policy instruments
to foster flexibility• Including flexibility requirements in long-term energy plans
Incentivise flexible dispatchable generators
Along the power sector transformation, conventional generators are forced to reduce their output while providing greater flexibility to the system. The flexibility provided by dispatchable generators is valuable for coping with significant vRES variability.
Increase flexibility of conventional dispatchable generators through:• Technical retrofits of power plants• Policy and system operation signals to foster investment in flexible
dispatchable generators that account for changing cost structures (e.g. capacity markets valuing flexibility)
• Including flexibility requirements in long-term energy plans
Adjustment of scheduling programmes
The scheduling of plants in the short-term allows system operators to keep the balance between supply and demand. The practices used to decide the scheduling of plants in the short-term can create or remove obstacles for the integration of vRES.
Enhance capability of the system to react faster through:• Adjusting scheduling programmes
(e.g. dispatch decisions closer to real time)• Increasing granularity of the dispatch intervals• Ensuring that instruments used for the scheduling of plants
(e.g. bids and/ or communication of a plant’s status to the system operator) capture the technical characteristics of generation assets, especially regarding flexibility.
Revision of ancillary services and providers
With increasing shares of vRES in the system, ancillary services (e.g. spinning and non-spinning reserves, ramping requirements) need to be updated or redesigned to maintain grid stability and security. The provision of ancillary services needs to be open to other components and technologies that enter the system and can be used to provide ancillary services.
Improve the efficiency of ancillary services through:• Upgrade and redesign of ancillary services based on the
specific needs of a system with high vRES shares
Distributed energy resources (DER) supporting system balance
DER introduce various new technologies to the system that may be located at low- to medium-voltage levels. While the non-coordinated uptake of new DER technologies may lead to significant challenges for the operation and planning of the system, their system-friendly integration carries substantial flexibility potential that can be used to balance the system.
Support the coordinated integration of DER through:• Integrating DER in economic dispatch. • Establishing a policy to allow the aggregation of several
DER into one single entity (i.e. aggregators)

23
to be continued
Challenge Measure Explanation of measure Intervention Area of intervention (technical/policy/market)Relevance of area of intervention:
low medium high
Load balancing and reserves challenges
Advanced forecast systems
Enhanced vRES forecasting is key for the effective integration of intermittent sources into the system. Accurate forecasts minimise uncertainty in the operation of the system, resulting in more efficient dispatch of the generating resources, optimised allocation of reserves and lower average prices of electricity.
Improve forecast techniques through:• Including meteo models in energy dispatch decisions• Increasing the time and spatial resolution of vRES
measurements
Revision of practices for load-generation balancing
Technical and operational modifications of existing practices to keep the system balance may address load balancing and reserves challenges that arise with increasing shares of vRES in the system.
Increase flexibility in the system, in the long and short term through:• Modification of operating practices and policy instruments
to foster flexibility• Including flexibility requirements in long-term energy plans
Incentivise flexible dispatchable generators
Along the power sector transformation, conventional generators are forced to reduce their output while providing greater flexibility to the system. The flexibility provided by dispatchable generators is valuable for coping with significant vRES variability.
Increase flexibility of conventional dispatchable generators through:• Technical retrofits of power plants• Policy and system operation signals to foster investment in flexible
dispatchable generators that account for changing cost structures (e.g. capacity markets valuing flexibility)
• Including flexibility requirements in long-term energy plans
Adjustment of scheduling programmes
The scheduling of plants in the short-term allows system operators to keep the balance between supply and demand. The practices used to decide the scheduling of plants in the short-term can create or remove obstacles for the integration of vRES.
Enhance capability of the system to react faster through:• Adjusting scheduling programmes
(e.g. dispatch decisions closer to real time)• Increasing granularity of the dispatch intervals• Ensuring that instruments used for the scheduling of plants
(e.g. bids and/ or communication of a plant’s status to the system operator) capture the technical characteristics of generation assets, especially regarding flexibility.
Revision of ancillary services and providers
With increasing shares of vRES in the system, ancillary services (e.g. spinning and non-spinning reserves, ramping requirements) need to be updated or redesigned to maintain grid stability and security. The provision of ancillary services needs to be open to other components and technologies that enter the system and can be used to provide ancillary services.
Improve the efficiency of ancillary services through:• Upgrade and redesign of ancillary services based on the
specific needs of a system with high vRES shares
Distributed energy resources (DER) supporting system balance
DER introduce various new technologies to the system that may be located at low- to medium-voltage levels. While the non-coordinated uptake of new DER technologies may lead to significant challenges for the operation and planning of the system, their system-friendly integration carries substantial flexibility potential that can be used to balance the system.
Support the coordinated integration of DER through:• Integrating DER in economic dispatch. • Establishing a policy to allow the aggregation of several
DER into one single entity (i.e. aggregators)
POLICIES AND MEASURES GUIDING POWER SYSTEM TRANSFORMATION

24
TABLE 5: Summary of challenges and respective measures guiding the power system transformation process (continued)
Challenge Measure Explanation of measure Intervention Area of intervention (technical/policy/market)Relevance of area of intervention:
low medium high
Monitoring, communication and control challenges in system operations
Advanced forecast systems
Monitoring and control challenges can be addressed with improved forecasting techniques and their incorporation into system operations.
See above.
Real-time monitoring of distributed generation
The system operator must know the state of the system and be able to adjust the settings for individual plants (manually or via automatic schemes). Distributed generation is often not visible to the system operator, thus monitoring and control infrastructure must be improved.
Improve real-time monitoring through:• Applying appropriate communication technologies, protocols
and data formats that capture real time information. • Ensuring IT security while integrating communication and control.
Control of the power plant portfolio
The system and network operators must be able to control the output of all power plants. The supply of dispatchable plants must be matched with the residual load in real time. The stronger the residual load fluctuates – due to increased vRES penetration – the more complex the optimum distribution among the dispatchable plants.
Improve the control of the power plant portfolio through:• Providing infrastructure for automatic generation control (AGC)
for dispatchable plants.• Providing specific infrastructure for control of distributed generation
(e.g. communication technologies, nowcasts).
Stakeholder coordination
Since renewable generation capacity, in particular from vRES, is often connected to distribution networks, the responsibility of distribution companies for system operation increases. Plant operators take over new responsibilities and communicate with the system and network operators.
Improve coordination between old and new players in the power system through:• Increased coordination of actions between grid operators
(TSO-DSO), distribution companies, plant operators, aggregators and the system operator.
• Translating new responsibilities and roles into institutional structures.
Monitoring, communication and control challenges in system planning and development
Cyber security With increasing distributed power generation, power system components are increasingly interconnected and integrated in information and communication technology (ICT) infrastructure. Unauthorised or erroneous access to and manipulation of generation capacity via these interfaces can jeopardise system stability.
Assurance of reliable system operation through:• Implementing consistent and stringent cyber security policies• Regular updates of security and robustness standards for all data
interfaces
Verification of conformity
For secure and reliable operation of power systems, it is essential that the generators behave as expected, i.e. as specified in the technical codes and standards. Verifying conformity of plants is an important quality control process. Distributed generation can make conformity tests more difficult, due to their varying levels of capacity, connection to several voltage levels, diverse technical characteristics, or other features.
Improve the quality of conformity tests and quality control through:• Designing and implementing a consistent process for verification
of conformity, during both project commissioning and project implementation.
Registry of generation facilities and plants
For robust system planning, it is of vital importance to have a comprehensive understanding of the composition of the power plant portfolio and of the capabilities and technical features of the individual plants. The technical characteristics of distributed generators change periodically. Only if this is well documented, it is possible to assess power system robustness and update technical requirements.
Improve visibility and data management through:• Creating a database covering all generation facilities and
including important technical parameters, such as i) information on geographical location, ii) time of connection, iii) connected network level, iv) technology, and v) date of commissioning.

25
to be continued
Challenge Measure Explanation of measure Intervention Area of intervention (technical/policy/market)Relevance of area of intervention:
low medium high
Monitoring, communication and control challenges in system operations
Advanced forecast systems
Monitoring and control challenges can be addressed with improved forecasting techniques and their incorporation into system operations.
See above.
Real-time monitoring of distributed generation
The system operator must know the state of the system and be able to adjust the settings for individual plants (manually or via automatic schemes). Distributed generation is often not visible to the system operator, thus monitoring and control infrastructure must be improved.
Improve real-time monitoring through:• Applying appropriate communication technologies, protocols
and data formats that capture real time information. • Ensuring IT security while integrating communication and control.
Control of the power plant portfolio
The system and network operators must be able to control the output of all power plants. The supply of dispatchable plants must be matched with the residual load in real time. The stronger the residual load fluctuates – due to increased vRES penetration – the more complex the optimum distribution among the dispatchable plants.
Improve the control of the power plant portfolio through:• Providing infrastructure for automatic generation control (AGC)
for dispatchable plants.• Providing specific infrastructure for control of distributed generation
(e.g. communication technologies, nowcasts).
Stakeholder coordination
Since renewable generation capacity, in particular from vRES, is often connected to distribution networks, the responsibility of distribution companies for system operation increases. Plant operators take over new responsibilities and communicate with the system and network operators.
Improve coordination between old and new players in the power system through:• Increased coordination of actions between grid operators
(TSO-DSO), distribution companies, plant operators, aggregators and the system operator.
• Translating new responsibilities and roles into institutional structures.
Monitoring, communication and control challenges in system planning and development
Cyber security With increasing distributed power generation, power system components are increasingly interconnected and integrated in information and communication technology (ICT) infrastructure. Unauthorised or erroneous access to and manipulation of generation capacity via these interfaces can jeopardise system stability.
Assurance of reliable system operation through:• Implementing consistent and stringent cyber security policies• Regular updates of security and robustness standards for all data
interfaces
Verification of conformity
For secure and reliable operation of power systems, it is essential that the generators behave as expected, i.e. as specified in the technical codes and standards. Verifying conformity of plants is an important quality control process. Distributed generation can make conformity tests more difficult, due to their varying levels of capacity, connection to several voltage levels, diverse technical characteristics, or other features.
Improve the quality of conformity tests and quality control through:• Designing and implementing a consistent process for verification
of conformity, during both project commissioning and project implementation.
Registry of generation facilities and plants
For robust system planning, it is of vital importance to have a comprehensive understanding of the composition of the power plant portfolio and of the capabilities and technical features of the individual plants. The technical characteristics of distributed generators change periodically. Only if this is well documented, it is possible to assess power system robustness and update technical requirements.
Improve visibility and data management through:• Creating a database covering all generation facilities and
including important technical parameters, such as i) information on geographical location, ii) time of connection, iii) connected network level, iv) technology, and v) date of commissioning.
POLICIES AND MEASURES GUIDING POWER SYSTEM TRANSFORMATION

26
TABLE 5: Summary of challenges and respective measures guiding the power system transformation process (continued)
Challenge Measure Explanation of measure Intervention Area of intervention (technical/policy/market)Relevance of area of intervention:
low medium high
SNSP-related challenges
Assessment of system capabilities
The technical characteristics of power electronic converters that are used for power generation from vRES have implications for power systems planning and operation. These implications must be analysed and understood in order to quantify SNSP restrictions that are adequate for secure system operation.
Improve understanding of system capabilities through:• Commissioning of dedicated technical studies on technical
restrictions • Identifying restrictions that can be solved by the system or network
operator and those which can only be overcome by changing the technical characteristics of power electronic converters.
Development of technical codes and standards
The technical capabilities of power generators are decisive for the secure and reliable operation of a power system under normal conditions as well as in the case of contingencies. The required technical capabilities are specified in technical codes and standards. Increasing shares of vRES in the system require the adjustment and further development of existing codes and standards.
Improve technical capabilities of power generators through:• Specification of and regularly adjusting adequate technical codes
and standards for generators, reflecting the specific situation of the power system.
Revision of protection schemes
When designing power systems, planners consider various fault scenarios like lightning strikes and short circuits. The task of protection systems is to isolate faults and manage their treatment. Distributed generation changes the technical parameters in networks (e.g. through reverse power flows) and requires the adjustment of existing protection schemes to ensure a safe and reliable operation of the system.
Ensure a safe and reliable operation of the system through: • Adjusting protection schemes and reviewing adequate settings for
individual protection devices and concepts.
Network congestion and restrictions from network operation
Ensure network access Connection to the network is a precondition for electricity generation. In most cases, the direct connection between a generation site and the existing network must be established first. Since distributed generation is often small-scale, the complexity of application procedures and connection costs can be decisive for project viability. Clarity regarding rights and procedures, planning processes and cost allocation are important for successful project implementation.
Facilitate network access for new generators through:• Establishing a legal and regulative framework that removes all barriers
related to network access and establishes an enabling environment. • This includes the right to connect, easy and uniform application
procedures and distribution or socialisation of connection costs.
Optimised operation of networks and network reinforcement
Depending on the locally installed capacity, network loading near the connection point may be higher than in the past and may exceed the rated capacity of the existing network assets. In these cases, network reinforcements are a precondition for expanding generation capacity.
Consideration of several options for dealing with network restrictions, including:• Optimising power flows across different branches and integration of
additional generation capacity (in meshed networks only)• Dynamic line rating• Network reinforcement through adding conductors to an existing
overhead line• Network reinforcement through adding extra lines
Network expansion Large vRES capacity may be planned and constructed in remote areas with low population density, no transmission infrastructure and limited loads nearby. Examples are large PV plants in deserts or wind farms in coastal areas or offshore.
Improve network planning processes through:• Use of scenario-based planning• Coordinating generation and transmission planning• Network expansion through adding new lines
Interconnection Interconnecting extended geographical areas offers various benefits, such as an increased security of supply and lower wholesale electricity prices, while allowing to reduce reserve margins in each of the connected areas. It furthermore helps to smooth out the variability from vRES generation.
Improve network planning processes through:• Use of scenario-based planning• Coordinating development of interconnectors across affected areas• Network expansion through adding new interconnections/ lines
Manage curtailment While some curtailment of vRES is a structural part of planning and operating power systems with enhanced shares of vRES, massive curtailment over an extended period of time is not economically reasonable.
Addressing the issue of curtailment through:• Techno-economic optimisation (investments in new network assets)• Allocating economic losses (socialisation or allocation to individual
stakeholders)Managing curtailment is inversely related to other measures such as grid reinforcement, etc.

27
to be continued
Challenge Measure Explanation of measure Intervention Area of intervention (technical/policy/market)Relevance of area of intervention:
low medium high
SNSP-related challenges
Assessment of system capabilities
The technical characteristics of power electronic converters that are used for power generation from vRES have implications for power systems planning and operation. These implications must be analysed and understood in order to quantify SNSP restrictions that are adequate for secure system operation.
Improve understanding of system capabilities through:• Commissioning of dedicated technical studies on technical
restrictions • Identifying restrictions that can be solved by the system or network
operator and those which can only be overcome by changing the technical characteristics of power electronic converters.
Development of technical codes and standards
The technical capabilities of power generators are decisive for the secure and reliable operation of a power system under normal conditions as well as in the case of contingencies. The required technical capabilities are specified in technical codes and standards. Increasing shares of vRES in the system require the adjustment and further development of existing codes and standards.
Improve technical capabilities of power generators through:• Specification of and regularly adjusting adequate technical codes
and standards for generators, reflecting the specific situation of the power system.
Revision of protection schemes
When designing power systems, planners consider various fault scenarios like lightning strikes and short circuits. The task of protection systems is to isolate faults and manage their treatment. Distributed generation changes the technical parameters in networks (e.g. through reverse power flows) and requires the adjustment of existing protection schemes to ensure a safe and reliable operation of the system.
Ensure a safe and reliable operation of the system through: • Adjusting protection schemes and reviewing adequate settings for
individual protection devices and concepts.
Network congestion and restrictions from network operation
Ensure network access Connection to the network is a precondition for electricity generation. In most cases, the direct connection between a generation site and the existing network must be established first. Since distributed generation is often small-scale, the complexity of application procedures and connection costs can be decisive for project viability. Clarity regarding rights and procedures, planning processes and cost allocation are important for successful project implementation.
Facilitate network access for new generators through:• Establishing a legal and regulative framework that removes all barriers
related to network access and establishes an enabling environment. • This includes the right to connect, easy and uniform application
procedures and distribution or socialisation of connection costs.
Optimised operation of networks and network reinforcement
Depending on the locally installed capacity, network loading near the connection point may be higher than in the past and may exceed the rated capacity of the existing network assets. In these cases, network reinforcements are a precondition for expanding generation capacity.
Consideration of several options for dealing with network restrictions, including:• Optimising power flows across different branches and integration of
additional generation capacity (in meshed networks only)• Dynamic line rating• Network reinforcement through adding conductors to an existing
overhead line• Network reinforcement through adding extra lines
Network expansion Large vRES capacity may be planned and constructed in remote areas with low population density, no transmission infrastructure and limited loads nearby. Examples are large PV plants in deserts or wind farms in coastal areas or offshore.
Improve network planning processes through:• Use of scenario-based planning• Coordinating generation and transmission planning• Network expansion through adding new lines
Interconnection Interconnecting extended geographical areas offers various benefits, such as an increased security of supply and lower wholesale electricity prices, while allowing to reduce reserve margins in each of the connected areas. It furthermore helps to smooth out the variability from vRES generation.
Improve network planning processes through:• Use of scenario-based planning• Coordinating development of interconnectors across affected areas• Network expansion through adding new interconnections/ lines
Manage curtailment While some curtailment of vRES is a structural part of planning and operating power systems with enhanced shares of vRES, massive curtailment over an extended period of time is not economically reasonable.
Addressing the issue of curtailment through:• Techno-economic optimisation (investments in new network assets)• Allocating economic losses (socialisation or allocation to individual
stakeholders)Managing curtailment is inversely related to other measures such as grid reinforcement, etc.
POLICIES AND MEASURES GUIDING POWER SYSTEM TRANSFORMATION

28
TABLE 5: Summary of challenges and respective measures guiding the power system transformation process (continued)
Challenge Measure Explanation of measure Intervention Area of intervention (technical/policy/market)Relevance of area of intervention:
low medium high
Reduced utilisation of dispatchable plants and must-run capacity
Short-term signals – Remuneration of ancillary services and providers
In a high-vRES system, dispatchable generators are required to provide more flexibility than before to the system. The remuneration of ancillary services encourages a more flexible operation of the system and covers part of their costs due to lower utilisation.
Providing incentives for dispatchable generators through:• Design and remuneration of ancillary services based on the
reliability and flexibility requirements of the system• Facilitating recovery of extra costs of a more flexible operation
through short-term signals (remuneration of ancillary services)
Short-term signals – Price formation
More complex power systems require modifications to clearing and pricing models. If the complexity of a power system is not sufficiently captured, system efficiency can be undermined, and the effects of reduced plant utilisation aggravated. With increasing shares of vRES, the price formation model in place must adapt.
Providing incentives for dispatchable generators through:• Defining clearing and pricing rules that consider the effects of
vRES in short-term markets
Long-term signals – Resource adequacy mechanisms
Short-term signals must be complemented with long-term signals that guide investment decisions to guarantee that the system counts with sufficient firm capacity and electricity in the long-term. Resource adequacy mechanisms, or capacity mechanisms, can provide such long-term signal with additional revenue streams for dispatchable generators. This gains importance as increasing vRES generation with zero marginal costs limits the profitability of existing dispatchable generators.
Enhanced assessment of long-term adequacy of the system through:• Designing resource adequacy mechanisms that capture the effects
of increasing participation of vRES in electricity markets and system operation in the long-run
• Establishing an adequacy assessment system that considers future concerns related to security of supply
System balance and negative residual load
Manage curtailment Curtailment can be an alternative to balance the system and counteract the negative residual load. However, with significant shares of vRES, reflected in frequent and ample negative residual load, curtailment becomes a non economically viable alternative.
See above.
Seasonal storage With very high shares of vRES, long-term energy storage becomes crucial to smooth out supply fluctuations over days, weeks or months. Seasonal energy storage systems allow to address the seasonal mismatch between demand and supply of renewable sources, reducing curtailment and adapting the load duration curve.
Consideration of different storage options that can offer a wide range of services to the power system, including alternatives such as:• Pumped hydro storage (PHS) with very large reservoirs• Compressed air energy storage (CAES)Power-to-gas storage
Interconnections Interconnection with neighbouring systems allows transporting excess electricity over long distances from areas with temporary oversupply to demand centres, reducing the occurrences of negative residual load and non-economic curtailment of vRES generation in the exporting system.
See above.
Sector coupling The electrification of other economic sectors is desirable to reach higher vRES penetration shares in systems that already count with high vRES levels – starting from phase C. The electrification of end-use sectors is a precondition to achieve a comprehensive energy transformation that is compatible with the Paris Agreement.
Promote a favourable electrification of other sectors through the development of an electrification roadmap, including:• Sector coupling and demand side management • Revising cross-sectoral institutional frameworks• Integral planning across sectorsReinforced and advanced operation of distribution networks

29
Challenge Measure Explanation of measure Intervention Area of intervention (technical/policy/market)Relevance of area of intervention:
low medium high
Reduced utilisation of dispatchable plants and must-run capacity
Short-term signals – Remuneration of ancillary services and providers
In a high-vRES system, dispatchable generators are required to provide more flexibility than before to the system. The remuneration of ancillary services encourages a more flexible operation of the system and covers part of their costs due to lower utilisation.
Providing incentives for dispatchable generators through:• Design and remuneration of ancillary services based on the
reliability and flexibility requirements of the system• Facilitating recovery of extra costs of a more flexible operation
through short-term signals (remuneration of ancillary services)
Short-term signals – Price formation
More complex power systems require modifications to clearing and pricing models. If the complexity of a power system is not sufficiently captured, system efficiency can be undermined, and the effects of reduced plant utilisation aggravated. With increasing shares of vRES, the price formation model in place must adapt.
Providing incentives for dispatchable generators through:• Defining clearing and pricing rules that consider the effects of
vRES in short-term markets
Long-term signals – Resource adequacy mechanisms
Short-term signals must be complemented with long-term signals that guide investment decisions to guarantee that the system counts with sufficient firm capacity and electricity in the long-term. Resource adequacy mechanisms, or capacity mechanisms, can provide such long-term signal with additional revenue streams for dispatchable generators. This gains importance as increasing vRES generation with zero marginal costs limits the profitability of existing dispatchable generators.
Enhanced assessment of long-term adequacy of the system through:• Designing resource adequacy mechanisms that capture the effects
of increasing participation of vRES in electricity markets and system operation in the long-run
• Establishing an adequacy assessment system that considers future concerns related to security of supply
System balance and negative residual load
Manage curtailment Curtailment can be an alternative to balance the system and counteract the negative residual load. However, with significant shares of vRES, reflected in frequent and ample negative residual load, curtailment becomes a non economically viable alternative.
See above.
Seasonal storage With very high shares of vRES, long-term energy storage becomes crucial to smooth out supply fluctuations over days, weeks or months. Seasonal energy storage systems allow to address the seasonal mismatch between demand and supply of renewable sources, reducing curtailment and adapting the load duration curve.
Consideration of different storage options that can offer a wide range of services to the power system, including alternatives such as:• Pumped hydro storage (PHS) with very large reservoirs• Compressed air energy storage (CAES)Power-to-gas storage
Interconnections Interconnection with neighbouring systems allows transporting excess electricity over long distances from areas with temporary oversupply to demand centres, reducing the occurrences of negative residual load and non-economic curtailment of vRES generation in the exporting system.
See above.
Sector coupling The electrification of other economic sectors is desirable to reach higher vRES penetration shares in systems that already count with high vRES levels – starting from phase C. The electrification of end-use sectors is a precondition to achieve a comprehensive energy transformation that is compatible with the Paris Agreement.
Promote a favourable electrification of other sectors through the development of an electrification roadmap, including:• Sector coupling and demand side management • Revising cross-sectoral institutional frameworks• Integral planning across sectorsReinforced and advanced operation of distribution networks
POLICIES AND MEASURES GUIDING POWER SYSTEM TRANSFORMATION

30
07CONSOLI- DATION OF RESULTS
T he Paris Agreement delivers a strong message to all countries that elevated efforts are necessary to limit the
global temperature increase to 1.5°C. Given the centrality of the energy sector for total global greenhouse gas emissions, the transformation of the energy system is key to achieving the Paris goal.
Power systems around the world have initiated the transformation process as they phase out fossil-fuel based electricity generation and accelerate the introduction of renewable energy technologies. The introduction of variable renewable energy sources (vRES) such as wind and solar at a large scale poses new challenges that need to be acknowledged, understood and overcome in order to facilitate the full decarbonisation of the power sector by mid-century.
This paper develops an assessment framework that allows policy makers to analyse their country’s stage in the power sector transformation process, including the challenges arising in the current and in future stages as well as potential measures to address them.
The measures identified must always be embedded in a regulatory framework that incentivises and supports their implementation. However, given that each country’s regulatory and policy framework is unique and subject to complex political negotiation processes, recommendations may not be universally applicable.
Taking this into account, the analysis undertaken in this paper conveys seven central messages for policy makers:
n Power sector transformation is a process that cannot be implemented overnight but progresses through phases.
n Specific challenges are likely to appear at certain points, i.e. in each phase, independent of a country’s geographic and/ or socio-economic characteristics.
n A country’s geographic and/ or socio-economic charac-teristics can shape the way in which these challenges influence the integration of variable renewable energy sources. Some characteristics may be favourable, while other may be unfavourable for vRES integration.
n Based on the analysis carried out in this paper, it is possible to anticipate the time of occurrence, plausibility of occurrence and the magnitude of the challenge in different country contexts.
n Measures to address the challenges in different country contexts already exist and are readily available, requiring different levels of action in different areas of intervention, i.e. the technical, policy, and system operation or market design area.
n Measures must be embedded in an effective regulatory framework that supports their implementation. The regulatory framework is country-specific and ideally arises from a careful consideration of several political and socio-economic factors.
n Key to a successful power sector transformation process is the careful and timely planning of each phase, anticipating the main challenges and identifying appropriate measures and policies for their solution. This ensures the rapid progress from one phase to the next until ultimately achieving full decarbonisation of the power sector.
Although several countries may encounter similar challenges when passing through a certain phase of the power sector transformation process, or when assessing their geographical and socio-economic features, it is difficult to compare countries along these parameters and to derive generally applicable recommendations to guide the power sector transition process. However, the assessment of different countries - and how they have approached certain challenges arising in their country context - can offer inspiration and orientation for policy makers on selective aspects, which they see applies to them. Thus, policy makers can make a choice on the elements of the power sector transformation process where they see room for peer-learning from others’ experiences and those elements where they prefer to go their own way.

31
08COUNTRY FACT-SHEETS
Structure of the country factsheets
All country factsheets follow a similar structure. A first section highlights country characteristics related to the three areas geography, population and economy and flexibility. The specific composition of characteristics in a country and their impact on the integration of vRES into the grid is summarised in a graph based on Table 7.
The analysis of country characteristics is followed by an examination of the status of power system transformation, including a visualisation of the generation mix and of emission trends in relation to RES shares. This provides the basis for an assessment of the phase of power system transformation a country finds itself in and the respective challenges.
An indication of this phase is given along a continuum:
The factsheets are rounded off by a short outlook on tasks and policy options for moving on and transitioning to the next phase.
B elow are eight country factsheets that illustrate the steps of the analysis explained previously. They offer a snapshot of the situation each
country currently finds itself in regarding its power system transformation process. Each factsheet examines country-specific characteristics and the development status of the country in the power system transformation process, which translate into country and system-based challenges. Policy options to address these challenges and advance from one stage to the next are enclosed. While the power system transformation is a highly complex process that does not offer simple solutions for replication, the country factsheets provide a higher-level overview that may encourage peer-learning between countries that show similarities in their respective situation.
TABLE 7: Characteristics and their impact on the integration of vRES
Area Icon Definition
Geography Availability and potential of dispatchable renewable energy sources (i.e. hydro, geothermal, biomass, waste)
Patterns of renewable resources in time (i.e. seasonal ratio of solar and wind)
Population and economy Trend of load growth
Density and distribution of population
Flexibility Interconnection to directly neighbouring countries
Colour code
Impact of the characteristic on the integration of variable renewable energy sources (vRES)
Characteristic is favourable for the integration of vRES
Characteristic is moderately favourable for the integration of vRES
Characteristic is unfavourable for the integration of vRES
negligible shares of vRES high shares of vRES
0 A B C D E

32
ARGENTINACHARACTERISTICS
GEOGRAPHY, POPULATION AND FLEXIBILITY
1.0
0 100 200 300 4000
POPULATION DISTRIBUTION [million]
SOLAR RATIO WINTER / SUMMER
POPULATION DENSITY [Inh./km2]
largest cityother citiesrural & smaller cities
Argentina has 17 cities with more than 300,000 inhabitants, but more than 30% of the country’s population lives in the Greater Buenos Aires area. The population density outside the 17 cities is extremely low, with about seven inhabitants per km2 (UNDESA, 2018).
The solar resource is very favourable in the north of Argentina. While the average solar ratio1 is about 0.3 for the whole country, the solar value in the north-west is close to 1 (DTU, 2019a). The wind resource, on the other hand, is very favourable in the south and on the coast (DTU, 2019b).
7 outside larger cities0.3
Buenos Aires
1 The average solar ratio is calculated as the ratio between the average daily solar energy yield of the darkest three months (winter) and the sunniest three months (summer). The closer the value is to 1, the smaller is the variation between winter and summer months and the steadier is the solar resource.
Between 2005 and 2016, per capita electricity consumption grew in line with the economy and reached about 3000 kWh per person and year in 2016. The total population also grew slightly, and electricity access reached 100% (World Bank, 2019a).
Together, these factors resulted in a significant growth of total final electricity consumption from 90 TWh in 2005 to 132 TWh in 2016, equivalent to an increase of 46% (IEA, 2018). Between 2016 and 2030, the Ministry of Energy expects a further increase of total consumption of around 3.4% per year, reaching 211 TWh in 2030 (MINEM, 2017).
Argentina is a net importer of electricity (IEA/OECD, 2018).
Argentina and Uruguay together form a synchronous electrical island. Interconnections to Brazil are based on non-synchronous, HVDC technology.
Generation
Load
0 2% 4% 6% 8%-2%
Share with regard to generation/ load [%]
ImportExport
14.7
18.3
10.9
3,000
2,500
2,000
1,500
1,000
500
0
Consumption per capita and population w/access to electricity
2000 2016
[kWh/capita]
95%with electricityacces
100%with electricityacces
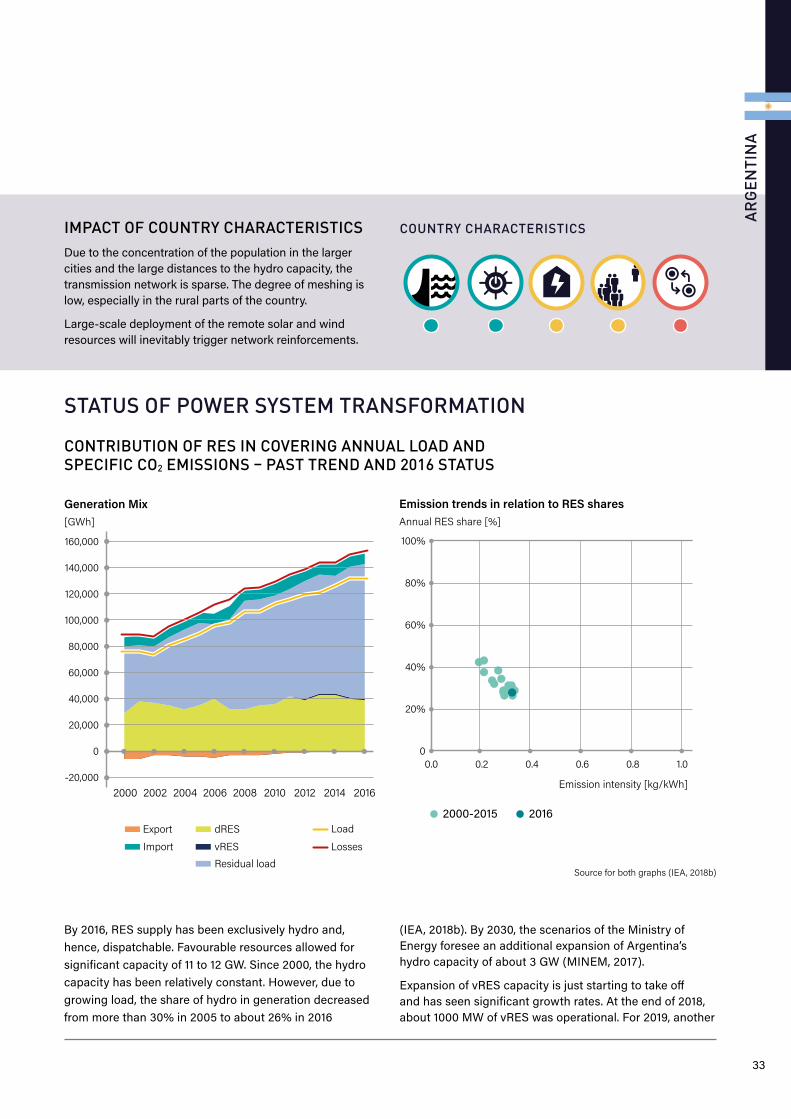
33
STATUS OF POWER SYSTEM TRANSFORMATION
CONTRIBUTION OF RES IN COVERING ANNUAL LOAD AND SPECIFIC CO2 EMISSIONS – PAST TREND AND 2016 STATUS
ARGE
NTI
NA
IMPACT OF COUNTRY CHARACTERISTICSDue to the concentration of the population in the larger cities and the large distances to the hydro capacity, the transmission network is sparse. The degree of meshing is low, especially in the rural parts of the country.
Large-scale deployment of the remote solar and wind resources will inevitably trigger network reinforcements.
Source for both graphs (IEA, 2018b)
COUNTRY CHARACTERISTICS
By 2016, RES supply has been exclusively hydro and, hence, dispatchable. Favourable resources allowed for significant capacity of 11 to 12 GW. Since 2000, the hydro capacity has been relatively constant. However, due to growing load, the share of hydro in generation decreased from more than 30% in 2005 to about 26% in 2016
(IEA, 2018b). By 2030, the scenarios of the Ministry of Energy foresee an additional expansion of Argentina’s hydro capacity of about 3 GW (MINEM, 2017).
Expansion of vRES capacity is just starting to take off and has seen significant growth rates. At the end of 2018, about 1000 MW of vRES was operational. For 2019, another
160,000
140,000
120,000
100,000
80,000
60,000
40,000
20,000
0
-20,000
Generation Mix[GWh]
2000 20162014201220102008200620042002
Export dRES
vRESResidual load
Import
Load
Losses
100%
80%
60%
40%
20%
0
Emission trends in relation to RES sharesAnnual RES share [%]
Emission intensity [kg/kWh]
0.0 1.00.80.60.40.2
2000-2015 2016

34
ARGENTINASTATUS OF POWER SYSTEM TRANSFORMATION (continued)
3000 MW of new capacity is expected. By 2030, the official scenarios assume a further capacity expansion of 14,000 to 18,000 MW compared to 2018 levels (MINEM, 2017).
As with an increasing participation of gas in the generation mix the renewables share slightly decreased, while specific CO2 emissions per kWh slightly increased. Absolute emissions grew by 60% from 50 MtCO2eq in 2000 to 80 MtCO2eq in 2016 (IEA, 2018b).
PHASE OF POWER SYSTEM TRANSFORMATION AND CHALLENGESLooking at vRES development only, Argentina is rapidly moving from phase A to phase B in the power sector transformation process. Currently, wind power is having a noticeable impact on system operations. CAMMESA is introducing the necessary tools for forecasting in system operations.3
In the near future, automatic generation control (AGC) coordinating the real time output of dispatchable plants will replace the current, manual dispatch. This is a pre-condition for maintaining efficient and reliable system operations with increasing shares of variable renewables.
TASKS AND POLICY OPTIONS FOR MOVING ON If vRES capacity in the GW range is deployed in the north-west and south, new transmission corridors will be required. Experience shows that planning and implementation of vRES projects is often faster than construction of new transmission lines, so it is important to start planning and permitting processes soon.
The growth plans for vRES capacity are ambitious. The move from phase B through to phase C and even to phase D may be fast and may just cover a couple of years. This requires a stable regulative framework and anticipating policies. Otherwise, inherent risks for new projects may unexpectedly block developments. Examples for relevant policy areas are:
• Redispatch of hydro and thermal capacity as a means of congestion management;
• Regulations for vRES projects experiencing congestion in their export networks or SNSP restrictions;
• Planning of new transmission capacity.
2 See: https://www.minem.gob.ar/www/833/25897/proyectos-adjudicados (accessed 13/08/2019).
3 CAMMESA (Compania Administradora del Mercado Mayorista Eléctrico) is the administrator of the wholesale electricity market in Argentina. Its main functions include the real-time operation of the electricity system, the dispatch of generation and the administration of the commercial transactions in the electricity market.
PHASE OF POWER SYSTEM TRANSFORMATION
negligible shares of vRES
high shares of
vRES
0 A B C D E

35
GERMANY CHARACTERISTICS
GEOGRAPHY, POPULATION AND FLEXIBILITY4
1.0
SOLAR RATIO WINTER / SUMMER
POPULATION DISTRIBUTION [million]
A sixth of Germany’s population lives in larger cities with more than 300,000 inhabitants. Many smaller municipalities exist resulting in a high average population across the country (UNDESA, 2018).
The solar resource is slightly better in the south and south-west (DTU, 2019a). The low solar winter to summer ratio (0.1) indicates a strong annual cycle. In the North Sea, wind resources are favourable, and its shallow waters allow large scale implementation of offshore wind (DTU, 2019b). However, the specific shape of the German territorial waters results in a greater water depth than neighbouring countries like Denmark or The Netherlands. The potential for sustainable expansion of dRES capacity like hydropower, geothermal and also biomass is limited.
4 Source of map: Forum Network Technology/ Network Operation (FNN) in the VDE, available at: https://www.vde.com/resource/blob/1361716/4ae6aaa1163060cd-6c186bc574711ec2/vde-fnn-karte-stromnetz-deutschland-2018-data.pdf.
Since around 2005, per capita electricity consumption changed only slightly as did the total population, and was reflected by little substantial change in total final electricity consumption, which is expected to remain stable in the near future (IEA, 2018b).
Germany’s power system is part of the synchronous interconnected Central and Western European power systems. The transmission networks cover all regions and are highly meshed and are strongly interconnected between countries.
Germany has been a net exporter of electricity, due to the ample capacity of thermal generation and the high share of lignite in the electricity supply, resulting in wholesale prices that are low compared to neighbouring countries (IEA, 2018b).
Berlin
3.5
65.8
13.0
0 100 200 300 400
POPULATION DENSITY [Inh./km2]
187 outside larger cities
Generation
Load
-15% -10% -5% 0% 5% 10%-20%
Share with regard to generation/ load [%]
ImportExport
7,000
6,000
5,000
4,000
3,000
2,000
1,000
0
Consumption per capita and population w/access to electricity
2000 2016
[kWh/capita]
100%with electricityacces
100%with electricityacces
largest cityother citiesrural & smaller cities 0
0.1

GERMANY
The share of vRES grew dynamically during the last decades. Total RES supply currently covers more than 30% of annual generation (IEA, 2018b).
Germany’s large coal-fired generation has been barely affected by the growth of renewables. Excess generation is exported to neighbouring countries via the liberalised European electricity markets. This has led to a stagnation of absolute levels of CO2 emissions, regardless of the growing contribution of RES to the supply (IEA, 2018b).
36
STATUS OF POWER SYSTEM TRANSFORMATIONCONTRIBUTION OF RES IN COVERING ANNUAL LOAD AND SPECIFIC CO2 EMISSIONS – PAST TREND AND 2016 STATUS
For nearly three decades, the policy framework has been actively supporting vRES. Compared to more sparsely populated countries, the size of most solar as well as wind generation facilities is moderate. For instance, the entire onshore wind capacity is connected to distribution networks (110 kV and below). A large portion of the PV capacity is represented by solar rooftop systems below 30 kW.
Due to the favourable wind resource but spatial restrictions onshore, Germany’s renewable energy policies strongly supported offshore wind. From 2015 connected offshore capacity increased significantly. Compared to other countries bordering the North Sea, German offshore capacity is located far from the coast and, unlike in many neighbouring countries (e.g. the Netherlands or Denmark)
offshore wind farms are connected to the onshore transmission networks by HVDC links.
Renewables and in particular wind power contribute to regular and strong north to south power flows.
Source for both graphs (IEA/OECD, 2018)
600,000
500,000
400,000
300,000
200,000
100,000
0
-100,000
Generation Mix[GWh]
2000 20162014201220102008200620042002
Export dRES
vRESResidual load
Import
Load
Losses
100%
80%
60%
40%
20%
0
Emission trends in relation to RES sharesAnnual RES share [%]
Emission intensity [kg/kWh]
0.0 1.00.80.60.40.2
2000-2015 2016
IMPACT OF COUNTRY CHARACTERISTICS
COUNTRY CHARACTERISTICS

PHASE OF POWER SYSTEM TRANSFORMATION AND CHALLENGES
37
GERM
ANY
Power system transformation is in phase C. However, the figures must be interpreted carefully, since the country is part of the synchronous interconnected Central and Western European power systems. The Total Final Electricity Consumption (TFC) of Germany is about 23% of the total synchronous system. Given the strong interconnections with its neighbours, SNSP is not a directly limiting factor for vRES growth at the country level. The total share of dRES in generation in the interconnected system is about 18% (IEA, 2018b).
By 2022, nuclear capacity in Germany will be phased out. This will result in a 10 GW decrease of capacity, a large share of which is located in the south of the country. North-south power transits across the country will increase further, a trend that will be intensified by the further growth of offshore capacity in the North Sea. The Coal Commission established in 2018 recommended a phase-out of coal capacity by 2038 (BMWi, 2019). This recommendation is, however, not legally binding.
Recently, the incentive scheme for renewables changed from fixed feed-in tariffs to an auction scheme. In that period, growth rates of vRES started to fluctuate considerably and continue to do so. Simultaneously, the first significant shares of the existing RES capacity have reached the age of 20 years, at which point they become ineligible for any incentive scheme. It is therefore likely that substantial RES capacity will be decommissioned
soon. To maintain a net growth, the newly-installed capacity must increase to a higher level than in the recent past, before stabilising again.
Because of existing bottlenecks in the transmission networks within the country, the north to south power flows result in network congestion. Curtailment of RES generation and redispatch of thermal power plants are used to manage congestion. In 2017, about 2.9% of RES generation had to be curtailed because of network congestion, with most of this affecting wind generation (Bundesnetzagentur, 2018).
Network reinforcements are planned regularly by the Transmission System Operators (TSOs). An important part of the reinforcements is the implementation of three DC interconnectors, increasing the transport capacity from north to south.
TASKS AND POLICY OPTIONS FOR MOVING TO THE NEXT PHASE Safeguarding stable net growth rates for renewables and achieving net reductions in CO2 emissions requires a stable policy framework based on clear policy targets. Potential elements are:
• Legally binding decisions regarding the phase-out of coal generation;
• Legally binding decisions or targets for renewable shares in load coverage or CO2 reduction;
• Accelerated network reinforcement in order to reduce network congestion;
• Increased efficiency of the system by integrating redispatch and congestion management.
Coordination of the German renewables and climate policies with those of neighbouring countries would increase efficiency.
In the near future, trends driven by the power system transformation may lead to an increase of electricity consumption. E-mobility, conversion of heating systems supplied by electricity (heat pumps) and other forms of sector coupling (power to gas) represent significant new loads.
The regulatory framework has to be adjusted in order to make these sector coupling options economically viable and allow the required growth rates.
PHASE OF POWER SYSTEM TRANSFORMATION
negligible shares of vRES
high shares of
vRES
0 A B C D E

38
INDIA CHARACTERISTICS
GEOGRAPHY, POPULATION AND FLEXIBILITY
1.0
0
POPULATION DISTRIBUTION [million]
SOLAR RATIO WINTER / SUMMER
largest cityother citiesrural & smaller cities
India has nearly 200 cities with more than 300,000 inhabitants. About 2% of the population of the sub-continent live in the largest city, Delhi (UNDESA, 2018). The majority of the total population, however, lives in rural areas. Even outside the major cities, the population density is high, with about 360 inhabitants per km2 (World Bank, 2019).
Due to the size of the country, meteorological characteristics in general and the solar resource in particular are diverse. The potential for solar PV is vast and is estimated at about 750 GW (DTU, 2019a). In large parts of the subcontinent, the solar winter-summer ratio is close to 1. The wind potential is realistically restricted to the coastline and is estimated at about 100 GW (DTU, 2019b).
0.8
New Delhi
Between 2005 and 2016, per capita consumption nearly doubled from 430 kWh/person/year to 840 kWh/person/year. Simultaneously, the population grew by 15% and the population with access to electricity by 50%. As a consequence, the total final electricity consumption grew to nearly 230% compared to 2005, amounting to 1100 TWh in 2016 (IEA, 2018b).
India has five transmission regions (northern, western, eastern, north-eastern and southern). In the past, these regions represented separate networks. In late 2013, the southern region was the last to synchronise to the others, creating a single, integrated, synchronous system covering the complete sub-continent. However, load and generation are unevenly distributed across the regions. The north and south regions rely on imports and, despite massive extension of the transmission network, capacity between the regions is still insufficient to completely cover the deficits.
0 100 200 300 400
POPULATION DENSITY [Inh./km2]
outside larger cities 357
There are interconnections with neighbouring countries. However, compared to the size of the system, they are rather insignificant for its behaviour and flexibility.
Generation
Load
-0.2% 0% 0.2% 0.4%-0.4%
Share with regard to generation/ load [%]
ImportExport
25.9
1074.0
224.3
1,200
1,000
800
600
400
200
0
Consumption per capita and population w/access to electricity
2000 2016
[kWh/capita]
59%with electricityacces
85%with electricityacces

39
STATUS OF POWER SYSTEM TRANSFORMATIONCONTRIBUTION OF RES IN COVERING ANNUAL LOAD AND SPECIFIC CO2 EMISSIONS – PAST TREND AND 2016 STATUS
INDI
A
IMPACT OF COUNTRY CHARACTERISTICSThe dominating factor for the development of the Indian power system is the surging demand. Generation capacity grew from about 115 GW in 2005 to 275 GW in 2015 and interregional transmission capacitiy was expanded from about 30 GW at the end of the 11th National Electricity Plan (2012) to about 70 GW at the end of the 12th National Electricity Plan (2017) (Ministry of Power, 2016). The size of the country requires long distance transmission. Both high AC voltages up to 675 kV and DC interconnectors are used.
A large part of the population lives in rural areas and more than 10% of the total poulation still has no access to electricity. The additional dRES potential is considerable. For the period 2017 to 2027 an extension of the existing
large hydro capacity with about 20 GW is projected, plus an additional 20 GW of imports from hydro resources. The additional indigenous potentials of small hydro (up to 25 MW per unit) and biomass are estimated at 20 GW and 25 GW, respectively (Ministry of Power, 2018).
Source for both graphs (IEA, 2018b)
During the last years, vRES grew much faster than dRES capacity. Existing dRES consists of nearly 50 GW of hydro plus nearly 10 GW of biomass (Ministry of Power, 2018).Load as well as thermal generation are growing faster than renewables generation, so the share of renewables in the
total annual balance has decreased slightly over the past ten years (IEA, 2018b).
Specific CO2 emissions per kWh generated are at a constant, high level.
COUNTRY CHARACTERISTICS
1,400,000
1,200,000
1,000,000
800,000
600,000
400,000
200,000
0
-200,000
Generation Mix[GWh]
2000 20162014201220102008200620042002
Export dRES
vRESResidual load
Import
Load
Losses
100%
80%
60%
40%
20%
0
Emission trends in relation to RES sharesAnnual RES share [%]
Emission intensity [kg/kWh]
0.0 1.00.80.60.40.2
2000-2015 2016

40
INDIA
PHASE OF POWER SYSTEM TRANSFORMATION AND CHALLENGESThe transformation process for India can be qualified as phase A. As a country-wide assessment, though, this is misleading. Given the uneven distribution of generation and load across the country in combination with the existing transmission constraints, some regions face challenges typical for phase B or even approaching C.
For 2022, the government set the target to achieve a total installed capacity of 100 GW PV, of which 40 GW is supposed to be rooftop PV. For the current 13th National Electricity Plan, this means a capacity addition of nearly 90 GW. Similarly, a total wind capacity of 60 GW is projected, requiring an addition of nearly 28 GW in the same period (Ministry of Power, 2018). Connecting this new capacity to load centres requires network reinforcements and extensions, therefore ‘green energy transmission corridors’ will be developed in parallel with the generation capacity.
There is a high share of losses in the supplied load, with a significant share representing non-technical losses (unpaid services and theft) (IEA, 2018b). This is a serious problem for the distribution companies who are unable to recover their costs. To date, efforts to reduce these losses show limited success. In some states, dedicated PV programmes focusing on the agricultural sector (water pumping) try
to tackle this problem and simultaneously stimulate RES development. In urban areas, distribution companies managed to effectively reduce non-technical losses by rolling-out smart meters.
For distribution companies, RE targets are also difficult because the remuneration for renewables is higher than for electricity from fossil fuels. As end user prices are politically set, there are no effective mechanisms to recover the extra costs. Similarly, distribution companies are responsible for balancing the system and, hence, they have to deal with the risk of vRES forecast errors in their supply area.
TASKS AND POLICY OPTIONS FOR MOVING ON
The National Electricity Plan assumes that nearly 50 GW of lignite and coal plants will be retired between 2017 and 2027. Part of the retirement will be forced by new environmental standards, in particular control of sulphur oxide emissions, which are not achieved by large numbers of coal plants (about 100 units with a cumulated capacity of nearly 17 GW) (Ministry of Power, 2018).
However, 45 GW of new coal capacity are projected for the same period. These new plants have an operational life reaching to 2050 and beyond. Together with an expected nuclear capacity of 10 GW in 2022 and 16 GW in 2027, the amount of thermal capacity in 2027 is nearly 230 GW. An additional 50 GW of hydro is also qualified as must run capacity (Ministry of Power, 2018). Thus, even in the long
run, a dominant share of the generation portfolio must be considered inflexible, potentially conflicting with the need to integrate additional amounts of vRES, which is a precondition for replacing fossil-based generation.
This is even more relevant because the government targets place much emphasis on PV. Inevitably, this technology choice introduces a strong daily cycle of the residual load, requiring high ramp rates of the load following, dispatchable generation.
Ambitious policies and targets with respect to RE deployment will need increasing attention in the near future.
PHASE OF POWER SYSTEM TRANSFORMATION
negligible shares of vRES
high shares of
vRES
0 A B C D E

41
IRELANDCHARACTERISTICS
GEOGRAPHY, POPULATION AND FLEXIBILITY
1.0
0
POPULATION DISTRIBUTION [million]
SOLAR RATIO WINTER / SUMMER
largest cityother citiesrural & smaller cities
Ireland and Northern Ireland operate as one interconnected synchronous system and a single power market. Most figures presented here are for the complete island.
There are two cities with more than 300,000 inhabitants: Dublin and Belfast. Nearly 20% of the island’s population lives
in the largest city, Dublin. The population density excluding these two cities is moderate (UNDESA, 2018). The existing transmission networks are not very dense.
The wind resource is very favourable (DTU, 2019b). The solar resource is less promising (DTU, 2019a). The seasonal solar ratio between winter and summer is about 0.1.
The share of dRES in generation covers about 6% of annual consumption (IEA, 2018b). There is little additional potential. Hence, vRES, especially wind, inevitably play a key role in renewables deployment.
0.1
Dublin
As the population is stable, total final energy consumption in the electricity sector did not change significantly over the last decade. Per capita consumption is just above 5500 kWh/person/year (World Bank, 2019).
The Irish All-Island power system is an electrical island. It is connected with the Great Britain power system by two non-synchronous HVDC links. A third interconnector with France (Celtic Link) is under development and possibly available after 2025.
A large share of primary energy is imported (IEA, 2018b).
0 100 200 300 400
POPULATION DENSITY [Inh./km2]
50 outside larger cities
1.2
4.90.5
Generation
Load
0 2% 4% 6%-2%-4%-6%
Share with regard to generation/ load [%]
ImportExport
6,000
5,000
4,000
3,000
2,000
1,000
0
Consumption per capita and population w/access to electricity
2000 2016
[kWh/capita]
100%with electricityacces
100%with electricityacces

IRELAND
The island character in combination with the large share of vRES introduces particular challenges.
Thermal generation in Ireland is carbon-intensive, so progress in renewables generation does not evenly translate into emission reductions. Structural changes in the power sector are still necessary in order to successfully decarbonise the power sector.
42
STATUS OF POWER SYSTEM TRANSFORMATIONCONTRIBUTION OF RES IN COVERING ANNUAL LOAD AND SPECIFIC CO2 EMISSIONS – PAST TREND AND 2016 STATUS
Because of the outstanding wind resource, renewables generation is dominated by (onshore) wind power. The island nature of the power system has led to early and high instantaneous penetrations of vRES, primarily wind. Offshore wind has been proposed for off the relatively shallow eastern coast.
Wind farms are dispersed across the country. Transmission extension projects like the north-south interconnector (400 kV AC, under planning) are important in order to smoothly integrate vRES generation.
However, the population is very scattered across the country. Planning and permitting of large infrastructure
projects easily affects large numbers of land owners and residents. Local resistance against transmission projects is significant and lead times tend to be long (more than a decade).
Source for both graphs (IEA/OECD, 2018)
30,000
25,000
20,000
15,000
10,000
5,000
0
-5,000
Generation Mix[GWh]
2000 20162014201220102008200620042002
Export dRES
vRESResidual load
Import
Load
Losses
100%
80%
60%
40%
20%
0
Emission trends in relation to RES sharesAnnual RES share [%]
Emission intensity [kg/kWh]
0.0 1.00.80.60.40.2
2000-2015 2016
IMPACT OF COUNTRY CHARACTERISTICS
COUNTRY CHARACTERISTICS

PHASE OF POWER SYSTEM TRANSFORMATION AND CHALLENGES
43
IREL
AND
The Irish government has set a target for a 40% renewables share in electricity generation in 2020 (Government of Ireland, 2009), and the country will get close to meeting this. However, the 40% target has been derived from a 16% target in overall primary energy supply and, because of delays in other sectors, it seems unlikely that this target will be met. For that reason, some stakeholders used this as an argument to increase the contribution from the power sector, for example, by pushing offshore wind development.
The All Island system is in phase C of the power system transformation process. Overcoming SNSP restrictions is a major challenge enabling further progress.
The two system operators Eirgrid and SONI have been looking into feasible SNSP levels since 2000. They defined maximum SNSP values affecting system operation and network access of new vRES projects. Simultaneously, they actively contributed to technical development and promoted measures allowing a gradual increase of the maximum allowable SNSP, e.g. by updating grid codes for vRES as well as for thermal and hydro generation (EirGrid/SONI, 2010).
In addition to SNSP restrictions, inter-area constraints influence the power plant dispatch. These constraints are related to a variety of technical aspects, like dynamic stability, voltage control and reserve provision (EirGrid/SONI, 2019). As a consequence of the technical limitations wind generation regularly has to be curtailed. In 2018, the total wind energy generated in Ireland and Northern Ireland was about 11 TWh, while about 0.7 GWh of wind energy was dispatched-down. This represents 6% of the total available wind energy in 2018 (EirGrid/SONI, 2018).
TASKS AND POLICY OPTIONS FOR MOVING TO THE NEXT PHASE In this stage the technical challenges are the most relevant to tackle. In order to progress power system transformation, Eirgrid and SONI – in close collaboration with manufacturers and system integrators – started the “DS3” programme (“Delivering a Secure, Sustainable Electricity System” (EirGrid/SEMO/SONI, 2015)). The aim
of the DS3 Programme is to increase allowable levels of instantaneous renewable generation on the system gradually to 75% over the coming years. Starting with a 50% limit and based on past progress, currently, 65% penetration levels are technically feasible.
PHASE OF POWER SYSTEM TRANSFORMATION
negligible shares of vRES
high shares of
vRES
0 A B C D E

44
SPAINCHARACTERISTICS
GEOGRAPHY, POPULATION AND FLEXIBILITY
1.0
0 100 200 300 4000
POPULATION DISTRIBUTION [million]
SOLAR RATIO WINTER / SUMMER
POPULATION DENSITY [Inh./km2]
largest cityother citiesrural & smaller cities
The largest city in Spain is Madrid. The agglomeration accounts for almost 14% of the total population. There are other large urban centres that concentrate large shares of population. However, outside the largest cities, the population density is moderate (UNDESA, 2018), so the existing network is not very dense and links the main load centres.
Spain is rich in solar resource, which is largely evenly distributed across the country. Ignoring the extreme north, solar irradiation only slightly increases from north to south (DTU, 2019a). Wind resources are very attractive at the coasts and in the north. The centre of the country has extended regions with a reasonable wind potential (DTU, 2019b).
58 outside larger cities0.2
Madrid
After many years of sustained growth, electricity demand plummeted in 2008 as result of a strong economic crisis and has not fully recovered. Total electricity consumption has slightly decreased and stagnated at levels below those of 2008 (REE, 2019b), while total population has remained constant, so electricity consumption per capita decreased slightly in the same period.
Spain exchanges just over 5% of its electricity generation and load with its neighbours. Exports and imports are balanced (IEA, 2018a).
Together with Portugal, the Iberic system is considered an isolated system. The interconnection with the rest of Europe (through France) is limited compared to its peak demand and balancing needs.
6.2
29.2 11.0
Generation
Load
-6%-8% -4% -2% 0% 2% 4% 6%-10%
Share with regard to generation/ load [%]
ImportExport
6,000
5,000
4,000
3,000
2,000
1,000
0
Consumption per capita and population w/access to electricity
2000 2016
[kWh/capita]
100%with electricityacces
100%with electricityacces

45
STATUS OF POWER SYSTEM TRANSFORMATION
CONTRIBUTION OF RES IN COVERING ANNUAL LOAD AND SPECIFIC CO2 EMISSIONS – PAST TREND AND 2016 STATUS
SPAI
N
Source for both graphs (IEA, 2018b)
RES supply currently covers around 40% of total annual power generation (IEA, 2018b). The share of renewables has increased in recent decades, led by a significant growth of vRES capacity between 2000-2010, mainly wind power. As result, wind power generation become the main renewable power source since 2008 – 18% of total electricity generation in 2017 – and the second source of power generation after nuclear – 21 % in 2017 (REE, 2018).
In the mainland system, hourly generation from renewable sources has reached record levels greater than 80% in load coverage, and wind power generation alone has reached levels close to 70% (REE, 2018).
As both demand and generation mix have largely remained constant since the uptake of vRES (coincidentally, the economic crisis that led to demand stagnation and the deployment of wind power occurred at the same time), the CO2 emission intensity per kWh has remained relatively constant over the last decade.
IMPACT OF COUNTRY CHARACTERISTICSvRES installations are evenly distributed across the country (REE, 2019c). Due to the geographical distribution of generation resources and main load centres, the existing network is meshed and dense around largest load centres. The relative interconnection with the rest of Europe is still very limited and the Iberic system is virtually operated as an isolated system.
After 2008, a decreasing and eventually stagnating demand led to considerable oversupply of electricity in the system. This led to a reduced (or null) utilisation of Combined Cycle Gas Turbine (CCGT) plants that were originally intended to operate as baseload units (Eurelectric, 2011).
The Spanish load profile changes substantially from winter to summer, shifting peak hours from night-hours to noon-hours. This makes the load-solar ratio favourable in the summer but challenging in the winter, when the annual peak demand usually occurs.
COUNTRY CHARACTERISTICS
300,000
250,000
200,000
150,000
100,000
50,000
0
-50,000
Generation Mix[GWh]
2000 20162014201220102008200620042002
Export dRES
vRESResidual load
Import
Load
Losses
100%
80%
60%
40%
20%
0
Emission trends in relation to RES sharesAnnual RES share [%]
Emission intensity [kg/kWh]
0.0 1.00.80.60.40.2
2000-2015 2016

46
SPAIN
PHASE OF POWER SYSTEM TRANSFORMATION AND CHALLENGESLooking at vRES growth, Spain made the transition from phase A to phase B in the early 2000’s. Adopting new system operation practices, improving forecasting systems and shifting the operating mode of dispatchable thermal generation since 2006 allowed Spain to smoothly integrate the increasing vRES capacity (Cochran, Bird, Heeter, & Arent, 2012). This is reflected in higher shares of vRES, moving the country from phase B to phase C.
Given the limited interconnection with the rest of Europe, Spain has exploited other flexibility sources and adopted advanced operational practices to cope with the increasing variability of wind generation in covering demand: in 2017, the wind generation share oscillated between 1%-69% values (REE, 2018). Some of the most relevant developments implemented in Spain to integrate higher shares of vRES include:
• Digitalisation and modernisation of the existing grid, which has contributed to reduce vRES curtailment associated with grid limitations.
• Dedicated Renewable Energy Control Centre (CECRE) aiming to maximise and integrate the generation from vRES while maintaining reliability and security in the system. CECRE increases the response capability in the operation of the system by overseeing and controlling the generation of renewable installations (Cochran et al., 2012).
• Benefitting from near real-time information from renewable installations, improved forecasting tools that are incorporated into the operation of the system (Cochran et al., 2012).
• Shift in the operating regime of CCGT units. CCGT units initially installed to operate as baseloads carry out retrofits to increase their flexibility (e.g., reduce minimum loads to avoid shut-downs) that allow them to respond to vRES variability and participate in ancillary services (Eurelectric, 2011).
• The Spanish regulator has developed a regulatory and market framework regarding ancillary services that respond to the increasing participation of vRES (IRENA, 2017). Since 2016, vRES generators can participate in ancillary services markets.
TASKS AND POLICY OPTIONS FOR MOVING ON
A substantial increase in vRES shares from current levels requires ample and deeper restructuring of the regulatory framework and market design. The limited interconnection with Europe will remain one of the most significant challenges for Spain in the future. Potential elements for further progress in the power sector transition are:
• Legally binding decisions to phase out coal-fired generation..
• Making a decision on the future role of nuclear power that is aligned with the participation of vRES. This will determine the need for flexibility in the system and affect long-term planning.
• Development of remuneration schemes for dispatchable generators that are needed despite their reduced utilisation. Remuneration should not be based solely on generation but on its availability, provision of inertia requirements and flexibility it provides to the system.
• Continue the progress in active demand management to facilitate the integration of higher shares of vRES.
• Ample revision of electricity markets (from long-term to short-term markets). The effects of a high-vRES system should be reflected in the design of capacity markets, ancillary services and other remuneration instruments. These markets need economic signals that reflect the additional costs resulting from keeping a high-vRES system in balance.
PHASE OF POWER SYSTEM TRANSFORMATION
negligible shares of vRES
high shares of
vRES
0 A B C D E

47
TURKEYCHARACTERISTICS
GEOGRAPHY, POPULATION AND FLEXIBILITY
1.0
SOLAR RATIO WINTER / SUMMER
0.2
POPULATION DISTRIBUTION [million]
Almost 20% of the total population of Turkey lives in Istanbul, Turkey’s largest city. Half of the total population is concentrated in the eight largest cities, most of them located in the north-west of the country. The population density outside the main cities is moderate (UNDESA, 2018).
As a consequence, the grid is heavily meshed and concentrated in the north-west. The Turkish system is interconnected to the rest of Europe through Bulgaria and Greece. There are additional interconnections with isolated systems (i.e., asynchronous to the main system).
The solar potential is attractive and evenly distributed across the country with a slight increase from north to south (DTU, 2019a). The solar ratio is 0.2. The wind resources are moderate in most parts of the country, with the greatest potential are found in coastal and mountain areas (DTU, 2019b).
Electricity consumption per capita increased from about 2000 kWh per year in 2005 to about 3000 kWh per year in 2016 (IEA, 2018b). Additionally, the population with access to electricity increased by nearly 15% compared to 2005 (World Bank, 2019). The combination of these two factors explains the steady demand growth between 2005 and 2016 (at average annual rates of about 5%). A further growth of electricity demand can be expected in the future due to continuous population growth, an increase in connections, and the rapid urbanisation rates.
Turkey has – compared to the extent of its system – limited connections with its neighbours. This is reflected in the export/ import balance: the volumes exchanged are small compared to the annual load or generation.
Turkey is a net importer (IEA, 2018b). The Turkish main system has had synchronous interconnections with the European interconnected system since 2015 (through Bulgaria and Greece) and several non-synchronous links with other neighbouring countries.
Ankara
14.1
38.9
25.2
0 100 200 300 400
POPULATION DENSITY [Inh./km2]
50 outside larger cities
Generation
Load
1% 2% 3% 4%0%-1%-2%
Share with regard to generation/ load [%]
ImportExport
3,000
2,500
2,000
1,500
1,000
500
0
Consumption per capita and population w/access to electricity
2000 2016
[kWh/capita]
95%with electricityacces
100%with electricityacces
largest cityother citiesrural & smaller cities 0

TURKEY
RES supply covers around 30% of today’s annual load. Hydropower is the main source of renewable generation, providing 20% of total supply, followed by wind with 8%.
Despite the decreasing participation of hydropower in meeting demand, its generation in absolute terms has increased over the last decade (IEA, 2018b).
48
STATUS OF POWER SYSTEM TRANSFORMATIONCONTRIBUTION OF RES IN COVERING ANNUAL LOAD AND SPECIFIC CO2 EMISSIONS – PAST TREND AND 2016 STATUS
The good availability of hydro resources has allowed Turkey to leverage from the flexibility provided by hydropower generation (Godron, Cebeci, Bülent, & Saygın, 2018), which contributed to the smooth and steady growth of wind power generation in the last decade without significant implications for the operation of the system.
Load is highest during summer days, when the availability and intensity of the solar resource is higher for power generation, presenting a favourable vRES-load ratio in the country.
The interconnection with Europe in the west (ENTSO-E system) allows the Turkish system to improve its frequency stability and share spinning reserves among ENTSO-E countries. However, the interconnection with the rest
of Europe is still very limited and the system is virtually operated as an isolated system (EPDK, 2017). The interconnections with other neighbouring countries are either with isolated systems, which do not contribute to the interconnection flexibility, or through non-synchronous links that compete with vRES regarding the SNSP limitations of the system.
300,000
250,000
200,000
150,000
100,000
50,000
0
-50,000
Generation Mix[GWh]
2000 20162014201220102008200620042002
Export dRES
vRESResidual load
Import
Load
Losses Source for both graphs (IEA/OECD, 2018)
100%
80%
60%
40%
20%
0
Emission trends in relation to RES sharesAnnual RES share [%]
Emission intensity [kg/kWh]
0.0 1.00.80.60.40.2
2000-2015 2016
IMPACT OF COUNTRY CHARACTERISTICS
COUNTRY CHARACTERISTICS
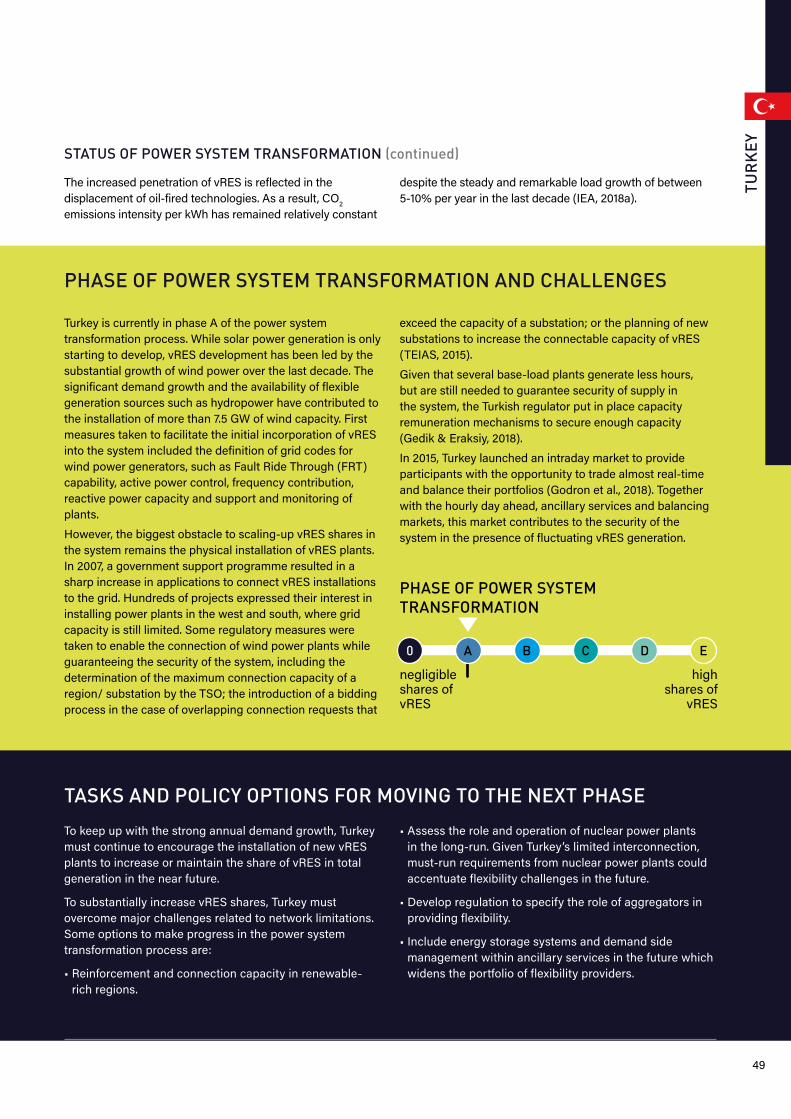
PHASE OF POWER SYSTEM TRANSFORMATION AND CHALLENGES
49
TURK
EY
Turkey is currently in phase A of the power system transformation process. While solar power generation is only starting to develop, vRES development has been led by the substantial growth of wind power over the last decade. The significant demand growth and the availability of flexible generation sources such as hydropower have contributed to the installation of more than 7.5 GW of wind capacity. First measures taken to facilitate the initial incorporation of vRES into the system included the definition of grid codes for wind power generators, such as Fault Ride Through (FRT) capability, active power control, frequency contribution, reactive power capacity and support and monitoring of plants.
However, the biggest obstacle to scaling-up vRES shares in the system remains the physical installation of vRES plants. In 2007, a government support programme resulted in a sharp increase in applications to connect vRES installations to the grid. Hundreds of projects expressed their interest in installing power plants in the west and south, where grid capacity is still limited. Some regulatory measures were taken to enable the connection of wind power plants while guaranteeing the security of the system, including the determination of the maximum connection capacity of a region/ substation by the TSO; the introduction of a bidding process in the case of overlapping connection requests that
exceed the capacity of a substation; or the planning of new substations to increase the connectable capacity of vRES (TEIAS, 2015).
Given that several base-load plants generate less hours, but are still needed to guarantee security of supply in the system, the Turkish regulator put in place capacity remuneration mechanisms to secure enough capacity (Gedik & Eraksiy, 2018).
In 2015, Turkey launched an intraday market to provide participants with the opportunity to trade almost real-time and balance their portfolios (Godron et al., 2018). Together with the hourly day ahead, ancillary services and balancing markets, this market contributes to the security of the system in the presence of fluctuating vRES generation.
TASKS AND POLICY OPTIONS FOR MOVING TO THE NEXT PHASE To keep up with the strong annual demand growth, Turkey must continue to encourage the installation of new vRES plants to increase or maintain the share of vRES in total generation in the near future.
To substantially increase vRES shares, Turkey must overcome major challenges related to network limitations. Some options to make progress in the power system transformation process are:
• Reinforcement and connection capacity in renewable-rich regions.
• Assess the role and operation of nuclear power plants in the long-run. Given Turkey’s limited interconnection, must-run requirements from nuclear power plants could accentuate flexibility challenges in the future.
• Develop regulation to specify the role of aggregators in providing flexibility.
• Include energy storage systems and demand side management within ancillary services in the future which widens the portfolio of flexibility providers.
STATUS OF POWER SYSTEM TRANSFORMATION (continued)
The increased penetration of vRES is reflected in the displacement of oil-fired technologies. As a result, CO2 emissions intensity per kWh has remained relatively constant
despite the steady and remarkable load growth of between 5-10% per year in the last decade (IEA, 2018a).
PHASE OF POWER SYSTEM TRANSFORMATION
negligible shares of vRES
high shares of
vRES
0 A B C D E

50
KENYACHARACTERISTICS
GEOGRAPHY, POPULATION AND FLEXIBILITY
1.0
0
POPULATION DISTRIBUTION [million]
SOLAR RATIO WINTER / SUMMER
largest cityother citiesrural & smaller cities
The majority of Kenya’s population (73%) lives in rural areas and the country is relatively sparsely populated (87 persons per km2) (World Bank, 2019).
Solar potential is high across the whole country (DTU, 2019a), with an average solar ratio of close to 1 (see graphic
above), and a wind resource that is attractive only in some areas (DTU, 2019b). Kenya is extremely rich in dispatchable renewable resources, i.e. geothermal and hydropower.
The existing transmission network is concentrated in the south-west of the country, where the few big cities are located, and has radial configuration and poor meshing (CESI, 2017). There are plans to establish a better meshed grid with connection to the north and east, as well as three major regional interconnectors to the neighbouring countries of Ethiopia, Uganda and Tanzania (Power Africa, 2016).
0.9
Nairobi
In 2015, final electricity consumption per capita was 167 kWh (World Bank, 2019). However, as still only two thirds of the population have access to electricity, the consumption of this fraction is about 300 kWh per person and year. Total demand is predicted to grow considerably, doubling from approx. 1,500 MW in 2015 to 2,500-3,600 MW by 2020, due to anticipated growth in population and economic activity (Power Africa, 2016).
Kenya is part of the Eastern Africa Power Pool (EAPP) in which 11 countries in Eastern Africa seek to interconnect their electricity grids. Today, Kenya is a net importer of electricity through an interconnector with Uganda (132 kV power line). Further interconnectors are planned with Ethiopia (500 kV, advanced stage) and Tanzania (400 kV, currently on hold) (KETRACO, 2019).
0 100 200 300 400
POPULATION DENSITY [Inh./km2]
72 outside larger cities
Generation
Load
-0.5% 0% 0.5% 1% 1.5%-1%
Share with regard to generation/ load [%]
ImportExport
3.9
42.0
2.5
700
600
500
400
300
200
100
0
Consumption per capita and population w/access to electricity
2000 2016
[kWh/capita]
16%with electricityacces
56%with electricityacces

51
STATUS OF POWER SYSTEM TRANSFORMATION
CONTRIBUTION OF RES IN COVERING ANNUAL LOAD AND SPECIFIC CO2 EMISSIONS – PAST TREND AND 2016 STATUS
KEN
YA
Source for both graphs (IEA, 2018b)
Kenya’s installed electricity generation capacity consists of around 80% renewable energy sources, with enormous potential to be expanded. The current mix includes mostly hydro (45%), followed by geothermal (39%) and thermal (14%). Other renewables (in particular wind power and bagasse-based co-generation) account for 2%.
The significant potential of dispatchable renewable energy sources (i.e. hydro and geothermal) allows for high overall shares in renewable energy supply. The expansion of vRES is just taking off, with the first 310 MW wind farm in Lake Turkana having been connected to the grid in late 2018. Despite the very favourable solar irradiation, solar is not yet deployed on a large scale.
IMPACT OF COUNTRY CHARACTERISTICSThe main challenge for further expansion of these resources as well as variable renewable sources is the poor transmission grid infrastructure and the lack of interconnectors to export excess electricity.
Kenya has also proven oil and coal resources that may compete with the further expansion of renewables. Commercial reserves of coal were discovered in the Mui Basin of Kitui County and have raised hopes for cheap coal-based electricity generation in the future (Gitonga, 2017).
COUNTRY CHARACTERISTICS
12,000
10,000
8,000
6,000
4,000
2,000
0
-2,000
Generation Mix[GWh]
2000 20162014201220102008200620042002
Export dRES
vRESResidual load
Import
Load
Losses
100%
80%
60%
40%
20%
0
Emission trends in relation to RES sharesAnnual RES share [%]
Emission intensity [kg/kWh]
0.0 1.00.80.60.40.2
2000-2015 2016

52
KENYA
PHASE OF POWER SYSTEM TRANSFORMATION AND CHALLENGESPower system transformation is in phase 0. Due to the very low share vRES that are fed into the grid (around 1%), their impact on power system operation is still negligible.
The most important challenges can be expected to come from the limited flexibility of the existing generation fleet and, related to that, the risk of excess generation and the need for non-economic curtailment. High shares of geothermal (and potentially coal) increase the inflexibility of the generation fleet and augment excess generation. This issue might become more critical in the long-term, due to must-run capacity of geothermal, take-or-pay power import through the HVDC link to Ethiopia, and priority dispatch of vRES. The integration of more vRES might increase the situations of excess generation (CESI, 2017).
Another challenge is the timely expansion of the transmission grid and the improvement of meshing, to avoid future network congestion and to allow for efficient and reliable power transport across the country and even beyond its borders (CESI, 2017).
TASKS AND POLICY OPTIONS FOR MOVING ON Electricity generation in Kenya is projected to increase significantly by 2030. If developing as planned, Kenya’s power sector will be close to 100% renewable around 2020. However, the possible introduction of coal power in 2024 would bring about significant changes to the power mix and would considerably increase the emissions of the country’s power system, delaying the sector’s transformation process.
In order to meet the fast-growing demand while further increasing the shares or vRES in power generation – advancing from phase 0 to phase A in the transformation process – a well thought-out electrification strategy is key. It must take into account the potential of geothermal power as an alternative to coal power, as well as the potential of solar-based mini-grids to electrify the more remote areas of the country.
To facilitate higher shares of vRES in the electricity grids, targeted policy making in the following areas is crucial:
• Definition of a realistic mid and long-term renewable energy target for Kenya’s power sector to provide a policy signal for future planning;
• Reconsideration of the coal plant plans at highest political level, taking into account scientific findings on the economic viability and environmental compatibility of a coal plant, with a focus on operational flexibility and resulting energy costs;
• Careful planning and coordination of supply and demand in the future, for example through combination of new geothermal projects with development of industrial zones;
• Clear regulation for the further expansion of renewable-based off-grid electrification of rural and isolated areas, facilitating private sector involvement;
• Prioritisation of transmission expansion to ensure timely evacuation of power from new projects;
• Facilitation of regional cooperation and power trade through fast-tracking interconnection plans with neighbouring countries (in the framework of the EAPP);
• Modernisation of the dispatch regime to allow for a reliable and efficient operation of the power system with substantial presence of intermittent resources.
The most recent Least Cost Power Development Plan (2017-2037 LCPDP) foresees an expansion of renewable energy by almost 4,000 MW by 2030, with an additional 760 MW wind, 646 MW solar and 1,388 MW geothermal generation 2030 (Republic of Kenya, 2018).
Due to the phase-out of medium speed diesel plants and the delayed uptake of coal, CO2 emissions per kWh are
decreasing and already close to zero in 2019. If developments proceed along the lines of the 2017-2037 LCPDP, with delayed and very limited use of coal-based electricity generation and no use of natural gas, CO2 emissions will remain near zero until 2024 and rise slightly thereafter due to the introduction of a down-scaled coal plant in Lamu, to around 0.3 MtCO2e in 2030 (Republic of Kenya, 2018).
STATUS OF POWER SYSTEM TRANSFORMATION (continued)
PHASE OF POWER SYSTEM TRANSFORMATION
negligible shares of vRES
high shares of
vRES
0 A B C D E

53
URUGUAYCHARACTERISTICS
GEOGRAPHY, POPULATION AND FLEXIBILITY
1.0
SOLAR RATIO WINTER / SUMMER
POPULATION DISTRIBUTION [million]
Montevideo is the largest city in Uruguay, with almost half of the national population, and the population density outside the capital is very low (UNDESA, 2018).
Due to the concentration of the population in the capital, the grid is sparse and concentrated around the main load centre in the south.
Wind resources are most favourable in the coastal areas in the south, where the main load centre is located (near Montevideo) (DTU, 2019b). Solar resources are equally favourable in the whole country with a slight increase from south to north (DTU, 2019a). Uruguay counts with remarkable hydro resources that allows it to cover around 60% of the total generation.
The per capita electricity consumption is about 3200 kWh per person and year. The demand has constantly grown over the last decade (IEA, 2018a).
In the north of the country are interconnections with Argentina (AC/ synchronous) and Brazil (HVDC/ non-synchronous). The interconnection capacity with Argentina alone is greater than Uruguay’s peak demand. However, the electricity exports to Brazil are significantly higher (ADME, 2019).
Because of the character of their interconnections, together, the power systems of Uruguay and Argentina form one joint - but isolated - synchronous system. Uruguay’s total final electricity consumption is about 8% of the total interconnected system.
Montevideo
1.71.7
0.00 100 200 300 400
POPULATION DENSITY [Inh./km2]
10 outside larger cities
Generation
Load
-6% -4% -2% 0% -2%-8%
Share with regard to generation/ load [%]
ImportExport
3,000
2,500
2,000
1,500
1,000
500
0
Consumption per capita and population w/access to electricity
2000 2016
[kWh/capita]
98%with electricityacces
100%with electricityacces
largest cityother citiesrural & smaller cities 0 0

URUGUAY
Uruguay’s generation mix is nearly 100% renewable, with a significant 33% from vRES (the majority from wind) and 67% from dRES (mainly hydro) (IEA, 2018b). Before the uptake of vRES in 2014, the Uruguayan system was highly dependent on hydro resources. Thermal participation in the generation mix varied from year to year to cope for occasional lack of water (MIEM, 2018). This is reflected in the fluctuating emissions intensity up to 2015. Fossil fuel resources for
thermal generation were imported. The strong reliance on hydropower and energy security concerns was the main challenge triggering the development of vRES technologies. With an increased share of vRES and the opportunity to export excess generation, thermal generation is mainly used to balance the system as a contingency. Since the development of vRES in 2014, Uruguay has overturned the historical trend and became a net electricity exporter.
54
The availability of hydro resources and the associated flexibility from hydropower generation contributed to smoothly integrate the significant uptake of vRES in 2014.
Load is expected to continue to grow in the future, lessening the risks of curtailment associated to high shares of vRE generation.
Due to the concentration of the population in the south and the large distances to the existing hydro capacity and interconnection links in the north, the existing transmission network is sparse. Despite the large interconnection capacity with Argentina (2000 MW) and Brazil (570 MW),
there is not an active cross-border market (MIEM, 2018), so the interconnections are not fully exploited and the system experiences high vRES curtailment due to oversupply.
STATUS OF POWER SYSTEM TRANSFORMATIONCONTRIBUTION OF RES IN COVERING ANNUAL LOAD AND SPECIFIC CO2 EMISSIONS – PAST TREND AND 2016 STATUS
Source for both graphs (IEA/OECD, 2018)
14,000
12,000
10,000
8,000
6,000
4,000
2,000
0
-2,000
Generation Mix[GWh]
2000 20162014201220102008200620042002
Export dRES
vRESResidual load
Import
Load
Losses
120%
100%
80%
60%
40%
20%
0
Emission trends in relation to RES sharesAnnual RES share [%]
Emission intensity [kg/kWh]
0.0 1.00.80.60.40.2
2000-2015 2016
IMPACT OF COUNTRY CHARACTERISTICS
COUNTRY CHARACTERISTICS

PHASE OF POWER SYSTEM TRANSFORMATION AND CHALLENGES
PHASE OF POWER SYSTEM TRANSFORMATION
negligible shares of vRES
high shares of
vRES
55
URUG
UAY
Uruguay is currently in phase C of power transformation. However, because of the strong link with Argentina the power system cannot be considered as isolated. Due to the large hydro capacity, the contribution from vRES is still limited and SNSP restrictions do not apply.
The significant participation of hydro resources and the high interconnection capacity equipped Uruguay with valuable flexibility resources to accommodate an important share of vRES: scaling from a symbolic 5% in 2013 to a remarkable 33% in 2017, less than a decade after starting the transition towards vRES.
In addition to the flexibility provided by dRES and the interconnections, Uruguay adopted additional measures to
facilitate the integration of higher shares of vRES, including advanced forecasting systems, monitoring and control measures, all of them with relatively limited technical effort.
TASKS AND POLICY OPTIONS FOR MOVING TO THE NEXT PHASE The major challenge that Uruguay faces in the near future is the curtailment of renewable power. Uruguay currently experiences high vRES curtailment levels, mostly at night when wind generation exceeds demand. Despite the large interconnection capacity with Argentina, this is not used at its maximum capacity to export the excess of generation, due to the lack of commercial agreement between the two countries.
Uruguay is considering the following options to efficiently integrate higher shares of vRES in the future:
• Establish an active cross-border market with Argentina and Brazil that increases the export of renewable energy surplus and reduces vRES curtailment levels;
• Install and use Automated Generation Control (AGC) systems for economic dispatch;
• Promote long-term planning for the grid that accounts for higher shares of vRES and their implications for grid congestion and voltage stability;
• Incorporate battery and pumped systems to cope with the variability of vRES;
• Develop demand side management programmes;
• Develop hybrid (wind-solar) power plants to benefit from their complementarity, increase the capacity factor and reduce net-variability.
Uruguay already foresees the key role of sector coupling alternatives to address the electricity surplus in a high vRES system. In this context, Uruguay is exploring the development of heat-pumps, electric vehicles and hydrogen production.
0 A B C D E

56
REFERENCES
ADME. (2019). Informe Anual 2018. Retrieved from https://adme.com.uy/db-docs/Docs_secciones/nid_526/ Informe_Anual_2018_V8.pdf
BMU. (2007). Das Integrierte Energie- und Klimaprogramm (IEKP) der Bundesregierung. Retrieved from https://www.bmu.de/fileadmin/bmu-import/files/pdfs/allge-mein/application/pdf/hintergrund_meseberg.pdf
BMWi. (2019). Strukturwandel und Beschäftigung “. Retrieved from https://www.bmwi.de/Redaktion/DE/Downloads/A/abschlussbericht-kommission-wachs-tum-strukturwandel-und-beschaeftigung.pdf?__blob=-publicationFile
Brown, T. W., Bischof-Niemz, T., Blok, K., Breyer, C., Lund, H., & Mathiesen, B. V. (2018). Response to ‘Burden of proof: A comprehensive review of the feasibility of 100% renewable-electricity systems.’ Renewable and Sustain-able Energy Reviews, 92(May), 834–847. Retrieved from https://doi.org/10.1016/j.rser.2018.04.113
Bundesnetzagentur. (2018). Monitoring report 2018. Retrieved from https://www.bundesnetzagentur.de/SharedDocs/Downloads/EN/Areas/Electricity-Gas/CollectionCompanySpecificData/Monitoring/MonitoringReport2018.pdf;jsessionid=62BCFD-256224D5E1C0BA38C00B6679B7?__blob=publication-File&v=3
CESI. (2017). Integration of non programmable Renewable Energy in the National Electric System of Kenya. Retrieved from https://www.res4africa.org/wp-content/uploads/2017/10/PP-8-CESI-ABSTRACT-70.pdf
Cochran, J., Bird, L., Heeter, J., & Arent, D. J. (2012). Integrating Variable Renewable Energy in Electric Power Markets: Best Practices from International Experience, Summary for Policymakers. Nreltp-6a20-60451, (April), 16. https://doi.org/10.1002/hup.470030208
DTU. (2019a). Global Solar Atlas. Retrieved August 13, 2019, from https://globalsolaratlas.info/?s=53.748711,-21.662852
DTU. (2019b). Global Wind Atlas. Retrieved August 13, 2019, from https://globalwindatlas.info/
EirGrid/SEMO/SONI. (2015). The DS3 Programme – Delivering a Secure, Sustainable Electricity System. Retrieved from http://www.eirgridgroup.com/site-files/library/EirGrid/DS3-Programme-Brochure.pdf
EirGrid/SONI. (2010). All Island TSO Facilitation of Renew-ables Studies. Retrieved from http://www.eirgridgroup.com/site-files/library/EirGrid/Facilitation-of-Renewa-bles-Report.pdf
EirGrid/SONI. (2018). Annual Renewable Energy Constraint and Curtailment Report 2018. Retrieved from http:// www.eirgridgroup.com/site-files/library/EirGrid/ Annual-Renewable-Constraint-and-Curtailment- Report-2018-V1.0.pdf
EirGrid/SONI. (2019). Operational Constraints Update 10/06/2019. Retrieved from http://www.eirgridgroup.com/site-files/library/EirGrid/OperationalConstraints UpdateVersion1_82_May_2019.pdf
EPDK. (2017). TURKISH ELECTRICITY NETWORK. Retrieved from https://rekk.hu/downloads/events/2017_SEERMAP_Turkish_system_Saglam_Yilmaz.pdf
Eurelectric. (2011). Flexible generation: Backing up renew-ables, 1–48. Retrieved from http://www.eurelectric.org/PowerStats2011/Facts.asp
Gedik & Eraksiy. (2018). The New Capacity Payment Scheme in the Turkish Electricity Market. Retrieved from www.gedikeraksoy.com
Gitonga, J. M. (2017). Kenya Country Profile. Retrieved from https://eneken.ieej.or.jp/data/7463.pdf
GIZ. (2018). Transformation of the Power Sector and Its Framework in Developing Countries – vRE Discussion Series Paper 7. Retrieved from https://energypedia.info/images/2/26/Discussion_Series_07_Policy_web.pdf
Godron, P., Cebeci, M., Bülent, O., & Saygın, D. (2018). Increasing the Share of Renewables in Turkey’s Power System: Options for Transmission Expansion and Flexibility. Retrieved from www.shura.org.tr
Government of Ireland. (2009). National Renewable Energy Action Plan Ireland. Retrieved from https://www.dccae.gov.ie/documents/The National Renewable Energy Action Plan (PDF).pdf
Heard, B. P., Brook, B. W., Wigley, T. M. L., & Bradshaw, C. J. A. (2017). Burden of proof: A comprehensive review of the feasibility of 100% renewable-electricity systems’. Renewable and Sustainable Energy Reviews, 76, 1122–1133. Retrieved from https://www.sciencedirect.com/science/article/pii/S1364032117304495
IEA. (2018a). World Energy Balances (2018 edition). Paris, France.
IEA. (2018b). World Energy Statistics 2018. Paris, France.
IEA. (2019). Status of Power System Transformation 2019. Retrieved from www.iea.org/publications/reports/ StatusofPowerSystemTransformation2019/
IRENA. (2017). Adapting market design to high shares of variable renewable energy. Retrieved from http://www.irena.org/-/media/Files/IRENA/Agency/Publi-cation/2017/May/IRENA_Adapting_Market_Design_VRE_2017.pdf
IRENA. (2018). Renewable Electricity Capacity and Generation Statistics – Query Tool. Retrieved April 10, 2019, from http://resourceirena.irena.org/gateway/ dashboard/?topic=4&subTopic=54

57
IRENA. (2019). Renewable Power Generation Costs in 2018. International Renewable Energy Agency. Abu Dhabi, United Arab Emirates. Retrieved from https://www.irena.org/-/media/Files/IRENA/Agency/Publication/2019/May/IRENA_2018_Power_Costs_2019.pdf
IRENA, IEA, & REN21. (2018). Renewable Energy Policies in a Time of Transition. Retrieved from http://www.iea.org/publications/freepublications/publication/IRENA_IEA_REN21_Policies_2018.pdf
KETRACO. (2019). Regional Power Interconnections. Retrieved from https://www.ketraco.co.ke/learn/ regional-interconnection.html
MIEM. (2018). Long-term Power Generation Capacity Expansion Planning & FlexTool Analysis URUGUAY CASE STUDY.
MINEM. (2017). Escenarios Energéticos 2030. Retrieved from http://datos.minem.gob.ar/dataset/9e2a8087-1b49- 446a-8e86-712b476122fb/resource/04dbee7f-0b6f- 48d0-b460-8d7fa3b282c7/download/minem- documento-escenarios-energeticos-2030pub.pdf
Ministry of Power. (2016). Advance National Transmission Plan for 2021-2022 – Report Part A. Retrieved from http://www.cea.nic.in/reports/others/ps/pspa2/ptp.pdf
Ministry of Power. (2018). National Electricity Plan Volume I Generation.
OECD/IEA. (2018a). Perspectives for the energy transition: The role of energy efficiency. Retrieved from http:// www.iea.org/publications/freepublications/publication/Perspectives for the Energy Transition - The Role of Energy Efficiency.pdf
OECD/IEA. (2018b). Status of Power System Transformation 2018. Advanced Power Plant Flexibility.
OECD/IEA. (2018c). World Energy Outlook 2018. Retrieved from https://www.iea.org/weo2018/
Power Africa. (2016). Development of Kenya’s power sector 2015-2020. Retrieved from https://www.usaid.gov/sites/default/files/documents/1860/Kenya_Power_Sector_ report.pdf
REE. (2018). Las energias renovables en el sistema eléctrico español. Retrieved from https://www.ree.es/sites/ default/files/11_PUBLICACIONES/Documentos/ Renovables-2017.pdf
REE. (2019a). Cecovel, centro de control de vehículo eléctrico. Retrieved August 8, 2019, from https://www.ree.es/es/red21/vehiculo-electrico/cecovel
REE. (2019b). Demanda eléctrica y actividad económica: ¿Cambio de paradigma? Retrieved from https:// www.ree.es/sites/default/files/downloadable/ demanda-electrica-actividad-economica_0.pdf
REE. (2019c). Mapas - ESIOS. Retrieved August 8, 2019, from https://www.esios.ree.es/es/mapas-de-interes
Republic of Kenya. (2018). Updated Least Cost Power Development Plan: Study Period 2017-2037.
Rogelj, J., Luderer, G., Pietzcker, R. C., Schaeffer, M., Krey, V., & Riahi, K. (2015). Energy system transformations for limiting end-of-century warming to below 1.5°C. Nature Climate Change, 5, 519–527. https://doi.org/10.1038/NCLIMATE2572
S&P Global Platts. (2017). World Electric Power Plants Database: Global Market Data and Price Assessments – Platts.
Saran, M., Sardana, T., & Rustagi, V. (2019). India RE Outlook 2019. Retrieved from http://www.indiaenvironmentportal.org.in/files/file/India-RE-Outlook-2019.pdf
TEIAS. (2015). Wind Power in Turkish Power System. Wind Power for the World.
Tongia, R., Harish, S., & Walawalkar, R. (2018). Integrating Renewable Energy Into India’ s Grid – Harder Than It Looks. Retrieved from https://www.brookings.edu/wp-content/uploads/2018/11/Complexities-of- Integrating-RE-into-Indias-grid2.pdf
UNDESA. (2018). World Urbanization Prospects: The 2018 Revision. Online Edition. Retrieved April 10, 2019, from https://population.un.org/wup/Download/
World Bank. (2019). World Development Indicators. Retrieved April 10, 2019, from https://databank.world-bank.org/data/source/world-development-indicators
World Nuclear Association. (2018). Nuclear Power in Turkey. Retrieved August 9, 2019, from https://www.world- nuclear.org/information-library/country-profiles/ countries-t-z/turkey.aspx

TRANSITION TOWARDS A DECARBONISED ELECTRICITY SECTOR – A FRAMEWORK OF ANALYSIS FOR POWER SYSTEM TRANSFORMATION