transport and retention of multi-walled carbon … · in general, transport studies at low cnt...
TRANSCRIPT

ww.sciencedirect.com
wat e r r e s e a r c h 4 7 ( 2 0 1 3 ) 9 3 3e9 4 4
Available online at w
journal homepage: www.elsevier .com/locate/watres
Transport and retention of multi-walled carbon nanotubes insaturated porous media: Effects of input concentration andgrain size
Daniela Kasel a,*, Scott A. Bradford b, Ji�rı �Sim�unek c, Marc Heggen d,e, Harry Vereecken a,Erwin Klumpp a
aAgrosphere Institute (IBG-3), Forschungszentrum Julich GmbH, 52425 Julich, GermanybUS Salinity Laboratory, Agricultural Research Service, United States Department of Agriculture, Riverside, CA 92507, USAcDepartment of Environmental Sciences, University of California Riverside, Riverside, CA 92521, USAdPeter Grunberg Institute (PGI-5), Forschungszentrum Julich GmbH, 52425 Julich, GermanyeErnst Ruska-Centre (ER-C), Forschungszentrum Julich GmbH, 52425 Julich, Germany
a r t i c l e i n f o
Article history:
Received 1 August 2012
Received in revised form
9 November 2012
Accepted 13 November 2012
Available online 23 November 2012
Keywords:
Carbon nanotubes
Column experiments
Quartz sand
Breakthrough curves
Retention profiles
Transport modeling
* Corresponding author. Tel.: þ49 2461 61 35E-mail addresses: [email protected] (
[email protected] (M. Heggen), h.vere0043-1354/$ e see front matter ª 2012 Elsevhttp://dx.doi.org/10.1016/j.watres.2012.11.019
a b s t r a c t
Water-saturated column experiments were conducted to investigate the effect of input
concentration (Co) and sand grain size on the transport and retention of low concentrations
(1, 0.01, and 0.005 mg L�1) of functionalized 14C-labeled multi-walled carbon nanotubes
(MWCNT) under repulsive electrostatic conditions that were unfavorable for attachment.
The breakthrough curves (BTCs) for MWCNT typically did not reach a plateau, but had an
asymmetric shape that slowly increased during breakthrough. The retention profiles (RPs)
were not exponential with distance, but rather exhibited a hyper-exponential shape with
greater retention near the column inlet. The collected BTCs and RPs were simulated using
a numerical model that accounted for both time- and depth-dependent blocking functions
on the retention coefficient. For a given Co, the depth-dependent retention coefficient and
the maximum solid phase concentration of MWCNT were both found to increase with
decreasing grain size. These trends reflect greater MWCNT retention rates and a greater
number of retention locations in the finer textured sand. The fraction of the injected
MWCNT mass that was recovered in the effluent increased and the RPs became less hyper-
exponential in shape with higher Co due to enhanced blocking/filling of retention locations.
This concentration dependency of MWCNT transport increased with smaller grain size
because of the effect of pore structure and MWCNT shape on MWCNT retention. In
particular, MWCNT have a high aspect ratio and we hypothesize that solid phase MWCNT
may create a porous network with enhanced ability to retain particles in smaller grain
sized sand, especially at higher Co. Results demonstrate that model simulations of MWCNT
transport and fate need to accurately account for observed behavior of both BTCs and RPs.
ª 2012 Elsevier Ltd. All rights reserved.
21; fax: þ49 2461 61 2518.D. Kasel), [email protected] (S.A. Bradford), [email protected] (J. �Sim�unek),[email protected] (H. Vereecken), [email protected] (E. Klumpp).ier Ltd. All rights reserved.

wat e r r e s e a r c h 4 7 ( 2 0 1 3 ) 9 3 3e9 4 4934
1. Introduction
Carbon nanotubes (CNT) are needle-shaped particles with
nano-scale diameters and micro-scale lengths (Iijima, 1991;
Mauter and Elimelech, 2008). In principle, CNT are rolled up
sheets of graphene forming individual tubes (single-walled
carbon nanotubes, SWCNT) or tubes within tubes (multi-
walled carbon nanotubes, MWCNT) (Sinnott, 2002). Carbon
nanotubes exhibit unique electronic, chemical, and physical
properties that have been exploited in numerous commercial
applications (Liu et al., 2009; Mattison et al., 2011). The wide-
spread use and a lack of regulations for CNT disposal will
undoubtedly result in their release into the environment,
especially into soils and groundwater (Nowack and Bucheli,
2007; Klaine et al., 2008; Kohler et al., 2008; Jaisi and
Elimelech, 2009). However, the fate and effects of CNT in the
environment are still not yet well understood (Saleh et al.,
2008). Previous studies have revealed a potential health risk
of CNT to several organisms, e.g., rainbow trout and rats (Lam
et al., 2006; Handy et al., 2008; Farre et al., 2009). Furthermore,
CNT are one of the most biologically non-degradable man-
made materials (Lam et al., 2004). The transport of CNT
through porous media is therefore of considerable interest
regarding potential risks to organisms and human health
(Mattison et al., 2011). This is especially true for CNT that have
been functionalized to increase their stability in aqueous
suspensions because this modification will also increase their
mobility in the environment (Mattison et al., 2011).
To date, several studies have investigated CNT transport in
packed sand columns under water-saturated conditions. The
transport and retention of CNT has been found to be sensitive
to a diversity of experimental conditions including ionic
strength (IS), pore water velocity, and collector grain size (Jaisi
et al., 2008; Jaisi and Elimelech, 2009; Liu et al., 2009; Tian et al.,
2010; Mattison et al., 2011; Tian et al., 2012). Despite this
research, transport and retention processes for MWCNT are
still not completely understood (Mattison et al., 2011). For
example, the effect of CNT input concentration on their
transport behavior has not yet been reported, and the selected
input CNT concentrations for previous studies were more
than nine orders of magnitude higher than is expected for
most environmentally relevant scenarios (Gottschalk et al.,
2009). This is an important aspect to consider because the
input concentration has been demonstrated to significantly
influence colloid deposition (Bradford and Bettahar, 2006;
Bradford et al., 2009), and this concentration effect was also
found to depend on the grain size (Bradford and Bettahar,
2006). In general, transport studies at low CNT concentra-
tions are of interest for fundamental research but recent
studies only considered input concentration significantly
higher than 1 mg L�1 (Jaisi et al., 2008; Jaisi and Elimelech,
2009; Liu et al., 2009; Tian et al., 2010; Mattison et al., 2011;
Tian et al., 2012). Environmental concentrations of MWCNT
will depend on their source and on hydro-geochemical
conditions. However, initial model estimates predict very
low CNT concentrations in soils in the range of several ng kg�1
(Mueller and Nowack, 2008; Gottschalk et al., 2009). In addi-
tion, information on retention profiles for CNT is very scarce
(Wang et al., 2012b). Retention profiles provide needed
information for mass balance and useful insight on control-
ling mechanisms of retention (Bradford and Bettahar, 2005).
Furthermore, breakthrough curves and retention profiles need
to both be accurately simulated by numerical models in order
to reliably predict environmental fate and risk (Bradford et al.,
2003).
The aim of this study was to investigate the transport and
retention of MWCNT in saturated porous media for different
input concentrations and sand grain sizes. Three sand grain
sizes (607, 350, and 240 mm) were considered in these studies.
The input MWCNT concentrations were 1, 0.01, and
0.005 mg L�1. In addition to breakthrough curves, retention
profiles were measured and numerically modeled in order to
obtain information on MWCNT mass balance, retention
mechanisms, and to more accurately predict environmental
fate.
2. Materials and methods
2.1. Carbon nanotubes
Radioactively (14C) labeledMWCNTwere prepared by catalytic
chemical vapor deposition (Bayer Technology Services GmbH,
51368 Leverkusen, Germany) using 14C-benzene as feedstock
gas. The synthesis procedure was a lab-scale setup of the
Baytubes� production process with slight modifications
(Bierdel et al., 2007). After synthesis, the MWCNT were boiled
in 70% nitric acid (SigmaeAldrich Chemie GmbH, 89555
Steinheim, Germany) for 4 h under reflux to remove residual
metal catalysts and to enhance their stability in the aqueous
phase by addition of oxygen containing functional groups (e.g.
carboxylic groups) to their surfaces (Nagasawa et al., 2000;
Pumera, 2007; Xia et al., 2007; Smith et al., 2009). Afterwards,
the MWCNT were removed from the acid by filtering through
a 0.45 mm polytetrafluoroethylene (PTFE) membrane and
rinsing with deionized water until a neutral pH-value was
achieved in the filtrate (Mattison et al., 2011). Finally, func-
tionalizedMWCNTwere dried in an oven at 45 �C and stored at
room temperature until needed.
Morphological properties of MWCNT were characterized
using a transmission electron microscope (TEM, Philips CM20
FEG, FEI Company, 5651 GG Eindhoven, The Netherlands). The
amountofmetalcatalystsbeforeandaftertheacidtreatmentwas
determined using inductively coupled plasma-mass spectrom-
etry (ICP-MS, Agilent 7500ce, Agilent Technologies, Inc., 71034
Boblingen, Germany). Oxygen containing functional groups on
the MWCNT induced by the functionalization procedure were
identifiedusingX-rayphotoelectronspectroscopy (XPS,Phi5600,
Physical Electronics Inc., Chanhassen,MN55317, USA).
For preparation of nanoparticle suspensions, 1 mg of 14C-
labeled functionalized MWCNT were added to 1 L of 1 mM KCl
solution and ultrasonicated for approximately 10 min at 65 W
using a cup horn sonicator (Branson Sonifier� W-250, Dan-
bury, CT 06813-1961, USA) until no aggregates were visible. To
obtain suspensions with lower MWCNT concentrations (0.01
and 0.005 mg L�1), the stock suspensions (1 mg MWCNT L�1)
were diluted with 1 mM KCl to achieve the desired concen-
trations. The concentration of the MWCNT suspensions was
assessed bymeasuring the radioactivity of five 2.5ml aliquots.

wat e r r e s e a r c h 4 7 ( 2 0 1 3 ) 9 3 3e9 4 4 935
Each aliquot was added to 5 mL of scintillation cocktail (Insta-
Gel Plus, Perkin Elmer, 63110 Rodgau, Germany), shaken, and
the radioactivity was measured using a liquid scintillation
counter (LSC, Perkin Elmer, 63110 Rodgau, Germany). The
standard deviation of the radioactivity measured in the five
replicates was low, indicating that the MWCNT suspensions
were homogeneous. The specific radioactivity of the func-
tionalized MWCNT was approximately 3.2 MBq mg�1.
The stability and electrophoretic mobility of suspensions
were determined using unlabeled functionalized MWCNT.
The critical coagulation concentration of 10mg L�1 MWCNT in
KCl (1e100 mM) solution was determined by visual observa-
tions over a 24 h period. The hydrodynamic radius and the
electrophoretic mobility of MWCNT suspensions (1 mg L�1,
1 mM KCl, pH 8.5) were determined using a Zetasizer Nano
(Malvern Instruments GmbH, 71083 Herrenberg, Germany).
The hydrodynamic radius of MWCNT was measured imme-
diately after suspension preparation, after 1 h, and after 24 h.
2.2. Porous media
Three quartz sands with different median grain sizes were
utilized in the experiments. In particular, we employed two
high purity quartz sands (Quarzwerke GmbH, 50226 Frechen,
Germany) with an average grain size of 350 mm and 240 mm,
and a sterile fused silica sand (Teco-Sil�, C-E Minerals, King of
Prussia, PA, 19406, USA) with an average grain size of 607 mm.
The sands were sequentially treated for 2 h with 65% nitric
acid to remove metal oxides, and then 10% peroxide to elim-
inate organic material (Mattison et al., 2011). The organic
carbon content of the sands was below 0.01 wt%. The sands
were repeatedly rinsed with deionized water following both
acid and peroxide treatments until a neutral pH was achieved
in the rinse water. Electrophoretic mobilities of milled sand
samples were determined in 1 mM KCl solution using the
previously described Zetasizer Nano.
2.3. Column transport experiments
Stainless steel columns with an inner diameter of 3 cm and
a length of 12 cm were used for all experiments. The column
ends were fitted with a stainless steel plate (1 mm openings)
and a PTFE mesh (200 mm openings) to support the sand and
Table 1 e Experimental conditions, hydraulic parameters, andmass; eff e effluent, soil e soil profile) for all column experime
MWCNT inputconcentration [mg L�1]
dc [mm] q [cm min�1] Pore watervelocity [cm min
0.01 240 0.64 1.39
0.01 350 0.63 1.66
0.01 607 0.62 1.51
0.005 350 0.64 1.45
1 240 0.64 1.42
1 350 0.66 1.53
1 607 0.66 1.43
a Disp. is the longitudinal dispersivity estimated on basis of the conserv
b CNT eff is the total amount of CNT in the liquid phase.
c CNT soil is the total amount of CNT in the solid phase.
to ensure uniform flow. The columns were incrementally
filled with porous medium by trickling sand and deionized
water into the column, and then tapping the column with
a rubber mallet. The packed column was connected to
a pump (MCP V 5.10, Ismatec SA, 8152 Glattbrugg,
Switzerland) on the inlet side and a fraction collector (Foxy
Jr.�, Teledyne Isco Inc., Lincoln, NE 68504, USA) on the outlet
side. A Darcy velocity of 0.62e0.66 cm min�1 (Table 1) was
applied for all experiments; equivalent to a pore water
velocity of 1.39e1.66 cm min�1. The flow direction was from
the column bottom to the top. Preliminary transport studies
were conducted using an empty column to determine losses
of MWCNT due to the experimental setup. The initial
MWCNT concentration (Co) that was applied to the column
was corrected for these losses.
The wet-packed column was rinsed with around 30 pore
volumes of the 1 mM KCl solution before starting a transport
experiment. A pulse of approximately 3 pore volumes of
a conservative tracer (1 mMKBr) was applied to determine the
column porosity and dispersivity. Afterwards, this tracer was
flushed to background levels using 1mMKCl solution. Effluent
solutions were collected using the fraction collector every 30 s
(e.g., 2.3 mL per vial). The effluent bromide concentrations
were determined using a high performance liquid chromato-
graph (STH 585, Dionex, Sunnyvale, CA, USA) equipped with
a UV-detector (UV2075, Jasco, Essex, UK).
The same procedure was repeated using the MWCNT
suspensions. In this case, the effluent concentrations of
MWCNTweremeasured using the previously discussed liquid
scintillation counter method. Retention profiles for MWCNT
were also determined after recovery of the breakthrough
curves. In this case, the packed column was excavated in
0.5e1 cm thick increments. The sand from each layer was
dried and then homogenized using a mill. The crushed sand
was then divided into five 500mg replicates and combusted at
900 �C using a biological oxidizer (OX 500, R.J. Harvey Instru-
mentation Corporation, Tappan, NY 10983, USA). The
emerging 14CO2 was dissolved in vials filled with scintillation
cocktail (Oxisolv�, MERCK KGAA, 64293 Darmstadt, Germany)
and the radioactivity was measured using the liquid scintil-
lation counter. Table 1 summarizes measured column prop-
erties determined from the conservative tracer experiments
and mass balance information for MWCNT.
mass balance information (as fractions of the total appliednts. The electrolyte was 1 mM KCl.
�1]Porosity Disp.a [cm] CNT effb CNT soilc Total mass
balance
0.46 0.029 0.05 0.91 0.96
0.38 0.043 0.27 0.72 0.99
0.41 0.090 0.51 0.46 0.98
0.44 0.051 0.13 0.95 1.07
0.45 0.038 0.04 0.82 0.85
0.43 0.052 0.33 0.56 0.88
0.46 0.069 0.73 0.21 0.94
ative tracer BTC.

wat e r r e s e a r c h 4 7 ( 2 0 1 3 ) 9 3 3e9 4 4936
2.4. Mathematical modeling
Transport experiments were analyzed using the HYDRUS-1D
code, a finite element model for simulating one-dimensional
movement of water, heat, and multiple solutes in (variably)
saturated media (�Sim�unek et al., 2008). The code includes
a nonlinear least squares optimization routine (Marquardt,
1963) that allows model parameters to be inversely fitted to
experimental breakthrough curves (BTC) and retention
profiles (RP). Weights to data points were adjusted so that the
contributions to the minimized objective function by the sum
of squared deviations between measured and fitted values
were approximately the same for BTC and RP. The conserva-
tive tracer BTC for each column was simulated using
the advective dispersive equation (ADE) and the column
porosity and dispersivity was obtained by inverse optimiza-
tion (Table 1).
The transport of MWCNT was simulated using the ADE
with terms for one site kinetic retention. The total mass
balance equation is written as (Gargiulo et al., 2007):
vqCvt
þ rvSvt
¼ v
vx
�qD
vCvx
� vqCvx
�(1)
where q [�] is the volumetric water content, r is the bulk
density of the porous media [ML�3, where M and L denote
units of mass and length, respectively], t is the time [T; T
denotes units of time], x is the spatial coordinate [L], q is the
flow rate [LT�1], C is the particle concentration in the aqueous
phase [NcL�3, where Nc is the number of MWCNT], S is the
solid phase particle concentration [NcM�1], and D is the
hydrodynamic dispersion coefficient [L2T�1]. The corre-
sponding solid phase particle mass balance equation is given
as:
rvSvt
¼ qk1jC� k2rS (2)
where k1 [T�1] is the first-order retention coefficient [T�1], k2 is
the first-order detachment coefficient [T�1], and j [�] is
a dimensionless function to account for time and depth-
dependent retention. The parameter j is given as:
j ¼�1� S
Smax
��dc þ xdc
��b
(3)
where Smax [NcM�1] is the maximum solid phase particle
concentration, dc [L] is the median diameter of the sand
grains, and b [�] is an empirical variable that controls the
shape of the retention profile.
The above model formulation is very flexible and can
account for time-dependent breakthrough curves and reten-
tion profiles that are exponential, uniform, and/or hyper-
exponential with depth. The first term on the right side of
Eq. (3) accounts for time-dependent blocking/filling of reten-
tion sites using a Langmuirian approach (Gargiulo et al., 2007).
This blocking term implies that retention decreases with time
and that the retention profile becomes uniform with depth as
S approaches Smax. The second term on the right side of Eq. (3)
describes depth-dependent retention (e.g., a decreasing
retention rate with depth). When b ¼ 0 this term equals 1 and
an exponential distribution of retained MWCNT is predicted
with depth similar to conventional filtration theory.
Conversely, when b > 0 is employed then the retention profile
of MWCNT exhibits a hyper-exponential shape (e.g., a higher
deposition rate close to the column inlet). Bradford et al. (2003)
found an optimal value of b ¼ 0.432 for different sized
spherical latex microspheres and sand grains. However,
this value of b did not adequately describe the observed
depth-dependency in retention profile shape for the non-
spherical MWCNT. This parameter was therefore re-
estimated by simultaneously fitting b and k1 to BTC and RP
from the three sized sands. Based on this information a value
of b for MWCNT was estimated from the average value from
these experiments as 0.765 (standard deviation ¼ 0.1). A
similar value for b (0.8) was employed byWang et al. (2012b) in
MWCNT transport studies.
Four model formulations based on Eqs. (1)e(3) will be
considered in this work. The conventional attachment and
detachment model (M1) is obtained by setting j ¼ 1. A model
that includes attachment, detachment, and Langmuirian
blocking (M2) is achieved when b ¼ 0. A depth-dependent
retention model (M3) is acquired by setting b ¼ 0.765 and
setting Smax to a large value so that the first term on the right
side of Eq. (3) goes to 1. Finally, a time and depth-dependent
retention model (M4) is given when b ¼ 0.765 and Smax is set
equal to a value resulting in the first term on the right side of
Eq. (3) being smaller than 1.
3. Results and discussion
3.1. Characterization of MWCNT
Results of the ICP-MS measurements indicated that catalyst
impurities were significantly removed after the functionali-
zation process. The acid treatment reduced the amount of Mg,
Mn, Co, and Al from 3.26 wt% to less than 0.07 wt%. Thus,
metal impurities were almost completely removed and were
not expected to influence interaction of MWCNT with the
porous media.
Fig. 1 shows XPS spectra of as-received and functionalized
MWCNT. The intensity of the binding energy of the O 1s
spectra (Fig. 1a) was significantly higher after the acid treat-
ment, indicating that functionalization produced an increased
amount of groups containing oxygen. The two materials also
show differences in their C 1s spectra (Fig. 1b). The peak at
285 eV, representing the sp2 carbon atoms of the graphene
sheets, was dominant for both samples (Xia et al., 2007).
Between 287 and 293 eV the spectra of the functionalized
MWCNT showed a shoulder that is attributable to carbon
atoms exhibiting bonds to oxygen atoms (Xia et al., 2007).
Hence, the XPS spectra demonstrate that acid treatment of
MWCNT produced functional groups that carried oxygen.
Transmission electron microscope (TEM) images (Fig. 2)
show that MWCNT were tortuous particles with a high aspect
ratio. At higher magnification, the multiple walls of carbon
were visible (Fig. 2b). The size distribution of MWCNT is very
heterogeneous. Pauluhn (2010) reported that MWCNT had
a median diameter of 10e15 nm and a median length of
200e1000 nm. Qualitative analysis of Fig. 2 yielded similar
results. The hydrodynamic radius of MWCNT dispersed in

Fig. 1 e High resolution O 1s (a) and C 1s (b) spectra of untreated (blue line) and functionalized (red line) multiwalled carbon
nanotubes obtained using X-ray photoelectron spectroscopy.
wat e r r e s e a r c h 4 7 ( 2 0 1 3 ) 9 3 3e9 4 4 937
1 mM KCl was determined using dynamic light scattering
(DLS) to range between 170 and 210 nm. DLS measurements
and TEM images did not reveal significant changes in size and
diameter after the acid treatment.
Reliable determination of MWCNT stability and interaction
energies using conventional approaches (DLS and DLVO
calculations) is not trivial because of their complex size
distribution and configuration (Fig. 2). However, the critical
coagulation concentration for unlabeled, functionalized
MWCNTs was found to be 40 mM KCl in simple aggregation
experiments. The electrolyte concentration used in the
transport experiments (1 mMKCl) was significantly below this
value. Furthermore, no visual MWCNT aggregates were
observed after 4 h in 1mMKCl solution and the hydrodynamic
radius at three measurement times (t ¼ 0 h, t ¼ 1 h, and
t ¼ 24 h) was in the same range. Thus, it was assumed that all
MWCNT suspensions were stable for the duration of the
transport experiments (approximately 1 h). The electropho-
retic mobility for MWCNT in 1 mM KCl solution (pH 8.5) was
Fig. 2 e Transmission electron micrographs of multiwa
measured to be �2.85 � 10�8 m2 V�1 s�1. The electrophoretic
mobility values for the sands were �3.90 � 10�8 (240 mm),
�4.47 � 10�8 (350 mm), and �3.15 � 10�8 m2 V�1 s�1 (607 mm).
The negative charge on bothMWCNT and sand, and the low IS
conditions, suggests that repulsive electrostatic conditions,
that were unfavorable for attachment, existed for MWCNT
during the transport experiments.
3.2. Effect of grain size
Column experiments were conducted to assess the effect of
the collector grain size on MWCNT transport and retention.
Fig. 3 presents observed and simulated BTCs for MWCNT in
three different sized sands (240, 350, and 607 mm) when
q ¼ 0.62e0.66 cm min�1, IS ¼ 1 mM, and Co ¼ 0.01 mg L�1. The
BTCs are plotted as the normalized effluent concentration (C/
Co) as a function of pore volumes that have been flushed
through the column. The corresponding observed and simu-
lated RPs for the MWCNT are shown in Fig. 4. The RPs are
lled carbon nanotubes at different magnifications.

wat e r r e s e a r c h 4 7 ( 2 0 1 3 ) 9 3 3e9 4 4938
plotted as normalized solid phase concentration (S/Co) as
a function of distance. The total mass balance information
presented in Table 1 ranged from 0.85 to 1.07.
The MWCNT breakthrough curves (Fig. 3) reached the
column outlet only slightly after the conservative tracer (data
not shown), indicating that size exclusion was negligible for
MWCNT (Bradford et al., 2003). A clear decrease in the
maximum MWCNT effluent concentration occurred with
decreasing grain size. This can partially be explained by an
increasing rate of mass transfer to the solid surface with
a decrease in sand grain size as predicted by filtration theory
(Yao et al., 1971; Tufenkji and Elimelech, 2004). The MWCNT
BTCs in the 240 and 350 mm sands also exhibited some time-
dependent blocking behavior (increasing breakthrough
concentrations with time), suggesting that retention locations
were being filled over time. The observed concentration tailing
was negligible after recovery of the BTC. The value of k2 was
therefore set equal to zero for all of these simulations.
The fitted model parameters to the BTCs (M1 and M2) as
well as to BTCs and RPs (M3 andM4) are provided in Table 2, as
well as the Pearson’s correlation coefficient for the BTC ðR2effÞ.
A direct comparison between k1 values for the four model
formulations is not meaningful since models M1 and M2 do
not account for a depth-dependency, whereas models M3 and
M4 do. All four model formulations (M1, M2, M3, and M4)
described the MWCNT BTCs quite well with ðR2effÞ>0.85.
0.00
0.02
0.04
0.06
0.08
0 1 2 3 4 5
C/ Co
Pore volume
240 µmfit M1fit M2fit M3fit M4
a
0.0
0.2
0.4
0.6
0 1 2
C/Co
Por
c
Fig. 3 e Observed and simulated breakthrough curves for MWCN
(b), and 607 mm (c). Experimental data were fitted with four diff
attachment, detachment, and blocking (M2); depth-dependent r
dependent retention (M4). The flow rate was 0.62e0.66 cm min
concentration was 0.01 mg LL1. Note different vertical scales in
Improved agreement with the BTCs was obtained for models
that included the Langmuirian blocking term (M2 and M4).
The Akaike information criterion (AIC) (Akaike, 1974) was
used to assess the relative ability of the four model formula-
tions to describe the BTC and RP data. The AIC value is
a measure of the goodness of a fit that penalizes for adding
fitting parameters; i.e., the model with the lowest value of AIC
is preferred. The AIC decreases fromM1 to M4, indicating that
M4 provides the best agreement with the observed data. For
a particular model, k1 and Smax increased with decreasing
grain size. Previous studies on the transport and deposition of
fullerene (C60) nanoparticles reported similar trends (Li et al.,
2008). These trends reflect an increasing rate of retention
and more retention locations in the finer textured sand.
MWCNT retention shown in Fig. 4 was highest close to the
column inlet and then rapidly decreased with distance.
Consistent with the BTCs shown in Fig. 3, greater MWCNT
retention occurredwith decreasing sand size. Large deviations
were observed between experimental and simulated RPs for
models M1 and M2. The Pearson’s correlation coefficient for
the RP ðR2soilÞ was less than 0.58. Models M1 and M2 tended to
underestimate the high concentrations near the column inlet
and overestimated the concentrations at greater distances,
especially for finer textured sand. Thus, RPs were not
considered for fitting model parameters using models M1 and
M2. These observations indicate that the experimental RPs
3 4 5
e volume
607 µmfit M1fit M2fit M3fit M4
0.0
0.1
0.2
0.3
0.4
0 1 2 3 4 5
C/ Co
Pore volume
350 µmfit M1fit M2fit M3fit M4
b
T in three different sized quartz sands: 240 mm (a), 350 mm
erent models including: attachment and detachment (M1);
etention (M3); and blocking combined with depth-L1, the electrolyte was 1 mM KCl, and the MWCNT input
the figures.

-12
-10
-8
-6
-4
-2
0
0 1 2 3 4 5 6
Dep
th [c
m]
S/Co[mL g-1]
240 µmfit M1fit M2fit M3fit M4
a
-12
-10
-8
-6
-4
-2
0
0 1 2 3 4 5 6
Dep
th [c
m]
S/Co[mL g-1]
350 µmfit M1fit M2fit M3fit M4
b
-12
-10
-8
-6
-4
-2
0
0 1 2 3 4
Dep
th [c
m]
S/Co[mL g-1]
607 µmfit M1fit M2fit M3fit M4
c
Fig. 4 e Observed and simulated retention profiles for MWCNT in three different sized quartz sands: 240 mm (a), 350 mm (b),
and 607 mm (c). Experimental data were simulated with four different models including: attachment and detachment (M1);
attachment, detachment, and blocking (M2); depth-dependent retention (M3); and blocking combined with depth-
dependent retention (M4). The flow rate was 0.62e0.66 cm minL1, the electrolyte was 1 mM KCl, and the MWCNT input
concentration was 0.01 mg LL1.
wat e r r e s e a r c h 4 7 ( 2 0 1 3 ) 9 3 3e9 4 4 939
were hyper-exponential with distance, and that the retention
coefficient exhibited a depth-dependency. Models M3 and M4
include a depth-dependency in the retention coefficient, and
therefore provided a much better description of the MWCNT
RPs than eitherM1 orM2. The value of ðR2soilÞ for theM3 andM4
models was >0.98. Model M4 provided the best overall
description of the data when both BTCs and RPs were
considered.
Hyper-exponential RPs have frequently been reported in
the literature for colloids, microorganisms, and nanoparticles
under unfavorable attachment conditions (Bradford and
Bettahar, 2006; Bradford and Toride, 2007; Gargiulo et al.,
2007, 2008; Wang et al., 2011; Wang et al., 2012a). A variety of
reasons for hyper-exponential RPs have been identified,
including: straining at grainegrain contacts and surface
roughness locations (Shellenberger and Logan, 2001; Bradford
et al., 2002 ,2003; Yoon et al., 2006), particle aggregation (Chen
and Elimelech, 2006, 2007; Chatterjee and Gupta, 2009;
Chatterjee et al., 2010), hydrodynamic factors (Li et al., 2005;
Bradford et al., 2009; Wang et al., 2011), and chemical
heterogeneity on the sand and colloid (Bolster et al., 1999; Li
et al., 2004; Tufenkji and Elimelech, 2005; Tong and Johnson,
2006). The relative contribution of each of these factors to
the observed RP data is difficult to ascertain without addi-
tional information. However, our data does clearly indicate
a strong dependency of the RP shape on the grain size under
low IS conditions. The contribution of physical processes to
the observed hyper-exponential RPs has to be proven.
However, other results in the literature indicate that straining
played a dominant role in the CNT retention under low IS
conditions (Jaisi et al., 2008; Wang et al., 2012b).
Previous transport studies with CNT measured and simu-
lated only BTCs (Jaisi et al., 2008; Jaisi and Elimelech, 2009; Liu
et al., 2009; Mattison et al., 2011). Determination andmodeling
of retention profile are scarce (Wang et al., 2012b). Accurate
simulation of both BTCs and RPs is needed in order to assess
the fate and risks associated with MWCNT migration. To
illustrate this point, Fig. 5 presents the simulated RPs of
MWCNT in the three different sized sands over a distance of
500 cm when using the various model formulations that were
calibrated to the column BTC (M1 and M2) or BTC and RP (M3
and M4) data, respectively (Fig. 3). In Fig. 5 and the discussion
below we set the lower limit of the predicted S/Co to 1E-
5 mL g�1. Increasing deviations in the model predictions
occurred with transport distance and grain size. The M1 and
M2 predictions were quite similar for a given grain size, with
no breakthrough at a depth of 500 cm. The maximum trans-
port distance predicted by the M1 and M2 models was around
200 cm in the coarsest textured 607 mm sand. In contrast,
models M3 and M4 predict similar low levels of MWCNT
breakthrough at 500 cm for the two largest grain sizes (350 and
607 mm). Consequently, using M1 and M2 to predict MWCNT
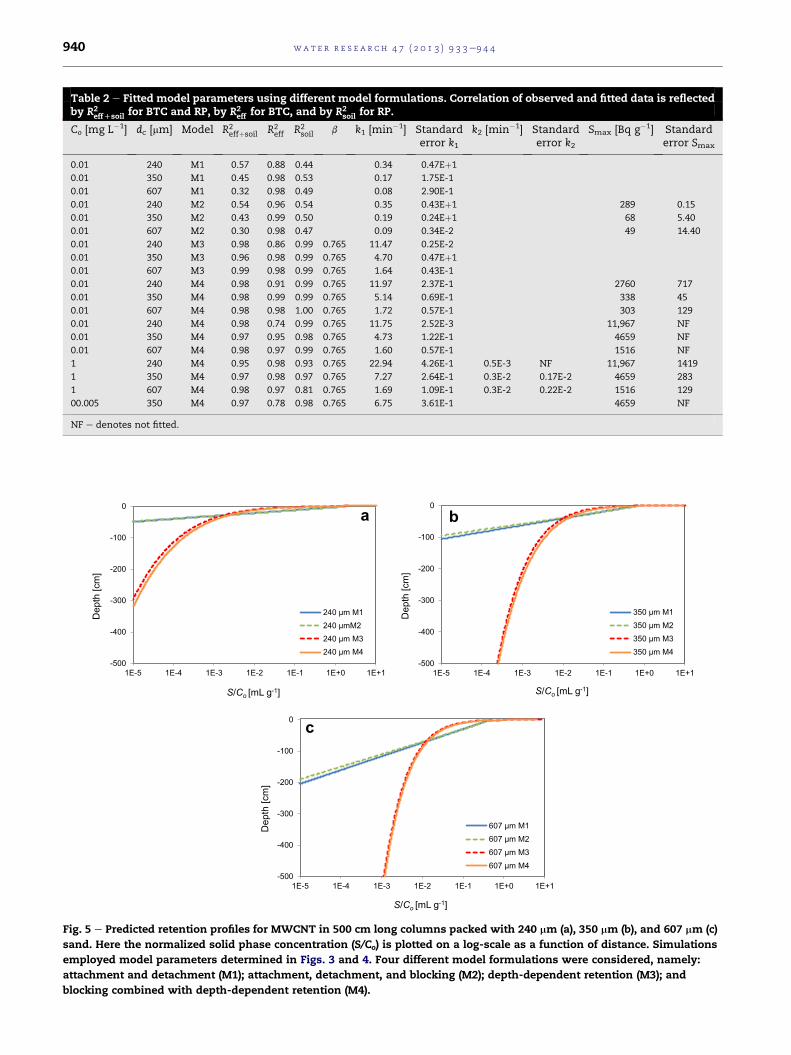
Table 2 e Fitted model parameters using different model formulations. Correlation of observed and fitted data is reflectedby R2
effDsoil for BTC and RP, by R2eff for BTC, and by R2
soil for RP.
Co [mg L�1] dc [mm] Model R2effþsoil R2
eff R2soil b k1 [min�1] Standard
error k1
k2 [min�1] Standarderror k2
Smax [Bq g�1] Standarderror Smax
0.01 240 M1 0.57 0.88 0.44 0.34 0.47Eþ1
0.01 350 M1 0.45 0.98 0.53 0.17 1.75E-1
0.01 607 M1 0.32 0.98 0.49 0.08 2.90E-1
0.01 240 M2 0.54 0.96 0.54 0.35 0.43Eþ1 289 0.15
0.01 350 M2 0.43 0.99 0.50 0.19 0.24Eþ1 68 5.40
0.01 607 M2 0.30 0.98 0.47 0.09 0.34E-2 49 14.40
0.01 240 M3 0.98 0.86 0.99 0.765 11.47 0.25E-2
0.01 350 M3 0.96 0.98 0.99 0.765 4.70 0.47Eþ1
0.01 607 M3 0.99 0.98 0.99 0.765 1.64 0.43E-1
0.01 240 M4 0.98 0.91 0.99 0.765 11.97 2.37E-1 2760 717
0.01 350 M4 0.98 0.99 0.99 0.765 5.14 0.69E-1 338 45
0.01 607 M4 0.98 0.98 1.00 0.765 1.72 0.57E-1 303 129
0.01 240 M4 0.98 0.74 0.99 0.765 11.75 2.52E-3 11,967 NF
0.01 350 M4 0.97 0.95 0.98 0.765 4.73 1.22E-1 4659 NF
0.01 607 M4 0.98 0.97 0.99 0.765 1.60 0.57E-1 1516 NF
1 240 M4 0.95 0.98 0.93 0.765 22.94 4.26E-1 0.5E-3 NF 11,967 1419
1 350 M4 0.97 0.98 0.97 0.765 7.27 2.64E-1 0.3E-2 0.17E-2 4659 283
1 607 M4 0.98 0.97 0.81 0.765 1.69 1.09E-1 0.3E-2 0.22E-2 1516 129
00.005 350 M4 0.97 0.78 0.98 0.765 6.75 3.61E-1 4659 NF
NF e denotes not fitted.
-500
-400
-300
-200
-100
0
1E-5 1E-4 1E-3 1E-2 1E-1 1E+0 1E+1
Dep
th [c
m]
S/Co[mL g-1]
240 µm M1240 µmM2240 µm M3240 µm M4
a
-500
-400
-300
-200
-100
0
1E-5 1E-4 1E-3 1E-2 1E-1 1E+0 1E+1
Dep
th [c
m]
S/Co[mL g-1]
350 µm M1350 µm M2350 µm M3350 µm M4
b
-500
-400
-300
-200
-100
0
1E-5 1E-4 1E-3 1E-2 1E-1 1E+0 1E+1
Dep
th [c
m]
S/Co[mL g-1]
607 µm M1607 µm M2607 µm M3607 µm M4
c
Fig. 5 e Predicted retention profiles for MWCNT in 500 cm long columns packed with 240 mm (a), 350 mm (b), and 607 mm (c)
sand. Here the normalized solid phase concentration (S/Co) is plotted on a log-scale as a function of distance. Simulations
employed model parameters determined in Figs. 3 and 4. Four different model formulations were considered, namely:
attachment and detachment (M1); attachment, detachment, and blocking (M2); depth-dependent retention (M3); and
blocking combined with depth-dependent retention (M4).
wat e r r e s e a r c h 4 7 ( 2 0 1 3 ) 9 3 3e9 4 4940

wat e r r e s e a r c h 4 7 ( 2 0 1 3 ) 9 3 3e9 4 4 941
fate would lead to the conclusion that MWCNT will be
retained in the various sands before reaching a depth of
around 200 cm. In contrast, M3 and M4 would predict
a transport of MWCNT to depths greater than 500 cm. Since
models M3 and M4 provided the best description of the BTCs
and RPs at the column scale (Figs. 3 and 4), the predictions of
these models are more reliable than the predictions obtained
from the other two models (M1 and M2).
3.3. Effect of MWCNT input concentration
Additional column experiments were performed to investi-
gate the influence of MWCNT input concentrations. Fig. 6
presents observed and simulated BTCs (Fig. 6a) and RPs
(Fig. 6b) for MWCNT in 350 mm sand when
q ¼ 0.62e0.66 cm min�1, IS ¼ 1 mM, and Co ¼ 1, 0.01, and
0.005 mg L�1. Based on the findings of the previous section,
only simulation results from model M4 were considered in
Fig. 6. Simulation fits to BTCs and RPs were very good, with
a ðR2effÞ>0.97 and ðR2
soilÞ>0.96. Tables 1 and 2 provide
a summary of the associated experimental, mass balance, and
model parameters.
Inspection of Fig. 6a indicates that the fraction of the
injected mass of MWCNT that was recovered in the effluent
increased with Co. In addition, the shape of the BTCwasmuch
steeper for the highest Co ¼ 1 mg L�1 condition. These trends
may be explained by blocking behavior as retention locations
fill up over time and produce increasing effluent concentra-
tions (Bradford and Bettahar, 2006). Consistent with observa-
tions in Fig. 6a, a higher Co is expected to fill a given Smax more
rapidly. The value of Smax was fitted for the highest Co and
then kept constant for the lower input concentrations. The
fitted retention rate parameter k1 was similar for all Co. After
recovery of the BTC, concentration tailing tended to be low,
but was most pronounced for the highest Co ¼ 1 mg L�1
condition. This indicates that some of the MWCNT retention
was reversible at higher Co when Smax was filled to a greater
extent (Kretzschmar et al., 1995).
Similar to the BTCs (Fig. 6a), the shape of the RPs was also
sensitive to Co (Fig. 6b). In particular, the fraction of MWCNT
0.0
0.2
0.4
0.6
0 1 2 3 4 5
C/Co
Pore volume
1 mg/L0.01 mg/L0.005 mg/L1 mg/L M40.01 mg/L M40.005 mg/L M4
a
Fig. 6 e Observed and simulated breakthrough curves (a) and re
equal to 1, 0.01, and 0.005 mg LL1. The flow rate was 0.62e0.66
of the quartz sand was 350 mm. The data was simulated using
(M4).
retained close to the column inlet increased with decreasing
Co. Conversely, the RPs became less hyper-exponential (more
uniform) with increasing Co. Blocking provides an explanation
for changes in the RPs shape with Co (Bradford and Bettahar,
2006; Bradford et al., 2009; Zhang et al., 2010; Kim et al.,
2011). As MWCNT retention approaches Smax the overall rate
of retention decreases and the RPs become uniform with
depth (Bradford et al., 2009).
Results from Fig. 6 demonstrate that Co can have a large
impact on the transport and retention behavior of MWCNT.
Enhanced retention and limited mobility of MWCNTs is ex-
pected for lower, more environmentally relevant concentra-
tions of MWCNT. These Co effects need to be considered in
models that are used to predict MWCNT fate and risks,
otherwise they may overestimate their transport potential
and groundwater concentrations.
3.4. Effect of grain size and MWCNT input concentration
Fig. 7 presents observed and simulated BTCs (Fig. 7a) and RPs
(Fig. 7b) for MWCNT in three different sized sands (240, 350,
and 607 mm) when q ¼ 0.62e0.66 cm min�1, IS ¼ 1 mM, and
Co ¼ 1.0 mg L�1. Simulation results from model M4 were
considered in Fig. 7. Simulation fits to BTCs and RPs were
good, with a ðR2effÞ>0.97 and ðR2
soilÞ>0.81. Tables 1 and 2 provide
a summary of the associated experimental, mass balance, and
model parameters. Similar to Figs. 3 and 4, Fig. 7 examines the
influence of grain size on MWCNT transport and retention.
However, the experiments shown in Fig. 7 were conducted at
a Co that was two orders of magnitude higher than in Figs. 3
and 4.
Comparison of Figs. 3 and 4 and 7 reveals a similar trend of
increasing MWCNT retention (decreasing breakthrough) with
decreasing grain size at both Co levels. In contrast, the time-
dependent blocking behavior shown in the BTCs (e.g.,
increase in the normalized effluent concentrations shown in
Figs. 3 and 7a) was much steeper for experiments conducted
at the higher Co. The RPs were also more hyper-exponential at
the lower Co (see Figs. 4 and 7b). As explained in the last
section, these trends occur because retention locations were
-12
-10
-8
-6
-4
-2
0
0 1 2 3 4 5 6 7 8 9
Dep
th [c
m]
S/Co[mL g-1]
1 mg/L0.01 mg/L0.005 mg/L1 mg/L M40.01 mg/L M40.005 mg/L M4
b
tention profiles (b) for MWCNT at input concentrations (Co)
cm minL1, the electrolyte was 1 mM KCl, and the grain size
a model combining depth- and time-dependent retention

0
5
10
15
20
25
240 350 607
k1(
min
- 1)
grain size [µm]
Co=1 mg/L
Co=0.01 mg/La
0
2000
4000
6000
8000
10000
12000
240 350 607
Sm
ax(B
q m
L-1 )
grain size [µm]
Co=1mg/LCo=0.01 mg/L
b
Fig. 8 e Plots of the depth-dependent (model M4) retention coefficient (k1) (a) and the maximum solid phase particle
concentration (Smax) (b) as a function of sand grain size for input MWCNT concentrations (Co) of 1 and 0.01 mg LL1.
0.0
0.2
0.4
0.6
0.8
1.0
0 1 2 3 4 5
C/Co
Pore volume
607 µm350 µm240 µm607 µm M4350 µm M4240 µm M4
a
-12
-10
-8
-6
-4
-2
0
0.0 0.5 1.0 1.5 2.0 2.5 3.0 3.5 4.0
Dep
th [c
m]
S/Co[mL g-1]
607 µm350 µm240 µm607 µm M4350 µm M4240 µm M4
b
Fig. 7 e Observed and simulated breakthrough curves (a) and retention profiles (b) for MWCNT in three different sized quartz
sands: 240 mm (a), 350 mm (b), and 607 mm (c). The flow rate was 0.62e0.66 cm minL1, the electrolyte was 1 mM KCl, and the
MWCNT input concentration was 1 mg LL1. The data was simulated using a model combining depth- and time-dependent
retention (M4).
wat e r r e s e a r c h 4 7 ( 2 0 1 3 ) 9 3 3e9 4 4942
filled more rapidly at a higher Co. However, close inspection of
Figs. 3, 4 and 7 indicates that this concentration-dependent
transport behavior was also a function of the sand grain size.
Examination of parameters k1 (Fig. 8a) and Smax (Fig. 8b) as
a function of grain size for the two Co levels revealed that the
values of k1 and Smax both increased with decreasing grain
size. As mentioned above, this reflects greater MWCNT
retention rates and number of retention locations in the finer
textured sand. However, higher Co values accentuated this
trend with k1 and this rate of enhancement increased with
decreasing grain size. Hence, the observed concentration
dependency of MWCNT transport became more important
with increasing Co and decreasing grain size. In contrast to our
observations with MWCNT, Bradford and Bettahar (2006)
observed for spherical latex microspheres that
concentration-dependent colloid transport behavior became
more important with increasing grain size. These trends can
be explained by the effect of porous media’s pore structure on
MWCNT retention (Tan et al., 1994). The non-spherical
MWCNT have a high aspect ratio and we hypothesize that
solid phase MWCNT may create a porous network with the
ability to retain particles (Sumanasekera et al., 2010; Xin et al.,
2012). It is logical to anticipate that the retained MWCNT
network will become more significant at higher Co and in
smaller grain sized sand. This finding suggests that the
particle shape will have a strong influence on concentration-
dependent colloid transport.
4. Conclusions
This study highlights the importance of considering input
concentration and retention profiles to allow reliable predic-
tions of MWCNT transport and fate. The work provides new
information on themobility ofmulti-walled carbon nanotubes
because both breakthrough curves and retention profiles were
considered. Additionally, experiments were performed using
more environmentally relevant MWCNT concentrations.
Results demonstrate that normalized MWCNT transport
increased with higher input concentrations and in coarser
textured sand. The retention profiles showed that themajority
of MWCNT retention occurred near the surface of the porous
medium,especially for lower input concentrationsandsmaller
sandsizes. Simulations that consideredacombinationof time-

wat e r r e s e a r c h 4 7 ( 2 0 1 3 ) 9 3 3e9 4 4 943
and depth-dependent retention provided a good description of
the experimental data. Analysis of model parameters demon-
strated that concentration dependent transport behavior
became more important for smaller grain sizes and higher
input concentrations. These trends were attributed to the
complex shape and deposition morphology of MWCNT in
smallerpore spacesathigher input concentrations.The results
of this study suggest that functionalized MWCNT tend to be
mobile in sandy subsurface environments, and may be trans-
ported to depths greater than 500 cm. Thus, aquifer contami-
nation cannot be excluded. Further work is needed to assess
the mobility of MWCNT in natural porous media, such as
undisturbed soils.
Acknowledgements
This research was performed within the framework of the
‘NanoFlow’-project supported by the German Federal Ministry
of Education and Research. Analysis of bromide in the liquid
samples by Stephan Koppchen is highly appreciated. The
technical assistance of Herbert Philipp is gratefully acknowl-
edged. We also thank Wolfgang Schierenberg for the deter-
mination of the critical coagulation concentration.
r e f e r e n c e s
Akaike, H., 1974. A new look at the statistical model identification.Automatic Control, IEEE Transactions on 19 (6), 716e723.
Bierdel, M., Buchholz, S., Michele, V., Mleczko, L., Rudolf, R.,Voetz, M., Wolf, A., 2007. Industrial production of multiwalledcarbon nanotubes. Physica Status Solidi (B) 244 (11),3939e3943.
Bolster, C.H., Mills, A.L., Hornberger, G.M., Herman, J.S., 1999.Spatial distribution of deposited bacteria following miscibledisplacement experiments in intact cores. Water ResourcesResearch 35 (6), 1797e1807.
Bradford, S.A., Bettahar, M., 2005. Straining, attachment, anddetachment of oocysts in saturated porous media. Journal ofEnvironmental Quality 34 (2), 469e478.
Bradford, S.A., Bettahar, M., 2006. Concentration dependenttransport of colloids in saturated porous media. Journal ofContaminant Hydrology 82 (1e2), 99e117.
Bradford, S.A., Toride, N., 2007. A Stochastic Model for colloidtransport and deposition all rights reserved. No part of thisperiodical may be reproduced or transmitted in any form or byany means, electronic or mechanical, including photocopying,recording, or any information storage and retrieval system,without permission in writing from the publisher. Journal ofEnvironmental Quality 36 (5), 1346e1356.
Bradford, S.A., Yates, S.R., Bettahar, M., Simunek, J., 2002. Physicalfactors affecting the transport and fate of colloids in saturatedporous media. Water Resources Research 38 (12), 12.
Bradford, S.A., Simunek, J., Bettahar, M., van Genuchten, M.T.,Yates, S.R., 2003. Modeling colloid attachment, straining, andexclusion in saturated porous media. Environmental Science& Technology 37 (10), 2242e2250.
Bradford, S.A., Kim, H.N., Haznedaroglu, B.Z., Torkzaban, S.,Walker, S.L., 2009. Coupled factors influencing concentration-dependent colloid transport and retention in saturated porous
media. Environmental Science & Technology 43 (18),6996e7002.
Chatterjee, J., Gupta, S.K., 2009. An agglomeration-based modelfor colloid filtration. Environmental Science & Technology 43(10), 3694e3699.
Chatterjee, J., Abdulkareem, S., Gupta, S.K., 2010. Estimation ofcolloidal deposition from heterogeneous populations. WaterResearch 44 (11), 3365e3374.
Chen, K.L., Elimelech,M., 2006. Aggregation and deposition kineticsof fullerene (C60) nanoparticles. Langmuir 22 (26), 10994.
Chen, K.L., Elimelech, M., 2007. Influence of humic acid on theaggregation kinetics of fullerene (C60) nanoparticles inmonovalent and divalent electrolyte solutions. Journal ofColloid & Interface Science 309 (1), 126e134.
Farre, M., Gajda-Schrantz, K., Kantiani, L., Barcelo, D., 2009.Ecotoxicity and analysis of nanomaterials in the aquaticenvironment. Analytical and Bioanalytical Chemistry 393 (1),81e95.
Gargiulo, G., Bradford, S., �Sim�unek, J., Ustohal, P., Vereecken, H.,Klumpp, E., 2007. Bacteria transport and deposition underunsaturated conditions: the role of the matrix grain size andthe bacteria surface protein. Journal of ContaminantHydrology 92 (3e4), 255e273.
Gargiulo, G., Bradford, S.A., Simunek, J., Ustohal, P.,Vereecken, H., Klumpp, E., 2008. Bacteria transport anddeposition under unsaturated flow conditions: the role ofwater content and bacteria surface hydrophobicity. VadoseZone Journal 7 (2), 406e419.
Gottschalk, F., Sonderer, T., Scholz, R.W., Nowack, B., 2009.Modeled environmental concentrations of engineerednanomaterials (TiO2, ZnO, Ag, CNT, fullerenes) for differentregions. Environmental Science & Technology 43 (24),9216e9222.
Handy, R., von der Kammer, F., Lead, J., Hassellov, M., Owen, R.,Crane, M., 2008. The ecotoxicology and chemistry ofmanufactured nanoparticles. Ecotoxicology 17 (4), 287e314.
Iijima, S., 1991. Helical microtubules of graphitic carbon. Nature354 (6348), 56e58.
Jaisi, D.P., Elimelech, M., 2009. Single-walled carbon nanotubesexhibit limited transport in soil columns. EnvironmentalScience & Technology 43 (24), 9161e9166.
Jaisi, D.P., Saleh, N.B., Blake, R.E., Elimelech, M., 2008. Transport ofsingle-walled carbon nanotubes in porous media: filtrationmechanisms and reversibility. Environmental Science &Technology 42 (22), 8317e8323.
Kim, H., Lee, M., Chae, W., Ezeh, T.D., Walker, S.L., 2011. Coupledeffect of input concentration and solution ionic strength oncolloid transport in saturated porous media. InternationalProceedings of Chemical, Biological, and EnvironmentalEngineering 17, 195e198.
Klaine, S.J., Alvarez, P.J.J., Batley, G.E., Fernandes, T.F.,Handy, R.D., Lyon, D.Y., Mahendra, S., McLaughlin, M.J.,Lead, J.R., 2008. Nanomaterials in the environment: behavior,fate, bioavailability, and effects. Environmental Toxicologyand Chemistry 27 (9), 1825e1851.
Kohler, A.R., Som, C., Helland, A., Gottschalk, F., 2008. Studyingthe potential release of carbon nanotubes throughout theapplication life cycle. Journal of Cleaner Production 16 (8e9),927e937.
Kretzschmar, R., Robarge, W.P., Amoozegar, A., 1995. Influence ofnatural organic matter on colloid transport through saprolite.Water Resources Research 31 (3), 435e445.
Lam, C.W., James, J.T., McCluskey, R., Hunter, R.L., 2004.Pulmonary toxicity of single-wall carbon nanotubes in mice 7and 90 days after intratracheal instillation. ToxicologicalSciences 77 (1), 126e134.
Lam, C.-W., James, J.T., McCluskey, R., Arepalli, S., Hunter, R.L.,2006. A review of carbon nanotube toxicity and assessment of

wat e r r e s e a r c h 4 7 ( 2 0 1 3 ) 9 3 3e9 4 4944
potential occupational and environmental health risks.Critical Reviews in Toxicology 36 (3), 189e217.
Li, X., Scheibe, T.D., Johnson, W.P., 2004. Apparent decreases incolloid deposition rate coefficients with distance of transportunder unfavorable deposition conditions: a generalphenomenon. Environmental Science & Technology 38 (21),5616e5625.
Li, X., Zhang, P., Lin, C.L., Johnson, W.P., 2005. Role ofhydrodynamic drag on microsphere deposition and re-entrainment in porous media under unfavorable conditions.Environmental Science & Technology 39 (11), 4012e4020.
Li, Y., Wang, Y., Pennell, K.D., Abriola, L.M., 2008. Investigation ofthe transport and deposition of fullerene (C60) nanoparticles inquartz sands under varying flow conditions. EnvironmentalScience & Technology 42 (19), 7174e7180.
Liu, X., O’Carroll, D.M., Petersen, E.J., Huang, Q., Anderson, C.L.,2009. Mobility of multiwalled carbon nanotubes in porousmedia. Environmental Science & Technology 43 (21),8153e8158.
Marquardt, D., 1963. An algorithm for least-squares estimation ofnonlinear parameters. Journal of the Society for Industrial andApplied Mathematics 11 (2), 431e441.
Mattison, N.T., O’Carroll, D.M., Kerry Rowe, R., Petersen, E.J., 2011.Impact of porous media grain size on the transport of multi-walled carbon nanotubes. Environmental Science &Technology 45 (22), 9765e9775.
Mauter, M.S., Elimelech, M., 2008. Environmental applications ofcarbon-based nanomaterials. Environmental Science &Technology 42 (16), 5843e5859.
Mueller, N.C., Nowack, B., 2008. Exposure modeling of engineerednanoparticles in the environment. Environmental Science &Technology 42 (12), 4447e4453.
Nagasawa, S., Yudasaka, M., Hirahara, K., Ichihashi, T., Iijima, S.,2000. Effect of oxidation on single-wall carbon nanotubes.Chemical Physics Letters 328 (4e6), 374e380.
Nowack, B., Bucheli, T.D., 2007. Occurrence, behavior and effectsof nanoparticles in the environment. Environmental Pollution150 (1), 5e22.
Pauluhn, J., 2010. Multi-walled carbon nanotubes (Baytubes):approach for derivation of occupational exposure limit.Regulatory Toxicology and Pharmacology: RTP 57 (1), 78e89.
Pumera, M., 2007. Carbon nanotubes contain residual metalcatalyst nanoparticles even after washing with nitric acid atelevated temperature because these metal nanoparticles areSheathed by several graphene sheets. Langmuir 23 (11),6453e6458.
Saleh, N.B., Pfefferle, L.D., Elimelech, M., 2008. Aggregationkinetics of multiwalled carbon nanotubes in aquatic systems:measurements and environmental implications.Environmental Science & Technology 42 (21), 7963e7969.
Shellenberger, K., Logan, B.E., 2001. Effect of molecular scaleroughness of glass beads on colloidal and bacterial deposition.Environmental Science & Technology 36 (2), 184e189.
Sinnott, S.B., 2002. Chemical functionalizationof carbonnanotubes.Journal of Nanoscience and Nanotechnology 2 (2), 113e123.
�Sim�unek, J., van Genuchten, M.T., �Sejna, M., 2008. Developmentand applications of the HYDRUS and STANMOD softwarepackages and related codes. Vadose Zone Journal 7 (2),587e600.
Smith, B., Wepasnick, K., Schrote, K.E., Cho, H.-H., Ball, W.P.,Fairbrother, D.H., 2009. Influence of surface oxides on the
colloidal stability of multi-walled carbon nanotubes:a structure-property relationship. Langmuir 25 (17), 9767e9776.
Sumanasekera, G.U., Chen, G., Takai, K., Joly, J., Kobayashi, N.,Enoki, T., Eklund, P.C., 2010. Charge transfer and weakchemisorption of oxygen molecules in nanoporous carbonconsisting of a disordered network of nanographene sheets.Journal of Physics: Condensed Matter 22 (33), 334208.
Tan, Y., Gannon, J.T., Baveye, P., Alexander, M., 1994. Transport ofbacteria in an aquifer sand: experiments and modelsimulations. Water Resources Research 30 (12), 3243e3252.
Tian, Y., Gao, B., Silvera-Batista, C., Ziegler, K., 2010. Transport ofengineered nanoparticles in saturated porous media. Journalof Nanoparticle Research 12 (7), 2371e2380.
Tian, Y., Gao, B., Wang, Y., Morales, V.L., Carpena, R.M.,Huang, Q., Yang, L., 2012. Deposition and transport offunctionalized carbon nanotubes in water-saturated sandcolumns. Journal of Hazardous Materials 213e214 (0), 265e272.
Tong, M., Johnson, W.P., 2006. Colloid population heterogeneitydrives hyperexponential deviation from classic filtrationtheory. Environmental Science & Technology 41 (2), 493e499.
Tufenkji, N., Elimelech, M., 2004. Deviation from the classicalcolloid filtration theory in the presence of repulsive DLVOinteractions. Langmuir 20 (25), 10818e10828.
Tufenkji, N., Elimelech, M., 2005. Spatial distributions ofcryptosporidium oocysts in porous media: evidence for dualmode deposition. Environmental Science & Technology 39(10), 3620e3629.
Wang, D., Paradelo, M., Bradford, S.A., Peijnenburg, W.J.G.M.,Chu, L., Zhou, D., 2011. Facilitated transport of Cu withhydroxyapatite nanoparticles in saturated sand: effects ofsolution ionic strength and composition. Water Research 45(18), 5905e5915.
Wang, D., Bradford, S.A., Harvey, R.W., Hao, X., Zhou, D., 2012a.Transport of ARS-labeled hydroxyapatite nanoparticles insaturated granular media is influenced by surface chargevariability even in the presence of humic acid. Journal ofHazardous Materials 229e230 (0), 170e176.
Wang, Y., Kim, J.H., Baek, J.B., Miller, G.W., Pennell, K.D., 2012b.Transport behavior of functionalized multi-wall carbonnanotubes in water-saturated quartz sand as a function oftube length. Water Research 46 (14), 4521e4531.
Xia, W., Wang, Y., Bergstraßer, R., Kundu, S., Muhler, M., 2007.Surface characterization of oxygen-functionalized multi-walled carbon nanotubes by high-resolution X-rayphotoelectron spectroscopy and temperature-programmeddesorption. Applied Surface Science 254 (1), 247e250.
Xin, S., Guo, Y.-G., Wan, L.-J., 2012. Nanocarbon networks foradvanced rechargeable lithium batteries. Accounts ofChemical Research 45 (10), 1759e1769.
Yao, K.M., Habibian, M.T., O’Melia, C.R., 1971. Water and wastewater filtration. concepts and applications. EnvironmentalScience & Technology 5 (11), 1105e1112.
Yoon, J.S., Germaine, J.T., Culligan, P.J., 2006. Visualization ofparticle behavior within a porous medium: mechanisms forparticle filtration and retardation during downward transport.Water Resources Research 42 (6), W06417.
Zhang, W., Morales, V.N.L., Cakmak, M.E., Salvucci, A.E.,Geohring, L.D., Hay, A.G., Parlange, J.Y., Steenhuis, T.S., 2010.Colloid transport and retention in unsaturated porous media:effect of colloid input concentration. Environmental Science &Technology 44 (13), 4965e4972.