transport corridors in europe - national spatial strategy
TRANSCRIPT

Transport Corridors in Europe
National Spatial Strategy
Atkins McCarthyBalgriffin House, Balgriffin Road, Dublin 17, Ireland.Tel: 01 846 0000 Fax: 01 8470310.
November 2000

THE COMISSIONAtkins McCarthy were appointed by the Spatial Planning Unit of the Department of Environment and Local Government on 27th June 2000 to undertake research into Transport Corridors in Europe within the context of the National Spatial Strategy.
THE CONSULTANTSAtkins McCarthy is part of the WS Atkins group. To undertake this study we have drawn together a team that combines the local knowledge of staff selected from our Dublin, Cork and Belfast offices, together with specialist expertise from our network of offices. In addition, to complement our core WS Atkins team we have drawn upon the services of specialist advisors MDS Transmodal and Tourism and Leisure Partners.
Table of Contents
EXECUTIVE SUMMARY .................................................................... 5
1 INTRODUCTION . . . . . . . . . . . . . . . . . . . . . . . . . . . . . . . . . . . . 17
STUDY CONTEXT . . . . . . . . . . . . . . . . . . . . . . . . . . . . . . . . . . . . . . . . . . . . . . 17AIMS AND OBJECTIVES . . . . . . . . . . . . . . . . . . . . . . . . . . . . . . . . . . . . . . . . . 17STUDY APPROACH . . . . . . . . . . . . . . . . . . . . . . . . . . . . . . . . . . . . . . . . . . . . . 18REPORT STRUCTURE . . . . . . . . . . . . . . . . . . . . . . . . . . . . . . . . . . . . . . . . . . . 19
2 IRELAND AND THE EU . . . . . . . . . . . . . . . . . . . . . . . . . . . . . . 21
ECONOMY . . . . . . . . . . . . . . . . . . . . . . . . . . . . . . . . . . . . . . . . . . . . . . . . . . . . 21IRELAND ACCESS POINTS TO EUROPE . . . . . . . . . . . . . . . . . . . . . . . . . . 23TRENDS IN MOVEMENTS IRELAND- EU . . . . . . . . . . . . . . . . . . . . . . . . . . 24FREIGHT AND PASSENGER TRENDS . . . . . . . . . . . . . . . . . . . . . . . . . . . . . 34FREIGHT AND PASSENGER FORECASTS . . . . . . . . . . . . . . . . . . . . . . . . . . 38
3 TRANSPORTATION AND INFRASTRUCTURE – CAPACITY IMPLICATIONS . . . . . . . . . . . . . . . . . . . . . . . . . . . . . . . . . . . . . 39
NATIONAL ACCESS POINTS . . . . . . . . . . . . . . . . . . . . . . . . . . . . . . . . . . . . 39PLANNED LANDSIDE ACCESS IMPROVEMENTS . . . . . . . . . . . . . . . . . . . 43AIRPORT CAPACITY . . . . . . . . . . . . . . . . . . . . . . . . . . . . . . . . . . . . . . . . . . . . 46PORT CAPACITY ISSUES . . . . . . . . . . . . . . . . . . . . . . . . . . . . . . . . . . . . . . . . 47AIRPORT CAPACITY ISSUES . . . . . . . . . . . . . . . . . . . . . . . . . . . . . . . . . . . . . 50NATIONAL PORT CAPACITY ISSUES . . . . . . . . . . . . . . . . . . . . . . . . . . . . . 50NATIONAL AIR CAPACITY ISSUES . . . . . . . . . . . . . . . . . . . . . . . . . . . . . . . 51INTERNATIONAL BOTTLENECKS . . . . . . . . . . . . . . . . . . . . . . . . . . . . . . . . 51INTERNATIONAL ISSUES . . . . . . . . . . . . . . . . . . . . . . . . . . . . . . . . . . . . . . . . 53SUSTAINABILITY . . . . . . . . . . . . . . . . . . . . . . . . . . . . . . . . . . . . . . . . . . . . . . . . 54
4 EUROPEAN TRANSPORTATION INVESTMENT – IMPLICATIONS FOR IRELAND . . . . . . . . . . . . . . . . . . . . . . . . 55
THE EUROPEAN TRANSPORT DIMENSION . . . . . . . . . . . . . . . . . . . . . . . 55EUROPEAN TRANSPORT POLICY . . . . . . . . . . . . . . . . . . . . . . . . . . . . . . . . 55NATIONAL TRANSPORT INFRASTRUCTURE AND INTERNATIONAL COMPETITIVENESS . . . . . . . . . . . . . . . . . . . . . . . . . . . . . . . . . . . . . . . . . . . . . 61TRENDS IN SPATIAL-TIME INTERRELATIONSHIPS . . . . . . . . . . . . . . . . . 64
5 IRELAND AND THE EU – TRENDS AND ISSUES FOR SECTORAL POLICY . . . . . . . . . . . . . . . . . . . . . . . . . . . . . . . . . 75
ISSUES FOR SECTORAL POLICY . . . . . . . . . . . . . . . . . . . . . . . . . . . . . . . . . . 79
3


Transport Corridors in Europe
EXECUTIVE SUMMARY
1 IntroductionThis Transport Corridors in Europe Study forms part of Stage Two of the National Spatial Strategy. The key objectives of the study include the following:
• To review the trends in transportation movements across all key corridors between Ireland and Europe;
• To derive forecasts of the future demand for transportation;
• Identify existing and potential bottlenecks in terms of movement between Ireland and Europe;
• To assess the impacts of both domestic and EU investment programmes in terms of Ireland’s competitive position;
• To identify the needs of the various sectors within business and industry;
• To suggest initiatives to address any capacity issues identified; and
• To address the future role of Regional Airports.
In preparing this report we have used substantial data sources including, freight and passenger movement data from Ports and sea carriers, Aer Rianta passenger and freight data, passenger flows from air carriers, key economic data from CSO and ESRI.
Regional Airports have been addressed in this study from a European perspective, the future role of Regional Airports in an Irish context have been covered in Goodbody’s report entitled “Transport and Regional Development”.
2 Ireland and the E.U. – Transport InterrelationshipsEconomy - The Irish economy has experienced significant economic growth in recent years. GDP and employment levels have grown at more than twice the EU average. It has been a primary concern of Government to ensure that the current economic trends are not undermined by a failure to invest in the relevant infrastructure at the appropriate time.
Employment Base - Recent economic development has impacted upon the nature of the employment base. In contrast to the steady growth in the traditional manufacturing sectors and significant increases in productivity, a key development has been the increased levels of employment in information technology (IT) and internationally traded services (ITS). These sectors which
5
include financial services and software development, have different transport needs to more traditional economic sectors.
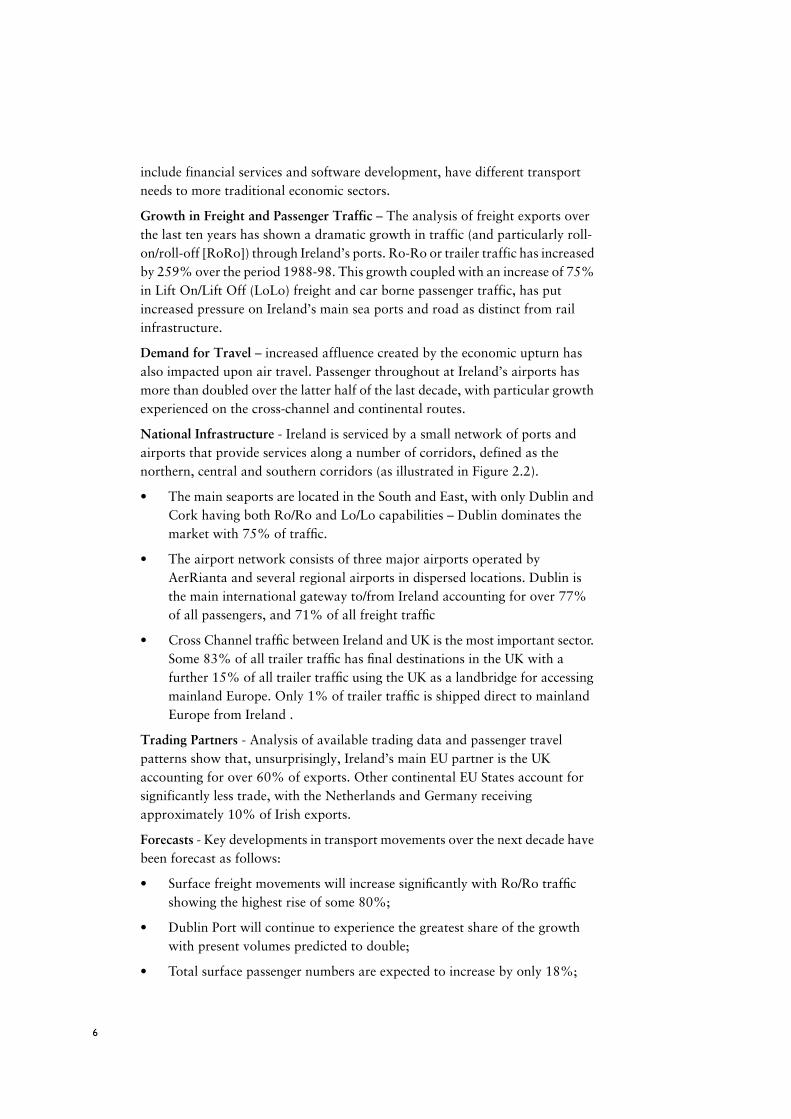
Growth in Freight and Passenger Traffic – The analysis of freight exports over the last ten years has shown a dramatic growth in traffic (and particularly roll-on/roll-off [RoRo]) through Ireland’s ports. Ro-Ro or trailer traffic has increased by 259% over the period 1988-98. This growth coupled with an increase of 75% in Lift On/Lift Off (LoLo) freight and car borne passenger traffic, has put increased pressure on Ireland’s main sea ports and road as distinct from rail infrastructure.
Demand for Travel – increased affluence created by the economic upturn has also impacted upon air travel. Passenger throughout at Ireland’s airports has more than doubled over the latter half of the last decade, with particular growth experienced on the cross-channel and continental routes.
National Infrastructure - Ireland is serviced by a small network of ports and airports that provide services along a number of corridors, defined as the northern, central and southern corridors (as illustrated in Figure 2.2).
• The main seaports are located in the South and East, with only Dublin and Cork having both Ro/Ro and Lo/Lo capabilities – Dublin dominates the market with 75% of traffic.
• The airport network consists of three major airports operated by AerRianta and several regional airports in dispersed locations. Dublin is the main international gateway to/from Ireland accounting for over 77% of all passengers, and 71% of all freight traffic
• Cross Channel traffic between Ireland and UK is the most important sector. Some 83% of all trailer traffic has final destinations in the UK with a further 15% of all trailer traffic using the UK as a landbridge for accessing mainland Europe. Only 1% of trailer traffic is shipped direct to mainland Europe from Ireland .
Trading Partners - Analysis of available trading data and passenger travel patterns show that, unsurprisingly, Ireland’s main EU partner is the UK accounting for over 60% of exports. Other continental EU States account for significantly less trade, with the Netherlands and Germany receiving approximately 10% of Irish exports.
Forecasts - Key developments in transport movements over the next decade have been forecast as follows:
• Surface freight movements will increase significantly with Ro/Ro traffic showing the highest rise of some 80%;
• Dublin Port will continue to experience the greatest share of the growth with present volumes predicted to double;
• Total surface passenger numbers are expected to increase by only 18%;
6

• Air passenger numbers are forecast to double, with Dublin Airport passenger numbers reaching over 25 million per annum; and
• Major growth of over 150% is expected in air freight;
3 Transport and Infrastructure - Capacity InteractionsIn addressing the issue of interactions between capacity and the forecast volume and patterns of future trade and passenger movement, the following matters have been considered.
National Landside Access - This study has identified a number of key issues for landside access to Ireland’s ports and airports:
• Travel time fluctuations experienced by road hauliers accessing Dublin Port due to traffic congestion – the “reliability issue”;
• Peak period traffic congestion in the vicinity of Dublin Airport;
• Low levels of public transport provision to the main ports and airports;
• A lack of rail freight facilities at some major ports and the underutilisation of such facilities at most ports; and
• Poor accessibility of regional airports.
Planned National Landside Improvements - There are a number of infrastructure improvements planned to alleviate these landside access constraints, including:
• Significant investment in road infrastructure nationwide as part of the implementation of the National Development Plan, including the Dublin Port Access Tunnel. This will significantly reduce journey times within Ireland; and
• Planned improvements to public transport within Dublin, to relieve congestion, and to Dublin Airport as set out in the DTO Strategy.2000-2016 “A Platform for Change”.
Implications from Landside Improvements - The main issues arising from landside access are:
• The Dublin//Port Access Tunnel, which is expected to be open by 2004, will reduce journey times to/from the port by 30 minutes avoiding congested built up areas and allowing operators to avoid unforeseen delays;
• Access to Dublin Port, particularly to the south-east would also be augmented by the suggested “Eastern Bypass”. However, this scheme has not been approved, nor can its implementation be reliably predicted.
• Delays in the implementation of major infrastructure should be avoided.
7

Port Capacity Issues - There are significant issues evolving from the forecast levels of demand for transport and the capacities at Ireland’s ports:
• Dublin will be affected most, with demand for Ro/Ro traffic exceeding capacity by 2007, and demand for Lo/Lo traffic exceeding capacity soon after 2010;
• Cork is expected to have capacity problems for Lo/Lo traffic by 2004, potential solutions have been proposed by the Port of Cork’s development plan study which is nearing completion;
• Spare capacity for Ro/Ro traffic to operate from Cork, or Rosslare could potentially accommodate overflow traffic from Dublin up to 2010;
• There will continue to be spare capacity for Lo/Lo traffic at Waterford and Drogheda, theoretically capable of accommodating any transfer from Dublin or Cork up until 2010. However carriers will remain keen to operate via Dublin; and
• Levels of car traffic are expected to increase as sea carriers concentrate on accommodating car based passengers.
Airport Capacity Issues - The main issues arising for airport capacity are as follows:
• Dublin has been operating in excess of capacity over the past three years;
• Planned capacity improvements at Dublin will be insufficient to cater for forecast demand in 2010;
• Cork and Shannon can accommodate increased demand levels up to 2010; and
• Even with a significant transfer of passengers from Dublin to Cork and Shannon by 2010, national demand will exceed capacity by 4 million passengers/annum.
National Issues - Given the balance between capacity and demand there is a need to consider:
• The potential for transfer of Ro/Ro traffic from Dublin to Rosslare and Cork, and Lo/Lo traffic from Dublin and Cork to Drogheda and Waterford;
• However carrier strategies which prefer use of Dublin are highly inelastic, so transfer will not occur easily;
• How to cater for freight movement beyond 2010 when capacity will meet demand nationally, even if these transfers are achieved; and
• How best to accommodate unsatisfied demand for air travel.
International Bottlenecks - There are a number of international capacity implications that have the potential to adversely effect Ireland’s trade abroad –
8
largely by causing unpredictable delays and eroding reliability in estimating journey times:
• As the UK landbridge is the most important corridor to the EU, bottlenecks here have the most potential to affect the efficacy of Ireland-EU movements;
• In the UK delays are common on the national motorway network at major urban areas, where long distance traffic mixes with commuter and local traffic such as the M6/M42 around Birmingham, the M25 around London and on the routes to the channel ports in South East England Access arrangement to the Humber Ports – there is limited capacity available at peak times for HGV traffic travelling to the ports. Congestion on the M62 cross Pennine motorway due to this route’s role as a major link between the conurbations of Manchester and Leeds. There is greater potential for rail freight on this route- although this may be of limited value to Irish traffic.
• Some key port access routes have significant peak periods reflecting ferry schedules;
• Whilst there are limited bottlenecks within major urban areas across the continent, particularly during the peaks, the inter urban links are not severely congested; and
• The major role which Heathrow plays as an international hub for Ireland brings its own difficulties as the scale of demand for movement through Heathrow creates landside, terminal and airside congestion.
International Issues – the main issues concerning transport matters beyond Ireland’s immediate control include:
• A key issue is the ability of Irish traffic to efficiently and reliably reach destinations within UK, its main trading partner;
• There is potential to utilise the Cross Pennine axis to the Humber ports for traffic to Europe thus minimising the impacts of congestion in UK – although this route does experience road capacity problems on the M62 which provides the key link between the conurbations of Manchester and Leeds, and there are some capacity problems in directly accessing the Humber ports;
• British Ports are expanding to reflect increased traffic from Dublin;
• Improvements to the UK road network are planned including the Birmingham Northern Relief Road and additional capacity improvements on the M25. However some planned improvements have been affected by a policy shift away from road building. Many proposed improvements are now subject to strategic government review;
9
• Planned improvements to Heathrow may reduce congestion concerns landside and airside.
The benefits of such good links to this international hub should also be recognised; and
• There may be scope to operate via an alternative EU hub such as Amsterdam although carrier policies will have a major influence beyond the immediate control of the Irish Government.
Sustainability – This is a key issue emerging in transport policy, with implications for transport to Europe including:
• There will be conflict with emerging sustainability policies due to the predicted increase in road freight volumes, increasing usage of air transport for passengers and freight and the numbers of car borne sea passengers;
• Although Ro/Ro traffic is seen as less sustainable than Lo/Lo, it is Ro/Ro traffic that is increasing at a faster rate due to time and cost savings, flexibility and the nature of the goods transported. Ro/Ro traffic is poorly suited to rail transit in Ireland due to infrastructure, cost of investment and flexibility barriers;
• EU policy is based on increased use of more sustainable energy efficient modes such as rail.
However applying this policy to Ireland is difficult given low volumes of freight, the dispersed settlement pattern, relative cost and time inefficiencies, compared to road; and
• The challenge in sustainability will be how to “decouple” increased demand for movement from increased energy demand and in turn, how to achieve transfer to environmentally sustainable modes such as rail. In the Irish context, rail is tied to LoLo, which is not growing as fast as RoRo and there are some barriers to effective rail-ship movement such as at Dublin Port.
4 European Transportation Investment IssuesEuropean Transport Dimension – Ireland is on the periphery of Europe and is the last link in the transport chain to and from Europe. In this regard, it is important to recall that Irish traffic represents only a small proportion of the total traffic passing through European Ports, airports and on the road and rail networks of the continental mainland.
EU Transport Policy - is now aimed at increasingly encouraging intermodal transport of freight, making increased use of rail for long haul journeys with a shorter road based distribution trip at each end. This has implications for Irish traffic including:
10

• Ireland has relatively low utilisation of rail freight, due to the volume and nature of the goods carried and the nature of the rail network;
• Irish traffic may benefit from policies seeking to make best use of existing road networks and reductions in congestion in urban areas;
• Irish traffic to the UK and operating via the UK landbridge may be disadvantaged if restraint measures are implemented such as congestion charging, and also due measures such as the recently proposed tax on foreign operated vehicles using the UK road network;
• Only two of the priority projects within the Trans European Network are of direct value to Irish traffic, and only one of these is road based; and
• Intermodal developments in policy and practical terms will require monitoring to ensure an effective balance for Ireland in terms of sustainability and competitive is assured.
Trends in Spatial-Time interrelationships – the developing pattern of transport improvements throughout the EU will have the following effects:
• Ireland has traditionally been compared to other peripheral regions such as Greece, and Central Scandinavia in accessing key markets in central Europe;
• The Study has shown that, at present, transporting goods to central Europe by road from various regional locations in Ireland is cheaper (including cost assumptions for journey times etc) than transporting the same goods from Lisbon or Helsinki;
• The development of the priority TENs projects over the next ten years will largely improve the rail infrastructure of central Europe bringing these States closer together in terms of journey time, and improving access from Eastern european States to western and Central European markets;
• Journey times within Britain will also be improved by road improvements specifically the Birmingham Northern Relief Road, increased lane provision on the M25, these improvements will also benefits traffic utilising the UK landbridge;
• Given the forecast capacity problems on traffic from Dublin Port, this pressure may increase the time taken in loading/unloading sea traffic both Ro/Ro and Lo/Lo;
• Within Ireland journey time will reduce due to planned infrastructure improvements in the NDP and TENs; and
• Despite some time savings, in reality, these will have little impact on operators whose unit travel time is measured in days i.e. Day 1 Ireland, Day 2 GB, Day 3 Continental Europe basis. Benefits through logistics practices and improved reliability of travel will probably be concentrated
11

in the areas of logistical efficacy and, reliability – critical in a competitive trade environment.
5 Ireland in Europe – Trends and Issues for Sectoral PolicyThe main trends and implications for sectoral policy include:
• Manufacturing and internationally traded services are emerging as key employment sectors in Ireland which in turn depend on effective international communication and transport networks.
• The differing transport needs of these sectors will have implications for land-use planning policies.
• The alleviation of congestion in urban areas in the UK and Continental Europe will benefit Irish manufacturers exporting/importing via the UK landbridge.
• If future economic development policy continues to be geared towards attracting internationally traded services to operate in Ireland as a European base, surface transport trends will have little effect. These firms locate in Ireland for other reasons, communications, labour skills, power, although internal transport improvement may increase the catchment areas for available labour pools.
• As Ireland’s economy becomes more aligned with the rest of Europe, Ireland will have to be competitive in all factors affecting business location decisions, including transport infrastructure.
• Air traffic will be important and a structured approach to provision of air services will be important i.e. Ireland will continue to have one national hub in Dublin, three international standard city-region type airports (Shannon, Cork, Belfast) and regional airports performing a number of dual roles including maintaining accessibility to outlying areas, improving perceived accessibility for inward investors, providing facilities for existing corporate bodies in the regions, maintaining close links with the capital, and serving the immediate hinterland’s needs.
6 Key Implications for Policy
Key Findings
The main findings of the study are :
• Dublin has been strongly growing as the international; access hub for Ireland and will continue to act as the key air and sea gateway to Ireland for the foreseeable future;
12

• Capacity problems are forecast at Dublin and Cork ports over the next ten years
• Dublin airport will not have sufficient capacity to cater for forecast demand levels after 2010; and
• The NDP programme of landside improvements should be implemented without delay.
Review of Ireland’s Competitiveness
The key implications for future competitiveness include:
• Ireland’s competitive position will be determined by a range of measures of which efficient and reliable transport corridors to and from Europe is one;
• The current problems experienced by Ireland’s transportation infrastructure are indicative of the level of economic success;
• The rapid growth in the economy has meant that demand for travel has been generated rapidly over a short period whereas the necessary infrastructure to alleviate congestion requires a longer period for implementation;
• Ireland compares well with other EU States in accessing its key markets;
• The UK is expected to maintain its current position as the dominant trading partner for Ireland;
• UK transport policies will affect all external freight operators transporting goods to/from the UK. However given the importance of the UK for Irish exports/imports, and as a landbridge for access to Continental Europe, a greater percentage of Ireland’s trade will be effected by these changes than other EU States. Irish producers and hauliers may become uncompetitive when compared with UK competitors;
• The key employment growth area for Ireland in the future is in Internationally Traded Services (ITS) which have different physical transport needs compared to traditional manufacturing with little demand for the transport of bulk goods;
• Growth in IT/ITS sectors will translate into growth in demand for air freight and effective air access to Ireland and the regions;
• A measure of the importance of transport in countries with the best performing economies is the fact that on average these countries spend almost 2.7 times as much as Ireland on such infrastructure;
• Central EU states will benefit from planned improvements to roads and rail infrastructure, however, this will have minimal effect on Ireland’s competitive position given that most trade is with the UK and also that the growth of Internationally Traded Services is not as sensitive to transport costs; and
13

• Irish Freight will continue to have a preference for Ro/Ro given the cost efficiencies and flexibility offered by this mode
Implications for Policy
The main implications for the development of future policy include impacts on domestic investment priorities, dependencies on UK and EU corridors in a trans-boundary sense and will necessitate policy responses within the NSS.
National Spatial Strategy
Implications for the preparation of the NSS include:
• The aim of redistributing at least half of the predicted 20 year population increase for the state of 1 million, to the regions would assist in relieving the pressure from Dublin’s ports and airport infrastructure. Problems will be encountered at Dublin over the next ten years, and there will be excess demand for air travel nationally. Carrier economies will also dictate that the market will continue to strive for operations via Dublin;
• Regional “Gateways” will require good connections to Dublin as they are unlikely to develop as international transport hubs between Ireland and the UK/EU but such centres will play a key regional transportation role in terms of local access and alternative corridors;
• Regional airports will continue to play an important role, particularly in high value sectors where there is increasing use of executive jets for key personnel regional airports will be important, but there is a need for a structured approach to Regional Airports policy;
• Gateways should make best use of regional port and airport facilities and maintain strong connections with the Dublin and European Hubs; and
• Ireland has only limited potential to significantly increase use of rail freight, to take advantages of the changes in EU/UK transport policy and programmes. Increased use of freight would require a major programme of expansion of intermodal rail freight facilities at ports and associated investment, and possibly the development of a grant/subsidy system.
Domestic Investment
The study shows that there will be implications for domestic investment programmes including:
• Investment is required to increase national air passenger handling capacities, particularly where demand is concentrated i.e Dublin;
• Investment is needed at Dublin Port for Ro/Ro capacity and at Cork for Lo/Lo capacity;
14

• There is limited potential for transfer to other ports such as Ro/Ro traffic to/from Rosslare however operator’s demand for the use of Dublin Port is inelastic, largely due to economies of scale;
• Fiscal measures will be required to make rail a more attractive option for the transportation of goods in Ireland this raises the question as to whether a freight facilities grants as operate in the UK, could be applied to Ireland; and
• In order to achieve maximum benefits for surface transport of goods in Ireland in the short term, consideration should be given to placing increased emphasis on relieving existing pinch-points, such as town centres and poor junctions in the NDP infrastructure improvement programme.
EU Investment
The main implications are as follows:
• Irish transport needs should be highlighted through the European Commission and the Council of the Isles with the UK;
• Irish transport will largely be reactive to changes in European and Global trade patterns and infrastructure improvements – opportunities to benefit from investments elsewhere should be tracked and optimised;
• Improvements in the UK network would have the greatest impact given Ireland’s existing and likely trade patterns;
• The continuing importance of road transport to Ireland’s trade (and its difficulties in transferring to rail based systems) should be highlighted;
• Proposals for unilateral improvements to ports and airports should be avoided, enhancements should be linked to an overall “spatial strategy for movement” providing for effective transport between Ireland and all its trading partners;
• There is limited potential for a more innovative approach to freight movement by rail in Ireland given the pattern of development, the volumes and types of goods, the requirements for rail operators to justify fully all costs and benefits for establishing a service; and
• Ireland’s competitive position could be adversely affected by emerging measures to assist UK based hauliers such as the recently proposed tax on foreign carriers operating via UK roads.
15

16
1 INTRODUCTION
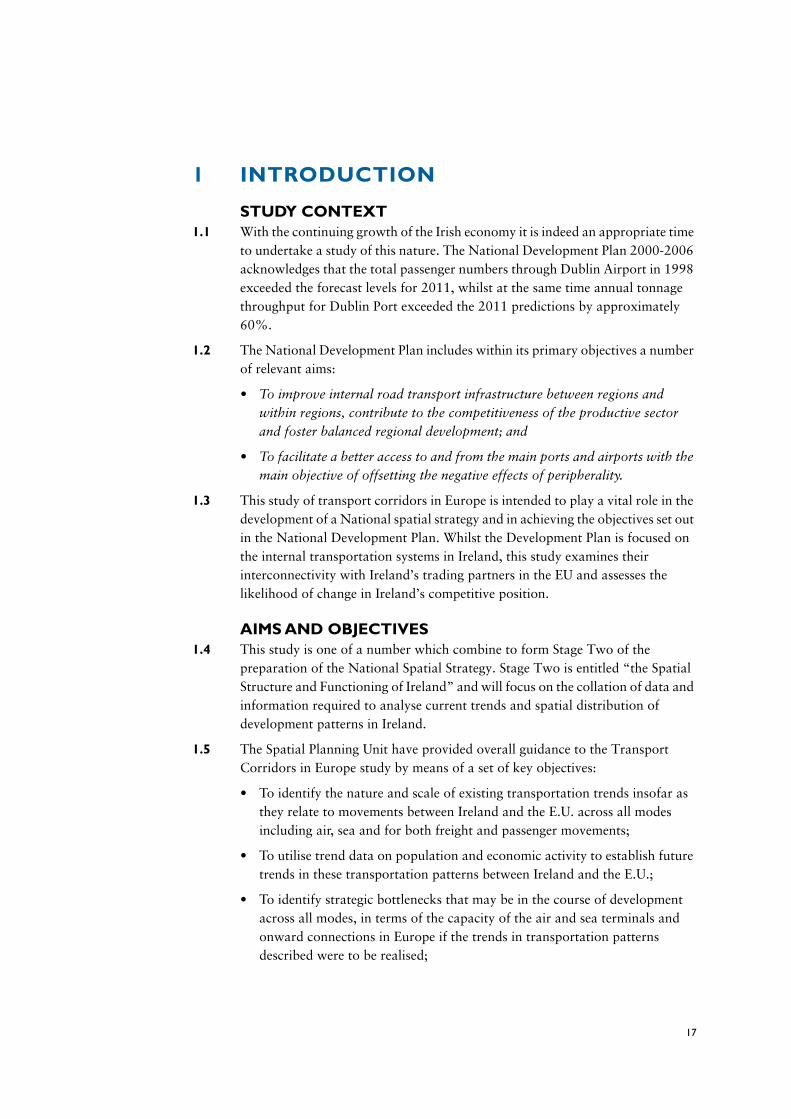
STUDY CONTEXT1.1 With the continuing growth of the Irish economy it is indeed an appropriate time
to undertake a study of this nature. The National Development Plan 2000-2006 acknowledges that the total passenger numbers through Dublin Airport in 1998 exceeded the forecast levels for 2011, whilst at the same time annual tonnage throughput for Dublin Port exceeded the 2011 predictions by approximately 60%.
1.2 The National Development Plan includes within its primary objectives a number of relevant aims:
• To improve internal road transport infrastructure between regions and within regions, contribute to the competitiveness of the productive sector and foster balanced regional development; and
• To facilitate a better access to and from the main ports and airports with the main objective of offsetting the negative effects of peripherality.
1.3 This study of transport corridors in Europe is intended to play a vital role in the development of a National spatial strategy and in achieving the objectives set out in the National Development Plan. Whilst the Development Plan is focused on the internal transportation systems in Ireland, this study examines their interconnectivity with Ireland’s trading partners in the EU and assesses the likelihood of change in Ireland’s competitive position.
AIMS AND OBJECTIVES1.4 This study is one of a number which combine to form Stage Two of the
preparation of the National Spatial Strategy. Stage Two is entitled “the Spatial Structure and Functioning of Ireland” and will focus on the collation of data and information required to analyse current trends and spatial distribution of development patterns in Ireland.
1.5 The Spatial Planning Unit have provided overall guidance to the Transport Corridors in Europe study by means of a set of key objectives:
• To identify the nature and scale of existing transportation trends insofar as they relate to movements between Ireland and the E.U. across all modes including air, sea and for both freight and passenger movements;
• To utilise trend data on population and economic activity to establish future trends in these transportation patterns between Ireland and the E.U.;
• To identify strategic bottlenecks that may be in the course of development across all modes, in terms of the capacity of the air and sea terminals and onward connections in Europe if the trends in transportation patterns described were to be realised;
17
• To chart recent developments within the European transportation network in terms of roads, deep sea shipping, rail and air transport particularly and to identify the relative position of Ireland in terms of accessibility in comparison with main competitors. In particular it will be necessary to identify if Ireland’s accessibility, taking into account infrastructure planned as part of the National Development Plan 2000-2006 is improving or worsening in this context and if the latter, to suggest measures to address this;
• To identify within these tasks, the relative accessibility needs of various sectors eg, tourism, manufacturing, food production and high value/low bulk activities such as the information technology area and strategic enhancements that may be necessary to cater for the specific needs of various sectors;
• To specifically address the issue of penetration of air services within the island of Ireland in terms of regional airports and the capacity to develop better linkages between the regions and international air services. This would include examining the potential hub and spoke approaches which coupled to enhanced public and private transportation linkages to and from regional destinations would ensure better parity of access for the regions.
1.6 In summary the key objectives of the study have been to:
• Review the trends in transportation movements across all key corridors between Ireland and Europe;
• Derive forecasts of the future demand for transportation;
• Identify existing and potential bottlenecks across the Ireland/Europe transport corridors;
• Assess the impacts of both domestic and EU investment programmes;
• Identify the needs of the various sectors within business and industry; and
• Suggest initiatives to address any capacity issues identified.
1.7 In preparing this report we have used substantial data sources including, freight and passenger movement data from Ports and sea carriers, Aer Rianta passenger and freight data, passenger flows from air carriers, key economic data from CSO and ESRI. A full bibliography detailing all reference sources is provided at the end of this document.
STUDY APPROACH1.8 The key elements of the study approach were the collection and interpretation of
relevant data and the subsequent analysis and forecasting of future conditions.
18

REPORT STRUCTURE1.9 This introductory section is followed by an overview of Ireland’s European
transport interrelationships, reflecting the recent economic growth and changes in the employment base. This section also identifies the main trends in demand for surface and air passenger and freight transport, and provides forecasts for the next ten years for these elements. The next chapter provides an assessment of the capacity implications of the forecast demand levels, and identifies international bottlenecks. The effects of European transport investment and the implications for Ireland are covered in the next chapter, followed by a section detailing the implications for sectoral policy arising from transport patterns. The final chapter sets out the key implications for policy. A number of appendices are also provided covering additional detail on transport trends and forecasts together with an overview of recent and proposed landside access improvements, UK landbridge issues and Trans European Networks.
19

20

2 IRELAND AND THE EU
ECONOMY2.1 In recent years Ireland has experienced significant economic growth due to a
number of advantageously aligned economic factors. Growth rates in employment and output have outstripped those of virtually all other developed countries. As illustrated in Figure 2.1, between 1994 and 1998 Ireland’s GDP average annual growth was 8.5% compared to and E.U. average of 2.5%, and the level of exports of goods and services grew by an average of 16.7% compared to an E.U. average of 7.5%.
2.2 The growth has been attributed to a number of factors including:
• A young, growing and better educated workforce;
• Favourable demographics
• Fiscal reform and a lower interest rate environment;
• Stability, afforded by successive national partnership agreements;
• A relatively benign external environment; and
• A success rate in attracting, maintaining and developing, high technology high productivity Foreign Direct Investment projects in manufacturing and traded services. This has been combined with Irish owned business in these sectors which is increasingly trade orientated and competitive.
2.3 Whilst the level of economic progress is welcomed it does raise a number of concerns that will need to be addressed if the economy is to continue to grow, even at a reduced rate:
• There is a limit to the number of new jobs that can be created and labour will no longer be as plentiful or as cheap as in the recent past. Labour market pressures may make it more difficult for employers to fill positions;
• The potential shortage of labour may necessitate increased productivity per person to continue economic growth;
• Infrastructure development has not kept pace with recent economic growth as evidenced by urban traffic problems and house price inflation; and
• Uneven spread of regional and urban development.
21

2.4 The pace of change in Ireland has resulted in increasing divergence between the demand for transport and the provision of additional capacity. Increasing pressure on the transport network is symptomatic of the success of the economy. Ireland is not alone in experiencing such pressure on its transport infrastructure, many European economies have had similar experiences in the past, and have substantially increased their transport capacity to address the issue. There is however an inevitable gap in the short term between the rapid increase in demand for transport and the time taken to implement transportation improvements.
2.5 The most recent Medium Term Review (MTR) published by the Economic and Social Research Institute (ESRI) covers the period to 2005. It presents a comprehensive forecast for the Irish economy, highlighting a number of strategic issues. The MTR suggests that the economy is now fully “wound up” and moving very fast but that over the next decade it is likely to unwind gradually and eventually return to the EU average rate of growth after 2010.
2.6 Ireland is a very open economy with trade playing a major role in the recent success of the economy. The country is therefore affected by factors and trends that affect global trade.
22
2.7 Recent economic development has impacted upon the nature of the employment base. In contrast to the steady growth in the traditional manufacturing sectors and significant increases in productivity, a key development has been the increased levels of employment in internationally traded services. This sector which includes financial services and software development, has very different transport needs to those of the traditional industries.
2.8 The Irish economy has experienced significant economic growth in recent years. It is a primary concern of Government to ensure that the current economic trends are not undermined by a failure to invest in the relevant infrastructure at the appropriate time.
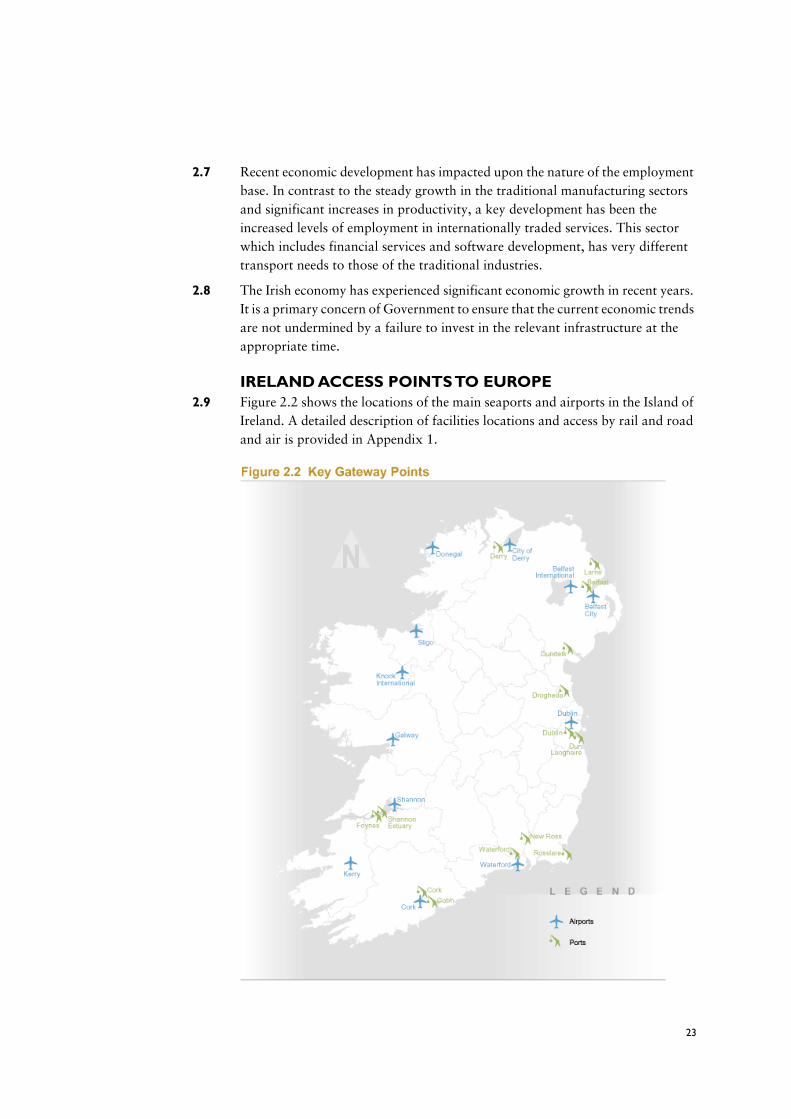
IRELAND ACCESS POINTS TO EUROPE2.9 Figure 2.2 shows the locations of the main seaports and airports in the Island of
Ireland. A detailed description of facilities locations and access by rail and road and air is provided in Appendix 1.
23

2.10 In terms of trade volumes and the scale of facilities the main port in the Republic of Ireland is Dublin. Other major ports are located at Cork, Rosslare, Dun Laoghaire, Waterford, and Drogheda. A network of smaller ports in Ireland serve small catchments and local trading requirements. These include, Shannon Estuary, Foynes, and New Ross. Freight traffic operates via Roll On/Roll Off (Ro/Ro) on freight only and passenger/freight ferry operations, largely to the UK with some service direct to Continental Europe. Freight also operates by Lift On/Lift Off, basically the direct shipment of more bulky/less time sensitive goods on cargo ships. Passenger services are provided by the Ro/Ro services to the UK with a smaller number of services direct to Continental Europe.
2.11 In the Republic of Ireland the main airports including Dublin, Shannon and Cork are operated by Aer Rianta. Dublin acts as the main gateway to Ireland from overseas and provides the main connections with international locations including a network of links with the UK and Continental Europe. Ireland also benefits from a substantial network of regional airports which include – Donegal (Carrickfinn), Knock (Connaught), Waterford, Kerry, Galway, and Sligo.
TRENDS IN MOVEMENTS IRELAND- EU2.12 Ireland’s ports and airports provide a complex network of services linking
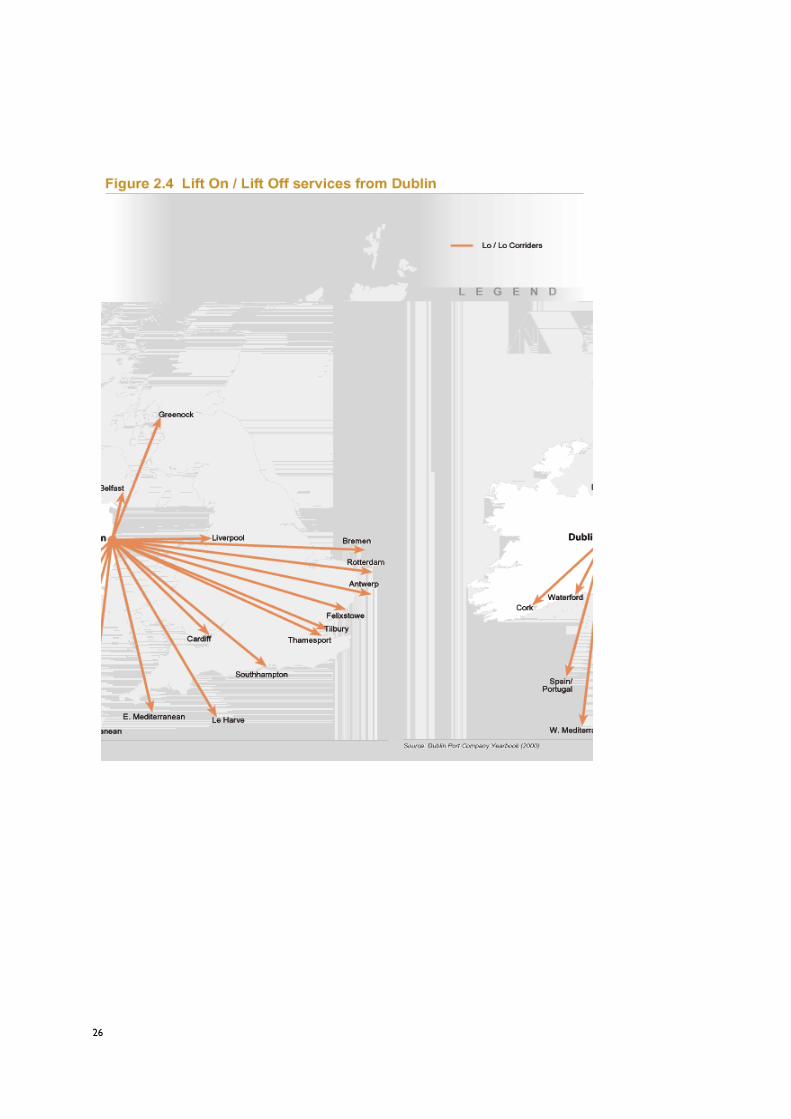
domestic and international locations. Figure 2.3 illustrates the range of services available by Ro/Ro ferries from Irish Ports, and shows the extent of the network linking to the UK. Dublin Port provides an extensive range of service by Lo/Lo cargo shipping linking to European destinations as shown in Figure 2.4.
2.13 Figure 2.5 shows the range of domestic and international destinations serviced by flights from the regional and international airports in Ireland. Dublin operates as the main International Hub, with Cork and Shannon providing additional international services, and the regional airports providing local services. Regional airport flights utilise Dublin as the major air hub. Connaught/Knock airport offers services to London Stansted, Manchester and Birmingham, Kerry provide services to London Stansted and Luton, Waterford has services to London Stansted and Manchester, Donegal has services to Glasgow and Prestwick, and Galway has a scheduled service to Manchester. Belfast International Airport offers a limited range of services to Europe and a shuttle service to the UK hubs as well as services to UK regions. Belfast City airport has concentrated on links to the UK main hubs and limited services to UK regions. City of Derry Airport provides a link for residents of the North West with Dublin, some UK regions and London Stansted.
2.14 Clearly Dublin is the main service provider with a significantly greater range of links to Europe than Cork or Shannon. There is however, a limited penetration of European services beyond the Dublin area. European links are available only from Dublin, Cork, and Shannon, although all the major European destinations are accessible. Regional airports largely use Dublin as a connecting hub for European links although there are a limited number of direct flights to a range of UK destinations range of UK destinations.
24

25
26
2.15 Figure 2.6 which presents volume of goods imported and exported to Ireland indicates that Ireland’s main trading partner is the UK. This figure shows that when the value of goods imported/exported is considered, the dominance of the UK is reduced although it remains the main trading partner.
2.16 The movement of goods and passengers on surface routes from Ireland to and through the UK, have traditionally utilised Roll on/Roll off services focused on four main corridors, as illustrated in Figure 2.7.
2.17 Northern – this corridor concentrates on the shipment of goods and passenger via ports in northeast Northern Ireland, including Larne, and Belfast to destinations in South Western Scotland. This corridor has the shortest crossing of the Irish Sea giving direct access to Scotland, the rest of the UK, and the main road networks on the west and east costs of England to the South East and the Channel ports. This route also gives access to the Humber ports via east west routes from Carlisle to Newcastle and south to the Humber or via the Trans Pennine routes via Leeds to Hull.
2.18 Central – this corridor provides for movement between the ports of Dublin and Dun Laoghaire to Holyhead and Liverpool. It benefits from good access to the Trans Pennine corridor via Leeds to the Humber. It also provides access to the Midlands, and the conurbation in the north east of England. Routes to the South East and the Channel Ports are also reasonably direct. The corridor benefits from the radial system of national primary routes and the rail network in Ireland which converges on the Dublin area.
2.19 Southern – shipments through the port of Rosslare and Cork to Fishguard and Pembroke Dock in West Wales and Swansea in South Wales are facilitated by this corridor. It provides direct access to the south Wales area, it has also reasonable access to the West Midlands and London and the South East of England.
2.20 There is also a Diagonal corridor covering services between Larne, Belfast and Warrenpoint to Fleetwood, Heysham and Liverpool that cross the above corridors.
2.21 These four corridors provide access to internal UK destinations and also act as the main connections to landbridge routes to continental Europe via the UK. In fact several ferry operators operate on both the Irish Sea and English Channel/North Sea routes and offer a freight customers a facility for through booking on both routes. Other ferry operators have agreements in place with the Channel Tunnel operators and are also able to offer a through booking service.
27

2.22 Clearly the UK plays a major role in facilitating access to European markets for industry based in Ireland. The four corridors basically filter to two main areas of the UK that provide onward Ro/Ro links (and the channel tunnel) to mainland Europe. The Humber ports provide access to the Benelux region and also to northern central Europe within the North European Trade Axis (NETA). The southern eastern England ports provide direct axis to France and north western Europe. The importance of the UK as a trading partner relative to Continental Europe, is illustrated by the fact that 83% of all trailer movements have destinations in the UK, some 15% of trailers use the UK as a landbridge for access to Continental Europe, with only 1% being shipped direct to destinations in Continental Europe. However as shown in Table A2.8 (Appendix 2) traffic to or from Britain has grown by 111% over the ten year period where as vehicles from other EU countries have grown by 251% since 1989. Traffic using the landbridge route has grown by 266% since 1989. This shows that Ireland is slowly moving away from its traditional trading partner, Britain, and is increasing its trade at a faster rate with the other countries of the EU.
28

Figure 215 Direct Flights from Ireland to European Destinations andDomestic FlightsC o r k S h a n n o n
D u b l i n B r u x e l l e s A m s t e r d a m
L u x e m b u r g P a r i s
B a r c e l o n a M a d r i d
F r a n k f u r t D u s s e l d o r f P r a g u e
V i e n n aM u n i c h C o p e n h a g e n B i l l u n d B u d a p e s t
S t o c k h o l m
M o s c o w
Airport Schedules (Winter). Addit ional Destinations put on to meet Tourist Destinations during Summer Holidays.
L E G E N D
B l a c k p o o lI s l e o f M a nP r e s t w i c k
F l y i n g T i m e ( A p p r o x . )
0 15 3 0 ( m i n )
F l y i n g T i m e ( A p p r o x . )
0 30 6 0 ( m i n ) Sources:
29
Z u r i c h
M i l a n R o m e
C o r kK e r r y
S h a n n o nG a l w a y
S l i g oD o n e g a lD e r r y
P l y m o u t h
E x e t e r
B o u r n e m o u t hB r i s t o l
E a s t M i d l a n d s
N e w c a s t l eT e e s i d e
D u b l i n B i r m i n g h a m
C a r d i f f L e e d sM a n c h e s t e rG l a s g o w
E d i n b u r g h
C o n n a u g h tI r e l a n d / E n g l a n dW a t e r f o r d L o n d o nL i v e r p o o l

30
2.23 With regard to Lift On/Lift Off (Lo/Lo) traffic the main services operating from Ireland to the UK are to the ports of Liverpool, Felixstowe, Southampton and Cardiff. There are also direct services to the main European hub ports of Rotterdam, Antwerp, Hamburg and Le Harve. Generally Lo/Lo caters for low value high volume goods which are less time sensitive, whereas Ro/Ro traffic provides facilities for high value and perishable goods. Figure 2.7 also shows the relative volumes of trade between the Island of Ireland, UK and Continental Europe on the various corridors by Ro/Ro. For the Republic of Ireland the central corridor is clearly the most important.
2.24 For illustrative purposes the potential for delays being encountered on a journey by HGV/Ro/Ro between North West Ireland, the UK and Continental Europe is provided. A container lorry travelling between Letterkenny in the North West and the UK will utilise one of two options given the destination in the UK - either via the northern corridor or the central corridor. By the northern corridor the container would move via the N13 to Derry where potential delays can be avoided by use of the A2 via the Foyle Bridge route to connect with the A6 to Belfast. Delays could be encountered at Toome and entering either Belfast or Larne during the peak hours. Crossings to Scotland are available from Larne or Belfast. The A75 is the main exit route from these ports and there is potential for delays when ferries arrive depart due to the volume of traffic and high numbers of HGVs. Trips from the north West to ports in southern Scotland typically account one day for a single journey, plus one day return, however these trips will merge into Day Two depending on the destination in Scotland/Northern England
2.25 Goods travelling onwards to England can do so southwards on the M6. This is a major interurban route connecting Birmingham, Manchester etc and as such there is considerable potential for delays. At Junction 30 on the M6 goods can travel via the M62 TransPennine route to the Humber Ports providing services to the BeNeLux region. Goods travelling onwards to the Southern England will encounter significant delays at the M6 north of Birmingham , during the peaks. This is a major national bottleneck, although Birmingham Northern Relief Road improvements are planned in the short term to alleviate this problem.
31

Gothenberg
L E G E N D
BergenLisbon
Porto
Figure 2.7 Main Freight Corridors between RoI and UK/Mainland Europe
Major Transport Corridors
Minor Transport Corridors
Note: Based on an interpretation of available freight & route data.
This data does not permit exact identification of the proportion of
trade going through specific UK ports, but UK trading patterns and
destination / origin of Irish freight suggests that volumes shown are
broadly accurate.
32
2.26 However Ro/Ro goods from the North West with destinations in Southern England are more likely to operate along the central corridor via Dublin to North Wales. Delays are likely approaching Dublin from the North on the N2, especially during local peaks at towns such as Monaghan, Castleblayney and Ardee. Major delays can be expected if approaching Dublin during peak periods and are likely to be experienced until the opening of the Port Access Tunnel planned for 2004.Goods utilising the central corridor with origins in the central west of Ireland such as Galway will also be transported on the basis on day one to English/Welsh ports with Day Two arrival in UK and onward carriage to final destinations. Delays can typically be encountered on the N6 at Enfield and Kinnegad, although the extent of the delay depend of the time of day due to potential mixing with Dublin commuter traffic. Container lorries from Dublin arriving in Holyhead have recently benefited from the A55 improvements through North Wales to Chester. Routes to Southern England will need to use the M6 to Birmingham where delays will be encountered at peaks until planned improvements are in place. From Birmingham travelling southwards along the M5 is normally free-flowing until the junction with the M4 from which point onwards delays may be encountered particularly during holiday periods. Goods shipped from ports in the South East of Ireland are likely to encounter delays in the UK on the main route linking the ferry ports of Fishguard and Pembroke Dock to Carmarthen and the M4. Delays on the M4 through South Wales can be encountered during the peak hours due to volumes of Commuter traffic. These delays can be severe if goods traffic passes Reading/Windsor en route to central London during peak periods and also at the junctions with the M25.
2.27 To access the South East traffic may use the M1 which is the main arterial route in the UK linking London to the north. This route is very busy and there is significant potential to encounter delays. The M1 meets the M25 north of London. The M25 is often severely congested and there are speed limits of 50mph imposed on some sections. To access Channel ports the M20 is available to Folkestone, or the M2 to Dover, however the M2 is only partial motorway.
2.28 Goods accessing continental Europe via the landbridge will reach their destinations normally on Day Three after departure from Ireland. Within Europe the main ports have direct motorway access, such as at Calais and Zeebrugge, although there is potential for some delays when several ferries are scheduled to embark or depart over a short time period. For goods traffic travelling by road within Europe, the main areas where bottlenecks can be encountered are in the urban areas. In these locations international goods traffic intermixes with local goods and commuter traffic that can create problems during the peaks. The main interurban links are normally free-flowing.
33

FREIGHT AND PASSENGER TRENDS2.29 A detailed analysis of recent trends in freight and passenger movement is
provided in Appendices 2 and 3.
2.30 The main trends for surface freight transport have been:
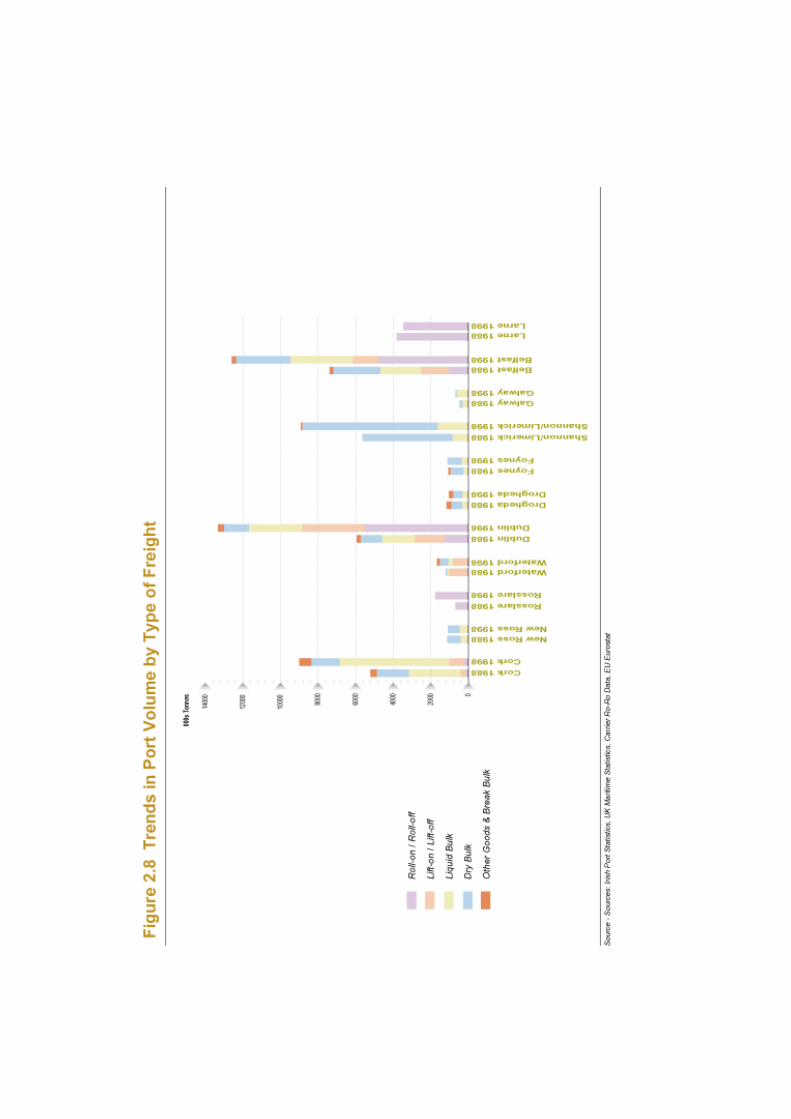
• Significant growth in goods traffic through all of Ireland’s ports. This growth has occurred mostly in Ro/Ro and has been concentrated on Dublin Port – as shown in Figure 2.8;
• Ro/Ro traffic has risen by 259% between 1988 and 1998;
• Lo/Lo traffic has risen by 72% 1988-1998;
• Dublin is the key port in Ireland experiencing a growth of 360% in Ro/Ro traffic between 1988 and 1998, and growth of 110% in Lo/Lo over the same period;
• In 1999 Dublin accounted for 75% of the total number of TEUs by Ro/Ro through Irish Ports. Rosslare was the next largest with 18%; and
• In 1998 Dublin accounted for 70% of the total number of units by Lo/Lo in Ireland, Cork was the next largest with 17%.
2.31 The main trends for air freight movements in Ireland have been:
• Dublin is the main airfreight terminal accounting for some 71% of terminal freight in 1999;
• Shannon handled 22% of air freight in 1999;
• Cork handled 7% of air freight in 1999; and
• Airfreight handled at Dublin Airport doubled between 1990 and 1999 to 112,000 tonnes.
2.32 Surface passenger numbers have also experienced considerable changes over the past ten years:
• Cross Channel (Irish Sea) sea passenger numbers have almost doubled since 1990 to 4.3 million in 1999; and
• Sea passenger numbers direct to/from Continental Europe have reduced by 50% since 1990 – largely reflecting the growth in popularity of air travel.
2.33 Analysis of the recent trends in air passenger figures has shown that :
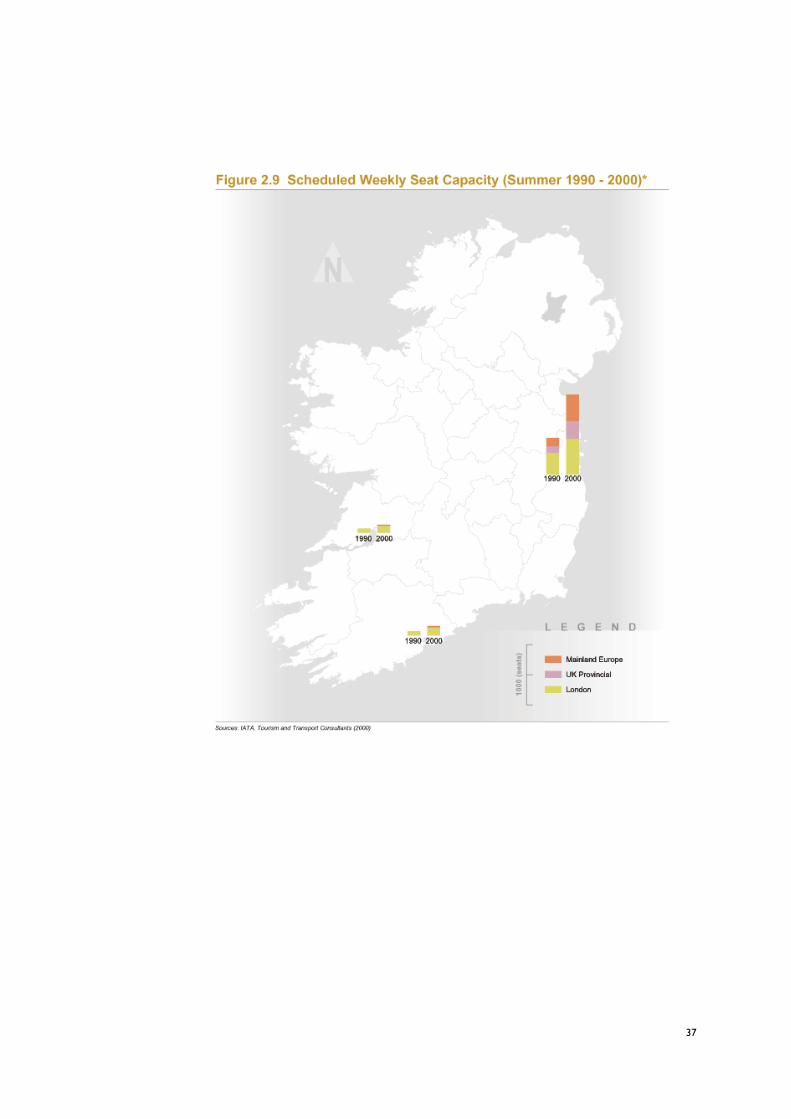
• Since 1990 the numbers of Cross Channel air passengers have almost doubled to 9 million passengers in 1999 – as illustrated by Figure 2.9;
• Air passenger numbers between Continental Europe and Ireland have trebled to over 4.5 million over the same period;
• Britain accounts for most visitors to Ireland with some 72% of total EU passengers in 1999. The next highest country of origin is Germany, with approximately 16%;
34
• In 1999 business travel to Ireland accounted for 16% of all air passengers from overseas;
• In 1999 UK business visitors accounted for some 74% of all business visits by air to Ireland from the EU;
• Travel to/from London dominates the Ireland/UK market with a 66% share;
• There were some 12.8 million passenger movements at Dublin in 1999, some 2.2 million at Shannon and 1.5 million at Cork, (increases since 1997 of 13%, 1% and 9% respectively)
• Total airport passenger movements at regional airports are a fraction of those at major airports with all regional airport movements accounting for less than 0.5 million in 1999. Figure 2.9 shows the relative position of Airports in Ireland by passenger throughput.
35
37

FREIGHT AND PASSENGER FORECASTS2.34 Detailed forecasts of passenger and freight movement by air and sea to 2010
have been developed. These are based on analysis of previous trends and utilise a range of available data sources. Further detail on the methodology and assumptions used are provided in Appendix 4, together with a more detailed analysis of the information derived from the forecasts. The main output from the forecasts are summarised below:
• Surface freight movements will increase significantly, with Ro/Ro traffic showing the highest rise of some 80%;
• Dublin Port will continue to experience the greatest share of growth with present volumes set to double by 2010;
• Cork and Rosslare are set to experience an increase in volumes by some 50%;
• Total surface passenger numbers are expected to increase by only 18%;
• By 2010 air passenger numbers are forecast to double;
• Dublin Airport passenger numbers could reach 25 million per annum by 2010; and
• Major growth of over 150% is expected in airfreight.
38
3 TRANSPORTATION AND INFRASTRUCTURE – CAPACITY IMPLICATIONS
NATIONAL ACCESS POINTS3.1 Landside access to National ports and seaports is an important aspect of their
operation and viability. The study has identified a number of key issues affecting accessibility, these primarily include :
• The problem of encountering delays in Dublin,
• low levels of public transport access (and a subsequent dependence on vehicular modes),
• a lack of/or underutilisation of rail freight facilities and generally poor accessibility to regional airports.
Airport Accessibility by Road3.2 One of the key issues relating to the future success of Dublin Airport is the
quality of access by road. In recent years the Airport has benefited substantially from the construction of the M50, the M1 and improvements to the N1. The M50 provides a motorway standard road around Dublin urban area with two lanes in each direction. A grade separated interchange with the M1 provides access to the Airport itself.
3.3 Similar to airports in other major cities, problems of accessibility by road can arise during the peak hours. Dublin airport is located on the fringes of the city’s built up area and on one of the major arterial routes into the city. Business travellers wishing to access the city centre from the Airport in the morning peak will encounter delays. Peak hour congestion is often less of a consideration for charter holiday flight traffic as flights regularly arrive/depart outside normal business hours.
3.4 Road accessibility problems to/from the airport during the peaks also affect the ability of road based public transport to cater efficiently for demand from airport passengers. Buses, coaches, airport transfer buses and taxis can all be adversely effected by congestion, leading to reduced reliability of these services creating a spiral of increased car use and congestion to/from the airport, as is the case for the wider city area.
3.5 Road access to Dublin airport from Dublin City and the M50 is to motorway standard. However, from the north the N1 varies between dual carriageway and single carriageway, with numerous signal controlled junction and roundabouts interrupting the traffic flow.
39
3.6 The future development of Dublin Airport is, to a degree, influenced by the quality of highway infrastructure extending throughout its catchment. Dublin is the main international gateway to/from Ireland and as such attracts passengers from throughout the whole of Ireland. Clearly the accessibility of the airport by road from the rest of the State is a key consideration in considering the future needs of the airport.
3.7 At Cork Airport the provision of a single carriageway access road between the city and the Airport may require enhancement depending on future levels of demand and the flight patterns that operate from the airport. However in both k AirsS ennoween tissueort mwelload howoad res, Dubkeen s the airpses, en ir by quality en tof highwof
demaforeomae pencof highwof
40

Seaport Accessibility Road and Rail3.11 Dublin Port is the main international gateway port for Ireland. The port is of
national importance in ensuring the continued competitiveness of Ireland generally, as well as being of direct benefit to the greater Dublin area. Dublin competes with other major European cities and must therefore continue to maintain its competitive position.
3.12 The major issue facing Dublin port is one of road access. Given the ports location on the eastern side of a major city the routes/to and from the ports are via residential/built up areas. Congestion problems already exist on these routes at peak hours and are often compounded by the presence of HGV traffic. There is also mounting concern regarding the adverse effects on the local communities from significant volumes of HGV traffic. These concerns include emissions from vehicles, noise pollution, general residential amenity and road safety. At present all port traffic passes through the Docklands residential area on four major roads. Port traffic in Dublin City centre is also noticeably intrusive reducing the enjoyment of visitors, workers and residents alike.
3.13 The Dublin Docklands Area Masterplan of 1997 recognised that catering for the efficient operation of the Port requires specific attention to providing and improving road access. Road traffic to/from the port includes, heavy goods vehicles, liquid tankers (oil, etc), passenger cars and coaches, construction and commuter traffic and service vehicles.
3.14 The proposed Dublin Eastern By-Pass would be a major benefit to the port of Dublin. This will provide a route for goods vehicles from the south to the port and for traffic to bypass the city centre and the C-ring. This road combined with the Port Access Tunnel will increase the accessibility of the port from the north, and avoid the need for goods vehicles to pass through sections of residential areas as is currently the case. The Port Access Tunnel is central to relieving critical junctions on East Wall Road (especially at Tolka Quay Road). Existing junctions would be unable to cope with the level of forecast traffic growth, requiring additional access points to the port from East Wall Road. However it is important to note that the Port Tunnel is unlikely to be completed prior to 2004.
3.15 Rail is currently utilised at Dublin Port for the transportation of materials such as oil, ore, animal feed and some containers, however the overwhelming majority of goods and material are shipped by road.
3.16 The prevalence of car borne traffic on Ro/Ro ferries to/from Dublin also means that rail and bus play an important but not greatly significant role in terms of the numbers of passengers.
41
3.17 In Dublin the problem of congestion is compounded by the physical urban form of the city i.e. it has developed in a semi-circular pattern centred around the former quays. Over time the greater Dublin metropolitan area has extended to cover access to/from the port at the mouth of the River Liffey on the northside and the southside. This is a common feature even where smaller settlements have developed around a port facility such as at Drogheda. Problems of congestion in these smaller settlements are also compounded by the presence of heavy goods vehicles unless the highway network has been developed to a sufficient standard.
3.18 The timing of arriving/departing ferry services can also act to increase congestion. Although in most cases the timings are dictated by external factors the arrival of a ferry just before or during the peak hours will contribute to increased congestion on local roads. In Dun Laoghaire the ferry port is located within the greater Dublin area and traffic to/from the ferry has to use local distributor roads through residential areas. The ferry traffic arrives just before the beginning of the peak period, although over time and especially given the growth of traffic and congestion in the greater Dublin area there may well be some spreading of the peaks leading to conflict with ferry traffic and commuters.
3.19 In Waterford access to/from the port is constrained by topography and the nature of the highway network. Access to the City from the north is via a single carriageway road. There is only one crossing of the River Suir. Access to/from the port from the west is via the City centre. These roads are single carriageway and are narrow in places. Access to/from the port is made more difficult at particular points in the City centre where congestion occurs due to the nature of junctions, signals, on street parking or narrow carriageways. In Waterford a bypass and second river crossing is currently being designed that will improve access to/from the port, particularly from the north. The scheme is due for completion by 2008, approximately.
3.20 Several of the smaller ports have no direct access to the National Primary Route Network. At Foynes and Shannon Estuary local distributor roads provide a link to the N69 which is classed as a secondary route. This lack of a primary route access my be appropriate to the level of traffic to/from these ports, the distances goods are shipped and the type of vehicles involved. However highway improvements should be considered if there are changes in the type of traffic or increases in the amount of traffic to/from these ports.
3.21 The majority of the goods and passenger traffic handled by Irelands ports is carried by road either by heavy goods vehicles, coaches or private car. However, a substantial element of that traffic continues to utilise the passenger and freight rail network. Passenger rail provides a through route between Ireland and European destinations, particularly for sailings from Dublin/Dun Laoghaire to Holyhead, and from Rosslare to Fishguard/Pembroke Dock.
42
3.22 In terms of freight, Iarnród Éireann operates “Containerail” which is a unit load services transporting containers door to door throughout Ireland. It utilises fast overnight trains to deliver goods from 8:00am onwards.
PLANNED LANDSIDE ACCESS IMPROVEMENTS3.23 There have been significant improvements to Ireland’s national infrastructure in
the last decade and a major programme of improvements is set out in the NRA National Roads Needs Study 1998, now superseded by the National Development Plan and the DTO Strategy 2000 – 2016 “A Platform for Change”. A detailed illustration of recent National infrastructure improvements is included as Appendix 5, and proposed improvements as set out in the National Development Plan in Appendix 6. The significant levels of investment set out in the National Development Plan will have a major impact on relieving local bottlenecks on the main National Primary Routes throughout Ireland. Figure 3.1. shows the locations of the main road improvements throughout Ireland. These should provide a major benefit for traffic approaching Dublin Port from the north, with the provision of the Dublin Port Access Tunnel. It is envisaged that this tunnel will be opened by 2004 and reduce journey times to the Port by at least 30 minutes, although the time savings will be much greater during the peaks when congestion can be avoided. There remains a pressing need for the provision of a similar quality of access to the Port from the south via the proposed Dublin Eastern By-Pass. However this scheme is not currently included within the improvements programme and has not yet reached the preliminary design stage.
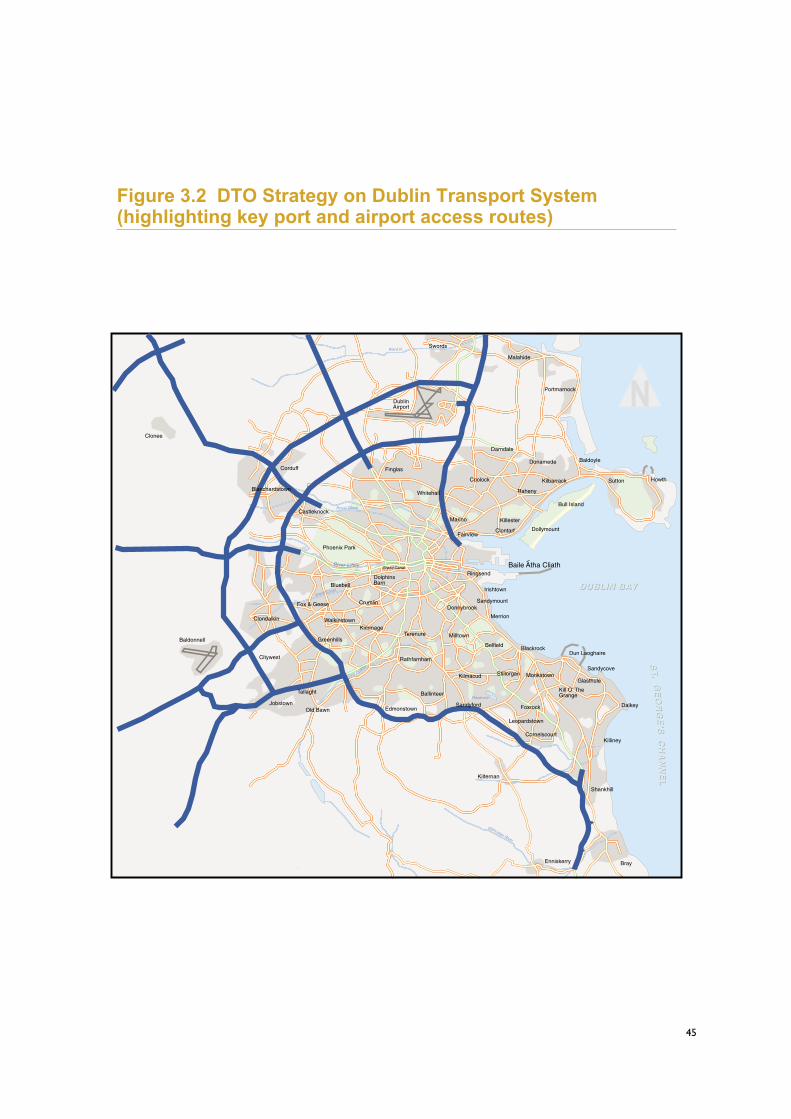
3.24 Figure 3.2 shows the main elements of the DTO Strategy. The Strategy will improve passenger access by public transport to the capital’s airport. This will relieve the surrounding road network and provide an alternative form of access to the airport for all travellers. Given the scale of the works set out in these improvement programmes, in the short and medium term, there is considerable potential for the construction to create disruption for traffic accessing the ports and airports. With regard to access to Dublin Port, the DTO strategy does not provide for radial access to the Port directly, meaning that traffic will have to travel clockwise or anticlockwise on the M50 to reach the Port Access Tunnel or the proposed Eastern By-Pass. Access to the port will be further hindered by the amount of roadspace required for the development of on-street public transport improvements on existing radial routes.
43

44
7
10
9
6
8
61
11
1
4
5
6
11
1
1
2
3
1
2
3
4
5
6
7
8
9
10
11
Upgrade M50 Motorway
Southern Cross Route
South Eastern Motorway
Dublin Port Tunnel
Eastern By-Pass
Outer Ring Road
Outer Orbital RouteNass / Navan / DroghedaEnvirons
M1 Northern Motorway
N2 M50 - Ashbourne
N3 Clonee - Kells
N7 Naas Road Improvements
Figure 3.2 DTO Strategy on Dublin Transport System(highlighting key port and airport access routes)
BrayEnniskerry
Kilternan
Swords
Malahide
DublinAirport
Portmarnock
Baldoyle
Sutton Howth
Bull Island
Dollymount
Kilbarrack
Raheny
Killester
ClontarfFairview
Ringsend
Irishtown
Sandymount
Merrion
BlackrockDun Laoghaire
Sandycove
Glasthule
Dalkey
Killiney
Shankhill
Cornelscourt
Leopardstown
Sandyford Foxrock
Monkstown
Kill O’ TheGrange
StillorganKilmacud
Ballinteer
EdmonstownOld Bawn
Tallaght
Jobstown
Citywest
Clondalkin
Corduff
Blanchardstown
Phoenix Park
Castleknock
Finglas
Marino
Whitehall
DolphinsBarn
Crumlin
WalkinstownKimmage
Greenhills
Fox & Geese
Bluebell
Coolock
Darndale
Donamede
Rathfarnham
Terenure
Donnybrook
Milltown
Belfield
Ward R.
Royal Canal
River Liffey Grand Canal
Grand Canal
River Dodder
Glancullen River
Reservoir
DUBLIN BADUBLIN BAYY
Baile Atha Cliath
ST
ST
..G
EO
RG
E’S
GE
OR
GE
’SC
HA
NN
EL
CH
AN
NE
L
Baldonnell
Clonee
45

3.25 Table 3.1 provides an overview of the planned improvements to Ro/Ro port capacity in Ireland over the next ten years.
Source MDS Transmodal 2000
Table 3.2 shows the capacities that are envisaged by 2010 at Ireland’s main Lo/Lo ports.
Source MDS Transmodal 2000
3.26 The main expansion in Lo/Lo is planned at Dublin where improved container facilities are planned for 2002 on 9 hectares of reclaimed land providing approximately 300m of new quay length. This expansion will effectively increase capacity by 25%.
AIRPORT CAPACITY3.27 There are substantial improvements to facilities planned for airports at Dublin,
Cork and Shannon. Dublin airport has been operating in excess of current capacity for the last three years. However, a major expansion plan is underway at Dublin airport to accommodate some 20 million passengers per annum (compared with throughput of 12.8m passengers in 1999)
3.28 Shannon Airport’s capacity has recently been upgraded and is currently capable of accommodating over 4 million passengers (compared with throughput of 2.2 million passengers in 1999). In September 1999 Aer Rianta announced a £61million improvement plan for Cork Airport aimed at increasing the terminal capacity to cater for some 3.5 million passengers per annum (compared to a throughput of 1.5 million passengers in 1999).
Table 3.1: Planned Ro/Ro Port Capacity by 2010
Port Trailer Handling Capacity by 2010
Cork 30,000
Rosslare 240,000
Dublin 736,000
Dun Laoghaire 50,000
Table 3.2: Planned Lo/Lo Port Capacity by 2010
Port Container Handling Capacity by 2010
Cork 144,000
Drogheda 22,000
Dublin 669,600
Waterford 170,000
46

PORT CAPACITY ISSUES3.29 To illustrate the proposed changes in demand versus supply, the volumes of
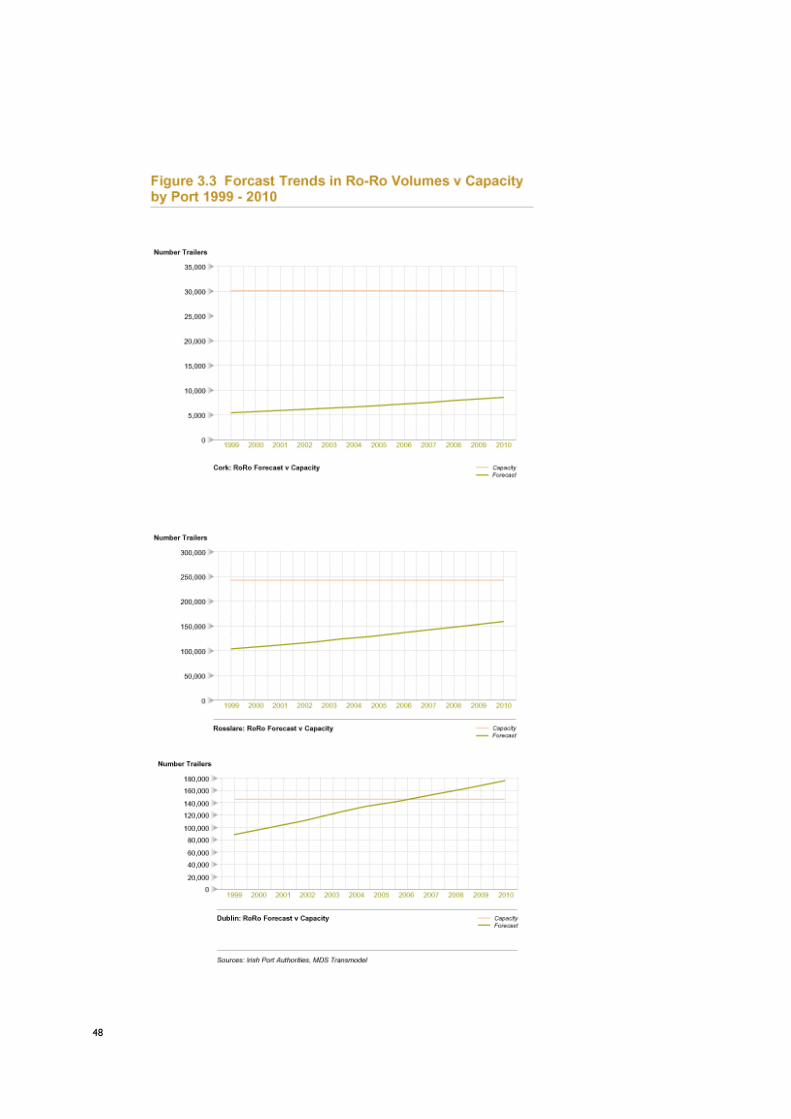
surface freight movement and air passengers per annum have been selected for further examination.
3.30 Figure 3.3 shows planned capacity improvements against the forecast demand for Ro/Ro transport at the key ports up to 2010.
3.31 For Ro/Ro traffic it is expected that demand will exceed supply at Dublin Port by 2007.At this point some 764,857 trailers are forecast although the capacity will accommodate only 736,000 trailers. By 2010 demand will exceed supply by 144,000 trailers.
3.32 The forecasts indicate that capacity problems are not expected at Cork for Ro/Ro traffic. Capacity will remain at 30,000 trailers with demand at 2010 reaching only 8,400 trailers.
3.33 Similarly, capacity problems are not forecast for Rosslare, where capacity is expected to remain constant at 240,000 trailers with levels of traffic reaching some 156,800 in 2010.
3.34 At Dun Laoghaire demand is expected to closely match present levels. For environmental reasons the port has imposed a capacity limit of 50,000 trailers per annum.
3.35 Figure 3.4 shows the forecast levels of Lo/Lo traffic relative to the planned capacity over the period to 2010.
3.36 Capacity problems are expected at for Lo/Lo at Dublin Port soon after 2010 as demand approaches the level of capacity towards the end of the ten year period.
3.37 Capacity problems are also forecast at Cork by 2004 when container numbers are predicted to reach 146,118 compared to the capacity of 144,000. By 2010 demand will reach 173,846, exceeding capacity by 29,486 containers per annum.
3.38 No capacity problems are expected at Drogheda where port capacity will stand at 22,000 containers compared to demand of only 4,487 trailers by 2010. No capacity problems are envisaged at Waterford where capacity should be some 170,000 containers compared to a demand level of some 137,592 trailers by 2010.
47
48

49
AIRPORT CAPACITY ISSUES3.39 The ongoing improvements at Dublin Airport, planned to accommodate some
20 million passengers, will be insufficient to cater for the passenger numbers of some 25.6 million forecast for 2010.
3.40 Shannon airport’s capacity of some 4 million passengers per annum should be capable of accommodating the forecast demand of some 3.2 million passengers in 2010.
3.41 At Cork airport the proposed increase in capacity to cater for some 3.5 million passengers should be more than sufficient to accommodate the forecast demand of 2.7 million in 2010.
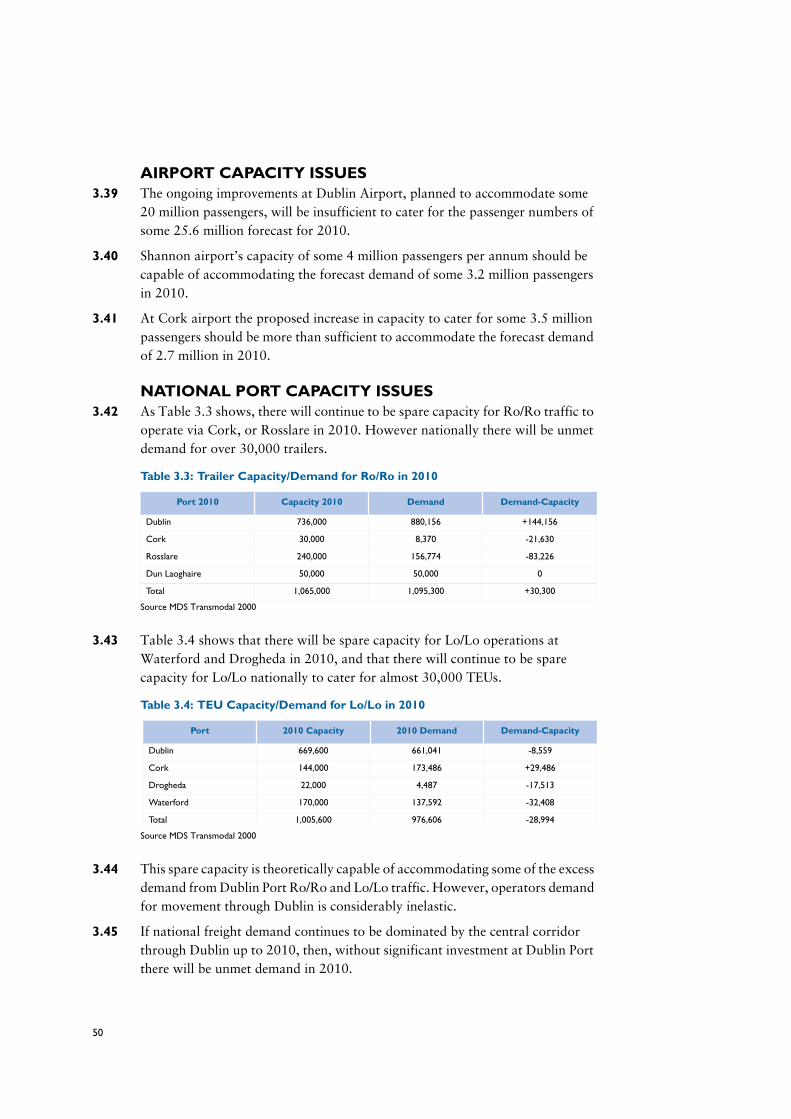
NATIONAL PORT CAPACITY ISSUES3.42 As Table 3.3 shows, there will continue to be spare capacity for Ro/Ro traffic to
operate via Cork, or Rosslare in 2010. However nationally there will be unmet demand for over 30,000 trailers.
Source MDS Transmodal 2000
3.43 Table 3.4 shows that there will be spare capacity for Lo/Lo operations at Waterford and Drogheda in 2010, and that there will continue to be spare capacity for Lo/Lo nationally to cater for almost 30,000 TEUs.
Source MDS Transmodal 2000
3.44 This spare capacity is theoretically capable of accommodating some of the excess demand from Dublin Port Ro/Ro and Lo/Lo traffic. However, operators demand for movement through Dublin is considerably inelastic.
3.45 If national freight demand continues to be dominated by the central corridor through Dublin up to 2010, then, without significant investment at Dublin Port there will be unmet demand in 2010.
Table 3.3: Trailer Capacity/Demand for Ro/Ro in 2010
Port 2010 Capacity 2010 Demand Demand-Capacity
Dublin 736,000 880,156 +144,156
Cork 30,000 8,370 -21,630
Rosslare 240,000 156,774 -83,226
Dun Laoghaire 50,000 50,000 0
Total 1,065,000 1,095,300 +30,300
Table 3.4: TEU Capacity/Demand for Lo/Lo in 2010
Port 2010 Capacity 2010 Demand Demand-Capacity
Dublin 669,600 661,041 -8,559
Cork 144,000 173,486 +29,486
Drogheda 22,000 4,487 -17,513
Waterford 170,000 137,592 -32,408
Total 1,005,600 976,606 -28,994
50

NATIONAL AIR CAPACITY ISSUES3.46 As shown in Table 3.5, national demand for passenger travel by air, via the
AerRianta airports, is expected to reach levels in excess of 30million by 2010. Even if passengers transfer to Cork and Shannon airports there will continue to be a national shortfall of some 4 million passengers by 2010.
Source TTC 2000
3.47 Although passenger demand is less inelastic than carrier strategies, demand will only be created if there is sufficient catchment at Cork and Shannon. This has implications for the successful implementation of the NSS to relocate growth from Dublin.
3.48 It is clear however that there will continue to be substantial demand for movement via the central corridor through Dublin airport.
INTERNATIONAL BOTTLENECKS3.49 There a number of international capacity implications that have the potential to
adversely affect Ireland’s trade abroad, largely through the creation of delays for carriers and unpredictability of journey times. Figure 3.5 shows the locations of the main bottlenecks on the EU road network. Given the volume of trade with the UK Ireland and the importance of the UK as a landbridge to continental Europe, Irish traffic is most affected by problems on the UK network. These problems include delays on the UK national motorway network at major urban areas, where long distance traffic mixes with commuter and local traffic such as on the M6/M42 around Birmingham, the M25 orbital motorway around London, the routes to Channel ports in South East England and the routes to from Scottish and South Wales ferry ports.
Table 3.5: Air Passenger Capacity/Demand 2010
Airport 2010 Capacity 2010 Demand Capacity- Demand
Dublin 20,000,000 25,600,000 - 5,600,000
Cork 3,500,000 2,700,000 + 800,000
Shannon 4,000,000 3,200,000 + 800,000
Total 27,500,000 31,500,000 - 4,000,000
51
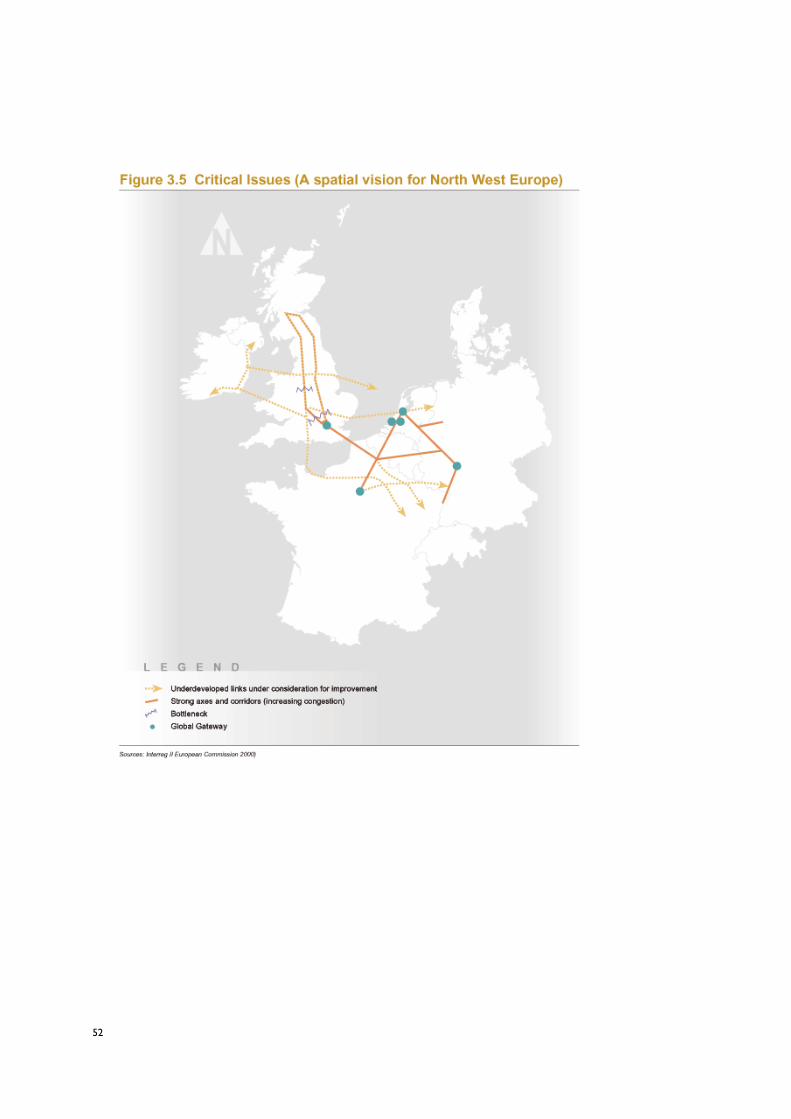
52

3.50 There are some minor bottlenecks within, and adjacent to, the main urban areas in Continental Europe, particularly during peak periods, however the main inter- urban routes are not severely congested.
3.51 Ireland’s dependence on London Heathrow can result in delays being experienced due to the sheer scale and volume of traffic travelling through this major international hub. There is significant airside and landside congestion at Heathrow.
INTERNATIONAL ISSUES3.52 The key issue for Irish traffic is the ability to travel to destinations efficiently and
reliably, particularly to the UK, Ireland’s main trading partner. Operators need to be able to plan for reasonably fixed travel times. Difficulties occur due to fluctuations in costsas journey times are affected by unforeseen delays due to congestion etc on the network.
3.53 It may be possible to utilise an alternative route to Europe using the UK as a landbridge with the Humber ports on the north east coast of England providing direct access to Europe. This route is commonly known as NETA (the North East Trade Axis). It provides one of the shortest distances within the UK to a port accessing continental Europe avoiding the bottlenecks encountered by Irish Traffic travelling south through the UK to the Channel Ports. There is spare capacity at the Humber ports for unitised traffic that could potentially be utilised by Irish traffic. However, there are a number of factors that hinder it fulfilling its potential for Irish Traffic including:
• Access arrangement to the Humber Ports – there is limited capacity available at peak times for HGV traffic travelling to the ports;
• Congestion on the M62 cross Pennine motorway due to this route’s role as a major link between the conurbations of Manchester and Leeds; and
• There is greater potential for rail freight on this route- although this may be of limited value to Irish traffic.
3.54 Investigations within the UK have revealed that strategies for development at British Ports on the Irish Sea include an element of expansion designed to accommodate anticipated increased trade between Ireland and the UK. For example at the Port of Liverpool a £20 million improvement to container handling facilities has recently been carried out.
3.55 The bottlenecks within the UK road network will be substantially relieved by planned improvements, implemented as part of a ten year strategy for transport by the Department of the Environment Transport and the Regions. These improvements will address the two main bottlenecks namely the M6 at Birmingham and the M25 orbital motorway around London. The M6 will be improved by the construction of the M6 Northern Relief Road, and the M25 will benefit from additional lane capacity over the most congested lengths. A more detailed breakdown of UK transport improvements is provided at Appendix 7.
53
SUSTAINABILITY3.56 This is a key driver of emerging transport policy, aimed at reducing the impact
of transport (and vehicular traffic in particular), in terms of emissions, loss of amenity, safety, noise etc, and seeking to develop more energy efficient patterns of movement together with integrated land use and transport planning policies. Within Europe the policy has been developed to encourage increased use of rail for freight transport. In implementing this policy, increased use of spare capacity on existing lines will be utilised and, where necessary, new rail access will be constructed and a series of intermodal freight depots constructed. This approach is currently being implemented in the UK as part of an integrated transport strategy, which is also seeking to establish sustainable distribution practices for the movement of freight and seeking to make best use of the existing road network for strategic traffic.
3.57 In general there may be some conflict with sustainability principles in seeking to accommodate the increased use of Ro/Ro. The predicted increase in Ro/Ro will mean an increase in the amount of freight transported by road. Ro/Ro traffic is less sustainable than Lo/Lo. This is due to its reliance on road haulage, which is less energy efficient than coastal shipping or rail. However Lo/Lo is not predicted to grow as rapidly as Ro/Ro, if left to market forces. This raises the issue of whether Ireland might be at a competitive disadvantage in being dependent on Ro/Ro, in a context where capacity/service enhancement in the UK/EU favours rail and Lo/Lo.
3.58 The trend towards increased air travel will also conflict with sustainability policies as air transport has a very high ratio of energy used to passengers/goods transported.
3.59 Similarly, sea carrier strategies based on accommodating the demand of car borne passengers is less sustainable than a policy based on increasing access to ports by public transport.
3.60 Other EU states are concentrating on programmes to encourage sustainable transport volumes of freight. Ireland will not be able to benefit from these improvements directly. Irish freight traffic is dominated by Ro/Ro. At present rail is not viable in many cases due to a combination of the infrastructure in Ireland, the cost of investment and flexibility barriers. Applying a policy of increasing rail freight in Ireland will have only limited success due to the low volumes of freight, the dispersed pattern of development relative to the rail network, combined with cost and time inefficiencies compared to road transport.
3.61 The challenge for sustainability policies in Ireland will be how to “decouple” increased demand for movement from increased energy demand and in turn, how to achieve transfer to more sustainable modes such as rail. In the Irish context rail is tied to Lo/Lo which is not growing as fast as Ro/Ro and there are barriers to effective rail ship movements as at Dublin Port.
54
4 EUROPEAN TRANSPORTATION INVESTMENT – IMPLICATIONS FOR IRELAND
THE EUROPEAN TRANSPORT DIMENSION4.1 Ireland is on the periphery of Europe. It is useful to recall that Ireland is
effectively the last link in the European transport chain. In this context Figure 4.1 illustrates that Irish traffic represents only a small proportion of the total traffic passing through the ports, airports and the road and rail networks of Continental Europe.
EUROPEAN TRANSPORT POLICY4.2 European Transport policy is now dominated by the need to develop more
sustainable patterns of freight distribution. This policy proposes a fundamental improvement in the scale of investment in rail infrastructure and in intermodal freight handling capacities, to significantly enhance the role of rail freight for transportation of goods within Europe. Investment is to be concentrated on Trans European Networks as set out below.
Trans – European Networks (TENS)4.3 The purpose of TENs is to link island, landlocked, and peripheral regions with
the more central regions of the European Community via improved road and rail networks. The aim is to develop the interoperability of the European Transport Network, improve integration and interconnection between E.U. states and Eastern Europe, and develop more sustainable transport practices. The potential of TENs for long term competitiveness, growth and employment has been emphasised by the European Commission. During the period 2000-2006 it is envisaged that significant expenditure will be incurred on the 14 priority projects shown in Figure 4.2. The majority of projects are programmed for completion by 2005.
4.4 There is one TENs scheme wholly contained within the island of Ireland and two affecting Ireland’s direct links to Europe via the UK landbridge:
55
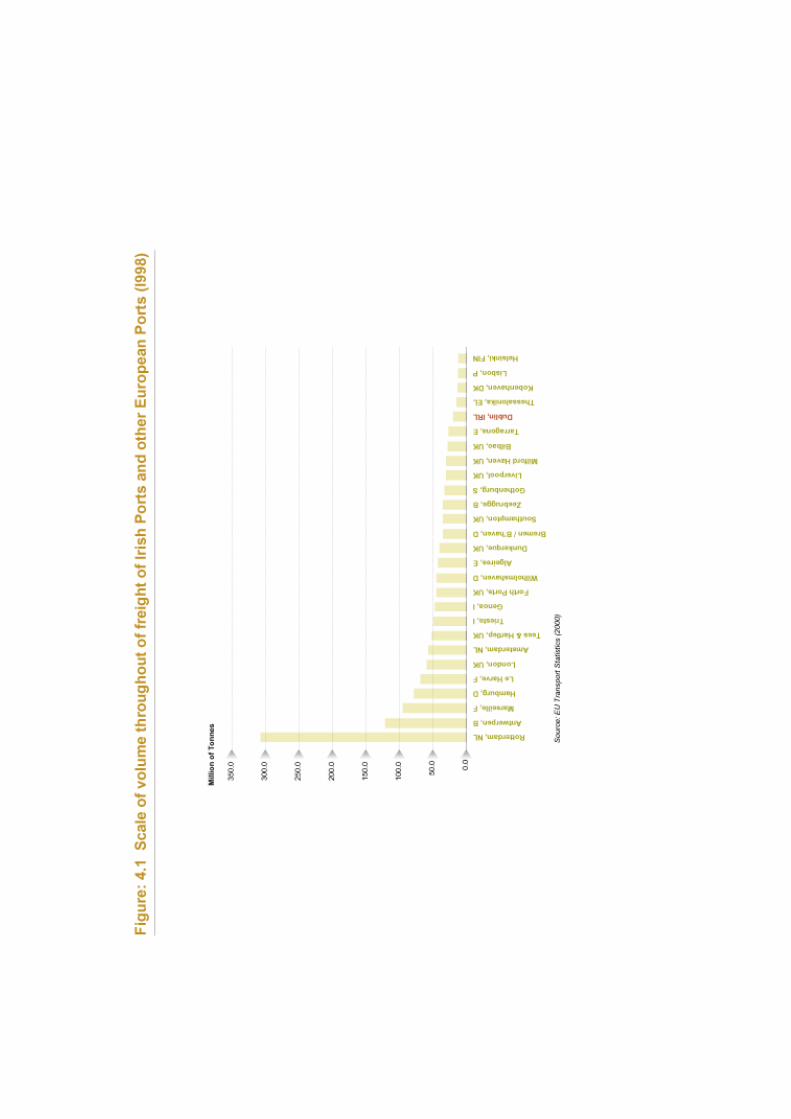

57
4.5 Project No. 9 involves the improvement of conventional rail facilities on a corridor linking Cork, Dublin, Belfast, Larne and Stranraer (with feeder routes to Limerick and via the rail line between Derry and Belfast). This project will link the three largest cities on the island of Ireland through to Larne and the ferry links to Scotland. The route is 502km long and should be upgraded to the benefit of both passenger and freight services. It is envisaged that passenger trains will have a capability of reaching speeds of 200 km/hr although in practice the maximum speeds obtainable are likely to be around 160 km/hr.
The expected benefits include improved journey time for both passengers and freight, plus greater use of rail in preference to road, particularly for journeys between Northern Ireland and the Republic of Ireland. The Cork to Dublin section was completed in November 1996. The Dublin to Belfast section was completed during 1998 although fast train services began operation on 24th October 1997 and the service is now well established and enjoys success in capturing traffic that would previously have been road based.
4.6 Project No. 13 is the Ireland/UK/Benelux road links. The project will to link to project No. 9 to provide a route to Scotland, to Wales by road and ferry, and via the M6 and A14 roads in England to the ferry ports of Felixstowe and Harwich onward to mainline Europe. The planned route is almost 1500km in length. The planned improvements consist of upgrading of roads to motorway standard, high quality single carriageway as traffic densities require. Expected benefits include reduced journey times, particularly for Trans-European traffic, combined with improved safety on the corridor. The upgrading is being planned as a series of individual schemes. In the UK whilst some sections such as the A14 link between the A1 and M6 have been completed, the project has been affected by a policy shift away from road building. Many sections are subject to strategic government review following the publication of the New Deal for Transport White Paper. Birmingham Northern Relief Road is a major element of the UK landbridge route and consists of a major scheme to relieve traffic congestion in the West Midlands that will be of major benefit to road based freight and passenger traffic travelling on the corridor from Holyhead to South East England. Following a major public inquiry approval of the scheme was announced in July 1997. The scheme is to be privately financed.
4.7 Project No 14 is indirectly important to Ireland. This project involves the upgrading of the present 850 km Glasgow-Liverpool-Manchester-Birmingham-London, line linking to the Channel Tunnel Rail Link in London. The project aims to provide through running High Speed Train (HST) services up to speeds of 225km/hr. Freight capacity will also be developed to allow use of high gauge rolling stock and enhance intermodal capacity. Expected benefits include improved journey times for passengers and freight between the outer regions of the EU and France, Benelux and Germany. With the privatisation of British Rail this project is being promoted as a private sector scheme by Railtrack plc. Virgin Rail is sharing some of the cost of providing the HST services although public
58
funding is being used to support some of the services. The project is scheduled for completion in 2005.
4.8 The TENS Network is an important aspect of the growing European economy. As previously stated the network is reasonably comprehensive. However, it must be acknowledged that the completion/upgrading of the network will require considerable funds and will only occur in the long term. Although, given scarce resources it is necessary to prioritise, opportunities for further improved links between Ireland and continental Europe such as via the Trans-Pennine route from Liverpool, Leeds to Hull have become less of a priority in terms of access to EU funds. Road access to other ports such as Dover, and Southampton has also similarly been made a lessor priority.
4.9 There is a danger that unless significantly more resources are concentrated on actually developing the TENs routes, little may happen on the ground for the majority of the network in the short to medium term.
4.10 Although funding is available for priority schemes from the EU, the realisation of the remaining TENS schemes in the UK and Ireland is further complicated by the recent changes to boundaries of those areas qualifying for EU Objective 1 & 2 Status. These changes have meant that some schemes may no longer be eligible for funding from ERDF sources. In Wales, as the south and western areas have qualified for Objective 1 status and this may provide an opportunity to improve the rail and road connections to the ferry ports serving the Irish market.
UK Transport Policy and Landbridge Issues4.11 One of the key considerations for Irish traffic is the future direction of UK
government transport policy. It is important to note that the UK Government is committed to developing some 37 major trunk road improvements over the next seven years. However, this is not an indication of the main thrust of policy. Similar to EU–wide transport policy the UK Government considers that there is a limited role for new road construction and increasing attention and resources are being aimed at encouraging a shift towards making greater use of rail for freight movement. There is also an intention to make the best use of the existing road network, including improved road maintenance, and promoting measures to address demand. The UK Government has developed a “toolkit” approach which includes a number of measures to make better use of the network and a number of pilot studies are currently underway such as greater use of crawler lanes for HGVs, and establishing priority measures for goods traffic.
4.12 The UK Government is placing increasing emphasis on promoting alternative modes for freight transport for example by integrating the road network with major transport interchanges such as rail intermodal terminals. A recent example has been the scheme to develop a new Euro Central Terminal at Mossend in Scotland which will links the main Edinburgh to Glasgow trunk road to the rail network for long distance freight distribution. Additional information on transport policies and schemes within the UK is provided at Appendix 9.
59

4.13 One UK Government proposal for the most congested trunk roads is giving greater priority to certain types of traffic. It has been recognised that subject to appraisal in detail, there may be parts of the UK trunk road and motorway network where lorries and other modes should have priority over cars.
4.14 A number of key objectives have been established by the UK Government, specifically:
• To promote the contribution of major freight interchanges to national and regional competitiveness: by pursuing policies of fair competition in the UK and throughout Europe, by giving due weight to the need for transhipment between modes, and by providing efficient access to/from interchanges by road and rail.
• To improve the operational and environmental performance of existing interchange facilities: by promoting greater use of less damaging modes for onward distribution; and
• To encourage full and efficient utilisation of existing interchange facilities in preference to expansion in cases where suitable spare capacity exists or can be created.
4.15 In implementing these measures, and other transport policies aimed at reducing congestion and reducing the role of the private car the UK Government is investigating the use of a balance of incentive and restraint tools (carrot and stick). These measures will seek to encourage more sustainable transport patterns and impose measures to reduce reliance on less sustainable modes. In major urban centres such as London congestion charging is being considered to impose a tariff on all vehicles entering and exiting the core of the city, or other congested areas. Other measures include taxation policies, fuel prices, motorway tolling and reducing the availability of road space available. Recently due to concerns generated by UK based road haulage firms, the UK Government has proposed a tax on foreign operated vehicles using the UK road network. EU Transport Policy Issues
4.16 Irish traffic is characterised by an increasing role for Ro/Ro, which translates into an increasing number of Irish goods to be facilitated on European and UK roads. Ireland has a relatively low utilisation of rail freight due to the volume and nature of the goods carried and the nature of the existing rail network. Rail is not the ideal mode for exporting goods from Ireland as goods would have to be transferred from rail to ship on at both the origin and destination. Therefore Irish goods traffic is unlikely to benefit directly from policies aimed at increasing the role of rail. In Ireland, growth in rail is more likely to come from passenger demand as settlements increase in size and roads become congested. If this passenger demand is catered for efficiently there will be a net benefit for road freight as congestion will decrease allowing more space for strategic movement of goods.
60
Within Ireland rail plays a secondary role to road transport for both passenger and freight transport combined. In total rail caters for 4% of all passenger traffic and around 10% of freight traffic, although there are suggestions that on the main corridors rails share of the passenger transport market rises to 24%. However, the importance of rail in catering for the movement of particular types of goods must be recognised. Much of the freight moved by rail is bulk material which would require a significant number of movements by HGVs to cater for similar volumes.
4.17 European and UK transport policy also includes an element of seeking to make best use of existing road networks and reduce congestion. Irish traffic may benefit from this aspect of policy given the high proportion of goods transported by HGVs on road to/from Ireland. Proposed restraint measures to influence the pattern of transport within the UK, have the potential to disadvantage Irish traffic with destinations in the UK and traffic using the UK as a landbridge for access to Continental Europe.
NATIONAL TRANSPORT INFRASTRUCTURE AND INTER-NATIONAL COMPETITIVENESS
4.18 Despite many years of funding from European Structural funds the national transport infrastructure is generally of poorer quality than our European Partners and competitors. Although the condition of the national transport infrastructure has not hindered the recent achievement of economic success, this success has helped to highlight the inadequacies of the transport infrastructure and fuelled rising concern.
4.19 The Annual Competitiveness Report 2000 produced by the National Competitiveness Council assesses national economic competitiveness from an international perspective.
The report uses E.U. Commission benchmarks to assess Ireland’s competitive position relative to other countries. The basic aim of the report is to highlight needs to improve Ireland’s relative position.
4.20 Ireland’s performance is illustrated by its position in one of four quarters, i.e. countries are grouped in quarters for each performance indicator, with those in the first quarter being the best performing and those in the fourth quarters performing worst.
4.21 With regard to infrastructure Ireland is in the third quarter in terms of time taken to travel to work, the fourth quarter in terms of rail infrastructure and the fourth quarter for road infrastructure. Although we should be careful in interpreting these results due to other factors such as land use patterns and the importance of various sectors within different economies, clearly the overall picture is that of an Irish road and rail network that cannot match the equivalent provision in many competing economies.
61

4.22 A measure of the importance of transport in countries with the best performing economies is the fact that on average these countries spend almost 2.7 times as much as Ireland on such infrastructure.
4.23 Although it is tempting to conclude that the condition of Ireland’s transport infrastructure must be a major factor preventing greater growth this has to be balanced against the fact that Ireland performs significantly better when measured against a number of other economic performance indicators.
4.24 When assessed against all of the indicators Ireland is included equally in the top half of and the bottom half of performance levels. Therefore, given the strong growth in the economy in recent years, and the success in attracting inward investment, there are clearly other factors that have had an overriding importance above transport generally.
4.25 If however, the growth is to be maintained albeit even at a reduced level, Ireland will need to enhance competitiveness in traditionally weak areas such as transport.
Transport and the Changing Economy4.26 Traditional economics pictures the potential investor assessing the pros and
cons, of a number of locations before deciding on where best to invest capital. In a total laissez-faire system, investors would be free to make decisions based on an optimum balance of costs and benefits such as available pool of educated and skilled labour, available supply of raw materials, sources of power, and costs of shipping goods in and out. Other factors being equal, transport costs would be a determining factor in deciding on where to invest.
4.27 In the modern economy many of these factors may no longer seem as relevant as they once where. The interventionist policies of national government agencies are obviously an influence on the market. However, the changing structure of national economies and the importance of the high tech sector, particularly in Ireland, requires a different approach in terms of transport and also communications policy. These new sectors of the economy no longer require traditional supplies of heavy raw materials etc, and therefore are not driven to locate where transport costs are lowest.
4.28 They are, on the other hand, more influenced by the availability of communications, and skilled labour. Therefore transportation costs may become a factor in determining the size of the catchment area for skilled labour, i.e. transport costs will be a consideration for staff. The type of transport also changes with firms requiring fast supplies of components and rapid transport of fragile goods to markets, as they compete on the basis of speed and quality of delivery. In this context effective linkage to well serviced airports become critical.
62
Competitiveness and the Level of Transport Demand and Supply4.29 The concentration of recent success and associated growth in the Dublin region
has led to concerns regarding the potential for the economy to overheat due to a number of adverse pressures. The inadequacy of the transport network in and round Dublin is one of the key factors in this concern, combined with rising demand for housing etc. of which the inadequacy of the transport infrastructure is a primary concern. This inadequacy is solely due to the level of demand being generated by new development.
4.30 There is concern that inefficient or congested transport systems will, in turn, limit the level of demand and that potential growth may go elsewhere. Although a shift in growth to other areas of the country would be somewhat beneficial, and indeed accord with the basic principles behind the emerging National Spatial Strategy, the real concern is that new foreign direct investment would be attracted to other competing countries, and that foreign firms already operating within Ireland would also move elsewhere outside Ireland’s national boundaries.
4.31 Obviously the physical supply of road and rail capacity should be directly related to the actual level of demand for movement. Typically, there is a lag in meeting the demand due to planning and construction periods in providing infrastructure. The availability of spare road and rail capacity also acts to attract inward investors, and encourages internal relocation. Therefore, it will be important to ensure that in line with objectives to shift a significant proportion of growth and investment to the regions of Ireland, similar objectives are in place to improve the capacity and quality of road and rail supply to increase regional accessibility. However, there is a critical balance of timing and resources to be achieved between ensuring that levels of existing demand in the Dublin region are met with adequate supply of road and rail capacity, whilst at the same time developing a sufficient level of quality infrastructure in the regions.
Overview4.32 In general therefore, Ireland’s strong economic growth in the recent past can be
seen to be a factor of various aspects within the economy other than the quality and extent of the transport infrastructure. However, in the future, there will be a need to develop the national transport infrastructure to maintain competitiveness.
63
4.33 Ireland may have grown quickly but to a certain extent the economy started from a worse position than other competing countries. Future growth may level out to the European average now that Ireland has in some regards “caught up” with other economies. Consequently labour market conditions etc may no longer be more advantageous in Ireland (there is already some concern regarding a potential for a labour shortage).
Therefore Ireland’s international competitive position may move towards increasing importance for other factors such as the infrastructure as other factors move to equilibrium within Europe.
4.34 Future transport infrastructure improvements will need to targeted to improving the worst bottlenecks to reduce delays and improve local environments, and also supporting the spread of future growth. Many other European countries have major motorway networks and a more polycentric settlement pattern, but at the same time they also suffer from a more complex matrix of travel patterns and major congestion.
4.35 Ireland’s competitive position will not be improved by the provision of new road capacity alone. The recent example of the UK transport policy in the 1980s and early 1990s shows the failure of opting for new road construction alone, when a broader transportation approach is required embracing other modes and developing integrated land use and transport planning.
TRENDS IN SPATIAL-TIME INTERRELATIONSHIPS4.36 It is important to consider the relative position of Ireland compared to its
competitors, given the scale, location and nature of transport improvements in the UK and Continental Europe. Figure 4.3 illustrates the results of work carried out by the Dutch National Spatial Planning Agency in 1996 showing that to access a catchment of 30million population road freight costs for Irish goods are similar to the costs of transporting goods from areas such as most of central Scandinavia, Greece, and Corsica/Sardinia. However this is a simplistic picture in that it does not take into consideration the relative importance of trading partners.
4.37 Work carried out in the course of this study has attempted to define Ireland’s relative position vis-à-vis transportation of good to a central European location from a number of peripheral cities.
64
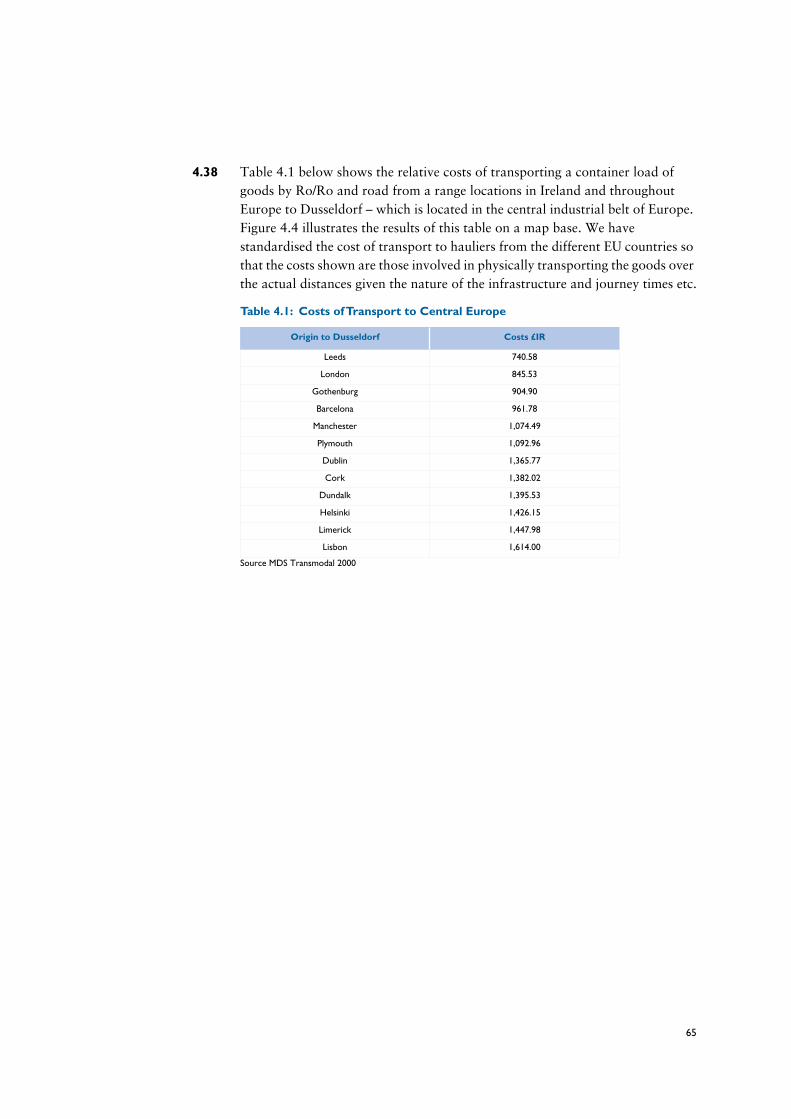
4.38 Table 4.1 below shows the relative costs of transporting a container load of goods by Ro/Ro and road from a range locations in Ireland and throughout Europe to Dusseldorf – which is located in the central industrial belt of Europe. Figure 4.4 illustrates the results of this table on a map base. We have standardised the cost of transport to hauliers from the different EU countries so that the costs shown are those involved in physically transporting the goods over the actual distances given the nature of the infrastructure and journey times etc.
Source MDS Transmodal 2000
Table 4.1: Costs of Transport to Central Europe
Origin to Dusseldorf Costs £IR
Leeds 740.58
London 845.53
Gothenburg 904.90
Barcelona 961.78
Manchester 1,074.49
Plymouth 1,092.96
Dublin 1,365.77
Cork 1,382.02
Dundalk 1,395.53
Helsinki 1,426.15
Limerick 1,447.98
Lisbon 1,614.00
65

66

4.39 Therefore at present transporting goods to central Europe by road from various regional locations in Ireland is relatively cheaper than transporting the same goods from Lisbon or Helsinki. Within Ireland shipping goods with origins in Dublin is the least costly, reflecting the economies of scale available in Dublin.
4.40 The development of the priority TENs projects throughout Europe will largely improve the rail infrastructure of central Europe bringing these States closer together in terms of journey times. Figure 4.5 shows how the map of Europe will be “distorted” by the changes in journey times to be achieved through improvements to the rail network in Central Europe. In effect these changes will substantially benefit Central European States through reductions in journey times, have a limited effect in the UK and cause virtually no change in journey times from Ireland to the UK and the EU.
4.41 Irish traffic will however benefit from the reduction in journey time within the UK, given the volume of trade with destinations in the UK and using the UK as a landbridge to continental Europe. Journey times in Britain will also be further improved due to the construction of major road schemes to relieve main bottlenecks. The proposals contained within the National Development Plan and the DTO Strategy will effectively reduce journey times in Ireland improving access to key ports and airports.
4.42 It is important to note that in spite of the time savings achievable through the above infrastructural improvements there will only be a marginal effect on current patterns and practices in transporting goods to/from the UK and Continental Europe by Irish Hauliers. The basic pattern of transport is based on a system which is dictated by other constraints such as drivers hours, ferry timings, opening hours at origins/destinations etc, which translates into a relatively simplistic timeframe for operations of Day 1 Ireland, Day 2 UK, Day 3 Continental Europe as shown in Figure 4.6a & 4.6b. The main benefits will be in reducing the number of unforeseen delays that would be encountered on a journey.
Operators will also benefits from improvements in logistics and improvements will also be critical in a competitive trading environment.
67

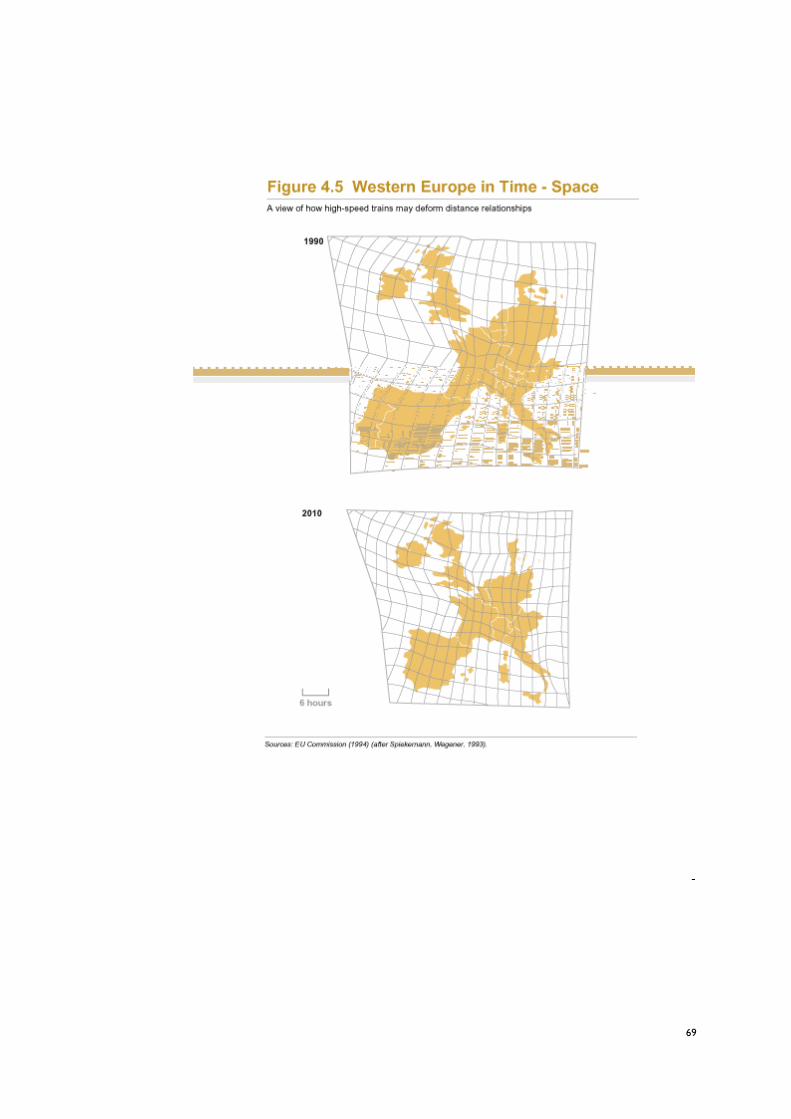
69

4.43 Figure 4.7 below compares journey times from Dublin airport and a number of other airports in peripheral areas of Europe. Irish business travellers wishing to access key European destinations are not disadvantaged compared with those for travellers using Oslo, Glasgow or Copenhagen. Dublin compares well in terms of flight frequency.
4.44 However Dublin performs less well in terms of punctuality. On average over 25% of all flights via Dublin were delayed for more than 15 minutes during the second and third quarters of 2000. Therefore whilst flight accessibility via Dublin performs reasonably well, journey time reliability does not, particularly when additional factors such as quality of taxi service etc are considered.
70
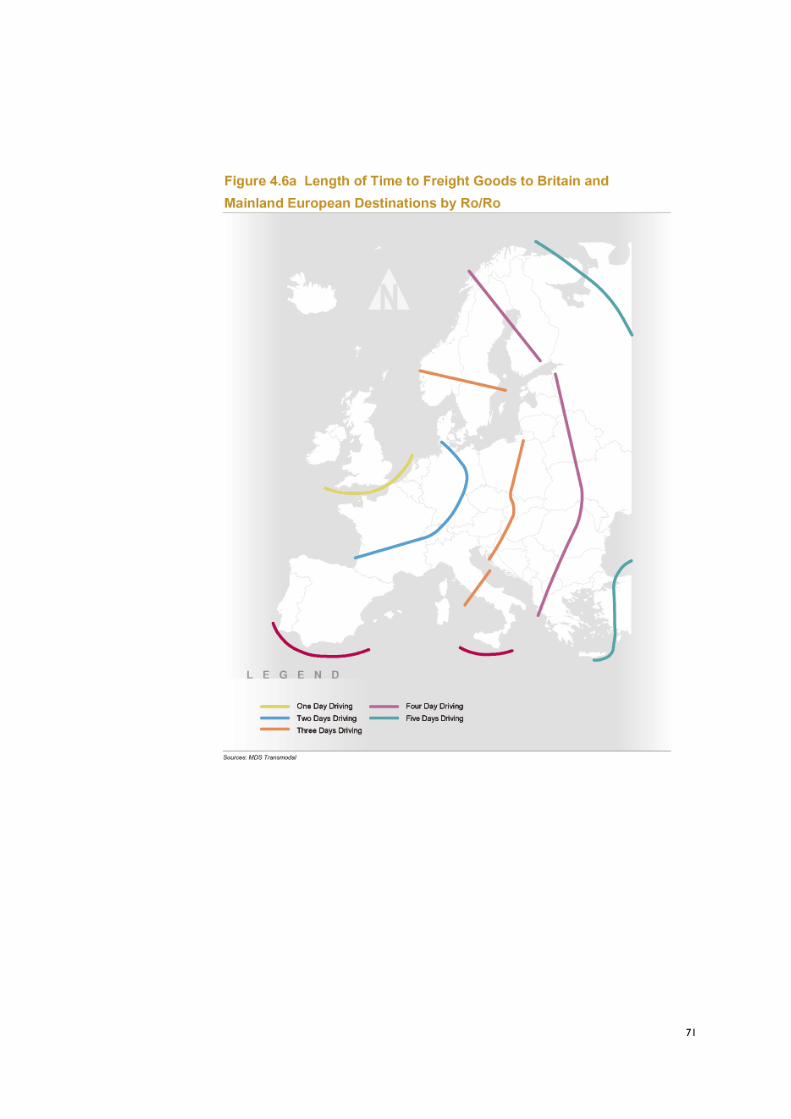
71

72
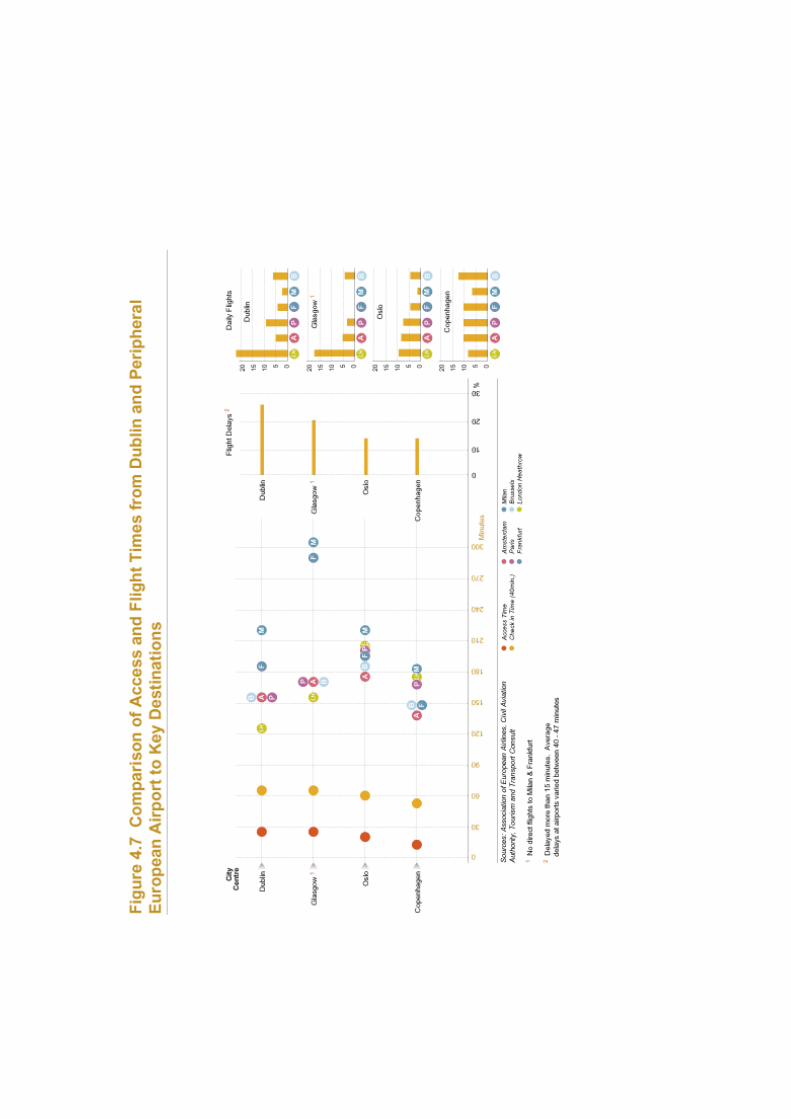

74
5 IRELAND AND THE EU – TRENDS AND ISSUES FOR SECTORAL POLICY
5.1 Forfás have shown in their document “Enterprise 2010” that employment in internationally traded services has grown fivefold from 9,600 in 1989 to over 46,000 in 1998. This sector includes information and telecommunications, software, training, financial, healthcare and design and entertainment services. This sector has provided high income and high value added employment. It is envisaged that this sector will make an increasingly important contribution to future levels of growth as services become more economically and easily facilitated by electronic commerce. Informational technology and internationally traded services sectors have significantly different transportation needs compared to traditional industry.
5.2 Forfás also note that Manufacturing has accounted for most of the increase in exports from Ireland. Some 80% of these exports originate from foreign owned firms with indigenous firms showing lower but growing levels. Forfás note that this will mean that Irish indigenous exports will continue to be vulnerable.
5.3 Over time global trends may mean that the sectors that are currently a major element of the Irish economy such as electronics, software, healthcare and food will be subject to significant change. Production of goods even today’s high technology goods, will inevitably be drawn to low wage economies across the world. This will mean that developed economies will concentrate on areas that require more sophisticated skills in research and development etc. Other factors such as GM foods will impact on the food production sectors, and the potential for biotechnology and DNA based procedures will change the manufacture of healthcare products etc.
5.4 In terms of locally traded services, such as transport and business services, and to a certain extent tourism Enterprise 2010 states that although this sector has been responsible for the bulk of employment growth in recent years, productivity has been low and growth relatively slow.
5.5 In general Ireland has had a historical difficulty compared to other larger, more developed EU countries, in that it has been more dependent on external trade to promote economic growth. However, its relatively peripheral location means that companies which trade on the Continent have to transport products over considerable distances, cross one if not two expanses of water, synchronise journeys with ferry timetables and meet the requirements of regulations on driving hours.
75
5.6 Besides these physical constraints on trade, economic development literature also emphasises the importance of face to face contact as a means of acquiring business information, stimulating ideas and solving problems. Distance from key markets can impose disadvantages that advances in new communications technologies cannot always overcome. These disadvantages can be particularly important in the case of indigenouslyowned businesses which lack the formal and informal information networks possessed by multinational businesses.
5.7 The recent review of competitiveness shows that Ireland performs well in terms of its capability to export goods and move people through its ports and airports. However, relatively low infrastructural investment compared to other EU countries has meant that the rapid economic growth achieved in the last few years has put a strain on airport and port capacities.
5.8 Some of the main elements of the manufacturing sector within the Irish economy are set out below combined with an indicative assessment of the effects of the different transport requirements for each element. Evaluation of the requirements for the stronger sections of the manufacturing may point to the areas of concern
Time5.9 Time taken in delivery of finished products and components is one of the key
considerations in manufacturing industry, and particularly within the more high tech sectors. Time is often a crucial element of competition with firms aiming for quick deliveries throughout Europe and the rest of the world.
5.10 Time is an important factor for firms involved in a wide range of manufacturing such as production of, office computers and data processing equipment, some pharmaceutical products, dairy produce, parts and accessories for motor vehicles, telecommunications and electrical equipment, and fresh meat products.
5.11 Another significant sector where time is a key consideration is the production of motor vehicle parts and accessories. Speed of delivery has been one of the crucial elements of the automobile industry in recent years. The worldwide competition and the adoption of Japanese “Just in Time” delivery techniques has meant that large manufacturers demand that suppliers are quick to respond to increase/decreases in the volume of goods produced and transported. Irish products are normally transported mostly to the UK and Northern Europe. In this sector Ro/Ro facilities are utilised either by container lorries or by specialist freight forwarders using smaller vehicles.
5.12 In the telecommunications sector Irish products are forwarded to industrial users in markets mostly in Europe and the USA. Normally time is of greater importance than, the cost of delivery as goods are often fragile and require special handling. The use of airfreight may also be warranted in this sector, if the goods are of sufficiently high value.
76

5.13 With regard to the production of office computers and data processing equipment in Ireland the main markets are in northern Europe, with the UK being an important destination. Again time is a major factor as there is often competition between firms on servicing orders quickly. Although the use of heavy goods vehicles using Ro/Ro facilities would be the norm, there is also a need to utilise specialist delivery firms where smaller faster shipments are concerned. Again quality of transport may take precedence over costs depending on the nature of the goods.
5.14 The production of some short life or high value pharmaceutical products may also require the use of specialist courier firms etc as goods may be low volume and be required urgently for medical reasons. Europe would be the main destination for these goods exported from Ireland.
5.15 Some dairy produce have a very short shelf life and require use of specialist containers with delivery,(mostly to the UK and northern Europe) within 24 to 48 hours.
5.16 Many food products manufactured or processed in Ireland are not particularly time sensitive. Mostly these goods are transported in containers using Lo/Lo facilities to the UK and northern Europe. Cost not speed is the main concern, although reliability is an important factor ensuring that companies can make robust assumptions regarding delivery times etc.
Distance to Markets5.17 The Irish manufacturing sectors’ main market is largely concentrated in the UK
and northern Europe. Where distances are long, such as trips by road through the UK to northern Europe, the savings on time afforded by use of facilities such as the Channel Tunnel for trips between Ireland – UK and Europe are relatively low. Distance via the UK to Europe may not be sufficiently long to merit utilisation of the developing UK rail freight terminal network. There is a balance to be struck between the location to be served, reliability, the volume of goods to be transported, the type of goods and the urgency of the delivery. However given the fact that Ireland’s main export markets are located within 24 to 48 hours by surface transport there are few cases where the distance to be covered is a major factor for any manufacturer.
77
Reliability5.18 Where goods are being transported to markets outside Ireland, reliability of
service is an important consideration. A manufacturer needs to establish robust and dependable methods of transporting goods so that the transport time can be built into production processes and customers develop confidence in a suppliers ability to service their needs. Reliability can be an issue where land bridge through the UK is used. Congestion on the UK road network can increase costs through time penalties. The time taken affects a driver’s ability to operate a HGV continuously due to regulations, and there is a need to co-ordinate the use of two ferry connections. Reliability is important for all sectors of Irish manufacturing industry in attempting to access markets in the UK and mainland Europe.
Fragility5.19 The nature of the goods to be exported may require consideration of the ability
of certain methods of transport to ensure that goods arrive at their final destination in good condition. This is important where the goods are high value and low density – such as in the production of office computers, or medical pharmaceutical supplies. In these cases goods will normally be transported by specialist express delivery firms where the integrity of the product can be maintained.
Capacity/Cost5.20 Where goods are produced in greater quantities and there is a relatively low value
to weight ratio then manufacturers will use Lo/Lo facilities to access UK and European markets. It is relatively uncommon for the production of bulk goods to be tied to just in time delivery practices given the scale of the production processes and techniques involved. The production of bulk goods such as basic industrial chemicals, some food products, and mass-produced pharmaceutical products require high capacity load facilities and/or tanker carriers depending on the nature of the material. The main criteria is that materials can be transported in sufficient capacity to make use of economies of scale and that the routes provided are reliable. These matters are of greater importance than speed of delivery.
Imports5.21 Another aspect of ensuring the competitiveness of the Irish manufacturing sector
is the ability of firms to access imports of raw materials and components. Many of the factors affecting exports will be similar to those affecting the ability of firms to secure regular imports of goods etc. e.g. the presence of congestion on main land bridge routes. However an important consideration must be the nature of Irelands internal transportation infrastructure. The need to develop a more efficient distribution network on European standard roads will become increasingly important as Ireland continues to attract firms involved in the production of high value goods.
78

Service Sector5.22 If the economy continues to attract firms involved in the provision of services,
and telecommunications etc the quality of the transport infrastructure will be important in terms of attracting labour supply. An efficient public transport and road network will increase the catchment area available to firms and therefore increase the available labour pool. This will become an important consideration as a more dispersed pattern of development is promoted with firms being encouraged to locate outside Dublin in other areas of the country.
5.23 In general therefore there is a complex relationship between cost of transport, the quality of transport and the speed of delivery, that leads decision makers in the industry to make choices of mode best suited to the requirements of their sector of the economy.
5.24 The importance of the cost of transport is dependent on the nature and value of the goods, combined with the distance to be covered to reach markets, and the efficiency of the mode of transport employed. Quality is also a factor in the decision making process depending on the fragility and perishability of the goods. Speed can also be a crucial factor where just in time delivery practices are important and where firms are competing on speed of delivery etc.
ISSUES FOR SECTORAL POLICY5.25 The growth in employment and output has largely been in the enterprise sector,
and specifically the internationally traded services sector. Both manufacturing and internationally traded services have increased output per employee. Ireland has specifically developed as a key location for USA business in these sectors seeking to establish a European operation.
5.26 However Forfás have noted that infrastructural development has not kept pace with recent economic growth. This has been most evident in national concern regarding traffic levels in urban areas and in rising house prices. However the Information Technology and Internationally Traded Services Sectors have different transport needs form traditional manufacturing’s transport needs. These sectors require improvements in transport in its broadest sense including transportation of information and communications technology. Deficiencies in these needs could impact negatively on the competitiveness of technology-based sectors and stifle ability to attract new enterprise or indeed encourage indigenous start-ups in these sectors.
5.27 Surface transport developments will have only marginal influence on the performance of Ireland in the Internationally Traded Services Sector and similar sectors that have a high need for Information Technology. These sectors are normally attracted by a range of other factors of which transport is only one, more important factors include the availability and supply of skilled labour, labour costs, quality of communications technology, and the range of incentives available.
79

5.28 Firms in the internationally traded services sectors often produce little in the way of goods that can be transported by traditional methods, and those firms in high technology goods manufacturing produce low bulk, high quality products. If economic policy continues to be aimed at attracting hi-tech firms, surface transport trends will not be a major influence on business location decisions. Surface transport will be more important in ensuring that a wide catchment area is available from which labour can be drawn.
5.29 Air transport is likely to play a significant role in the information technology/internationally traded services sectors. The previously demonstrated growth in air travel is likely to be further increased by an economic policy aimed at encouraging high technology firms to locate in Ireland. Air transport is utilised for freight movement in this sector, as the goods are often low bulk, high value and as previously stated firms are often competing on delivery times – so speed is important. Direct movement of goods by dedicated express carriers also has reduced potential for unforeseen delays due to the relatively short journey times compared to surface transport – although even a small delay may have a greater effect. Air transport is also important in providing access to regional locations for executives and senior personnel. The role of air travel for these sectors is such that the provision of regional airports will continue to be a significant factors in increasing the “market accessibility” of regional areas.
5.30 Those sectors of Irish industry that rely heavily on the UK market and on the UK as a landbridge for access to Europe may benefit from policies in the UK aimed at reducing congestion. Journey times with and through the UK will be reduced but the main potential benefits will be achieved through a reduction in unforeseen delays in congested urban areas. However these benefits may be substantially reduced if the UK Government implements restraint measures designed not only to reduced traffic volumes but also to increase the competitiveness of UK based hauliers over their Irish and Mainland European counterparts.
80

6 KEY IMPLICATIONS FOR SPATIAL POLICY
KEY FINDINGS6.1 The Role of Dublin - Analysis suggests that based on current trends and
investment programmes Dublin will not only continue to be the main European gateway, both by sea and air and for freight and passengers but is likely to increase in importance in the future. The primary role of Dublin derives from the importance of the central corridor which passes through the UK. In terms of passenger numbers this corridor provides the most important conduit of business travel, with London being an important destination in its own right but also as a hub to further travel. In addition a substantial proportion of Ro-Ro freight is carried on this corridor to UK and mainland European destinations.
6.2 Forecast Capacity Problems at the Ports of Dublin and Cork – At Dublin Port forecasts levels of Ro/Ro traffic are expected to exceed demand by 2007. Lo/Lo traffic capacity problems may be expected at Dublin Port soon after the ten year period as demand approaches capacity by 2010. No capacity problems are expected at Cork for Ro/Ro traffic over the next ten years, however capacity problems are expected for Lo/Lo traffic by 2004. There are no capacity problems forecast for Rosslare even though capacity is expected to remain constant over the ten-year period. At Dun Laoghaire demand is expected to closely match present levels due to the existing capacity limit enforced for local environmental reasons. No Lo/Lo capacity problems are expected at Drogheda and similarly capacity problems are not envisaged at Waterford where supply should comfortably exceed demand by 2010.
6.3 Forecast Capacity Problems at Dublin Airport - Improvements at Dublin Airport to accommodate some 20 million passengers will be insufficient to cater for the 25.6 million passengers forecast for 2010. Shannon airport’s capacity of some 4 million passengers per annum should be capable of accommodating the forecast demand of some 3.2 million passengers in 2010. At Cork airport the proposed increase in capacity to cater for some 3.5 million passengers will be more than sufficient to accommodate the forecast demand of 2.7 million in 2010.
6.4 Operators use of Central Corridor is relatively inelastic - The central role, and related forecast capacity problems of Dublin port and airport facilities is also reinforced by the desire of carriers to centralise their operations in order to obtain the benefits of economies of scale. Clearly there are key logistical and economic factors at work which will ensure future role of existing Dublin port and airport facilities. At present the economies of scale available at Dublin Port are such that the cost of transport can be borne by carriers and hauliers, which creates a considerable inertia effect limiting the development of alternative port facilities, particularly when combined with the level of start up investment required. There is little scope for further expansion at Dublin port without
81

6.8 The current problems experienced by Ireland’s transportation infrastructure are indicative of the level of economic success – Growth in levels of car ownership, increasing journey lengths and higher numbers of goods traffic have been typical characteristics of economies that have experienced rapid growth throughout the world. Traffic problems are present in most developed economies particularly in major urban areas within those countries. There is potential to learn from other economies (such as Holland) how to develop a strategy aimed at increasing capacity for all modes, adopting a multi-modal approach to passenger transport and developing integrated transport and land use planning policies.
6.9 The rapid growth in the economy has meant that demand for travel has been generated rapidly over a short period – Rapid growth in the economy coupled with rapid growth in demand for transport creates problems in any transport network where there is limited capacity. Inevitably due to the length of “lead-in” time required for major infrastructure projects to increase capacity, there will continue to be problems in the short term. These problems may continue into the medium term given disruption due to construction on such a scale.
6.10 Ireland compares well with other EU countries in accessing key markets – Ireland’s key market is the UK, and there is currently no evidence that the volumes and value of trade between Ireland and the UK will change substantially over the next ten year period. Other peripheral EU States may have different key trading partners to Ireland therefore continental transport improvements will not necessarily threaten Ireland’s competitive position vis-à-vis competing countries attempting to increase their share of the UK market.
6.11 UK transport policies will impact on Irish Traffic – UK transport policies aimed at developing restraint measures, (particularly proposals such as congestion charging and road tolling) to reduce the impact of goods movement by road and reduction in urban congestion etc, will affect all external freight operators transporting goods to/from the UK. However given the volume of imports/exports between the UK and Ireland and the role of the UK as a landbridge for goods traffic to/from Europe, a greater percentage of Ireland’s trade will be effected by these changes than other EU States. Irish producers and hauliers may become less competitive when compared to UK competitors. At the same time, however there may be limited benefit to Irish Ro/Ro traffic if these polices are successful in the longer term and substantially relieve the currently congested parts of the road network.
6.12 The key role of Internationally Traded Services – The key employment growth area for Ireland in the future is in Internationally Traded Services (ITS). These have substantially different physical transport needs compared to traditional manufacturing with little demand for the transport of bulk goods.
6.13 Effect of ITS sector growth on transport patterns – Growth in the information technology and internationally traded services sectors will translate into growth in demand for air freight and effective air access to Ireland and the regions.
83

6.14 Central EU States will benefit from planned improvements to roads and rail infrastructure – The benefits to EU States of the improvements contained in the TENs programme will have comparatively minimal effect on Ireland’s competitive position given that most Irish trade is with the UK. Also the competitive effects will be further reduced by predicted growth in Internationally Traded Services which are not as sensitive to transport costs as traditional manufacturing industry.
6.15 Irish Freight will continue to have a preference for Ro/Ro – The trend for increasing use of Ro/Ro for freight transport is set to continue over the next ten year period. This trend is due to the cost efficiencies and flexibility offered by this mode. Freight transport by Lo/Lo and rail does not have these advantages. Substantial enhancement of rail facilities will be necessary to address this issue although the costs involved may be prohibitive without some form of intervention.
IMPLICATIONS FOR POLICY
Implications for the National Spatial Strategy6.16 A dispersed pattern of development will assist problems at Dublin to a limited
extent – Ensuring the maximum level of population growth at regional centres rather than Dublin would assist in relieving pressure on Dublin’s ports and airport infrastructure. However it is envisaged that unless substantial additional investment to increase capacity is secured, problems will continue to be encountered at Dublin over the next ten years, and there will be an excess demand for air travel nationally. Carrier economies of scale will also dictate that the market will continue to strive for operations via Dublin.
6.17 Regional Centres will require good connections to Dublin – Regional Centres are unlikely to develop as international transport hubs between Ireland and the UK/EU. However these gateways will play a key regional transportation role in providing of local accessibility and alternative corridors.
6.18 Gateways will benefit from the continued provision of a regional airport facility – the presence of a regional airport will be an important factor in the success of Regional Gateways. A regional airport can promote an enhanced perception of market accessibility in outlying regions for potential inward investors and is therefore a strong marketing asset.
6.19 Regional airports will continue to play an important role – in the high value sectors there is increasing use of executive jets for key personnel, and high technology sector industries will seek to utilise fast delivery systems through airfreight for low bulk high value goods.
84
6.20 Gateways should make best use of regional port and airport facilities – in developing strategies for the enhancement of regional gateways and seeking to attract inward investment regional Gateways should promote the availability of regional airport connections, seek to enhance airport facilities and maintain and develop strong connections with the Dublin and European Hubs.
6.21 Ireland has only limited potential to significantly increase use of rail freight – in Ireland the full potential of utilising rail as a mode for the transportation of goods is restrained for a number of reasons that combine to reduce its attractiveness without some form of intervention. Irish traffic will therefore be unable to take full advantage of the changes in EU/UK transport policy and programmes. Increased use of freight would require a major programme of expansion of intermodal rail freight facilities at ports.
Implications for Domestic Investment6.22 Forecasts show a need for further investment at Dublin Airport – given the
forecast level of demand for air travel via Dublin airport and the proposed capacity at the Airport there will be excess demand of over 5.5 million passengers by 2010 unless there is a substantial increase in passenger handling capacities.
6.23 The majority of demand for air travel will continue to concentrate in Dublin – even if some demand is transferred from Dublin airport successfully to utilise spare capacity at Shannon and Cork there will continue to be unmet demand nationally for some 4 million passengers. It is clear therefore that there will continue to be substantial demand for movement via the central corridor through Dublin airport.
6.24 Investment is needed at Dublin Port for Ro/Ro capacity and at Cork for Lo/Lo capacity; Ro/Ro traffic is expected to exceed capacity at Dublin Port by 2007, and by the end of the decade demand will exceed supply by 144,000 trailers. Lo/Lo capacity problems are expected at Dublin Port soon after 2010 as demand approaches the level of capacity towards the end of the decade. Lo/Lo demand at Cork is forcast to exceed capacity as early as 2004, and by 2010 container numbers will exceed capacity by 29,486 containers per annum.
6.25 Inelasticity of operator/carrier demand for transport via Dublin Port - there is potential for limited transfer to other ports such as Ro/Ro traffic to/from Rosslare however operator’s demand for the use of Dublin Port is inelastic, largely due to economies of scale.
6.26 Fiscal measures will be required to make rail a more attractive option for the transportation of goods in Ireland – If railfreight was a more viable option for transporting goods to/from/within Ireland, there may be potential to utilise some of the railfreight systems currently being developed in the UK and continental Europe. However at present rail freight is not a competitive option given the advantages to operators of Ro/Ro. Railfreight operations also have to pay full costs of network infrastructure, whereas for road transport road construction is
85
generally not a direct cost. Transportation by rail will not be a normally be viable option for IT/ITS sectors where speed of delivery is a crucial factor, given factors such as frequency, interchange transfer facilities etc.
6.27 The NSS can play an important role by strengthening demand for regional ports and airports – The aim of the National Spatial Strategy to distribute predicted growth from Dublin to the regional Gateways will develop a enhanced population catchment in the regions and create more business opportunities for regional airports and port. Operators may be attracted to operate via regional ports and airports if there is sufficient business available within the catchment of the facility and the service reaches a viability threshold.
6.28 Targeting the NDP programme of infrastructure improvement would have greater benefits for road hauliers in the short term - In order to achieve maximum benefits for surface transport of goods in Ireland in the short term, consideration should be given to placing increased emphasis on relieving existing pinch-points, such as town centres and poor junctions and priorities these in the NDP infrastructure improvement programme.
Implications for EU Investment /Policy6.29 Irish transport needs should be highlighted through the European Commission
and the Council of the Isles with the UK – Ireland’s peripheral location in Europe, and the nature of its trade patterns may mean that Irish transport needs do not have sufficient profile in Europe. In the UK there may also be little recognition of Ireland’s transport needs when developing and implementing new transport policies. For example Ireland’s competitive position could be adversely affected by emerging measures to assist UK based hauliers such as the recently proposed tax on foreign carriers operating via UK roads. There is potential for increased awareness of Ireland’s transport needs generally and particularly within the EU with the implementation of the TENs network and through the Council of the Isles with the UK.
6.30 Irish transport will largely be reactive to changes in European and Global trade patterns and infrastructure improvements and opportunities to benefit from investments elsewhere should be tracked and optimised - Given Ireland’s relatively low volume of trade when compared to European volumes, Ireland is unlikely to become a key driver of changes in transport policy within Europe. Therefore it is considered that the best way forward would be for Ireland to maximise benefit from investments elsewhere, through monitoring European transport developments and implementing examples of best practice as appropriate, such as in the area of telematics. At present two proposals are being developed by the National Roads Authority to substantially enhance the level of information available on to freight operators. INSTANT is an EU funded project currently at feasibility study stages. This project will provide multi-modal pre-trip information, allow more informed choice of route and modes for transporting freight. It is also envisaged that this project will lead to the
86

development of a system that can be utilised via on board computers in driver’s cabs to allow access to real time information and allow more informed decision making on routing etc. Initially this project be concentrated on the Belfast /Dublin corridor. A project known as STREETWISE is currently the subject of a funding application to the EU. This project is being developed by the NRA in conjunction with the Highways Agency in England, and is aimed at providing similar information but extended to cover all of England, Wales, Scotland, Northern Ireland and the Republic of Ireland, plus additional information on port and ferry information. Clearly this STREETWISE system will be of substantial benefit to operators making trips to the UK and utilising the UK as a landbridge to continental Europe.
6.31 Road transport will continue to figure prominently in Ireland’s trade - in raising the profile of Ireland transport needs the continuing importance of road transport to Ireland’s trade (and its difficulties in transferring to rail based systems) should be highlighted in EU transport policy. There is limited potential for a more innovative approach to freight movement by rail in Ireland given the pattern of development, the volumes and types of goods, the requirements for rail operators to justify fully all costs and benefits for establishing a service.
6.32 Improvements to Ports and Airports should form part of a co-ordinated “corridor” strategy - Proposals for unilateral improvements to ports and airports should be avoided, enhancements should be linked to an overall “spatial strategy for movement” providing for effective movement between Ireland and all its trading partners.
87

88

Appendix 1 - National Infrastructure
AIRPORT LOCATION AND ACCESS1.1 This section provides information on the locations of the three major Aer Rianta
airports and the main regional airports. Additional information is also provided on existing access arrangements.
1.2 Aer Rianta, is the state body responsible for the operation of the three main airports in the republic of Ireland, Dublin, Cork and Shannon. There are also several other smaller airports operating in Ireland in private ownership offering a limited range of services.
Dublin Airport
Location Dublin Airport is situated to the north of the city approximately 10 kilometres from the city centre. It is positioned on the fringe of the built up area of the city which is bounded by the M50 motorway. The airport is within the administrative boundary of Fingal County Council.
Road Access Access to the Airport is provided via the M1/N1 which provides a dual carriageway standard link direct to the City Centre to the south and to Belfast in the north. The M1/N1 is also linked to the M50 via a grade separated interchange. The M50 motorway provides an almost total orbital route around Dublin connecting to a series of radial National Primary Routes giving nationwide access.
Bus/Coach/Taxi Access There are regular bus services provided to the Airport by Dublin Bus, providing a public transport link direct to the city centre. Year round expressway coach services are also provided by Bus Eireann. There are also a number of coach and minibus services provided by hotels and charter companies. Taxis also operate to/from the airport providing a direct service to a required destination.
89

Rail Access Dublin Airport does not presently benefit from a direct rail service. The DART services operate on a coastal track to the south and east of the Airport. The existing heavy rail line also passes to the east of the Airport using a coastal route to link Dublin and Belfast.
Shannon Airport
Location Shannon Airport is situated to the immediate west of the town of Shannon on the north banks of the Shannon Estuary approximately 15 km to the north west of Limerick City. The Airport is approximately 18km south of Ennis. The airport is within the administrative boundary of Clare County Council.
Road Access Access to the Airport is provided by the N19 which links to the N18 to the north east of the airport and provides a link between Ennis and Limerick. The N18 provides a mostly dual carriageway standard road between the Airport and Limerick.
Car Parking Car park facilities are provided on site to the south of the main passenger terminal building. Bus/Coach/Taxi Access There are regular year round expressway coach services provided to the Airport by Bus Eireann, to Limerick and Ennis These services are supplemented by a network of local buses. Taxis also operate to/from the airport providing a direct service to a required destination.
Rail Access Shannon Airport does not benefit from a direct rail service. The nearest stations are located in Limerick and Ennis which both around 20km from the Airport. The existing heavy rail line runs north west/south east serving Ennis/Limerick and bypasses the airport some 8km to the northeast.
Dublin Airport (continued)
90

Cork Airport
Location Cork Airport is situated approximately 6km directly south of Cork city centre, and some 2-3km beyond the built up area of the southern fringes of the city. The airport is within the administrative boundary of Cork County Council.
Road Access Access to the Airport is provided by the N27 which links directly to Cork city centre. The N27 is dual carriageway standard between the city centre and the junction with the N28. The road is dual carriageway from this junction to the Airport. Car Parking Car park facilities are provided on site to the east of the main passenger terminal building.
Bus/Coach/Taxi Access There are regular year round expressway coach services provided to the Airport by Bus Eireann. These services are supplemented by a network of local buses. Taxis also operate to/from the airport providing a direct service to a required destination. Rail Access Cork Airport does not benefit from a direct rail service. The nearest station is located at Kent station in central Cork.
Donegal Airport
Location Donegal Airport is situated in a rural location at Carrickfinn to the west of Bunbeg in north western Donegal. The nearest large settlement is Letterkenny some 45km to the east. The airport is within the administrative boundary of Donegal County Council.
Road Access Access to the Airport is provided by the R259 which provides a single carriageway coastal route to Dunglow in the south. Due to local topography access to Letterkenny is via a circuitous route through the Derryveagh mountains on the R251
91
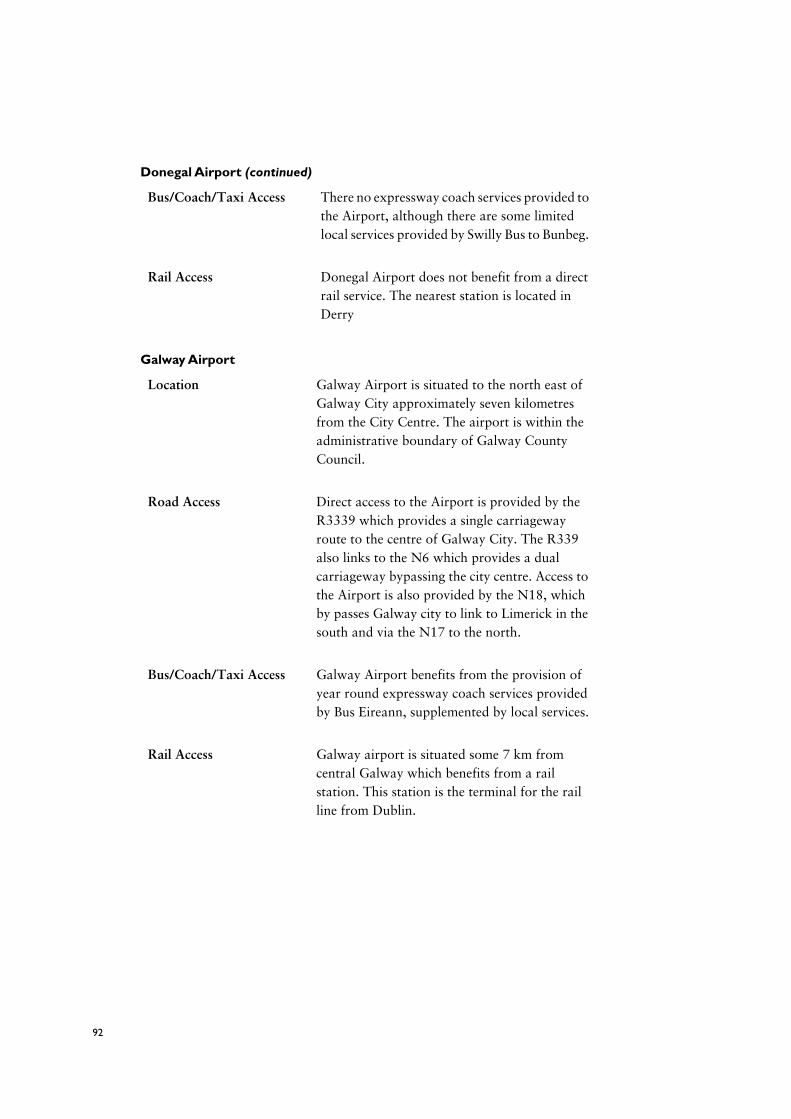
Bus/Coach/Taxi Access There no expressway coach services provided to the Airport, although there are some limited local services provided by Swilly Bus to Bunbeg.
Rail Access Donegal Airport does not benefit from a direct rail service. The nearest station is located in Derry
Galway Airport
Location Galway Airport is situated to the north east of Galway City approximately seven kilometres from the City Centre. The airport is within the administrative boundary of Galway County Council.
Road Access Direct access to the Airport is provided by the R3339 which provides a single carriageway route to the centre of Galway City. The R339 also links to the N6 which provides a dual carriageway bypassing the city centre. Access to the Airport is also provided by the N18, which by passes Galway city to link to Limerick in the south and via the N17 to the north.
Bus/Coach/Taxi Access Galway Airport benefits from the provision of year round expressway coach services provided by Bus Eireann, supplemented by local services.
Rail Access Galway airport is situated some 7 km from central Galway which benefits from a rail station. This station is the terminal for the rail line from Dublin.
Donegal Airport (continued)
92

Kerry Airport
Location Kerry Airport is situated 13 km to the north of Killarney and adjacent to the village of Farrafore. The Airport is within the administrative boundary of Kerry County Council.
Road Access Direct access to the Airport is provided by the N23 which provides a single carriageway route to the centre of Killarney in the south and links to the N21 in the north giving access to Limerick. The N22 passes within 1km of the west of the airport providing a link to Tralee approximately 15km to the northwest.
Bus/Coach/Taxi Access Kerry Airport benefits from the provision of year round expressway coach services provided by Bus Eireann, supplemented by local services..
Rail Access Kerry Airport has the benefit of being located within 1km of Farranfore railway station. This station has services to Killarney/Cork and Tralee.
Connaught/Knock Airport
Location Connaught/Knock Airport is situated 5km to the east of the town of Swinford and some 50km south west of Sligo. The Airport is within the administrative boundary of Mayo County Council.
Road Access Direct access to the Airport is provided by the N17 which provides a single carriageway route to the Sligo in the north and Galway in the south.
Bus/Coach/Taxi Access Connaught/Knock benefits from the provision of year round expressway coach services provided by Bus Eireann.
93
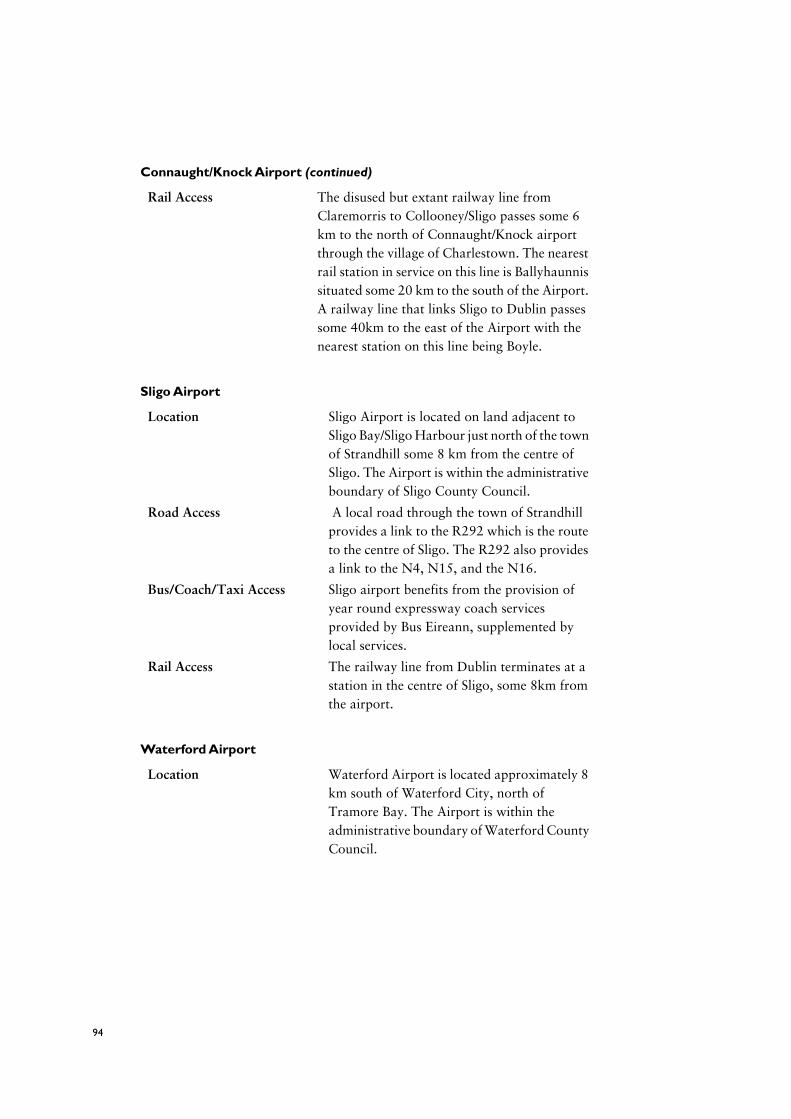
Rail Access The disused but extant railway line from Claremorris to Collooney/Sligo passes some 6 km to the north of Connaught/Knock airport through the village of Charlestown. The nearest rail station in service on this line is Ballyhaunnis situated some 20 km to the south of the Airport. A railway line that links Sligo to Dublin passes some 40km to the east of the Airport with the nearest station on this line being Boyle.
Sligo Airport
Location Sligo Airport is located on land adjacent to Sligo Bay/Sligo Harbour just north of the town of Strandhill some 8 km from the centre of Sligo. The Airport is within the administrative boundary of Sligo County Council.
Road Access A local road through the town of Strandhill provides a link to the R292 which is the route to the centre of Sligo. The R292 also provides a link to the N4, N15, and the N16.
Bus/Coach/Taxi Access Sligo airport benefits from the provision of year round expressway coach services provided by Bus Eireann, supplemented by local services.
Rail Access The railway line from Dublin terminates at a station in the centre of Sligo, some 8km from the airport.
Waterford Airport
Location Waterford Airport is located approximately 8 km south of Waterford City, north of Tramore Bay. The Airport is within the administrative boundary of Waterford County Council.
Connaught/Knock Airport (continued)
94

SEAPORT LOCATION AND ACCESS1.3 This section provides information on the location of existing major seaports in
Ireland together with an overview of existing access arrangements.
Road Access The R708 provides access from the Airport to the centre of Waterford. This road is single carriageway standard. At the city centre national primary routes can be accessed including the N25 to Cork in the West and New Ross in the east, the N24 to Clonmel and Limerick and the N9 to Kilkenny and Dublin.
Bus/Coach/Taxi Access Waterford Airport benefits from the provision of year round expressway coach services provided by Bus Eireann, supplemented by local services.
Rail Access The rail station on side of the river Suir in central Waterford provides the nearest link to the National Rail network.
Dublin
Location The Port of Dublin is located at the mouth of the river Liffey in east central Dublin. The port is operated by Dublin Port a State Port Company.
Road Access Access to the National Primary Route network is via the R131 and R101 on the north side and the R131 on the south side. The R131 provides a route over the River Liffey via a toll bridge.
Rail Access Rail access is provided to the northside of the River Liffey. There are three main branches providing rail freight facilities on the northside. There is no rail access to the southside where the main international/deep sea container handling facilities are located.
Waterford Airport (continued)
95

Dun Laoghaire
Location Dun Laoghaire port is located within the greater Dublin area within Dun Laoghaire-Rathdown Council’s area. The port is operated by a State Port Company.
Road Access Access by road is via the N31 which joins the N11 to provide direct access to central Dublin to the north west and south to Wicklow and Rosslare.
Rail Access Dun Laoghaire Port has the benefit of an adjacent station for DART services to central and north Dublin. This facility is a passenger operation. There are no rail freight facilities at this port.
Rosslare
Location Rosslare Harbour is located to the south east of the town of Rosslare. The port is operated by Iarnrod Eireann.
Road Access Access to the port is provided by the N25 which links the port to New Ross/Waterford and Cork. The N25 also links to the N11 which is the main route from the South East to Dublin.
Rail Access Rosslare benefits from having a passenger rail station which serves the port. This station is the terminal for the rail line between Dublin and the South East, and the line from Waterford to the west. No rail-borne freight is handled at Rosslare
Cork
Location The port of Cork includes the Ro/Ro facility at Ringaskiddy to the South east of Cork City. This facility serves ferry traffic to/from Wales, and north western France. There are also areas of Docks on the banks of the River Lee in the centre of Cork city. The port of Cork is operated by a State Port Company.
96

Road Access The Ro/Ro facility is served by the N28 which provides a link to central Cork city. The central quays are served by the N8.
Rail Access The Ro/Ro facility does not benefit from rail access. The city quays are adjacent to Kent station the main station for Cork City. Rail connections to Tivoli have recently been disconnected.
Drogheda
Location The port of Drogheda is located on the river Boyne at Quays to the east of the town. A new deep water quay is being developed at the mouth of the Boyne at Roe’s Point.
Road Access Road access to the port is via the R167 which gives access to the town centre where it links to the N1 the main north/south route on the east coast of Ireland.
Rail Access The town of Drogheda has a railway station which is located on the main line between Dublin and Belfast. The rail line runs at high level over the Boyne estuary. However a disused but extant spur was previously used to serve the former cement factory, which is proximate to the existing jetties.
Waterford
Location Waterford Port is located on both the north and south quays on the River Suir in the centre of Waterford City. This port is operated by a state port company.
Road Access The port can be accessed by National Primary Routes: N25 to/from Cork; N24 to/from Clonmel and Limerick; and the N9 to Kilkenny and Dublin
Cork (continued)
97

Rail Access The port benefits from direct rail access on the northern side of the River Suir. Rail access is available at Belview Port to the east of the city where there are container handling facilities. Railway access to the north bank of the river in Waterford City itself has been dismantled.
Shannon Estuary
Location Shannon estuary port is located at Augunish island. This port is operated by a State port company.
Road Access Access to the port is by third class road which leads onto the N69 providing a route to Limerick and the rest of the national road network.
Rail Access The railway line to Limerick runs approximately 3 km to the south of the port. However there is no connection to this rail line from the port
New Ross
Location The port of New Ross is situated at quayside in the centre of the town. This port is operated by a State port company
Road Access Access to/from the port is provided by the N25 which provides a link to Wexford in the east and Waterford/Cork in the south west.
Rail Access The port is the terminal point of a disused but extant rail line which connects New Ross and Waterford. At Waterford rail traffic can access the national rail network.
Waterford (continued)
98
AIRPORT CAPACITY1.4 Capacity at airports is largely determined is largely determined by:
• the physical infrastructure available such as runway length, the number of piers;
• the size and range of facilities available at the terminals to handle both passengers and luggage;
• landside accessibility, availability of parking etc.
1.5 Cargo capacity can be influenced by the availability of associated warehousing etc. Non physical measures can be important such as the capacity or availability of air traffic control facilities and the influence of operator strategy. These factors are important for the regional airports.
1.6 At Dublin Airport handling capacity at the end of 1999 was approximately 20million passengers pa. These are part of an on-going package of improvements at Dublin Airport costing some £370million. At Cork airport the capacity of the terminal building will be enhanced to accommodate some 2.5 million by 2005 (with a longer term aim of increasing the capacity to 3.5 million passengers). At present Cork airport handles over 1.7million passengers per annum. Shannon airport has a passenger capacity of 4 million passengers.
1.7 Dublin has the largest throughput of passengers, frequently operating above design capacity limits and has had to engage in catch-up investment. The impact of recent investment has yet to be realised with performance suffering under excessive demand. Service quality has been relatively low by international standards, a point which has been highlighted in an Association of European Airlines report which identified Dublin as the second worst airport in Europe for delay duration in the second quarter of this year.
Foynes
Location The port of Foynes at a quayside on the river Shannon. It is located at Irish National Grid Reference R249518. This port is operated by a State port company.
Road Access Access to the port is provided by the N69 which allows access to Limerick in the east and the rest of the national road network.
Rail Access The port is the terminal point of a rail line which connects Foynes to Limerick and the rest of the National rail network.
99

1.8 It is estimated that 90% of the population of Ireland live within 2 hours surface journey time of an airport (55% within 1 hour). 5 airports are within 2 hours surface journey time of another airport. Of the 13 airports in Ireland, 4 have runways of less than 1000m, and another 4 with runway lengths of between 1000 and 1599m. Such airports can cater for turbo-prop. Operations and at the upper end limited jet operations(e.g. general aviation and Bae146s), but not narrow or wide bodied passenger jets. The proportion of short runway airports in Ireland is similar to the proportion in Scotland and Greece (Norway has a higher share of airports in these categories).
SEAPORT CAPACITY1.9 Capacity is largely determined by:
• Size of ships operated;
• The physical scale of ports; and
• The range and scale of facilities for handling freight and passengers.
1.10 Capacity is also influenced by landside access to/from ports by road and rail.
1.11 As shown in Table A1.1 the Port of Dublin can accommodate vessels up to 236m. Rosslare can cater for vessels up to 180 metres, and Cork can facilitate vessels of 295m in length. Dublin Port can cater for vessels requiring depths of up to 10.2m. Rosslare can has a maximum depth of 6.3m, and Dun Laoghaire and Cork have maximum depths of 5.5 and 13.4m respectively. Drogheda can cater for vessels up to 100m requiring depths of 5.2 m. There are limited tidal restrictions at Dublin Port, Cork, and Dun Laoghaire.
1.12 The port of Dublin has Roll on Roll Off facilities (Ro-Ro) which cater for passenger/freight ferries operated by Irish Ferries, a terminal facility for Merchant Ferries which is non passenger, a P&O terminal, freight only and a Stena passenger and freight terminal. At Dun Laoghaire one ferry terminal can accommodate vessels up to 120 metres in length. Rosslare operates four ferry berths the largest of which can accommodate vessels up to 221m in length. Cork has three facilities for ferries accommodating vessels up to 180m in length.
Table A1.1 Maritime Access and Ro-Ro Capacity at Selected Ports
Maritime Access Ro-Ro
Port Max Vessel Length
Max Depth Max Vessel Depth
Max Depth
Dublin 236m 10.2m 216m 11.0m
Dun Laoghaire N/A 5.5m 120m 5.1m
Rosslare 180m 6.3m 221m 7.5m
Cork 295m 13.4 180m 9.2m
Drogheda 100m 5.2m N/A N/A
100
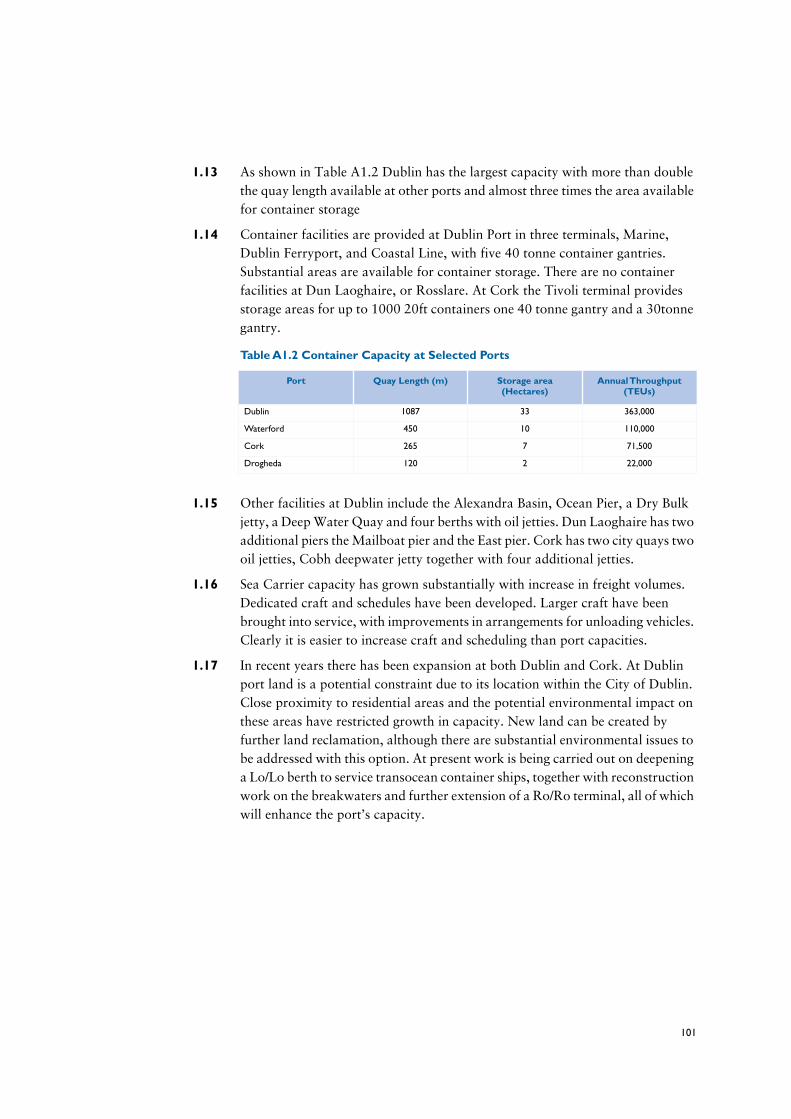
1.13 As shown in Table A1.2 Dublin has the largest capacity with more than double the quay length available at other ports and almost three times the area available for container storage
1.14 Container facilities are provided at Dublin Port in three terminals, Marine, Dublin Ferryport, and Coastal Line, with five 40 tonne container gantries. Substantial areas are available for container storage. There are no container facilities at Dun Laoghaire, or Rosslare. At Cork the Tivoli terminal provides storage areas for up to 1000 20ft containers one 40 tonne gantry and a 30tonne gantry.
1.15 Other facilities at Dublin include the Alexandra Basin, Ocean Pier, a Dry Bulk jetty, a Deep Water Quay and four berths with oil jetties. Dun Laoghaire has two additional piers the Mailboat pier and the East pier. Cork has two city quays two oil jetties, Cobh deepwater jetty together with four additional jetties.
1.16 Sea Carrier capacity has grown substantially with increase in freight volumes. Dedicated craft and schedules have been developed. Larger craft have been brought into service, with improvements in arrangements for unloading vehicles. Clearly it is easier to increase craft and scheduling than port capacities.
1.17 In recent years there has been expansion at both Dublin and Cork. At Dublin port land is a potential constraint due to its location within the City of Dublin. Close proximity to residential areas and the potential environmental impact on these areas have restricted growth in capacity. New land can be created by further land reclamation, although there are substantial environmental issues to be addressed with this option. At present work is being carried out on deepening a Lo/Lo berth to service transocean container ships, together with reconstruction work on the breakwaters and further extension of a Ro/Ro terminal, all of which will enhance the port’s capacity.
Table A1.2 Container Capacity at Selected Ports
Port Quay Length (m) Storage area (Hectares)
Annual Throughput (TEUs)
Dublin 1087 33 363,000
Waterford 450 10 110,000
Cork 265 7 71,500
Drogheda 120 2 22,000
101
1.18 Capacity on cross channel routes has increased significantly during the 1990s as each incumbent operator - Irish Ferries; Stena; Swansea/Cork and Britanny Ferries - have expanded capacity and introduced more modern and larger capacity ships. In addition new entrants have included the SuperSeaCat, and Merchant Ferries, reintroducing service to/from Liverpool. The first high speed passenger craft were introduced (Stena Sea Lynx I in 1993, Sea Lynx II in 1994, the HHS in 1996, the Sea Cat and Super Sea Cat in 1997/8, and Irish Ferries "Swift" in 1999). The Isle of Inishfree, the largest ro/ro ferry to serve the market was introduced by Irish Ferries in 1994, followed by a larger capacity ship Isle of Innishmore in 1996.
102
Appendix 2 - Freight Trend Analysis
All Ireland Sea Freight Trend Analysis2.1 Trade through the ports of Ireland was analysed using four main sources of data:
• Ireland Port Statistics from the Central Statistical Office of Ireland
• Maritime Statistics from the UK Stationary Office
• Cruise Ferry Info Roll-on Roll-off Statistics
• EU Eurostat trade data
2.2 As ports in Northern Ireland have been used as freight gateways in the past for the export and import of products into the south, all the major ports in the island of Ireland north and south have been included in the analysis. Key British data was available from 1988 to 1998, as the UK maritime statistics from 1999 have yet to be published. However, the Roll-on Roll-off (RoRo) analysis was undertaken from 1989 to 1999.
Total Port Trade2.3 Total trade through the ports of Ireland grew from 39.25 million tonnes in 1988
to 60.03 million tonnes in 1998. This was a total growth of 53% or an average rate of 4% per annum. Trade through the Republic’s ports grew at a faster rate that those through the north. The Republic’s port traffics grew by 66% or by 5% per annum, while freight traffic through the north’s ports grew by 32% or 3% per annum. These trends are shown in the tables 5.1 to 5.3 below. Average annual growth is shown in sea freight for the Republic of Ireland is shown in A2.1
2.4 In terms of mode the largest increase has been in RoRo traffic. This grew by 131% for Ireland as a whole or on average by 9% per annum. Ro-Ro traffic growth was more pronounced in the Republic growing, by 259% over the period (or an annual average of 14%). The reasons why RoRo has performed so is discussed in a later section.
2.5 Liquid bulks, mainly petroleum products, saw the next largest increase, a total growth of 48% in total or 4% per annum average growth. Growth in this segment was again higher in the Republic, 86% over the period or an annual average of 7%.
2.6 Lift-on Lift-off (LoLo) traffic grew by 43% in total, a mean growth of 4% per annum for the island as a whole. This is less than the proportion achieved in the south, 72% (an annual average growth of 6%)
2.7 Dry bulks saw the smallest growth north or south but again the level of growth was higher in the south over the period.
103
2.8 In terms of individual ports, Rosslare saw the largest increase in throughput, increasing by 175%. However Rosslare started from a very low base and is now only the sixth largest port in Ireland. Additionally, all of its traffic is RoRo. Dublin is the largest port in Ireland and has shown the second highest growth, moving from 5.8 million tonnes in 1988 to 13.2 million tonnes in 1998, a growth of 126%. Within Dublin, RoRo and LoLo saw the largest growth, increasing by 358% and 110% respectively. Both these growth rates were larger than the national averages for these segments. Cork followed a similar pattern to Dublin. Belfast saw its RoRo traffic increase by 380%, and a total port growth of 71% over the ten years, though its LoLo traffic did fall.
Lift-On and Lift-Off and Roll-On/Roll-off2.9 The trend analysis will concentrate on unitised goods i.e. LoLo and RoRo traffic.
This is due to the following reasons:
• They are the fastest growing mode of appearance of goods entering and leaving Ireland.
• They have the greatest impact on the internal transport infrastructure of Ireland, requiring a road haul or rail from origin or to destination
• Container storage and trailer parking at ports requires a large area of space. Large increases in the throughput of these modes will require additional space to accommodate them.
• RoRo and LoLo traffics tend to be concentrated on a small number of ports, thus their inland impact tends to be concentrated on a small number of locations. Bulk trade is more evenly spread over a larger number of ports.
104
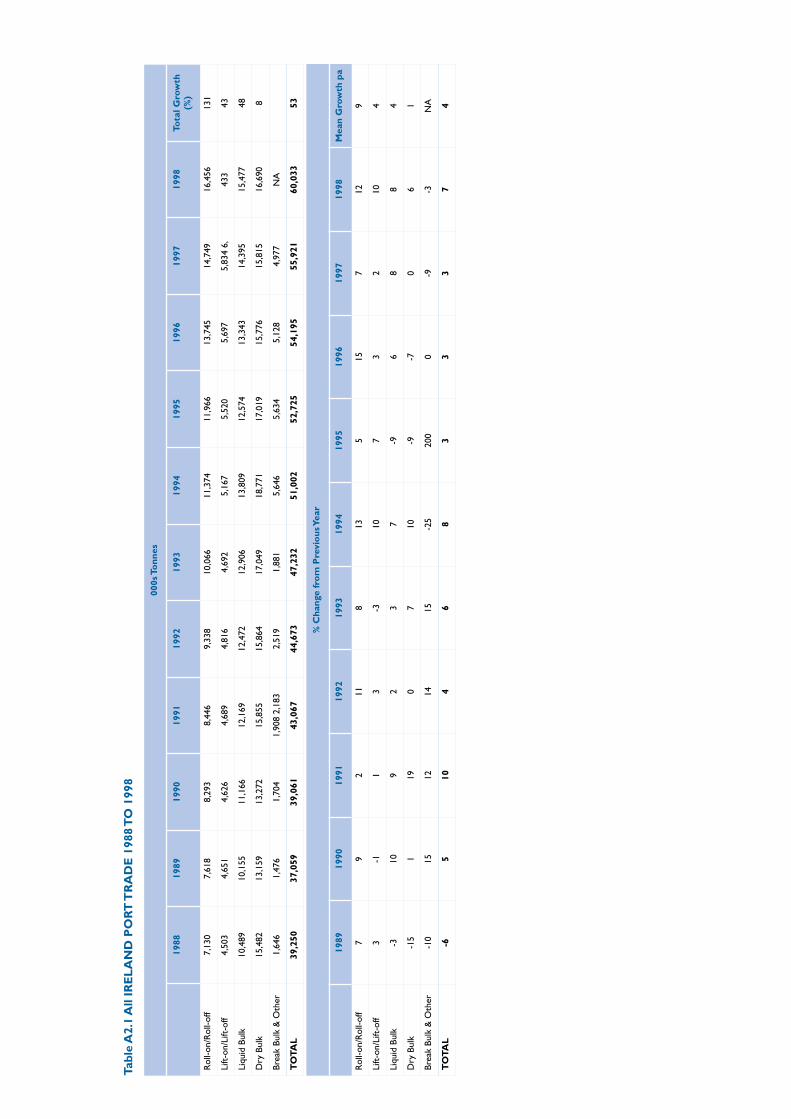
Tabl
e A
2.1
All
IRE
LA
ND
PO
RT
TR
AD
E 1
988
TO
199
8
000s
To
nnes
1988
19
89
1990
19
91
1992
19
93
1994
19
95
1996
19
97
1998
To
tal G
row
th
(%)
Rol
l-on/
Rol
l-off
7,13
0 7,
618
8,29
3 8,
446
9,33
8 10
,066
11
,374
11
,966
13
,745
14
,749
16
,456
13
1
Lift
-on/
Lift
-off
4,50
3 4,
651
4,62
6 4,
689
4,81
6 4,
692
5,16
7 5,
520
5,69
7 5,
834
6,43
3 43
Liqu
id B
ulk
10,4
89
10,1
55
11,1
66
12,1
69
12,4
72
12,9
06
13,8
09
12,5
74
13,3
43
14,3
95
15,4
77
48
Dry
Bul
k 15
,482
13
,159
13
,272
15
,855
15
,864
17
,049
18
,771
17
,019
15
,776
15
,815
16
,690
8
Brea
k Bu
lk &
Oth
er
1,64
6 1,
476
1,70
4 1,
908
2,18
3 2,
519
1,88
1 5,
646
5,63
4 5,
128
4,97
7 N
A
TO
TA
L
39,2
50
37,0
59
39,0
61
43,0
67
44,6
73
47,2
32
51,0
02
52,7
25
54,1
95
55,9
21
60,0
33
53
% C
hang
e fr
om
Pre
vio
us Y
ear
1989
19
90
1991
19
92
1993
19
94
1995
19
96
1997
19
98
Mea
n G
row
th p
a
Rol
l-on/
Rol
l-off
7 9
2 11
8
13
5 15
7
12
9
Lift
-on/
Lift
-off
3 -1
1
3 -3
10
7
3 2
10
4
Liqu
id B
ulk
-3
10
9 2
3 7
-9
6 8
8 4
Dry
Bul
k -1
5 1
19
0 7
10
-9
-7
0 6
1
Brea
k Bu
lk &
Oth
er
-10
15
12
14
15
-25
200
0 -9
-3
N
A
TO
TA
L
-6
5 10
4
6 8
3 3
3 7
4

Tabl
e A
2.2
Rep
ublic
of I
rela
nd P
ort
Tra
de 1
988-
98
000s
To
nnes
1988
19
89
1990
19
91
1992
19
93
1994
19
95
1996
19
97
1998
(%
)
Rol
l-on/
Rol
l-off
2,09
2 2,
344
2,56
4 2,
746
2,80
1 2,
677
3,18
0 3,
894
5,85
7 6,
354
7,50
4 25
9
Lift
-on/
Lift
-off
2,84
5 3,
099
3,04
5 2,
962
2,97
3 3,
371
3,89
9 4,
175
4,40
4 4,
423
4,90
6 72
Liqu
id B
ulk
6,52
5 7,
151
7,79
7 8,
048
8,54
0 8,
553
9,41
8 9,
384
9,82
8 11
,117
12
,166
86
Dry
Bul
k 11
,343
10
,895
11
,059
11
,026
11
,053
11
,744
13
,009
13
,538
12
,266
12
,739
13
,783
22
Brea
k Bu
lk &
Oth
er
1,24
3 1,
407
1,60
6 1,
458
1,71
1 2,
014
1,42
4 1,
389
1,56
4 1,
697
1,59
5 28
TO
TA
L
24,0
48
24,8
96
26,0
71
26,2
40
27,0
78
28,3
59
30,9
30
32,3
80
33,9
19
36,3
30
39,9
54
66
% C
hang
e fr
om
Pre
vio
us Y
ear
1989
19
90
1991
19
92
1993
19
94
1995
19
96
1997
19
98
Mea
n G
row
th
pa
Rol
l-on/
Rol
l-off
12
9 7
2 -4
19
22
50
8
18
14
Lift
-on/
Lift
-off
9 -2
-3
0
13
16
7 5
0 11
6
Liqu
id B
ulk
10
9 3
6 0
10
0 5
13
9 7
Dry
Bul
k -4
2
0 0
6 11
4
-9
4 8
2
Brea
k Bu
lk &
Oth
er
13
14
-9
17
18
-29
-2
13
9 -6
4
TO
TA
L
4 5
1 3
5 9
5 5
7 10
5
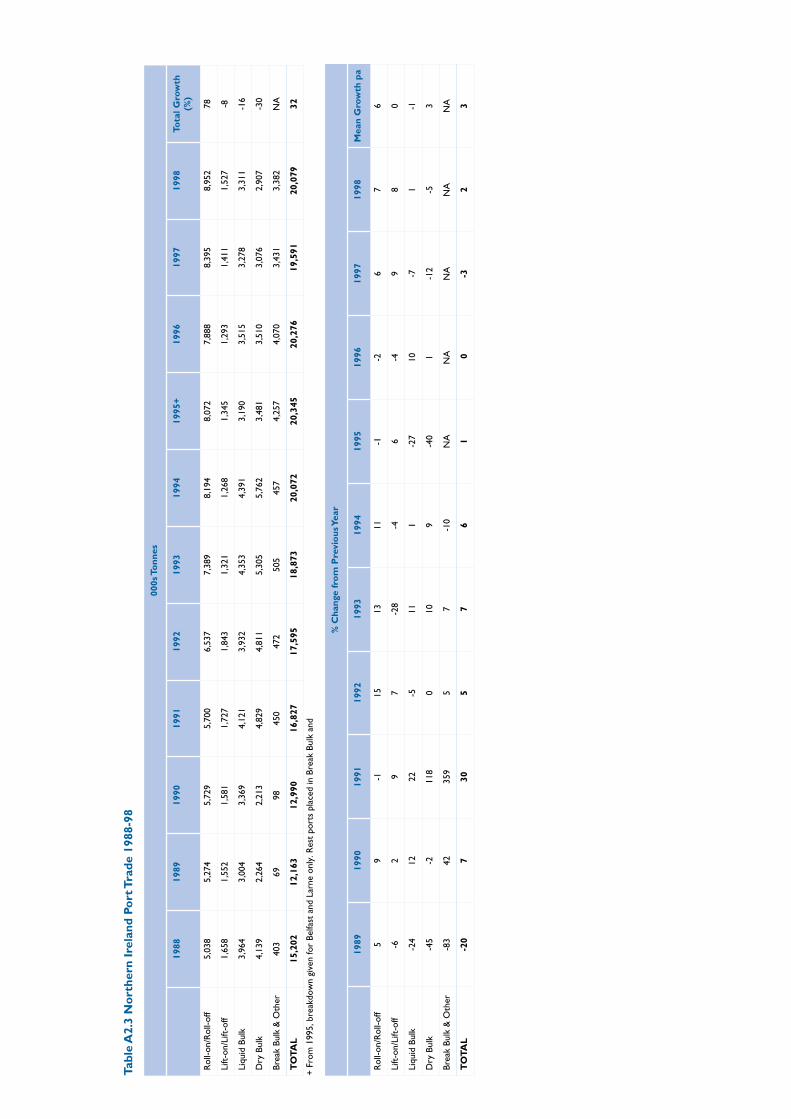
+ F
rom
199
5, b
reak
dow
n gi
ven
for
Belfa
st a
nd L
arne
onl
y. R
est
port
s pl
aced
in B
reak
Bul
k an
d
Tabl
e A
2.3
No
rthe
rn I
rela
nd P
ort
Tra
de 1
988-
98
000s
To
nnes
1988
19
89
1990
19
91
1992
19
93
1994
19
95+
1996
19
97
1998
To
tal G
row
th
(%)
Rol
l-on/
Rol
l-off
5,03
8 5,
274
5,72
9 5,
700
6,53
7 7,
389
8,19
4 8,
072
7,88
8 8,
395
8,95
2 78
Lift
-on/
Lift
-off
1,65
8 1,
552
1,58
1 1,
727
1,84
3 1,
321
1,26
8 1,
345
1,29
3 1,
411
1,52
7 -8
Liqu
id B
ulk
3,96
4 3,
004
3,36
9 4,
121
3,93
2 4,
353
4,39
1 3,
190
3,51
5 3,
278
3,31
1 -1
6
Dry
Bul
k 4,
139
2,26
4 2,
213
4,82
9 4,
811
5,30
5 5,
762
3,48
1 3,
510
3,07
6 2,
907
-30
Brea
k Bu
lk &
Oth
er
403
69
98
450
472
505
457
4,25
7 4,
070
3,43
1 3,
382
NA
TO
TA
L
15,2
02
12,1
63
12,9
90
16,8
27
17,5
95
18,8
73
20,0
72
20,3
45
20,2
76
19,5
91
20,0
79
32
% C
hang
e fr
om
Pre
vio
us Y
ear
1989
19
90
1991
19
92
1993
19
94
1995
19
96
1997
19
98
Mea
n G
row
th p
a
Rol
l-on/
Rol
l-off
5 9
-1
15
13
11
-1
-2
6 7
6
Lift
-on/
Lift
-off
-6
2 9
7 -2
8 -4
6
-4
9 8
0
Liqu
id B
ulk
-24
12
22
-5
11
1 -2
7 10
-7
1
-1
Dry
Bul
k -4
5 -2
11
8 0
10
9 -4
0 1
-12
-5
3
Brea
k Bu
lk &
Oth
er
-83
42
359
5 7
-10
NA
N
A
NA
N
A
NA
TO
TA
L
-20
7 30
5
7 6
1 0
-3
2
3

• Bulk materials are usually handled at ports closest to where they are processed, quite often within the port estates they are imported or exported. Therefore their inland impacts are more limited than unitised traffics.
• RoRo and LoLo trade is a constant flow, RoRo and LoLo services run to regular scheduled timetables, and the inland impact is immediate.
Lift-on Lift-off Traffic2.10 Total container trade via Irish ports increased from 371,659 units in 1988 to
499,979 units in 1998. This was a total increase of 35% or 3% per annum. Table A2.4 below shows the total number of units handled by port individual ports. The growth in containers has not kept pace with the growth in GDP of Ireland. The reasons for this will be discussed below.
2.11 Dublin is the largest container port in Ireland handling 254,816 units in 1998, a growth of 95% since 1988 or 12% per annum. Dublin has gained market share over this period of time and grown faster than the overall segment average. For Belfast is the second largest container port in Ireland although the port experienced a decline in container through put from 128,000 units in 1988 to 118,000 units in 1998, a fall of 8% overall.
2.12 Cork saw the largest percentage growth, a rise of 134% overall, or 14% per annum. Its throughput rose from 26,369 units in 1988 to 61,694 units in 1998. The upward ‘blip’ in 1992 was due to the strike in Dublin, with containers being diverted via Cork instead. Waterford and Drogheda saw their container traffics fall over this period, by 34% and 76% respectively, while the traffic through Waterford’s volumes in 1997 was due to the demise of Bell Lines container services that year.
108
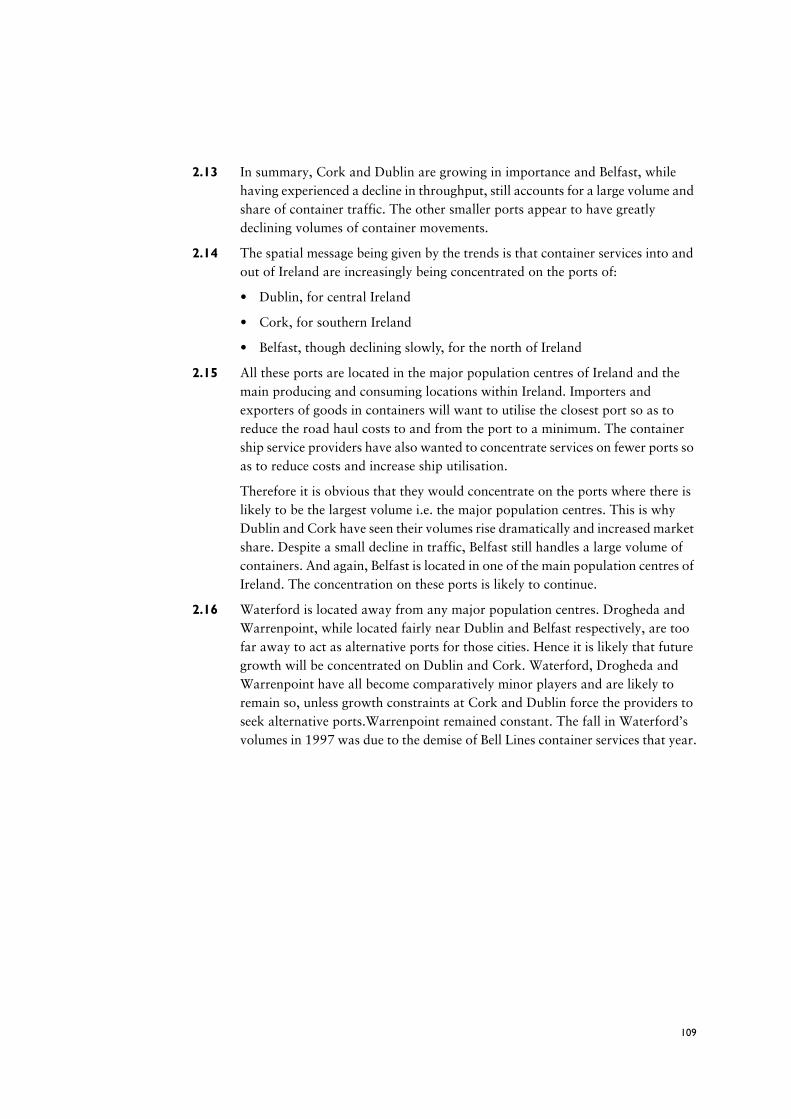
2.13 In summary, Cork and Dublin are growing in importance and Belfast, while having experienced a decline in throughput, still accounts for a large volume and share of container traffic. The other smaller ports appear to have greatly declining volumes of container movements.
2.14 The spatial message being given by the trends is that container services into and out of Ireland are increasingly being concentrated on the ports of:
• Dublin, for central Ireland
• Cork, for southern Ireland
• Belfast, though declining slowly, for the north of Ireland
2.15 All these ports are located in the major population centres of Ireland and the main producing and consuming locations within Ireland. Importers and exporters of goods in containers will want to utilise the closest port so as to reduce the road haul costs to and from the port to a minimum. The container ship service providers have also wanted to concentrate services on fewer ports so as to reduce costs and increase ship utilisation.
Therefore it is obvious that they would concentrate on the ports where there is likely to be the largest volume i.e. the major population centres. This is why Dublin and Cork have seen their volumes rise dramatically and increased market share. Despite a small decline in traffic, Belfast still handles a large volume of containers. And again, Belfast is located in one of the main population centres of Ireland. The concentration on these ports is likely to continue.
2.16 Waterford is located away from any major population centres. Drogheda and Warrenpoint, while located fairly near Dublin and Belfast respectively, are too far away to act as alternative ports for those cities. Hence it is likely that future growth will be concentrated on Dublin and Cork. Waterford, Drogheda and Warrenpoint have all become comparatively minor players and are likely to remain so, unless growth constraints at Cork and Dublin force the providers to seek alternative ports.Warrenpoint remained constant. The fall in Waterford’s volumes in 1997 was due to the demise of Bell Lines container services that year.
109
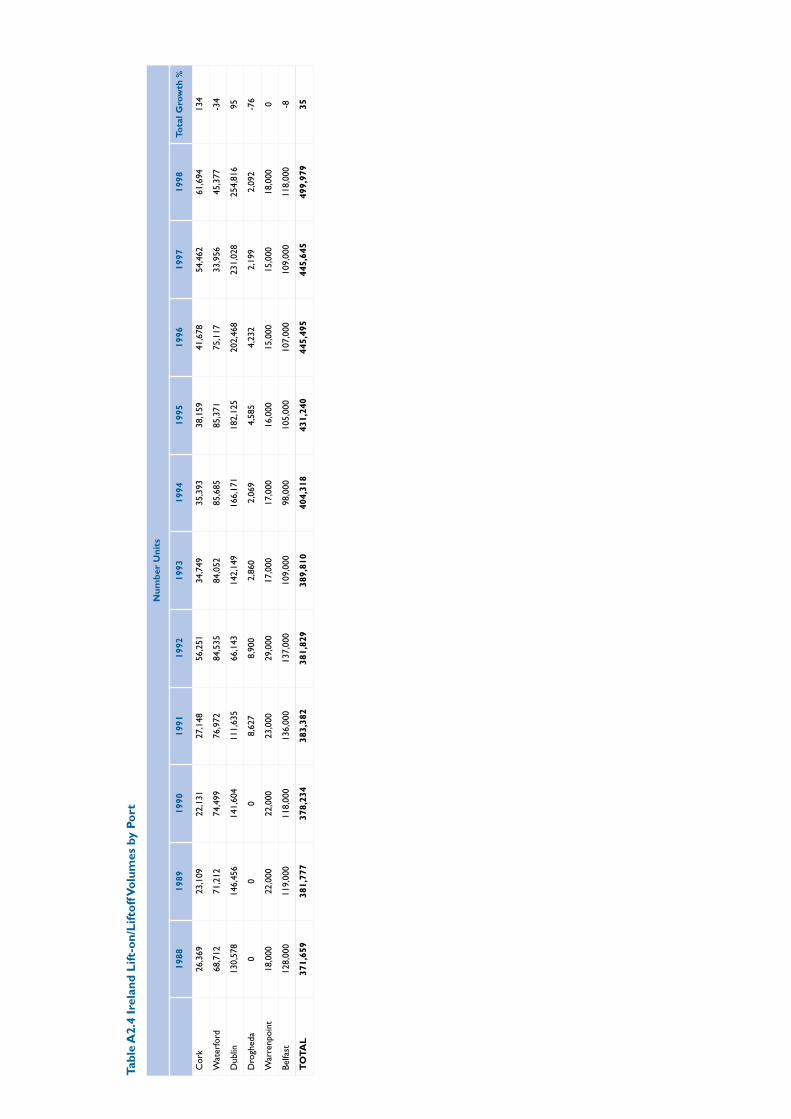
Tabl
e A
2.4
Irel
and
Lift
-on/
Lift
off
Vo
lum
es b
y Po
rt
Num
ber
Uni
ts
1988
19
89
1990
19
91
1992
19
93
1994
19
95
1996
19
97
1998
To
tal G
row
th %
Cor
k 26
,369
23
,109
22
,131
27
,148
56
,251
34
,749
35
,393
38
,159
41
,678
54
,462
61
,694
13
4
Wat
erfo
rd
68,7
12
71,2
12
74,4
99
76,9
72
84,5
35
84,0
52
85,6
85
85,3
71
75,1
17
33,9
56
45,3
77
-34
Dub
lin
130,
578
146,
456
141,
604
111,
635
66,1
43
142,
149
166,
171
182,
125
202,
468
231,
028
254,
816
95
Dro
ghed
a 0
0 0
8,62
7 8,
900
2,86
0 2,
069
4,58
5 4,
232
2,19
9 2,
092
-76
War
renp
oint
18
,000
22
,000
22
,000
23
,000
29
,000
17
,000
17
,000
16
,000
15
,000
15
,000
18
,000
0
Belfa
st
128,
000
119,
000
118,
000
136,
000
137,
000
109,
000
98,0
00
105,
000
107,
000
109,
000
118,
000
-8
TO
TA
L
371,
659
381,
777
378,
234
383,
382
381,
829
389,
810
404,
318
431,
240
445,
495
445,
645
499,
979
35
2.17 Unfortunately, there appears to have been a change in how deep sea originating/destined containers are recorded in the port statistics. Up to 1996, they were given a Non EU origin/destination. From 1997, they seem to have been given an EU origin/destination (having been trans-shipped via other EU ports). It is therefore difficult to precisely define the ultimate origin/destination of containers being handled through Irish ports. However, as the level of non EU trade to or from Ireland is small, some general trends can be ascertained. Container trade with Great Britain fell by 8% overall, from 178,044 units (48%) in 1988 to 163,420 units (32%) in 1998. This was a fall on average of 1% per annum. Containers from other EU countries grew from 186,365 units (50%) in 1988 to 331,039 units (66%) in 1998, a growth of 78% or 6% per annum (this will include from 1997 containers previously classed as non EU so actual total will be slightly lower). Table A2.5 below shows the trends. The breakdown of origin/destination by port shows a similar pattern to total container throughput, in that container services from Britain and the other EU countries are being concentrated on Dublin, Cork and Belfast (though Britain to Belfast container trade is declining).
Summary2.18 LoLo trade to and from Ireland can be summarised as follows:
• Total container throughput has increased by 35% in total or 3% per annum
• Total trade has grown less than Irish GDP growth
• Container services are being concentrated on Dublin, Cork and Belfast. This trend will continue with other ports becoming minor players unless growth constraints at Cork and Dublin force the providers to seek alternative ports.
• Containers shipped to/from Britain have fallen in numbers since 1988 by 8% or 1% per annum
• Containers shipped from other EU countries have grown by 78% since 1988 or 6% per annum
• Containers shipped to/from Britain accounted for 48% of total throughput in 1988 but fell to 32% by 1998
• Total container throughput has increased by 35% in total or 3% per annum
• Total trade has grown less than Irish GDP growth
• Containers shipped to/from other EU countries accounted for 50% in 1988 and rose to 66% in 1998.
111
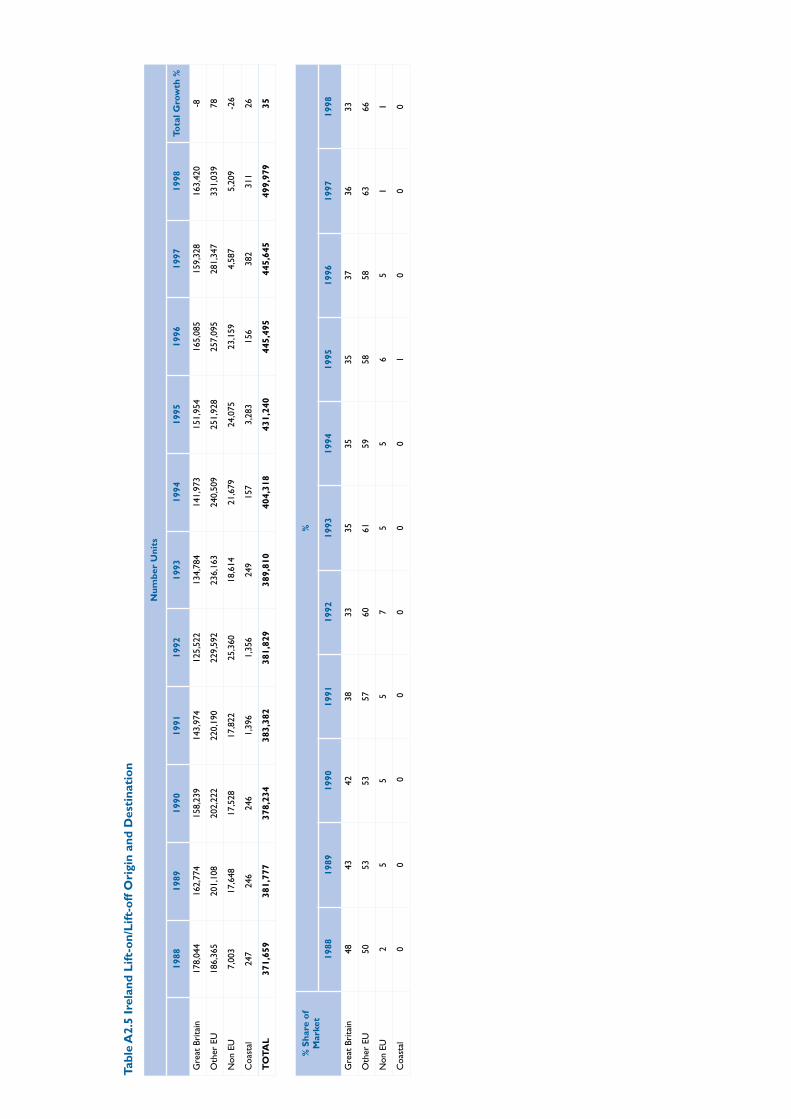
Tabl
e A
2.5
Irel
and
Lift
-on/
Lift
-off
Ori
gin
and
Des
tina
tio
n
Num
ber
Uni
ts
1988
19
89
1990
19
91
1992
19
93
1994
19
95
1996
19
97
1998
To
tal G
row
th %
Gre
at B
rita
in
178,
044
162,
774
158,
239
143,
974
125,
522
134,
784
141,
973
151,
954
165,
085
159,
328
163,
420
-8
Oth
er E
U
186,
365
201,
108
202,
222
220,
190
229,
592
236,
163
240,
509
251,
928
257,
095
281,
347
331,
039
78
Non
EU
7,
003
17,6
48
17,5
28
17,8
22
25,3
60
18,6
14
21,6
79
24,0
75
23,1
59
4,58
7 5,
209
-26
Coa
stal
24
7 24
6 24
6 1,
396
1,35
6 24
9 15
7 3,
283
156
382
311
26
TO
TA
L
371,
659
381,
777
378,
234
383,
382
381,
829
389,
810
404,
318
431,
240
445,
495
445,
645
499,
979
35
% S
hare
of
Mar
ket
%
1988
19
89
1990
19
91
1992
19
93
1994
19
95
1996
19
97
1998
Gre
at B
rita
in
48
43
42
38
33
35
35
35
37
36
33
Oth
er E
U
50
53
53
57
60
61
59
58
58
63
66
Non
EU
2
5 5
5 7
5 5
6 5
1 1
Coa
stal
0
0 0
0
0 0
0 1
0 0
0


• Road haulage is a very efficient method of moving goods with rates little changed from 10 years ago. With RoRo shipping rates also falling, sending goods by road via a RoRo ferry service is often the cheaper option.
2.21 The trend is likely to continue in the near future. Table A2.7 below quantifies the mode switch from LoLo to RoRo since 1989. Britain - Ireland unitised trade is now completely dominated by the RoRo sector with LoLo now only occupying a small niche market. In total, 72% of unitised trade enters or leaves Ireland via a RoRo service compared to 62% in 1989.
2.22 Dublin is the largest handler of RoRo traffic, increasing its volumes from 93,600 units in 1989 to 447,900 units in 1999, a total growth of 379%. Larne is the next largest RoRo port handling 419,000 units in 1999, though it showed the smallest growth over the ten year period, with a growth of only 30%. After Dublin, the next largest growth was achieved by Belfast which grew its traffic by 229% from 77,500 units in 1989 to 255,000 units in 1999. Rosslare almost doubled its RoRo throughput from 52,988 units in 1989 to 103.389 units in 1999, a growth of 95% or 7% per annum. Dun Laoghaire grew its traffics from 24.200 units in 1989 to 50,000 units in 1999. Dun Laoghaire port has an environmental limit of 50,000 freight units per annum which it cannot exceed. As a result, Stena line switched its main ferry operation to Dublin in 1995 and has since used Dun Laoghaire for its HSS fast ferry service which does carry some freight, normally time critical freight (but only within the specified limit). Cork handles very few RoRo units on the seasonal ferry services to France which are aimed primarily at the tourist market.
Key Ro-Ro Routes2.23 The biggest growth has been on services into Dublin and Belfast from North
West England and North Wales. The trend in the early 1990s was large growth through the ports of Larne and Belfast. The ports of Liverpool and Dublin suffered from poor industrial relations problems during the late 1980s and as a result, the new RoRo services that began operating on the Irish Sea were concentrated on Belfast and Larne from ports such as Fleetwood, Heysham, Cairnryan and Stranraer.
2.24 However, as Liverpool and Dublin solved their problems, the ferry companies began operating services from these ports. Therefore services on the central corridor into Dublin and from Liverpool into Belfast have seen large growth over the late 1990s. This trend is likely to continue. The preferred ports of entry/departure in Britain are Liverpool and Holyhead. These are the nearest ports to the major producing and consuming areas of Britain. The preferred ports of entry/departure in Ireland are Dublin and Belfast, as again they are the nearest ports to the producing and consuming areas of Ireland.
115

2.25 The spatial message therefore arising from the RoRo analysis is similar to the LoLo trends, with RoRo services being concentrated on a few major ports.
2.26 These ports are:
• Larne, for services from Scotland, though growth here is fairly flat;
• Belfast, for services from North West England, with large growth in volumes;
• Dublin, for services from North West England and North Wales, with large growth in volumes; and
• To a lesser extent, Rosslare, for services from West Wales and France, with steady growth in volumes.
2.27 These trends are likely to continue over the medium term.
2.28 Cork, Dun Laoghaire and Warrenpoint are minor players in the RoRo market.
2.29 In terms of the origin and destinations of freight vehicles, 99% of vehicles arrive in or leave Ireland on a service from Britain, and this has remained constant over the ten year period. However, a proportion of the vehicles on the services to or from Britain will have ultimate origins or destinations in other EU countries apart from Britain i.e. they utilise Britain as a landbridge to the continent.
2.30 Table A2.8 below shows an estimation of the ultimate origins and destinations of good vehicles arriving in or leaving Ireland on a RoRo service Landbridge traffic from other EU countries has out grown traffic to or from Britain over the ten year period. Traffic to or from Britain has grown by 111% over the ten year period where as vehicles from other EU countries have grown by 251% since 1989. Traffic using the landbridge route has grown by 266% since 1989. This shows that Ireland is slowly moving away from its traditional trading partner, Britain, and is increasing its trade at a faster rate with the other countries of the EU.
116
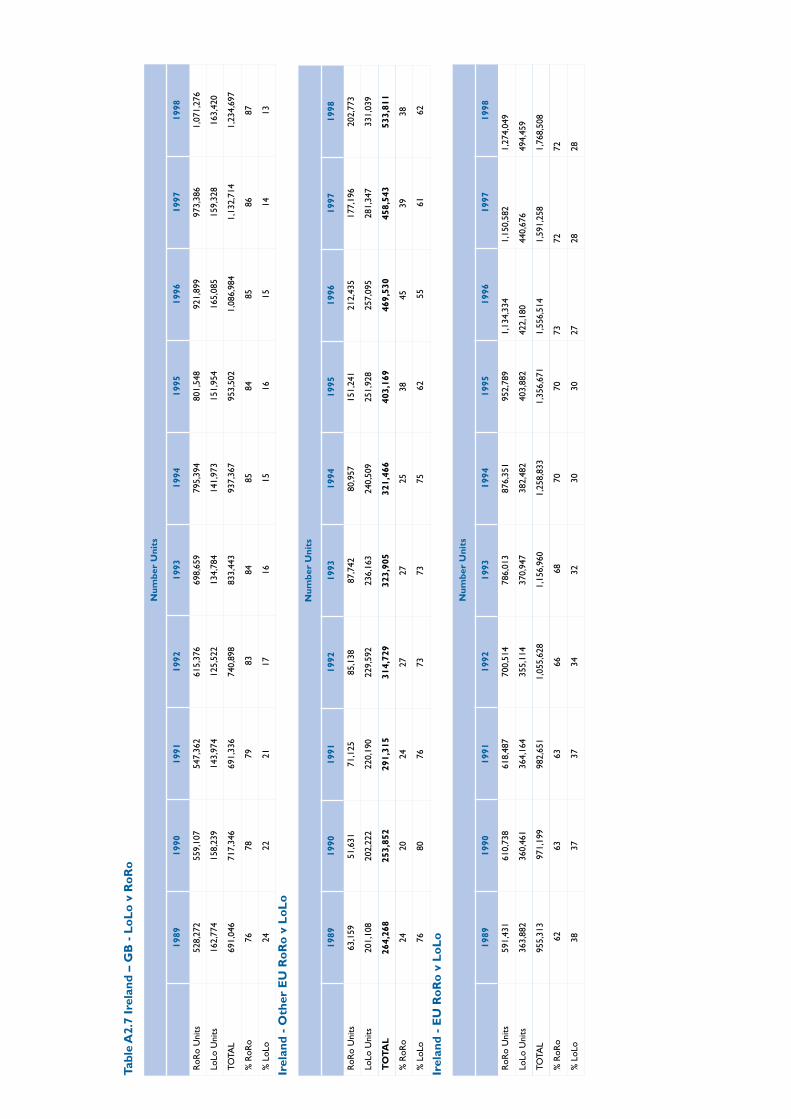
Tabl
e A
2.7
Irel
and
– G
B -
Lo
Lo
v R
oR
o
Num
ber
Uni
ts
1989
19
90
1991
19
92
1993
19
94
1995
19
96
1997
19
98
RoR
o U
nits
52
8,27
2 55
9,10
7 54
7,36
2 61
5,37
6 69
8,65
9 79
5,39
4 80
1,54
8 92
1,89
9 97
3,38
61,
071,
276
LoLo
Uni
ts
162,
774
158,
239
143,
974
125,
522
134,
784
141,
973
151,
954
165,
085
159,
328
163,
420
TOTA
L 69
1,04
6 71
7,34
6 69
1,33
6 74
0,89
8 83
3,44
3 93
7,36
7 95
3,50
21,
086,
984
1,13
2,71
41,
234,
697
% R
oRo
76
78
79 8
3 84
85
84
85
86
87
% L
oLo
24
22
21
17
16
15
16
15
14
13
Irel
and
- O
ther
EU
Ro
Ro
v L
oL
o
Num
ber
Uni
ts
1989
19
90
1991
19
92
1993
19
94
1995
19
96
1997
19
98
RoR
o U
nits
63
,159
51
,631
71
,125
85
,138
87
,742
80
,957
15
1,24
1 21
2,43
5 17
7,19
6 20
2,77
3
LoLo
Uni
ts
201,
108
202,
222
220,
190
229,
592
236,
163
240,
509
251,
928
257,
095
281,
347
331,
039
TO
TA
L
264,
268
253,
852
291,
315
314,
729
323,
905
321,
466
403,
169
469,
530
458,
543
533,
811
% R
oRo
24
20
24
27
27
25
38
45
39
38
% L
oLo
76
80
76
73
73
75 6
2 5
5 6
1 6
2
Irel
and
- E
U R
oR
o v
Lo
Lo
Num
ber
Uni
ts
1989
19
90
1991
19
92
1993
19
94
1995
19
96
1997
19
98
RoR
o U
nits
59
1,43
1 61
0,73
8 61
8,48
7 70
0,51
4 78
6,01
3 87
6,35
1 95
2,78
91,
134,
334
1,15
0,58
21,
274,
049
LoLo
Uni
ts
363,
882
360,
461
364,
164
355,
114
370,
947
382,
482
403,
882
422,
180
440,
676
494,
459
TOTA
L 95
5,31
3 9
71,1
99
982,
651
1,05
5,62
8 1,
156,
960
1,25
8,83
31,
356,
671
1,55
6,51
41,
591,
258
1,76
8,50
8
% R
oRo
62
63
63
66 6
8 70
70
73
72
72
% L
oLo
38
37
37
34
32
30
30
27
28
28

Summary of Ro-Ro Movements2.31 RoRo trade can be summarised as follows:
• Total RoRo trade grew from 591,431 units in 1989 to 1.34 million units in 1999, a total growth of 126% or 9% per annum
• The growth faster than GDP can be explained by a modal switch from LoLo to RoRo services
• Dublin is the largest handler of RoRo traffics accounting for 447,900 freight units in 1999. Larne, Belfast and Rosslare are the other major RoRo ports.
• The trend has been towards concentrating services on the ports of Dublin, Belfast and Larne, and to a lesser extent, Rosslare. This trend is likely to continue.
Unitised Freight2.32 Unitised freight includes both Ro-Ro and Lo-Lo. Details of recent unitised
freight trends are appended. In terms of tonneage imported from other EU countries in 1999 76% of the total were sourced in the UK, the Netherlands the next most important with 7% of imports sourced there. However in terms of value 64% of imports originated in the UK with 11% and 7% originating in Germany and France respectively. There is even less co-incidence between value and tonnage in the case of exports. Whilst 62% of total Irish exports are shipped to the UK, these exports only account for 33% of the total value of exports and include traditional exports such as food and dairy produce. In contrast Germany, and France comprise 19% and 13% respectively of the value of exports respectively, although Germany took only 8% of the tonnage of exports and France 7%.
Air Freight2.33 Table A2.9 shows that in terms of weight, total air freight (including air mail)
almost doubled between 1990 and 1999. Although the largest growth occurred at the Cork terminal (24% annual average) this was from a low base and was subject to wide variation over the period. About 71% of all freight in 1999 was dealt with at Dublin Airport.
Source Data: Aer Rianta
Table A2.9 Air Freight [inc. mail] (Metric Tonnes)
1990 1999 Annual average % change 1990 – 1999
Dublin 53361 112124 9
Shannon 22870 34714 6
Cork 2336 11723 24
Total 78567 158561 9
118
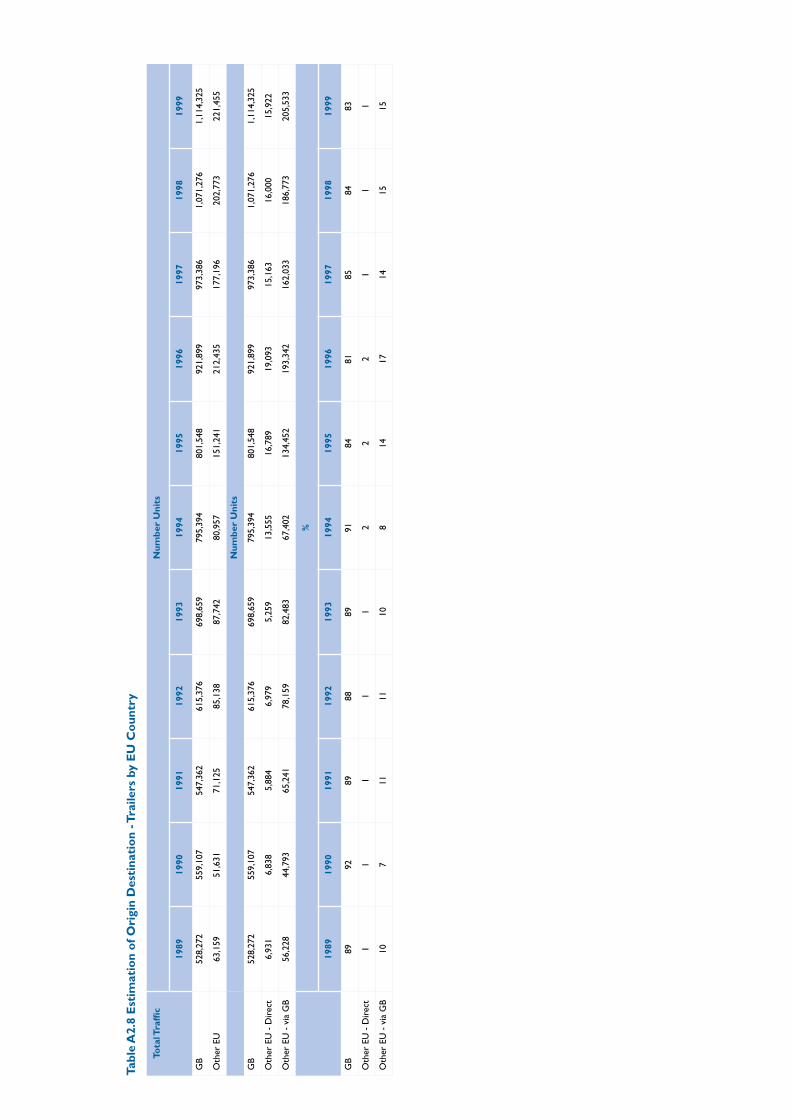
Tabl
e A
2.8
Est
imat
ion
of O
rigi
n D
esti
nati
on
- Tra
ilers
by
EU
Co
untr
y
Tota
l Tra
ffic
Num
ber
Uni
ts
1989
19
90
1991
19
92
1993
19
94
1995
19
96
1997
19
98
1999
GB
528,
272
559,
107
547,
362
615,
376
698,
659
795,
394
801,
548
921,
899
973,
386
1,07
1,27
6 1,
114,
325
Oth
er E
U
63,1
59
51,6
31
71,1
25
85,1
38
87,7
42
80,9
57
151,
241
212,
435
177,
196
202,
773
221,
455
Num
ber
Uni
ts
GB
528,
272
559,
107
547,
362
615,
376
698,
659
795,
394
801,
548
921,
899
973,
386
1,07
1,27
6 1,
114,
325
Oth
er E
U -
Dir
ect
6,93
1 6,
838
5,88
4 6,
979
5,25
9 13
,555
16
,789
19
,093
15
,163
16
,000
15
,922
Oth
er E
U -
via
GB
56,2
28
44,7
93
65,2
41
78,1
59
82,4
83
67,4
02
134,
452
193,
342
162,
033
186,
773
205,
533
%
1989
19
90
1991
19
92
1993
19
94
1995
19
96
1997
19
98
1999
GB
89
92
89
88
89
91
84
81
85
84
83
Oth
er E
U -
Dir
ect
1 1
1 1
1 2
2 2
1 1
1
Oth
er E
U -
via
GB
10
7 11
11
10
8
14
17
14
15
15

120

Appendix 3 - Passenger Trend Analysis
INTERNATIONAL PASSENGER TRAVEL: RESIDENTS AND VISITORS
3.1 The discussion of international passenger travel begins with a review of general passenger movements to draw out the main changes that have taken place over the 1990 to 1999 period. Subsequently it then goes on to analyses in greater detail the travel behaviour of Irish residents and visitors according to a number of characteristics including broad route, purpose and seasonality. Headline tables diagrams have been included in the text while major tables are located at the end of this appendix. A further section summarises he main influences behind the trends. These will be used to support projected travel patterns.
3.2 Total passenger movements into and out of Ireland doubled over the past ten years, from 9.7 million in 1990 to 19.25 million in 1999. However, as Fig A3.1 demonstrates, much of this growth occurred in the latter part of the 1990s.
3.3 Growth in air travel has fast outpaced the demand for sea routes. Air travel increased by +132% over the decade, compared to a +43% growth in sea travel. Travel by air now accounts for 76.5% share of all passenger movements, up from a 66.8% share in 1990. Air travel dominates on all major routes (Table A3.1).
3.4 The fastest traffic growth was recorded on continental routes with a growth of 157% between 1990 and 1999 (an average of +11% per annum). Continental routes now account for nearly a quarter of total movements, up from a fifth in 1990. Interestingly, while growth in continental air movements doubled over the period, sea traffic declined by almost a third (Table A3.1).
121

3.5 Cross channel movements grew by 86% between 1990 and 1999 (an average of + 7% per annum) and now accounts for 68% of total movements, a decrease from the 1990 proportion (74%). Most of the overall increase over the period can be attributed to people travelling by plane, although sea borne movements have increased steadily in number.Transatlantic traffic grew strongly over the latter half of the period being studied. Between 1998 and 1999 alone, there was an increase in passenger movements by 20%. Although growth was above the average, transatlantic traffic still accounts for a relatively small proportion of all passenger movements.
Source: Bord Fáilte passenger database compiled from C.S.O surveys.
Table A3.1 – Passenger Movements
1990 1999 % Share 1990
% Share1999
% Change1990
-1999
% Annual Average
TOTAL CROSS CHANNEL Cross Channel – AIR Cross Channel – SEA
7180 13372 73.9 68.0 86.2 7.3
4355 9029 44.8 45.9 107.3 8.8
2825 4343 29.1 22.1 53.7 5.0
1874 4812 19.3 24.5 156.8 11.1
1478 4544 15.2 23.1 207.4 13.4
TOTAL CONTINENTAL Continental - AIR Continental - SEA
396 268 4.1 1.4 -32.3 -3.4
TOTAL TRANSATLANTIC 660 1468 6.8 7.5 122.4 9.8
TOTAL SEA PASSENGER 3221 4611 33.2 23.5 43.2 -4.2
TOTAL AIR PASSENGER 6493 15041 66.8 76.5 131.6 12.1
TOTAL PASSENGERS 9714 19652 100.0 100.0 102.3 8.2
122
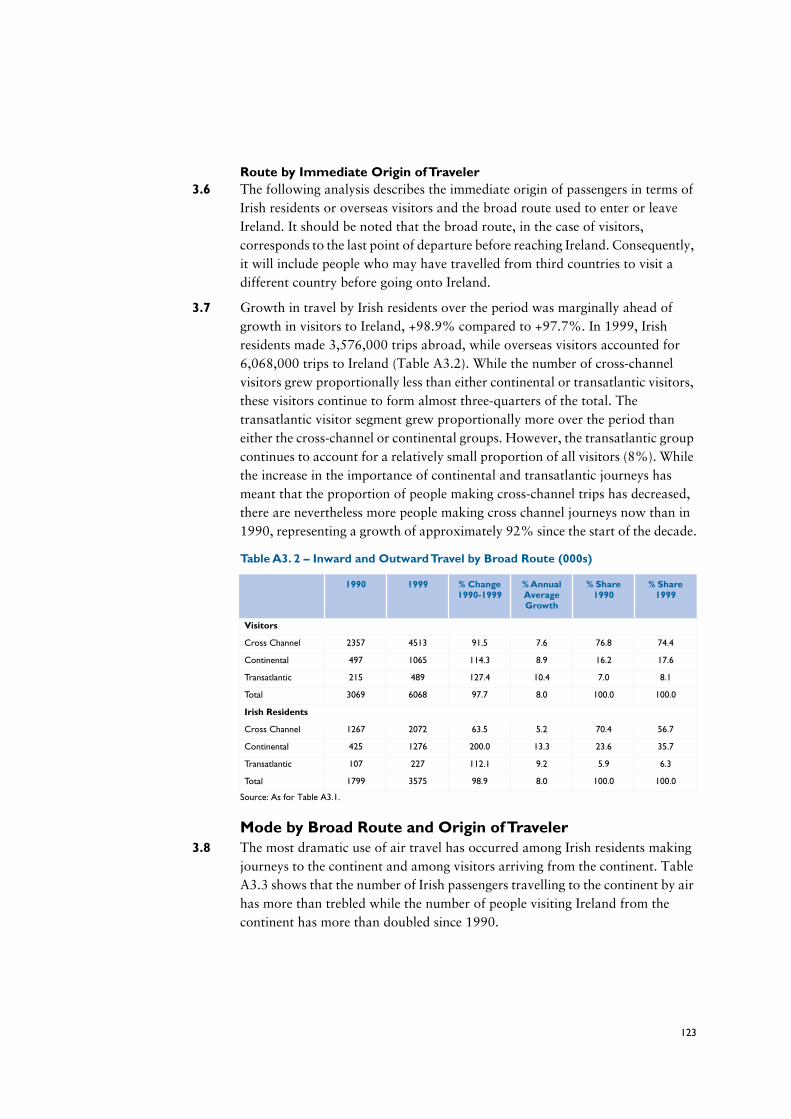
Route by Immediate Origin of Traveler3.6 The following analysis describes the immediate origin of passengers in terms of
Irish residents or overseas visitors and the broad route used to enter or leave Ireland. It should be noted that the broad route, in the case of visitors, corresponds to the last point of departure before reaching Ireland. Consequently, it will include people who may have travelled from third countries to visit a different country before going onto Ireland.
3.7 Growth in travel by Irish residents over the period was marginally ahead of growth in visitors to Ireland, +98.9% compared to +97.7%. In 1999, Irish residents made 3,576,000 trips abroad, while overseas visitors accounted for 6,068,000 trips to Ireland (Table A3.2). While the number of cross-channel visitors grew proportionally less than either continental or transatlantic visitors, these visitors continue to form almost three-quarters of the total. The transatlantic visitor segment grew proportionally more over the period than either the cross-channel or continental groups. However, the transatlantic group continues to account for a relatively small proportion of all visitors (8%). While the increase in the importance of continental and transatlantic journeys has meant that the proportion of people making cross-channel trips has decreased, there are nevertheless more people making cross channel journeys now than in 1990, representing a growth of approximately 92% since the start of the decade.
Source: As for Table A3.1.
Mode by Broad Route and Origin of Traveler3.8 The most dramatic use of air travel has occurred among Irish residents making
journeys to the continent and among visitors arriving from the continent. Table A3.3 shows that the number of Irish passengers travelling to the continent by air has more than trebled while the number of people visiting Ireland from the continent has more than doubled since 1990.
Table A3. 2 – Inward and Outward Travel by Broad Route (000s)
1990 1999 % Change 1990-1999
% Annual Average Growth
% Share 1990
% Share 1999
Visitors
Cross Channel 2357 4513 91.5 7.6 76.8 74.4
Continental 497 1065 114.3 8.9 16.2 17.6
Transatlantic 215 489 127.4 10.4 7.0 8.1
Total 3069 6068 97.7 8.0 100.0 100.0
Irish Residents
Cross Channel 1267 2072 63.5 5.2 70.4 56.7
Continental 425 1276 200.0 13.3 23.6 35.7
Transatlantic 107 227 112.1 9.2 5.9 6.3
Total 1799 3575 98.9 8.0 100.0 100.0
123
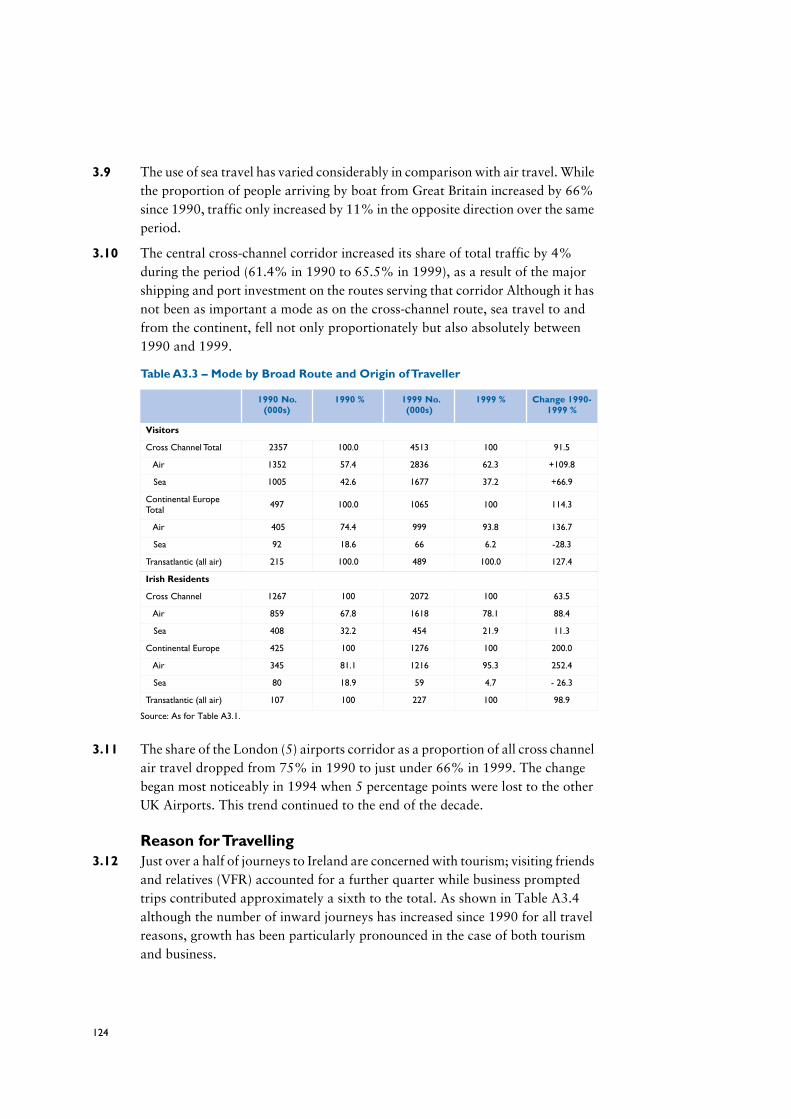
3.9 The use of sea travel has varied considerably in comparison with air travel. While the proportion of people arriving by boat from Great Britain increased by 66% since 1990, traffic only increased by 11% in the opposite direction over the same period.
3.10 The central cross-channel corridor increased its share of total traffic by 4% during the period (61.4% in 1990 to 65.5% in 1999), as a result of the major shipping and port investment on the routes serving that corridor Although it has not been as important a mode as on the cross-channel route, sea travel to and from the continent, fell not only proportionately but also absolutely between 1990 and 1999.
Source: As for Table A3.1.
3.11 The share of the London (5) airports corridor as a proportion of all cross channel air travel dropped from 75% in 1990 to just under 66% in 1999. The change began most noticeably in 1994 when 5 percentage points were lost to the other UK Airports. This trend continued to the end of the decade.
Reason for Travelling3.12 Just over a half of journeys to Ireland are concerned with tourism; visiting friends
and relatives (VFR) accounted for a further quarter while business prompted trips contributed approximately a sixth to the total. As shown in Table A3.4 although the number of inward journeys has increased since 1990 for all travel reasons, growth has been particularly pronounced in the case of both tourism and business.
Table A3.3 – Mode by Broad Route and Origin of Traveller
1990 No. (000s)
1990 % 1999 No. (000s)
1999 % Change 1990-1999 %
Visitors
Cross Channel Total 2357 100.0 4513 100 91.5
Air 1352 57.4 2836 62.3 +109.8
Sea 1005 42.6 1677 37.2 +66.9
Continental Europe Total 497 100.0 1065 100 114.3
Air 405 74.4 999 93.8 136.7
Sea 92 18.6 66 6.2 -28.3
Transatlantic (all air) 215 100.0 489 100.0 127.4
Irish Residents
Cross Channel 1267 100 2072 100 63.5
Air 859 67.8 1618 78.1 88.4
Sea 408 32.2 454 21.9 11.3
Continental Europe 425 100 1276 100 200.0
Air 345 81.1 1216 95.3 252.4
Sea 80 18.9 59 4.7 - 26.3
Transatlantic (all air) 107 100 227 100 98.9
124

3.13 The proportions of visitors and Irish residents travelling for business reasons are now approximately equal. However the growth in business-related journeys among Irish residents has been less than that which occurred among visitors to Ireland over the period.
Source: As for Table 1.
Seasonality3.14 Examination of the pattern of travel since 1990 by quarter suggests that while
there are strong seasonal effects, inward and outward travel this has become generally less peaked across the main routes. For example, the proportion of visitors on the continental route peaked at 49% for the July-September quarter during the early 1990s but this has declined steadily to 42% in 1999. Similarly, the proportion Irish residents travelling by air across to Britain during the same quarter has declined from approximately 32% in the first half of the decade to reach 26% by 1999.
Table A3.4 – Reason for Travelling by Origin of Traveller
1993 No. 1993% 1999 No. 1999 % Change 1990-1999 %
Visitors
Business 497 14.9 994 16.4 100.0
Tourist 1622 48.7 3306 54.5 103.8
Visiting Friends and Relatives 980 29.4 1439 23.7 46.8
Other 233 7.0 328 5.4 40.8
Total 3333 100.0 6068 100.0 82.1
Irish residents
Business 373 18.1 594 16.7 59.2
Tourist 857 41.7 1752 49.1 104.4
Visiting Friends and Relatives 622 30.3 958 26.9 54.0
Other 204 9.9 261 7.3 27.9
Total 2056 100.0 3565 100.0 73.4
125

3.15 As shown in Figure A3.3, when analysed by reason of travel, there is little variation in seasonal patterns shown by inward visitors and outward residents. There were however clear differences in the seasonal pattern when examined according to journey purpose. Business travel displays the least seasonal variation among both visitors and residents while, as would be expected, tourists show the most peaked behaviour, with the highest proportion of journeys being made in the July-September period
3.16 Although journeys made to visit friends and relatives are less peaked in comparison to tourist journeys, these too reach their highest level in the July-September quarter. Inward visits prompted by this reason are slightly more peaked than outward visits.
Origin of Visitors3.17 As previously mentioned, analysis by broad route does not necessarily imply that
inward travelers actually originate from the starting point of their journey to Ireland. Table A3.5 below shows the national origin of inward travelers. Visitors from Britain as share of total visitors remained unchanged at 57.7% during the decade, whilst North American visitors increased their share by nearly 2% points to 16%. European visitor share dropped by just under 2% points between 1990 and 1999 with a current share of 22% having achieved a high of 23% in 1993. North American visitors had the fastest growth of +114% (an average +10% per annum) and in contrast European visitors grew by only 78% (an average +7% per annum).
126

Source: As for Table 1.
3.18 Table A3.5b shows that over 20% of people who visit Ireland from Great Britain originate from elsewhere. (This proportion rises to 25% in the case of people traveling to Ireland by plane.) In order of importance, North Americans and people from mainland European countries comprise 12% and 8% of the visitors which reach Ireland using the crosschannel route.
3.19 The proportion of continental European visitors travelling over the peak (July – September) period dropped from 50% between 1990 and 1993 to 43% in 1999.
Source: As for Table 1.
3.20 Between 1990 and 1994 an average of about 44% of North American visitors came to Ireland during the peak period. In the last three years this proportion has averaged at 39% of the total. Britain visitors during the peak period accounted for 36% of annual visitors between 1990 and 1992 this figure had now fallen to 32% in 1999.
Route Segment Analysis Visitors to Ireland by route and Market Area 1995-1999
3.21 During the period 1995 – 1998 continental visitors using cross channel routes in preference to direct routes accounted for around 30% of the total. However this figure dropped to 26.3% by 1999.
Table A3.5a – Origin of Visitors to Ireland 1990-1999
Origin 1990 No. 1990 % 1999 No. 1999 % Change 1990-1999 %
Annual Average %
Britain 1785 57.7 3430 57.7 92.2 7.6
North America 443 14.3 950 16.0 114.4 9.7
Mainland Europe 744 24.0 1321 22.2 77.6 6.7
Other Areas 124 4.0 243 4.1 96.0 8.6
Total 3096 100.0 5943 100.0 92.0 7.6
Table A3.5b – National Origin of Visitors to Ireland by Broad Route and Mode
GB Continental N. America Other Total
Cross Channel %
3538 (78.4)
347 (7.7)
425 (12.0)
203 (4.5)
4513 (100.0)
Air %
2130 (75.1)
208 (7.3)
335 (11.8)
163 (5.7)
2836 (100.0)
Sea 1408 (84.0)
139 (8.3)
90 (5.4)
40(2.4)
1677 (100.0)
Continental 983 (92.3)
82 (7.7)
1062
Transatlantic 478 (97.8)
11 (2.2)
489
127
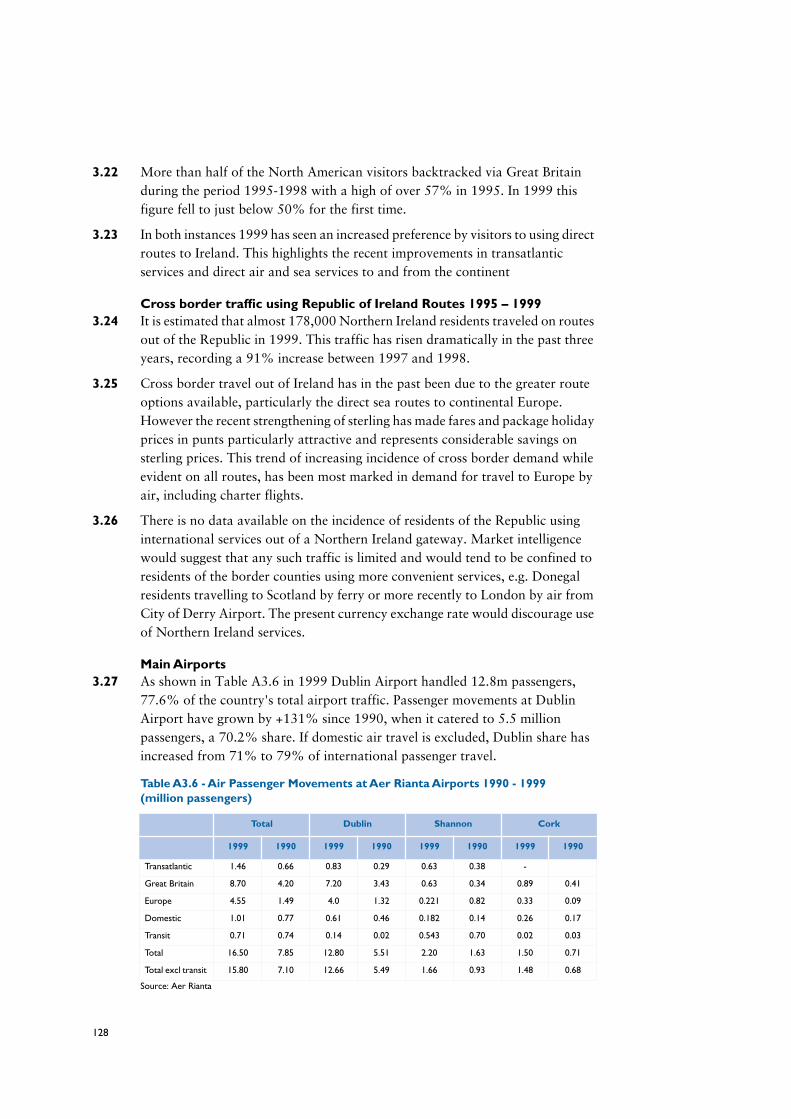
3.22 More than half of the North American visitors backtracked via Great Britain during the period 1995-1998 with a high of over 57% in 1995. In 1999 this figure fell to just below 50% for the first time.
3.23 In both instances 1999 has seen an increased preference by visitors to using direct routes to Ireland. This highlights the recent improvements in transatlantic services and direct air and sea services to and from the continent
Cross border traffic using Republic of Ireland Routes 1995 – 19993.24 It is estimated that almost 178,000 Northern Ireland residents traveled on routes
out of the Republic in 1999. This traffic has risen dramatically in the past three years, recording a 91% increase between 1997 and 1998.
3.25 Cross border travel out of Ireland has in the past been due to the greater route options available, particularly the direct sea routes to continental Europe. However the recent strengthening of sterling has made fares and package holiday prices in punts particularly attractive and represents considerable savings on sterling prices. This trend of increasing incidence of cross border demand while evident on all routes, has been most marked in demand for travel to Europe by air, including charter flights.
3.26 There is no data available on the incidence of residents of the Republic using international services out of a Northern Ireland gateway. Market intelligence would suggest that any such traffic is limited and would tend to be confined to residents of the border counties using more convenient services, e.g. Donegal residents travelling to Scotland by ferry or more recently to London by air from City of Derry Airport. The present currency exchange rate would discourage use of Northern Ireland services.
Main Airports3.27 As shown in Table A3.6 in 1999 Dublin Airport handled 12.8m passengers,
77.6% of the country's total airport traffic. Passenger movements at Dublin Airport have grown by +131% since 1990, when it catered to 5.5 million passengers, a 70.2% share. If domestic air travel is excluded, Dublin share has increased from 71% to 79% of international passenger travel.
Source: Aer Rianta
Table A3.6 - Air Passenger Movements at Aer Rianta Airports 1990 - 1999 (million passengers)
Total Dublin Shannon Cork
1999 1990 1999 1990 1999 1990 1999 1990
Transatlantic 1.46 0.66 0.83 0.29 0.63 0.38 -
Great Britain 8.70 4.20 7.20 3.43 0.63 0.34 0.89 0.41
Europe 4.55 1.49 4.0 1.32 0.221 0.82 0.33 0.09
Domestic 1.01 0.77 0.61 0.46 0.182 0.14 0.26 0.17
Transit 0.71 0.74 0.14 0.02 0.543 0.70 0.02 0.03
Total 16.50 7.85 12.80 5.51 2.20 1.63 1.50 0.71
Total excl transit 15.80 7.10 12.66 5.49 1.66 0.93 1.48 0.68
128

3.28 Dublin and Dun Laoghaire ports catered to 2,762,000 passenger movements in 1999. The growth in passengers on these routes has exceeded the growth in total demand for sea crossings so that the central corridor now handles 65.5% of all sea passengers (1999), compared with a 61.4% share in 1990.
Regional Airports3.29 According to Department of Public Enterprise figures (as set ou in Table ,
Connaught/Kock has had the largest number of passenger movements in recent years with almost 200,000 passengers in 1999. Kerry is second largest with over almost 165,000 passengers, and Galway third with 91,000 passengers in 1999. Other regional airports have relatively small passengers movements. In total the combined passenger movements through regional airports was approximately 518,000 passengers in 1999.
INTERPRETATION OF THE REVIEW – DRIVERS OF GROWTH
3.30 There are several factors that have contributed to the exceptionally fast growth in travel to/from Ireland, particularly during the latter half of the nineties. We will examine these within the major segments. However, probably the most significant was the decrease in airfares.
Liberalisation of Air Travel3.31 As a consequence of increasing deregulation, airfares have fallen by as much as
70% (1986-2000). Deregulation has also been accompanied by aggressive commercial policy on the part of carriers regarding reservation systems, ground handling and airport charges and the elimination of in-flight catering which have lowered external airline costs. Also carrier competition has been accompanied by increased competition between airports
Air Access 3.32 The early years of the decade saw a consolidation and in some instances a
withdrawal of air service - BA withdrew from Ireland routes in 1991; Aer Lingus ceased its Chicago service; and most carriers reduced capacity and frequency due to the impact of the Gulf War.
Table A3.7. Regional Airport Passenger Movements
1997 1998 1999
Connaught/Knock 172,070 186,689 197,358
Kerry 123,601 157,173 164,742
Galway 74,431 91,295 91,276
Sligo 21,308 23,646 24,234
Donegal 21,681 15,119 23,136
129

3.33 However the liberalisation of access air transport regimes in Europe resulted in increased capacity and more competition (including new carrier entrants), with subsequent lower fares, new routes and consequent increased capacities.
3.34 The most marked example was the generative effect of the Ryanair, low fare carrier, which during the 1990s refocused its strategy with an expansion of its cross channel route network and the introduction of routes to Paris and Brussels. The stimulative effect can be seen on traffic growth in the latter part of the 1990s. However this would appear to have reached a plateau, as little growth has occurred on cross channel routes throughout 1999 and early 2000.
3.35 At the same time several new carriers entered the Ireland market and incumbent carriers expanded their capacities on cross channel and European routes. The number of carriers serving Ireland expanded, while a major reinvestment programme by Aer Lingus resulted in significant fleet expansion, new route developments and more attractive tariffs.
3.36 The impact of Aer Lingus's new strategy was most marked on continental European routes - which resulted in significantly increased traffic and on the North Atlantic where since 1994 has expanded the number of gateways served from two (JFK & Boston) to six (adding Chicago, Newark, Los Angels and Baltimore). The introduction of A330 aircraft enabled a higher frequency and greater capacity to be offered on the route. In addition the alleviation of the regulatory "Shannon stop" made the Ireland route more attractive to US carriers, with the entry of Continental in 1998, followed by a new JFK service by Delta in 1999.
3.37 The charter capacity on offer out of Ireland to sun destinations and inbound for European visitors have each increased over the period to meet increasing demand. However the inbound charter series appear to be contracting in recent years and maybe feeling the competitive impact from low fare carriers.
3.38 The lower airfare structures have contributed to a shift from sea to air travel, encouraging growth in short-stay trips.
Sea Access3.39 Capacity on cross channel routes has increased significantly over the period
Business Travel3.40 While difficult to appraise the importance of lower fares on business travel, this
market segment is highly correlated with economic growth. The fact that so much of recent economic growth has been driven by inward investment could explain why the growth in inward business travel compared to outward business travel. There is possibly less of a need for Irish based personnel working in transnational corporations to travel outwards because staff located in destination countries can address local and corporate requirements.
130

Tourism/Leisure Travel3.41 The number of passengers travelling aboard for tourism has increased
substantially since 1993. Studies suggest that the propensity to undertake tourist travel is influenced by a number of factors including growth in employment and personal incomes, cost of travel cost of holiday (accommodation, sustenance and activities) and accessibility.
3.42 There have also been very favourable trends in Ireland in recent years among the other factors. Employment growth has meant that more people have the ability to undertake overseas travel. In addition to this average disposable incomes have increased. Employment growth has occurred amongst people in younger working age groups who have traditionally higher propensity to make tourist trips abroad reflected in high incidence of short trips aboard and the increase in demand for summer and winter sun holidays.
3.43 Coinciding with the demographic, social and economic changes in Ireland the marketing of travel has increased and become more proactive, aggressive and innovative. This trend is evident from the activities of destinations, carriers, tour operators and other travel intermediaries. As in other markets travel shopping has become more easily accessible and convenient.
Inbound Tourism3.44 Major growth in tourism in Ireland has occurred due to the falling cost of travel
and the following factors :
• Major investment in visitor attractions ;
• Increased destination marketing;
• Combination of strong economic performance and the Northern Ireland Peace Process;
3.45 However, there have been changes in the type of visitor, growth has been strong among people paying shorter stay visits focusing on Dublin in particular while longer stays in the rest of the country have not grown as much.
Visiting Friends and Relatives3.46 As a small country with a substantial tradition of net emigration and now more
recently net immigration, visiting friends and relatives has been and is likely to remain an important component of journey purpose to and from Ireland. Although trends generally considered to be influenced by the same factors that prompt tourism, social and family networks impose natural limits on the extent that these types of journeys can be made and this is reflected in lower growth in VFR compared to purely tourist trips. Not a lot is known about ultimate destinations of outward VFR but likely to broadly reflect the inward pattern.
131

132
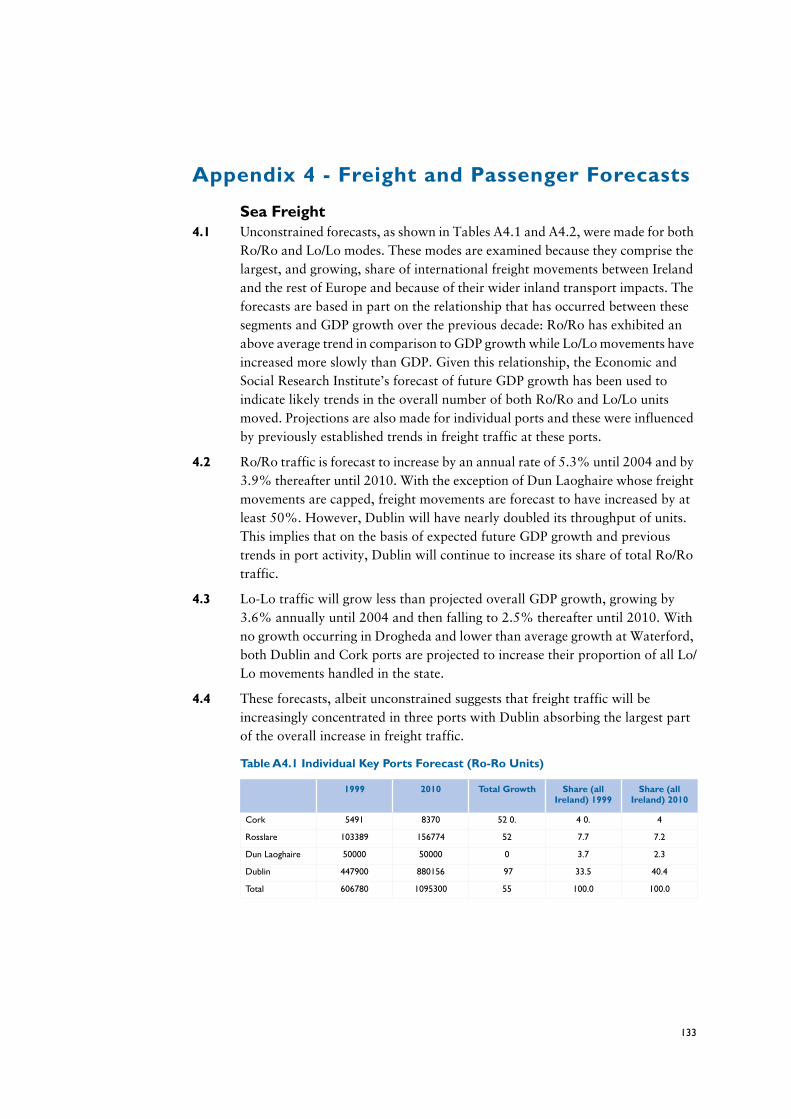
Appendix 4 - Freight and Passenger Forecasts
Sea Freight4.1 Unconstrained forecasts, as shown in Tables A4.1 and A4.2, were made for both
Ro/Ro and Lo/Lo modes. These modes are examined because they comprise the largest, and growing, share of international freight movements between Ireland and the rest of Europe and because of their wider inland transport impacts. The forecasts are based in part on the relationship that has occurred between these segments and GDP growth over the previous decade: Ro/Ro has exhibited an above average trend in comparison to GDP growth while Lo/Lo movements have increased more slowly than GDP. Given this relationship, the Economic and Social Research Institute’s forecast of future GDP growth has been used to indicate likely trends in the overall number of both Ro/Ro and Lo/Lo units moved. Projections are also made for individual ports and these were influenced by previously established trends in freight traffic at these ports.
4.2 Ro/Ro traffic is forecast to increase by an annual rate of 5.3% until 2004 and by 3.9% thereafter until 2010. With the exception of Dun Laoghaire whose freight movements are capped, freight movements are forecast to have increased by at least 50%. However, Dublin will have nearly doubled its throughput of units. This implies that on the basis of expected future GDP growth and previous trends in port activity, Dublin will continue to increase its share of total Ro/Ro traffic.
4.3 Lo-Lo traffic will grow less than projected overall GDP growth, growing by 3.6% annually until 2004 and then falling to 2.5% thereafter until 2010. With no growth occurring in Drogheda and lower than average growth at Waterford, both Dublin and Cork ports are projected to increase their proportion of all Lo/Lo movements handled in the state.
4.4 These forecasts, albeit unconstrained suggests that freight traffic will be increasingly concentrated in three ports with Dublin absorbing the largest part of the overall increase in freight traffic.
Table A4.1 Individual Key Ports Forecast (Ro-Ro Units)
1999 2010 Total Growth Share (all Ireland) 1999
Share (all Ireland) 2010
Cork 5491 8370 52 0. 4 0. 4
Rosslare 103389 156774 52 7.7 7.2
Dun Laoghaire 50000 50000 0 3.7 2.3
Dublin 447900 880156 97 33.5 40.4
Total 606780 1095300 55 100.0 100.0
133
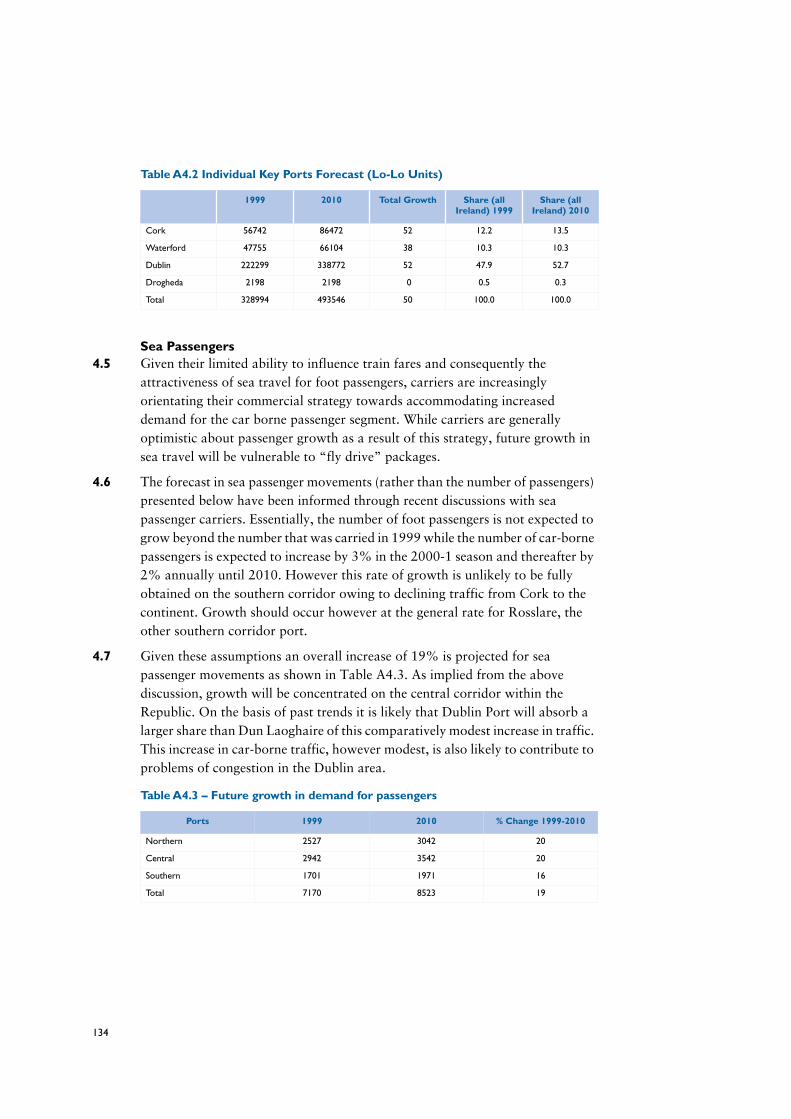
Sea Passengers4.5 Given their limited ability to influence train fares and consequently the
attractiveness of sea travel for foot passengers, carriers are increasingly orientating their commercial strategy towards accommodating increased demand for the car borne passenger segment. While carriers are generally optimistic about passenger growth as a result of this strategy, future growth in sea travel will be vulnerable to “fly drive” packages.
4.6 The forecast in sea passenger movements (rather than the number of passengers) presented below have been informed through recent discussions with sea passenger carriers. Essentially, the number of foot passengers is not expected to grow beyond the number that was carried in 1999 while the number of car-borne passengers is expected to increase by 3% in the 2000-1 season and thereafter by 2% annually until 2010. However this rate of growth is unlikely to be fully obtained on the southern corridor owing to declining traffic from Cork to the continent. Growth should occur however at the general rate for Rosslare, the other southern corridor port.
4.7 Given these assumptions an overall increase of 19% is projected for sea passenger movements as shown in Table A4.3. As implied from the above discussion, growth will be concentrated on the central corridor within the Republic. On the basis of past trends it is likely that Dublin Port will absorb a larger share than Dun Laoghaire of this comparatively modest increase in traffic. This increase in car-borne traffic, however modest, is also likely to contribute to problems of congestion in the Dublin area.
Table A4.2 Individual Key Ports Forecast (Lo-Lo Units)
1999 2010 Total Growth Share (all Ireland) 1999
Share (all Ireland) 2010
Cork 56742 86472 52 12.2 13.5
Waterford 47755 66104 38 10.3 10.3
Dublin 222299 338772 52 47.9 52.7
Drogheda 2198 2198 0 0.5 0.3
Total 328994 493546 50 100.0 100.0
Table A4.3 – Future growth in demand for passengers
Ports 1999 2010 % Change 1999-2010
Northern 2527 3042 20
Central 2942 3542 20
Southern 1701 1971 16
Total 7170 8523 19
134
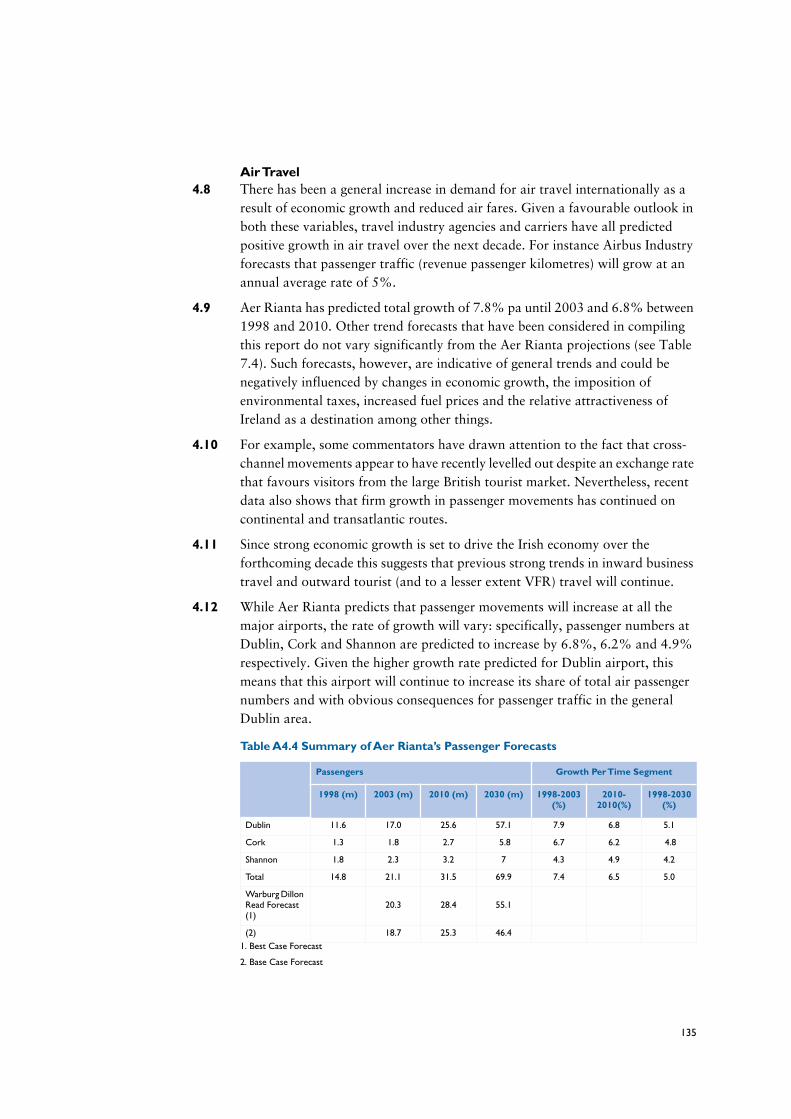
Air Travel4.8 There has been a general increase in demand for air travel internationally as a
result of economic growth and reduced air fares. Given a favourable outlook in both these variables, travel industry agencies and carriers have all predicted positive growth in air travel over the next decade. For instance Airbus Industry forecasts that passenger traffic (revenue passenger kilometres) will grow at an annual average rate of 5%.
4.9 Aer Rianta has predicted total growth of 7.8% pa until 2003 and 6.8% between 1998 and 2010. Other trend forecasts that have been considered in compiling this report do not vary significantly from the Aer Rianta projections (see Table 7.4). Such forecasts, however, are indicative of general trends and could be negatively influenced by changes in economic growth, the imposition of environmental taxes, increased fuel prices and the relative attractiveness of Ireland as a destination among other things.
4.10 For example, some commentators have drawn attention to the fact that cross-channel movements appear to have recently levelled out despite an exchange rate that favours visitors from the large British tourist market. Nevertheless, recent data also shows that firm growth in passenger movements has continued on continental and transatlantic routes.
4.11 Since strong economic growth is set to drive the Irish economy over the forthcoming decade this suggests that previous strong trends in inward business travel and outward tourist (and to a lesser extent VFR) travel will continue.
4.12 While Aer Rianta predicts that passenger movements will increase at all the major airports, the rate of growth will vary: specifically, passenger numbers at Dublin, Cork and Shannon are predicted to increase by 6.8%, 6.2% and 4.9% respectively. Given the higher growth rate predicted for Dublin airport, this means that this airport will continue to increase its share of total air passenger numbers and with obvious consequences for passenger traffic in the general Dublin area.
1. Best Case Forecast
2. Base Case Forecast
Table A4.4 Summary of Aer Rianta’s Passenger Forecasts
Passengers Growth Per Time Segment
1998 (m) 2003 (m) 2010 (m) 2030 (m) 1998-2003 (%)
2010-2010(%)
1998-2030 (%)
Dublin 11.6 17.0 25.6 57.1 7.9 6.8 5.1
Cork 1.3 1.8 2.7 5.8 6.7 6.2 4.8
Shannon 1.8 2.3 3.2 7 4.3 4.9 4.2
Total 14.8 21.1 31.5 69.9 7.4 6.5 5.0
Warburg Dillon Read Forecast (1)
20.3 28.4 55.1
(2) 18.7 25.3 46.4
135

Airfreight4.13 Table A4.5 shows that with the exception of Cork, the airfreight forecast
assumes that the overall and individual airport trends established in the previous decade will continue until 2010. These growth rate suggest that the total tonneage of air freight handled will more than double over the forecast period. Dublin Airport is projected to increase its share of air freight from 71% in 1999 to 74% in 2010.
(1) Assumes growth rate of 12% because of low base. Actual annual average growth was 25% between 1990 and 1999
Source Data: Aer Rianta
4.14 Air Freight is a high value sector relative to the volume of goods carried. It is expected that growth in the movement of goods by air will be closely linked to the economic success of the sectors of the Irish economy within the high technology industry.
4.15 The overall annual growth rate of 9% in airfreight moved at Irish airports compares with an Airbus Industry prediction of a 6% growth (freight tonne kilometres) over the next two decades.
4.16 With the growth in internationally traded services, the development of low volume high value manufacturing (eg microchips) in Ireland and the increasing application of Just in Time (JIT) logistics systems the role of airfreight has become increasingly important. So much so in fact that the close proximity to an airport is becoming an increasingly important factor in site selection for new businesses.
Table A4.5 Air Freight Forecast incl Mail 1999 –2010 (Metric Tonnes)
1999 2010 Annual Average Growth %
Dublin 112124 301070 9
Shannon 34714 67124 6
Cork 11723 40779 121
Total 158561 408973 9
136

Appendix 5 - Recent Infrastructure Improvements5.1 Under E.U. Cohesion and Structural Funds Ireland has seen major expansion in
the level of investment in road infrastructure. The first integrated transport programme – the Operational Programme for Peripherality – covered the period 1989 – 1993. Under this first programme some £600 million was provided to upgrade the road network.
5.2 As part of the Community Support Framework (CSF) for Ireland 1994/1999 a development strategy has been implemented. Expenditure under this framework has totalled some £8.7 billion to date. One of the main priorities of this strategy was the improvement of Ireland’s competitive position by investing in economic infrastructure.
5.3 Arising from a provision in the mid term review of the CSF for a review of progress there was a major reallocation of 161 million Euros (mostly from the LUAS Dublin Light Rail project) to other public transport projects in the Dublin region and to improvements in the national roads network.
5.4 Transport infrastructure accounted for almost 50% of the 1,755 million Euros allocated for the improvement of the economic infrastructure.
5.5 The main objective of this Operational Programme for Transport was to provide essential infrastructural support for the development of the productive sectors of the Irish economy, and the creation of long term sustainable employment. The primary transport objectives of the programme were to:
• Improve internal and access transport infrastructure and facilities on an integrated basis, thereby reducing transport costs and offsetting the negative effects of peripherality; and
• Improve the reliability of the transport system by removing bottlenecks, remedying capacity deficiencies and reducing absolute journey times and journey time variance.
5.6 There were two sub programmes under transport:
• The National Economic Development Sub Programme which covered investment in strategic transport infrastructure and facilities, principally national roads, mainline rail, commercial seaports and the State airports;
• The Sub Regional Economic Development Sub Programme which dealt with investment in key sub regional and local transport infrastructure and facilities, primarily nonnational roads, the Dublin Transport Initiative and regional ports.
137

5.7 The indications are that the objectives set under these programmes have largely been met. As of 1998 some 57% of the national primary road network had been upgraded to an interurban standard of speeds up to 80 kph. Only 35% of the nation’s road network reached this standard at the beginning of the programme. The original target had been to improve 58% of the road network.
5.8 Time savings on major road corridors as a result of major improvements amounted to 124 minutes at the end of 1998, compared to the original target of achieving a saving of 176 minutes. Predictions for made during 1998 estimated that this target would be met by the end of 1999.
5.9 With regard to main line rail passenger numbers have increase by 1.6 million between 1994 and 1998. This figure is 0.3 million in excess of the original target for 1999.
5.10 The planned improvements to State airports were completed by 1997, where numbers of passengers and throughput of cargo have been higher than the original targets. Similarly there have been substantial increases in passenger numbers and Ro/Ro, Lo/Lo and bulk traffic at seaports. The original target of reducing combined ports and shipping costs to port users by 15% has been achieved.
5.11 Some 1,694 km of non national roadway were improved by the end of 1998. A large number of other transportation projects were also carried out under the Dublin Transportation Initiative such as quality bus corridors, cycleways, street improvements and improved facilities for the mobility impaired.
5.12 During the period from 1994 to 1999 Ireland’s infrastructure benefited from the E.U. Cohesion Fund. This fund was established under the terms of the Treaty of Maastricht and is aimed at reducing social and economic disparities between Member States.
5.13 More than 100 projects have been improved in Ireland since 1993, mostly larger infrastructure schemes. Roads investment co-financed by this Fund resulted in the provision of 171 km of motorway, 157 km of single carriageway, and 47 km of dual carriageway. These schemes included Balbriggan By-Pass, the Southern Cross section of the Dublin Ring Road, Dunleer-Dundalk road, Arklow by-pass, and Portlaoise By-Pass.
138

5.14 The main line rail network renewal programme also benefited from this fund. Expenditure concentrated on those sections of the network that are included in the Trans European Networks of high speed, conventional rail and combined transport. Basic infrastructure was improved to facilitate higher operating speeds on radial routes from Dublin including Dublin to Belfast, Sligo, Galway, Limerick, Tralee, Cork and Waterford. Track has been upgraded by the provision of continuously welded rail and provision of concrete sleepers, combined with provision of improved signalling. The Cohesion fund has been combined with European Regional Development Fund to finance new rolling stock. In total 355km of track renewal was carried out, 46 bridges benefited from renewal works, some 164 level crossings were also improved.
5.15 Investment under the Cohesion Fund was also carried out at Dublin Airport.
Warehousing and offices at the airport were constructed to provide expanded facilities for the sorting and handling of freight. Upgraded infrastructure was also provided to improve freight handling facilities for wide-bodied aircraft.
139

140

Appendix 6 - National Landside Access Improvements
THE NATIONAL DEVELOPMENT PLAN 2000-20066.1 The National Development Plan (NDP) recognises the infrastructural deficits in
Ireland that threatens the achievement of economic and employment potential. This deficit relates to Roads , Public Transport, the Environment, Telecommunications and Energy Matters.
6.2 The NDP sets out to “…prepare the economy for the competitive challenges arising from the new and rapidly changing domestic and international economic conditions…”.
6.3 The Government has established a series of national objectives and a strategy for achieving these objectives. One of the key elements of the strategy is a major investment programme in Economic [and social] infrastructure.
6.4 For the purposes of EU aid programmes two regions have been established in Ireland :
• The Border Midlands and the West (BMW) region – Objective 1 area
• The South and East (S&E) region – Objective 1 in transition.
6.5 The key challenges for the BMW region have been identified as increase the potential of the region to attract more growth from the S&E region, increased sustainable growth, and improved economic infrastructure.
6.6 In the S&E region the main challenge is to address urban congestion, overcome bottlenecks to growth, and develop counter balances to Dublin’s growth through distribution of that growth throughout the region.
6.7 The NDP recognises that crucial associated challenges exist in Ireland, foremost of which is the better distribution of the “fruits of economic growth” both regionally and throughout society, and an appropriate balance between the environment and development.
6.8 The development of regional infrastructure is an important factor in achieving a more balanced approach to development. This development will be combined with a promotion of a small number of additional regional “Gateways” (urban growth centres) to complement existing gateways and to drive development throughout the regions. This concept has led to the recognition of the need for a National Spatial Strategy.
Proposed NDP Roads Investment 6.9 The NDP includes a development strategy for National Primary Roads totalling
some £4.4 billion. One of the primary aims of this strategy is to facilitate better access to and from the main ports and airports to offset the negative effects of peripherality.
141

6.10 The first element of the strategy is the development in their entirety by 2006 of the following routes to motorway/improved dual carriageway standard:
• Dublin to Border (M1);
• Galway to Dublin (N4/N6);
• Cork to Dublin (N8);
• Limerick to Dublin (N7); and
• Waterford to Dublin (N9) [although the exact road type will be subject to further evaluation]
6.11 The NDP also states that there will be improvements on other national primary routes including:
• Routes to the North West – N2 Dublin/Monaghan/Omagh/Derry/Letterkenny; N3 Dublin/Belturbet/Enniskillen/Derry; N4 Kinnegad to Sligo; N13-15 Sligo/Donegal/Lifford/Letterkenny/Derry; N16 Sligo/Blacklion/Enniskillen/ Dungannon/Larne (connecting routes indicated through Northern Ireland).
• The Western Corridor – N7/N18/N24/N25 from Sligo through Limerick to Rosslare; N5 Castlebar/Longford; N28 Cork/Ringaskiddy; N30 Enniscorthy/New Ross
• Completion of the M50 and the Dublin Port Access Tunnel.
6.12 A number of National Secondary Routes have also been identified for improvement, including:
BMW Region -• N56 Letterkenny/Dungloe/Donegal;
• N59 Ballisadare/Ballina/Westport/Clifden/Galway;
• N61 Athlone/Boyle;
• N80 Moate/Stradbally; and
• N52 Mullingar/Birr
S&E Region –• N52 Birr/Nenagh;
• N69 Tralee/Listowel/Limerick;
• N86 Tralee Dingle;
• N70 Tralee/Cahirciveen/Kenmare;
• N71 Killarney/Bantry/Bandon/Cork;
• N80 Stradbally/Bunclody;
• N81 Tallaght/Blessington; and
142

• N85 Ennis/Ennistymon.
6.13 On the main interurban routes the NDP states that the aim will be a minimum level of service equivalent to an average inter urban speed of 94 kph on dual carriageways and 105 kph on motorways.
Proposed NDP Public Transport Improvements6.14 The NDP outlines the key elements of the public transport improvements to be
carried out between 2000 – 2006, including:
Greater Dublin Area:
• Implementation of the light rail network (LUAS);
• Major Short Term investment in suburban rail including -
• Phased purchase of 46 additional DART cars and 58 diesel rail cars
• Upgrading of the Greystones to Arklow line
• Linking Heuston and Connolly stations to permit the Kildare Arrow service to run through to Connolly
• Quadrupling of track between Hazelhatch and Sallins to separate long distance and suburban services
• Provision of new stations at Intel, Lucan, north and south and Ashington
• Resignalling of Howth to Barrow Street
• Expansion and enhancement of the Bus Network including -
• Expansion of the bus network, including the provision of orbital and local routes to complement the existing largely radial network
• The phased purchase of 275 additional buses to increase passenger capacity and meet the development requirements of the network
• An ongoing bus replacement and equipment renewal programme
• The provision of five new Quality Bus Corridors, the enhancement of existing QBCs and the introduction of bus priority measures
• Promotion of transport integration through the provision of additional park and ride facilities and the introduction of integrated public transport ticketing
• Implementation of traffic management measures (& measures to respond to the needs of the mobility impaired and disabled) and additional cycling facilities
143
• A substantial provision for meeting the recommendations of the Strategic Rail Study and underground LUAS section. (Rail study should have been completed by end of 1999). PPP to be used for LRT and heavy rail where appropriate
• Investment to be complemented by a demand management strategy to be completed by the Dublin Transportation Office during 2000.
Regional Public Transport:
6.15 Major investment outside Dublin is also planned including:
• Implementation of the Railway Safety Programme
• Significant investment in mainline rail renewal
• Public transport development in the Greater Cork area, Limerick, Galway and Waterford
• Regional bus improvements
• Accessibility improvements to existing public transport infrastructure and facilities
• Bus Eireann ongoing fleet replacement and re-equipment
• Pilot measures for rural public transport to encourage local or community-based initiatives to provide bus services in rural areas.
Detailed National Development Plan Regional Investment ProposalsBMW Region Non National Roads :
6.16 The NDP identifies that there is a general poor quality of physical infrastructure within the BMW region (with the exception of the eastern part of the region) and a lack of efficient access to the main cities and ports.
6.17 A Local Infrastructure Sub Programme is proposed providing for non-national roads, regional airports and seaports.
6.18 At least 891million Euros will be invested in non-national roads in the BMW region the majority of which will be allocated to restoration and improvement with roughly one fifth for maintenance.
BMW Region Airports
6.19 Some £8 million (10.2 million Euros) is planed for improvements to the regions airports. The NDP acknowledges the importance of ease of access to regional airports in attracting foreign direct investment. It highlights the need to ensure that road links to Dublin, Cork and Shannon airports are improved, and the need to upgrade existing infrastructure at Donegal, Galway, Knock and Sligo given their role in improving tourism and business access to the region.
144
BMW Region Seaports
6.20 Planned expenditure on the region’s seaports is £10 million. The NDP acknowledges that “…geographical and commercial imperatives have dictated that the country’s main ports are located in the S&E region..”
6.21 There are 7 regional ports in the BMW region, with the main ones being Galway, Greenore, Dundalk and Drogheda. However the NDP also states that the total combined cargo throughput in 1998 for these ports amounted to only 5% of the national total, although their regional and local importance is recognised. No details are provided on how the proposed expenditure will be allocated.
S&E Region Non National Roads
6.22 The NDP allocates some £898 million towards non-national roads. Just over two thirds of this total amount will be allocated to the restoration and upgrading of non-national roads, with the remaining amount being allocated to maintenance.
6.23 The NDP acknowledges that non-national roads form an important part of the highway network serving urban centres, ports and airports. The expenditure will improve access from the more remote areas of the S&E Region to the strategic road network, and the ports and airports.
S&E Region Airports
6.24 Transport links, and particularly road links, to Dublin, Cork and Shannon airports is identified as the focus of the £3million planned expenditure under this heading.
6.25 In addition the two regional airports, Kerry and Waterford will benefits from improved infrastructural investment under this programme.
S&E Region Seaports
6.26 Improvements to the region’s seaports are planned totalling £36 million. All of Ireland’s major ports are located in this region including those operated by the seven state port companies – Cork, Dublin, Dun Laoghaire, Foynes, New Ross, Shannon Estuary, and Waterford. Rosslare is also located in this region and is operated by Iarnród Éireann.
6.27 However expenditure under this programme will be targeted at regional ports such as Arklow, Baltimore and Skibbereen, Bantry Bay, Dingle, Kinsale, Tralee and Fenit, Wicklow, Wexford and Youghal. Investment in these regional ports is to be “market driven…in response to actual market needs and non-displacement of seaborne trade”.
6.28 Works eligible under this programme include new port infrastructure, upgrading existing port infrastructure, improvement of capacity utilisation, and inter-modal connections. The NDP states that these measures will address capacity deficiencies in regional ports that could otherwise inhibit growth.
145

146

Appendix 7 - UK Landbridge Issues7.1 There are two main constraints on Irish Traffic utilising the UK landbridge:
• The current congestion experienced by all traffic on the UK motorway network particularly around Birmingham on the M6 and the road network in the South East and especially on the M25; and
• Only a limited number of road schemes will be constructed in the UK as the main thrust of policy reduced role for new road construction and increasing use of rail. There may be tolls imposed for use of new road schemes, and charges imposed for entering city centres within the next five years.
7.2 The following is a detailed investigation of transport issues in UK regions through which Irish freight and passengers are transported:
7.3 The Yorkshire and Humber region of central north and north eastern England has a well developed strategic road network. One of the main UK arteries is the A1/M1. From the north the A1 (M)/A1 provides a mostly dual carriageway route to Leeds where it becomes the M1 providing access to the M25 orbital route around London. The main UK east west route the M62 cross the region, which together with the A63/A1033 on the north bank of the Humber and the M180/A180 on the south bank provides the main Trans Pennine link and the principal access to the Humber Ports. The East Coast Main Line and the Midland Main Line railways provide the north south routes in the region with a number of additional Trans Pennine routes. The UK government has recently carried out consultation on the main transport issues affecting this region and has concluded that improvement of the routes to the Humber Ports, particularly Hull is one of the main areas where improvements need to be targeted. The A1033 (Hedon Road, Hull) improvements are therefore included in a programme to relieve congestion on the main access route to the Port of Hull.
7.4 In the South East England region the extent of the transport network is a major strength. Major road and rail links mainly provide radial routes to/from London, although it is recognised that east west connections are weaker. The ports in this region generally account for some 75% of international passenger movements and 15% of freight at all UK ports. London Heathrow and London Gatwick airports are located in this region. Again the UK Government has consulted locally on transport issues and has concluded that the main areas for improvement include, the widening of sections of the M25, improved access to Kent, by-passes of smaller towns and villages and improved access to the Port of Sheerness.
147

7.5 In the West Midlands there is a major concentration of the UK motorway network, including the M6 to Scotland and the north west, the M5 to the South West, the M40 to the south East, and east west routes such as the M42, M69, and A38. Several of these routes are also paralleled by major rail lines, and a new international freight terminal has been developed at Hams Hall east of Birmingham. Local consultation has revealed the need to keep traffic moving on the motorway network and the early completion of the Birmingham Northern Relief Road.
7.6 In the Eastern Region there are several main trunk roads and rail lines radiating to/from London. The area contains the main ports of Felixstowe, Harwich and Tilbury. Government consultation revealed concern from increasing accessibility from remote areas of the region, and dealing with congestion problems on main routes in Essex and Cambridgeshire, and removing traffic from local communities. No schemes have been included in the programme to specifically improve direct access to the regions ports, although freight traffic will benefit indirectly from reduced congestion and the provision of local by-passes. A UK national policy framework for major freight interchanges has been developed which seeks to improve the performance of “hubs” on the transport network in terms of catering for intermodal freight. At these hubs rail is seen as the “trunk haul” mode carrying large loads over longer distances. These hubs are seen as vital to maintaining UK trade with Europe. The need to maintain and improve the freight handling abilities of port and airports is also recognised although this must be balanced by environmental considerations. However a loss of efficiency at UK ports and airports has the potential to encourage a migration of development and associated employment to France, Belgium or the Netherlands which in turn would lead to goods being transported over greater distances by lorry.
7.7 An example of these objectives in practice is the Daventry International Rail Freight Terminal. This terminal is adjacent to the M1 and has direct access to the West Coast Main rail line, and provides facilities for fast, integrated road and rail distribution linking most UK cities within a one day return trip.
7.8 The need to reserve land adjacent to rail line for the future development of additional intermodal facilities etc is currently the subject of debate in the UK. The privatised rail industry is keen to sell off its inherited land bank for commercial reasons and is increasingly coming under pressure to hold this land as an asset for the potential development of future rail freight facilities.
148
7.9 A system of Rail Freight grants operates in the UK to fund the use of the rail network for freight, such as Freight Facilities Grant for investment in terminals, handling equipment and wagons. Significant finances have been allocated to railfreight grants in recent years with £40 million (sterling) being allocated for 1998/99. This grant is administered by central Government agencies and is one method of realising Government endorsed targets of to triple the amount of railfreight by 2010 and to increase the volume of containers carried by 50% over 5 years. Over 1998/99 rail freight already increased by 16%.
7.10 Railfreight links to ports in the UK are also being developed such as the proposed £8 million (sterling) investment by Railtrack on the Ipswich/Felixstowe link. Railtrack has also proposed the upgrading of the West Coast Main line to accommodate 9ft 6in containers.
7.11 Felixstowe is a good example of trends in the UK. The Felixstowe Dock and Railway Company and Railtrack are increasing rail operations by extending and improving the rail container handling facilities by means of a Freight Facilities Grant, improving signalling and a series of reliability and capacity improvements on the rail network. The aim is increased efficiency which also provides reduced road traffic, improved ship/rail intermodality, reduced road tonnage, and reduced road traffic emissions. The capacity of the port and surrounding rail network has increased from 32 to 48 trains per day.
7.12 The direction of UK Government transport policy is an important factor in assessing future trends in the movement of freight between Ireland and the UK and onwards to mainland Europe.
7.13 Current trends in UK transport policy recognise the importance of freight movement from and through the UK to continental Europe, (some 95% of UK trade by tonnage [and 75% by value] is carried by sea), however at the same time this is accompanied by view that road based freight traffic should be encouraged to make a shift towards utilising rail where possible. Clearly this is not a practical proposition for all freight but it will depend on the nature of the goods carried, costs, the availability of rail facilities and the range of origins and destinations to be served. The availability of grants from central government sources may tip the balance towards using rail freight in a limited number of cases where previously the costs would have been prohibitive or where there where previously no facilities present. This trend is part of a wider move towards more sustainable and integrated patterns of transport for both goods and people across the whole of Europe.
149

150
Appendix 8 – Trans European Networks8.1 The TENS concept has been developed to promote pan-European market
integration and economic and social cohesion. The concept was endorsed in the 1989 Commission communication entitled “Towards Trans-European Networks”. The meeting of the European Council in Strasbourg in December 1989 instructed the European commission to draw up a programme of work relating to transport, telecommunications, energy and training. In December 1990 a communication entitled “Towards Trans European Networks – for a Community Action Programme was published. TENs were endorsed by the Maastricht Treaty.
8.2 The map of the TENS routes is fairly comprehensive throughout Europe. The road network is predictably more dense than the rail network. Even after the completion of the 14 identified priority projects there remains a significant number of projects that will need to be developed and a significant amount of finance necessary to complete the network.
8.3 In the context of Ireland the road network includes links via national primary routes to all major cities and seaports. Although the rail network that has been identified as forming part of the TENs systems it is relatively limited covering only the rail lines between Cork, Dublin and Belfast with feeder routes to Limerick and Derry. The TENs network matches closely the improvements to Ireland’s Road network as set out in the National Development Plan. The NDP proposes rail improvements on the TENs network and elsewhere.
8.4 In the UK the network again covers road and rail links between major cities, the main seaports, and the Channel tunnel. The rail network extends as far north as Fort William in the Scottish Highlands to Southampton on the south coast of England, and covers rail line from Holyhead in the west to Felixstowe and Harwich in East Anglia. The road network extends to all the main Irish Sea ferryports and the main ports for access to Europe in the East.
8.5 However there is an important omission from the rail network in that the movement between Great Britain and Ireland via Rosslare to Fishguard/Pembroke Dock is not covered by the TENs system within Ireland or in the UK. The UK TENS rail line in South Wales stops at Cardiff although there is an existing rail line currently in place linking the ferry ports of Pembroke Dock and Fishguard to London. Although there are a limited number of HST units providing connections to departing/arriving ferries in west Wales, an hourly passenger service between London Paddington and Wales terminates at Swansea where passengers need to change to local services on much slower Sprinter and Pacer units.
8.6 There is also increasing demand for both passenger and rail freight traffic on this south Wales corridor. This is leading to competition between freight and passenger services for the limited number of train paths available with current speed restrictions and signalling.
151
8.7 A Eurofreight Terminal is currently being developed in Cardiff at a cost of £15 million by the local authority and private sector partners. This terminal will provide freight transfer facilities from road to frail for services to/from Europe via the Channel Tunnel. There are also proposals from Railtrack and other south Wales local authorities for a series of smaller freight depots on the South Wales main railway line to provide rail freight services connecting to the Eurofreight terminal.
8.8 There are also no through passenger trains to Waterloo (for the channel tunnel) from southwest Wales. A relatively infrequent direct service is operated by Wales and West trains from Cardiff to Waterloo for the Channel Tunnel, but services from west Wales terminate at London Paddington.
152

Bibliography1. NETA – Logistics Audit –Interim Report.
2. Strategy 2000-2016 –A Platform for Change. D.T.O. September 2000
3. A Spatial Vision for North West Europe- Interreg 11c Community Initiative. September 2000
4. Ireland National Development Plan 2000- 2006
5. Transport Needs of Irish Manufacturing Sectors- Forfas
6. Annual Competitiveness Report 2000. National Competitive Council –Forfas.
7. Proposals on Transport Infrastructure. The Planning Process and Public Transport. February 2000.
8. Enterprise 2010- A New Strategy for the Promotion of Enterprise in Ireland in the 21st Century. Forfas.
9. Commentary on Irish Transport Socioeconomics and Environmental Data. August 2000.
10. The NETA Project (Logistics Module) Interim Report. Transport Policy Research Institute- University College Dublin.
11. Trade and Transport Data Republic of Ireland.
12. Blueprint for Success- A Development Plan for the West 2000- 2006. Western Development Commission.
13. Blueprint for Investing in the West – Promoting Foreign Direct Investment in the West. Western Development Commission – October 1999.
14. Pilot Projects on Benchmarking of Framework Conditions – Benchmarking Logistics. Forfas
15. Report to the Minister for Public Enterprise and the Minister of Finance- Review of Strategic Options for the Future of Aer Rianta. Warburg Dillon Read. December 1999.
16. Infrastructure Priorities for the Enterprise Development in the Regions. Forfas, Enterprise and Trade Policy Division, April 1999.
17. Improvement of Air Services for the Business Sector at Cork and Shannon Airports. Forfas Air Services Group. October 1998.
18. Transport Corridors in Europe. Department of the Environment and Local Government. August 2000.
19. Information from the Strategic Planning Guidelines for the Greater Dublin Area. March 1999.
20. Medium Term Review : 1997-2003. The Economic and Social Research Institute. April 1997.
153

21. Air Traffic Forecasts for the United Kingdom 1997. Department of the Environment, Transport and the Regions.
22. Boeing Outlook for the Future of Commercial Aviation 1998. Current Market Outlook.
23. Global Market Forecast 2000- 2019. Airbus. July 2000.
24. Airport Competition in the Deregulated European Aviation Market.- Sean D. Barrett. Journal of Air Transport Management 6. 2000.
25. Irish Economics Statistics – Autumn 1999.
26. Irish Economics Statistics – Autumn 2000.
27. Ireland Vital Statistics – Marketing Services Division. February 2000.
28. National Spatial Strategy – The Scope and Delivery of the National Spatial Strategy. Spatial Planning Unit , Department of the Environment and Local Government May 2000.
29. Review of Road Plan and Access Facilities at Dublin Airport. Aer Rianta Technical Consultants August 1996.
30. CSO : Principal Statistics – Finance.
31. CSO : Principal Statistics – Industry.
32. CSO : Principal Statistics – Transport and Tourism.
33. CSO : Economic Series – Labour.
34. ESRI Medium Term Review.
35. Dublin Port Company Yearbook 2000
36. Cork Airport Development Plan Aer Rianta Scott Wilson & Kirkpatrick 1999
37. Port of Cork, strategic Development Study, Stage 1 Report, 1999 Posford Duvivier – KPMG, MDS, Parkman, Cunnane Stratton Reynolds
38. Spatial Patterns of Transportation – Atlas of Freight Transport in Europe.
154