transportation opportunities in the fec corridor
TRANSCRIPT

FFLLOORRIIDDAA EEAASSTT CCOOAASSTT CCOORRRRIIDDOORR SSTTRRAATTEEGGIICC RREEDDEEVVEELLOOPPMMEENNTT PPLLAANN FFEECC CCOORRRRIIDDOORR RRIIGGHHTT--OOFF--WWAAYY SSTTUUDDYY ((TTRRAANNSSPPOORRTTAATTIIOONN CCOOMMPPOONNEENNTT)) FFIINNAALL RREEPPOORRTT Prepared for: The City of Miami Prepared by: Fang Zhao Min-Tang Li L. David Shen Albert Gan Lehman Center for Transportation Research Department of Civil and Environmental Engineering Florida International University 10555 W Flagler Street Miami, Florida 33174 Phone: (305) 348-3821 Fax: (305) 348-2802 E-mail: [email protected] April 2002

TABLE OF CONTENTS 1. INTRODUCTION .............................................................................................................. 1
1.1 Purpose.................................................................................................................... 1 1.2 Background............................................................................................................. 1 1.3 Organizations .......................................................................................................... 2
2. REGIONAL TRANSPORTATION SYSTEMS ................................................................ 3 2.1 Highways ................................................................................................................ 3 2.2 Airports ................................................................................................................... 4 2.3 Seaports................................................................................................................... 5 2.4 Railroads ................................................................................................................. 7
2.4.1 Freight Rail ................................................................................................. 7 2.4.2 Passenger Rail............................................................................................. 7
3. LOCAL TRANSPORTATION SYSTEM.......................................................................... 9 3.1 Roadway System..................................................................................................... 9
3.1.1 Existing Street Functional Classifications .................................................. 9 3.1.2 Traffic Conditions..................................................................................... 12
3.2 Public Transit System ........................................................................................... 15 3.2.1 Miami-Dade Transit Agency .................................................................... 15 3.2.2 Jitney......................................................................................................... 18 3.2.3 Tri-County Commuter Rail Authority (Tri-Rail)...................................... 19
3.3 Airport................................................................................................................... 21 3.4 Port of Miami........................................................................................................ 21 3.5 Railroad................................................................................................................. 22
4. TRANSPORTATION OPPORTUNITIES AND CONSTRAINTS................................. 24 4.1 Introduction........................................................................................................... 24 4.2 Tri-Rail Service Extensions .................................................................................. 25 4.3 Miami Beach Light Rail........................................................................................ 29 4.4 East-West Multimodal Corridor ........................................................................... 32 4.5 Miami Intermodal Center...................................................................................... 33 4.6 Intermodal Facility at 79th Street .......................................................................... 35 4.7 Highway Improvements........................................................................................ 37 4.8 Non-Motorized Transportation System ................................................................ 42
4.8.1 Bicycle Facilities....................................................................................... 42 4.8.2 Pedestrian Facilities .................................................................................. 42 4.8.3 North Dade Greenways............................................................................. 42
4.9 Downtown Master Plan......................................................................................... 45 5. RECOMMENDED TRANSPORTATION IMPROVEMENTS...................................... 48
5.1 Public Transit Improvements................................................................................ 48 5.2 Roadway Improvements ....................................................................................... 57
6. CONCLUSIONS............................................................................................................... 60 REFERENCES ............................................................................................................................. 62 APPENDIX A TURNING MOVEMENT COUNTS................................................................ 65 APPENDIX B SPEED MEASUREMENTS ............................................................................. 73
ii

LIST OF TABLES Table 2.1 U.S. Airports Ranked by International Passengers................................................. 4 Table 2.2 U.S. Airports Ranked by Total Passengers............................................................. 5 Table 2.3 Operating Statistics of Major Airports in the Southeast Region............................. 5 Table 2.4 Florida Deepwater Seaports FY 00/01 Operation Measurements .......................... 6 Table 3.1 Miami-Dade County Shares of State Highway Lane-Miles and DVMT.............. 11 Table 3.2 Traffic Data Collection Tasks Conducted in the FEC Area ................................. 12 Table 3.3 Locations for Turning Movement Counts............................................................. 13 Table 3.4 Locations for Speed Measure................................................................................ 13 Table 3.5 Classification Count Summary ............................................................................. 14 Table 3.6 System Performance Summary for October 2001 ................................................ 15 Table 3.7 Metrobus Route Operating Statistics .................................................................... 17 Table 3.8 Major Activity Centers Served by Bus Routes in FEC Corridor Area ................. 18 Table 4.1 Summary of Five Alignments............................................................................... 29 Table 4.2 Characteristics of Four New Light Rail Systems in the U.S................................. 31 Table 4.3 Projects in Miami-Dade Five-Year Work Program.............................................. 37 Table 4.4 Future Cost Feasible Improvements for Bicycle Facilities................................... 42 Table 4.5 Future Cost Feasible Improvements for Pedestrian Facilities .............................. 43 Table 5.1 Capital Costs of Six Light Rail Systems in the U.S.............................................. 56 Table 5.2 Distribution of Light Rail Capital Costs by Cost Category (Percentiles)............. 56
iii

LIST OF FIGURES Figure 2.1 Interstate Highways ................................................................................................ 3 Figure 2.2 Major International Airports in Florida and Adjacent States.................................. 4 Figure 2.3 Major Ports in Florida............................................................................................. 6 Figure 2.4 Railroad Network in the Region ............................................................................. 7 Figure 2.5 Amtrak Services in the Region ............................................................................... 8 Figure 3.1 Roadway Functional Classification in the Study Area ......................................... 10 Figure 3.2 Number of Lanes of Major Roadways.................................................................. 11 Figure 3.3 Traffic Count Sites................................................................................................ 12 Figure 3.4 Metrobus Routes Serving the FEC Corridor Area................................................ 16 Figure 3.5 Jitney Routes in Miami-Dade County................................................................... 19 Figure 3.6 Tri-Rail System Map............................................................................................. 20 Figure 3.7 Tonnage Traded by Region................................................................................... 21 Figure 3.8 Railroad Rights-of-Way in Miami-Dade County and FEC Corridor Area........... 23 Figure 4.1 Dolphin Extension and Proposed Stations............................................................ 26 Figure 4.2 Kendall Extension and Proposed Stations ............................................................ 27 Figure 4.3 FEC Alignment and Proposed Stations................................................................. 28 Figure 4.4 Zagato's EuroTram................................................................................................ 30 Figure 4.5 Zagato Incentro Vehicle Operating in Milan, Italy............................................... 30 Figure 4.6 Light Rail in Selected U.S. Cities ......................................................................... 31 Figure 4.7 Proposed Bay Link Alignments in Downtown Miami ......................................... 32 Figure 4.8 Alignment of the East-West Rail Line.................................................................. 33 Figure 4.9 General Location of MIC...................................................................................... 34 Figure 4.10 Site Plan of MIC ................................................................................................... 35 Figure 4.11 Proposed Intermodal Facility at Biscayne Boulevard and 79th Street .................. 36 Figure 4.12 Year 1999 Base System Level of Service for Miami-Dade County..................... 40 Figure 4.13 Year 2025 Minimum Revenue Plan Level of Service for Miami-Dade County .. 41 Figure 4.14 North Dade Greenway Trails ................................................................................ 44 Figure 4.15 Flagler Trail Alignment ........................................................................................ 45 Figure 4.16 Transportation Improvements under Consideration ............................................. 46 Figure 5.1 Roadway Alignment for Alternatives A & D ....................................................... 51 Figure 5.2 Alignment for Alternatives B & C, Stop Design, and Trolley Line Siding.......... 52 Figure 5.3 Reconfiguration of 36th Street for Short-Term Alternative A............................... 53 Figure 5.4 Reconfiguration of 36th Street for Long-Term Alternative D............................... 54 Figure 5.5 Light Rail and Streetcars in Pedestrian Oriented Downtown Areas..................... 55 Figure 5.6 Intersection of NE 2nd Avenue and 34th Street...................................................... 57 Figure 5.7 Alternative Configuration of Intersection of NE 2nd Avenue and 34th Street ....... 58 Figure 5.8 Intersection of NE 29th Street and NE 2nd Avenue ............................................. 58
iv

1. INTRODUCTION 1.1 Purpose This Transportation Element report is a part of a series of documents related to the Florida East Coast (FEC) rail corridor study aimed at economic redevelopment. The purpose of the Transportation Element is to recommend goals and policies that will guide the development of land/sea/air transportation facilities and services in the FEC area in a manner consistent with the overall goals of the redevelopment vision plan. The Transportation Element addresses street classifications, levels of service, travel forecasts, travel improvements, alternative modes, funding strategies, and concurrency management. It is based upon current and projected land use and travel patterns. Both local and State transportation facilities are addressed. It establishes direction for development of regulations for transportation systems, and for facilities and improvement programs now and in the future. Transportation is one of the critical elements in the FEC corridor redevelopment plan. On one hand, the economy relies on an efficient transportation system to move people and goods. Yet, on the other hand, transportation helps shape the land use and the economy. It can facilitate the development of a sustainable and robust local economy in the FEC corridor area, or it may hinder such development if transportation related issues are not properly addressed. 1.2 Background The FEC rail corridor is an economically distressed area that is considered to have great potential to revitalize for freight and passenger transportation in the future given its proximity to downtown Miami and the presence of the Florida East Coast Railroad tracks. It is well recognized that improvements to the corridor transportation network could be beneficial to the economic growth of the local area, the county, and the state. For example, one of the goals in the 2020 Florida Transportation Plan (FTP) is to link all transportation facilities and services into a cohesive statewide transportation network that enhances Florida’s economic competitiveness. Several objectives are proposed to achieve this goal. The following are two of the objectives that may have implications on the existing transportation system in the FEC corridor area [2020FTP]:
• Improve connections between seaports, airports, railroads and the highway system for efficient interregional movement of people and goods; and
• Manage and preserve designated transportation corridors in cooperation with local
governments and through advance acquisition of right-of-way. Miami-Dade County is among the eighteen counties that account for about 85 percent of Florida’s gross state product and are considered the state’s primary economic centers [FIHS2001]. The transportation system in Miami-Dade County has become overburdened in recent years as the trend of population growth and suburbanization continues. The growth in freight and passenger transport at the Port of Miami and the Miami International Airport (MIA) also contribute to aggravate the traffic conditions. In fact, Miami-Dade County has been ranked
1

as one of the most congested urban areas nationwide (TTI2001). However, traffic congestion is a regional issue and is difficult for any one jurisdiction to resolve, particularly when the majority of the traffic is generated outside of that jurisdiction. While there are some improvements that can be accomplished on a local basis, traffic problems such as those experienced by FEC residents are regional problems that can only be addressed through intergovernmental cooperation. To ensure the vitality of southeast Florida and to accommodate anticipated growth in the future, the state and local governments have been actively seeking solutions. As the adverse social and environmental impacts of new highway construction are identified, building more highways is no longer the preferred solution to congestion. New solutions seek to make existing highway operations more efficient through improvements to roadways and traffic controls, incorporation of new technologies such as Intelligent Transportation System (ITS), improvements and expansions of public transit services, management and reduction of travel demand, and change of land use patterns in a move toward sustainable development. 1.3 Organizations Provided in this report is a summary of important transportation related issues and potential transportation projects that may impact the FEC corridor. These potential transportation projects are in various stages of development. Some are in the implementation stage; some are being planned; while others are arising as a part of a broad vision for the future transportation system in Miami-Dade County and the State of Florida. This report is organized into five sections. The next section, Section 2, provides an overview of the regional transportation systems in the context of their relationship to the FEC corridor. Each system is described in terms of its main characteristics, operation, and local significance. Section 3 describes the local transportation system that serves the FEC corridor. Section 4 identifies opportunities and constraints of the transportation system in relation to the FEC corridor area. Finally, Section 5 outlines recommendations on improvements to the transportation system in the FEC corridor with the objective of supporting the redevelopment goals.
2

2. REGIONAL TRANSPORTATION SYSTEMS In this section, a general overview of the transportation systems in the southeast coastal United States is provided to allow an understanding of how these systems affect the study area and the role that the local transportation system plays at the regional level. The following subsections will discuss interstate highways, airports, seaports, and railroads, respectively. 2.1 Highways Miami-Dade County is connected to other cities and outside Florida by a network of interstate highways. Figure 2.1 illustrates the interstate highways and major cities in the southeast United States. Located at the tip of the Florida Peninsula, Miami-Dade is connected to the rest of the state and other states through I-95 on the Florida east coast and I-75 on the west coast. Major cities in the southeast region such as Charleston, South Carolina, Atlanta, Georgia, Birmingham and Mobile Alabama can be reached via I-95, I-75, and I-10. Additionally, Florida Turnpike also provides access to southeast Florida and central Florida. The FEC corridor area is located near downtown Miami and by I-95, thus has good access to the interstate system. This is an advantage that can facilitate the economic development in the area.
Figure 2.1 Interstate Highways
3

2.2 Airports Figure 2.2 shows locations of international airports in Florida and in the adjacent states, namely Georgia, Alabama, and Louisiana. As a major hub in southern United States, Miami International Airport (MIA) provides passengers services all the major airports in the region as well as nationally and internationally. It is also the gateway to Latin America and the Caribbean countries. Tables 2.1 and 2.2 provide statistics on international and total passengers by airports. It may be seen that MIA is ranked 3rd based on international passengers and 13th in terms of total passengers.
Figure 2.2 Major International Airports in Florida and Adjacent States
Table 2.1 U.S. Airports Ranked by International Passengers
Rank Airport City Intl. Passengers (millions) % Change1 New York (Kennedy) New York 18.6 +3% 2 Los Angeles Int’l (LAX) Los Angeles 17.4 +10% 3 Miami Int’l (MIA) Miami 16.2 +3% 4 O’Hare Int’l (ORD) Chicago 10.5 +8% 5 Newark Int'l (EWR) Newark 8.3 +8% 6 San Francisco Int’l (SFO) San Francisco 8.1 +12% 7 Hartsfield Atlanta (ATL) Atlanta 5.8 +14% 8 Houston Intercontinental (IAH) Houston 5.6 +12% 9 Honolulu Int'l (HNL) Honolulu 5.1 +0.8%
10 Dallas-Ft. Worth Int'l (DFW) Dallas 5.0 +2.8% Source: Airports Council International (ACI) and respective airport traffic reports.
4

Table 2.2 U.S. Airports Ranked by Total Passengers
Rank Airport City Total Passengers (millions)
% Change
1 Hartsfield Atlanta (ATL) Atlanta 80.2 +3% 2 O’Hare Int’l (ORD) Chicago 72.1 -0.7% 3 Los Angeles Int’l (LAX) Los Angeles 68.5 +5% 4 Dallas-Ft. Worth Int'l (DFW) Dallas 60.7 +1% 5 San Francisco Int’l (SFO) San Francisco 41.2 +2% 6 Denver Int'l (DEN) Denver 38.7 +2% 7 McCarran International (LAS) Las Vegas 36.9 +10% 8 Minneapolis/St. Paul (MSP) Minneapolis 36.7 +5% 9 Sky Harbor Int'l (PHX) Phoenix 35.9 +7% 10 Metro Wayne County (DTW) Detroit 35.5 +5% 11 Houston Intercontinental (IAH) Houston 35.2 +7% 12 Newark Int'l (EWR) Newark 34.2 +2% 13 Miami Int’l (MIA) Miami 33.6 -0.8%
Source: Airports Council International (ACI) and respective airport traffic reports.
Table 2.3 Operating Statistics of Major Airports in the Southeast Region
Airport City Passengers Cargo (tons)
1 Hartsfield Atlanta (ATL) Atlanta, GA 80,162,407 894,4712 Miami Int’l (MIA) Miami, FL 33,621,273 1,811,1843 Orlando International Orlando, FL 31,066,799 294,0554 Fort Lauderdale/Hollywood Int’l Ft. Lauderdale/
Hollywood, FL 16,500,0001 200,559
5 Tampa International Tampa, FL 16,043,383 102,2396 Louis Armstrong New Orleans Int’l New Orleans, LA 8,241,834 72,6407 Palm Beach Int’l 5,842,594 23,1218 Jacksonville Int’l Jacksonville, FL 5,287,563 60,3229 Southwest Florida Int’l Fort Myers, FL 5,207,212 15,67910 Birmingham Int’l Birmingham, AL 3,067,777 44,89711 Savannah Int’l Savannah, GA 1,774,190 7,99012 Melbourne International Airport Melbourne, FL 521,207 3,293
Notes: All statistics are from individual airport website as of March 2002. 1 Estimated total passengers in 2001 (http://www.broward.org/avi00400.htm) 2.3 Seaports There are 14 deepwater seaports in Florida, geographically split between the Gulf and Atlantic coasts. Figure 2.3 shows the locations of the 14 ports. The Gulf ports deal primarily with domestic trade, while the Atlantic ports compete with ports all along the Eastern Seaboard for international cargo and cruise ship passengers. The international trade in Florida totals over $70 billion. In addition to Florida seaports, up the Atlantic coastline, there are also other two close ports in Georgia: Port of Brunswick and Port of Savannah, about 60 miles and 120 miles north of
5
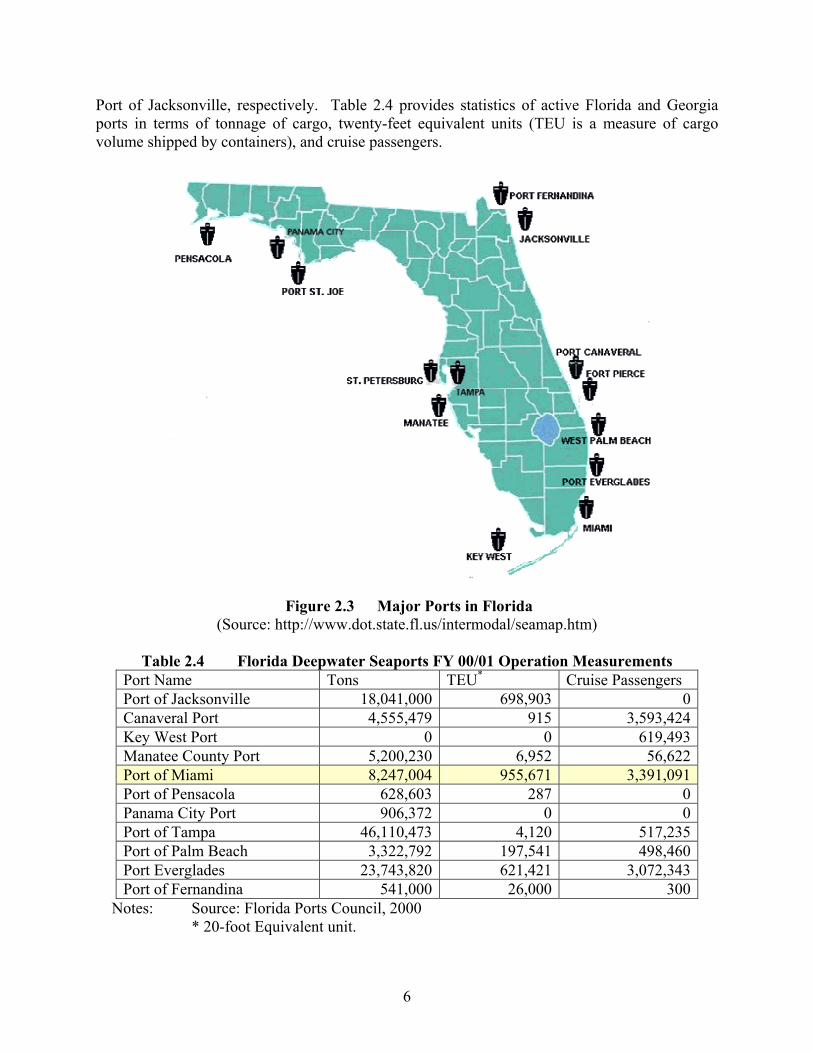
Port of Jacksonville, respectively. Table 2.4 provides statistics of active Florida and Georgia ports in terms of tonnage of cargo, twenty-feet equivalent units (TEU is a measure of cargo volume shipped by containers), and cruise passengers.
Figure 2.3 Major Ports in Florida
(Source: http://www.dot.state.fl.us/intermodal/seamap.htm)
Table 2.4 Florida Deepwater Seaports FY 00/01 Operation Measurements Port Name Tons TEU* Cruise Passengers Port of Jacksonville 18,041,000 698,903 0Canaveral Port 4,555,479 915 3,593,424Key West Port 0 0 619,493Manatee County Port 5,200,230 6,952 56,622Port of Miami 8,247,004 955,671 3,391,091Port of Pensacola 628,603 287 0Panama City Port 906,372 0 0Port of Tampa 46,110,473 4,120 517,235Port of Palm Beach 3,322,792 197,541 498,460Port Everglades 23,743,820 621,421 3,072,343Port of Fernandina 541,000 26,000 300
Notes: Source: Florida Ports Council, 2000 * 20-foot Equivalent unit.
6

2.4 Railroads 2.4.1 Freight Rail The Florida rail system is comprised of 13 line-haul railroads and four terminal or switching companies [RAIL2000]. The line-haul carriers range in size from small intrastate railroads to large rail systems extending from Florida into Canada. These railroads, as illustrated in Figure 2-4, comprise a 2000 state rail system of about 2,900 miles. Two major railroad companies serve the southeastern seaboard: CSX Transportation (CSXT) and Florida East Coast (FEC) Railroad. CSXT has a national network while FEC mainly serves the east coastal area in Florida from Miami up to Jacksonville. CSX Transportation's (CSXT) 1,619 Florida route miles represent 56 percent of the statewide rail system. The Florida East Coast Railway (FEC), with 386 route miles, is the second largest carrier in terms of Florida mileage accounting for 13 percent of the state rail system.
Figure 2.4 Railroad Network in the Region 2.4.2 Passenger Rail Conventional intercity rail passenger service in Florida continues to be operated by the National Railroad Passenger Corporation (Amtrak), which links Florida with the northeast and the west. Amtrak was created in 1970 to revitalize and operate the nation’s rail passenger service after the private railroads had given up on their money-losing operations. Amtrak operates passenger trains in 44 states over a system of some 23,000 miles comprised principally of track owned by for-profit freight railroads.
7

Amtrak ridership in Florida has increased significantly since 1980, from 626,115 riders in 1980 to 951,064 in FY 2000 (an increase of 52 percent). FY 2000 ridership was down 21 percent from the FY 1993 peak of over 1.2 million, but was still above the FY 1999 ridership of 917,346. Figure 2.5 illustrates the Amtrak services in the Florida region. Negotiations are underway with the FEC for use of its main track between Jacksonville and Miami for one of Amtrak’s Silver Service trains. Rerouting one of the Silver Service trains over the FEC between Jacksonville and West Palm Beach has long been a desire of the FDOT, Amtrak, and local communities located on the East Coast along this 300-mile route. Amtrak is prepared to work with FDOT to enter an equal funding relationship to implement the initial capital program development efforts [FIPRSVP].
Figure 2.5 Amtrak Services in the Region
(Source: RAIL2000)
8

3. LOCAL TRANSPORTATION SYSTEM This section provides an overview of the local transportation system, including the roadway system, public transportation system, airport, seaport, and railroads in or near the FEC Corridor Area. Each subsystem is discussed in the content of its relationship to and impact on the FEC Corridor Area. 3.1 Roadway System 3.1.1 Existing Street Functional Classifications Transportation systems have a hierarchy of streets that provide through movement and land access functions. Streets are classified based on the degree to which they provide these functions. Based on the street function, certain land use policies and street standards should apply. For example, most cities, counties, and states have designated minimum right-of-way dedication requirements, stopping and entering sight distances, roadway width, design speed, daily traffic volumes, access control, and sidewalk requirements in accordance with an adopted classification designation. These requirements are usually codified in the jurisdiction’s municipal code and/or adopted as street standards. Roadways are classified into the following three functional groups: principal arterial, minor arterial, and collector. All other roadways are assumed to be local access streets. Principal arterials serve corridors with the highest traffic volumes as well as major activity centers such as universities, shopping centers, and stadiums. They carry most of the trips entering and leaving the urban area, as well as most of the bypassing through movements. In addition, they also serve significant intra-area travel, e.g., between central business districts (CBDs) and outlying residential areas, between major inner-city communities, and between major suburban centers. Minor arterials are streets and highways that connect with other arterial and collector roads extending into the urban area. Minor arterial streets and highways serve less concentrated traffic-generating areas, urban area neighborhood shopping centers, and schools. Although the predominant function of minor arterial streets is the movement of through traffic, they also provide for considerable local traffic that originates or is destined for points along the corridor. Collectors are streets that provide direct services to residential areas, local parks, churches, and areas with similar uses of the land. To preserve the amenities of neighborhoods, they are usually spaced at about half-mile intervals in order to collect traffic from local-access streets and convey it to major and minor arterial streets and highways. Direct access to abutting land is essential. The FEC Corridor study area is approximately 1 mile wide in the east-west direction and about 4 miles long in the north-south direction. Figure 3.1 shows the major roadways in the area and their functional classifications. The FEC Corridor is served by Interstate 95, which runs north and south along the western boundary of the study area, and Interstates 195 and 395, which are east-west expressways connecting the mainland to Miami Beach. In the north-south direction, Biscayne Boulevard (US 1) is a major arterial that forms the eastern boundary of the study area.
9

North Miami Avenue and NE 2nd Avenue function as minor arterial roadways, while NW 2nd Avenue and North Federal Highway are classified as collector streets. The major east-west arterials are NE 79th and NE 36th Streets, while NE 71st, 62nd, 54th, 29th, and 20th Streets are minor arterials, and NE 69th, 61st, 46th, and 14th Streets function primarily as collector streets.
Figure 3.1 Roadway Functional Classification in the Study Area
Figure 3.2 shows the number of lanes for the major roadways in the area. It can be seen that the area has good access to transportation facilities. Overall, the street system within the FEC Corridor study area can be defined as a symmetrical grid, although this pattern is interrupted along the FEC right-of-way. The local streets define a system of multiple rectangular shaped blocks, each with the longer dimension oriented east and west.
10

Figure 3.2 Number of Lanes of Major Roadways
Table 3.1 presents the statistics for Miami-Dade County in terms of its share of the State Highway System, National Highway System, and Florida Intrastate Highway System measured by lane miles and its share of the daily vehicle miles traveled (DVMT), which is the product of annual average daily traffic (AADT) and the length of road (FDOT) [PRMMT]. It can be seen that Miami-Dade County has a smaller share of the lane miles in the three highway systems but a larger share of the DVMT, indicating that Miami-Dade County faces higher travel demand in comparison with the other counties in the state.
Table 3.1 Miami-Dade County Shares of State Highway Lane-Miles and DVMT (SOURCE: [SHSMR])
Road System Lane Mile DVMT State Highway System (SHS)1 6.47% 10.75%
National Highway System2 6.74% 11.88%Florida Intrastate Highway System3 6.26% 11.45%
1 Roads owned and maintained by the State of Florida. 2 Public roads designated by Congress or the FHWA as nationally important. 3 A part of the SHS that is intended to connect urban and rural areas throughout the state, and to connect to global
markets through airports, seaports and rail terminals.
11

3.1.2 Traffic Conditions In order to further explore the existing traffic conditions in the study area, three types of traffic data, as shown in Table 3.2, were collected at the selected locations in the FEC Corridor. Figure 3.3 illustrates the specific location of each traffic count site. Metric Engineering, Inc was requested to provide the data collection services. A data report prepared by the company is attached as a supplemental document. The 12-hour turning movement count (TMC), Task 1, was performed on a regular and sunny weekday other than Monday and Friday at the intersections shown in Table 3.3 from 7 am to 7 pm to investigate the existing traffic conditions. Refer to Appendixes A-1 to A-8 for the turning movement counts at each intersection during the morning and evening peak hours.
Table 3.2 Traffic Data Collection Tasks Conducted in the FEC Area Task Description
1 12-hour vehicle turning movement (and pedestrian) count 2 24-hour bi-directional automatic volume count and speed measure 3 24-hour bi-directional automatic volume and classification count
Figure 3.3 Traffic Count Sites
12

Table 3.3 Locations for Turning Movement Counts Site Number Intersection
1 N Federal Highway & NE 54 Street 2 N Federal Highway & NE 39 Street 3 NE 2 Avenue & NE 39 Street 4 N Miami Avenue & NE (NW) 29 Street
The 24-hour volume count and speed measure, Task 2, were performed on a weekday similar to those for turning movement counts at the five locations identified in Table 3.4. They were selected because they are currently provided with MDTA transit services. Since the autos in mixed traffic heavily influence a bus’s travel speed, the speed measures will be an indicator for transit travel time and thus help to explore the current transit services available in the FEC area. Refer to Appendixes B-1 to B-8 for the turning movement counts at each intersection during the morning and evening peak hours.
Table 3.4 Locations for Speed Measure Site Number Roadway Segment Between
1 NW 79 St. N Miami Ave. NE 2 Ave. 2 NW 62 St. N Miami Ave. NE 2 Ave. 3 NW 54 St. N Miami Ave. NE 2 Ave. 4 NW 20 St. N Miami Ave. NE 2 Ave. 5 Southbound NE 2 Ave. NE 36 St. NE 39 St.
The 24-hour volume and classification counts, Task 3, were performed on a similar weekday at the fifteen roadway segments shown in Table 3.5 that may have significantly more truck traffic than other locations in the FEC area.
13
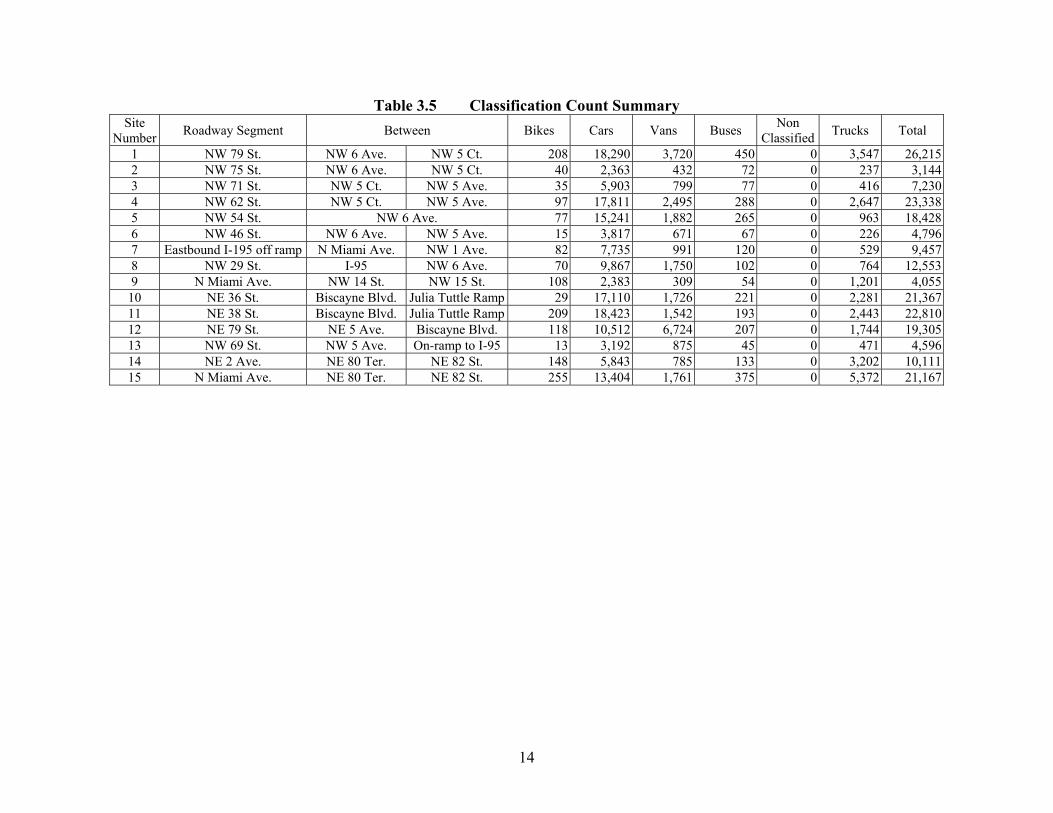
Table 3.5 Classification Count Summary Site
Number Roadway Segment Between Bikes Cars Vans Buses Non Classified Trucks Total
1 NW 79 St. NW 6 Ave. NW 5 Ct. 208 18,290 3,720 450 0 3,547 26,2152 NW 75 St. NW 6 Ave. NW 5 Ct. 40 2,363 432 72 0 237 3,1443 NW 71 St. NW 5 Ct. NW 5 Ave. 35 5,903 799 77 0 416 7,2304 NW 62 St. NW 5 Ct. NW 5 Ave. 97 17,811 2,495 288 0 2,647 23,3385 NW 54 St. NW 6 Ave. 77 15,241 1,882 265 0 963 18,4286 NW 46 St. NW 6 Ave. NW 5 Ave. 15 3,817 671 67 0 226 4,7967 Eastbound I-195 off ramp N Miami Ave. NW 1 Ave. 82 7,735 991 120 0 529 9,4578 NW 29 St. I-95 NW 6 Ave. 70 9,867 1,750 102 0 764 12,5539 N Miami Ave. NW 14 St. NW 15 St. 108 2,383 309 54 0 1,201 4,055
10 NE 36 St. Biscayne Blvd. Julia Tuttle Ramp 29 17,110 1,726 221 0 2,281 21,36711 NE 38 St. Biscayne Blvd. Julia Tuttle Ramp 209 18,423 1,542 193 0 2,443 22,81012 NE 79 St. NE 5 Ave. Biscayne Blvd. 118 10,512 6,724 207 0 1,744 19,30513 NW 69 St. NW 5 Ave. On-ramp to I-95 13 3,192 875 45 0 471 4,59614 NE 2 Ave. NE 80 Ter. NE 82 St. 148 5,843 785 133 0 3,202 10,11115 N Miami Ave. NE 80 Ter. NE 82 St. 255 13,404 1,761 375 0 5,372 21,167
14

3.2 Public Transit System 3.2.1 Miami-Dade Transit Agency Miami-Dade Transit Agency (MTDA) is the 16th largest public transit system in the nation, and the largest transit agency in the State of Florida. MDTA serves the residents and visitors of Miami-Dade County and its 30 municipalities. MDTA offers rail (Metrorail and Metromover), bus (Metrobus), and Paratransit services. MDTA system-wide ridership information is summarized in Table 3.6.
Table 3.6 System Performance Summary for October 2001 (Source: Miami-Dade Transit Agency)
Travel Mode
Total Weekday
Ridership*
Total Saturday Ridership
Total Sunday
Ridership
Total Ridership
Metrobus 4,828,915 487,727 314,861 5,631,503Metrorail 1,067,383 82,344 58,690 1,208,417
Metromover 349,258 26,080 18,063 393,401STS N/A N/A N/A 78,781Total 6,245,556 596,151 391,614 7,312,102
* Total Weekday Ridership includes Columbus Day boarding (October 8, 2001); ridership that for that day was as follows:
Metrobus = 201,489 Metrorail = 34,219 Metromover = 8,341
Metrorail is an elevated rapid transit system that runs from Dadeland South in Kendall through South Miami, Coral Gables, and downtown Miami to the Civic Center/Jackson Memorial Hospital area, and to Brownsville, Liberty City, and Hialeah. Metrorail is also connected to the Tri-Rail/Metrorail transfer station, where by boarding a Tri-Rail train, Broward and Palm Beach counties may be reached. The 21 accessible Metrorail stations are about one-mile apart, providing easy access for bus riders, pedestrians, and passengers being dropped off and picked up. Parking is available at 18 Metrorail stations. Metrorail runs from 5 a.m. to midnight seven days a week. Trains arrive every six minutes during weekday rush hours, every 15 minutes during midday, and every 30 minutes after 8 p.m. Weekend service runs every 20 minutes until 8 p.m. when trains arrive every 30 minutes. Metromover is an automated people-mover system that serves downtown Miami from Omni to Brickell and connects with Metrorail at Government Center and Brickell stations. There are 21 conveniently located wheelchair accessible Metromover stations, one about every two blocks. Metromover links many of Downtown's major office buildings, hotels, and retail centers, the Stephen P. Clark Government Center, the Cultural Plaza (Miami Art Museum, Historical Museum, Main Library), and the Brickell business district. With Metromover cars arriving frequently, getting around downtown is fast and convenient.
15

Metrobus offers countywide service from Miami Beach to west Miami-Dade, and from Key Largo to the southern portion of Broward County. Metrobus connects with Metrorail and Metromover. Metrobus has 82 routes and a fleet of over 600 buses that travel over 25.9 million miles per year. Special Transportation Service (STS) is a door-to-door transportation for people with mental or physical disabilities who are unable to use Metrobus, Metrorail, or Metromover. For $2.50 per one-way trip, STS offers shared-ride, door-to-door travel in accessible vehicles throughout most of Miami-Dade County, in some parts of south Broward County, and in northern Monroe County (http://www.co.miami-dade.fl.us/transit/metrobus/STS.htm). STS operates seven days a week, including most holidays, from 4:30 a.m. to 2:30 a.m. the following day. STS is used for trips to medical appointments, school, work, shopping, business, or recreation. Air-conditioned minivans, small buses, lift-equipped vans, and sedans transport passengers with disabilities safely in a clean, smoke-free environment. Pickups are within 30 minutes of the scheduled time. The FEC Corridor is served only by Metrobus, although Metrorail and Metromover are connected to a majority of the bus routes serving the area. Figure 3.4 illustrates the Metrorail and bus routes serving the FEC Corridor area. Their operating statistics are summarized in Table 3.7, and the major activity centers that they serve are provided in Table 3.8. It can be seen that the area has relatively good transit coverage, with many routes serving different destinations directly. Because of the proximity to downtown, local residents can also reach other parts of the county via a transfer at Metrorail or Metromover stations, or at the bus terminals in downtown or at Omni Plaza.
Figure 3.4 Metrobus Routes Serving the FEC Corridor Area (Source: MTDA2002)
16

Table 3.7 Metrobus Route Operating Statistics
Route Service Hours Peak
Headway (min)
Off. Headway
(min) Main Route in Area
L 4:36am-2:25am 10 12 N 79th Street 62 5:35am-1:36am 10 15 N 62nd Street 54 5:00am-10:08pm 20 30 N 54th Street 36 5:03am-9:51pm 14 25 N 36th Street J 4:20am-12:13am 17 23 N 36th Street
Airport Owl 11:17 pm-6:44 am - 27 N 36th Street 6 8:37 am-5:55 pm 60 60 NW 29th Street
32 5:01am-12:21am 21 30 N 20th Street M 5:43am-11:31pm 27 30 NE 14th & NW
Night Owl 10:27pm-6:26am - 22 N 14th Street 2 5:30am-11:38pm 15 15 NW 2nd Avenue K 5:13am-11:25pm 19 20 NE 1st Avenue T 5:00am-9:39pm 19 30 NE 1st Avenue & Biscayne Blvd9 4:58am-11:58pm 13 40 NE 1st Avenue
10 5:18 am-12:27am 30 40 NE 2nd Avenue 3 5:15am-2:08am 18 20 Biscayne Blvd
95 (Aventutra Mall)
6:11am-9:19am 3:14pm-7:02pm 4 - Biscayne Blvd
16 5:35am-11:08pm 20 20 Biscayne Blvd Bisc MAX 6:00am-7:23pm 15 15 Biscayne Blvd
Note: Information is from the Miami-Dade County Published Bus Schedules.
17

Table 3.8 Major Activity Centers Served by Bus Routes in FEC Corridor Area Major Activity Center/Destination Routes
Downtown 62, Airport Owl, 6, 32, M, Night Owl, 2, K, T, 9, 10, 3 Coconut Grove 6, 95,16, Biscayne MAX Miami Beach L, 62, J, Airport Owl, M, Night Owl, K, T, 9, 10, 3, 16 North Miami Beach Night Owl, 2, K, 10, 3, 95, 16, Biscayne MAX Hialeah L, 62, 54, J Little Havana 6 Airport Airport Owl
MetroRail/Metromover L, 62, 54, 36, J, Airport Owl, 6, 32, M, Night Owl, 2, K, T, 9, 10, 3, 16, Biscayne MAX
Omni Bus Term. 62, 36, Airport Owl, 6, 32, M, Night Owl, K, T, 9, 10, 3, 16, Biscayne MAX
Tri-Rail Station 32 Amtrak Terminal L Miami Springs 36, J, Airport Owl Coral Gables J Bal Harbour T, Night Owl Miami Shores 9 Florida Dept. of Children and Families 54 Carol City, St. Thomas University, Fl. Memorial College, Opa-locka, MDCC North Campus
32
Mt. Sinai Hospital, Miami Heart Institute M Jackson Memorial Hospitals Night Owl, M 163rd Street Mall 2, Night Owl, 16 Aventura Mall 9, 3, Biscayne MAX Westland Mall 54 Diplomat Mall (Broward) K, 3
Note: Compiled based on information from http://www.co.miami-dade.fl.us/transit/metrobus/routes.htm.
3.2.2 Jitney Jitneys are small privately operated buses that operate regular (or semi-fixed) routes and flexible stops and schedules. Jitneys are available in some areas in Miami-Dade County to complement services provided by MTDA. The advantages that jitney services offer include trip speed and ease of boarding. To board a jitney, the passenger simply flags down the jitney from any place along the jitney’s route as in the case of stopping a taxi. Moreover, some riders prefer the jitneys to public buses for a variety reasons such as faster trip times, shorter walking distance and wait times, availability of seats, flexibility in stopping locations, and security, as the driver will not let disorderly or threatening passengers aboard the vehicle. Many minority riders also enjoy a jitney driven by a person speaking their native language. For these reasons, jitneys have been able to establish their own market. A Miami study indicated that only 25 percent of jitney passengers were would-be public transit riders (http://www.taxi_I.org/jitneyed.htm). Two companies are currently operating jitney services under interlocal agreements with the county and municipalities: Conchita Transportation provides services that connect to the Hialeah Metrorail Station; and Metro Jitney operates in South Miami-Dade that connects to Dadeland
18

South Station (http://www.co.miami-dade.fl.us/transit/welcome/transfers.htm). Both companies accept customers either to or from Metrorail. There are 51 jitney routes specified in the 1999 Miami-Dade MPO’s validated transportation model. Figure 3.5 shows jitney routes that can be identified from the 1999 Miami-Dade transportation model. The FEC corridor area is served mainly by two jitney routes: Mia-mini-bus that operates along 2nd Avenue, and the Marcello Jitney that operates along North Miami Avenue.
Figure 3.5 Jitney Routes in Miami-Dade County
3.2.3 Tri-County Commuter Rail Authority (Tri-Rail) Tri-Rail provides commuter rail services to the tri-county area comprised of Miami-Dade County, Broward County, and Palm Beach County. It begins at Mangonia Park in Palm Beach County, follows I-95 through Broward County, and terminates at Miami International Airport in Miami-Dade County (see Figure 3.6). Originally operated as a maintenance of traffic (MOT) program during the reconstruction of I-95 in 1989 through the early 1990s, Tri-Rail has become a viable travel alternative to driving on the severely congested I-95 for thousands of commuters. Tri-Rail operates on 71 miles of railroad tracks owned by the state and the CSXT. An agreement between Tri-Rail and CSXT gives each exclusive rights of operation during different time
19

windows. Tri-Rail also shares tracks with AmTrak. On weekdays, 28 trains are operated between 4:13 a.m. and 9:50 p.m. with 60 minutes headway in the morning and evening peak hours. There are 8,324 boardings daily [Tri-Rail2002], and annual ridership is 2.5 million. Due to its success, Tri-Rail has been able to proceed with projects to upgrade and double track the corridor with state and federal funding. Double tracking will complete in Miami-Dade and Broward counties by June 2002. Tri-Rail is also looking to expand its services, which will be discussed in Section 4.2.
Figure 3.6 Tri-Rail System Map
(Source: http://www.tri-rail.com/TrainSched/systemmap.htm)
20

3.3 Airport The Miami International Airport (MIA) is one of the busiest international air passenger and cargo hubs in the world. Currently, there are over one hundred airlines serving Miami International Airport (MIA) nonstop to 109 destinations and one-stop to 36 destinations around the globe. Passengers and cargo rely heavily on the highway system to access the airport. The two highway routes, SR 836 and SR 112 are both congested. There have been studies calling for rail connection between airport and downtown Miami, the Port of Miami, Miami Beach to the east, and Florida Turnpike and Florida International University to the west (see Section 4.5. An intermodal center is also currently under construction (see Section 4.6), which will become the first of its kind to connect all transportation modes in one location. This and other future transportation projects will further strengthen the link between the airport and the FEC Corridor Area and help the redevelopment of the area. 3.4 Port of Miami The Port of Miami is the largest container port in Florida and is ranked eighth in the nation. According to the 2001 Official Directory published by the port, it has more than 40 shipping lines calling on 132 countries and 362 ports around the world. Because of Miami’s geographic location and cultural affinity, the majority of the port’s cargo is originated from or destined for Latin America and the Caribbean, with 26 carriers serving 33 countries and 101 ports in the region. In fiscal year 2000, the Port of Miami moved 7.8 million tons of cargo, including exports of 3,341,759 tons and imports of 4,463,187 tons. These are equivalent to 868,178 TEU’s (twenty-foot equivalent units), which was a 12% increase from fiscal year 1999. Figure 2 shows the tonnages and percentages of trade by different regions for year 2000. In addition to Latin America and the Caribbean, Europe and Asia are also important trade partners of the U.S. with a significant volume of cargo going through the Port of Miami.
Figure 3.7 Tonnage Traded by Region
(Source: PORT2001)
21

In addition to cargo operations, the port is known as the "Cruise Capital of the World." Home to 17 cruise ships, the port has the largest year-round cruise fleet in the world. Carnival Cruise Lines, Norwegian Cruise Line, and Royal Caribbean International all operate cruise vessels from the Port of Miami. In fiscal year 2000, more than 3.3 million passengers used the port. The growth of the port is expected to continue. While the exact figures are not available, the passenger volume is projected to grow to 4 million annually within a few years time. Significant growth in cargo is also expected. These growths will put greater demand on the transportation system. Some of the existing problems that are faced by the port include congestion in the downtown area because trucks have to access the port through Biscayne Boulevard, and congestion on State Road 836, which carries cruise passengers between the port and the Miami International Airport (MIA) and moves trucks to the west of the county and to I-95. One proposed solution includes building a tunnel under Biscayne Bay to connect the port to Mac- Arthur Causeway (I-395) at Watson Island to eliminate the need for truck traffic to go through downtown. Other proposals aimed at improving traffic operations on State Road 836 include the construction of a High Occupancy Vehicle (HOV) lane and a Metrorail extension to MIA. The Port of Miami can be an important partner in the redevelopment of the FEC corridor. In addition to being a large economic force in Miami-Dade County, the port also has a presence in the FEC corridor area through the FEC Railway tracks and the Buena Vista Yard. Due to its proximity to the FEC Corridor area, the port not only offers employment opportunities (45,000 employees in 2000 [Port2001]) to the local residents, but also provides opportunities for the growth of the local industry and tourism. Its link to the Caribbean can help strengthen the cultural identity of the FEC Corridor area. 3.5 Railroad The railroad rights-of-way in Miami-Dade County are owned by three entities: the State of Florida, CSXX, and the FEC railroad. Figure 3.6 shows the railroads in the county and in the FEC Corridor Area. The railroad in the FEC Corridor Area is owned and operated by FEC. Currently, it is not heavily utilized. FEC occasionally transports oversized and/or overweight cargo on short trains from or to the port. Due to the site limitation inside the port, large-scale freight by train has been determined unprofitable by FEC. Although the track will stay and light railroad freight will continue, the freight operations are not expected to grow significantly in the future. The track, however, can be used for passenger services. This possibility is discussed in the next section and in Section 5.
22

Figure 3.8 Railroad Rights-of-Way in Miami-Dade County and FEC Corridor Area
23

4. TRANSPORTATION OPPORTUNITIES AND CONSTRAINTS 4.1 Introduction In this section, transportation opportunities in the FEC corridor area will be discussed along with constraints that may hinder the development of an integrated transportation system that provides access to automobiles, passengers, and bicyclists, and pedestrians. The most significant competitive advantage of the FEC corridor area is its proximity to downtown and other employment centers such as the Port of Miami, Jackson Memorial Hospital, and the new Performing Arts Center. It also has well connected access to Miami Beach, where employment opportunities are abundant. In terms of transportation, it enjoys the following advantages:
• Proximity to freeways, expressways, and the arterial system. The entire FEC Corridor is surrounded by a freeway (Interstate 95), expressways (Interstates 195 and 395), and major arterials (Biscayne Boulevard and N 36th Street). The roadway system provides good regional accessibility to major activity centers such as downtown Miami, the Port of Miami, Miami Beach, Miami Airport, Airport West, etc.
• While the interstate highways are congested, roadways inside the FEC Corridor still have
additional capacity to allow growth in population, employment, and traffic in the area.
• The FEC railroad track offers the possibility of rail passenger services along the corridor that can serve as a link between downtown Miami and the FEC corridor area with the northern part of Miami-Dade County, Fort Lauderdale, and the rest of the region along the Atlantic coast. The existing track allows passenger services to begin with significant cost savings in infrastructure. The right-of-way also offers other opportunities for public use such as greenways.
• The corridor has been identified as a future premium transit corridor in the 2025 Long
Range Transportation Plan adopted by the Miami-Dade County Commission in December 2001. Tri-Rail and Amtrak are also currently considering expanding services along the FEC railroad tracks.
• Significant developments that exist in the corridor area and anticipated future growth
concentrated along NE 2nd Avenue, result in a linear corridor of attractions and make a high quality, high efficiency public transportation system solution possible.
While having some significant advantages in transportation, the transportation system in the area also has some deficiencies, including the following:
• Lack of connectivity between neighborhoods and Downtown. There is a lack of connectivity between individual neighborhoods within the FEC corridor and between neighborhoods and Downtown. This can be attributed to several factors including the fragmented land use pattern, absence of an integrated mass transit system, and the general lack of pedestrian pathways and greenways. Additionally, the FEC railroad track in some places acts as a barrier that disrupts the continuity of local
24

streets and reduces the accessibility by local businesses and residents from/to NE 2nd Avenue and Biscayne Boulevard. The area is in close proximity to downtown Miami but does not have rail passenger services. While transit services in the area are no worse than most areas in the county, they still do not completely satisfy the needs of local residents and businesses.
• Congestion on freeways, expressways, and major arterials.
Traffic condition on all major roadways surrounding the FEC area including the expressways and Biscayne Boulevard will continue to deteriorate in the future. This will affect the accessibility of the area from or to the rest of the county. Unless an integrated public transportation system with rail transit offering high levels of service can be developed, congestion will continue to worsen. The key will be winning public support for such a public transportation system.
• Aging infrastructure and limited right-of-way.
Being an older community in the county, infrastructure such as water and sewer systems in the area may need rehabilitation. Additionally, most streets in the area are relatively narrow, limiting the ability to develop rail services.
In addition to the advantages and obstacles described above, there are numerous opportunities that have risen out of specific transportation plans or projects, which either directly affect the transportation system in the area or the integration of the local transportation system into the regional system. These opportunities are described in the subsections below. 4.2 Tri-Rail Service Extensions Tri-Rail has just completed its 2020 Long-Range Master Plan [TR 2002]. The plan identifies five potential corridors where commuter rail services may be provided. These five corridors include the Jupiter extension in Palm Beach County, the Broward East/West Line, the Dolphin Extension, the Kendall Extension, and the FEC alignment. The latter three are all in Miami-Dade County. The alignments of the three alternatives in Miami-Dade County are shown in Figures 4.1 through 4.3. Of the five alternatives, except for the Broward East/West Line, all other alternatives utilize existing railroad tracks, thus utilizing the conventional railroad technology. Light rail technology is considered for the Broward East/West Line (a discussion of the light rail technology will be presented later in this section).
25

Figure 4.1 Dolphin Extension and Proposed Stations
(Source: TRI2001)
26

Figure 4.2 Kendall Extension and Proposed Stations (Source: TRI2001)
27

Figure 4.3 FEC Alignment and Proposed Stations
(Source: TRI2001)
28

Table 4.1 summarizes some of the important facts about the five alternatives. Once constructed, the FEC railroad will become a major regional transportation corridor for the tri-county area and will greatly enhance the local/regional rail accessibility of the FEC area. The key issue on its implementation is funding. However, if redevelopment of the FEC Corridor Area occurs as expected, a higher ridership projection may help reduce the per new rider cost and make it easier to receive federal funding.
Table 4.1 Summary of Five Alignments (Source: TRI2001, Tri-Rail2002)
Alternative 1 2 3 4 5 Alignment Jupiter Dolphin Kendall FEC Broward
Type Conv. rail Conv. rail Conv. rail Conv. Rail Light railLength (miles) 15.7 8.8 16.7 31.6 17
Double track length (miles) 7.2 8.8 16.7 22.6 17 Grade crossing updates 21 11 34 108 N/A
New Stations 6 3 5 11 15 Average station spacing (miles) 2.62 2.93 3.34 2.87 1.13
Mainline* 20 20 20 20 20 Peak headway (min) Branch 20 20 20 40 15 Daily tri-rail ridership 26,600 28,100 30,800 32,400 41,000
Daily new tri-rail ridership 4,400 5,900 8,600 10,200 18,900 Corridor upgrade/capital cost ($1000) 113,000 145,000 247,000 377,000 547,000
Cost per mile ($million) 7.172 16.443 14.802 11.937 32.165 O&M cost ($1000) 3,380 4,440 8,420 6,600 14,250
Program Funds ($1000) $15,000 $0 $0 $106,000 $398,000Funding Shortfalls ($1000) $98,000 $145,000 $247,000 $271,000 $149,000Implementation Schedule 2007 2006 2019 2016 2015
* Mainline is the South Florida Rail Corridor Owned by the State of Florida. 4.3 Miami Beach Light Rail The Miami-Dade County MPO is currently conducting a study on a Miami-to-Miami Beach light rail line (http://www.co.miami-dade.fl.us/mpo/docs/MPO_mmb_lrt_20010703.pps). Because of the proximity of the system to the FEC corridor, it may influence the future of any rail services in the FEC area, as all rail services will be connected whenever possible. Light rail is a guideway technology that has evolved from the streetcars before World War II. Light rail tracks may be at grade, elevated, or underground. The vehicles are powered by electricity, usually via overhead catenaries. Light rail trains may consist of a single car or multiple cars, each car carrying 120 to 160 passengers. Light rail vehicles are quiet, capable of operating at relatively high speeds of up to 65 mph, and can maneuver tight turns and climb steep grades. Low-floor vehicles allow people with disabilities or strollers to easily board or alight from a train. Modern vehicle design gives light rail cars a futuristic look that is visually appealing. Shown in Figure 4.4 is a model of EuroTram designed and built by Zagato, an Italian company. Figure 4.5 shows another Zagato light rail vehicle model operating in Milan, Italy.
29

Figure 4.4 Zagato's EuroTram
Figure 4.5 Zagato Incentro Vehicle Operating in Milan, Italy
There are 23 light rail systems currently operating in the United States, seven of which were added since 1990. Among them, the San Diego system is the most successful one with the highest fare box return. Figure 4.6 shows the light rail systems currently operating in Baltimore, Denver, Salt Lake City, and Jersey City, all new startup systems since 1990. Their characteristics are summarized in Table 4.2. An additional twenty cities are considering building light rail systems as a high quality, relative low cost transit alternative. More information on guideway technologies and guideway system costs may be found in Technology Considerations in Guideway Planning [LCTR1998].
30

Figure 4.6 Light Rail in Selected U.S. Cities
(Source: MPO2001a)
Table 4.2 Characteristics of Four New Light Rail Systems in the U.S. (Source: MPO2001a)
City Population (millions) Opening Year Length
(miles) Daily Riders
Baltimore 1.9 1993 22 30,000 St. Louis 1.9 1993 18 45,000 Denver 1.5 1994 5.3 25,000 Salt Lake City 0.7 1999 8.3 20,000
A guideway transit link to Miami Beach has been considered for some time. In 1988, the City of Miami sponsored a study to determine the feasibility of a light rail transit system serving the city. The study concluded that light rail service was feasible and recommended a 9.3-mile, 20-station, double-tracked system that would run between 63rd Street and the Omini. The project was included in the 2010 Long-Rang Transportation Plan but not pursued due to a lack of funding. In 1992, light rail service to Miami Beach was again considered in a study sponsored by the MPO. The study, titled “Dade County Priority Corridors Transitional Study,” examined six priority transit corridors including the Miami Beach corridor, and made various recommendations. Subsequent studies were conducted after this project to advance planning for the West, Miami Beach, North, Kendall and South corridors. In 1995, FDOT commissioned a study to examine multimodal transportation improvements along the West and Beach Corridors linking Florida International University (FIU), Miami International Airport (MIA), the Port of Miami, downtown Miami, and South Miami Beach
31

[FDOT1995]. The study resulted in the recommendation by the MPO of a heavy rail line from State Road 826 to the port and High Occupancy Vehicle (HOV) lanes along State Road 836. FDOT is currently sponsoring another Miami Beach light rail study under the auspices of the MPO with consultant services provided by Parsons, Brinkerhoff, Quade & Douglas, Inc. This study involves the preparation of a supplemental draft Environmental Impact Study (EIS), selection of a preferred alternative, including the alignment and technology, and preparation of a final EIS of the preferred alternative. The selection of the Local Preferred Alternative (LPA) will be completed in July 2002. The final EIS is expected to be completed by February 2003. Figure 4.7 illustrates the proposed alignments for the Bay Link. The first three (from left to right) involve the application of LRT technology. The last one is a bus rapid transit alternative similar to the South Dade Busway. The construction of this line will help reduce congestion on I-395 and offer better access to Miami Beach.
Figure 4.7 Proposed Bay Link Alignments in Downtown Miami (Source: PAR2001)
4.4 East-West Multimodal Corridor Because the existing Metrorail system is part of a more extensive system that was originally planned but never implemented, its effectiveness has been limited in terms of the extent of the coverage area and connection to major activity centers. In particular, MIA and the area west of MIA, known as Airport West, where intensive land development has occurred, are not served by the Metrorail. The commercial and industrial developments in the area of Airport West as well as the ever-expanding residential development in the southwest of the county seriously strain the existing highway system. Severe congestion occurs on State Road 836, the only east-west expressway in the county. To address this problem, a Metrorail extension that connects downtown Miami with west Miami-Dade was conceived. After years of various planning studies, a Major Investment Study (MIS)/Draft Environmental Impact Statement (EIS) was completed in 1995 [FDOT1995]. In 1998, under the sponsorship of U.S. Department of Transportation (USDOT), the final EIS was completed [FDOT1998] setting the stage for a long-waited and urgently needed transit system that would provide high-quality, high-capacity transit services to a large population.
32

The final EIS examined State Road 836 as a multimodal corridor by considering a large array of alternatives including no-build, Transportation System Management (TSM), expressway widening, and a multimodal corridor with a transit line along State Road 836. The alignment of the system is shown in Figure 4.8. The recommended alternatives include a rail transit line of 11.2 miles that begins just east of the Palmetto Expressway (State Road 826) near the Palmetto/Dolphin Expressway interchange, connects to the MIC, and ends at the port. An additional 0.7-mile branch connects the MIC to MIA. The line includes 8.2 miles of aerial guideway and 3.6 miles of bored tunnel. Among the ten proposed stations, six will be aerial and four underground. The project cost was estimated as $1,586,250,000 in 1995 dollars. The projected 2020 ridership was estimated at 31,400 boardings per day.
Figure 4.8 Alignment of the East-West Rail Line
(Source: FDOT1998) While the highway improvements recommended by the study are being advanced, funding sources for the mass transit component have not been identified. The penny sales tax initiative to finance the project was defeated by Miami-Dade County voters in 1999. There is the possibility that a dedicated transit funding source may become available in the future, e.g., in the form of a half-penny sales tax. However, this will only be possible when a consensus can be reached among the county residents that public transportation will provide the solution. 4.5 Miami Intermodal Center A major intermodal project that has been under construction is the Miami Intermodal Center (MIC). The MIC will be an international transportation hub that facilitates regional intermodal
33

travel in Miami-Dade County and Florida. Serving as an extension of MIA, the MIC will be connected to MIA via an automated people mover system and will provide selected landside terminal functions such as ticketing, baggage handling, long-term parking, and consolidated rental car facilities. It will become an intermodal transfer point in the regional transportation system, providing connections to Metrorail, Tri-Rail, Amtrak, a new East-West rail line, airport-seaport transportation services, Metrobus, intercity buses, regional highways, and local streets. Figure 4.9 provides the site plan of the MIC. A sectional perspective of the MIC is shown in Figure 4.10.
Figure 4.9 General Location of MIC (Source: FDOT1995)
Although the MIC is not a part of the FEC corridor study area, its significance as a regional transportation hub warrants its mentioning. For any future highway or transit projects, including any that may be implemented in the FEC corridor area, it will be necessary to consider how they contribute regionally from an intermodal perspective. Both land use planning and transportation planning should take advantage of any potential intermodal connections to maximize transportation benefits.
34

Figure 4.10 Site Plan of MIC
(Source: FDOT1995) 4.6 Intermodal Facility at 79th Street The MPO completed a study in 1998 to identify possible transit intermodal facilities in Miami-Dade County. The goals of the study included providing public agencies with a “cookbook” guide to integrating intermodal facilities into their communities, evaluating 25 locations in Miami-Dade County for intermodal facilities, and developing cost estimates to identify potential grant and/or funding sources. One of the locations considered was the intersection of Biscayne Boulevard (US-1) and 79th Street. Figure 4.11 shows the site location of the proposed intermodal facility. The land uses in the immediate surrounding area are mostly commercial, office, and residential. The Village Mall is to the north of the proposed facility, and Biscayne Plaza Shopping Center is to the west. It is bounded by Biscayne Boulevard to the west, Bayshore
35

Drive to the east, 79th Street to the south and 80th Street to the north. The location is served by buses, has heavy vehicular traffic on both Biscayne Boulevard and 79th Street, and has heavy pedestrian traffic. The proposed facilities at the location include a kiss-n-ride lane, bus shelter with amenities such as drinking fountains, phone kiosks, information and ETA kiosks, lighting, restrooms, seating, newspaper racks, pedestrian access with handicap access, security surveillance, a clock tower, bike racks, trash receptacles, and two bus bays. The cost is estimated at $719,000, with $200,000 for site/civil costs and $519,000 for facility costs. The significance of this proposed intermodal facility is its potential to become a future station for a proposed trolley line (see Chapter 5 for a description). This station can also integrate the proposed trolley service with local bus circulators and feeders.
Figure 4.11 Proposed Intermodal Facility at Biscayne Boulevard and 79th Street
36

4.7 Highway Improvements One of the major constraints to the transportation system in the FEC area will be congestion on freeways, expressways, and major arterials, which include I-95, I-195, I-395, and Biscayne Boulevard. As a result, the City of Miami is seeking improvements to its existing highway system. The improvement projects listed in the county’s 2001 Transportation Improvement Plan (TIP) [TIP2001] that may have direct/indirect impacts to the highway system in the FEC Corridor are listed in Table 4.3. The table provides information on the projects that the county anticipates funding during the next five years from project inception through construction. The majority of the transportation improvement projects identified from the 2001 TIP are traffic operation oriented improvements, e.g., traffic signal upgrades and ITS system installations. Most of the construction intensive projects, except No. 2516871, are identified as being not cost feasible in the next five fiscal years. Thus, the highway system in the FEC Corridor can be assumed to remain largely in the same geometric roadway condition as it is now for the next five years according to the 2001 TIP.
Table 4.3 Projects in Miami-Dade Five-Year Work Program Item
Number Project
Description Location Project Status Funding Funding
Source Project Period
RRU $238,700 ACXA 2495281 Resurfacing
SR 25/NW/NE 36 ST from NW 7 Avenue to NE 7
Avenue CST $1,954,177 ACXA 2001-2003
PE $100,000 DIH 2498352 Multi-Lane
Reconstruction US 1/Biscayne Blvd. from
NE 5 Street to NE 13 Street CST $5,390,773 XU 2001-2005
CST $574,870 DDR
CST $293,729 DIH
CST $1,990,729 DS 2501721 Resurfacing
SR 7/ NW 7 Avenue from NW 5 Street bridge to NW
36 Street
INC $70,000 DDR
2002
CST $2,380,500 DDR
CST $170,381 DIH 2501731 Resurfacing SR 7/NW 7 Avenue from
NW 5 Street to NW 79 Street
INC $70,000 DS
2001
CST $8,591,327 DDR 2502241 Flexible Pavement
Reconstruction
SR5/US1/Biscayne Blvd. from NE 35 Terrace to NE
67 Street CST $105,180 DIH 2004
2502381 ITS Information System FDOT District VI CST $8,216,268 NH 2002
2511681 Replace Movable Span Bridge
SW 2 Avenue over Miami River Bridge No. 874262 INC $2,100,000 MGBP 2003
CST $8,836,830 BRT 2511901 Bridge
Repair/Rehabilitation
NW 54 Street Bridge, NO. 874130 & East 1 AVENUE
Bridge No. 874129 INC $550,000 BRT 2001-2003
CST $1,739,612 BRRP 2516261 Fender Work I-95 over Miami River
CST $148,572 DIH 2002
37

Item Number
Project Description Location Project
Status Funding Funding Source
Project Period
2512811 Bike Path Lummus Park Riverwalk from SR 9A/I-95 to NW 4
Street CST $900,000 SE 2002
CST $413,239 IM
CST $23,561,187 DI 2516631 Miscellaneous Structure
SR 9A/I95/Noise Walls, from North of SR 112 TO
NE 199 Street INC $900,000 IM
2002-2004
2516701 Corridor Improvement I-395/SR 836/I-95 from
NW 17 Avenue to Macarthur CSWY BR.
PE $2,300,000 NH 2003
PE $790,000 NH 2516831 ITS Information
System
SR 112/I-195 ITS from NW 11 Avenue to SR 907/
Alton Road CST $8,776,015 NH 2005
PE $362,500 NH 2516861 ITS Information
System SR 836/I-395 from I-95 to
Mac Arthur CWSY CST 4,229,766 MH 2003-2005
2516871 Interchange (Major) SR 836/I-395 from west of NW 17 Avenue to East of I-
95 PE $9,928,125 NH 2003
2516881 Flexible Pavement Reconstruction
SR 836/I-395 from NW 17 Avenue to I-95 PE $10,076,625 NH 2005
2516951 ITS Information System
SR9A/I-95 from SR 5/US 1 to Dade/Broward County
Line PE $9,361,299 NH 2002
$251,993
$809,783 4055741 Traffic Signals Countywide (Maintenance & Operations) MSC
$1,134,514
DDR 2003-2005
4055871 Traffic Signal Update (ATMS) Countywide CST $14,869,000 CM 2004
4056381 Traffic Signal Update Countywide Traffic Signal Upgrade CST $5,035,004 XU 2004
$500,000 PE
$500,000 CM
PE $786,421 IVH 4056631 ITS Information
System Countywide Regional Traveler Information
PE $786,421 LF
2001-2002
PE $786,421 IVH 4056632 ITS Information
System ITS Miami Deployment
Project PE $786,421 LF 2001
4067341 Urban Corridor Improvements
SR 968/Flagler Street from Miami River to US 1/
Biscayne Blvd. CST $1,900,000 SS 2001
CST $40,371 DIH 4074612 Bridge
Repair/Rehabilitation SR 968/W Flagler Street
over Miami River CST $227,700 RBRP 2001
PE $10,050 DIH 4076531 Resurfacing SR 944/ NW/ NE 54 Street, From NW 7 Avenue/ SR 7
to SR 5/ US1 PE $90,450 XU
2001-2003
38

Item Number
Project Description Location Project
Status Funding Funding Source
Project Period
CST $1,059,706 XU
PE $6,300 DIH
PE $56,400 XU 4076561 Resurfacing SR112/ Airport EXPY from NW 12 Avenue to NW 11
Avenue DIH $697,783 XU
2003-2005
PE $70,000 SS
ROW $5,000 DIH
ROW $1,052,300 DS 4077121 Safety Project
SR 934/ NW 79 ST from NW 7 Avenue to NW 5
Court
CST $870,549 SS
2005
CST: Construction & Construction Engineering Inspection INC: Alternative Contracting Incentives MSC: Miscellaneous Grant PE: Preliminary Engineering Figure 4.12 illustrates the resulting level of service (LOS) at each roadway segment in 1999 estimated by the recently updated long-range transportation model. LOS is a qualitative assessment of road users’ perceptions of roadway quality of flow and is represented by the letters "A" through "F", with "A" generally representing the most favorable conditions and "F" representing the least favorable. The long-range transportation model is periodically updated to measure the effects of the proposed improvement plans to the transportation system in Miami-Dade County and provide guidance for long-range transportation investments. The model is first validated with the existing traffic conditions in a base year and is then used to estimate the effects of future travel demand on the transportation system by jointly considering growth in demographics and other socio-economic parameters as well as new land use development and change. Future improvements such as the new connections to major activity centers, between and among roadways, transit facilities, bicycle facilities, pedestrian facilities, and other means of transportation are incorporated in the model to identify the area with future traffic problems. Figure 4.12 indicates that, other than the roadway segments on US-1 and I-95, the traffic conditions on the majority roadway segments in the FEC area are relatively calm in comparison with the other in Miami-Dade County. The continuing growth trend in Miami-Dade County is expected to bring a 30% increase in population in the next 25 years. At the same time, highway construction will not keep up with the pace of population growth. Unless the number of cars on roadways can be significantly reduced, our roadways will become more congested and less efficient. The LOSs estimated by the long-range transportation model are presented in Figure 4.13. The figure shows that countywide traffic congestion is expected to occur even without considering the new travel demand induced by the redevelopment in the FEC area. Consequently, new transportation improvement alternatives are needed.
39
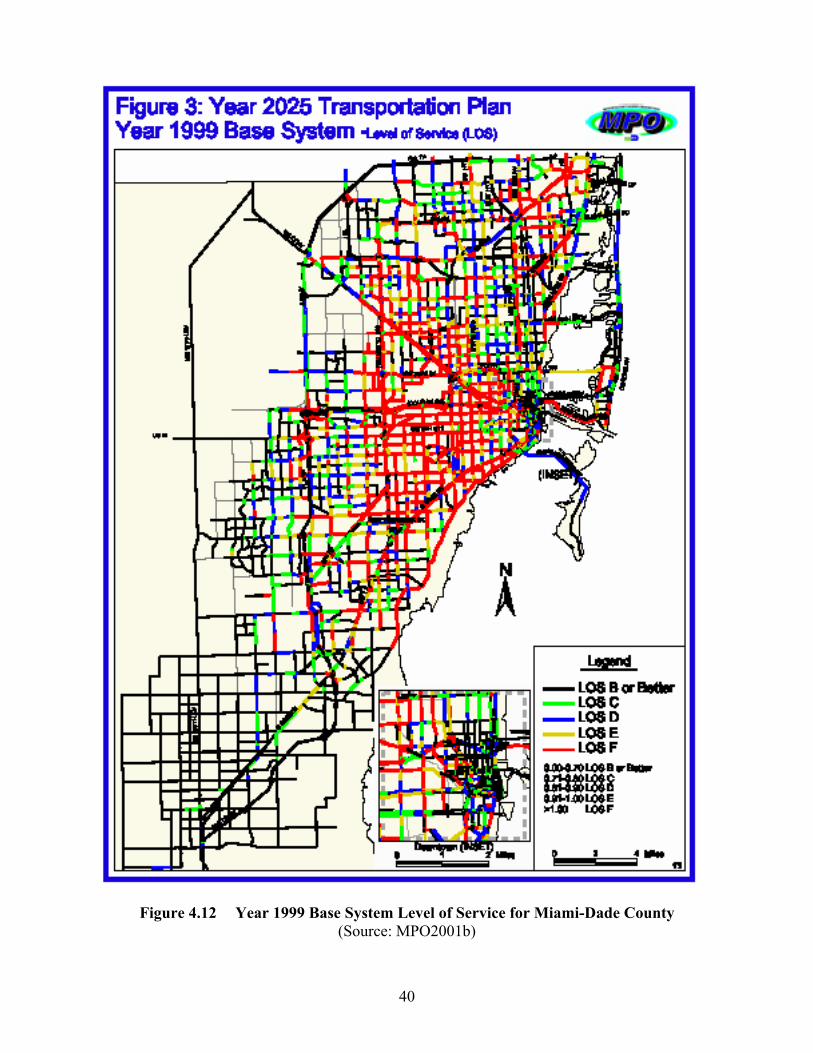
Figure 4.12 Year 1999 Base System Level of Service for Miami-Dade County
(Source: MPO2001b)
40

Figure 4.13 Year 2025 Minimum Revenue Plan Level of Service for Miami-Dade County
(Source: MPO2001b)
41

4.8 Non-Motorized Transportation System The passage of the Intermodal Surface Transportation Efficiency Act (ISTEA) and the Clean Air Act Amendments (CAAA) have renewed incentives for planning agencies to emphasize bicycling and walking as significant components of the transportation mix. Commuting by bicycle and other purposeful riding has been recognized as a healthful and environmentally sound form of travel that benefits both the individual user and the community as a whole [MDBF]. As the population increases, the construction of bicycle and pedestrian facilities as an alternative to automobile travel becomes increasingly more important. Other efforts to improve bicycle mobility within Miami-Dade County include the Bikes-on-Transit Program. Free bike and ride permits are available which permit cyclists to bring a bicycle on-board Metrorail during off-peak weekday hours and on all weekend and holiday hours. The permits also allow cyclists to mount a bicycle on any rack-equipped Metrobus during normal operating hours. 4.8.1 Bicycle Facilities The 2025 Cost Feasible Plan for Bicycle is shown in Table 4.4. It is assumed that 1.5% of eligible federal funds will be devoted to non-motorized transportation projects in addition to funds for Transportation Enhancements program projects that have historically been programmed for bicycle and pedestrian projects.
Table 4.4 Future Cost Feasible Improvements for Bicycle Facilities Limits Priority Project or Facility From To Project Description
I N. Federal Highway NE 54th Street NE 36th Street On-road Bicycle Facility II NE 2nd Avenue NE 87th Street NE 17th Street On-road Bicycle Facility
4.8.2 Pedestrian Facilities At times it may be necessary to restrict midblock access to pedestrians. Shrubs below the palm trees are dense enough to divert pedestrians to adjacent intersections [FPPDH]. Common practice for creation of a pedestrian refuge is to use a minimum of a 1.2m (4ft) separator between the left-turn lane and the opposing traffic lane. The minimum width for pedestrian refuge is 1.8m (6 ft). Where more than occasional pedestrians may be present, the median width should be at least 2.5m (8.5 ft) and preferably at least 3 m (10 ft) [MH]. The 2025 Cost Feasible Plan for Bicycle is shown in Table 4.5. Just as in Table 4.4, it is assumed 1.5% of available federal funds will bee devoted to non-motorized transportation projects. 4.8.3 North Dade Greenways One study that is closely related to transit projects but itself is not a transit study is the North Dade Greenway Study [MPO1997]. This study was funded by the MPO and carried out by the FIU School of Architecture in 1997. With the goal of creating a physical environment offering recreation and cultural opportunities for the residents to improve quality of life, the study identified 25 greenway corridors in north Miami-Dade County. The study area is bounded on the
42

south by North Kendall Drive, on the west by Krome Avenue, on the north by County Line Road and on the east by Biscayne Bay and the Atlantic Ocean. The population in the area is estimated at 1.5 million.
Table 4.5 Future Cost Feasible Improvements for Pedestrian Facilities Limits Priority Project or Facility From To Project Description
I Biscayne Boulevard NE 36th Street NE 54th Street Pedestrian Facility I N. Federal Highway NE 36th Street NE 54th Street Pedestrian Facility II NW 2nd Avenue NW 17th Street NW 20th Street Pedestrian Facility II NW 3rd Court I-95 Expressway NW 8th Street Pedestrian Facility II NW 6th Avenue NW 54th Street NW 62nd Street Pedestrian Facility III Biscayne Boulevard NE 71st Street NE 79th Street Pedestrian Facility III Biscayne Boulevard NE 54th Street NE 61st Street Pedestrian Facility III Biscayne Boulevard NE 61st Street NE 62nd Street Pedestrian Facility III Biscayne Boulevard NE 54th Street NE 61st Street Pedestrian Facility
Figure 4.14 identifies the 25 Greenway corridors in the North Dade. The trail that goes through the FEC Corridor study area is the Flagler Trail (see Figure 4.15). It will begin at the intersection of the Venetian Causeway (NE 15th Street) and Biscayne Boulevard, and then follow the FEC railroad right-of-way to the northern boundary of the county, with a total length of 14.9 miles. Along the way, it will intersect the Snake Creek Trail, the Memorial Trail, and the Unity Trail. It will also connect to the Miami River Trail and the M-Path trail at the south end. The M-Path will allow greenway users to continue on the existing pedestrian and bicycle facility on Biscayne Boulevard to reach downtown Miami and areas south. One problem cited in the report was that the right-of-way of the FEC railroad narrowed greatly, to around 50 feet, between 20th Street and 14th Street. This narrow right-of-way posed a safety risk to pedestrian and bicycle users. The report recommended that a parallel path be developed along Biscayne Boulevard as an alternative to access downtown Miami. The study pointed out that the north Dade area was crisscrossed with a network of South Florida Water Management District canals, Florida Power & Light transmission corridors, various classes of roadways, and railroad rights-of-way, all offering opportunities for the greenway network. At the same time, public access to these facilities was not assured. Access policies would need to be established with the owners of the facilities involved.
43
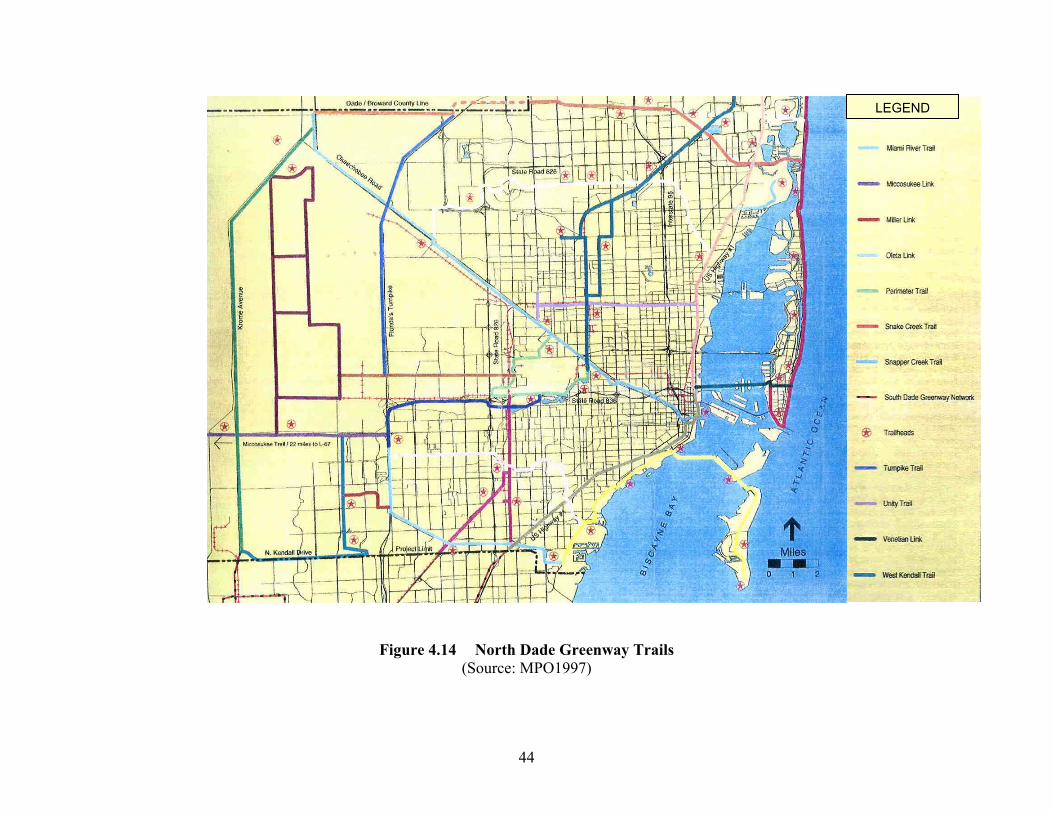
Figure 4.14 North Dade Greenway Trails (Source: MPO1997)
44
LEGEND

Figure 4.15 Flagler Trail Alignment
(SOURCE: MPO1997) 4.9 Downtown Master Plan Downtown Miami continues to be a center of economic activity. In recent years, intense development and redevelopment has occurred in the downtown area, particularly within the downtown core defined by the MPO [MPO2001c] as the area between North 20th Street in the north to SW 15th Road in the south, and east of I-95. This growth is expected to spill over into the surrounding area. However, Downtown Miami faces some serious transportation problems. Congestion during weekday peak hours and special events, and a deteriorating pedestrian environment threatens the health of the downtown businesses, regional tourism, and the economy. To deal with these problems the Miami-Dade Metropolitan Organization, the City of Miami, and FDOT commissioned a study to develop a downtown transportation master plan. The consultant for the study is David Plummer & Associates. The project is to be completed by May 2002.
45

The study area extends from I-195 on the north to SW 26 Road to the south, and is bordered on the east by Biscayne Bay and on the west by I-95. The study area includes the three traditional sub-areas of Downtown, Omni-Park West in the north, the centrally situated CBD, and the Brickell District in the south, as well as the Port of Miami and Claughton Island (now called Brickell Key). The project will address transportation problems, issues, systems, projects, and improvements. Different scenarios of land development and land use will be considered to evaluate the benefits of transportation projects. The consultant is expected to develop a framework to evaluate master plan alternatives and a set of criteria to determine how well the recommendations included in the master plan meet the plan’s goals and objectives. Figure 4.16 illustrates alternative transportation improvement projects, which will be further developed and evaluated with the methodologies and tools devised by the consultant.
Figure 4.16 Transportation Improvements under Consideration
(Source: MPO2001d)
46

One of the projects that will affect the FEC corridor area is the proposed tunnel connecting SW 1st Avenue and NW 1st Avenue, which are currently disconnected. The connection of 1st Avenue will provide another north-south arterial parallel to Biscayne Boulevard alleviating the traffic congestion on the latter. It will also benefit the Fashion District by providing better access. Another project that has been envisioned is the extension of the Metromover south through the financial district on Brickell Avenue and north to NW 20th Street along North Miami Avenue. Due to the high cost of the Metromover system, which is a fully automated medium capacity guideway system, the northward extension will need to be justified by high-density development and high ridership. There have been several other proposals that will compete with the extension of the Metromover. These proposals are discussed next in the section on transit opportunities.
47

5. RECOMMENDED TRANSPORTATION IMPROVEMENTS Recommendations on transportation improvements are developed with the vision that the FEC Buena Vista Yard will evolve into a mixed-use, high-density development and that the larger corridor, distinguished by the Arts and Entertainment District, Little Haiti and the Design District, will become a regional tourist attraction. To realize this vision, the transportation system in the area needs to be improved in several ways including public transportation, roadways, and intersections. The following sections discuss these recommended improvements. 5.1 Public Transit Improvements The FEC corridor is currently relatively well served by the MDTA buses and jitney buses. However, to allow economic redevelopment to occur and to attract people with higher incomes to live, shop, and entertain in the area, improvements to the existing transit system are necessary. Improvements need to enhance the attractiveness of the new development and to provide a competitive alternative to driving alone on the area’s congested freeways and major arterials, mainly Biscayne Boulevard. There are several reasons for the need of significant improvements to the transit system in the area:
• The Buena Vista Yard is envisioned to become a mixed-use, high-density development. This development will generate a significant amount of traffic, which will contribute further to congestion on roadways in the area unless an alternative is available.
• The corridor, with its expected big box retail and cultural activities in the Little Haiti and the Performing Arts Center areas, will become a regional destination that will attract people from nearby areas such as Miami Beach as well as from the entire county. This will also generate a significant amount of traffic that will negatively impact the existing highway system if there is no viable transit alternative.
• The Buena Vista Yard will be a high-density development, which will be supportive of public transit.
• The population that is expected to move into the area as well as travelers that will choose the area as a destination are expected to be professionals who will demand high quality transit services. Bus transit in its current form is not attractive enough to be considered as an alternative to driving by people who can afford driving alone.
Based on the above considerations, a premium transit system that provides high quality services to the local residents and the population in the surrounding area is recommended. This premium transit system is based on the assumption that significant redevelopment and population growth will occur over the next ten to fifteen years, and the area will become a regional attraction for working, living, shopping, and recreational purposes. Because most intensive developments are anticipated to occur along NE 2nd Avenue, and because Biscayne Boulevard will become highly congested in the future, a premium transit on NE 2nd Avenue will be ideal since it not only will provide a true alternative to driving to access the area, make the area more pedestrian oriented, but also relieve some of the congestion on Biscayne Boulevard. The recommended transit line should be part of a plan for a premium transit line in the Northeast Corridor as called for in the 2025 Long Range Transportation Plan, adopted by the Miami-Dade
48

County commission in December 2001 that considers the history of trolley lines in the area, limited street width to accommodate any substantial rail infrastructure, the desire to develop NE 2nd Avenue into a pedestrian friendly boulevard, and weaknesses of bus transit including low levels of service and poor image. A streetcar or trolley system is proposed. To support the economic redevelopment plan and to allow this premium transit service to grow with the redevelopment, different alternatives are proposed as short-term and long-term visions. These alternatives are developed based on two alignments. Considering the incremental nature of the expected growth, each alternative will consist of two components, one being a solution for the near term and the other a solution for the long term. The final selection of an alignment should be based on a more detailed engineering analysis that considers ridership, costs, impact on the area’s businesses and residents, and integration into a regional transportation system that consists of all the existing rail and bus services as well as future rail services. Alternative A The alignment for Alternative A will connect downtown with the northern terminus of the FEC Corridor study boundary at NW 79th Street. The alignment, as illustrated in Figure 5.1, will begin at NW 79th Street and follow the FEC right-of-way to NW 36th Street. At the junction of NW 36th Street, the trolley line will utilize NE 2nd Avenue, then turn onto NE 15th Street, and finally turn bask to the FEC right-of-way before reaching Downtown. The near-term solution entails an electric trolley that will operate in mixed traffic. The vehicle will have a modern or vintage appearance and may be powered with clean energy such as electric fuel cells or overhead catenaries. Stops spacing will vary up to 6 stops per mile. Figure 5.2(b) illustrates the stop design for the near-term solution. This new service will serve both the residents and businesses in the area as well as visitors traveling to the area. The service may be started quickly and service frequency may be adjusted easily based on ridership growth. While Alternative A will be less expensive because it will be partially located in the FEC railroad right-of-way, and for the same reason less disruptive to traffic during construction, it will not serve the commercial area along NE 2nd Avenue north of NE 36th Street. Alternative B A second near term solution that also entails an electric trolley line that will operate in mixed traffic and connect to the northern end of the FEC Corridor study boundary to Downtown Miami at Government Center. The alignment is shown in Figure 5.2(a). It will run along the entire length of NE 2nd Avenue where businesses are concentrated. Stops spacing will vary up to 6 stops per mile. This alignment will serve both the residents and businesses in the area. The services may be started quickly and service frequency may be adjusted easily based on ridership growth. Alternative C A trolley line that connects the northern end of the FEC Corridor study boundary to Downtown Miami at Government Center. The trolley line will follow the same alignment as the electric trolley in alternative B. This trolley line will be built when the area is developed and has become a regional attraction, resulting in significant growth in demand for high quality transit services. Due to the limitation of the available right-of-way, the line will be a single track with three sidings to allow trains running in opposite directions to pass each other.
49

Figure 5.5 shows some trolley vehicles that are operating in other cities in the United States and in some foreign countries. Alternative D The long-term solution to Alternative A, will locate the trolley line on its own exclusive right-of-way, a key to high-quality services. This trolley line will be built when the area is developed and has become a regional attraction, resulting in significant growth in demand for high-quality transit services. Due to the limitation of the available right-of-way, the line will be a single track with three sidings to allow trains running in opposite directions to pass each other. Figure 5.2(c) illustrates the possible siding designed to perform such an operation. Beside the trolley services, future services provided by Tri-Rail and possibly AmTrak to connect downtown Miami with their regional service networks are also possible. These services may operate on the FEC tracks, but no interference between these services and the trolley services is anticipated. The public needs to be educated about operations of a single tracked trolley system that operates in the fashion of a shuttle since trolley vehicles may be coming from both directions. Additionally, the safety issue needs to be properly addressed through detailed engineering planning and design, including providing physical separation between the exclusive transit system and pedestrians. This may involve installing fences along the sidewalk and between the trolley track and the traffic lanes, planting vegetation to serve as a barrier, providing street crossing at appropriate locations, clearly identifying station areas, etc.
50

Figure 5.1 Roadway Alignment for Alternatives A & D
51

(a) Alternative B & C Alignment (b) Street Car Stop Design (c) Trolley Line with Sidings
Figure 5.2 Alignment for Alternatives B & C, Stop Design, and Trolley Line Siding Figure 5.3 illustrates the reconfiguration of the intersection at NE 36th Street and NE 2nd Avenue. Due to the complexity of the geometry of the intersection with five approaches, compounded by the addition of the streetcar line, it is proposed to make NE 2nd Avenue between NE 36th Street and 39th Street one-way southbound and limit the use of the north bound lane for streetcar use only. Northbound traffic from NE 2nd Avenue will be forced to go on Federal Highway, then either continue northbound on Federal Highway or turn left on NE 39th Street to access NE 2nd Street, which becomes two-way north of NE 39th Street. This configuration is intended to reduce vehicle conflicts and ensure traffic safety and operation efficiency. The triangular area north of NE 36th Street and between NE 2nd Avenue and Federal Highway will be converted into a park area. This park area will enhance the pedestrian-friendly feature of the design district.
52

Figure 5.3 Reconfiguration of 36th Street for Short-Term Alternative A
For the long-term solution that involves a streetcar operating on its own track, the configuration of the intersection is shown in Figure 5.4. The streetcar track will run across the intersection to follow NE 2nd Avenue, making a stop inside the park. NE 2nd Avenue between the park and 39th Street will be open to two-way traffic. The figures shown in Figures 5.3 and 5.4 are conceptual plans that must be carefully studied and evaluated for their feasibility as well as their impact on traffic flow and safety.
53

Figure 5.4 Reconfiguration of 36th Street for Long-Term Alternative D
It should be noted that the proposed streetcar/trolley system is not only a transportation system, but also a tool for developing the FEC Corridor Area into a people-friendly, pedestrian-oriented community. This has been done successfully in many cities in the U.S and the world. Figure 5.5 shows light rail vehicles or streetcars operated in a downtown setting in different cities. Some common features of these systems include operating on exclusive right-of-way, limiting auto traffic by either making the street one-way or totally ban auto traffic from operating on the same street, wide sidewalks, clear markings of station areas and street crossings, often using pavers, and imposing lower speed limits on traffic. The transit systems have become an integral part of the downtown where people can enjoy going to and staying. These systems are good examples of livable communities from which a lot can be learned.
54

Figure 5.5 Light Rail and Streetcars in Pedestrian Oriented Downtown Areas From top to bottom, left to right: Downtown Houston light rail, Boston light rail, Portland streetcar, Dallas light rail, Denver light rail, Orleans France light rail, Portland light rail, Sacramento light rail, Montpellier, France low-floor light rail, German low floor light rail.
55

The light rail costs are generally much lower than heavy rail systems. While a heavy rail system can cost anywhere from about $50 million to over $200 million per mile, costs of light rail systems are usually under $50 million per mile. The major differences are that heavy rail systems require 100% grade separation while light rail can operate at grade. Light rail stations, vehicles, and train control systems also cost less. Among light rail systems, the cost differences are often the result of the need for land acquisition, utility relocation, grade separation, construction of bridges, reconstruction of streets, etc. Table 5.1 provides the general characteristics and capital cost data for six light rail systems in the U.S. Table 5.2 shows the distribution of light rail capital costs by commonly used cost categories. For a more detailed discussion on light rail technology, costs, cost factors, as well as capital and operating costs of other rail technologies such as heavy rail (the technology used for Miami Metrorail) and automated people movers (the technology used for Miami Metromover), please refer to Technology Considerations in Guideway Planning (LCTR1998).
Table 5.1 Capital Costs of Six Light Rail Systems in the U.S.
City Los Angeles Pittsburgh Portland Sacramento San Jose St.
Luis Transit Agency LACMTA PAC Tri-Met Sacramento
RTD Santa Clara
County Transit Bi-State
Year Opened 1990 1988 1986 1987 1987 1993 Guideway
(miles) 22.6 41.1 15.1 18.2 18.1
# of Stations 22 13 25 27 22 20 Fleet Size 54 21 26 37 50 31
As-Built Cost1 ($M) $887.20 $555.52 $351.19 $254.26 $380.35 $555.60
1994 Cost2 (National) $1,015.58 #767.10 $347.23 $231.18 $411.57 $366.76
Cost per Mile ($M National) $44.94 $18.66 $23.00 $12.63 $20.68 $20.26
19.9
Source: 1 [BOOZ1991] 2 [LCTR1998]
Table 5.2 Distribution of Light Rail Capital Costs by Cost Category (Percentiles)
Category
Los
Ang
eles
(B
lue
Lin
e)
Pitt
sbur
gh
Port
land
Sacr
amen
to
San
Jose
Low
Hig
h
Ave
rage
Real Estate 6.61 3.98 6.02 9.52 14.73 3.98 14.73 8.17 Guideway 16.36 19.86 37.74 25.47 16.75 16.36 37.74 23.24 Stations 7.24 6.16 5.98 5.61 1.19 1.19 7.24 5.24 Vehicles 8.79 10.32 11.77 18.54 15.44 8.79 18.54 12.97
Yards/Shop 4.86 6.86 4.73 2.17 5.63 2.17 6.86 4.85 System 12.68 10.59 8.43 10.65 7.91 7.91 12.68 10.05
Eng. Design &Proj. Admin. 25.22 40.41 23.05 21.27 36.09 21.37 40.41 29.23 Special Conditions 18.23 1.82 2.30 6.66 2.24 1.82 18.23 6.25
Source: [BOOZ1991]
56

5.2 Roadway Improvements Due to the fact that the existing FEC Buena Vista Yard is expected to redevelop into a high-density, mixed-use development with a segment of big box retailers, good access to and from the development site is essential. Recommended access roads are North Miami Avenue to the west of the development site and NE 34th Street to the east of the site. The plan recommends that NE 34th Street be the principal east-west connector to Biscayne Boulevard. NE 34th Street will need to be widened between the FEC Buena Vista site and Biscayne Boulevard to accommodate increased traffic volumes (see Figure 5.6). Alternatively, to avoid right-of-way acquisition for widening of 34th Street, it can be made one-way west bound between 2nd Avenue and Biscayne Boulevard. This will require that 33rd Street also be made one-way east bound. Figure 5.7 illustrates this concept.
NE 34th Street
NE 2nd Avenue
FEC Track
Figure 5.6 Intersection of NE 2nd Avenue and 34th Street
The east-west connections in the Edgewater area between NE 15th Street and NE 36th Streets are relatively poor. This situation could be remedied partially by making certain improvements to NE 29th Street, the only minor arterial connecting Biscayne Boulevard to the area west of Interstate 95. Currently, NE 29th Street is misaligned at NE 2nd Avenue. By widening it between NE 2nd Avenue and Biscayne Boulevard and realigning it on the west side of NE 2nd Avenue, traffic circulation between the east and west sides of I-95 would be improved. Access to the FEC Buena Vista site will also be enhanced. Additionally, NE 29th Street may serve as a more viable alternative route to NW 36th Street. Recommended improvements will require land acquisition between NE 2nd Avenue and Biscayne Boulevard. Because 29th Street is misaligned on the two sides of 2nd Avenue, requisition of land on the south side of the road will help reduce this misalignment and potentially reduce land acquisition costs (see Figure 5.8). With realignment and widening, NE 29th Street will serve as a minor arterial providing east-west connection between the Edgewater
57

area and the Biscayne Boulevard. To ensure its traffic moving capacity, it is recommended that no street parking be allowed on NE 29th Street.
Figure 5.7 Alternative Configuration of Intersection of NE 2nd Avenue and 34th Street
NE 2nd Ave
NE 33rd St
FEC
Traffic Light
Traffic Light
NE 34th St
Figure 5.8 Intersection of NE 29th Street and NE 2nd Avenue
North Miami Avenue is a major gateway from the north via 1-95 and 1-195 to the FEC Buena Vista site; traffic volumes are expected to increase as the area redevelops. It is important to maintain North Miami Avenue as a north-south thoroughfare to allow neighborhoods to the west to easily access downtown and the freeways. Therefore, it is recommended that North Miami Avenue remain a minor arterial with four lanes for traffic. The avenue could accommodate sidewalks and a possible median. However, as a designated arterial designed to mitigate projected redevelopment impacts the plan does not recommend street parking that would limit the avenue's traffic carrying ability. Biscayne Boulevard currently functions as a barrier to east/west pedestrian movement within the corridor, restricting public access to Biscayne Bay. In order to provide pedestrian access and improve the visual image of the Biscayne Boulevard streetscape, the plan recommends that a
58

planted 6-foot median be installed between NE 14th and NE 36th Street as appropriate with crosswalks provided at intersections. Sidewalks of 10 to 15 feet width are recommended on both sides of the boulevard. Finally, there have been demands from local residents in the Edgewater area to improve local access to I-95 by building new ramps at NW 29th Street. Currently, the area residents and businesses need to travel across downtown or to the 1-95 ramp at N. Miami Ave. to access freeways. However, given that NW 29th Street is less than 3,000 feet away from two major interchanges (I-95 and I-395 to the south, and I-95 and I-195 to the north), a detailed engineering study by the Florida Department of Transportation is necessary to determine the feasibility of constructing new ramps to ensure that the safety and efficiency of traffic operation on I-95 will not be compromised.
59

6. CONCLUSIONS It has been demonstrated in this report that the FEC Corridor Area has great potential in terms of its strategic location in Miami-Dade County and its access via various modes to the entire southeast as well as regional and local areas. One of its biggest assets is the FEC railroad, which offers many opportunities for economic growth given the industrial land use in the area and its good connection with the Port of Miami. The railroad also offers excellent opportunities for passenger service and greenways. There have been plans for Tri-Rail and AmTrak to expand their services to downtown Miami via the FEC railroad track. A future premium transit has also been included in the Miami-Dade County 2025 Long Range Transportation Plan. Another advantage of the FEC Corridor Area is its geography. Its long and narrow rectangular shape is well suited for intensified land use that can be easily served by high quality rail transit services. To support the redevelopment of the area, a series of recommendations have been made to improve the area transportation system. These include the introduction of a streetcar system that is flexible enough to accommodate the gradual growth in population, employment, and activities, and that can evolve into a rail transit system that will become a part of the regional rail transit system in the future. In the short term, a streetcar can operate in the selected alignment in mixed traffic. An important feature to distinguish it from a regular bus will be its vehicle design, which must give people an impression of it being a high quality service. In the long term when density has become more supportive of rail transit and ridership has grown, a streetcar operating on its own track and right-of-way can be built. The exclusive right-of-way is essential to ensure high-speed service, especially given the expectation that congestion will worsen in the future and will become prevalent throughout the county. In addition to transit improvements, roadway improvements are also needed to ensure good access to the Buena Vista Yard development and other business and residential areas in the corridor. East-west connections will need to be improved, as well as providing enhanced pedestrian facilities in the area. Regionally, with a transportation system that currently is not adequately meeting demands, Miami-Dade County as well as the City of Miami are faced with the challenge of maintaining the vitality of the economy and improving the quality of life for the people living in the county and the city. As new highway construction becomes less likely, innovative thinking is required to make our transportation system more efficient. As the national trend moves toward multimodal, intermodal, and sustainable development, there are numerous opportunities in the county and the city to develop and implement projects that promote these ideas. The transportation studies, proposals, and projects described in this report reflect this new trend, as a great emphasis has been placed on looking for alternatives to highway expansion. The various guideway transit projects in the making and the MIC project that promises to interconnect them are all major impetuses to regional intermodalism. If successful, an intermodal passenger system will gradually take shape that promises an extensive high quality public transportation network in the county. The FEC corridor area will benefit by looking for opportunities to connect to this guideway transit network. Some of these opportunities include the proposed Tri-Rail FEC extension and the concept of extending the Metromover into the area. Although at present the land use intensity and economic activities have not reached a level that can support a guideway
60

system such as the Metromover, the redevelopment that may take place in the area will make such alternatives feasible in the future. Land use planning therefore needs to consider these opportunities and encourage development patterns that will result in appropriate densities as well as significant activity centers. Without large activity centers of regional importance, many opportunities of integrating the area into the regional intermodal system will be missed. The FEC corridor area has many opportunities and many challenges in regards to transportation. To achieve the goals of the project, a vision from the community must be incorporated. This project will help bring that vision to fruition by identifying the opportunities as well as the challenges that make transportation an integral component of land use planning and sustainable development.
61

REFERENCES [2020FTP] 2020 Florida Transportation Plan, Connections Bring Florida Together, Florida
Department of Transportation. [BOOZ1991] Light Rail Transit Capital Cost Study, Schneck, DC; Amodei, RM; Ferreri, MG,
Booz-Allen & Hamilton, UMTA Report No. UMTA-MD-08-7001, Federal Transit Administration U.S. Department of Transportation, Washington, D.C., April 1991.
[Corradino] Freight Movement Study, Technical Report, prepared for the Miami-Dade County
Metropolitan Planning Organization, Miami, FL., Corradino Group, Miami, FL, 1996.
[CUTR] Electric Transit Circulator Feasibility Study, Technical Report, prepared for the
Miami-Dade County Metropolitan Planning Organization, Miami, FL., Center for Urban Transportation Research, University of South Florida, Tampa, FL, 2001.
[DDA] Downtown Miami Transportation Master Plan, Technical Report, prepared for the
Miami-Dade County Metropolitan Planning Organization, Miami, FL., Miami Downtown Development Authority, 2000.
[FDOT1995] East-West Multimodal Corridor Major Investment Study/Draft Environmental
Impact Statement, Prepared for the Florida Department of Transportation, prepared by Parsons, Brinckerhoff, Quade, & Douglas, Inc. et al.
[FDOT1995a] Miami Intermodal Center Environmental Impact Statement. [FDOT1998] East-West Multimodal Corridor Final Environmental Impact Statement, U.S.
Department of Transportation, Federal Highway Administration and Florida Department of Transportation.
[FDOT2001] Transportation Outreach Program Application Package for Extension of Amtrak
Passenger Service on the Florida East Coast (FEC) Railway, Public Transportation Office, Florida Department of Transportation, Tallahassee, FL.
[FHDSB] Florida Highway Data Source Book, Florida Department of Transportation,
January 2000. [FIHS2001] Florida Intrastate Highway System (FIHS) Status Report, Florida Department of
Transportation, March 2001. [FIPRSVP] Florida Intercity Passenger Rail Service Vision Plan [FPPDH] Florida Pedestrian and Planning and Design Handbook, April 1999
62

[LCTR1998] Technology Considerations in Guideway Planning, No. 1 in a Report Series Titled Guideway Transit and Intermodalism: Function and Effectiveness, Prepared for the federal Transit Administration, U.S. Department of Transportation, prepared by Lehman Center for Transportation Research, Florida International University, Billam & Associates, and Center for urban Transportation Research, University of South Florida.
[LRTP25] Miami Urban Area Transportation Study and Year 2025 Plan Update, Miami-
Dade Metropolitan Planning Organization, Draft Report, September 2001. [MDBF] Metro-Dade Bicycle Facilities Plan, 1997 [MDTA2002] Metro-Dade Transit Agency Transit Map, http://www.co.miami-
dade.fl.us/transit/images/Pdfs/maps/transit_map.pdf, March 2002. [MH] Median Handbook, January 1997 [MPO1997] North Dade Greenways – A Study Identifying Linear Corridors for the
Development of Non-Motorized Transportation Network Within North Dade County, Miami-Dade County Metropolitan Planning Organization, Miami, FL, December 1997.
[MPO1998] Alternatives for Intermodal Improvements in Miami-Dade County, Final Report
for Miami-Dade Metropolitan Planning Organization, prepared by Kimley-Horn and Associates, June 1998.
[MPO2001a] Miami - Miami Beach Light Rail Transit Presentation, Miami-Dade Metropolitan
Planning Organization, http://www.co.miami-dade.fl.us/mpo/mpo4-baylink-details.htm, July 2001.
[MPO2001b] Miami-Dade Transportation Plan for the Year 2025, Miami-Dade Metropolitan
Planning Organization, December 2001. [MPO2001c] Scope of Work of Development of a Miami Downtown Transportation Master
Plan, Miami-Dade County Metropolitan Planning Organization, Miami, FL. [MPO2001d] Miami Downtown Transportation Master Plan, presentation materials, David
Plumber & Associates, Miami FL. [MUATS] Miami Urban Area Transportation Study and Year 2025 Plan Update, Miami-
Dade Metropolitan Planning Organization, December 2001. [PAR2001] Miami-Miami Beach Transportation Corridor Study, Draft Conceptual
Alternatives Report (Task 4.3), Prepared for Miami-Dade Metropolitan Planning Organization, Prepared by Parsons Brinckerhoff Quade & Douglas, Inc. (lead consultant), March 2002.
63

[POMCSI] Beiswenger, Hoch and Associates, Inc., Port of Miami City Street Improvements
(Seaport Truck Study), Prepared for the Miami-Dade MPO, September 2000. [PORT2001] 2001 Official Directory, Port of Miami, Miami, Florida. [PORT2002] 2002 Official Directory, Port of Miami, Miami, Florida. [PRMMT] 2000 Public Road Mileage and Miles Traveled, Posted at
http://www.dot.state.fl.us/Planning/Statistics/stats.htm, Florida Department of Transportation, September 4, 2001.
[RAIL2000] 2000 Florida Rail System Plan, Rail Office,
http://www11.myflorida.com/rail/Publications/2000Plan/plan.htm, Florida Department of Transportation, 2000.
[SHSMR] State Highway System Mileage Report, Posted at
http://www.dot.state.fl.us/Planning/Statistics/stats.htm, Florida Department of Transportation, 2001.
[TIP2001] Transportation Improvement Program for Fiscal Years 2001- 2005, Miami-Dade
Metropolitan Planning Organization, May 2000. [TR2002] Tri-Rail 2020 Long-Range Master Plan, Final Report, Parsons Brinckerhoff,
March 2002. [TRI2001] Alignment, Ridership, and Cost Estimates for Five Tri-Rail Extensions,
presentation materials, Parsons, Brinckerhoff, Quade, & Douglas, Inc. et al., November 2001.
[TTI2001] 2001 Urban Mobility Study, Texas Transportation Institute, College Station,
Texas, 2001.
64

APPENDIX A TURNING MOVEMENT COUNTS A-1. Morning Peak Volumes at Intersection of N. Federal Highway and NE 54th Street
65

A-2. Evening Peak Volumes at Intersection of N. Federal Highway and NE 54th Street
66

A-3. Morning Peak Volumes at Intersection of N. Federal Highway and NE 39th Street
67

A-4. Evening Peak Volumes at Intersection of N. Federal Highway and NE 39th Street
68

A-5. Morning Peak Volumes at Intersection of NE. 2 Ave and NE 39th Street
69

A-6. Evening Peak Volumes at Intersection of NE. 2 Ave and NE 39th Street
70

A-7. Morning Peak Volumes at Intersection of N. Miami Ave and NE 29th Street
71

A-8. Morning Peak Volumes at Intersection of N. Miami Ave and NE 29th Street
72

APPENDIX B SPEED MEASUREMENTS B-1. NW 79th St Between N Miami Ave and NE 2nd Ave
0
1000
2000
3000
4000
5000
6000
1-5 6-10 11-15 16-20 21-25 26-30 31-35 36-40 41-45 46-50 51-55 56-60 61-65 66-70 70+
Speed Intervals (mph)
Freq
uenc
y
NW 79 St, East Bound
NW 79 St, west Bound
73

B-2. NW 62nd St Between N Miami Ave and NE 2nd Ave
0
500
1000
1500
2000
2500
3000
3500
1-5 6-10 11-15 16-20 21-25 26-30 31-35 36-40 41-45 46-50 51-55 56-60 61-65 66-70 70+
Speed Intervals
Freq
uenc
y
NW 62 St, East BoundNW 62St, West Bound
74

B-3. NW 54th St Between N Miami Ave and NE 2nd Ave
0
200
400
600
800
1000
1200
1400
1600
1800
2000
1-5 6-10 11-15 16-20 21-25 26-30 31-35 36-40 41-45 46-50 51-55 56-60 61-65 66-70 70+
Speed Intervals
Freq
uenc
y
NW 54 St, East BoundNW 54 St, West Bound
75

0
200
400
600
800
1000
1200
1-5 6-10 11-15 16-20 21-25 26-30 31-35 36-40 41-45 46-50 51-55 56-60 61-65 66-70 70+
Speed Intervals
Freq
uenc
y
NW 20 St, East BoundNW 20 St, West Bound
76
B-4. NW 20th St Between N Miami Ave and NE 2nd Ave