transportation research board non-profit org. …
TRANSCRIPT

TRANSPORTATION RESEARCH BOARD500 Fifth Street, NW
Washington, DC 20001
www.TRB.org
ADDRESS SERVICE REQUESTED
C O N F E R E N C E P R O C E E D I N G S 2 9
Remote Sensing forTransportationProducts and Results:Foundations for the Future
PR
OC
EE
DIN
GS
29
Report of a Conference
ISBN 0-309-08551-9
Rem
ote S
ensing for T
ransportatio
n:Pro
ducts and Results
NON-PROFIT ORG.U.S. POSTAGE
PAIDWASHINGTON, D.C.
PERMIT NO. 8970
53864_TRB_C1_C4_indicia 8/26/03 2:02 PM Page 1

TRANSPORTATION RESEARCH BOARD 2003 EXECUTIVE COMMITTEE*
Chair: Genevieve Giuliano, Director and Professor, School of Policy, Planning, and Development, MetransTransportation Center, University of Southern California, Los Angeles
Vice Chair: Michael S. Townes, President and CEO, Hampton Roads Transit, VirginiaExecutive Director: Robert E. Skinner, Jr., Transportation Research Board
Michael W. Behrens, Executive Director, Texas Department of Transportation, AustinJoseph H. Boardman, Commissioner, New York State Department of Transportation, AlbanySarah C. Campbell, President, TransManagement, Inc., Washington, D.C.E. Dean Carlson, President, Carlson Associates, Topeka, Kansas (Past Chair, 2002)Joanne F. Casey, President and CEO, Intermodal Association of North America, Greenbelt, MarylandJames C. Codell III, Secretary, Kentucky Transportation Cabinet, FrankfortJohn L. Craig, Director, Nebraska Department of Roads, LincolnBernard S. Groseclose, Jr., President and CEO, South Carolina State Ports Authority, CharlestonSusan Hanson, Landry University Professor of Geography, Graduate School of Geography, Clark University,
Worcester, MassachusettsLester A. Hoel, L.A. Lacy Distinguished Professor of Engineering, Department of Civil Engineering,
University of Virginia, Charlottesville (Past Chair, 1986)Henry L. Hungerbeeler, Director, Missouri Department of Transportation, Jefferson CityAdib K. Kanafani, Cahill Professor and Chairman, Department of Civil and Environmental Engineering,
University of California, BerkeleyRonald F. Kirby, Director of Transportation Planning, Metropolitan Washington Council of Governments,
Washington, D.C.Herbert S. Levinson, Principal, Herbert S. Levinson Transportation Consultant, New Haven, ConnecticutMichael D. Meyer, Professor, School of Civil and Environmental Engineering, Georgia Institute of Technology,
AtlantaJeff P. Morales, Director of Transportation, California Department of Transportation, SacramentoKam Movassaghi, Secretary, Louisiana Department of Transportation and Development, Baton RougeCarol A. Murray, Commissioner, New Hampshire Department of Transportation, ConcordDavid Plavin, President, Airports Council International, Washington, D.C.John Rebensdorf, Vice President, Network and Service Planning, Union Pacific Railroad Company,
Omaha, NebraskaCatherine L. Ross, Harry West Chair of Quality Growth and Regional Development, College of Architecture,
Georgia Institute of Technology, AtlantaJohn M. Samuels, Senior Vice President, Operations Planning and Support, Norfolk Southern Corporation,
Norfolk, Virginia (Past Chair, 2001)Paul P. Skoutelas, CEO, Port Authority of Allegheny County, Pittsburgh, PennsylvaniaMartin Wachs, Director, Institute of Transportation Studies, University of California, Berkeley (Past Chair, 2000)Michael W. Wickham, Chairman and CEO, Roadway Express, Inc., Akron, Ohio
Marion C. Blakey, Administrator, Federal Aviation Administration, U.S. Department of Transportation (ex officio)Samuel G. Bonasso, Acting Administrator, Research and Special Programs Administration, U.S. Department of
Transportation (ex officio)Rebecca M. Brewster, President and COO, American Transportation Research Institute, Smyrna, Georgia
(ex officio)Thomas H. Collins (Adm., U.S. Coast Guard), Commandant, U.S. Coast Guard, Washington, D.C. (ex officio)Jennifer L. Dorn, Administrator, Federal Transit Administration, U.S. Department of Transportation (ex officio)Robert B. Flowers (Lt. Gen., U.S. Army), Chief of Engineers and Commander, U.S. Army Corps of Engineers,
Washington, D.C. (ex officio)Harold K. Forsen, Foreign Secretary, National Academy of Engineering, Washington, D.C. (ex officio)Edward R. Hamberger, President and CEO, Association of American Railroads, Washington, D.C. (ex officio)John C. Horsley, Executive Director, American Association of State Highway and Transportation Officials,
Washington, D.C. (ex officio)Michael P. Jackson, Deputy Secretary, U.S. Department of Transportation (ex officio)Roger L. King, Chief Technologist, Applications Division, National Aeronautics and Space Administration,
Washington, D.C. (ex officio)Robert S. Kirk, Director, Office of Advanced Automotive Technologies, U.S. Department of Energy (ex officio)Rick Kowalewski, Acting Director, Bureau of Transportation Statistics, U.S. Department of Transportation
(ex officio)William W. Millar, President, American Public Transportation Association, Washington, D.C. (ex officio)
(Past Chair, 1992)Mary E. Peters, Administrator, Federal Highway Administration, U.S. Department of Transportation (ex officio)Suzanne Rudzinski, Director, Transportation and Regional Programs, U.S. Environmental Protection Agency
(ex officio)Jeffrey W. Runge, Administrator, National Highway Traffic Safety Administration, U.S. Department of
Transportation (ex officio)Allan Rutter, Administrator, Federal Railroad Administration, U.S. Department of Transportation (ex officio)Annette M. Sandberg, Deputy Administrator, Federal Motor Carrier Safety Administration, U.S. Department
of Transportation (ex officio)William G. Schubert, Administrator, Maritime Administration, U.S. Department of Transportation (ex officio)
* Membership as of August 2003.
53864_TRB_C2_p08 8/25/03 3:08 PM Page C2

TRANSPORTATIONRESEARCH BOARDWashington, D.C.2003www.TRB.org
C O N F E R E N C E P R O C E E D I N G S 2 9
Remote Sensing forTransportationProducts and Results:
Foundations for the Future
Report of a Conference
Committee for Conferences on Remote Sensing and
Spatial Information Technologies for Transportation
Washington, D.C.December 10–12, 2001
Sponsored by
Research and Special Programs Administration, U.S. Department of Transportation
National Aeronautics and Space Administration
Transportation Research Board
Cosponsored by
American Association of State Highway and Transportation Officials
National States Geographic Information Council
53864_TRB_C2_p08 8/25/03 3:08 PM Page i
Transportation Research Board Conference Proceedings 29ISSN 1073-1652ISBN 0-309-08551-9
Subscriber CategoryIA planning and administration
Transportation Research Board publications are available by ordering individual publications directly from theTRB Business Office, through the Internet at national-academies.org/trb, or by annual subscription through or-ganizational or individual affiliation with TRB. Affiliates and library subscribers are eligible for substantial dis-counts. For further information, contact the Transportation Research Board Business Office, 500 Fifth Street,NW, Washington, DC 20001 (telephone 202-334-3213; fax 202-334-2519; or e-mail [email protected]).
Printed in the United States of America
NOTICE: The project that is the subject of this report was approved by the Governing Board of the National Re-search Council, whose members are drawn from the councils of the National Academy of Sciences, the NationalAcademy of Engineering, and the Institute of Medicine. The members of the committee responsible for the re-port were chosen for their special competencies and with regard for appropriate balance.
This report has been reviewed by a group other than the authors according to the procedures approved by aReport Review Committee consisting of members of the National Academy of Sciences, the National Academy ofEngineering, and the Institute of Medicine.
The views expressed in the presentations and papers contained in this report are those of the authors and donot necessarily reflect the views of the committee, the Transportation Research Board, the National ResearchCouncil, or the sponsors of the conference.
The conference was sponsored by the Research and Special Programs Administration of the U.S. Departmentof Transportation, the National Aeronautics and Space Administration, and the Transportation Research Board,and cosponsored by the American Association of State Highway and Transportation Officials and the NationalStates Geographic Information Council.
Committee for Conferences on Remote Sensing andSpatial Information Technologies for TransportationDavid S. Ekern, Minnesota Department of Transportation, ChairCliff Greve, Science Applications International CorporationDavid L. Huft, South Dakota Department of TransportationJohn R. Jensen, University of South CarolinaLawrie E. Jordan III, ERDAS, Inc.Walter H. Kraft, PB Farradyne, Inc.Michael T. McNerney, DMJM AviationLeni Oman, Washington State Department of TransportationDiane Pierzinski, California Department of TransportationJeff Tayman, San Diego Association of GovernmentsAnita Pauline Vandervalk, Florida Department of Transportation
Transportation Research Board StaffMark Norman, Director, Technical ActivitiesThomas M. Palmerlee, Transportation Data SpecialistFrederick N. Scharf, Program AssistantHenry L. Peyrebrune, Transportation ConsultantNancy A. Ackerman, Director of PublicationsLinda Frommer, Associate Editor
Cover photo: Digital Globe
53864_TRB_C2_p08 8/25/03 3:08 PM Page ii
The National Academy of Sciences is a private, nonprofit, self-perpetuating society of distinguished scholars engaged in scientific and engineering research, dedicated to the furtherance of science and technology and to their use for the general welfare. On the authority of the charter granted to it by the Congress in 1863, the Academy has a mandate that requires it to advise the federal government on scientific and technical matters. Dr. Bruce M. Alberts is president of the National Academy of Sciences.
The National Academy of Engineering was established in 1964, under the charter of the National Academy of Sciences, as a parallel organization of outstanding engineers. It is autonomous in its administration and in the selection of its members, sharing with the National Academy of Sciences the responsibility for advising the federal government. The National Academy of Engineering also sponsors engineering programs aimed at meeting national needs, encourages education and research, and recognizes the superior achievements of engineers. Dr. William A. Wulf is president of the National Academy of Engineering.
The Institute of Medicine was established in 1970 by the National Academy of Sciences to secure the services of eminent members of appropriate professions in the examination of policy matters pertaining to the health of the public. The Institute acts under the responsibility given to the National Academy of Sciences by its congressional charter to be an adviser to the federal government and, on its own initiative, to identify issues of medical care, research, and education. Dr. Harvey V. Fineberg is president of the Institute of Medicine.
The National Research Council was organized by the National Academy of Sciences in 1916 to associate the broad community of science and technology with the Academy’s purposes of furthering knowledge and advising the federal government. Functioning in accordance with general policies determined by the Academy, the Council has become the principal operating agency of both the National Academy of Sciences and the National Academy of Engineering in providing services to the government, the public, and the scientific and engineering communities. The Council is administered jointly by both the Academies and the Institute of Medicine. Dr. Bruce M. Alberts and Dr. William A. Wulf are chair and vice chair, respectively, of the National Research Council.
The Transportation Research Board is a division of the National Research Council, which serves the National Academy of Sciences and the National Academy of Engineering. The Board’s mission is to promote innovation and progress in transportation through research. In an objective and interdisciplinary setting, the Board facilitates the sharing of information on transportation practice and policy by researchers and practitioners; stimulates research and offers research management services that promote technical excellence; provides expert advice on transportation policy and programs; and disseminates research results broadly and encourages their implementation. The Board’s varied activities annually engage more than 4,000 engineers, scientists, and other transportation researchers and practitioners from the public and private sectors and academia, all of whom contribute their expertise in the public interest. The program is supported by state transportation departments, federal agencies including the component administrations of the U.S. Department of Transportation, and other organizations and individuals interested in the development of transportation. www.TRB.org
www.national-academies.org
53864_TRB_C2_p08 8/25/03 3:08 PM Page iii

53864_TRB_C2_p08 8/25/03 3:08 PM Page iv
Contents
Foreword . . . . . . . . . . . . . . . . . . . . . . . . . . . . . . . . . . . . . . . . . . . . . . . . . . . . . . . . . . . . . . . . . . . . . . . viiDavid S. Ekern
Introduction to the Proceedings . . . . . . . . . . . . . . . . . . . . . . . . . . . . . . . . . . . . . . . . . . . . . . . . . . . . . . . 1David S. Ekern
Structure of the 2001 Conference and Proceedings . . . . . . . . . . . . . . . . . . . . . . . . . . . . . . . . . . . . . . . . . 7
SESSION 1
Opening Session of Remote Sensing for Transportation—Products and Results: Foundations for the Future . . . . . . . . . . . . . . . . . . . . . . . . . . . . . . . . . . . . . . . . 9
Setting the Stage: David S. Ekern, 9Welcome: Robert E. Skinner, Jr., 10Building the Foundation for 21st-Century Transportation: Ellen G. Engleman, 10U.S. Department of Transportation Program Progress—Building a Remote Sensing Foundation for
Transportation: K. T. Thirumalai, 11Top 10 Issues in Remote Sensing for Transportation (with Predictions): Remote Sensing and Challenges,
Michael R. Thomas, 11
SESSION 2
Environmental Streamlining: Overview of Remote Sensing Products and Results . . . . . . . . . . . . . . . . . 15Environmental Assessments: Consortium Paper Presentation, Roger L. King and
Charles Gaston O’Hara, 15Moderator Summary, Ian MacGillivray, 20
SESSION 3
Transportation Planning: Overview of Remote Sensing Products and Results . . . . . . . . . . . . . . . . . . . . 21Remote Sensing of Transportation Flows: Consortium Paper Presentation, Mark R. McCord,
Mark Hickman, Michael S. Bronzini, Prem K. Goel, Richard B. Gomez, Carolyn J. Merry, Pitu B. Mirchandani, and Joel L. Morrison, 21
Moderator Summary, Mark E. Hallenbeck, 28
53864_TRB_C2_p08 8/25/03 3:08 PM Page v

SESSION 4
Infrastructure and Engineering: Overview of Remote Sensing Products and Results . . . . . . . . . . . . . . . 29Infrastructure and Engineering: Consortium Paper Presentation, Michael F. Goodchild,
Shauna Hallmark, and Val Noronha, 29Moderator Summary, John J. Conrad, 35
SESSION 5
Transportation Lifelines and Hazards: Overview of Remote Sensing Products and Results . . . . . . . . . . 39Safety, Hazards, and Disaster Assessment: Consortium Paper Presentation, Stanley A. Morain, 39Moderator Summary, Walter H. Kraft, 45
SESSION 6
10-Year Remote Sensing Industry Forecast . . . . . . . . . . . . . . . . . . . . . . . . . . . . . . . . . . . . . . . . . . . . . . 47James R. Plasker
SESSION 7
State of Remote Sensing in Transportation: Summary Panel . . . . . . . . . . . . . . . . . . . . . . . . . . . . . . . . . 51David Fletcher, 51Ian MacGillivray, 53Anita Pauline Vandervalk, 55John J. Conrad, 56Walter H. Kraft, 57Michael R. Thomas, 59James R. Plasker, 60John R. Jensen, 62
APPENDIXES
A. Summary of Roundtable for States and Metropolitan Planning Organizations . . . . . . . . . . . . . . . . . 65
B. Conference Workshop Information . . . . . . . . . . . . . . . . . . . . . . . . . . . . . . . . . . . . . . . . . . . . . . . . . . 79
C. Listing of Technology Buffet Displays . . . . . . . . . . . . . . . . . . . . . . . . . . . . . . . . . . . . . . . . . . . . . . . 80
D. Abbreviations and Acronyms . . . . . . . . . . . . . . . . . . . . . . . . . . . . . . . . . . . . . . . . . . . . . . . . . . . . . . 83
E. Conference Participants . . . . . . . . . . . . . . . . . . . . . . . . . . . . . . . . . . . . . . . . . . . . . . . . . . . . . . . . . . 85
53864_TRB_C2_p08 8/25/03 3:08 PM Page vi

Foreword
David S. Ekern, Conference Committee Chair
These proceedings summarize the highlights fromthe Conference on Remote Sensing for Trans-portation—Products and Results: Foundations
for the Future. The conference was held December 10through 12, 2001, at the National Academy of Sciencesin Washington, D.C., as the second in a series of three onthe subject of remote sensing in transportation. The firstconference was held December 4 and 5, 2000, also inWashington, D.C.
This 2-day conference was organized by the Trans-portation Research Board and sponsored by the Re-search and Special Programs Administration of the U.S.Department of Transportation and by the NationalAeronautics and Space Administration. The AmericanAssociation of State Highway and Transportation Offi-cials and the National States Geographic InformationCouncil were cosponsors.
The conference brought together representativesfrom academia, transportation agencies, remote sensingbusinesses, consulting firms, and other groups. The coregeneral sessions heard presentations from the four Na-tional Consortia on Remote Sensing in Transportationon the results of their research activities. Session moder-ators experienced in the transportation industry initiateddiscussions with conference participants on the im-pacts of these research activities. A Technology Buffet ofdisplays on remote sensing gave participants the oppor-tunity to visit with individual researchers. In the finalsession, eight transportation and remote sensing expertsoffered their assessments of the penetration by remotesensing technologies in the transportation industry andthe usefulness of these applications. The conference was
preceded by five workshops and a Roundtable for Statesand Metropolitan Planning Organizations, in whichpractitioners shared information on the uses of remotesensing in their organizations.
The objectives of this conference were
1. Enhancing communication between the transporta-tion and remote sensing communities,
2. Developing a common understanding of currentsuccessful applications of remote sensing to transporta-tion, and
3. Crafting strategies for implementation of remotesensing in transportation.
A number of people contributed to the success of theconference and deserve recognition. First, I would like tothank the other members of the conference committeefor their time and effort in organizing the conference andguiding the preparation of this report. K. T. Thirumalaiof the Research and Special Programs Administration atthe U.S. Department of Transportation deserves specialrecognition for helping to develop the conference con-cept and obtaining federal support for the workshopand the conference. Transportation Research Board Senior Program Officer Thomas M. Palmerlee and hisProgram Assistant Fred N. Scharf of the TransportationResearch Board did an outstanding job with conferencelogistics. Transportation Consultant Henry L. Peyre-brune prepared and assembled the report manuscript.Finally, I would like to thank all the participants forsharing their ideas, issues, and visions related to remotesensing applications in transportation.
vii
53864_TRB_C2_p08 8/25/03 3:08 PM Page vii
viii REMOTE SENSING FOR TRANSPORTATION 2001
The conference, which is the subject of this report,was approved by the Governing Board of the NationalResearch Council, whose members are drawn from thecouncils of the National Academy of Sciences, the Na-tional Academy of Engineering, and the Institute ofMedicine. The conference committee members responsi-ble for the report were chosen for their special compe-tencies and for their representation of an appropriatebalance. This report has been reviewed in draft formby individuals chosen for their diverse perspectivesand technical expertise, in accordance with proceduresapproved by the National Research Council’s ReportReview Committee. The purpose of this independentreview is to provide candid and critical comments thatassist the institution in making the published proceed-ings as sound as possible and to ensure that this reportmeets institutional standards for objectivity, evidence,and responsiveness to the charge. The review commentsand draft manuscript remain confidential to protect theintegrity of the process.
The committee thanks the following individuals fortheir review of this report: Robert J. Czerniak of NewMexico State University, Las Cruces; Jack H. Hansen of
the University of Tennessee (Emeritus), Reno, Nevada;Kenneth S. Miller of the Massachusetts Highway De-partment, Boston; and David B. Zilkoski of the NationalGeodetic Survey, Silver Spring, Maryland.
Although the reviewers provided many constructivecomments and suggestions, they did not see the finaldraft of the report before its release. The review of thisreport was overseen by Lester A. Hoel of the Universityof Virginia, Charlottesville. Appointed by the NationalResearch Council, he was responsible for making certainthat an independent examination of this report was car-ried out in accordance with institutional procedures andthat all review comments were carefully considered.Suzanne Schneider, Associate Executive Director of theTransportation Research Board, managed the report re-view process. The views expressed in the report’s pre-sentations, papers, and discussion summaries are thoseof the authors and do not necessarily reflect the views ofthe conference committee, the Transportation ResearchBoard, the National Research Council, or the conferencesponsors. Responsibility for the final content of theseproceedings rests entirely with the conference committeeand the institution.
53864_TRB_C2_p08 8/25/03 3:08 PM Page viii

Introduction to the Proceedings
David S. Ekern, Conference Chair
1
Transportation agencies at all levels face unprece-dented challenges today. Demands are increasingon these agencies to preserve the existing trans-
portation system and to take on new missions. A vari-ety of advanced technologies is available to enhance theplanning, designing, managing, operating, and main-taining of all modes of transportation. Aerial and satel-lite remote sensing is one area that is experiencing rapiddevelopment. As John Jensen noted at the 2000 confer-ence, “[R]emote sensing Earth observation from aircraftor satellite may be considered an information business.The goal of the business is to obtain earth resourceinformation by measuring and examining electromag-netic radiation reflected or emitted from the Earth’s sur-face . . . and supply the data or derived . . . informationto users.”
Collectively, the goals of the three conferences onremote sensing are to (1) develop awareness of remotesensing within the transportation community, (2) pro-vide input from potential users, (3) showcase practicalapplications and uses of the tools and technologies, and(4) give direction for future transportation remote sens-ing program activities.
This conference was the second of the three confer-ences on remote sensing and spatial technologies, withthe first being held 1 year ago. The conferences are anopportunity to track the progress of the National Con-sortium on Remote Sensing in Transportation (NCRST),which is in the second of a 4-year research programauthorized in the Transportation Equity Act for the 21stCentury (TEA21). NCRST was established in 1999 bythe U.S. Department of Transportation (USDOT) in col-
laboration with the National Aeronautics and SpaceAdministration (NASA) to focus on application of com-mercial remote sensing technologies to the transportationindustry. Research is conducted through four universityconsortia. The lead universities and their subject mat-ters are
• Mississippi State University on environmental impactassessment;
• University of California, Santa Barbara, on infra-structure management;
• Ohio State University, on regional traffic monitor-ing; and
• University of New Mexico, on safety hazards anddisaster assessment.
The objectives of the first conference were to im-prove both the understanding of remote sensing amongtransportation professionals and the understanding ofkey transportation issues among remote sensing experts;and to facilitate the ongoing communication among allgroups interested in remote sensing and transportation.The Steering Committee believed that the research pro-gram had advanced to the point that the theme for thesecond conference could be “Products and Results:Foundations for the Future.” While the committee rec-ognized that the consortia were only in Year 2 of a 4-yearresearch cycle, it decided that the best way to advancethe state of the practice was for the user community tosee the products and applications—to see what is work-ing, what is not yet working, and what is promising—and to learn about the barriers and opportunities that
53864_TRB_p09_14 8/25/03 3:08 PM Page 1

arise during implementation. The committee had threeobjectives:
1. Enhancing communications between the transpor-tation and remote sensing communities,
2. Developing a common understanding of currentsuccessful remote sensing transportation applications,and
3. Crafting strategies for remote sensing implementa-tion in transportation.
The Transportation Research Board (TRB) Commit-tee organizing the conference was interested in attractinga broad mix of participants that would encompass bothpractitioners and users of remote sensing products,industry representatives, and the research community.More than 150 people attended the conference, and thedesired mix was achieved with representation from statedepartments of transportation, metropolitan planningorganizations (MPOs), local government, USDOT, otherfederal agencies, universities, the private sector, andother organizations. (See Appendix E, page 85, for thelist of participants.)
PROGRESS SINCE THE 2000 CONFERENCE
Significant progress has been made, but there is still a longway to go before the consideration of remote sensing tech-nologies for collecting transportation information becomesroutine.
One way to measure progress is to consider the eightthemes developed from the 2000 conference and reviewthe new issues that came before the 2001 conference. The2001 status of the 2000 conference themes is presentedbelow.
Theme 1. Closing the Knowledge Gap Between the Remote Sensingand Transportation Communities
At the 2001 conference, it became clear that the knowl-edge gap is closing: the remote sensing community isgaining a better understanding of the highway planningand project development process. The 2001 Conferencefeatured a Technology Buffet, where 37 different proj-ects were displayed on the application of remote sensingtechnologies to transportation issues. (See Appendix C,page 80, for a complete list of projects and contact per-sons.) Through these projects and applications, the trans-portation community is beginning to understand thecapabilities and limitations of remote sensing informa-tion. As technology changes and new transportationissues arise, the applications will expand to other modes
and to intermodal and multimodal issues. The need forcommunication will be ongoing.
Theme 2. Enhancing Ongoing CommunicationAmong All Groups Interested in Remote SensingTransportation Applications
At the 2001 conference, enhancing communication wasconsidered a work in progress. Significant progress hasbeen made among a small circle of users and providers.Many attendees at the 2001 conference also attended the2000 conference. Four workshops at the 2001 confer-ence provided an opportunity for sharing information indepth on several subjects. (See Appendix B, page 79, fora list of subjects and contact persons.) Relationships aredeveloping between the remote sensing industry and thetransportation community. The circle of contact needs tobe expanded in future years.
Theme 3. Expanding Workforce Developmentand Training
At the 2001 conference, workforce development andtraining continued to be recognized as a priority for thefuture. Little progress has been made in the past year,since concentration was focused on product and appli-cation development. The sense from the 2001 conferenceis that concentrating on expanding awareness of the poten-tial of remote sensing is the initial priority.
Theme 4. Enhancing Technology Transferand Moving Research Findingsand Products Quickly into Practice
At the 2001 conference, many of the presented productsand applications are approaching the point of release forimplementation. For more than half of the technologyapplication projects for 2002, state departments of trans-portation are either the primary investigator or a partnerin the application. The discussion in 2001 was how topackage and market these products.
Theme 5. Developing Standards
At the 2001 conference, the development of standardscontinued to be an issue, but the discussion has not ad-vanced to the point of defining who should have respon-sibility for developing standards, which mechanisms arebest, and which areas are priorities. Many felt that, atthis time, it is more important to focus on identifyingusers rather than on establishing standards.
2 REMOTE SENSING FOR TRANSPORTATION 2001
53864_TRB_p09_14 8/25/03 3:08 PM Page 2
Theme 6. Encouraging Innovative Partnerships
The 2001 conference highlighted several innovative part-nerships that have been formed, including for technologyapplication projects. In 2002, 18 technology applicationprojects will involve 10 state departments of transporta-tion along with other transportation and public agencies.(See the Proceedings for details on many of these appli-cations.) Partnerships were also emphasized in the StateRoundtable discussion (see Appendix A, page 65).
Theme 7. Defining Specific Research Needs
Progress was reported at the 2001 conference in a num-ber of areas for research, recommended as priorities at the2000 conference. The 2001 conference identified addi-tional tasks within the four topic areas and reinforced andredefined several areas previously recommended.
Theme 8. Promoting Innovative Thinking
While the 2001 conference placed emphasis on productsand applications, the issues raised at the 2000 conferencecontinued to be in the background. The 2001 conferencediscussed the need to market products and applications,but work remains to be done on the concept of develop-ing a strategic plan or approach.
THEMES EMERGING FROM THE2001 CONFERENCE
Eight new headlines or themes on remote sensing fortransportation emerged from the 2001 conference andare presented below.
Theme 1. Transportation is not the major driver in the development of remote sensing technologies, buttransportation can be a significant user of remote sensinginformation.
The American Society for Photogrammetry and RemoteSensing is conducting a 10-year remote sensing industryforecast. This is the first comprehensive forecast preparedfor this industry, and as such, it will be subject to revisionand updating in the future. However, the forecast can beused to establish a relative scale of the transportation sec-tor market for remote sensing. Results from the study’searly phases show a $1.8 billion market for remote sens-ing in 2000 that will increase to $6.0 billion in 2010. Rep-resenting about 9% of the total market, transportation isforecast as the remote sensing industry’s fourth largestmarket, increasing from $162 million in 2000 to $540 mil-
lion by 2010. While this is a significant number, it is asmall portion of the more than $100 billion that all levelsof government are expected to spend on highways aloneannually (1997). Remote sensing is a tool, an enablingtechnology. It is not a need, a program, or a stand-aloneactivity. Remote sensing is a complementary tool and isnot in competition with other tools or programs.
Theme 2. There are two types of applications for the useof remote sensing information:
• Doing current activities quicker, better, and morecheaply; and
• Expanding the ability of the transportation com-munity to conduct new activities, consider additionalfactors, and improve current decision processes.
Transportation agencies have a large investment in theircurrent information systems, workforce, training, soft-ware, and hardware. To change current practices so thatthe use of remote sensing information is considered, theresearch program must be able to show that remote sens-ing helps speed the process, improves the quality of theproduct, and is cost-effective.
Theme 3. Remote sensing information is rarely stand-alone information in the transportation sector.
The applications to date show that remote sensing infor-mation must be combined with other information sources,either for calibration or control purposes or for gaining acomplete picture. Thus, issues currently under study inother areas of the transportation research community—such as data integration, data sharing, and data fusion—are also relevant to remote sensing.
Theme 4. To be successful, remote sensing informationshould be directly related to the transportation agency’sdecision support systems.
Most transportation agencies have in place well-definedtransportation decision support systems that are modifiedover time because of federal or state legislation or chang-ing values and social conditions. Examples are systemsfor pavement management, bridge management, conges-tion management, asset management, and design manu-als. These different decision systems comprise seven basictransportation agency functions:
• Long-range planning;• Programming and budgeting;• Project development, including design;• Construction, including traffic and environmental
mitigation;• Maintenance, including routine, preventive, and
emergency;
INTRODUCTION TO THE PROCEEDINGS 3
53864_TRB_p09_14 8/25/03 3:08 PM Page 3

• Operations and management; and• System security.
The current research program has touched on parts ofmost of these functions but has not yet examined thedecision processes in detail for opportunities for remotesensing technology.
Theme 5. Application of remote sensing technologies toall modes and to intermodal and multimodal issues isjust beginning.
Most applications presented at the 2001 conference ap-plied to highway issues. The application of remote sens-ing to the other passenger modes—transit, aviation, rail,water-borne, pedestrian, and bicycle—and to freighttransportation is still very sketchy. The implications ofremote sensing information for intermodal and multi-modal planning and development need to be pursued.
Theme 6. Transportation agencies’ current state of thepractice in information technology involves geographicinformation systems (GIS), the Global Positioning System(GPS), and digital orthophotography.
The technology environment for the introduction of re-mote sensing varies greatly in transportation organiza-tions. At the point that it is considering introducingremote sensing information, each transportation agencyis starting from a different “technology environment”—its information technology capability, GIS, GPS, fiberoptics, technology awareness, software, and hardware.Since introducing remote sensing requires a fairly well-developed technology environment, a first step for a stateagency that is considering use of remote sensing infor-mation is assessing its technical capability to handle anduse such information. During the state roundtable dis-cussion, only 1 of 15 participating states reported that ithad incorporated the consideration of remote sensinginformation into its routine business.
Theme 7. The remote sensing effort can learn frompast efforts to introduce technology into transportationprocesses.
The introduction of remote sensing is analogous to theintroduction of GIS and intelligent transportation systems(ITS) technology to transportation decision processes.The lessons learned from these activities can be carriedover to remote sensing. Three key lessons were: (1) ittakes time to introduce new technologies into an alreadyhighly developed decision process, (2) experimentationwith real-world applications is a strategy for success, and(3) the new technology must be directly tied to the deci-sion support systems.
Theme 8. As transportation agencies reexamine pro-cesses for project development and the approval process,the availability of remote sensing information mayprovide an opportunity for changing the standards forinformation and data from those based on oldmethodologies of data collection and analysis.
Many data accuracy standards have been in place for along time. They are based on ground data acquisitionmethods and on a project development process in whichdecisions are made late in the process during the de-tailed design phase. Currently transportation agencies arereexamining the project development processes to speedup project delivery, including environmental stream-lining, and to make some project decisions earlier in theprocess during the planning phase. Remote sensing offersthe opportunity to reexamine the questions of “What dowe need to know, at what point in the decision process,and at what level of accuracy?” The use of image analy-sis and other remotely acquired data may allow certaindecisions—such as environmental impacts, utility loca-tion, and right-of-way requirements—to be made earlierin the process when the degree of accuracy is not as strin-gent as that needed for final design plans.
ASSESSMENT: WHERE THE INITIATIVE STANDS
The final session of the 2001 conference gave numbers ofpanelists the opportunity to comment on the status of theinitiative to date: its strengths, weaknesses, opportuni-ties, and threats. This strategic assessment, summarizedbelow, also incorporates participation from others at theconference.
Strengths
The major strengths of remote sensing information fortransportation are
• Collecting remote sensing information is nonintru-sive. Transportation agencies are always looking forways to improve employee safety and to minimize theamount of time employees spend on the roadway dodg-ing traffic.
• Information gathering is potentially quicker, cheaper,and better with remote sensing.
• Remote sensing provides access to places that areimpossible or too expensive to reach with other methodsand provides a synoptic view.
• The technology delivers the ability to collect con-tinuous information at a low cost.
• Accuracy is improving (spatial and spectral) in re-mote sensing as its cost is decreasing.
4 REMOTE SENSING FOR TRANSPORTATION 2001
53864_TRB_p09_14 8/25/03 3:08 PM Page 4

• The definition of remote sensing is changing to in-clude technologies better suited for transportation, suchas uninhabited aerial vehicles (UAVs) and pole-mountedvideo systems.
Weaknesses
The major weaknesses of remote sensing identified are
• Remote sensing information may not be availableat critical times because of visibility problems, weather,and other factors.
• Converting remote sensing data into transportationinformation is usually a labor-intensive process.
• There is a lack of awareness in transportation agen-cies of the potential of remote sensing information. Theeducation and marketing of remote sensing informationneed to be structured. Some ideas include awareness edu-cation for the federal, state, and local levels followed byapplication-specific education for potential users throughexisting professional education programs.
• Participation in the conference was lacking fromsome key players, such as the consulting profession,MPOs, and management-level personnel.
The technology of remote sensing is not the restrain-ing factor in its implementation in transportation. Manytechnological applications are available. However, with-out a structured program to develop awareness of thebenefits of these applications, these players will not havethe information on successful applications, their benefits,and the costs of implementation that are required forserious consideration of remote sensing.
Opportunities
The major opportunities for the use of remote sensinginformation in transportation are in the areas of
• Environmental assessment and streamlining;• Operations, including ITS;• Security;• Identification of roadway characteristics;• Hazard assessment;• Performance measurement;• Engineering of features into projects to enhance
remote sensing use;• Improvement of transportation decision processes
through inclusion of information and factors that couldnot be collected by traditional methods;
• Collection of real-time information through UAVs;and
• Instrumentation of the national highway system.(Only 5% of the national highway system is currentlyinstrumented. Remote sensing offers a low-cost potentialfor monitoring the remainder of the system.)
Threats
The major threats identified are
• The new reality for security purposes after Septem-ber 11, 2001, in the balance between public informationand privacy;
• Transportation agencies’ characteristic of being con-servative adapters of new technology;
• Lack of readiness of most current applications forwidespread implementation;
• Limits on innovative contracting;• Danger of overselling remote sensing before com-
mercial applications are proven; and• Lack of trained personnel for use of remote sensing;
and• Lack of transportation agency awareness of bene-
fits of remote sensing.
POTENTIAL NEXT STEPS
During the 2001 conference discussions, participants iden-tified areas for follow-up or where the next steps shouldbe taken to facilitate the implementation of remote sens-ing technologies in transportation:
1. With the USDOT–NASA Joint Program on RemoteSensing and Spatial Information, the remote sensing tech-nology industry should consider forming additional stra-tegic partnerships with and outreach to other efforts,including
• National Steering Committee on Operations,• American Association of State Highway Offi-
cials (AASHTO) lead state program,• AASHTO and National Aeronautical Charting
Office security efforts,• Federal Highway Administration core business
units,• AASHTO GIS for the Transportation Annual
Conference,• AASHTO spatial,• TRB Data Information Technology and Remote
Sensing committees, and• USDOT efforts for the reauthorization of the
TEA21 process to ensure funding is available forremote sensing demonstration deployment.
2. There is a need to think strategically about the de-velopment of remote sensing in transportation. The ITS
INTRODUCTION TO THE PROCEEDINGS 5
53864_TRB_p09_14 8/25/03 3:08 PM Page 5

model of national protocols, architecture, standards,demonstration projects, and strategic deployment shouldbe considered as the model to follow. Major issues arewho should develop the strategic plan and who hasresponsibility for implementing such a plan.
3. Care is needed to not oversell remote sensing andturn people away from the technology. Solid informationis required on those applications that really work andthose that do not.
4. There must be assurance that remote sensing dataintegrates with other types of data and information in atransportation agency’s decision support systems.
5. Incentives should be built in for transportationagencies to use remote sensing, such as funding for demon-stration applications in the reauthorization of TEA21.
6. The use of remote sensing should be expanded toother modes and to multimodal and intermodal issues.
7. For remote sensing technologies that have been pro-ven through the NCRST program, the consortia shouldmake connections with users, select projects to go intooperational testing, and develop standardized operating
manuals for their application to a transportation busi-ness process. These applications of remote sensing shouldbe implemented in collaboration with the user.
8. Workshops can be held regionally on awarenessand on applications as they become available.
9. The third conference on remote sensing shouldcontinue to demonstrate the results of the research pro-gram, concentrating on applications that improve trans-portation agencies’ business processes. After the 2001conference, emphasis should be placed on mainstream-ing remote sensing into the agencies’ business processes.Strategic thinking should be initiated for marketing atthe AASHTO and TRB conferences and for activities in2003 and 2004.
BIBLIOGRAPHY
Jensen, J. R. The Changing Face of Remote Sensing. In TRBCircular 360: Remote Sensing for Transportation, TRB,National Research Council, Washington, 2001, pp. 53–64.
6 REMOTE SENSING FOR TRANSPORTATION 2001
53864_TRB_p09_14 8/25/03 3:08 PM Page 6
Structure of the 2001 Conference and Proceedings
7
The 2001 Conference on Remote Sensing inTransportation—Products and Results: Founda-tions for the Future was structured to give atten-
dees opportunities to exchange information on remotesensing and spatial technologies. These opportunities arepresented below.
ROUNDTABLE FOR STATES ANDMETROPOLITAN PLANNING ORGANIZATIONS
The conference organized an informal roundtable forstates and metropolitan planning organizations to shareexperiences and strategies for advancing the state of thepractice. Fifteen states sent representatives to the round-table, of which 14 made presentations. The state pre-sentations and a summary of the discussion and the issuesthat were identified are in Appendix A.
TECHNOLOGY BUFFET
The Technology Buffet assembled poster and computerdisplays to showcase
• Projects and application guidebooks of the four uni-versity consortia participating in the National Consor-tium on Remote Sensing in Transportation (NCRST);
• Technology application projects funded by the U.S.Department of Transportation; and
• Applications of remote sensing in transportation.
The Technology Buffet was open several times during theconference, and attendees were able to view the exhibitsand exchange information with the research managers.A listing of the technology buffet exhibits and contactinformation are in Appendix C.
WORKSHOPS
Attendees were free to attend any of five concurrent work-shops held during the first afternoon of the conference.The titles of the five workshops were
1. Introduction to Remote Sensing;2. Successful Public and Private Partnerships for Pro-
curing and Utilizing Remote Sensing Imagery: The CaseStudy of Pima County;
3. The National Map: A Framework for InstitutionalInteroperability;
4. Applying Remote Sensing Technology to Airports;and
5. A Fast-Track Approach to National Environmen-tal Policy Act Streamlining and Environmental Assess-ment: Technology Demonstration Project.
53864_TRB_p15_16 8/25/03 3:08 PM Page 7

The workshops are listed with contact information forthe instructors in Appendix B.
MAIN CONFERENCE
The main conference consisted of seven plenary sessions.The reports of these sessions follow.
The first session included opening comments from theconference chair and sponsors and the keynote addressby Michael R. Thomas on the Top 10 Issues in RemoteSensing Technology (with Predictions): Remote Sensingand Challenges.
The next four sessions featured presentations from thefour NCRST university research consortia on their cur-rent research on remote sensing products and results. Fol-lowing each presentation, the session moderator deliveredcomments on the contents presented and moderated aquestion-and-answer session between the researchers and
conference participants. Each university consortium wasasked to prepare a short presentation for inclusion inthese Proceedings, with links to their research activitiesfor ready access to additional information. These reportsand the moderators’ summaries follow the proceedingsof the Opening Session.
The sixth session featured a remote sensing industryforecast prepared by the American Society for Photo-grammetry and Remote Sensing (ASPRS). The report onthis session includes a paper prepared for the conferencethat summarizes the results of the ASPRS survey.
In the final session, the State of Remote Sensing inTransportation, participants heard eight presentationsfrom experienced transportation professionals and remotesensing experts. Each participant was asked to commenton the strengths, weaknesses, opportunities, and threatsfor the increased use of remote sensing in transportationapplications. These presentations and a summary are thelast section of these Proceedings.
8 REMOTE SENSING FOR TRANSPORTATION 2001
53864_TRB_p15_16 8/25/03 3:08 PM Page 8
SESSION 1
Opening Session of Remote Sensing for TransportationProducts and Results: Foundations for the Future
David S. Ekern, Minnesota Department of Transportation, Conference Committee ChairRobert E. Skinner, Jr., Transportation Research BoardEllen G. Engleman, Research and Special Programs Administration, U.S. Department
of TransportationK. T. Thirumalai, Research and Special Programs Administration, U.S. Department
of TransportationMichael R. Thomas, National Aeronautics and Space Administration Earth Science Applications
Directorate, Stennis Space Center
9
SETTING THE STAGE: DAVID S. EKERN
David Ekern welcomed the participants to the sec-ond Conference on Remote Sensing and SpatialTechnologies. Ekern serves as chairman of the
committee responsible for developing the three confer-ences on remote sensing. He thanked the other committeemembers for their support and input and recognized theefforts of the staff of the Transportation Research Board(TRB), in particular Thomas Palmerlee and Fred Scharf,for making the conference a success. He also thanked theconference sponsors—the Research and Special ProgramsAdministration (RSPA) of the U.S. Department of Trans-portation (USDOT) and the National Aeronautics andSpace Administration (NASA)—and cosponsor, the Amer-ican Association of State Highway and TransportationOfficials.
Chairman Ekern reviewed the conference scheduleand reiterated the conference’s goals and objectives. Hecited the Proceedings from the first conference in 2000and the themes that emerged from that conference,namely:
• Closing the knowledge gap between the remotesensing and transportation communities;
• Enhancing ongoing communication among all groupsinterested in remote sensing transportation applications;
• Expanding workforce development and training;• Enhancing technology transfer with the need to move
research findings and products quickly into practice;• Developing standards;• Encouraging innovative partnerships;• Defining specific research needs; and• Promoting innovative thinking.
He asked the participants to think about four ques-tions relative to the use of remote sensing in transporta-tion, as they listened to the presentations and discussions:
1. What are the strengths?2. What are the weaknesses?3. What are the opportunities?4. What are the threats or showstoppers?
“This year’s goals are to facilitate an interaction be-tween our professionals and those in transportation remotesensing; to enhance the understanding of remote sensing;to provide feedback on current research projects; and tobring focus to the key issues in remote sensing deploy-ment,” said Ekern. “We have tried to structure the activi-ties over the next day and one-half to achieve these goals.”
53864_TRB_p17_22 8/25/03 3:08 PM Page 9

WELCOME: ROBERT E. SKINNER, JR.
Robert Skinner also welcomed the participants tothe conference and thanked the sponsors and co-sponsors. “The Transportation Research Board
has been engaged now for 80 years to assist the linkagebetween the users of technology and the researchers anddevelopers of those technologies. Probably there is noset of technologies today that holds more promise long-term for changing the daily practice in the various trans-portation fields than remote sensing technologies,”Skinner said.
He reminded the participants of the upcoming AnnualMeeting of the Transportation Research Board in Janu-ary 2002 in Washington, D.C., and said several sessionswould deal with remote sensing and spatial technologies:“In addition, there will be 30-some sessions addressingsecurity activities, including a Department of Transpor-tation megasession on the first Monday morning in whicha number of senior U.S. Department Transportation offi-cials will provide information about what is going on atthe department.”
BUILDING THE FOUNDATION FOR21ST-CENTURY TRANSPORTATION:ELLEN G. ENGLEMAN
Administrator Ellen Engleman began by describingthe functions of the USDOT RSPA:
• “We are responsible for 2.1 million miles of oil andnatural gas pipelines in the United States, the nation’senergy infrastructure.
• “We are responsible for 800,000 shipments of haz-ardous material every day.
• “We have the Office of Emergency Transportation,which is responsible to ensure that transportation remainsopen in time of natural or civil disaster.
• “We have the Volpe National Transportation Sys-tems Center in Cambridge, Massachusetts, which doesexcellent program management on our research and de-velopment (R&D) projects, procurement expertise, anda variety of technology core competencies.
• “We have the Transportation Safety Institute inOklahoma City, which is focused on education and train-ing of safety and security personnel—everyone from haz-ardous material inspectors to pipeline inspectors to Fed-eral Aviation Administration accident investigators andaviation safety professions, etc.
• “We are also responsible for the intermodal thrustfor research, innovation, and education at USDOT.
• “The Crisis Management Center is another functionof RSPA.” This is a 24/7 operational center for all the
communication and coordination related to the events ofSeptember 11, 2001, that Administrator Engleman andher staff were active in handling.
Administrator Engleman highlighted the importanceof transportation to the U.S. economy and the role of tech-nology improvements. “We have a greater opportunitywhen you look at transportation, not as an individualvehicle, but as a system of our economy; an importantapplication of what makes America run.
“Transportation is electronic ideas and information.Transportation is commercial activity. Transportation isthe movement of goods, services, and people. Your rolein remote sensing is integral in making this happen in thebest way possible.”
Administrator Engleman finished her remarks by offer-ing this challenge to the participants:
“In my prior life, I was CEO of an organization. I con-sider myself the CEO of RSPA. For me, CEO means Com-municate, Educate, and Outreach. I need your help toshare those responsibilities to support this program. Wecannot do this alone. The federal government is not acheckbook. The federal government is not a private pot ofmoney. The federal government is you and me and ourtaxes paid April 15. So, we need to work together to investour money and not spend our money.
“Deployment of new technologies is an evolutionfrom research, development, demonstration, deploy-ment, to commercialization. I know where the gap is. Iknow how difficult it is get from demonstration anddeployment to commercialization. That is the challengethat we all face. You’re looking at developing manynear-term solutions as well as the long-term planning.It is critical that we help communicate, educate, andreach out to the American public, members of Con-gress, and other agencies about the criticality of invest-ment in technology. I don’t want 2.1 million miles ofpipeline just sitting there vulnerable to terrorist attack.I want sensors to tell me how my pipelines are doing. Iwant self-healing pipes. I want unmanned air vehicles.I want to see technology help us. We have to track themovement of hazardous materials—we have to find it;we have to know how to move it. These are things thatyou can help with.
“So, think beyond your immediate application andtell me how everything you can do can give me five timesthe bang for the buck on the federal investment, and Iwill march up the mountain with you to help you find themoney. But, it has to be ‘a joint watch,’ using some Navyterms. Why allow technology and the importance ofresearch to get lost in the communication of everythingelse? Not on my watch will I allow our investment tofalter or dwindle, and not on our watch will we let theAmerican people down.”
10 REMOTE SENSING FOR TRANSPORTATION 2001
53864_TRB_p17_22 8/25/03 3:08 PM Page 10
U.S. DEPARTMENT OF TRANSPORTATIONPROGRAM PROGRESS—BUILDING A REMOTESENSING FOUNDATION FOR TRANSPORTATION:K. T. THIRUMALAI
K.T. Thirumalai reported that there has been sig-nificant progress since the 2000 conference inthe program and work of the four university
consortia in the National Consortium on Remote Sensingin Transportation.
“We set objectives to have smarter and more effi-cient transportation services for the 21st century in theprogram,” he said. “Then, with partnership support,we tried to segment the technology-based developmentthrough university consortia participation. As you mayappreciate, for every dollar we invest, the universitiesinvest another dollar on that particular activity. Bybuilding the partnerships and the university consortia,we were able to cover the technology base for prod-ucts. Then we coupled integrated product demonstra-tion in partnership with service providers, and we inte-grated the whole activity to move as one unit in eachone of the important areas that Administrator Engle-man pointed out.”
Thirumalai presented some highlights of projects theconsortia will present at the conference, including
• Assessing the highway right-of-way for moving theCSX railroad in Mississippi;
• Blending a multisensor data collection to improvewetland identification and conduct wetland permitting;
• Applying remote sensing for improving bridge man-agement across the country;
• Using remote sensing for intermodal applications inthe Alameda Corridor in California;
• Applying remote sensing in traffic flow to bridgeremote sensing and intelligent transportation system(ITS) technology in ways that enable remote sensingtools to supplement ITS;
• Managing the freight flow in urban areas and inintercity transportation;
• Applying remote sensing to open up new horizonsfor disaster detection and management by developing theability to identify potential landslide areas;
• Applying unmanned aerial technology to monitortransit operations and to continuously collect data andinformation in ways that could interact with ITS devices;and
• Exploring sensor options, with NASA support, toprovide near real-time data anywhere.
Thirumalai presented a technical and business visionfor the program: “Our technical vision will be to try toapply some of the remote sensing technologies to trans-
portation security, trying to develop those capabilitiesfor anytime, anywhere data collection for transportation,and trying to develop those capabilities for near real-timeimage analysis and data information systems. Most ofall, we want to develop this activity to the standards ofglobal excellence. I do not know of any other activity inthe world focusing on remote sensing in transportation.We are the first such operation. We hope to make thebest use of this opportunity.
“On the business vision, we would like a nationwideapplication of remote sensing products and technologiesfor providing remote sensing to the transportation ser-vices. We would like awareness of remote sensing in eachstate so that you would be able to recognize the values ofremote sensing tools and apply them in your activities.Above all, we would like to reach the global marketplacefor some of the excellent products that are coming out ofthe program.”
TOP 10 ISSUES IN REMOTE SENSING FORTRANSPORTATION (WITH PREDICTIONS):REMOTE SENSING AND CHALLENGES
Michael R. Thomas
Iam delighted to be here. NASA is very glad to be a partof this joint program. NASA is an R&D organization.My responsibility in the applications division is to get
science and technology results out of the science commu-nity and NASA and into the hands of people that can usethem to really affect their operational lives and decisions.As an R&D organization, we cannot do that without ope-rational partners like USDOT. So, we are glad to be here.We are behind the partnership 100%, and we are delightedwith the early results of the program.
What really are the challenges for applying remotesensing data to issues in transportation? I think they arepretty much these:
1. Availability of data,2. Cost,3. Licensing,4. Image-processing software,5. User conservatism,6. Training,7. Database management,8. Real-time imagery,9. Currency, and
10. Communication.
The following are my views from my position in NASAon what is happening in each of these areas.
OPENING SESSION 11
53864_TRB_p17_22 8/25/03 3:08 PM Page 11
Availability of Data
Data from satellites, airplanes, and helicopters are alllimited in their own way. I think what is on the horizonis the extended use of uninhabited aerial vehicles (UAVs).The UAVs today have many advantages over satellites,primarily because you can replace the sensor payloads inthem instantly. You don’t have to fight the current tech-nology lag, in which you design an instrument and by thetime you go through the entire launch process, yourinstrument is probably 5 to 6 years old, and you can’tbring it back and swap out parts. When you get a betterfocal plane, you don’t just rush up there and change itout. With UAVs you can do that.
Some of the projects you will see here at this conferenceinvolve UAVs. While these are mostly the small ones, peo-ple are making very large UAVs with long loiter times.There is a UAV program that used to be called Tier 2Minus, with a very large UAV that can carry hundreds ofpounds in both communications and sensor payloads. TheUAV flies at 65,000 ft and can loiter for very long periodsof time—months, for example. When you have an on-sta-tion UAV of a very high altitude, it can be carrying com-munications, telecommunications packages, and sensorpackages much more effectively than other alternatives.So, I think UAVs in the next 10 years are going to start tobe a factor in the remote sensing business.
Cost
Cost is constantly an issue. Remote sensing data are per-ceived as expensive, but I think the time is coming whenwe are going to start looking more at the life-cycle costmodel for remote sensing data. We will find out it is notexpensive. There are some significant savings from remotesensing data. We need to start looking at it as an infra-structure issue rather than as a special cost.
The selective updating of information is not routine. Itis very hard to tell what you need a new picture of, be-cause what you want is the information. You don’t wantthe picture; you only need a picture if something haschanged. We are not doing a very good job now of figur-ing out where we need new coverage and when we needto refresh our aerial coverage or our remote sensing cov-erage. I think we will start to do a much better job withthat. It will be driven by just-in-time requirements suchas, What is the perishability of the data? When do I haveto go collect it to extract the information that I really needfor this task? What is the area of coverage that I reallyneed just to do this project? Considering these require-ments will bring the cost down.
Licensing
Licensing is going to be a continual issue until the busi-ness community, the private sector, develops a business
model that gives the public sector what it really requires,which is public domain licenses. When people in the pub-lic domain buy data, the data have to be releasable. Thetension is that the commercial providers want to resellthe stuff. Obviously, it is to their benefit to sell it asmany times as possible. I think this is just a built-in ten-sion in this relationship. Probably business models aregoing to emerge and some have already, in which thebaseline standard products are sold and are releasable,and they are in the public domain. On top of those, or inaddition to those, value-added resellers are customizingspecial information packages and products that they canretain the rights to. I think we will probably see more andmore of that.
Image-Processing Software
We have a long way to go on this issue. Thank goodnesswe have a couple of projects that we are sponsoring inthis program that I believe will help. Image-processingsoftware right now has acquisition requirements. Dif-ferent kinds of software like different kinds of data anddifferent kinds of sources and formats. Information ex-traction is mostly manual these days, is very arcane, re-quires special training, and is not very well developed toany particular end user, a transportation user, for ex-ample. The transportation user is going to use the sameversion of ERDAS software with a little bit of tailoring.Also, the downstream systems, the data that you extractfrom the imagery, are not easy to integrate with the othersystems in your business—the computer-aided design andcomputer-aided manufacturing systems, road centerlines,and things like that. But, I think improvements comealong relatively quickly. This is one of those push-and-pull issues. If there is a demonstrated market and cus-tomer pull, then believe me, the software manufacturerswill make software that addresses that pull. As the indus-try matures and as the use of remote sensing in trans-portation flourishes and expands, I think these issues willbe addressed by the industry to meet the demonstrateddemand.
User Conservatism
Departments of transportation (DOTs) are not earlyadopters. They are risk-averse, they have limited re-sources, and they can’t afford to be wrong, especially indays of declining budgets. It is career limiting for some-body to take a flyer on a big expensive program and havethe thing flop. I don’t expect operational users in a DOTor other operating agencies to be risk takers. That is notwhat they get paid for. They get paid for the right solutionand the right cost. So, we have to recognize this reality.
This joint RSPA–NASA program is the perfect vehicleto wring the bugs out of these systems and to show people
12 REMOTE SENSING FOR TRANSPORTATION 2001
53864_TRB_p17_22 8/25/03 3:08 PM Page 12

in an operational environment that higher-technologysolutions to their problems exist. Those solutions arepretty robust. They are almost ready for prime time,although I would say we are right on the verge of beingready. As we develop successful operations and commu-nicate the results to our peers, I think we will solve thisproblem of conservatism.
Training
Training has already been mentioned a couple of timestoday. It was mentioned at the earlier conference as oneof the key issues. Most of the training now is supplied bysoftware vendors, and it is training to use their particu-lar software. It is appropriate for their products and notbased on the business model of the user. Now, we arestarting to see that change a little bit through industryand professional organizations such as the American So-ciety for Photogrammetry and Remote Sensing (ASPRS).ASPRS and other similar user organizations are primemovers in figuring out what kind of workforce develop-ment is needed, what kind of training is needed, and howto apply the training. I would like to propose that thegovernment itself could help here by extending the use ofgovernment training centers. I think it is probably timethat we start looking to create a curriculum in those gov-ernment training centers for federal, state, and local usersof this new remote sensing technology.
Database Management
Today, we manage the images, which is not what wewant to do. What we really want to do is to manage infor-mation. Managing the imagery is just something we do onthe way to getting to the information. We do not need big,complicated image storage, retrieval, search, and manip-ulation systems. Typically those systems are centralized,very expensive, and slow. I don’t think we want to bepushing the images around anyway. What we really wantis for the information to be extracted from the image andthen for that extracted information to be what we aresharing so that it is virtually available to people who needit. We need to change from a kind of image managementarchitecture mindset to an information managementmindset, in which metadata and derived information arewhat are widely distributed and shared.
I believe we need a system in which the updating andmaintenance of information are performed at the lowestlevel and rolled up to synoptic data with the creation ofad hoc data products on the fly—a business model thatreimburses custodians by access. The way we are attack-ing the problem now—the U.S. Geological Survey’s(USGS) national map is an example—is with kind of atop-down information flow. The idea is that some high-level repository will send data out to the people in the
field. I think that is backwards. What you see, especiallyin the Department of Defense (DoD), is that the peoplewho have to maintain the data themselves, the people forwhom these data are the critical issue, are the best peo-ple to maintain it. These are typically the people at thebottom of the structure—not the top of the structure.These are the people that actually collect the data. Theyare the ones with the most current data. It is the munici-palities, the regional guys, and the state guys that reallyhave the freshest data, because it is in their interest to col-lect it, to make sure it is correct, and to keep it fresh.They have to be serving this data upwards—not the otherway around. So, what you need is a system that is creat-ing larger, higher-level views, synoptic views from thedetailed information that the people at the lowest levelsin the organization are providing. What is the incentivefor people to do that? Well, now, none. What you reallyneed is a business model, or a financial model, that cre-ates incentives for those people at the bottom to sharetheir data. You need a cost-reimbursement model byaccess, so if the data are rolled up to a higher level, theperson that collected it and created it and maintains it getsreimbursed for that, so that person can start offsetting thecost of doing the data collection and maintenance.
This is something we ought to think about. I don’teven know who should think about it. What we need is aremote sensing information data czar or something likethat. I have been having discussions with USGS aboutthese kinds of things, and maybe the national map is aprogram that might take a look at how to organize infor-mation like this. It is probably beyond any agency likeDOT or USGS or public utilities and people like that whowant to share spatial information. You probably need alarger organization to be an overview organization.
Real-Time Imagery
I know it is desirable, but there are enormous problemswith real-time imagery. The first is processing. I remem-ber 5 to 6 years ago, I was attending a briefing, and Gen-eral [James R.] Clapper stood up and said to a roomful ofaerospace companies, “It is not the camera, stupid.” Wewere collecting something like 16,000 to 17,000 imagesa day during Desert Storm, plus aircraft gun camera video.We had 16 image analysts. We got about 25% of thedata looked at on Day 1. On Day 2, we now had about1% of all the data looked at. Day 3? Every day you getmore than 16,000 new images. The fact is that you cancollect a lot more images than you can extract informa-tion from. The only thing to do about it right now, I be-lieve, is to go back to basics and ask, “What do we wantthis real-time data for?” and “How else could we collectit other than by remote sensing?” Remote sensing is pro-bably not the best way, given our inability to process re-mote sensing data right now. Probably what we will do
OPENING SESSION 13
53864_TRB_p17_22 8/25/03 3:08 PM Page 13
is fuse information collected from a number of differentsources—intelligent highway systems, intelligent vehi-cles, and some remote sensing data maybe as required forsnapshot views or for durational views. There is likely tobe some mix of data that is appropriate to solving thoseproblems.
There is also a privacy issue with real-time remotesensing imagery, which we haven’t talked about verymuch. It is all well and good for traffic flow people to saywe want to understand origins and destinations, but howmany people here want somebody to know that we leftthis location and went to that location every time westart and use our cars? That question is bordering on aprivacy issue, I think.
Currency
Obviously, spatial information is very perishable. Thetimeliness of the data is related to the question you areasking. Some data don’t have to be refreshed very often.Some data have to be refreshed much more often. Fre-quently, it is the change that you are interested in. You donot want to have to go and recollect all the data just tofind out that you only had these two little changes, whichyou could have spot-collected if you had known.
Improved software will help us a great deal here—analysis software such as automated information extrac-tion software and change detection software. We haveinvested an enormous amount of money over the last 15to 20 years in automatic feature extraction without verymuch progress. I left DoD in the early 1990s and thenbecame reacquainted with automatic feature extractiona couple of years ago. I didn’t see any difference at all.It is remarkable that in almost an 8- to 9-year span ofcontinued investment in this field, there was very littleprogress. I think the reason is that we are still stuck withtwo-dimensional data, for the most part. Frankly, two-dimensional data are just not enough to distinguish fea-tures from each other. You have to have three-dimensionaldata. You have to have elevation data. What you need todo a good job is the elevation, the material of the thingyou’re looking at, and the surface texture. If you can putthose three kinds of information together, you have a sig-nature that says it is asphalt; you’ve got a surface texture;and you’ve got an elevation. Then it is much easier to saythis is a roof and not a parking lot. As those data sourcesbecome fused, operationally we will do much better withautomatic information extraction, automatic feature de-tection, and automatic change detection. That is what weneed for this industry to take off. You just can’t haveenough eyes on the imagery to do this manually for a largescale. But I think it is almost there.
Communication
It is important for the people in this field to reinforceeach other, and we do that a lot at conferences like this.We encourage each other to keep working. It is hardwork, and so we need this support group, but we have togo beyond this. We have to get to the larger world withreal results, before we can change things. I suggest we doexecutive seminars, which would probably be a greatthing. We all know how important this field is and howexciting it is and how much it can potentially do. Theimportant thing is that our boss knows that. We shouldprobably think about executive-level seminars where wecan bring in higher-level people and indoctrinate them orinfect them with this idea.
Integrating new knowledge acquisition with profes-sional development plans would be a great way to dothis. In NASA, every employee has an individual devel-opment plan. For the people who work for me, I’ll justmake it part of their plan for them to acquire knowledgeand skill in this area. It is relatively easy to do. You canupdate the skill set of your employees this way. But,unless you make it part of their formal plan, people lefton their own will just tend to do what they do—a bodyat rest tends to stay at rest. You have to provide somestimulation. We all owe it to our employees to help themupdate their skill set.
Finally, intern and extern programs are terrific. Wehave talked about this before, having people from DOTscome to the Stennis Space Center for 3 to 5 months. Wewould love to do that. We would love to send peoplefrom our labs to DOT locations, for example, to stimu-late the interaction and the exchange of information, sopeople can work with it, get their hands on it, see how itworks. I think that would help us a lot.
Conclusion
In conclusion, I think this program is very important. Ithink it is in the right place at the right time. It is address-ing directly many of the issues that I brought up withprojects that you will see briefed. It is creating synergywith other NASA and DOT programs. NASA has a stateand local Broad Agency Announcement out on the streetnow. We would love to see those contracts be focused ontransportation issues and be synergistic with the pro-grams here in RSPA. Also, it focuses attention on mod-ernizing, on how we view our transportation infrastruc-ture, and on the importance of innovation. Finally, frommy own parochial point of view, this program highlightshow NASA can help operational agencies increase thelevel of technical sophistication.
14 REMOTE SENSING FOR TRANSPORTATION 2001
53864_TRB_p17_22 8/25/03 3:08 PM Page 14
SESSION 2
Environmental StreamliningOverview of Remote Sensing Products and Results
Roger L. King, Mississippi State UniversityCharles Gaston O’Hara, Mississippi State UniversityIan MacGillivray, Iowa Department of Transportation, Moderator
15
ENVIRONMENTAL ASSESSMENTS: CONSORTIUM PAPER PRESENTATION
Roger L. King and Charles Gaston O’Hara
The National Consortium on Remote Sensing in Transportation–Environmental Assessments(NCRST-E) is one of four consortia established
by the National Aeronautics and Space Administration(NASA) and the U.S. Department of Transportation(USDOT) to lead in the application of remote sensingand geospatial technologies in the transportation indus-try. The primary mission of the consortium for envi-ronmental assessments is to develop and promote theuse of remote sensing and geospatial technologies andrequisite analysis products by transportation decisionmakers and environmental assessment specialists formeasuring, monitoring, and assessing environmentalconditions in relation to transportation infrastructure.The consortium is composed of partners from universi-ties (Mississippi State University, Auburn University,University of Alabama in Huntsville, and University ofMississippi), government (NASA Marshall Space FlightCenter and Global Hydrology and Climate Center), andbusinesses (DigitalGlobe, EarthData Technologies,Intermap Technologies, and ITRES Corporation). Theconsortium also has been asked to provide technical over-sight to separately funded technical application projects(TAPs). TAPs presently under this oversight includeprojects led by EarthData, ICF Consulting, Veridian,the Virginia Department of Transportation (VDOT),
and the Washington State Department of Transporta-tion (WSDOT).
Background
Urban growth and sprawl have been attributed to a num-ber of cultural and economic conditions, one of which is highway development. It is a conundrum as to whetherhighway development initiates urban growth or whetherurbanization and the concomitant expansion of suburbanbedroom communities into rural areas precipitate trans-portation development. Regardless, the growth of trans-portation networks associated with urban growth andsprawl translates into a host of environmental impacts,ranging from deforestation to impacts on local and re-gional hydrology, and accentuation or enhancement ofsuch land–atmosphere factors as the urban heat islandphenomenon. Remote sensing allows the synoptic obser-vation and analyses of urban growth. This has been at arelatively coarse level (e.g., >30 m) via satellite plat-forms. With the advent of current, or soon-to-be launched,satellite-based imaging instruments that provide spatial re-solutions of 4 m, it is now possible to obtain a muchclearer picture of these environmental impacts. Moreover,anticipated hyperspectral sensors will provide increasedradiometric resolutions that have the potential to bringabout greater understanding of changes in land use andland cover. Opportunities exist for exploiting remote sens-ing imagery with increased spatial, radiometric, and tem-poral resolutions for analysis of transportation impacts onthe environment. However, analytical techniques need to
53864_TRB_p23_28 8/25/03 3:08 PM Page 15

be developed and verified to demonstrate the viability ofthis kind of observational and quantitative information.
Since the passage of the National Environmental Pol-icy Review Act of 1969 (NEPA), the Clean Air Act, theClean Water Act, the Intermodal Surface TransportationEfficiency Act, and other related legislation, transporta-tion agencies have been obligated to put transportationprojects through an often rigorous and time-consumingenvironmental review process. A need to expedite theapproval process was voiced in the Transportation in theNew Millennium paper by the Transportation ResearchBoard (TRB) Committee on Environmental Analysis inTransportation (Committee A1F02) entitled, “Environ-mental Analysis for Transportation Projects.” However,when the author of the paper listed several technologiesthat have had a “profound effect in the area of environ-mental analysis,” remote sensing was missing from thatlist. NCRST-E has a goal to help increase awareness andinterest in utilizing remote sensing to expedite and stan-dardize the environmental review process among trans-portation agencies, to make the process part of the earlystages of project development and design, and to do soin a more cost-effective manner. However, to accomplishthis goal, the utility of remote sensing imagery needs tobe examined to determine if it in fact provides informa-tion that is a significant improvement over that fromsources already available to planners, decision makers,and other members of the transportation community.
Mission and Goals
The primary mission of the consortium for environmen-tal assessments is to develop and promote the use of re-mote sensing and geospatial technologies and requisiteanalysis products by transportation decision makers andenvironmental assessment specialists for measuring, mon-itoring, and assessing environmental conditions in rela-tion to transportation infrastructure. To accomplish thismission NCRST-E has four goals:
• Developing innovative remote sensing technologysolutions for assessing the implications of transportationon the natural environment and protecting and enhancingthe environment;
• Assessing and planning, in particular, the capabi-lities of new high-resolution, multispectral sensors and developing the tools necessary to efficiently extract infor-mation content from remote observations;
• Streamlining and standardizing data processing forinformation necessary to meet federal and state environ-mental regulations and requirements; and
• Increasing the awareness and understanding of re-mote sensing technologies and products through work-shops and educational materials.
NCRST-E is exploring applications of remote sensingimagery of increased spatial, radiometric, and temporalresolution for the analysis of transportation impacts onthe environment, both human and man-made. Strategicresearch areas of the NCRST-E encompass needs assess-ment for remote sensing information in transportationenvironmental assessment; land cover classification andchange detection; wetlands mapping and assessment; airquality measurement, analysis, and modeling; watershedassessment and characterization; habitat assessment;cultural feature identification; and digital geospatial li-braries for environmental assessment and planning intransportation.
Needs Assessment
An initial task of NCRST-E was to work with TRB of theNational Academy of Sciences–National Research Coun-cil in determining areas in which remote sensing could beused by the transportation industry. NCRST-E’s research,technology application, and education programs respondto the needs of transportation stakeholders for evaluatedenvironmental assessment geospatial information. Theseinformation needs were compiled through workshops,surveys of transportation agencies, and literature reviews.The NCRST-E needs assessment process and results, aswell as publications for other described areas of research,can be found at the NCRST-E website: www.ncrste.msstate.edu/publications.
The following list summarizes the environmental sub-ject areas identified by the user groups:
• Regulatory streamlining,• Watershed assessment,• Wetlands,• Water quality and storm water,• Land use change,• Air quality,• Species,• Floodplain management,• Environmental justice, and• Cultural resources.
Several environmental process issues were also identi-fied by the group:
• Regulatory acceptance of remote sensing data,• Accuracy,• Real-time data,• Data directory,• Metrics and measurement,• Benefit–cost information, and• Education and outreach.
16 REMOTE SENSING FOR TRANSPORTATION 2001
53864_TRB_p23_28 8/25/03 3:08 PM Page 16

Field Studies
NCRST-E has a suite of ongoing field studies to ascertainand demonstrate the viability of remote sensing in en-vironmental assessments, integration, and streamlining.Several of these projects being conducted by the univer-sity partners are detailed below.
Land Cover Classification and Change Detection
For the Mississippi Gulf Coast I-10 and coastal corridorand for an area in the Appalachian region, the NCRST-E’sefforts in land cover classification and change detectionare producing significant results. Within the Appalachianregion, 55 counties of northeastern Alabama, northwest-ern Georgia, and south–central Tennessee are included ina regional environmental assessment. The MississippiGulf Coast I-10 and coastal corridor project is investi-gating the changes that have occurred in the Mississippicoastal corridor over the past 30 years in land cover, landuse, and transportation infrastructure. From these efforts,the consortium expects to gain valuable insight into therelationship between transportation development andlong-term environmental changes and possibly even intorates of change. At the NCRST-E website, TechnologyNotes describing these projects are available. Also acces-sible is a Technology Guideline for product implementa-tion, which provides methods and best practices for usingsatellite imagery to determine land cover for environ-mental assessment in transportation projects.
The Appalachian study area includes 55 counties of thesouthern Appalachian region of northeastern Alabama,northwestern Georgia, and south–central Tennessee. Thisregion includes the metropolitan areas of Atlanta, Georgia;Birmingham, Alabama; Chattanooga, Tennessee; andHuntsville, Alabama. The objective of this study is todetermine the effect of transportation development overthe past 25 years on the regional environment, includingchanges in land cover and land use, runoff, stream flow,and socioeconomic variables. From this study, the con-sortium expects to gain valuable insight into the relation-ship between transportation development and long-termenvironmental changes and possibly even into rates ofchange. Causal factors will not be defined.
Wetlands Identification and Mapping
Technology outreach among researchers, on-the-groundpractitioners, and regulators is critical to the develop-ment of acceptable approaches to identifying and map-ping wetlands with remote sensing products. The initialcritical questions that must be answered are, “How dothese data affect the assessment work flow?” and “Howdo these data provide results that differ from results of
traditional approaches?” Working closely with consor-tium partners, data providers, and transportation agenciesin several states, NCRST-E is answering those questionsand developing a set of best practices for utilizing remotesensing data for wetlands identification and mapping intransportation projects. Initial results from North Carolinaand Iowa studies indicate that the best uses will likelyinvolve using high-resolution image and elevation data tocreate information products for early screening anddetection of potential wetlands for alignment alternativesassessment and for field guides for wetlands biologistswho must eventually “walk the line” of selected align-ments. Additional studies under way in Virginia andAlabama will help refine data-processing methods, imple-mentation uses, best practices, and limitations. The devel-opment of sound, cost-effective, acceptable approachesto the use of remotely sensed data for wetlands identifi-cation and mapping will help improve screening andselection of alignments and minimize related wetlandsSection 404 actions. A Technology Guideline for productimplementation and assessment streamlining is availableat the NCRST-E website. Additional studies are beingconducted to assess the use of similar data for watershedassessment and characterization.
Air Quality Measurement, Analysis, and Modeling
Efforts to directly determine the impact of transportationon air quality have had varied success, but the use ofremote sensing technology may yield important results inthis area. Differential absorption LIDAR (DIAL) has beenused with success to monitor atmospheric pollutants, suchas nitrogen oxides, sulfur dioxide, hydrocarbons, ozone,and mercury vapors. LIDAR is the acronym for lightdetection and ranging. DIAL uses laser pulses to transmitand receive electromagnetic radiation. Noninvasive re-mote sensing DIAL systems operate on the principle thatthe absorption of light by the atmosphere and air pollu-tants has different wavelengths. NCRST-E has used DIALtechnology to measure air quality, correlating air contam-inant levels with vehicle traffic, meteorological conditions,and other factors to assist in developing improved modelsfor assessing the impact of transportation on air qualityand the environment. The results of early efforts are doc-umented on the NCRST-E website, and a TechnologyGuideline for product implementation is also available.
Habitat Assessment, Cultural FeatureIdentification, and Digital Geospatial Libraries
New project efforts are under way in habitat assess-ment, cultural feature identification, and digital geospa-tial libraries. All of these projects are being conducted
ENVIRONMENTAL STREAMLINING 17
53864_TRB_p23_28 8/25/03 3:08 PM Page 17

in partnership with transportation agencies that have on-the-ground needs for research for their projects. Thispartnering model for developing research efforts with atechnical outreach component has been identified as animportant key to the eventual successful implementationof the results of NCRST-E’s research efforts. Other keysto the success of this program include
• Identifying stakeholders and their information needs;• Understanding which information needs (i.e., prod-
ucts) can be met with remote sensing and geospatial tech-nologies;
• Understanding the accuracy or variance permittedin the environmental impact statement process;
• Successful technical outreach that matches realneeds with relevant research;
• Effective communication of developed remote sens-ing technology and methods for use and application in theenvironmental assessment of transportation projects; and
• Measurement and benchmarking research results.
Technology Application Projects
The longer-term research efforts of NCRST-E are linkedto TAPs conducted by service providers and transporta-tion agencies. The TAPs demonstrate how informationproducts derived from remote sensing and related tech-nology can be used by transportation professionals in theirengineering and decision-making work flows. TAPs havebeen selected through a competitive, yet cooperative, pro-cess that links transportation agency partners with knowninformation requirements and focused demonstrationprojects. TAPs receive guidance from and draw upon theexpertise in the NCRST consortia. TAPs are 1-year proj-ects. First-year TAPs are described below with summariesof the project results. Second-year TAPs are under wayand presented with their planned application of technicalexpertise, project objectives, and planned deliverables.
First-Year TAPs
ICF Consulting used high-spatial-resolution multispectralsatellite data to detect and map environmental features.
Out of its Fairfax, Virginia, office, ICF Consulting workedclosely with the VDOT road project to use high-spatial-resolution multispectral satellite data to detect and mapenvironmental features. The study compared the results ofremote sensing analysis with field environmental data andassessments and guided VDOT on using remote sensingdata and image-processing techniques in the environmen-tal and review assessment processes. With image datafrom Landsat and the IKONOS satellite, ICF demon-
strated the effective use of satellite image products to iden-tify natural and human environmental features.
ICF presented results from its study at the workshopon A Fast-Track Approach to NEPA Streamlining andEnvironmental Assessment: Technology DemonstrationProject (see Appendix B). The presentation focused onproviding transportation professionals with informationabout the acquisition and use of satellite imagery to assistin the environmental assessment process for transporta-tion projects.
EarthData International employed advanced technologyin airborne imaging, mapping, and geographic informa-tion systems (GIS) to streamline the NEPA permittingprocess.
The High Point, North Carolina, office of EarthData Inter-national, in partnership with the North Carolina Depart-ment of Transportation (NCDOT), employed airborneremote sensing technologies to create high-resolution pla-nimetric and topographic mapping products. The spatialaccuracy of these products was independently verified byNCDOT photogrammetrists. NCDOT design engineersused the data to create roadway designs. Wetlands fieldsurveys, performed to the standards of NCDOT and theU.S. Army Corps of Engineers, were used to verify theresults of wetlands classification performed with digitalhyperspectral imagery.
The EarthData project demonstrates that high-resolution, high-accuracy data can be acquired over largeproject areas and that such data are suitable for the eval-uation of multiple alternative corridors in the NEPA per-mitting process. This effort illustrates recent advances inphotogrammetry and airborne remote sensing, throughuse of advanced airborne mapping sensors to generatehigh-resolution data on terrain data, wetlands data, andorthorectified photography for corridor selection andalignment approval. The technologies employed byEarthData show how early data collection and generationof necessary information products can accelerate trans-portation decision-making processes, because detailedinformation is available more quickly for all the agenciesinvolved and for the public.
Acceptance of technologies such as the airborne GlobalPositioning System, inertial measurement, LIDAR, andhigh-resolution hyperspectral imagery by state DOTsfaces numerous challenges. Highway design engineers,DOT photogrammetrists, and wetlands biologists mustbe confident of the reliability and accuracy of these datain a high-volume map production environment. Fullacceptance of these new data types requires that the datameet specifications and be integrated into existing workflows.
EarthData’s final products include a Technology Guidefor implementing the data produced by advanced air-
18 REMOTE SENSING FOR TRANSPORTATION 2001
53864_TRB_p23_28 8/25/03 3:08 PM Page 18
borne mapping sensors in mainstream transportationpractice. The workshop on NEPA streamlining at theconference (see Appendix B) provided transportationprofessionals with improved understanding about theprocurement, integration, and use of these remote sens-ing information products for transportation projects.
Second-Year TAPs
WSDOT will demonstrate the use of commercial soft-ware and remotely sensed data to generate products thatstreamline the environmental analysis process in the plan-ning of transportation projects.
WSDOT will apply commercial remote sensing techno-logies specifically to NEPA-related analysis in planningthe Washington I-405 corridor project in the Puget Soundurban area. Current regional transportation planningefforts have identified this corridor as a high priority forcongestion relief. Currently, transportation planning andthe NEPA process for major projects are long and costlyprocesses that delay the delivery of transportation im-provements. This project will evaluate the utility of thenew technology in the NEPA process, by comparing thecost and quality of the results obtained from traditionalNEPA data collection methods with the cost and qualityof results obtained from the methods this project willdevelop, which will include remote sensing and relatedtechnology.
Among the major products of this project will be
• A spatial database of raw image data from a varietyof remote sensing sources and derived and interpretedinformation in GIS format, including information on landuse and land cover;
• Software procedures that access multiple datasources to derive information on land use and land coverand to identify and delineate areas where proposed trans-portation development might cause adverse environmen-tal impacts; and
• Cost–benefit analysis that compares—in cost, con-tent, accuracy, and timeliness—products derived fromconventional data-gathering practices with products de-veloped in this study.
VDOT will automate wetlands identification to meetfederal reporting requirements.
VDOT will demonstrate that remotely sensed wetlandsdata, when introduced early in the planning process withother available GIS data layers, serve as a good prelimi-nary indication of potential impact and as an accurateguide to field reconnaissance and surveying. The as-is
planning process follows the 1987 Corps of EngineersWetlands Delineation Manual with supplemental infor-mation from the National Wetlands Inventory data, soilsurvey data from the U.S. Department of AgricultureNational Resource Conservation Service, aerial photo-graphy, and field reconnaissance. The investigation includes plans to review VDOT wetland identificationprocesses for projects, review completed processes forUS-17, acquire ERDAS Sub-Pixel software, identify andacquire imagery, establish reflectance ranges for vegeta-tion types, refine wetland classification routines, and out-put wetland polygons to compare with existing GIS data,such as soil type, and with National Wetlands Inventorydata. The areas classified as wetlands will be comparedwith existing field reconnaissance data. The derived wet-land polygon data will be made available in the VDOTGIS and integrated with other enterprise GIS data. Dis-tribution of data will be enabled by means of Oracle,ESRI SDE, and ArcIMS software.
Veridian will develop a regional database for trans-portation planning for southern and coastal areas inMississippi.
Transportation planning can benefit significantly fromuse of regional environmental databases. Among themost significant benefits is the ability to rapidly assess theimpacts of changes in alignment configuration. This proj-ect focuses on the development of a regional database forsouthern Mississippi for the purposes of transportationplanning. Beginning with a regional database developedfor the Gulf Regional Planning Commission, Veridianwill use remotely sensed imagery to update existing vector data layers. The database will then be shared viaan Internet Map Server (IMS). Another portion of thestudy involves analysis and comparison of various digi-tal elevation data sources. Existing U.S. Geological Sur-vey information products and products derived fromremote sensing analyses will be compared with groundtruth data to determine if any of these data sources meetsthe needs of transportation planners. In addition, a trans-portation-planning tool will be developed to assist engi-neers and environmental scientists in evaluation of envi-ronmental impacts.
This GIS-based tool will allow the user to specify analignment configuration and right-of-way requirements.With this information, the tool will query the databasefor specific environmental features, calculate the amountof impacts for each feature, and develop an impact ma-trix. Finally, the tool will allow the user to develop “stripmaps” along the corridor at a specified scale. These mapscan be printed and used in the field. If possible, this toolwill be built upon the framework of the Veridian Battle-space Mapper tool originally designed for Department ofDefense applications.
ENVIRONMENTAL STREAMLINING 19
53864_TRB_p23_28 8/25/03 3:08 PM Page 19
Conclusions
NCRST-E is a multiyear research and education centerfunded by the USDOT to facilitate the use of remotesensing and geospatial technologies. NCRST-E has de-veloped partnerships with DOTs in several states for theutilization of imagery in environmental subject areas andprocesses. It serves as a national center of excellence forthe use of remote sensing and other geospatial technolo-gies for the transportation industry.
Bibliography
Willis, D. Environmental Analysis for Transportation Projects.In Transportation in the New Millennium: State of the Artand Future Directions. TRB, National Research Council,Washington, D.C., 2000. http://gulliver.trb.org/publications/millennium/00035.pdf.
Wetlands Delineation Manual. Technical Report 4-87-1. U.S.Army Corps of Engineers Waterways Experimental Station,Vicksburg, Miss., 1987.
MODERATOR SUMMARY
Ian MacGillivray
When I was introduced to environmental con-cerns a long time ago, when we were lookingat developing challenging projects, the first thing
that hit me was how overwhelming the challenge was.Finally, 20, 25, 30 years later, I’m beginning to see somepromise that maybe we can actually do what we wereasked to do under NEPA or other legislation. There is alot of promise. The potential is now starting to show.
I think we are a little ways away from getting it alldone, but the pace of development is accelerating. Thepotential is being demonstrated.
Environmental streamlining: what is that all about?To folks that are not in the middle of it, what it means isfaster, more than anything else. It takes a long time todevelop transportation projects. In fact, in our state we
have gone from a time not too many years ago when adesigner could develop a project in a couple of years, tothe point that now it takes 6 to 9 to 11 years to developmajor projects. We have been addressing that by chang-ing management practices, and on occasion we have evenbeen able to get it down to a 5-year turnaround for devel-oping a project. That is a real accomplishment, but thepublic thinks that is a joke.
Better, quicker, cheaper—I want to turn that phrasearound. Better is useful. Cheaper is okay, because thatwill close the sale for sure. But quicker is the most impor-tant. That affects our credibility and our ability to do ourjob and to have the work accepted by decision makers,and “decision makers” means the public. We need to bemore responsible to and inform the public about whatwe are doing. Remote sensing is a key opportunity andtool for us to do a better job of that.
As a nonpractitioner, I’ve seen the emergence of thesetools in the last few years. I don’t know a lot about thedesign of a sensor. I do know something about the use ofthe information when it comes down to the design andoperation of a transportation facility. I am quite im-pressed. I have also now begun to recognize that we havea Catch-22 at work, and perhaps we have a new chal-lenge to all of those folks. The Catch-22 for us at theDOT and the resource agencies is that we need to under-stand what you are trying to tell us and what you aredemonstrating, before we can adopt it. But, we will notapply it on projects unless we understand it, and we arenot going to learn unless we apply it.
One final observation from my view: I appreciate thatthe university consortia, with support from RSPA, arehere leading and bringing to us the development andapplication of remote sensing technologies. We do needto understand. We do need to get into it. We are notgoing to get into it with our old traditional approach.The role of universities is to develop that education andunderstanding, and that is what this conference and pro-gram are all about. So, what I need to say to my counter-parts at the DOTs is that you need to get involved withyour universities and become participants and learn inthat fashion. That is what we’re doing in Iowa, and we’reseeing that return on investment now.
20 REMOTE SENSING FOR TRANSPORTATION 2001
53864_TRB_p23_28 8/25/03 3:08 PM Page 20

SESSION 3
Transportation PlanningOverview of Remote Sensing Products and Results
Mark R. McCord, Ohio State UniversityMark Hickman, University of ArizonaMichael S. Bronzini, George Mason UniversityPrem K. Goel, Ohio State UniversityRichard B. Gomez, George Mason UniversityCarolyn J. Merry, Ohio State UniversityPitu B. Mirchandani, University of ArizonaJoel L. Morrison, Ohio State UniversityMark E. Hallenbeck, Washington State Department of Transportation, Moderator
21
REMOTE SENSING OF TRANSPORTATION FLOWS:CONSORTIUM PAPER PRESENTATION
Mark R. McCord, Mark Hickman, Michael S. Bronzini, Prem K. Goel, Richard B. Gomez, Carolyn J. Merry, Pitu B. Mirchandani, and Joel L. Morrison
This paper presents transportation flow problemsfor which remote sensing has been successfullyapplied and discusses recent results pointing to
other flow-related problems for which remote sensingcould be beneficial. The scope is limited to that consid-ered in the U.S. Department of Transportation’s (USDOT)National Consortium for Remote Sensing in Transporta-tion (NCRST) (see www.ncrst.org/ncrst.html). As con-sidered in the context of these consortia, remote sensingencompasses sensing from space- and air-based plat-forms. Compared with loop detectors, road tubes, andincreasingly operational side-of-the-road sensors, remotesensing from space and air offers the potential for wide-area coverage, synoptic views, rapid deployment, and flex-ible maneuverability. However, these potential advantages
generally come at the price of decreased temporal reso-lution. Moreover, the remote sensing of transportationflows from space- and air-based platforms is a relativelyundeveloped civilian activity, and many of the interest-ing applications may not yet even be identified.
This paper highlights numbers of space- and air-based applications and technologies, although probablynot all applications have been found. Similarly, there isno attempt to list all applications that likely could even-tually benefit from remote sensing. Rather, studies arepresented that have already produced concrete resultsto indicate that a flow-related problem could benefitfrom remote sensing. Several ideas for additional appli-cations warrant investigation, but no results are knownin support of the applications. It is hoped that thispaper will generate other ideas and the motivation topursue them.
The paper is organized into three major sections. Thefirst section discusses actual transportation-flow-relatedapplications of air- or space-based remote sensing. Thesecond presents recent results that indicate as-yet unde-veloped applications for which remote sensing may havepotential value. If the promise of these applications is tobe fulfilled, breakthroughs will be required in automatic
53864_TRB_p29_36 8/25/03 3:10 PM Page 21
vehicle detection. The third section reviews recent progressin this area and discusses work in uninhabited autono-mous vehicles (UAVs) related to remote sensing of trans-portation flows. The paper concludes with brief remarks.
Present Applications
The National Consortium on Remote Sensing in Transportation–Flows (NCRST-F) (see www.ncrst.org/research/ncrst_f.html) is the USDOT remote sensing con-sortium devoted to transportation flow activity. MuchNCRST-F work centers on developing the field of remotelysensing traffic flows from air or space for the purposes ofmonitoring, management, and intermodal planning andanalysis. There are several examples of successful applica-tions. Most major metropolitan areas provide helicopter-based traffic reports during peak periods. Similarly, duringlarge special events, such reports are common and help-ful. The sensing in these routine applications is ratherlow-tech: a trained reporter observes flow data. How-ever, the synoptic views gained from the air offer distinctadvantages compared with the local information collectedby a set of ground-based sensors. There have been other,perhaps less well-known, applications of space- and air-based remote sensing. The following applications are high-lighted because of their potential for widespread, if notroutine, use.
At the request of a private trucking company, SpaceImaging LLC in 2000 used panchromatic 1-m imageryobtained from sensors carried on the IKONOS satellite.Although details of the study are not publicly available,the company has given access to general information(Anderson and Young, 2001) on the company’s successfuluse of the imagery to quantify truck traffic on I-25 nearDenver, Colorado, with special emphasis on long trucks.The long trucks (>60 ft) served as an indicator of inter-state truck traffic, information that is not readily availablefrom other sources. Vehicles (including passenger cars)are clearly visible in the 1-m imagery shown. The numberof trucks observed in the imagery matched ground countsof the trucks to within 10%. Although this is not men-tioned in the report, the 10% discrepancy is not an indica-tion of the accuracy of the imagery. Rather, it likely reflectsfundamental differences between traffic density, whichis observed in image snapshots, and traffic flow, which isused largely because of reliance on location-specific groundsensors available to traffic monitoring crews. In fact, if theground counts had been converted to density estimates,the results would read: “The ground-based counts matchedthe image-based counts to within 10%.” Moreover, analy-sis conducted by NCRST-F researchers indicated that dis-crepancies between average density-based flow estimatesand true flow averages decrease rapidly with the numberof images taken at different times. Even with a single data
set in the Space Imaging application, however, the com-pany reported client satisfaction.
Private companies also provide air-based traffic sur-veys for transportation planning and management. Forexample, the Maricopa Association of Governments usedsuch surveys to study traffic congestion on freewaysand major arterials in the metropolitan area of Phoenix,Arizona (Maricopa Association of Governments, 2000).Skycomp Inc. collected aerial photographs of peak-periodtraffic congestion from a fixed-wing aircraft. Photographsof different locations were taken at 20-min intervals on 4 days during peak periods in the morning (7 to 9 a.m.) andevening (4 to 6 p.m.). This yielded a collection of 48 photo-graphs of each location (6 photographs in each of themorning and evening periods for each of 4 days).
The photographs were manually reduced to obtainvehicle queue lengths at major intersections and vehicledensities on freeway segments. Technicians manuallycounted the number of queued vehicles at the intersectionapproaches. Separate counts were made for left- and right-turn and through-movement lanes. These queue lengthswere combined with the traffic and turning movementcounts (obtained by another contractor) to estimate thestopped delay at the intersection, which is the typicallevel-of-service measure in arterial capacity analysis. Onfreeways, vehicle densities were determined directly fromthe aerial photographs for well-defined segments. Differ-ent classes of vehicles (passenger cars, trucks, tractor-trailers, and buses) were considered, and passenger-carequivalent factors were applied to determine a densitymeasure of passenger cars per lane per mile. This densityvalue was used with the Highway Capacity Manual (TRB,2000) to determine the freeway level of service. Separatestudies were conducted of the general-purpose lanes andof the high-occupancy-vehicle lanes in the study area.
Determination of locations generated by the GlobalPositioning System (GPS)—of emergency vehicles, snow-plows, long-haul trucks, and other fleets of vehicles forpurposes of managing operations and planning—is fairlystandard practice and outside the scope of air- and space-based remote sensing in this paper. GPS is arguably thebest way to monitor locations of these vehicles now andin the foreseeable future. Still, there is potential value in air-based imagery as a backdrop for GPS locations.Bridgewater State’s Moakley Center for TechnologicalApplications placed selected GPS-generated locations ofbuses in the Cape Cod, Massachusetts, area on hard-copyair-based imagery (see www.ncrst.org/research/ncrst-f/library.html). The product served as visual support forinvestigating suspected driver deviations from scheduledroutes.
This static, hard-copy application has motivated a moredynamic, electronic extension of the underlying concept.The Ohio State University Campus Area Bus Systemoperates approximately 30 buses over roughly a dozen
22 REMOTE SENSING FOR TRANSPORTATION 2001
53864_TRB_p29_36 8/25/03 3:10 PM Page 22

scheduled service routes in and around the campus. AGPS-based location system is used to obtain real-time pas-senger information and for off-line performance moni-toring. Among the applications of this information, buslocations are displayed in real time at a website on a crudemap background (see www.blis.units.ohio-state.edu).NCRST-F is also providing users with the option of see-ing the bus locations on an image backdrop of the area.This image offers a higher-tech and more aestheticallypleasing presentation of the information. If marketedwell, such an appearance could generate a more positiveimage and greater support among transit users and non-users alike.
Imaging methods not directly related to remote sens-ing of transportation flows but developed by NCRST-Fresearchers in other contexts have found their way into realapplications. EarthData was hired to provide near-real-time airborne data on hot spots at the World Trade Cen-ter twice daily for more than 1 month after September11, 2001. Data collection was then reduced to once a dayand eventually to once a week. Sample data can be foundat www.newyork.earthdata.com. The images were ac-quired with a 4K-by-4K digital camera, a technology de-veloped by NCRST-F researchers. This camera and thedirect georeferencing concepts used, also pioneered byNCRST-F researchers, were necessary for providingthe information in near–real time. These researchers,who have a long-standing professional relationship withEarthData, are refining these same hardware and soft-ware concepts for near-real-time flow detection.
Promising Areas for Development
In addition to successful implementation of air- and space-based remote sensing of transportation flows, recent re-sults point to the potential to develop other applications.
State DOTs and local agencies commit large amountsof equipment and personnel resources to estimating sys-tems’ traffic statistics. Two of the most commonly esti-mated statistics are average annual daily traffic (AADT)on individual highway segments and vehicle miles trav-eled (VMT) on a network of segments. Previous analysis(McCord et al., 1995) indicated the potential of detect-ing vehicles in 1-m satellite imagery and distinguishingsmall (passenger cars) from large (trucks) vehicles in theimagery. These results have been validated in availableIKONOS satellite imagery, such as that used in the SpaceImaging study presented above. This source of data couldconceivably be added to data collected from ground-based sensors to produce better AADT and VMT esti-mates. However, high-resolution sensors are carried onsatellites in low orbits that do not allow high-frequencytemporal sampling of the links. Moreover, the satellitedata consist of “snapshots” of the highway densities,
which would then be converted to equivalent volumescorresponding to extremely short (e.g., 5-min) time inter-vals. These extremely short-interval counts would thenbe expanded to daily counts that could be combined withthe ground-based data. In comparison with ground-baseddata only, these conversions and expansions would besubject to additional error or “noise.” The question thenbecomes, Is the noise in converting short-interval obser-vations to daily volumes too great and the sampling fre-quency too small to allow the satellite-based data to im-prove AADT and VMT estimates?
Computer simulation models developed by NCRST-Fresearchers show that the addition of even noisy satellitedata obtained with low temporal frequency to collectedground-based data can lead to large reductions of errorsin AADT and VMT estimates under a wide range of con-ditions. The results also show that using satellite-baseddata allows for dramatic reductions in ground-basedsampling efforts and in the number of required fixed traf-fic recorders, while it also decreases AADT and VMTerrors (McCord et al., 2002). States use a combination ofpermanent automatic traffic recorders (ATRs) and a cov-erage count sampling program. The results showed thata scenario of satellite-based data, some ATR data, andno coverage count program outperformed a scenario ofmore ATRs, an aggressive coverage count program, andno satellite-based data. Additional analytical results illus-trated that the assumptions in the analysis involved withconverting short-term satellite observations to 24-h vol-umes may be overly conservative (Goel and McCord,2001). A proof-of-concept study is being conducted withactual, rather than simulated, IKONOS imagery andground-based data to estimate AADT on selected highwaysegments in Ohio.
Remote sensing also could be used to track turningmovements and improve the estimation of dynamic andstatic origin–destination (OD) flows. OD flows are amongthe most fundamental demand characteristics for trans-portation flow planning studies and real-time traffic man-agement. Observed traffic counts on network segments—generally obtained from in situ traffic recorders—arevaluable data that can lead to improved OD estimates.Indeed, commercially available software packages nowinclude procedures for accomplishing this task for plan-ning applications. Air-based sensing can cover more ofthe network than that covered by a limited number of insitu sensors. Air-based sensing also offers the potential totrack individual vehicles or platoons of vehicles alongportions of their OD routes.
The potential was investigated, therefore, of improvingOD estimation with data collected from airborne remotesensing, which is collected more easily than data gatheredfrom ground-based sensors. Researchers collected 3 h ofvideo data from a tower on the Ohio State Universitycampus with three camera views covering portions of a
TRANSPORTATION PLANNING 23
53864_TRB_p29_36 8/25/03 3:10 PM Page 23
campus subnetwork with three intersections. The videodata were digitized, and vehicles were matched across thethree scenes. These processed data served as a data set oftrue OD flows, intersection turning movements, link vol-umes, and travel times. With a Kalman filtering approach(Ashok and Ben Akiva, 2000), 5-min OD flows were esti-mated from historical estimates of the flows and assign-ment matrices that relate OD flows to link flows. The esti-mates were produced under a set of scenarios representingdifferent traffic surveillance assumptions, and estimateswere compared with the true flows obtained from thevideo data. More detail on the study can be found inMishalani et al. (2002) and Gopalakrishnan (2001). Inbrief, adding turning movement observations to the tra-ditional link volume observations decreased the normal-ized root-mean-square-error (RMSE) of the 5-min flowestimates by more than 20% under the base case assump-tions. Similarly clear performance improvements wereobserved across a wide range of conditions with a sensi-tivity analysis of the historical estimates on the magnitudeof the OD flows. Moreover, when the historical estimatesof the assignment matrices were poor, adding link traveltime observations to the surveillance data led to a reduc-tion in RMSE of more than 10%, compared with theRMSE when only the link and intersection turning vol-umes were used. In addition, when aggregating OD flowsacross the 3-h period, adding observed intersection turn-ing movements to the OD estimation led to an RMSEreduction of more than 25% with base case historical esti-mates. However, adding observed link travel times led tono further reduction in RMSE even when a poor estimateof the assignment matrices was used, which indicates thatthe use of travel time data is important only when con-sidering dynamic OD flows.
Although the network was small, it is believed thatthis is the first study with empirical data to illustrate thevalue to OD estimation of observing turning movementsand link travel times—two flow variables likely bettermeasured from remote sensing than from traditionalground-based detectors. The results showed that the im-portance of link travel times increases as the quality de-creases of prior estimates of the assignment matrix, atleast for dynamic flow estimation. The quality of assign-ment matrix estimates would likely be poor for largeurban networks, and the empirical results implied thatthe positive effects of using air-based remote sensing sur-veillance would increase for the larger networks that areof interest to transportation planners and traffic man-agers. The study was extended to address the effect ofpartial spatial and temporal sampling of turning move-ments and link travel times. Larger networks with routechoice options also came under consideration.
Vehicle velocities are also among the flow-relatedparameters of most interest to transportation planners,engineers, enforcement agencies, and policy makers.
Ground-based sensors can be used to estimate vehiclevelocities at locations on a highway during a time inter-val. So-called floating cars often track average velocitiesalong highways. However, airborne sensors can be moreeasily maneuvered to sample multiple locations and havethe potential to collect velocities of multiple vehicles alonga highway section. These data would lead to more directand less subjective estimates of space mean speeds andtheir variances, which are of more fundamental interestto traffic flow applications than time mean speeds col-lected at points on the highway.
Therefore, NCRST-F researchers investigated the esti-mation of vehicle velocities from airborne imagery. Theycollected video data from a helicopter platform on twoseparate occasions in the Tucson, Arizona, area, in sum-mer 2000. Video data of several arterials and freewayswere collected with a handheld digital video camera fromaltitudes of 600 to 1,500 ft. A second flight in May 2001collected data at altitudes of 800 to 1,200 ft over a se-lected arterial and I-10. Sensor placement and orientationwere more carefully planned in this second flight, andwith a GPS unit, location and altitude of the helicopterwere recorded more accurately. Also, ground cameras anda GPS-equipped floating car were used to produce ground-based velocity estimates. Details and an extended analysisof the experiment, including analysis of the sensitivity tosampling intervals and scaling issues, are in Hickman et al.(2001). Because of the small sample size, the results canonly be considered indicative. Still, they show that thehelicopter-based estimates of space mean speed matchedthe ground truth estimates better than estimates derivedfrom traditional floating cars. (In obtaining average high-way velocities, driver subjectivity in determining andmatching average highway speed is always of concernwith floating cars.) The airborne video data also yieldedinformation on across-vehicle velocity variability that isunavailable from floating car data. A level-of-serviceanalysis also highlighted the ability to detect variations inflow-based performance measures among segments. Suchvariations could only be obtained with a large amount ofground-based collection equipment. The study also deter-mined a number of other flow parameters (Angel andHickman, 2002; Angel et al., 2002). Flow data collectedfrom helicopters or other airborne platforms may seemexpensive when the collection cost is attributed to onlyone data set. However, because of the richness of thetypes of data derived from airborne platforms, the cost ofcollection can be spread widely, and the cost per usefuldata item can be driven down markedly.
Progress in Automation
To realize the potential of these promising applicationswould require developments in identifying and, in the
24 REMOTE SENSING FOR TRANSPORTATION 2001
53864_TRB_p29_36 8/25/03 3:10 PM Page 24

case of the velocity and turning movements, matching oflarge numbers of vehicles across frames. In addition, ODestimation and velocity determination would be of valuein real-time applications. Therefore, it would be impor-tant to detect, classify, and match vehicles with little, ifany, human intervention. NCRST-F researchers have beendeveloping automated image-processing approaches foridentifying and classifying vehicles.
Researchers attempting to detect vehicles in high-resolution (1-m) panchromatic satellite imagery, the typeof imagery that would be used in the AADT and VMTestimation application described above, have been pur-suing several approaches in parallel. Two of these aredescribed below, both of which considered the compari-son of the image of interest with a background imagerepresenting the highway without vehicles. On low-vehicle-density highways, this background could con-ceivably be constructed by averaging several images ofthe same highway taken at different times. Low densitieswould lead to low probabilities of vehicles present at thesame locations in a set of images. The highway signalswould, therefore, tend to dominate the vehicle signals inthe average. For example, in an empirical trial with aseries of digitized aerial photographs on Ohio rural Inter-states, vehicle signals were almost entirely eliminatedwhen five images in the average were used (Merry et al.,2001). The researchers had access to only a few IKONOSimages with no repeated images of the same location.They, therefore, created a synthetic background image bymanually replacing gray levels of pixels where vehicleswere present with gray levels based on surrounding high-way pavement in the image.
The first approach relied on principal componentanalysis (PCA), which involves rotation of the originaldata into uncorrelated variables that account for vari-ability in the data. The sum of and absolute difference(absolute value of the difference) between the image ofinterest and the background image were first calculated.Mean and standard deviations over small spatial win-dows (2- × 2-pixel windows) were then computed forboth the sum and absolute difference images to producefour input bands to the PCA algorithm. Four PC bandswere produced as outputs, and a binary thresholding oper-ation was performed on the third band, which showedvery good performance for vehicle identification. (Re-searchers are investigating joint thresholding on the thirdand fourth bands, but no results are reported yet.)
The second approach (McCord et al., 2000) simulta-neously transformed the background image to the con-ditions of the image of interest and considered the dif-ference between the two images to assess whether eachpixel should be considered dynamic or static—whether apixel appears very different from the corresponding pixelin the background image and, therefore, was likely imagedwhen a moving object was occupying its location, or
whether it appears to be representative of the static,background pavement conditions. This procedure wasiterative and based on the use of natural splines and anexpectation–maximization approach to estimate the dis-tributions of the gray levels of static and dynamic pixelsin the difference images. Once the procedure converged,an output probability map assigned to each pixel a prob-ability for being static and therefore discarded as a can-didate for categorization as a vehicle pixel. A binarythresholding operation was then performed on this prob-ability image.
In both approaches, the binary threshold separated pix-els into those that should be further considered as possiblevehicles and those that should be eliminated from consid-eration. Adjoining pixels retained for further considera-tion as vehicles are clumped together, along with rulesbased on the size and geometry of the clumps, allowedclassification into small or large vehicles or nonvehicle ob-jects. Results are promising for both approaches (seewww.ncrst.org/research/ncrst_f/library.html), but werebased on a limited number of satellite images and scannedair photographs.
Other NCRST-F researchers are considering imageprocessing of airborne video data. Compared with 1-msatellite data, vehicles in video data cover a large numberof pixels. There are also an extremely large number ofimages in a time interval—on the order of 30 images persecond for video versus a single or perhaps stereo pair ofimages every few days for satellite imagery. On the otherhand, the helicopter platform is much less stable than thesatellite platform, which increases the complexity of videoimage processing.
The currently pursued approach to automatically pro-cessing the helicopter-based video uses edge detection tech-niques on each frame retained for analysis (Hickman et al.,2001). The coordinates, scale, and orientation of eachframe are used to transform a subsequent frame to thesame reference system as the first frame. The two framesare subtracted with the expectation that only dynamic(moving) objects will remain. To date, researchers havesuccessfully identified vehicles with this approach in lessthan 0.5 s. The goal is to identify and match vehicles in the2-s interval between successive image acquisitions targetedfor velocity determinations. Researchers are pursuing amaximum likelihood estimation technique to accomplishmatching in the 1.5 s remaining.
Other remote sensing technologies, proven in appli-cations outside of transportation, appear attractive to thesensing of transportation flows. Because they detect themore detailed characteristics of the sensed objects, theyoffer a better chance of distinguishing vehicles from thehighway and of matching identical vehicles sensed at dif-ferent times. Matching vehicles is important in trackingturning movements and in determining velocities, twotasks of special concern to developmental efforts.
TRANSPORTATION PLANNING 25
53864_TRB_p29_36 8/25/03 3:10 PM Page 25

Multi- and hyperspectral sensing is one attractivetechnology. Several spectral databases are available indefense and civilian agencies, but they deal mostly withsignatures of natural materials or military vehicle paintsand finishes. Therefore, NCRST-F researchers conductedfield measurements with a portable spectroradiometer ofvehicle paint and pavement signatures. Measurementswere taken on 2 days in a parking lot on the Universityof Arizona campus: on October 16, 2000, a bright andclear day, approximately 20 cars and 5 pavement typeswere sampled, and on April 20, 2001, a cloudy day,approximately 20 cars of different colors were measured.
Plots of reflectance as a function of wavelength between300 to 2500 nanometers can be found in Schowengerdt et al. (2001). Figures 1, 3, and 4 in their report show thatthe different vehicle colors were distinguishable from eachother and from pavement backgrounds throughout thevisible to shortwave infrared spectral regions. Figure 2in their report shows that different pavements can alsoclearly be distinguished. Developing an operational spec-tral signature library would require a much more extensivesampling program than that undertaken in this prelimi-nary study. However, this is the first study demonstratingthe ability to recognize civilian vehicles with multispectralimagery.
Light detection and ranging (LIDAR) is another sen-sor that has been gaining popularity in the remote sens-ing community. LIDAR data would provide over timethe (x, y, z) coordinates of a very large number of pointsfor a relatively extended area. The data can conceivablybe used to detect vehicles on a highway surface (the high-way has lower z-values than the vehicles do). The datawould also be conducive to classifying individual vehi-cles by three-dimensional estimates of size and shape, andthese characteristics can be used to match identical vehi-cles over time. Moreover, the stark numerical contrastsin vehicle (x, y, z) signatures from the background high-way are appealing for automated image processing. Asan active sensor, LIDAR can also image at night andunder reduced lighting and other adverse conditions.
Although LIDAR seems to be of increasing interest tothe remote sensing community, there appears to be noinvestigation in the civilian community of its use for vehi-cle detection and identification. Woolpert, LLP, donatedLIDAR data obtained over US-35 in Green County,Ohio, to NCRST-F researchers, who used the corre-sponding U.S. Geological Survey digital orthophotoquarter-quadrangle to serve as an image backdrop. Largevehicles (trucks) could be clearly identified by visualinspection of the data (see www.ncrst.org/research/ncrst-f/library.html). The LIDAR data collection effort was notdesigned for vehicle identification, and the researchersare investigating whether this data set will allow identi-fication of smaller vehicles (passenger cars), or whethera denser grid of LIDAR returns is required. Vehicle velo-
cities could also conceivably be estimated from the speedof the aircraft, the LIDAR scan rate, and an assumedvehicle length. The researchers are pursuing this innova-tive use of LIDAR data and testing it with their empiri-cal data.
A major impediment to determining velocities fromimagery, especially in near–real time, is the need to deter-mine ground-control points that reference overlappingimages taken at different times to the same coordinatesystem. NCRST-F researchers have been refining theirexpertise in the GPS, the inertial navigation system, andgeometric calibration of sensors to estimate and improvethe accuracy of automatically determining geocoordinatesof image pixels on the ground without the need to resortto the intermediate step of matching ground controlpoints. They believe that they can obtain between 2- and20-cm accuracy on the ground, depending on altitude andcalibration quality (Brzezinska et al., 2001). Even underthe worst-case assumption of uncorrelated errors, the20-cm error would correspond to extreme velocity errorsof less than 1.5 and 0.75 km/hr when the times betweenimages are 1 and 2 s, respectively. The researchers arecontinuing efforts to decrease georeferencing errors.Nevertheless, these already promising results have ledthem to join with researchers who have been estimatingvelocities from helicopter video on a new project that willdemonstrate the ability to estimate velocities directly(i.e., without matching ground control points) withthese accuracies.
In addition to sensors and processing developments,an expanded array of platforms is encouraging for thedevelopment of space- and air-based remote sensing oftransportation flows. The feasibility of obtaining high-quality, high-resolution imagery from nonmilitary satel-lite platforms has been proven with empirical IKONOSimagery. Fixed-wing and helicopter platforms have beenused operationally in traffic management and monitor-ing for some time. UAVs may soon offer another plat-form for data collection.
Bridgewater State’s Moakley Center for Technologi-cal Applications developed a small UAV and equipped itwith an inexpensive 35-mm camera and two video cam-eras (see www.ncrst.org/research/ncrst-f/library.html).This low-cost, commercially available UAV, which wascontrolled through a line-of-sight video link, collectedimagery to assist in monitoring commuter rail park-and-ride lots and vehicle and pedestrian traffic at an inter-modal facility. GeoData Systems, Inc., and DBR & Asso-ciates will soon be demonstrating the use of a larger UAVfor traffic surveillance on an arterial (US-13) and free-way (I-64) near Chesapeake, Virginia (GeoData Systems,Inc., and DBR & Associates, 2001). The Airborne DataAcquisition System (ADAS) will use high-resolution videoimagery to capture traffic data conditions during several15-min periods while loitering over arterial intersections
26 REMOTE SENSING FOR TRANSPORTATION 2001
53864_TRB_p29_36 8/25/03 3:10 PM Page 26
and a freeway interchange and flying along a 5-mi stretchof highway. The companies also intend to make ADASavailable on a standby basis to monitor traffic conditionsaround a future incident in the study area. Plans are beingformulated to demonstrate ADAS to state and localtransportation officials in the Central Ohio area in 2002.
Remarks
The use of air- and space-based remote sensing of trans-portation flows cannot be considered extensive. Never-theless, several flow-related applications have found theirway into the marketplace. Several other large-scale andrecurring flow problems could likely benefit from remotesensing, and only those with promising results have beendiscussed in this paper. Many other as-yet untested appli-cations may have similar potential. To realize this poten-tial, additional research and development are required.In many cases, the cost of the remotely sensed data to theusers must also be reduced. With the expected increasein supply of available satellite and airborne platforms—manned and eventually unmanned—the cost of datashould decrease, and the interest in exploiting the plat-forms should increase. The time, therefore, seems appro-priate for concentrated development of these areas.
Acknowledgments
This work was supported by the U.S. Department ofTransportation’s National Consortium on Remote Sens-ing of Transportation–Flows. We gratefully acknowledgethe contributions of Dorota Brzezinska, Benn Coifman,Rabi Mishalani, Bob Schowengerdt, and Charles Toth.
References
Anderson, D. E., and J. M. Young. Truck Traffic AnalysisUsing IKONOS Satellite Imagery. Space Imaging TechnicalBrief prepared for National Consortium on Remote Sensingin Transportation–Flows. Ohio State University Center forMapping, Columbus, May 2001.
Angel, A., and M. D. Hickman. Experimental Investiga-tion of Travel Time Estimation Using Georeferenced Aer-ial Video. Presented at the 81st Annual Meeting of the Transportation Research Board, Washington, D.C., Jan.2002.
Angel, A., M. Hickman, D. Chandnani, and P. Mirchandani.Application of Aerial Video for Traffic Flow Monitoringand Management. American Society of Civil Engineers Con-ference on Applications of Advanced Technology in Trans-portation, Cambridge, Mass., Aug. 2002.
Ashok, K., and M. Ben-Akiva. Alternative Approaches forReal-Time Estimation and Prediction of Time-Dependent
Origin–Destination Flows. Transportation Science, Vol., 34,No. 1, 2000.
Brzezinska, D., C. Toth, and M. McCord. Traffic Manage-ment: Sensor and Platform Issues. Annual Report. NationalConsortium on Remote Sensing in Transportation–Flows,2001. www.ncrst.org/research/ncrst-f/library.html.
GeoData Systems, Inc., and DBR & Associates. Using anUnmanned Airborne Data Acquisition System (ADAS) forTraffic Surveillance, Monitoring, and Management. InterimReport No. 1. Research and Special Programs Adminis-tration, U.S. Department of Transportation, Oct. 2001.www.ncrst.org/research/ncrst-f/library.html.
Goel, P., and M. McCord. Statistical Modeling for TrafficMonitoring. Quarterly Report of Project 00-02. NationalConsortium on Remote Sensing in Transportation–Flows,July 1–Sept. 30, 2001. www.ncrst.org/research/ncrst-f/library.html.
Gopalakrishnan, D. Evaluating Real-Time Origin–DestinationFlow Estimation Under Different Surveillance Data Avail-ability Scenarios. M.S. thesis. Ohio State University,Columbus, 2001.
Hickman, M., P. Mirchandani, A. Angel, and D. Chandnani.Needs Assessment and Allocation of Imaging Resources forTransportation Planning and Management. Annual Report.National Consortium on Remote Sensing in Transportation–Flows, 2001. www.ncrst.org/research/ncrst-f/library.html.
Highway Capacity Manual. TRB, National Research Council,Washington, D.C., 2000.
Maricopa Association of Governments. 1998 MAG RegionalCongestion Study. Final Report. Sept. 2000. www.mag.maricopa.gov.
McCord, M. R., C. J. Merry, and J. D. Bossler. Feasibility of Traffic Data Collection Using Satellite Imagery. FinalReport. FHWA, U.S. Department of Transportation; Ohio Department of Transportation, Columbus, April1995.
McCord, M. R., P. K. Goel, and C. J. Merry. Traffic Monitor-ing Using Satellite and Ground Data: Preparation for Feasi-bility Tests and Operational System. Final Report. OhioDepartment of Transportation, Columbus, June 2000.
McCord, M. R., P. K. Goel, Z. Jiang, and P. Bobbit. ImprovingAADT and VMT Estimates with High-Resolution SatelliteImagery: Simulate Analytical Results. American Society ofCivil Engineers Conference on Applications of AdvancedTechnology in Transportation, Cambridge, Mass., Aug. 2002.
Merry, C., B. Coifman, P. Goel, M. McCord. Satellite-Based Datafor Traffic Monitoring Applications: Proof of Concepts andOperational Issues. Quarterly Report, Project 00-01. Na-tional Consortium on Remote Sensing in Transportation–Flows, July 1–Sept. 30, 2001. www.ncrst.org/research/ncrst-f/library.html.
Mishalani, R., B. Coifman, and U. Ozguner. Evaluating Real-Time Origin–Destination Flow Estimation Using RemoteSensing-Based Surveillance Data. American Society of CivilEngineers Conference on Applications of Advanced Tech-nology in Transportation, Cambridge, Mass., Aug. 2002.
Schowengerdt, R., A. C. Shastry, and J. B. Engle. Validation ofRemote Sensing Techniques for Traffic Flow. Annual Report.National Consortium on Remote Sensing in Transportation–Flows, 2001. www.ncrst.org/research/ncrst-f/library.html.
TRANSPORTATION PLANNING 27
53864_TRB_p29_36 8/25/03 3:10 PM Page 27
MODERATOR SUMMARY
Mark E. Hallenbeck
Iwant to compliment Ohio State University and its con-sortium partners. If you look from a year ago to wherewe are today, I think they have made a lot of wonder-
ful progress. A year ago, I thought the area of traffic flowhad the farthest to go of all the consortia. Now, we stillhave the farthest to go. It is like measuring infinity. Howbig is infinity? How far is it? We have a long way to go,and yet I think even more now that flows has the biggestpotential of all the groups that you’ll hear about today.
We’ve talked about counting cars from space as long asI’ve been involved in counting cars, which is longer than Icare to admit, but there is so much going on when it comesto understanding traffic. There is a huge body of knowl-edge that we have to manage in how we operate trans-portation facilities. It is not a new thing for state DOTsand local agencies, but its importance has changed in thelast few years. In Washington State we found out a lot ear-lier than other parts of the country that we could not buildour way out of traffic. We got the operations message andhad to do operations earlier than much of the rest of thecountry.
One thing we found out is that you cannot operatesomething if you do not understand what is going on. Wecannot afford, under conventional technologies, to obtainthe information necessary to understand and manageoperations.
I want to take exception to some earlier presentationsconcerning the collection of data from remote sensing—that is, data are not information. We don’t need data. Weneed information. That is the key between going fromgigabytes worth of images, sensors, and hyperspectros toinformation on operations.
We do need data, but operations data are new to us.Very few cities have ramp controls. We still do traffic sig-nal operations as it was done in 1920. If we are verylucky, we have made it to the 1960s. We have technolo-gies that can allow us to do adaptive traffic controls, thatcan change traffic signals on the basis of the flow that isthere, or better yet, the flow that will be there 5 min fromnow, but only if we have sensing, and we do not have it.
Here is the opportunity for us and for remote sensing.To do operations, we have to cover enormous geographicareas for both the data and, more importantly, informa-tion. The time frame is, in fact, continuous. We do nothave to be out there continuously, because we do nothave to operate the whole roadway system hands-on rightnow, but we do need this mix of continuous, forever oper-ations. You are going to operate the Beltway here in Wash-ington, D.C., and we are going to operate Interstate 5continuously because they are so busy. There are othersections of roadway that only need to be operated hands-on periodically. When was the last hurricane that hitFlorida? When is the last hurricane that hit Mississippi?When were the floods? When is the tornado? We have tobe able to respond operationally and ask, What roads areflooded right now? What roads are open? Where is thetraffic? How can we route it from here to there? That is ahuge sensing problem, but it is also a huge data manipu-lation problem, because we do not need to know howmany pictures we have. We have to know where the caris stuck, which roads are open, if that bridge is closedbecause it is flooded or if that bridge is closed or open,and if vehicles can be routed over there. That is a wonder-ful, difficult data-handling process.
The good news is that these researchers are heading inall the right directions. We now have small airplanes—UAVs—that can be launched on 15-min notice. A UAVcan be sent up there and used for real-time video sur-veillance in a flood situation. That is great! The nextstep: that plane has to fly in a hurricane. As I said, we havea ways to go, but the military is flying remote vehicles at65,000 ft continuously over Afghanistan right now. Thatcost is the wrong level of cost for us traffic operationsfolks, but cost is relative. What is the value of the lifeyou can save if you have to evacuate the Florida Pan-handle? We are not only talking about traffic operations;we are talking about national security and emergencymanagement, and that allows us to look to remote sens-ing. It has a very different scale than we, as traffic engi-neers, are used to. It is good for us, not only at the scaleof correctly taking care of those emergency and securityevents but also at the scale of enabling us to get to workon time on Monday.
28 REMOTE SENSING FOR TRANSPORTATION 2001
53864_TRB_p29_36 8/25/03 3:10 PM Page 28
SESSION 4
Infrastructure and EngineeringOverview of Remote Sensing Products and Results
Michael F. Goodchild, University of California, Santa BarbaraShauna Hallmark, Iowa State UniversityVal Noronha, University of California, Santa BarbaraJohn J. Conrad, Washington State Department of Transportation, Moderator
29
INFRASTRUCTURE AND ENGINEERING:CONSORTIUM PAPER PRESENTATION
Michael F. Goodchild,Shauna Hallmark, and Val Noronha
The National Consortium on Remote Sensing ofTransportation–Infrastructure (NCRST-I) ad-dresses a number of U.S. Department of Trans-
portation (USDOT) strategic goals—safety, mobility,economic growth, security, and organizational excellence.Over the last two decades, state DOTs have faced increas-ing demands for accountability in transportation infra-structure management, such as the Highway PerformanceMonitoring System and the Government AccountingStandards Board 34 (GASB-34). Remote sensing offersnew sources of data that were not available previously. Tobe most useful, data from remote sensors must be inte-grated with computer-aided design databases, current geo-graphic information system (GIS) data, traffic sensors andcameras, and current transportation needs and practicesas well as evolving information demands such as fromintelligent transportation systems (ITS). Security must alsobe taken into account.
Our approach to infrastructure recognizes three essen-tial components:
• The objective of infrastructure management, whichranges from operational tasks of maintenance to tacticaltasks of renewal and construction and strategic tasks ofplanning and design;
• The assets that are the focus of management, includ-ing pavement, bridges, pipelines, rail lines, harbors, andairports; and
• The information needed for management, recog-nizing in particular the aspects that are particularly wellserved by remote sensing, including information on loca-tion and on change through time.
If information technology is to be successful in practi-cal, everyday infrastructure management, it must be inte-grated and comprehensive, easy to use, and capable ofproviding answers to management questions rapidly. Alltoo often in the past remote sensing has delivered abun-dant data, but in forms that require extensive preprocess-ing and a high level of user skill. New technologies emerg-ing in the areas of digital libraries, search engines, and GISoffer much more appropriate solutions. NCRST-I’s ap-proach has been to explore everything that new technolo-gies offer and to develop products that come much closerto meeting the needs of the transportation community (seeFigure 1).
As the lead site of NCRST-I, the University of Califor-nia at Santa Barbara is also the home of the AlexandriaDigital Library, a leader in specialized applications of dig-ital library technology to geospatial data. Products thatintegrate GIS with digital library technology and searchengines are just beginning to appear in the GIS world. Inaddition, NCRST-I is actively developing another com-ponent of this integrated approach to remote sensingdata management: a comprehensive data model fortransportation applications. The data model, termedUNETRANS, is being developed with the help of addi-
53864_TRB_p37_46 8/25/03 3:09 PM Page 29

tional funding from the Environmental Systems ResearchInstitute (ESRI), a leading GIS vendor.
Consortium Research Projects
Road Feature Inventory
Many inventory data collection methods are used bytransportation agencies in the United States, but they areoften time-consuming and labor-intensive. With data re-quirements increasing, more efficient methods of datacollection are needed. A pilot study was conducted toevaluate the use of remotely sensed images for the col-lection of roadway inventory features. Images at resolu-tions of 2, 6, and 24 in. and 1 m were evaluated andcompared for the study area. Imagery was tested for po-sitional accuracy, the number of inventory features thatcould consistently be identified, distance measurements,and variation among users in correctly positioning featurelocation.
A root-mean-square (RMS) test was used to evaluatepositional accuracy with kinematic Global PositioningSystem (GPS) points (centimeter accuracy) for compari-son. The 2-, 6-, and 24-in. data sets met the accuracyrequirements for anchor points, according to the IowaDOT linear referencing system (LRS) specifications of ±1m RMS. The 1-m data set did not.
Even if there are standard procedures for identifica-tion of a feature and selection of its location, there can bedifferences among observers in locating the same point.Nine different features—signals, utility poles, drainagestructures, medians, pedestrian crossings, intersection cen-ters, railroad crossings, bridges, and driveways—with asample size of five or six elements were randomly selected
in a pilot study area. Observers familiar with ArcViewwere selected to identify and locate each set of features ineach data set. Only three of the nine features could visu-ally be identified in the 24-in. and 1-m images.
The utility of imagery was evaluated for creation ofanchor sections. Distance measurements from the photoswere compared with videolog van distance measuringinstrument (DMI) measurements. None of the photo-based measurements met the requirements for anchorsections in the Iowa DOT LRS. However, these require-ments are stringent, and financial constraints may requirethat standards be lowered.
In conclusion, although lower-resolution images aremore cost-effective, their usefulness is limited by theuser’s ability to see and identify inventory features. A sig-nificant number of features either could not be identifiedor could not be regularly identified in the 1-m and 24-in.data sets. Because the ability to consistently identify fea-tures decreases with lower resolution, images with atleast 6-in. resolution would be necessary for most in-ventory purposes. For collection of data elements for theLRS datum, 2- or 6-in. resolution would be feasible ifdatum accuracy standards were relaxed slightly.
Centerline Extraction—Manual and Automated
With GPS now a popular accessory in numerous systems,a need is emerging for a new generation of centerlinedatabases that are more detailed, accurate, up to date,and universal in coverage than the current products (seeFigure 2). In August 2001 a gathering of internationalexperts on centerlines was hosted by NCRST-I. Whatemerged in parallel with a wide variety of approaches—pavement signatures, edge detection, GPS, and futuristicITS scenarios—was that centerlines fulfill such a varietyof roles, with accuracy demands from centimeters to
30 REMOTE SENSING FOR TRANSPORTATION 2001
Sensor
Image ProcessingDecision/Solution
Problem
Data Integration Data Management
Needs analysis Sensor technology
Image-processing techniques
Data modeling, organization,communications
Process models
Education and outreach
FIGURE 1 Remote sensing in the context of transportationinformation requirements.
53864_TRB_p37_46 8/25/03 3:09 PM Page 30
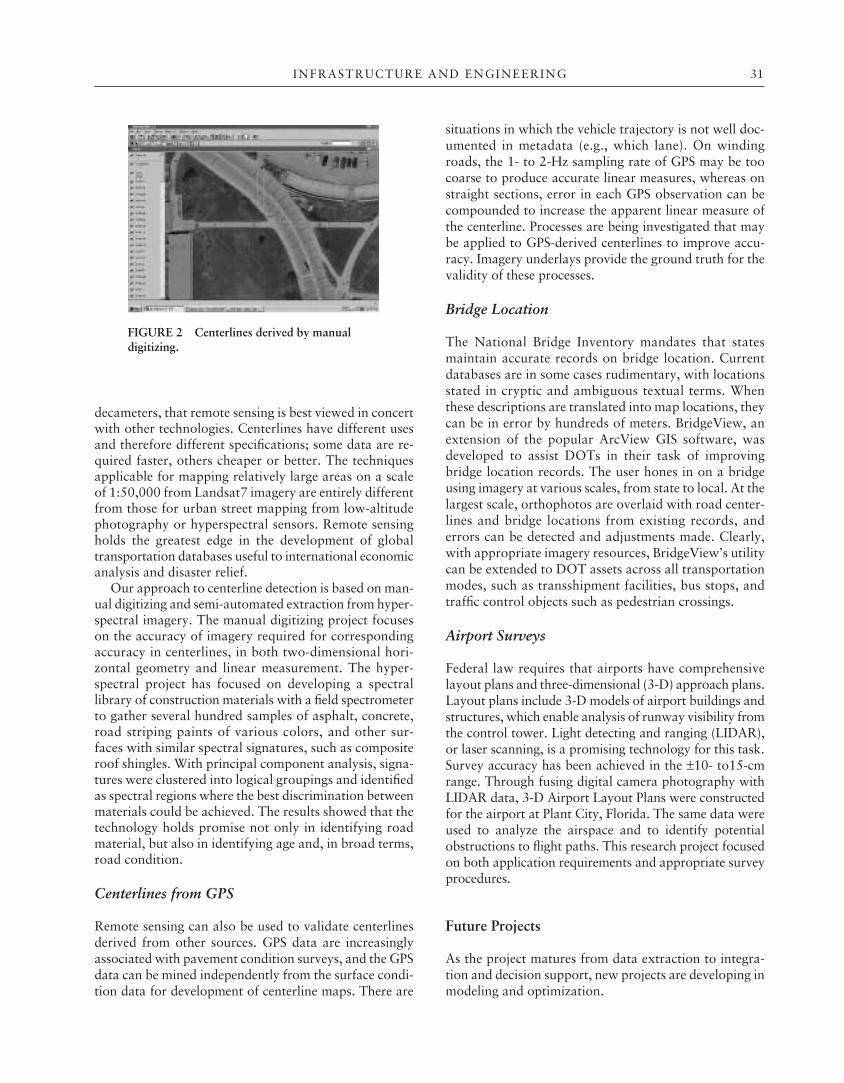
decameters, that remote sensing is best viewed in concertwith other technologies. Centerlines have different usesand therefore different specifications; some data are re-quired faster, others cheaper or better. The techniquesapplicable for mapping relatively large areas on a scaleof 1:50,000 from Landsat7 imagery are entirely differentfrom those for urban street mapping from low-altitudephotography or hyperspectral sensors. Remote sensingholds the greatest edge in the development of globaltransportation databases useful to international economicanalysis and disaster relief.
Our approach to centerline detection is based on man-ual digitizing and semi-automated extraction from hyper-spectral imagery. The manual digitizing project focuseson the accuracy of imagery required for correspondingaccuracy in centerlines, in both two-dimensional hori-zontal geometry and linear measurement. The hyper-spectral project has focused on developing a spectrallibrary of construction materials with a field spectrometerto gather several hundred samples of asphalt, concrete,road striping paints of various colors, and other sur-faces with similar spectral signatures, such as compositeroof shingles. With principal component analysis, signa-tures were clustered into logical groupings and identifiedas spectral regions where the best discrimination betweenmaterials could be achieved. The results showed that thetechnology holds promise not only in identifying roadmaterial, but also in identifying age and, in broad terms,road condition.
Centerlines from GPS
Remote sensing can also be used to validate centerlinesderived from other sources. GPS data are increasinglyassociated with pavement condition surveys, and the GPSdata can be mined independently from the surface condi-tion data for development of centerline maps. There are
situations in which the vehicle trajectory is not well doc-umented in metadata (e.g., which lane). On windingroads, the 1- to 2-Hz sampling rate of GPS may be toocoarse to produce accurate linear measures, whereas onstraight sections, error in each GPS observation can becompounded to increase the apparent linear measure ofthe centerline. Processes are being investigated that maybe applied to GPS-derived centerlines to improve accu-racy. Imagery underlays provide the ground truth for thevalidity of these processes.
Bridge Location
The National Bridge Inventory mandates that statesmaintain accurate records on bridge location. Currentdatabases are in some cases rudimentary, with locationsstated in cryptic and ambiguous textual terms. Whenthese descriptions are translated into map locations, theycan be in error by hundreds of meters. BridgeView, anextension of the popular ArcView GIS software, wasdeveloped to assist DOTs in their task of improvingbridge location records. The user hones in on a bridgeusing imagery at various scales, from state to local. At thelargest scale, orthophotos are overlaid with road center-lines and bridge locations from existing records, anderrors can be detected and adjustments made. Clearly,with appropriate imagery resources, BridgeView’s utilitycan be extended to DOT assets across all transportationmodes, such as transshipment facilities, bus stops, andtraffic control objects such as pedestrian crossings.
Airport Surveys
Federal law requires that airports have comprehensivelayout plans and three-dimensional (3-D) approach plans.Layout plans include 3-D models of airport buildings andstructures, which enable analysis of runway visibility fromthe control tower. Light detecting and ranging (LIDAR),or laser scanning, is a promising technology for this task.Survey accuracy has been achieved in the ±10- to15-cmrange. Through fusing digital camera photography withLIDAR data, 3-D Airport Layout Plans were constructedfor the airport at Plant City, Florida. The same data wereused to analyze the airspace and to identify potentialobstructions to flight paths. This research project focusedon both application requirements and appropriate surveyprocedures.
Future Projects
As the project matures from data extraction to integra-tion and decision support, new projects are developing inmodeling and optimization.
INFRASTRUCTURE AND ENGINEERING 31
FIGURE 2 Centerlines derived by manualdigitizing.
53864_TRB_p37_46 8/25/03 3:09 PM Page 31

Corridor Location
Decisions on priorities for new infrastructure projectsand alignment of new transport corridors involve manystakeholders with competing interests. It is critical thatthe right information inputs be identified and be madeavailable to all interested parties and decision makersand that appropriate analytical and modeling tools bedeployed. A new project, by the National Aeronautics andSpace Administration’s Stennis Space Center in the UnitedStates and the Commonwealth Scientific and IndustrialResearch Institute–Quantm in Australia, is being devel-oped in this area, building on previous work and products.
Communications Infrastructure
New towers for radio, cellular, and ITS-related commu-nications need to be placed to maximize coverage for agiven budget, and placement must be sensitive to envi-ronmental concerns. A new project is using data derivedfrom remote sensing to determine optimal sites.
Infrastructure Security
Hazards and safety issues have been an area of interestin the NCRST-I consortium, particularly appropriate de-sign of infrastructure to ensure traveler safety, physicalsecurity of the infrastructure, and postevent survey ofdamage. The University of Florida was involved in laserscanning from aerial and ground platforms of the WorldTrade Center and Pentagon in the aftermath of the dis-asters of September 11, 2001. A number of other projectsare being developed by consortium members in this area.
Consortium Outreach
The consortium has several outreach activities underway. A growing set of resources on the web includesglossaries of technical terms in transportation, GIS forTransportation (GIS-T), and remote sensing, and an ex-tensive bibliography with about 700 entries. In workbeing done in conjunction with the National Center forGeographic Information and Analysis’ core curriculumin GIScience and the Remote Sensing Core Curriculum,a curriculum is being built on GIS-T and Remote Sensingfor Transportation (RS-T). Regional meetings are beingorganized with state DOTs and local government agen-cies to promote remote sensing technology, offer techni-cal advice, and facilitate local initiatives.
Technology Application Projects
Two technology application project partners—OrbitalImaging Corporation (ORBIMAGE) and Tetra Tech Inc.—
are nearing completion of their projects. Two others,Florida DOT and the University of Massachusetts, arebeginning.
Orbital Imaging Corporation
Orbital Imaging in Dulles, Virginia, and its partners, Par-sons Brinckerhoff and Bentley Systems, are in the finalstages of an agreement with USDOT to investigate anddemonstrate the application of remotely sensed data toplanning projects involving five transportation types:roads, railroads, airports, water ports, and transmissionsystems. The project’s application of road data will beinteractive with Bentley’s MicroStation software. Thedemonstration will incorporate various forms of imageryand GIS data, with emphasis on nearly automated tech-niques for the delivery of remotely sensed digital imageryto desktops and software environments of transportationprofessionals. High-resolution imagery containing impor-tant land features will be used in demonstrating a num-ber of effective applications for regional transportationplanning. Northern Virginia is the geographic focus forthis project in cooperation with the Virginia DOT. Muchaerial, satellite, and ground-based imagery, accurate roadcenterline vectors, and other GIS data already exist forthis area. By utilizing these resources, the project teamwill focus on tailoring software applications and inter-acting with transportation planners in technical exchangemeetings and demonstrations.
With the project’s nearing completion, the team hasfocused application efforts of the transaction agreement onthe Virginia DOT Route 1 Location Study (see Figure 3).With ArcView parcel data shape files combined withblack-and-white and 24-bit color digital orthorectified
32 REMOTE SENSING FOR TRANSPORTATION 2001
FIGURE 3 Northern Virginia’s US-1 project plan with digital1-ft resolution orthophoto and ArcView Fairfax County parcelinformation. The instant imagery access button is shown.
53864_TRB_p37_46 8/25/03 3:09 PM Page 32

images, the team is demonstrating the ability to quicklyobtain remote-sensed data from geographically diverseserver locations, integrate these data with infrastructureand demographic data, and display them at the user’s desk-top. Vector data coordinates are automatically matchedto underlying imagery; relevant imagery is autoselectedfrom the remote server based on the defined coordinatebox. Implementation will initially serve Bentley’s Micro-Station software environments. This image server andsoftware architecture eliminate on-site storage of massiveimage data libraries by removing image bank mainte-nance responsibilities from regional DOT or contractorpersonnel and by matching the location and resolutionof accessible images to the vector map display view.
Remaining milestones include demonstration of theagreement’s achievements to USDOT, the Virginia DOT,and selected contractors; presentations at numerous trans-portation infrastructure conferences and symposiums; andobtaining feedback from the presentations on the prod-uct’s utility. Ultimately, an implementation plan and blue-print for future actions will be generated to help guidelocal, state, and federal initiatives.
Tetra Tech Inc.
The project’s focus is to develop remote sensing tools foranalysis of federal intermodal connectors to the federalhighway system. An intermodal connector is a major ar-terial on which trucks move from intermodal facilitiessuch as railroad yards to the highway system. The testlocale for this program is the Alameda Corridor area ofsouthern Los Angeles County. The Alameda Corridor isa $2.8 billion freight rail system that connects the portsof Los Angeles and Long Beach, collectively the largestport complex in the United States, with the interconti-nental rail system.
The project is analyzing two intermodal connectors.This first is Sepulveda Boulevard linking the port of LosAngeles’ Intermodal Container Transfer Facility to the710 Freeway. The 710 Freeway, in turn, links the portswith the regional highway system. The second is Wash-ington Boulevard, which is part of a four-arterial (withAtlantic, Bandini, and Sheila Streets) intermodal connec-tor that links Union Pacific and the Burlington NorthernSanta Fe’s rail facilities to the 710 Freeway.
The analysis is overseen by Tetra Tech, Inc., a nation-wide infrastructure, environmental, and telecommunica-tions firm based in Pasadena, California. The primarytechnical work is being conducted at Pasadena’s Jet Pro-pulsion Laboratory (JPL) and is supported by a multi-disciplinary team of private firms, nonprofit researchorganizations, and local universities. The team is assess-ing the application of multiple remote sensing imagerytypes, including data from IKONOS, Landsat, andAVIRIS, to determine the images’ value and their ability
to be combined for greater analytical utility. To opti-mize their resolution, these data types are being refinedwith specialized enhancement techniques by the JPL. Thedata are being cross-referenced with digital orthopho-tography (provided by HJW GeoSpatial and CaliforniaState University’s remote sensing department) and thenbeing integrated with an ESRI GIS platform.
Nationally available transportation and census data-bases will be integrated into these data to create analyticaltools with national applications. As it is being accom-plished, the work is being assessed by a team of indus-try experts led by the North American Foreign TradeAssociation (NAFTA) Corridor Institute and AmericanTransportation Management, who will apply the tools toindustry-specific needs. These applications include
• Planning of real estate along the intermodal con-nectors for expansion and optimization of goods move-ment through the intermodal connectors;
• Identification of trucks operating on surface streetsin areas surrounding the intermodal connector studyareas; and
• Identification of container depots in the neighbor-hood of intermodal connectors.
The tools will then be applied to public needs throughUSDOT, state transportation agencies, metropolitanplanning organizations, and the national offices of TetraTech, to further refine them for national use.
Florida Department of Transportation
The Florida DOT Transportation Statistics Office and itsproject partners, the Oak Ridge National Laboratory,Southern Resources Mapping of Miami, and TRANS-MAP of Ohio, are teaming up on the USDOT’s Re-search and Special Projects Administration project, en-titled Highway Feature and Characteristics DatabaseDevelopment Using Commercial Remote Sensing Tech-nologies, Combined with Mobile Mapping, GIS, andGPS. The major objective of this effort is to determinethe feasibility of using commercial remote sensing tech-nologies, combined with GIS, mobile mapping, and GPS,to develop accurate and comprehensive databases ofroadway features and characteristics for infrastructuremanagement.
The project will first use remotely sensed data—specifically, airborne and satellite high-resolution images—to extract highway networks (centerlines, edges, andmedians); measure highway width and length; count traf-fic lanes; identify pavement types and road conditions;and obtain 3-D representation of highway systems. Theproject will also fuse remotely sensed data with commer-cial mobile mapping capabilities to map detailed roadwayfeatures and characteristics such as traffic signs, traffic
INFRASTRUCTURE AND ENGINEERING 33
53864_TRB_p37_46 8/25/03 3:09 PM Page 33
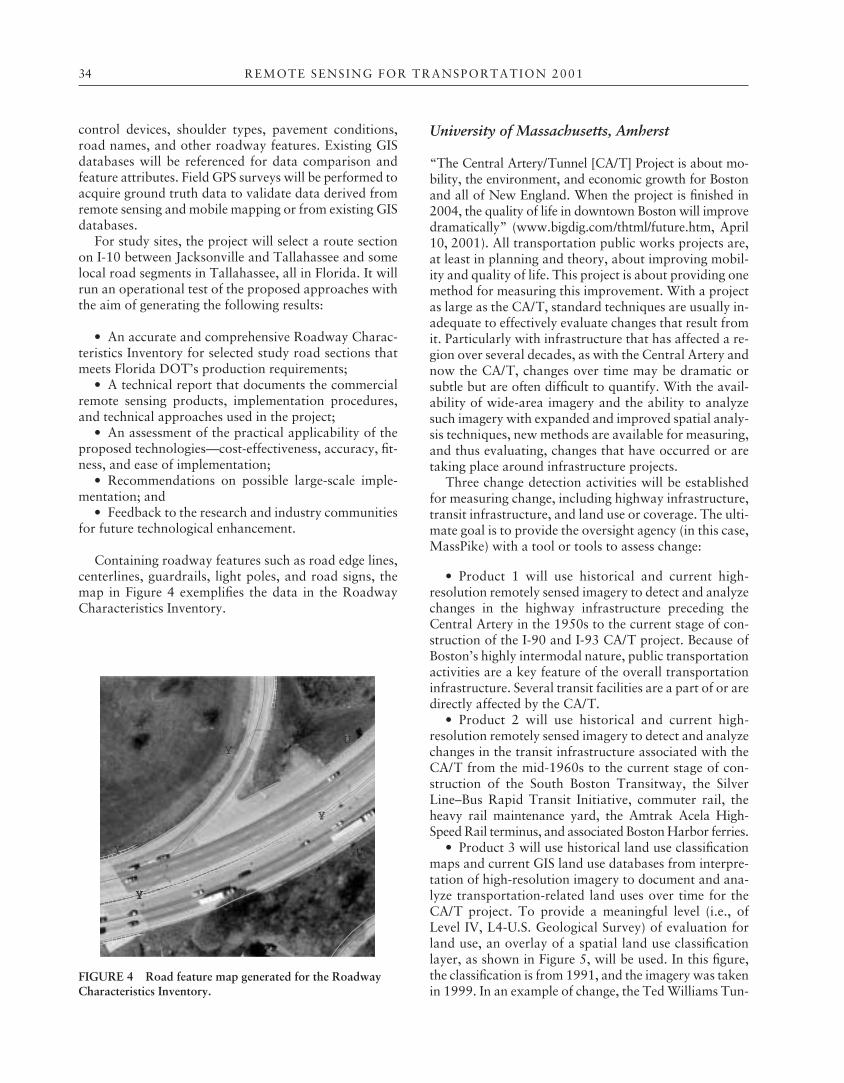
control devices, shoulder types, pavement conditions,road names, and other roadway features. Existing GISdatabases will be referenced for data comparison andfeature attributes. Field GPS surveys will be performed toacquire ground truth data to validate data derived fromremote sensing and mobile mapping or from existing GISdatabases.
For study sites, the project will select a route sectionon I-10 between Jacksonville and Tallahassee and somelocal road segments in Tallahassee, all in Florida. It willrun an operational test of the proposed approaches withthe aim of generating the following results:
• An accurate and comprehensive Roadway Charac-teristics Inventory for selected study road sections thatmeets Florida DOT’s production requirements;
• A technical report that documents the commercialremote sensing products, implementation procedures,and technical approaches used in the project;
• An assessment of the practical applicability of theproposed technologies—cost-effectiveness, accuracy, fit-ness, and ease of implementation;
• Recommendations on possible large-scale imple-mentation; and
• Feedback to the research and industry communitiesfor future technological enhancement.
Containing roadway features such as road edge lines,centerlines, guardrails, light poles, and road signs, themap in Figure 4 exemplifies the data in the RoadwayCharacteristics Inventory.
University of Massachusetts, Amherst
“The Central Artery/Tunnel [CA/T] Project is about mo-bility, the environment, and economic growth for Bostonand all of New England. When the project is finished in2004, the quality of life in downtown Boston will improvedramatically” (www.bigdig.com/thtml/future.htm, April10, 2001). All transportation public works projects are,at least in planning and theory, about improving mobil-ity and quality of life. This project is about providing onemethod for measuring this improvement. With a projectas large as the CA/T, standard techniques are usually in-adequate to effectively evaluate changes that result fromit. Particularly with infrastructure that has affected a re-gion over several decades, as with the Central Artery andnow the CA/T, changes over time may be dramatic orsubtle but are often difficult to quantify. With the avail-ability of wide-area imagery and the ability to analyzesuch imagery with expanded and improved spatial analy-sis techniques, new methods are available for measuring,and thus evaluating, changes that have occurred or aretaking place around infrastructure projects.
Three change detection activities will be establishedfor measuring change, including highway infrastructure,transit infrastructure, and land use or coverage. The ulti-mate goal is to provide the oversight agency (in this case,MassPike) with a tool or tools to assess change:
• Product 1 will use historical and current high-resolution remotely sensed imagery to detect and analyzechanges in the highway infrastructure preceding theCentral Artery in the 1950s to the current stage of con-struction of the I-90 and I-93 CA/T project. Because ofBoston’s highly intermodal nature, public transportationactivities are a key feature of the overall transportationinfrastructure. Several transit facilities are a part of or aredirectly affected by the CA/T.
• Product 2 will use historical and current high-resolution remotely sensed imagery to detect and analyzechanges in the transit infrastructure associated with theCA/T from the mid-1960s to the current stage of con-struction of the South Boston Transitway, the SilverLine–Bus Rapid Transit Initiative, commuter rail, theheavy rail maintenance yard, the Amtrak Acela High-Speed Rail terminus, and associated Boston Harbor ferries.
• Product 3 will use historical land use classificationmaps and current GIS land use databases from interpre-tation of high-resolution imagery to document and ana-lyze transportation-related land uses over time for theCA/T project. To provide a meaningful level (i.e., ofLevel IV, L4-U.S. Geological Survey) of evaluation forland use, an overlay of a spatial land use classificationlayer, as shown in Figure 5, will be used. In this figure,the classification is from 1991, and the imagery was takenin 1999. In an example of change, the Ted Williams Tun-
34 REMOTE SENSING FOR TRANSPORTATION 2001
#Y%U
#Y#Y
#Y
#Y
FIGURE 4 Road feature map generated for the RoadwayCharacteristics Inventory.
53864_TRB_p37_46 8/25/03 3:09 PM Page 34

nel entrance was classified as urban open and is now con-sidered a transportation facility.
Concluding Remarks
The management of transportation assets requires fastand easy access to appropriate data, particularly data onlocation and change. Remote sensing is an excellentsource of such data, and several NCRST-I projects havedemonstrated the role that imagery can play in thisregard. However, all too often demonstrations of capa-bility fail to lead to actual implementation. We believethat implementation requires more than a basic demon-stration of capability; it also requires
• Ready access to tools that implement solutions ineasy-to-use packages; and
• Tools that address all stages of dissemination ofremotely sensed data, including data models, digitallibraries, and search engines that are fully integrated withapplications.
Many of these tools will be demonstrated at this con-ference, and many more are under development and will
be made available in due course through the NCRST-Iwebsite.
MODERATOR SUMMARY
John J. Conrad
Iam Assistant Secretary for Engineering and RegionalOperations with the Washington State Departmentof Transportation (WSDOT). My job here is to pro-
vide observations on the current state of remote sensingapplications for transportation infrastructure and engi-neering and on future contributions that these tech-nologies could make.
I wasn’t here last year, so I am a fresh observer and afresh participant. I want to take a step back and put alarger context around this from the standpoint of a DOT.It will be that of WSDOT, but I think our experiences arevery similar to those of DOTs all across the country in theface of the changing dynamics in the world we are in-volved in.
First, DOTs have a high turnover of their chief ad-ministrative officers. We have just turned over, in our
INFRASTRUCTURE AND ENGINEERING 35
FIGURE 5 Land use classification in the vicinity of the Boston Central/Artery Tunnel Project.
53864_TRB_p37_46 8/25/03 3:09 PM Page 35

department, from one person that was there for 8 years,but the average lifespan of the head of a DOT now issomewhere between 2 and 3 years. So, there is almost acontinual upheaval in DOTs across the country as theyexperience new leadership, and new leadership bringsnew ideas and new ways of doing business. That certainlyis what we are undergoing right now at WSDOT with avery dynamic leader with lots of new ideas and lots ofinvolvement in the department’s detailed operations.
We are operating in an environment in which peopleexpect us to be more efficient. All of our customers andthe taxpayers have very high expectations of us. The for-tunate thing is that we have a product that everybodywants, so we are in demand. However, we are also playingin a market in which our revenues are relatively stagnantor, in many cases, shrinking. We are operating systemsthat are mature and are aging, and in fact, we are nowback to the stage of having to rehabilitate many of theparts of our transportation system that were constructedback in the 1950s, 1960s, and even in the 1970s. We arenot constructing a whole lot of new facilities these days,but many of us have high hopes, as you saw in ElizabethLanzer’s presentation this morning on the 405 Corridor(see pages 19 and 78).
No matter the dynamics that we’re operating in, weare still in a world where we are planning, designing,building, maintaining, and operating transportation facil-ities. You can combine the planning and the design as apart of the build, or at least for my purposes here, but weexpect to do it in a fashion that treads lightly on the envi-ronment or enhances the environment to make up forsome of the sins of our ancestors. When I say “some ofthe sins of our ancestors,” we can talk about things thatwere done when the system was first built. In the case ofthe endangered species listing of the salmon stocks in thestate of Washington, we are going back 150 years to seegenerations of actions that have led us to where we aretoday. The things we do as part of our transportationprojects are very small, incremental measures that helpwith the endangered species listing. We are certainly notgoing to be able to easily overcome 150 years of mankind’sefforts to get rid of that species.
I hope, as I lay that context out, that you can begin tosee how some of the presentations today fit in with thosechallenges that we are faced with. One of these, as justmentioned by Shauna Hallmark, is that we need to findways to absolutely keep our staff off the road as much aspossible. For the purposes of work zone safety, whetherit be for a construction project, a maintenance project, orpeople out there doing data collection, any way thatreduces exposure is great.
From the building standpoint, our challenge is to do iton time and on budget. The project development processtakes years and years, and we are looking for ways ofenvironmental streamlining. We are looking for ways to
do context-sensitive design—to come up with facilitiesthat fit better into the communities in which they arelocated. We are also looking for ways to enhance the en-vironment as a part of our work.
Maintaining and preserving our system are a hugechallenge, because of the system’s age. Val Noronha hastalked about bridges and pavements, and I’m strugglinga bit there. For example, with pavements and bridges, wehave extensive management systems for both of thoseparts of our infrastructure. For pavements, we are outthere every year. We are not concerned particularly aboutthe age of the pavement, as much as we are concernedwith its condition. We are looking at things such as Whatis cracking? How smooth is the pavement? Is it rutted?How long has it been lasting? We then use that informa-tion to program when we are going to replace thosepavements.
On the bridge side, we have our own series of acro-nyms, and a couple weeks ago I went out with our bridgepreservation crew and took a ride in the UBIT. UBIT isan under-bridge inspection truck. We have people outthere on a continuing basis, crawling under, through,and around our bridges, assessing their condition. I haveto admit that I snickered a bit when I learned that one ofthese projects was to tie down where our bridges reallyare, and, lo and behold, I found out that in some cases,our bridges are just like the ones shown in that slide—they are about 50 ft from where we thought they were.So we need to take that a little more seriously than I orig-inally thought. But we do have extensive inventories inmanagement systems, and we are looking for ways tofeed those inventories and those management systems ina less expensive and more efficient way.
Intermodal connections are another big issue we dealwith in Washington with the ports of Seattle and Tacoma,and this includes the connectivity between the ports andthe highway system and between the ports and the railsystem, and how the rail system and highway system inter-relate.
A new concern that we did not pay much attention tountil September 11th, although we had our issues fromtime to time, is security and vulnerability assessments ofour facilities. It is something we are all just scratching thesurface of now, trying to figure out what it is that weneed to do and how to do it. Perhaps there is an applica-tion for remote sensing as a part of that.
In the future, I guess we are looking for ways to dothings that we have not thought about. I can’t tell youwhat they are, because I haven’t thought about them.Most of what we looked at today is finding differentways to do what we are doing right now. I think we needto be a little more visionary in our thinking in the yearsahead.
I think technology transfer and delivery mechanismsare going to be a big issue as we move ahead with this
36 REMOTE SENSING FOR TRANSPORTATION 2001
53864_TRB_p37_46 8/25/03 3:09 PM Page 36

technology. I will save my comments there, and I think itis more appropriate to talk about it in the wrap-up session.
I am giving you the perspective from a DOT, but weare not the only transportation agency or agencies thathave transportation facilities out there, and I think localagencies in cities and counties are big customers as well.
In listening to the presentations, I liked the approachof trying to compare existing processes and measure thedifferences in cost, cost-effectiveness, life-cycle costs, andso on. Perhaps the biggest challenge is going to be, in theold gambler movie lingo, knowing when to hold themand when to fold them. I think that will be a challengefor several of these technologies: at what point do youdecide “Yes, this is good, and let’s go with it,” or keepgoing with it, or “No, this isn’t going to work, and weshould let go and move on to something else”?
Common specifications will be crucial. This is an issuethat DOTs have been dealing with for several years inrelation to ITS, as we try to have a common frameworkor a common specification for what is being developed.It is very difficult to implement a technology without acommon specification.
One important thing that was not specifically broughtout in the presentations, but was discussed in the write-up on infrastructure, is organizing regional meetingswith DOTs and local agencies to help promote remotesensing technology and seek to provide technical adviceand facilitate local initiatives. I cannot stress enough theimportance of maintaining that contact with all the usersor as many users as you can and making sure they areonboard and giving you that reality check as you moveahead with these projects.
INFRASTRUCTURE AND ENGINEERING 37
53864_TRB_p37_46 8/25/03 3:09 PM Page 37

53864_TRB_p37_46 8/25/03 3:09 PM Page 38

SESSION 5
Transportation Lifelines and HazardsOverview of Remote Sensing Products and Results
Stanley A. Morain, University of New MexicoWalter H. Kraft, PB Farradyne Inc., Moderator
39
SAFETY, HAZARDS, AND DISASTER ASSESSMENT:CONSORTIUM PAPER PRESENTATION
Stanley A. Morain
In 2000 the U.S. Department of Transportation(USDOT) and the National Aeronautics and Space Ad-ministration (NASA) inaugurated a new joint program
titled the National Consortium for Remote Sensing inTransportation (NCRST). Four university consortia wereestablished in the United States to focus on specific sectorsof transportation-related issues. The consortium describedhere—NCRST–Hazards (NCRST-H)—focuses on trans-portation safety, hazards, and disaster assessments. Itconsists of the University of New Mexico’s Earth DataAnalysis Center (EDAC); the University of Utah Geog-raphy Department’s Center for Natural and Techno-logical Hazards (CNTH) and its Digitally IntegratedGeographic Information Technologies (DIGIT) Lab;George Washington University’s Space Policy Institute(SPI); Oak Ridge National Laboratory’s (ORNL’s) Centerfor Transportation Analysis (CTA); and the Universityof Calgary’s Department of Geomatics Engineering. Thereare also three commercial partners. Two are engaged inpipeline leak detection and hazards assessment: Aeris, Inc.,and DigitalGlobe (formerly, EarthWatch, Inc.). The third,ImageCat Inc., is engaged in earthquake damage assess-ments with synthetic aperture radar (SAR) imagery.
NCRST-H Focus Definitions
Transportation safety, hazards, and disaster assessmentembrace topics that are not as intuitive as the subject mat-
ters for the other consortia. NCRST-H’s interests focus onassessing the lifelines themselves and their corridor align-ments, not so much on what travels along them. Theselifelines include roads of all classes, railroads, bridges, air-ports, pipelines, coastal and inland waterways, marinefacilities, and intermodal facilities.
Assessments for safety, in this context, refer to fail-ures in pipelines and bridges, road washouts, track mis-alignments, waterway morphology, airport runway andglide-slope obstructions, road subsidence, and intermodaldisruptions; however, they do not refer to passenger safetyas related to, say, safety belts or tire safety (see Figure 1).The chief criterion is whether the phenomenon can beremotely sensed. Interest is centered on aerial and satel-lite imaging, light detection and ranging (LIDAR), radar,interferometric SAR (IFSAR), and hyperspectral sensing.Where possible, there is a need to integrate in situ sensorsand related data sets into intelligent transportation sys-tems (ITS).
Hazards refer to
• All safety issues caused by natural means, such asfloods, fire, land subsidence, and avalanches;
• Technical hazards such as those associated withwaste transport and pipeline failures that may requireevacuation or emergency relief; and
• Terrorist actions that disrupt any mode of commontransportation.
Here, again, the chief criterion is our ability to providetimely imagery, maps, and sensor data for planning andmitigation—as was the case for the Cerro Grande fire inLos Alamos, New Mexico.
53864_TRB_p47_54 8/25/03 3:10 PM Page 39

Disasters refer more to “acts of God,” as they arereferred to in the insurance business. Thanks to NASAand the National Oceanographic and AtmosphericAdministration, remote sensing technology is advancingour ability to forecast disastrous events and thus improv-ing the public’s avoidance and mitigation responses.Such events include network disruptions caused by hur-ricanes, floods, tornados, volcanoes, fires, dust storms,and earthquakes. NCRST-H is not involved with pre-dicting or forecasting these events per se, because that isthe job of the weather and geophysical sciences; rather,it is interested in the transportation consequences arisingfrom these events. For example, ImageCat, Inc. is devel-oping a SAR-based interpretation system for assessingthe damage to lifeline infrastructures resulting from thesenatural phenomena.
The disastrous events of September 11th have chis-eled indelible new instructions for NCRST-H that willbe pursued in its third year of operation. GI-Science cancontribute to homeland security, but there are manychallenges that must be considered and articulated.However, if ways and means can be identified for usingremote sensing and geospatial technologies for assessingand mitigating terrorist acts, it will improve substan-tially the near-real-time information extraction capabil-ities required by other, more predictable events.
Consortium Tasks
Tasks in the first and second years of consortium opera-tion have considered these broader definitions, whilefocusing attention on specific applications research. Theconsortium’s ORNL members at CTA have focused onperfecting an image-based automatic road extraction tech-nique and on testing their evacuation modeling system.
The University of Utah CNTH and DIGITLab have beencreating a transportation lifeline database for Salt LakeCity focused on avalanche hazards. They have also beendeveloping hyperspectral data applications to assess roadcomposition and condition and IFSAR applications forroad subsidence. The University of Calgary is a recentaddition to the consortium and is focusing its initial acti-vities on pipeline monitoring with LIDAR sensors. TheSPI at George Washington University has assembled abibliography of remote sensing for safety, hazards, anddisaster assessments and developed a technique for assess-ing hazardous rural road segments from imagery. TheUniversity of New Mexico’s EDAC has been assessinghigh-resolution satellite imagery for Enhanced 911 (E911)updates and, on behalf of the consortium, has also inau-gurated an airport glide-slope safety initiative involvingthree commercial partners and the city of Santa Barbara,California. It is also developing an application that inte-grates satellite remote sensing data with geographicinformation system (GIS) road networks and merged,real-time Doppler radar weather data to identify haz-ardous conditions on unpaved rural roads.
The consortium, overall, has been actively developingapplication briefs, technology notes, and cookbooks (ondisplay at this conference) and since last summer hasundertaken several international activities to extend out-reach and technology transfer in Germany and China.
Technology Application Partners
Two of the technology demonstration contractors arefocused on oil and gas pipeline monitoring and spill reme-diation. The Aeris team consists of Aeris, Inc.; SystemPlanning Corporation; Summit Helicopters; and SAIC.The DigitalGlobe team consists of DigitalGlobe; Pacific
40 REMOTE SENSING FOR TRANSPORTATION 2001
FIGURE 1 Subsidence and flooding are typical hazards for transportation life-lines, as shown by this composite of photographs.
53864_TRB_p47_54 8/25/03 3:10 PM Page 40

Gas & Electric; Lawrence Livermore National Labora-tory, and Chevron.
The Aeris team’s objectives are
• Collecting airborne ground penetrating radar (GPR)data of a simulated pipeline failure by means of a multi-frequency, dual-polarized radar system with differentviewing geometries and distances (see Figure 2);
• Improving large-area detection using GPR;• Assessing early detection of pipeline leaks;• Supporting optimization routing for new pipelines;
and• Assessing hyperspectral sensor capabilities.
DigitalGlobe’s objectives are
• Interpreting and adapting IFSAR deformation map-ping as input to risk analysis modeling;
• Interpreting and adapting high-resolution satelliteenvironment maps;
• Determining reliability of IFSAR digital elevationmodels (DEMs) and resulting deformation maps;
• Validating multispectral environmental impact maps;and
• Automating and customizing interferometry pro-cessing.
Status of Consortium Tasks
Automatic Road Extraction
For road extraction, conventional techniques are labor-intensive and expensive. Automated techniques offer timeand cost savings and greater reliability. The consortium’sapproach uses a pattern recognition algorithm thatemploys image attributes such as intensity, changes ofintensity, texture, and neighborhood connectivity. Theseare used to define a road model. Potential roads areextracted by matching the model with the image (see Fig-ure 3). A feature network is established to group road seg-
ments into a hypothetical road network. By comparingthe characteristics of this network with the trained roadmodel, valid candidates are identified.
Evacuation Modeling
The evacuation modeling team is perfecting the inputdata sets required to interface the Oak Ridge EvacuationModel (OREMS) with ARC/Info. So far, model runs forthe Sequoya Nuclear Power Station in Hamilton County,Tennessee, have verified the model’s robustness and haverevealed the relative importance of parameter inputs. Inone case, where a road was out of service during anemergency, nighttime evacuation of 95% of the peopletook 3.2 h (Figure 4a). In a second case (Figure 4b), themodel changed the direction of traffic flow along a keyartery to expedite evacuation to achieve a 95% evacua-tion in less than 3 h.
Trafficability on Rural Roads
The trafficability task assesses the role of imagery inidentifying hazardous road segments on unpaved roadsin remote areas. This is an important task with numer-ous applications in both the military and civilian envi-ronments, but before they can be considered useful andreliable, the image data must be registered geospatiallywith associated geophysical data. Soil, topography, andgeology have been merged with aerial photography todelineate road nets at Hopi, Arizona, and in McKinleyCounty, New Mexico. The road network has been super-imposed, and the output looks promising for planningand road maintenance. Road segments have been identi-fied with high potential risk during inclement weather.The next steps are to verify and validate the results andto develop a user guide describing procedures, costs andbenefits, and future technologies.
TRANSPORTATION LIFELINES AND HAZARDS 41
FIGURE 2 Helicopter-mounted GPR for assessing pipelineleaks.
FIGURE 3 Automatic road extraction by means of imageattributes and neighborhood connectivity.
53864_TRB_p47_54 8/25/03 3:10 PM Page 41

Searchable Remote Sensing Database
For the searchable database, citations and abstracts havebeen captured for more than 1,800 English languageitems that link remote sensing and GIS technologies tothe general categories of safety, hazards, and disaster as-sessment. Only a small number of these references relateto transportation, but the database represents a tool thatcan be shared for practical applications and for assessingremote sensing methods. The next steps in this task areto review the database for those citations that relatespecifically to remote sensing transportation issues andto organize relevant entries by sensor type and applicationto develop technology assessments. Preliminary work byAeris, Inc., indicates that road surfaces exhibit spectraldifferences related to paving material and condition (seeFigure 5). The meaning of these differences will be as-sessed in the context of road maintenance.
Lifeline Vulnerability
The goal in the lifeline hazard task is to assess advancedremote sensing data sets as inputs to changing transporta-tion vulnerabilities. These vulnerabilities can relate to thelifeline itself or to regions through which the lifeline passes(e.g., canyons prone to avalanches or slowly changingconditions along the corridor). For avalanches, the con-ceptual and mathematical frameworks have been devel-oped, and an application brief has been prepared (see Fig-ure 6). With ARC/Info, a prototype spatial database hasbeen built for the Salt Lake City area that includes majorroads, rail, pipelines, and transmission lines. Hyperspec-tral analysis of road surfaces has been initiated. The meth-ods should next be applied to actual hazards in the SaltLake City area. More hazard maps need to be incorpo-rated into the lifeline database so the database can be usedto model threats to transportation lifelines. A user guideand workshop materials for IFSAR, hyperspectral, andhigh-resolution imagery are being developed.
42 REMOTE SENSING FOR TRANSPORTATION 2001
(b)(a)
FIGURE 4 Two modeled scenarios for the Oak Ridge EvacuationModel: (a) road closure scenario evacuated 50% of the population in1 h, 75% in 1.8 h, and 95% in 3.2 h; (b) road reversal scenario evac-uated 50% in 1 h, 75% in 1.75 h, and 95% in 2.8 h.
(a) (b)
FIGURE 5 Comparison of (a) hyperspectral characterizationof road surfaces with their (b) monospectral (panchromatic)appearance. Colors in the original image show differentpaving materials and surface conditions that can affect roadsafety. (Courtesy of Aeris, Inc.)
FIGURE 6 PG&E pipeline showing encroachment of neigh-borhoods inside the 1-km buffer.
53864_TRB_p47_54 8/25/03 3:10 PM Page 42

Lifeline Subsidence
Work with ERS-1 and -2 satellite data, TOPSAR, andAirSAR is under way for measuring the impact of groundsubsidence on roads, bridges, railroads, and pipelines.The goal for evaluating IFSAR is to produce topographicand displacement maps to evaluate lifeline loss due toslope-induced subsidence failures. The results so far arethat two ERS-1 SAR scenes of Salt Lake Valley have beenprocessed into interferograms. The pair produced goodfringes in the valley, representing the topographic con-tribution to the phase shift. In the next steps the topo-graphic component in the interferograms will be removedto obtain the signal due to ground subsidence. An analy-sis will compare slope maps generated from the fusedDEMs, which will pave the way for evaluating DEMresolution on hazard mapping (see Figure 7).
Enhanced 911 Emergency Response
For the E911 task, the goal is to compare digital ortho-photoquads, IRS-C, and IKONOS data sets for updatingroad networks in urban fringes and rapidly growing bed-room communities (see Figure 8). The methodology hasbeen as follows:
• Select test sites.• Acquire imagery and vector road layers.• Process the imagery (geocorrection, merging, and
enhancement).
• Perform an accuracy and cost assessment.• Compare the cost per kilometer of road updated.• Verify and validate the results.
So far, the results suggest that IRS-C data represent thebest value and provide a medium-priced data set for themaximum length of road per kilometer updated.
Airport Glide Slope Obstructions
An exciting new development is in Figure 9: a LIDARimage showing the glide slope to an airport runwaythrough which tree crown obstructions have protruded.
TRANSPORTATION LIFELINES AND HAZARDS 43
FIGURE 7 Fusion of ERS-2 satellite data (the backgroundimage) with ERS-1 data taken 3 years earlier (interferogram),both superimposed on TM 30-m data sharpened with SPOT10-m panchromatic data. The interferogram shows an area ofsubsidence (at the millimeter level) near Las Vegas, Nevada,caused by groundwater withdrawal during the 3-year interval.(From Professional Surveyor, Oct. 1999.)
(a)
(b)
(c)
FIGURE 8 Road updates from (a) DOQQ (0.33-m resolu-tion); (b) IKONOS (1-m resolution); and (c) IRS-C (5-mresolution).
FIGURE 9 Runway glide slope (gray swath) showing treespenetrating above the path. Heights of trees and other obstruc-tions are obtained from airborne LIDAR measurements.
53864_TRB_p47_54 8/25/03 3:10 PM Page 43
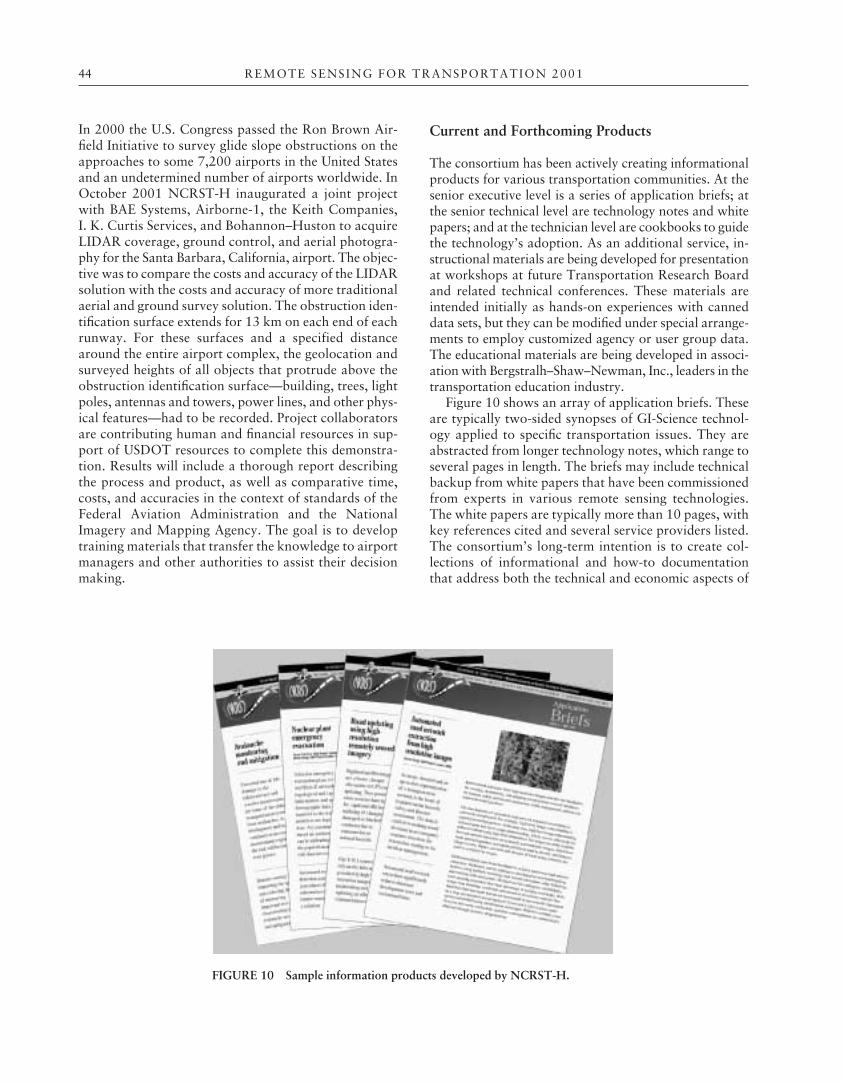
In 2000 the U.S. Congress passed the Ron Brown Air-field Initiative to survey glide slope obstructions on theapproaches to some 7,200 airports in the United Statesand an undetermined number of airports worldwide. InOctober 2001 NCRST-H inaugurated a joint projectwith BAE Systems, Airborne-1, the Keith Companies,I. K. Curtis Services, and Bohannon–Huston to acquireLIDAR coverage, ground control, and aerial photogra-phy for the Santa Barbara, California, airport. The objec-tive was to compare the costs and accuracy of the LIDARsolution with the costs and accuracy of more traditionalaerial and ground survey solution. The obstruction iden-tification surface extends for 13 km on each end of eachrunway. For these surfaces and a specified distancearound the entire airport complex, the geolocation andsurveyed heights of all objects that protrude above theobstruction identification surface—building, trees, lightpoles, antennas and towers, power lines, and other phys-ical features—had to be recorded. Project collaboratorsare contributing human and financial resources in sup-port of USDOT resources to complete this demonstra-tion. Results will include a thorough report describingthe process and product, as well as comparative time,costs, and accuracies in the context of standards of theFederal Aviation Administration and the NationalImagery and Mapping Agency. The goal is to developtraining materials that transfer the knowledge to airportmanagers and other authorities to assist their decisionmaking.
Current and Forthcoming Products
The consortium has been actively creating informationalproducts for various transportation communities. At thesenior executive level is a series of application briefs; atthe senior technical level are technology notes and whitepapers; and at the technician level are cookbooks to guidethe technology’s adoption. As an additional service, in-structional materials are being developed for presentationat workshops at future Transportation Research Boardand related technical conferences. These materials areintended initially as hands-on experiences with canneddata sets, but they can be modified under special arrange-ments to employ customized agency or user group data.The educational materials are being developed in associ-ation with Bergstralh–Shaw–Newman, Inc., leaders in thetransportation education industry.
Figure 10 shows an array of application briefs. Theseare typically two-sided synopses of GI-Science technol-ogy applied to specific transportation issues. They areabstracted from longer technology notes, which range toseveral pages in length. The briefs may include technicalbackup from white papers that have been commissionedfrom experts in various remote sensing technologies.The white papers are typically more than 10 pages, withkey references cited and several service providers listed.The consortium’s long-term intention is to create col-lections of informational and how-to documentationthat address both the technical and economic aspects of
44 REMOTE SENSING FOR TRANSPORTATION 2001
FIGURE 10 Sample information products developed by NCRST-H.
53864_TRB_p47_54 8/25/03 3:10 PM Page 44

applications and to work with industry and governmentto put the technology to work.
The list of available and forthcoming documents isgiven in Table 1.
Acknowledgment
This research was performed by the TransportationSafety, Hazards, and Disaster Assessment Consortiumsponsored by the U.S. Department of TransportationResearch and Special Projects Administration. The authoris solely responsible for the content and conclusionsdrawn from this research.
MODERATOR SUMMARY
Walter H. Kraft
Iam Walter Kraft. I’m a Traffic Engineer. I’m an ITSEngineer. I do planning. I do operations. I do manage-ment. I do integration. I want to see what is happening
on the roadway.Are all of you familiar with ITS—intelligent trans-
portation systems? Do you know what it is? I like the def-inition that describes ITS as the use of information tech-nology in transportation. ITS has been around a while,even though the term is relatively new. Any guesses as towhen it was first used in this country? I believe ITS startedin 1928 when the first actuated traffic controller wasinstalled in Baltimore. ITS deals with the flow of infor-mation. We gather information, we look at it, we synthe-size it, we do something with it, and we send informationout. Let’s draw a mental picture of ITS where informa-
tion flows in, we do something with it, and we send infor-mation out. That is what the controller in Baltimore did.The controller left the green signal on the main street untilinformation was received. When a car came to the sidestreet, the driver honked the car’s horn. A device had beenplaced there that heard the sound, which caused a changefrom a green signal on the main street to the side street.The controller had received information, did somethingwith the information, and sent information out. The in-formation it sent out caused the green signal to changefrom the main street to the side street. That is ITS, andI’ve been involved with ITS all my professional life.
I’m interested in remote sensing, because I want tosee how we can provide information to maintain andimprove mobility and also to improve safety on our road-way systems.
I get a little concerned because I do not think we aremeasuring the right things. I say that, because a numberof years ago I wanted to submit a proposal to the FederalTransit Administration to determine if people wouldmake a different modal choice if they had real-time infor-mation on travel conditions and the costs of travel. Todo that, we needed to install detectors to measure traveltime. A large firm that had developed a new detector con-tacted me. I asked the representative to tell me about thedevice. He said, “Do you realize that with our system wecan detect where every nuclear submarine is located rightnow around the world?” I told him that I didn’t carewhere every car is on our roadway system; all I wantedto determine was the average travel time of all the vehi-cles. They were giving me the wrong information. It isnot what I wanted to measure. I didn’t want to knowwhere each car was. I wanted to measure travel time.
So, I’m concerned that we are going in the right direc-tion. We need to reflect and ask if we are collecting theright information and if we are using it the right way.
TRANSPORTATION LIFELINES AND HAZARDS 45
Type of Document Title WhenAvailable
Application Brief Avalanche Monitoring and Mitigation 7/01 Application Brief Nuclear Power Plant Emergency Evacuation 7/01 Application Brief andTechnical Note
Road Updating Using High-Resolution, Remotely Sensed Imagery
7/01
Application Brief, TechnicalNote, and Cookbook
Automated Road Network Extraction from High-Resolution Images
7/01
Application Brief, TechnicalNote, and White Paper
Automatic Feature Recognition and Extraction from Imagery
11/01
Application Brief andTechnical Note
Road Mileage 11/01
Application Brief, TechnicalNote, and White Paper
LIDAR 11/01
Application Brief andTechnical Note
Hyperspectral 11/01
White Paper Remote Sensing Applications: Hyperspectral Imaging 11/01
TABLE 1 Products Available from NCRST-H (as of December 2001)
53864_TRB_p47_54 8/25/03 3:10 PM Page 45
I am encouraged by this meeting because last year Igot frustrated. My frustration was that nobody wouldlisten to me. When I said, “You’re not providing what Ineed,” I was told, “We can’t do that.” Right now, I thinkthat gap has been reduced, and I’m encouraged by find-ing more topics on operations, which is the area I’m in-terested in.
I am encouraged by what I have heard, because as Ilistened to the different speakers, I had certain reactionsas to how I would use remote sensing in an operationsenvironment. With respect to lifeline disruptions, I wouldlook beyond avalanches and think of anything that wouldaffect the lifeline. Vehicular crashes affect the lifeline.Construction of facilities affects the lifeline. Soon we aregoing to be in a period of major reconstruction of ourInterstate system. The reconstruction of many of the roadswill take multiple years for completion. For I-95 in PalmBeach County, Florida, it will take 8 years to reconstructa 10-mi section. It will take many years for reconstruc-tion of the Woodrow Wilson Bridge here in Washington,D.C. The Katy Freeway in Houston will also take a num-ber of years for reconstruction.
As I learn more about remote sensing, I find that Iwould like to know more about the effects of traffic dis-ruptions on travel. There are dynamic impacts that Iwould like to know about. I would like to have real-timeinformation. How do I find out what is happening on areal-time basis so that I can react to it on a real-time basis?
I would also like to know the impacts of diversions.Where are people diverting? How can I move traffic bet-ter? Again, this knowledge requires real-time feedback.Understanding travel impacts is a challenge that I willadd to understanding avalanches.
I think that yesterday’s discussion on airports wasvery interesting. I did not realize that tree growth is aproblem for glide paths, because traffic operations alsohas a tree growth problem. If trees block a driver’s viewat intersections or if traffic control center operators can-not use a remote camera to view traffic disruptions be-cause of tree growth, safety can be affected. So I see a lotof opportunity there for this technology.
The evacuation planning presentation was interesting,because I think there is a lot of good potential. When you
analyze evacuation planning, you want to determine dif-ferent ways of evacuating people. Evacuation planningfor a nuclear power plant is generally straightforwardbecause the plant does not move. Hurricanes are harderto plan evacuations for because hurricanes move andmove unpredictably, so you have to plan dynamicallyand realize that conditions are going to change unpre-dictably over time. The challenge is: How do we moni-tor the unpredictable on a real-time basis?
I thought the presentation on mapping transportationrisk was fantastic, because I see a lot of potential. If dur-ing the design process, I can locate areas where theremight be accidents, I could change the design to minimizeaccidents at those locations before construction takesplace. If the design cannot be changed, maybe I can locateremote television cameras at those locations to observetraffic and verify that an accident has taken place.
Earlier, mention was made of keeping pedestrians offhigh-speed roadways, which is very important in thearena of incident management. Let me share a statistic,which I thought was astonishing. For the period of 1992to 1997, 31% of fatalities incurred by law enforcementpersonnel by event or exposure were attributed to high-way crashes. That is astounding. Police are getting killedeither in their vehicles or as they are managing an inci-dent. Police are not the only responders to an incident.Fire, emergency, and department of transportation per-sonnel also help manage an incident. We want to moveall responders off the roadway as quickly as possible tosave their lives. So, what can we do to get them offquickly? Right now, police usually put up a total stationto reconstruct the accident scene. Can’t we get this infor-mation from a satellite or from an airplane, so that theincident scene can be cleared more quickly? This is anotherchallenge for you.
I helped develop a brochure for the Federal HighwayAdministration, which describes a self-assessment toolthat an agency can use to evaluate its roadway opera-tions. I brought the brochure to the conference because Ithink remote sensing can potentially be applied to helpan agency gauge its activities. Again, there is a need thatremote sensing may help fulfill. I encourage you to takea copy of the self-assessment brochure.
46 REMOTE SENSING FOR TRANSPORTATION 2001
53864_TRB_p47_54 8/25/03 3:10 PM Page 46

SESSION 6
10-Year Remote Sensing Industry Forecast
James R. Plasker, American Society for Photogrammetry and Remote Sensing1
47
In August 1999, the American Society for Photogram-metry and Remote Sensing (ASPRS) and the NationalAeronautics and Space Administration (NASA) Com-
mercial Remote Sensing Program entered into a 5-yearSpace Act Agreement to combine resources and exper-tise for
• Baselining the remote sensing industry (RSI);• Developing a 10-year RSI market forecast;• Providing improved information for decision mak-
ers; and• Developing attendant processes.
The forecast participants were
• NASA,• ASPRS,• Space Imaging,• Kodak,• SPOT Image Corporation,• EarthData,• PAR Technology Corporation,• Autometrics,• Spencer Gross,• American Forests,• RAND Corporation,• Pictometry International,• Leading Edge,• Lockheed Martin,• Geomatics,• University of Arizona,
• University of Utah,• University of Southern Mississippi, and• Rochester Institute of Technology.
Phase I of the survey, Characterization and BaselineForecast of the Industry (December 2000), focused onthe producer portion of the remote sensing process (seeFigure 1). Phase II, Characterization of Customers/Usersand Determination of Their Needs/Requirements, wascompleted in January 2002. Current summaries are avail-able on the ASPRS website at http://www.asprs.org/news.html. Phases I and II are being documented, withpublication anticipated in spring 2003 in the ASPRSjournal, Photogrammetric Engineering and Remote Sens-ing. Phase III, titled Validating Phases I and II, will in-clude a technology assessment and will be completed inDecember 2003. Phase IV, titled Market Forecast, will becompleted in December 2004.
Phase I includes 36 interviews at the commercial chiefexecutive officer (CEO) level; 437 web surveys of com-mercial, government, and academia personnel; 43 closed-envelope revenue surveys of commercial CEOs or chieffinancial officers, and a literature search.
To date, Phase II includes 134 interviews of managersand users; 4 focus groups involving members from the National State Geographic Information Council, localgeographical information systems, ASPRS, the Manage-ment Association of Private Photogrammetric Surveyors,and the Urban and Regional Information Systems Associ-ation; more than 700 web surveys; and an ongoing closed-envelope revenue survey.
53864_TRB_p55_58 8/25/03 3:10 PM Page 47

PHASE I: INDUSTRY BASELINE
The baseline forecast, in constant 2000 U.S. dollars,showed a growth from $1.8 billion in 2000 (actual) to$3.3 billion in 2005 and $6.0 billion in 2010.
In 2000, the largest market segments were divided asfollows: 66% of respondents used aerial platforms, andthe remaining 34% used space platforms.
In interviews, CEOs cited the following as barriers togrowth:
• Technology. Innovations are needed for–Increasing the speed of availability of information(rather than availability of data),–Delivering information that will be valued by theuser,–Developing systems that integrate data and offermultidisciplinary solutions, and–Lowering costs.
• Workforce education. The demand for entry-levelpersonnel exceeds the supply.
• Customers’ insufficient knowledge of remote sens-ing. Applications are based on the market, and demon-strations may help.
PHASE II: USER NEEDS AND REQUIREMENTS
Of the 708 respondents to date, the government sectorrespondents constitute nearly half, or 47%, of the sam-ple, with 34% of respondents from commercial accountsand 19% from academia. The survey identified three types
of uses: data, information, and software. Data and infor-mation are used more than software. When the survey iscompleted, ASPRS plans to do a cross-cut analysis of thefollowing factors:
• Demographic factors–Sectors—commercial, academia, and government(federal versus local),–Users versus managers,–Tools needed versus tools used,–Research and development,–Education levels, and–Training rates;
• Characteristics—imagery types, accuracy and res-olution, timeliness, applications and market segments,collection means, coverage, data layers, and sources andproviders.
Results of the surveys are presented in greater detail onthe ASPRS website; however, the following are among themajor findings from the preliminary survey results:
• A well-educated workforce exists, and the projectedshortage is an issue of numbers.
• Approximately 60% of the respondents had takencourse work related to remote sensing.
• The top three growth potential areas are in generalmapping and environmental and civil government appli-cations.
• In general, half of the user needs are being fairly wellmet, but a significant percentage of the needs, or 28%, arebeing poorly met. This is generally true across all sectors.
48 REMOTE SENSING FOR TRANSPORTATION 2001
Platforms & Sensors
End User
Data Collection
Data Processing
• Hardware • Software • Etc.
•
• Consultants
Industry Intermediaries
Support Elements
• Value-Added ResellersBusiness Segments
Phase I
Phase II
FIGURE 1 Remote sensing industry definition.
53864_TRB_p56_r1 8/25/03 3:11 PM Page 48
• Users of data and information collected from bothaerial and space platforms agree that spatial resolutionand geolocation accuracy are the most important char-acteristics.
• Cost is an important characteristic but not the mostimportant. However, cost is an apparent major driver formanagerial users who purchase the data and information.
• Increased elevation accuracy is needed.• In the governmental sector, there is a decided need
for elevation accuracy of approximately 3 m.• Pending further analysis, there is an apparent gen-
eral need for geolocation accuracy of 1 m or better.• Pending further analysis, there is an apparent need
for higher spatial resolution of <1 m.• Timelines requirements tend to cluster. The gov-
ernment sector has more interest in real time than othersectors do. Nearly 60% of commercial-sector interestclusters from 1 to 3 days and 1 to 3 months.
• Aerial imagery is used 65% of the time. Multi-spectral imagery is the most used type of imagery col-lected by space platforms. Digital is the most used imageryformat.
• For imagery, the largest increases in usage in 2006are projected to be hyperspectral, light detection and rang-ing (LIDAR), digital color, digital black and white, andcolor infrared film.
CONCLUSIONS
• The commercial RSI market is growing at about13% a year, although the impact of September 11, 2001,on this estimate is unknown.
–Market size was about $2 billion in 2001 and willgrow to $6 billion in 2010, in constant 2000 U.S.dollars.
–Aerial and satellite markets do not seem to becompetitors.
• The industry is fragmented and populated withmany small companies. This does not necessarily meanlow entry barriers.
• Imagery collected from aerial platforms is used twiceas frequently as imagery collected from space platforms.
• High resolution, geolocation, and cost are marketdrivers. However, information value and content have astrong influence and can supersede cost issues.
• Digital is the preferred format.• Companies typically operate in more than one busi-
ness segment.• Government agencies are the largest potential custo-
mer group. About two-thirds of commercial RSI revenuesthrough 2006 are from the federal and state governments.
• In all sectors, the barriers to growth appear to befunding, education, training, and awareness—not avail-able technology.
• Currently, across all sectors, the most active appli-cations or market segments are as follows:
–National and global security—41%,–Mapping and geography—17%,–Civil government—15%,–Transportation—9%,–Environment—4%,–Utilities—4%, and–Other individual market segments—2% or less.
NOTE
1. The preceding was a summary of Mr. Plasker’s presenta-tion. Copies of the slides in the presentation, which includedetails of the forecast’s findings, are available at http://www.asprs.org/asprs/news/forecast_frame.html.
10-YEAR REMOTE SENSING INDUSTRY FORECAST 49
53864_TRB_p55_58 8/25/03 3:11 PM Page 49

53864_TRB_p55_58 8/25/03 3:11 PM Page 50

SESSION 7
State of Remote Sensing in TransportationSummary Panel
David Fletcher, GEODIGM, ModeratorIan MacGillivray, Iowa Department of TransportationAnita Pauline Vandervalk, Florida Department of TransportationJohn J. Conrad, Washington State Department of TransportationWalter H. Kraft, PB Farradyne Inc.Michael R. Thomas, National Aeronautics and Space Administration Earth Science Applications
Directorate, Stennis Space CenterJames R. Plasker, American Society for Photogrammetry and Remote SensingJohn R. Jensen, University of South Carolina
51
David Fletcher
This is the conference feedback panel. Evaluationquestionnaires from last year indicated this typeof wrap-up session was one of the most valuable
aspects of the conference. This year’s panelists have spenta lot of time thinking about the bigger picture, and theywill offer some synthesis remarks and observations andprovide a perspective that rounds out a lot of the techni-cal material that we heard yesterday.
We asked the panel to focus on key questions. Since theprogram is now 2 years old, we are trying to think of thisas a midterm assessment or evaluation. At the first confer-ence last year, we were still exploring each other’s vocabu-lary, needs, and interests in the remote sensing communityand the transportation community. We have seen somegood progress over the last year at the application level.
The first question is what are the greatest strengthsoffered by remote sensing technologies to transportationand program activities? Is there something uniquely dif-ferent about remote sensing, and are there activities thatcan play to that strength?
Conversely, it is equally important to identify the cur-rent weaknesses of the technology. What are we doing,
or what is the industry doing, to go ahead and addressthose weaknesses?
These are two questions internal to the industry, gaz-ing inside from the perspective of remote sensing. As webegin to look out, what are the external factors that influ-ence the success of the program? The first external factoris, obviously, what are the best viable opportunities thatare being explored? Viable is different from do-able. Wehave seen a lot of research that remote sensing is techni-cally feasible, but that does not necessarily make it viableor sustainable or desirable in an operational setting. Wewant to begin to think, given all the projects, are there anythat begin to stand out as real core activities? We shouldthen think about strategies for deployment within theindustry—deployment and commercialization.
Along with that is the question: Are there new trans-portation policies and program areas that are just nowcoming on line that could benefit from the new technolo-gies? We spend a lot of time matching new technology toold missions. In some cases that is probably a good fit. Inother cases, rather than spending all our energies lookingat how new capabilities could be applied to old opera-tions, we can also ask, Are there new operational respon-sibilities that we can match against the new technologies?
53864_TRB_p59_72 8/25/03 3:12 PM Page 51
Finally, are there any kinds of external threats? Arethere factors that would tend to threaten or change theslope of the deployment curve shown in Jim Plasker’spresentation? [See session on a 10-year remote sensingindustry forecast, page 47.] Now we are looking at an8% growth rate for remote sensing. What are the threatsthat could change the slope of that curve?
I’ll start, since that is the moderator’s prerogative.My view is that in a much broader sense than we havethought about it, remote sensing has inherent strengthsthat are worth exploring. Remote sensing technologies,by their definition, are nonintrusive. They offer an over-the-horizon access to places that are either prohibitivelyexpensive to reach or are impossible to have access toby any other means.
The other trend we are seeing is for multispectral sens-ing, the hyperspectral with hundreds of channels, andultimately to ultraspectral sensors with thousands ofchannels, and perhaps the thousands of channels will beuser-programmable so an analyst can select a particularpart of the spectra to analyze.
Another significant strength: these data are, on a persample basis, essentially free. In a 1-km2 area, at 1-m res-olution, there are a million data points. Even if it costs$40 or $50 to buy a million samples of data, that is lessthan a penny a sample. That completely changes the rela-tionship I have with the feature or the phenomenon thatI am beginning to view. I can begin to think about con-tinuous types of monitoring activities.
We’ve seen a lot of small-area applications, and Ithink the pilot level is a good way to start. But I wouldencourage us to play to the strengths of the technology,to consider, How can I take advantage of data that areless than a penny per sample? How can I take advantageof data where I now have hundreds, if not thousands, ofitems of spectral information with the high-resolutioninformation?
On the weakness side: a number of folks stood up andsaid, “We had a data collection mission scheduled that wehad to scrub because of poor conditions.” The paradoxis the greatest weakness for remote sensing: the greatestneed for remote sensing information is generally when thedata are the least available. We want data during stormevents. It is very hard to launch a tiny plane during thehurricane. What happens in nighttime events? What hap-pens in fire events when smoke produces visibility prob-lems? The timeliness of the information is affected by therevisit cycle of the sensor: the sensor came over this morn-ing, the event happened in the afternoon, it is 4 days be-fore I get that sensor back again. How do we deal withthis? Certainly, transportation people are unwilling to putmission-critical safety issues onto unreliable technology.If that technology is inaccessible, I consider it unreliable,and it is not worth the investment just for sunny days. Ineed a technology that operates 24/7.
The other weakness, mentioned by many speakersyesterday, deals with the data-to-information transfor-mation process. Human beings are incredibly good at allthe things that software is not good at. We’ve got a millionyears of evolution at basically a preconscious level thathave taught us pattern detection, trend line recognition,and anomaly detection. Of course, those are all the thingsthat we want from remote sensing products, and they arethe most difficult things to write in the software. Untilwe take human intelligence out of the loop and replacethat with machine intelligence, we will have this barrier.There is an enormous shortage in the qualified work-force. It is unlikely, at least in the short term, that therewill be a huge infusion of new industry professionals. Wewill have to start talking about coding intelligence ratherthan hiring it.
In terms of opportunities, it is the same. The trans-portation industry has advantages that some other indus-try segments do not. We can take a much more systemicapproach. Most remote sensing projects are based on theassumption that we have smart sensors and dumb fea-tures. We don’t have to live that way. We can create thedigital world, because we are creating engineered facili-ties and can have smart sensors working on smart fea-tures. For example, in trying to identify where pavementis, rather than doing feature extraction and assumingthat the pavement is passively sitting out there, if I havea cheap mixture, say a $1.00/lb add mixture, I can throwthat into a pavement mix. If that add mixture has a spe-cially designed signature, then the signature will show upquite clearly. It makes the feature extraction that mucheasier. Likewise, if I have the library of spectral responsefrom car colors, which is only several hundred paintshades, identifying those vehicles out of the backgroundsis much easier.
Let’s take a systems approach then: design smarter fea-tures that can take advantage of the remote sensors, sothat the two begin to work together. I think the best exam-ple is intelligent transport systems (ITS). I would assertthat, given all the ITS experiments in applications and thedemonstration projects, there has been only one clear-cutexample of success in the entire ITS industry and that iselectronic toll collection. We have done many things, butthe only thing that has been deployed nationally and thatall 50 states are using is the EZ-Pass toll system. It is agood illustration. Originally, toll taking was a human-to-human interaction. I searched around the glove compart-ment, found 40 cents, and I handed the 40 cents to the tolltaker. Now, it is a vehicle-to-infrastructure interaction,which takes the human being right out of the loop. Now Ihave a smarter car and a smarter road, and I don’t needthe people to conduct the same transaction. At the sametime, the public benefits improved: travel times got better,environmental air quality improved, and it was tied to aprogram that had a revenue stream. Those are the kinds
52 REMOTE SENSING FOR TRANSPORTATION 2001
53864_TRB_p59_72 8/25/03 3:12 PM Page 52

of opportunities and the kinds of systems engineering thatwould be useful for us to investigate.
Another opportunity is condition surveys. We need tothink differently about the way we do condition surveysand design the structures themselves. We need to designphenomenon in the structures to take advantage of theunique characteristics of the sensors, rather than tryingto retrofit the sensors back to the condition survey. Theproject on the bridge condition survey is an example.
Threat. There is, and will continue to be, the tensionbetween openness on the one hand and restriction of in-formation on the other hand. Where we set that balancepoint will determine the impedance of the deploymentof these technologies in the industry. What to one personlooks like improved customer service, to another per-son looks like invasion of privacy. What to an agencylooks like regulatory monitoring, to an industry lookslike the capability for industrial espionage. What looksto government like infrastructure management, fromanother perspective looks like infrastructure vulnerabil-ity. Negotiating the balance between transparency andthe restriction of information will probably do more thanthe inherent technical capabilities in determining the dif-fusion rate of remote sensing.
Ian MacGillivray
Icannot focus on all five of the panel’s charges, but Iwould like to address three of them: opportunities,barriers, and threats.I see the opportunities in the environmental area. The
most immediate barriers are organizational within thedepartments of transportation (DOTs). I want to talkabout myself and my organization for a couple minutesand how that relates. On the question of showstoppers:some of the new tools and the results are showstoppersthat can potentially revolutionize how we do some ofour work.
Administrator [Ellen] Engleman [of the Research andSpecial Programs Administration of USDOT; see theopening session on page 10] graphically pointed out thegap in going from research to commercialization. We nowface that gap, she said, in achieving commercialization,although I prefer to use a different word. I call it imple-mentation. I want to focus on those questions. In effect, itis a start on strategic planning. I’ll come back to the gap acouple times.
There are two themes through much of the discussionand presentations at this conference. One is that remotesensing technology is “not quite ready for prime time.”The other is that “the prime customer,” and I guess that isthe DOTs, “is a resistant customer.” This morning theindustry survey [see session on a 10-year forecast for the
remote sensing industry, page 47] showed two considera-tions that I think are key: speed and the availability ofinformation in our development process. You’re darnedright. That is one of the most perceptive things you can sayabout the transportation business, particularly when itcomes to location planning, environmental analysis, anddeveloping projects. Cutting down that lead time from 5,6, or 7 years on project development will get us back in therealm of reality with lead times of 2 and 3 years.
The survey found that information is valued by thecustomer. That is real logical. Lower cost is not criticalbut that would close the sale. I’m not concerned that wehave an emphasis just on cost. The most important pointthat was made from that survey is the insufficient level ofcustomer knowledge of remote sensing. It is hard to buywhat you don’t know. It is hard to use it. The demon-strations, as we have seen from our university consortiapartners, are key in that.
The transportation sector looked a little smaller in thesurvey as a customer than I would have expected. Just aswe, as customers, lack some adequate knowledge aboutremote sensing, perhaps the remote sensing communityalso lacks some adequate knowledge about us as cus-tomers. The industry needs to have a better idea of andthe research community needs to better understand thecustomer, to look at our prime needs, so that we don’tget another way to do what we already do, only with anew tool. There is no real strategic advantage to that.Yes, maybe it is more cost-effective, but we also need tounderstand how the prime transportation customer, theDOT, does business in the environment in which it worksand how the presentation of information from thesetools could be more usable.
BARRIERS TO ENTRY
Accuracy, vertical accuracy, is critical. Can you imaginewhat a 3-m or 10-ft vertical accuracy means to a designeror a location planner? It means the data are virtually use-less. Think about a 10-ft cut in rock fill or a 10-ft cut fora back slope and its impact on the footprint of that right-of-way and what that footprint means in an environ-mental assessment for alternative highway locations. Wecan’t work with it. In some ways, the vertical accuracy ofremote sensing is not quite there yet, although digital ter-rain models with 0.5-meter accuracy are a breakthroughand are going to allow us to do many applications.
BETTER, QUICKER, CHEAPER
I’d like to turn this phrase around and suggest that thechallenge is quicker, better, and cheaper—quicker,quicker. One of the best opportunities for adoption is in
STATE OF REMOTE SENSING IN TRANSPORTATION 53
53864_TRB_p59_72 8/25/03 3:12 PM Page 53

the environmental area, but I want to put that in a broadercontext. This is location planning and design. From thetechnical side of the traditional engineering, like cuts andfills, all the way through to areawide coverage, there arevarious environmental factors. The ability to look in theearly stages of the alternatives analysis at environmentalinfluences and analyze not just a preferred alternative,but a variety of alternatives, and to do that cooperativelywith resource agencies and with the public is very desir-able. To do that means that the information from remotesensing needs to be understandable, and it needs to bepresentable in a fashion that relates to the decisions thatare going to be made.
We’re participating in a wetland project right now.I’m very enthusiastic about what it is going to do for us.As I present the information to the public, it is clear thatthere is more to a wetland than just calling it a wetland.Some issues are quite significant, and some aren’t signif-icant at all. As a user of the information, I have to have away to convey the difference in that significance as wetalk about measuring the impacts of our work. We haveto present the information in a way that folks can appre-ciate it, and yet there are going to be people that don’thave the background that we’re presuming as we talkeven to that educated customer.
I’m excited about everything, from digital terrain mod-els to environmental representation of information thatis now becoming available. I’m excited about the toolsthat let us evaluate and optimize those locations fromthat information. Let us optimize the analysis of ourlocations through value sets. Value sets can be dollars orenvironmental measurements of various types (wetlands,prime farmlands), but they are primarily the values of thecommunities that we work with and the methods that letus rapidly turn that information around for them. Suchtools are also becoming widely available and need to beintegrated with this practice.
There are two gaps to focus on: the knowledge gapand the use gap. The knowledge gap is perhaps moreimportant. Several times the resistant customer was men-tioned, or it was said that the DOTs are not earlyadopters and are somewhat risk avoiders. You proba-bly need to understand us a little bit better. Those aresuperficial characteristics, but they are valid observa-tions. Why? One of the reasons is that a lot of us arecivil engineers; we are a can-do organization. We werecrafted with that, and we take pride in that. What do Imean by “can-do”? We can do it ourselves. We are talk-ing about changing the environment of practice in moststate DOTs, because state DOTs are probably not goingto do remote sensing. We are not going to collect thisinformation. This is a foreign intrusion into our pro-cess, and that is a part of what we are somewhat resis-tant to, and it is very difficult to get us to understandand adopt.
That means, then, developing innovative partnershipsand working with DOTs in demonstrations to apply andlearn from these technologies. In fact, that is what we’vebeen able to develop with our university, and we are veryproud of that successful partnership that is working verywell with Iowa State University. That is a plug for you,and good job.
INNOVATIVE CONTRACTING
DOTs are a little resistant to innovative contracting, too.The remote sensing community needs to be thinking abouthow to present us with opportunities to partner with youin more innovative fashions that allow you to combinethe things you can do with us with the things you can dowith other people that we may not understand as well.
The demonstration of the tools is perhaps the bestopportunity. I’m concerned about some other gaps: thegap between pure science that produces entertainingresults and the application of useful information thatrelates to the decisions that we need to make. I’m alsoconcerned about doing some true measurements—notenvironmental measurements, but measurements of theimpact on the process itself. Are we, through the use andapplication of remote sensing technologies, having a pos-itive impact on the process we are responsible for? Oneway that is measured is by how long it takes us to de-velop our projects. Another way is by measuring thequality of the projects that we develop, in essence, intotal in the environment and in the community and alsowith the users, but particularly in the environment andin the community. We need to look at how to contributeto improving that product with these methods.
The one thing I would like to leave you with is thatperhaps when you look at me, you’re looking at one ofthose uneducated users who need to better understandwhat the potential is. The challenge and the invitation toyou are to educate me on how I can help my agency besttake advantage of what you have to offer. You need tounderstand my terms of business and the decisions that Iface, and we need to begin exploring ways to get beyondthe research community. Today, people like Dave Ekern[of the Minnesota DOT], John Conrad [of the Washing-ton State DOT], and I are here representing our organi-zations more from a research viewpoint than from adevelopment and practicing engineering viewpoint. Wenow need to start approaching an integration betweenthis science that is coming out of the cocoon and sittingdown with those civil engineers, those old-fashioned fel-lows and ladies, and talking about how to modernizesome of their practices.
I encourage you to make your next engagement to benot talking to each other or to us, but perhaps visiting withthe committees at the American Association of State High-
54 REMOTE SENSING FOR TRANSPORTATION 2001
53864_TRB_p59_72 8/25/03 3:12 PM Page 54
way and Transportation Officials (AASHTO) and perhapsTom Palmerlee [of the Transportation Research Board(TRB)] and others who can assist us in that integration.
Anita Pauline Vandervalk
I’m Anita Vandervalk, the Manager of the Trans-portation Statistics Office at the Florida Departmentof Transportation. I’m a planner, an engineer, and a
data manager, so I’m going to talk from those perspec-tives. I will concentrate on the flows in infrastructureareas, as those are what I’m most familiar with and towhich I have something to add.
I’m going to organize my comments into three areas.I will talk about strengths and weaknesses and then focuson opportunities. Many of my comments are a continu-ation of Mark Hallenbeck’s comments from yesterday[see the session on transportation planning, page 28].
As we have heard over the last couple of days, therehave been a lot of improvement and a lot of progressover the last year in the flow area, but beyond the tech-nical advancements, even more important are theimproved relationships and the communication andcoordination that have occurred. Last year we heard a lotof “we” and “them,” and we are not hearing that thisyear. There is a lot more discussion about how all of thiscan benefit all of us in the transportation community.
On flows, I think there is the potential to providelow-cost continuous data. This is a strength, but it isalso a potential weakness because we do not have theability to provide that “any time, anywhere” data. AsMark Hallenbeck indicated, there is a lot of potential,but still quite a way to go before the data can truly re-place the way we measure volume and report on level ofservice and speed calculations.
What we need is to decrease the cost per unit of infor-mation that we are getting. The technology needs to workaccurately and consistently and be more cost-effectivethan the alternatives we are already using.
As far as weaknesses go, I agree that we need to con-tinue to work on improved vehicle detection, tracking,and automation so we can turn the data into informa-tion. We need a system that is simple enough so thatexisting employees can use it. We have heard a lot aboutthat already. Very importantly, despite the difficulties inbeing able to provide benefit–cost ratios, we need to atleast look at cost comparisons between the spatial tech-nologies and get some indication of what the “addedvalue” is for our transportation processes. That is some-thing we need to do together. That we, in the transpor-tation community, expect the remote sensing communityto come up with that has, I think, been part of the prob-lem, when this needs to be a joint effort.
We also need to be careful with an approach that sim-ply replaces existing data collection techniques. We can’ttake a data collection methodology and assume that wecan replace it with a new spatial technology. We shouldaim to use the spatial technology and spatial informationtools as tools to improve our transportation businessprocesses. Again, that is something we need to work ontogether.
An example that I want to use is yesterday’s presenta-tion on level of service [see the session on transportationplanning, page 21]. The techniques presented weregood and applicable. We, at the Florida Department ofTransportation, did take some aerial photography andtry to measure density, and we used that measurement insome of our performance measures evaluation. I’m goingto talk a bit from the standpoint of performance mea-sures, because we are working very hard on developingmobility performance measures, and the need to come upwith data collection techniques is high on my list.
We looked at that technology to report on level of ser-vice, and it did not mean a whole lot to us. The reason isthat as an agency, we are turning to look more at opera-tions. Operations is important, and our customers areexpecting reliable transportation. We are searching forreliability measures, measures of travel speed, and thevariability of those speeds along a corridor. For the mea-surement of level of service, although that possibly meetsan existing or an old demand, we need to be looking atother ways of measuring different metrics. For example,it would be great if we could get something that wouldgive us good travel speeds consistently and regularly,since the traditional travel time runs are relatively expen-sive. We must be careful not to assume that we are goingto continue to measure things the way that we do now orthat the accuracy levels have to be what they are. Weshouldn’t fit remote sensing into transportation, but ratheragain, improve our overall processes and figure out howremote sensing can help us do that.
Another example: in Florida I’m working on improv-ing our data collection process from the planning stand-point. We are looking at using remote sensing or aerialphotography to collect data at the early stages where wecollect our roadway characteristics inventory and ourHighway Performance Monitoring System data. We aretrying to figure out at what accuracy level we can collectso that data can better serve the environmental folks inprecorridor studies and possibly even predesign.
One of the interesting things we found is that thedesigners do not know what accuracy level they need.They are assuming that their providers, being the sur-veyors, are providing it at the Level 1, Level 2, Level 3survey, or at whatever level they are getting. We need toget at the question of what accuracy do they need andcouple that with what accuracy can be provided by re-mote sensing technologies.
STATE OF REMOTE SENSING IN TRANSPORTATION 55
53864_TRB_p59_72 8/25/03 3:12 PM Page 55

If the new spatial technology can work with us in a waythat will help us revamp our processes, and help us figureout a better way to do business, then we need to thinkmore of the bigger picture. All of this will challenge us towork even more closely together as we endeavor to do that.
On the opportunities, I think I have already alluded tosome of them during my discussion of weaknesses, butsome measures Mark [Hallenbeck] wanted me to men-tion that we could use would be measures that give usqueue detection, park and ride utilization, flow, originand destination, vehicle class and size, and emissions. Hefelt fairly strongly that there must be a way to figure outa new way to measure the total air pollutant load byfacility or area, which will get us away from trying to fig-ure out emissions based on vehicles.
It would also be great if the sensors could help us seeboth a wide focus area and a narrow area. Then we canuse the wide area to figure out where there may be apotential congestion or transportation problem, and thennarrow in on the problem and go ahead and collect dataat regular intervals to help us figure out how to operatethe system more efficiently.
Another opportunity lies in the collection of multi-modal and intermodal data. I’ve seen some potential pro-jects in that area. Another example from Florida, which isillustrative of other states as well, is the development of astrategic intermodal system to move beyond the tradi-tional approach of prioritizing projects on an interstatesystem. We are in the middle of developing an intermodalsystem that will include ports, airports, transit, and high-way, and figuring out how to prioritize projects amongand between all of those modes on a systemwide basis. Weare definitely going to need some way to measure flows ofpeople, commodities, and goods as they move through thesystem. That would be a definite opportunity area for us.
In general, I think there is a good amount of potentialin the flows area and especially in the infrastructure area.Again, we still need to work together to see the big pic-ture and how we can get the most out of remote sensingtechnologies.
John J. Conrad
I’m John Conrad with the Washington State De-partment of Transportation. I’m going to focus onstrengths, weaknesses, and some emerging policies
and programs. Much of what I’m going to say will rein-force what you have heard from Ian MacGillivray [of theIowa DOT, see the session on environmental streamlin-ing, page 20] and Anita Vandervalk [see this session,page 55].
First of all, on the strengths side, I think remote sens-ing provides a richness of data that is a natural fit with
the DOTs. I talked about the build, maintain, operatefunction that makes up most of what we do, and it fitsvery well with that.
I think there are great opportunities for doing thingsfaster, better, and cheaper. The ones that most piqued ourinterest are in the environmental and hazard assessmentareas. They, in particular, lend themselves to this technol-ogy. We’re demonstrating that by our involvement withthe I-405 project [see the session on environmental stream-lining, page 19] that we described yesterday.
Infrastructure, I think, also has the potential to offersome significant benefits, but what I see as an emergingstrength is more emphasis on user involvement. It is goodto see a number of DOT folks and others here that areactual users of this technology, and it is good to see thatmany projects being researched right now have stronginvolvement from agencies that are the potential users.
Now I want to talk about some of the weaknesses. Oneproblem is that remote sensing is a very technical subjectthat is not easily understood by those of us who aren’tworking with it day to day. There is a natural skepticismbecause of that. The challenge is, How do you overcomethat skepticism and get the right information on the ben-efits, costs, and how this fits in with our mission, to thoseof us who are decision makers in our agencies?
If we reflect back on the history of research in DOTs,the biggest research project that we ever had was theStrategic Highway Research Program (SHRP) in the late1980s. Hundreds of millions of dollars were expendedon research as a part of that program. The big weaknessthat was uncovered as that program wound up was thatnot much thought had been given to implementation ofthe research. That is a key lesson that needs to be kept inmind with remote sensing.
What ultimately came about with SHRP was that imple-mentation groups were formed, both within TRB andwithin the AASHTO organization. This went a long waytoward getting that research into actual practice. Thatmission could have been a lot easier had thought beengiven to this problem up front as the research was beingput together.
I particularly liked [session Moderator] Dave Fletcher’scomment about designing systems that take advantage ofthe technology (see page 51). The only way that willhappen is through a strong connection with those usergroups, such as AASHTO. I want to talk a bit about howAASHTO works as an organization and how the remotesensing community might fit in with that and TRB as well.
Let me start with TRB. As [TRB Executive Director]Bob Skinner mentioned Tuesday [see the opening session,page 10], the TRB and those of us in the business put a lotof hurdles out there in front of research. We are not try-ing to put barriers out there to implementation, but thatis certainly how it comes across. TRB last year formed aspecial task force on accelerating innovation in the high-
56 REMOTE SENSING FOR TRANSPORTATION 2001
53864_TRB_p59_72 8/25/03 3:12 PM Page 56

way industry—a group of industry and DOT officialsfrom across the country that are trying to identify inno-vations and address how they might be mainstreamed andaccelerated into practice. That is one model for this.
AASHTO is essentially formed of all the DOTs fromacross the country. One of the primary committeeswithin AASHTO is the Standing Committee on High-ways. That committee is the most technical committee ofany of the AASHTO committees. That is where all thedesign, construction and traffic operations, maintenance,highway safety, etc., are discussed through subcommit-tees for each of those technical areas. That StandingCommittee on Highways is made up of the chief engi-neers from all the DOTs across the country. The sub-committees are made up of actual practitioners fromeach state DOT. Learning from the SHRP experience: asAASHTO phased out its SHRP Implementation TaskForce, it continued with the new group called the Tech-nology Implementation Group (TIG). This new group istrying to find technologies that are ripe for mainstream-ing and implementation in the DOTs and lending a handto making it happen.
One of the most successful approaches developed fortechnology implementation is the lead state program.This technique relies on identifying those states that areout front in leading and implementing the particularresearch or technology, and then using those states as auser and teacher model with other states that may beinterested in implementing the technology. The TIG andSHRP Implementation Task Force have both made gooduse of this approach within AASHTO.
On emerging policies and programs, I think AnitaVandervalk has hit it right on the head with flow andoperations. The highway system is fairly mature. It isbuilt out, and focus needs to be on how we operate thatsystem. Making the system operate as efficiently as it canis now being recognized by virtually all DOTs as ex-tremely important. It is coming together in a nationalfocus that I think will lead to incorporating some languageon operations into the reauthorization of the Federal AidHighway Program next year.
A key part of operations is knowing what is going onin your system. Now our basic way of knowing what isgoing on relies on very extensive hardware, such as sen-sors in the pavement or closed-circuit TV cameras, whichare very expensive and are not easily implemented. Weare searching for less expensive ways to detect incidents,measure traffic flows, and know what is going on outthere in the system. We are looking for ways to speed upour response to accidents and incidents on the systemand get them cleared more quickly.
Lastly, we are challenged to measure the performanceof our system, and Anita Vandervalk has given you ideasof those measures that we need to keep track of in oper-ating our system.
I want to thank everybody for the opportunity to par-ticipate in this workshop. It has been a tremendous learn-ing opportunity for me.
Walter H. Kraft
Good morning. I’m Walter Kraft. I’m a civil engi-neer who migrated into traffic engineering andITS. I have to admit that when I was here last
year, I was a bit lost in trying to understand remote sens-ing technology. It was very detailed, and even though Iconsider myself a technology buff, it was over my head.This year, I feel more comfortable, because I think thegap in my understanding of the remote sensing technol-ogy has been reduced.
I am reminded of the evolution of the mobile tele-phone. Remember those breadboxes we used to carryaround as mobile telephones? I had one and kept it formany years. Over time, the phones got smaller and becamemore usable. However, when I went overseas, I could notuse my mobile telephone because of different standards.I remember my colleagues in Hong Kong, who wouldchange the chip in the back of their telephone to use thatsame device in Beijing. Now there are mobile phones thatare interoperable in different countries, and you don’thave to change the chip. I sense a similar evolution inremote sensing.
I would like to share some thoughts with you. I did notdo a rigorous breakdown of my summary by the suggestedcategories. However, I will cover strengths, weaknesses,opportunities, and threats. I want to share some capabili-ties that are needed in operations and that I think areimportant, and maybe some can be solved with the use ofremote sensing. Our challenge is to separate those neededcapabilities that can be provided with remote sensing andthose that should be provided through other sources.
Operations need real-time data. Real-time data canhave different meanings. It can mean second-by-secondmonitoring. In other cases, information in 5-min inter-vals may be sufficient. For operations, I need frequentdata, and I need it continuously.
We need to improve safety. Each year, we kill morethan 40,000 people on our roadway system. That is anepidemic. As I mentioned yesterday, 31% of police fatal-ities were attributed to highway crashes [see session onlifelines and hazards, page 45]. The roadway is a hostileand dangerous environment.
Let’s take a look at an incident, which can be primaryor secondary. It can also be planned or unplanned. Anexample of a planned incident is roadway constructionor a major event. An unplanned incident is a crash, orwreck or accident, depending upon which part of thecountry you are in. Let’s assume that two vehicles crash,
STATE OF REMOTE SENSING IN TRANSPORTATION 57
53864_TRB_p59_72 8/25/03 3:12 PM Page 57

causing a primary incident. The effect of the crash is thatthe traffic upstream of the primary incident slows, stops,and backs up. Primary incidents provide opportunities forsecondary incidents to occur. In many cases, the secondaryincidents are more severe than the primary incident, be-cause a high-speed vehicle hits a stopped vehicle. Theobjective of incident management is to clear the primaryincident before secondary incidents occur. To help under-stand the situation better, let me explain the incidentmanagement process.
Incident management has three parts: detection, verifi-cation, and response. First, we need to detect an incident.Then we need to verify that the incident has occurred.Lastly, we need to respond to the incident. Response isdirecting those resources that can clear the incident quicklyand effectively.
I’ve been in some states where it takes the police 33 minto verify an incident. That is too long just to verify an inci-dent. Such a long verification time provides too manyopportunities for secondary incidents.
What we need is information; we need to knowquickly when an incident occurs. Currently, about 5% ofthe nation’s roadways are instrumented, either by intru-sive devices where we put detectors in the roadway or bynonintrusive devices that can be maintained withoutcausing congestion. These devices are expensive to installand maintain. We can’t afford to provide the same levelof detection on all of our nation’s roadway system. Weneed to look for alternative ways of detecting incidents.
In urban areas, cell phone users provide us with timely,but not always accurate, incident information. We don’thave that same opportunity in rural areas. Many ruralareas don’t have very good cell phone coverage.
We also need to know information about the roadwaysystem when an incident occurs. How many lanes areblocked? What types of vehicles are involved? Do weneed the big wrecker or will the small wrecker be suffi-cient? How do we handle the incident? Are there injuries?Do we need to get medical personnel there? Is there a fire?Does the fire department have to come out? Is there a fuelspill on the road? Is there hazardous material in the vehi-cles involved? We need to know the answers to thesequestions as quickly as possible.
I would also like to know what happens if we have anincident and traffic diverts. Diversions can be planned orunplanned. Planned diversions provide drivers with infor-mation on suggested diversion routes. The objectives ofplanned diversions are to help drivers get through theroadway system more effectively, keep them out of neigh-borhoods, and keep them away from schools. Unplanneddiversions provide no information to drivers other thanthat there is an incident ahead. Drivers then travel ondiversion routes based on their own knowledge and with-out information about the diversion routes. Real-timemonitoring by remote sensing could reduce the effects ofdiversions.
I also want to know what parts of the road system arenot usable due to natural or man-made disasters. Reac-tions to hurricanes consist of evacuation, sheltering, andrecovery. I need to know when to stop evacuation andstart sheltering. Likewise, I would like to know when therecovery process could begin. For example, there is a sec-tion of Route I-10 east of New Orleans that frequentlyfloods during hurricanes. I would like to know when vehi-cles should stop using that section of road so that vehiclesdon’t get stuck in a queue at the flooded areas. I wouldalso like to know when the road could be passable again.
Another application of remote sensing is to provideinformation on the location of fog. Currently, we canobtain information from point source weather stationsand interpret the area of fog. I would like actual infor-mation on the areas covered by fog.
Yesterday, I asked if we are measuring the right things.For example, the Minnesota legislature decided that theramp-metering system in Minnesota should be discon-tinued because of public concerns. The engineers werefocusing on maintaining free flow on the freeways, whilethe public focused on the ramp backups. Fortunately,when the ramp-metering system was shut down for a fewweeks, travel was negatively impacted. The net effect hasbeen increased awareness of the effects of ramp meteringby both the engineers and the public.
I would like to give you some challenges to address.How can you provide real-time data for operations?Also, are we measuring the right things? Is remote sens-ing the right technology for what we need to measure? Ifit is not the right technology at the present time, will thisconclusion change over time as the technology evolves?For example, a few years ago, unmanned aircraft werenot considered as viable options to gather real-timeinformation; now they have become a viable option.
We need to get the message out that remote sensing isa viable technology for operations. TRB has a number ofcommittees that each of us could inform at their meet-ings. I am a member of the TRB Committee on FreewayOperations, and I will inform them of remote sensing. Ihope that you will also spread the word.
We need to continue to move beyond planning. Lastyear, the meeting’s focus was on planning. This year therewere many applications dealing with operations, such aslifeline disruptions, evacuation planning, airports, andflows. The gap has been reduced from last year.
Let me summarize the strengths, weaknesses, oppor-tunities, and threats. A strength has been reduction in thegap between technology and applications presented atthis meeting. Some of the weaknesses are that we maynot be measuring the right things or applying technologythe right way. The opportunities are there. Let’s gobeyond planning and address operations. The threats arethe nay-sayers that say we can’t do that. We need tothink outside of the box and continue to make great
58 REMOTE SENSING FOR TRANSPORTATION 2001
53864_TRB_p59_72 8/25/03 3:12 PM Page 58
strides similar to those we made since last year. I amlooking forward to the great strides that we will makebefore next year’s meeting.
Michael R. Thomas
I’m Mike Thomas from NASA. I would like to make acouple of observations. One is I am a NASA person,and NASA is interested in the Earth as a planet. Typ-
ically we look at really big things. We look at planet-sizethings like the global climate change, which NASA isinterested in, and the circulation patterns of oceans.
When we look at the land, generally we are looking athow large-scale human activities are going to affect cli-mate or weather. Are we causing it to rain more in oneplace and not in another, or are we causing the weatherto warm up?—questions like that.
Therefore, the conventional wisdom was that NASAwas interested in very-low-resolution images of the Earth,a scale that would not be applicable to an agency like aDOT that wants typically very-high-resolution images. Acouple of years ago Congress set aside $50 million forNASA to buy commercial data. This was done primarilyat the urging of commercial data providers for usingcommercial data from remote sensing for the earth sci-ence community. What happened? People beat a path toour door. We couldn’t get enough information, and wecouldn’t get it out to the earth scientists quickly enough.They found from the data that anomalies that cannot beexplained with kilometer-size data can be explained ifyou can see into the kilometer-sized data and figure outwhat exactly is going on in that higher-resolution data.Now, IKONUS 1-m size data are being used by the earthscience community a lot. The models that we use to cal-ibrate and program at the 1-km level, we are finding, per-form much more accurately with higher-resolution data.Now we are running up against the model’s ability to takein these data at these scales and perform, because thecomputation complexity goes up so much when the reso-lution of the data is so much higher—but then the prod-uct is so much better.
From NASA’s point of view, it looks like we willprobably, and this is a prediction, continue to be inter-ested in higher- and higher-resolution earth remote sens-ing data. I believe that with the advent of Quick Bird II,the new satellite that has just been launched with 6-mresolution, NASA scientists will take all they can get.
It remains true that NASA is interested in things thatthe general public probably is never going to be inter-ested in, like atmospheric chemistry, for which there is avery small customer community. I believe NASA willcontinue to build satellites, collect that kind of data, andmake them available to the science community, but the
land observations are probably going over into the pub-lic domain. Probably NASA is going to buy data overland areas from commercial providers, rather than putup its own satellites as it did in the past.
Now, because of these changes, we are doing some-thing at the Stennis Space Center that we would not havedone a number of years ago. We are very interested inunderstanding the sensors that are providing this landdata. We are building a calibration range at the StennisSpace Center for commercial instruments. One need weperceive in the growing remote sensing industry is forsome way of characterizing instruments so that the datathey produce are comparable. Different vendors sell dif-ferent kinds of instruments. Light detection and ranging(LIDAR) is a good example. The performance of thoseinstruments is, by no means, the same. Depending on howthe company providing the LIDAR uses it and how itprocesses the data, the results could be quite different fromthe results you would get if you hired another company.The U.S. Geological Survey (USGS) for years has per-formed certification of aerial cameras. USGS and NASAare entering into an arrangement whereby NASA will helpUSGS in understanding new instruments as they come online and the characterization of those instruments, andUSGS can continue in its role as a certifier of those instru-ments. I think this will be valuable to the industry. We arevery excited about it at Stennis. Working with USGS, weare starting a LIDAR calibration range and a digital cam-era calibration range. As new instruments become popu-lar and as the commercial demand for data from thoseinstruments grows, we will probably upgrade our facilitiesto be able to characterize those instruments.
This leads me to another future area. I believe NASA,as an agency, is probably going to become much moreinterested in active sensing. Right now, the camera sys-tems, even in the visible range and also hyperspectral andmultispectral, all use illumination from the sun. The sun isa great source of illumination, but we only have it for cer-tain hours of the day. Also, it does not illuminate thingsvery well under clouds, and when we are flying we don’tsee well through the clouds. We are becoming more inter-ested in how we can design sensors that provide their ownsource of light, a source of energy, because we can controlthat source. We can understand it. With a LIDAR, whenwe send a pulse out, we know what the beam compositionis, so we know how to interpret the response much betterthan we do when we just use sunlight.
We are very interested in what new kinds of sensordesigns and new kinds of processing can be done withLIDAR, with synthetic aperture radar, and others. I pre-dict NASA will make more of an investment in under-standing that end of the technology as time goes on. Aswe get results there, we want to work together with theuser community, the DOTs, and others, to understandwhat those new sensors can do for that operational
STATE OF REMOTE SENSING IN TRANSPORTATION 59
53864_TRB_p59_72 8/25/03 3:12 PM Page 59
community. I go back to the previous speaker’s saying,“Let’s understand the question before we apply a sensorto a particular problem. Let’s understand what we aretrying to figure out here and make sure we have the rightsensor for the right job.”
In comparing this year with last year, I also havenoticed a big difference. The projects this year are veryapplications-oriented. They are very understandable bythe applications community. I agree that it is time to takethe next step, which is to get the operational communitymuch more involved now. We are ready for prime timein some areas, and we need to remind ourselves that peo-ple don’t buy technology—people buy products. Whatdo we have to do now to make a product routinely, oper-ationally available? It is not enough to show that some-thing works. Somebody has to buy it. It reminds me ofthe early days in the Defense Department when I wasflogging new high-tech products. The worst thing thatwould happen was that after giving a demonstration,some general would stand up and say, “I want 10 ofthose, so where do I go to get them?” You would have tosay, “Well, General, there is only one and it takes eightPh.Ds.” That was it. Everybody left the room, and youwere done. I don’t think we want to create the expecta-tion that all of these technologies are ready for adoptioninstantly unless, in fact, they are, unless we have some-body in the back of the room who is writing orders. Weshould be careful about saying this is ready for you tobuy, you can have one in Iowa, and you can use it tomor-row. I guess that is my only caution.
James R. Plasker
Ithought I would go down the list of questions withjust a few bullets on each one. I wasn’t here last year,and therefore I don’t have the benefit of the compar-
ison from year to year. I’m also somewhat sensitive to theconservative nature of the transportation industry. AsYogi Bear says, “When you come to a fork in the road,take the fork.” I took my fork. The fork was, after abachelor’s degree in civil engineering, to go to a highwaydepartment and do a good job there, or to go on toschool and end up in surveying and mapping. I came veryclose to be sitting in the other chair, so I think I under-stand a little bit of that conservative nature.
On the strengths of the technology, you can make along list. I have a limited subset, and since I am sixth orseventh on the panel, a number of these points havealready been made. Some could argue whether they arestrengths now or strengths eventually to be realized.Clearly, some remote sensing technologies facilitate orcould, if we used them properly, real-time acquisition.You can’t do that from a satellite, but that doesn’t mean
you couldn’t do it from an uninhabited aerial vehicle(UAV). It doesn’t mean you couldn’t do it from a pole-mounted video camera, and an analog return might havemade it more complicated in the past, but all that is dig-ital now. Taking time-sequenced images from a pole andusing them in an analysis situation certainly would facil-itate real-time acquisition.
The point was made earlier that the incremental datacost is near zero, and I think that is a real advantage ofmost of this technology, but in real time. Once the poleis up with the camera and the processes are in place touse it, the data themselves are nearly free. The process-ing of the data may not be, depending on how manyhumans need to be involved in that process, but the dataare very cheap.
Another tremendous advantage of remote sensingdata is that you have the ability, if you need it and cantake advantage of it, to have a synoptic view or synopticacquisition. You can look at a large area and get a snap-shot nearly instantaneously or certainly over a shortperiod of time and a lot quicker than you could if you ranaround in a vehicle all over a state trying to collect thesame kind of information on the ground. You may notneed the synoptic view, but if you do and if that can ben-efit you, that is an advantage of remote sensing. You canalso hone in on a particular area. In fact, you could usethe synoptic view to determine what specific phenome-non you’re trying to pick up.
Another area that seems to me to be a real strength isthat remote sensing is nonintrusive. We know aboutpolice deaths on the highways and the accidents thatoccur on the highways. Survey crews and other road-monitoring personnel are also out on the highway. Safetyand efficiency in the data collection itself are a factor. Idon’t think the numbers of deaths is anywhere as withthe police, but there is a safety and efficiency issue.
A comment was made earlier about needing much bet-ter than the 3-m elevation accuracy. LIDAR gives lessthan half a meter. In fact, I think the mega–pilot projectin North Carolina is showing us that probably betterthan one-quarter-meter accuracy is possible, at least inrelatively open terrain. Most highway surfaces are rela-tively open, or at least are here and there, even if thereare tree-lined roads.
Weaknesses. Currently, the ability, except for theexamples I gave earlier, to do any-time, anywhere sens-ing is limited, but where it does exist, that is a strength.To the extent that you need information and you can’thave it, that is obviously a weakness.
To extract information from data takes an effort. Ittakes probably human intellect, and probably humantime, because most of the time you can’t “can” all thehuman intellect and put it into the software. A cost andvalue issue exists, and that is currently a weakness. Thesmarter we can make the software, the more we can
60 REMOTE SENSING FOR TRANSPORTATION 2001
53864_TRB_p59_72 8/25/03 3:12 PM Page 60

“can” the human intellect into the process, and the lessthat would be a weakness. But, it is a weakness.
If you’re looking at satellite-based data, there are chal-lenges that relate to the duration on scene. A satellitecomes by only for a short while, so you are only going toget information at limited times. The satellite can’t loiter;that is the “Enemy of the State” problem. It also onlycomes by every so often, every few days or whatever. Thesatellite is also weather-challenged; the panchromaticand multispectral high-resolution satellites we have rightnow are weather-challenged. If it is cloudy, they aren’tgoing to see it. Those are weaknesses.
Where are the technical opportunities? That is anintriguing one. I alluded earlier to my experience in thedigital orthophoto arena. We looked at trends. If youlook at trends or look where people are likely to go nextand if there is any potential for pay-off in those areas, thatmight be an area to concentrate on. In my mind, the warright now is demonstrating a tremendous advancement inthe UAV. They are now sufficiently large and deployablethat they can be used for bombing. There is talk nowabout having pilotless fighter aircraft—taking the humanout of the cockpit totally. That means that there is a lotof investment in this. I suspect if a trend is to capitalize ondual use, the UAV is a great potential area to capitalizeon dual use. We are going to see more and more oppor-tunities to take advantage of that from a commercialstandpoint. I would suggest then that if there is real valuein real-time monitoring and it takes a UAV to do it, thenthat might be an area to watch for opportunities, becausethe trend is probably in the right direction.
The recent emphasis on security is pointing up theneed for data integration, data fusion, and data visual-ization. I expect there will be a significant increase ininvestment in those areas driven by homeland securityand by the Defense Department side of things. As thatinvestment occurs, we might as well look for opportuni-ties to take advantage of it.
Another trend area is LIDAR. I think we are withLIDAR about where we were with digital orthos in about1990. We had proven technology. We had done somepilot projects. We were hamstrung by capacity of disksand media. The CD-ROM hadn’t been invented yet, or ifit had, it hadn’t been deployed yet. Horsepower in work-stations was getting there but was not there yet. It was aluxury to have digital orthorectified quarter quadrangles(DOQQs), and in fact, initially, the federal governmentwas the only one making them. Over time, all of thosetrends led us to the point that today there is hardly a stategovernment, maybe hardly a DOT or local government,that does not have DOQQs readily available. I suspectthat the operating word is that when you start to plansomething, you need an image base, and that is theDOQQ. We have gone, in a decade, from barely beingable to do it technologically, to expecting it and having it
be almost ubiquitous. My sense is that LIDAR and otherterrain measurements and the visualization supported bythem are in the same situation today as DOQQs then, oreven slightly ahead, primarily because of what I think ofas a mega–pilot project that North Carolina elected tomove forward with. In looking at trends, that is a goodone to follow, because I would expect the commercial-ization and the deployment are going to be very quick.
Another technical opportunity came up yesterdaywhen I asked about the cell phone and the traffic flowand the centerline positioning. Several people later saidessentially the same technology is being put in baggagecontainers and being tracked around in planes and evenbeing put on planes to monitor plane movements. I’mnot sure that is a remote sensing technology. It is not aclassic remote sensing technology, but it is a technologythat might bring some opportunity.
Photo radar is another opportunity. I don’t know ifyou know the District [of Columbia] has implementedphoto radar. What they did was to arrange five policecars with a photographic radar system. Instead of writ-ing tickets, they just sit there and collect images and theycan write the tickets by computer. At some point, theycollected so many tickets that the estimate was that 75%of the people driving down the road were speeding. Fromwhat little I remember from 30 years ago in transporta-tion engineering, I believe that may mean that somethingis wrong either with the speed limit or with the design ofthe road. Generally speaking though, the human popu-lation tends to obey legitimate signage in transportationsystems as a group, not as individuals. Maybe there areother ways to think out of the box and, in the traffic engi-neering area, get the information from some other means.For example, a photo radar system today is primarily apolice enforcement tool.
Policies. What policies are going to affect remote sens-ing? There is a mantra in real estate that says, if you wantto watch real estate investments, it is location, location,and location. Those are the three factors. I think in thisarena today, and maybe we’re still too close to 9/11, butI think it is security, security, and security. I’ll give youtwo examples. There is a significant emphasis now oninfrastructure security, which will cause a lot of resourcesto be put into that in both human capital and funding.That is going to cut both ways. It is going to create agreater demand for geo-based information and for man-aging it, keeping track of it, and addressing it in times ofcrisis. There is going to be a greater demand for geo-based information. On the other hand, it is probablygoing to create additional restrictions on what can beshared, what can be put into the public domain, and howwell that geo-based data can be made available. Infra-structure security is going to have an effect.
They are also talking now about having positive con-trol of certain modes. The first one is having the ability
STATE OF REMOTE SENSING IN TRANSPORTATION 61
53864_TRB_p59_72 8/25/03 3:12 PM Page 61

to take over control of the aircraft and bring it down, ina situation that might be like what we experienced on9/11, or of requiring certain kinds of materials to betransported with a positive control device attached.Again, that is more of a GPS technology application per-haps, but certainly keeping track of things is a geo-basedfunction.
What are the threats? The limits on easy access todata, the public sharing of data, and the convenient shar-ing even amongst agencies of data are threats. I think tothe extent that we let the security drive us away fromsharing, that creates a threat. There may be some waysaround that, but that is certainly going to threaten one ofthe characteristics of our society. The applications thatuse geo-based information, and there is a tremendousamount of it out there, pretty much freely share, withlicensing being separate from that.
The other threat is, again I don’t want to be criticalas I could just as easily be sitting in one of those DOTs,internal within the organizations, and it is the risk-averse nature of transportation organizations. That isunderstandable. I would probably characterize myselfthat way. I would be surprised if every DOT doesn’t havea group or a small group, and in some cases it might belarge, of folks that are pretty savvy in geospatial tech-nologies. Many DOTs had photogrammetric depart-ments, although I understand over time some of that haschanged. Many of them may have other kinds of capa-bilities as well. I lived for 26 years in a very large bureau-cracy and very often the left hand didn’t know what theright hand was doing. One of the questions I would haveis, Is there sufficient communication going on, evenwithin the departments themselves or within the indus-try itself?
For instance, the American Society for Photogramme-try and Remote Sensing has a very strong transportationsurveys committee that has been meeting for years andyears. It has a long list of participants, all from DOTs.There is expertise out there, and perhaps in some areas,we are not talking about early adoption, but we are talk-ing about adopting in a different area the same technol-ogy that has served well in other areas.
John R. Jensen
Iam the last speaker in the last session of the last dayof the conference. Thank you for asking me to par-ticipate. I was generally impressed with the breadth of
the use of remote sensing technology in transportation-related studies and the understanding of how to use itcorrectly. I witnessed some excellent use of more advancedhyperspectral, LIDAR, interferometric synthetic aper-ture radar (IFSAR), and soft-copy photogrammetric tech-
niques. I believe that we will see a significant increase inthe use of LIDAR technology for the derivation of detaileddigital elevation models for the calculation of elevation,slope, and aspect. In addition, many transportation ap-plications discussed require very high spatial resolutioninfrastructure information and about the only way toobtain it is by using soft-copy photogrammetric tech-niques applied to large-scale analog or digital imagery. Wemust not neglect this important area of remote sensingdata collection and analysis, which is of significant valueto transportation studies.
I was pleased to see that scientists in the consortia hada genuine interest in trying to determine the optimumsensor system configuration and image analysis processto apply to particular problems of information extrac-tion. They were not trying to force one remote sensingmodel or data type (e.g., Landsat Thematic Mapper data)to fit all problems.
However, it is interesting to note that most of thetransportation-related remote sensing projects functionedreasonably well with uncalibrated remote sensor data,e.g., optical data were not transformed into percent re-flectance, which allows multiple date comparisons to bemade. In the future, more attention should be given tothe atmospheric and radiometric calibration of the re-mote sensor data, especially if the data are to be used tomonitor the biophysical characteristics of phenomenathrough time.
I believe we will see significant improvement in the col-lection and processing of digital data obtained from UAVsand terrestrial video remote sensing systems mounted onbuildings and towers. I witnessed many important trans-portation-related problems that could be solved by theextremely efficient processing of real-time video remotelysensed data to identify vehicle location, velocity, direc-tion, etc. This will require investment in specializedimage-processing hardware and development of opti-mized software. Then the real-time change or velocityinformation should be fed into an automated decisionsupport system that makes appropriate decisions. Remotesensor data collected from UAVs will become increasinglyimportant. Additional effort should be directed to thisimportant topic.
Remote sensing–derived information and other spa-tial information are placed in geographic informationsystem (GIS) databases. Such information only realizesits full potential when processed using a carefully con-ceived decision support system (actually an expert sys-tem) that can be utilized to answer important trans-portation problems. The procedures developed by theconsortia may eventually be judged by whether or notthey perform a valuable function in a practical decisionsupport system. It is recognized that the development oftransportation-related decision support systems is still inits infancy.
62 REMOTE SENSING FOR TRANSPORTATION 2001
53864_TRB_p59_72 8/25/03 3:12 PM Page 62

Proposed transportation projects often require a wet-lands inventory based on vegetation, hydrology, andsoils information. Currently, jurisdictional wetlands canonly be identified by ground observation. This is notsurprising since most wetland remote sensing studiesrely almost solely on multispectral data. They rarely utilize thermal infrared, active microwave (multiplefrequency and polarization), or passive microwave tech-niques to assess soil moisture (a hydrologic parameter).Additional basic and applied research is required todetermine what information these remote sensing sys-tems can contribute to the eventual delineation of juris-dictional wetlands. In 5 to 10 years I believe it will bepossible to perform jurisdictional wetlands mappingwith specialized, multitemporal remote sensing systems.Perhaps we could arrive at this capability sooner withadditional attention given to the wetlands remote sens-ing problem.
Transportation systems impact flora and fauna, butadditional research should determine what types of indi-cators may be derived from remotely sensed data to predicthuman quality of life impacted by proposed transportationsystems. People often perceive that it is undesirable to livenearby certain types of transportation systems and infra-structure. Research should begin to incorporate remotelysensed information on land use and land cover as well as
demographic and cultural information to predict the po-tential loss of quality of living in certain areas. The morethat a transportation planner can demonstrate that he orshe has minimized the impact on a community’s quality oflife, the better.
I am very concerned about remote sensing and GISworkforce development. Who is going to conduct theremote sensing–related tasks within the DOTs? Will theremote sensing work be performed by people in the DOT,be completely outsourced, or be done by a combinationof both? If the remote sensing–related studies are con-ducted by an in-house capability, it is not clear where theworkforce will be educated or what their qualificationsshould be (e.g., formal academic degrees, certification,registration). If the remote sensing–related studies areoutsourced, the DOTs will still need people who under-stand enough about remote sensing to (a) write the proj-ect specifications and (b) judge the quality and accuracyof the remote sensing–derived information.
The academic educational system cannot graduate thenumber of persons qualified to conduct the remote sens-ing–related research required by many of the transporta-tion applications demonstrated at this conference. K-12remote sensing education is almost completely absent.
Thank you for asking me to participate on the panel.This concludes my remarks.
STATE OF REMOTE SENSING IN TRANSPORTATION 63
53864_TRB_p59_72 8/25/03 3:12 PM Page 63

53864_TRB_p59_72 8/25/03 3:12 PM Page 64

APPENDIX A
Summary of Roundtable for States andMetropolitan Planning Organizations
65
Prior to the 2001 Transportation Research BoardConference on Remote Sensing and Spatial Tech-nologies for Transportation, the Steering Commit-
tee for the Conference sponsored a Roundtable for Statesand Metropolitan Planning Organizations (MPOs).
The roundtable was an opportunity for transportationorganization staff to share experiences and strategies inthe use of remote sensing. Topics included current pro-grams and funding, new initiatives, successful strategies,and partnerships and barriers. Representatives from thestate departments of transportation (DOTs) in attendancewere asked to make short presentations and prepare ashort paper on their current program for remote sensingand spatial technologies. Summaries of these papers areattached to this report.
David M. Gorg of Minnesota DOT, Roger Petzold ofthe Federal Highway Administration, and Val Noronhaof the University of California, Santa Barbara, organizedthe session. In the organizers’ introductory remarks, thefollowing points were made:
• Interest in remote sensing is high because the numberof tools available is increasing and the cost is decreasing.
• The American Association of State Highway Officials(AASHTO) has a new task force on spatial information.
• All four university consortia in the National Con-sortium on Remote Sensing Technology (NCRST) arepreparing guidebooks for DOTs and MPOs on the use ofremote sensing in aspects of transportation.
• The four university consortia funded by the Researchand Special Programs Administration (RSPA) of the U.S.Department of Transportation (USDOT) are in Year 2 ofthe 4-year research program. The results were presented
at the full conference and are available directly from theconsortia.
• Representatives of three state DOTs—Minnesota,Iowa, and Wisconsin—met in August 2001 to share expe-riences. The exchange was very successful and identifieda number of joint concerns, including vendor contracting,data ownership (licensing), common specifications, com-puter server and network capacity problems, enterprisebuy-in to remote sensing, and data sharing within theorganization.
STATE DOT PRESENTATIONS
Representatives of 15 state DOTs were present at theroundtable, and 14 gave presentations and prepared shortsummaries of their programs. Copies of the state paperscan be found at the University of California, Santa Bar-bara, NCRST website, www.ncgia.ucsb.edu/ncrst, underMeetings. In alphabetical order, the states represented atthe roundtable were
1. Arkansas2. California (no presentation)3. Florida4. Iowa5. Kansas6. Maine7. Maryland8. Massachusetts9. Minnesota
10. North Carolina11. Oklahoma
53864_TRB_p73_86 8/25/03 3:12 PM Page 65

12. Pennsylvania13. Utah14. Virginia15. Washington
From the 14 state presentations and the subsequentdiscussions, a number of topics were raised to focus thediscussion:
• State of the practice of remote sensing and spatialtechnologies,
• New initiatives,• Types of partnerships evolving with states and others,• Barriers to implementing remote sensing, and• Issues for further discussion and research.
State of the Practice of Remote Sensing and Spatial Technologies
Digital photogrammetry, geographic information systems(GIS), and the Global Positioning System (GPS) representthe state of the practice in state transportation agencies.Only one state (Virginia) reported on the integration ofremote sensing [light detection and ranging (LIDAR)] intoeveryday activities. Six states have some ongoing activitiesrelated to LIDAR, and three states have projects involvingsatellite imagery (IKONOS and Landsat7).
New Initiatives
Experimentation at the state level is common. A total of29 new initiatives are included in the state write-ups. Asmentioned, six involve LIDAR, and three involve satel-lite imagery. Many of the new initiatives are taken incoordination or partnership with other agencies. Internalnew initiatives are generally in the areas of data sharingand data accessibility.
Types of Partnerships Evolving with States and Others
One of the major drivers in the progression of new tech-nologies is partnerships. Different types of partnershipswere mentioned, including partnerships of
• State and county or counties,• State interagency or statewide agencies,• State and federal agencies,• State and university,• State and private sector data providers and utilities,
and• Combinations of the above.
Barriers to Implementing Remote Sensing
The following were identified as barriers to implementa-tion of remote sensing technologies in state DOTS:
• Funding, including budget and staff reductions—the most frequently mentioned barrier;
• Time pressures to produce work on a known sched-ule and lack of time to investigate new ideas;
• Lack of agreement on common formats;• Lack of understanding and buy-in from staff and
top management;• Data size, data sharing, and data retention related
to server and network capability; and• Licensing.
Issues for Further Discussion and Research
Marketing
Documenting and marketing successful applications ofremote sensing information are needed. A number ofpossible venues were suggested for this, including statetransportation conferences, state GIS conferences, andregional meetings between state DOTs and user groups.Marketing should be designed for three audiences: users,practitioners, and policy makers.
Accuracy
There is a need to sit down with the ultimate users ofinformation to determine the level of accuracy requiredand to match the required level to the most cost-effectivemethod of data collection. There is a sense that the cur-rent accuracy requirements are more traditional and notbased on detailed trade-off analyses (trading of accuracyfor advantages of time and cost).
Partnerships
Most of the successful projects involving remote sensinghave come through some kind of partnership. States needto continue to explore partnership arrangements with avariety of different groups.
Time Pressure
The pressure faced by states to reduce the time from plan-ning to construction is both a barrier and an opportunity.It is a barrier, because the photogrammetry sections areunder time pressures to produce products with knownaccuracy on a predictable time schedule, leaving little timefor experimentation. States do not have time to make mis-takes. It is an opportunity, because if it can be shown that
66 REMOTE SENSING FOR TRANSPORTATION 2001
53864_TRB_p73_86 8/25/03 3:12 PM Page 66

remote sensing can speed up the project delivery schedule,agencies would be willing to invest in the technology.
Measuring Benefits
There is a need for good information on the accuracy andbenefits of using remote sensing data in the project devel-opment process. Several side-by-side comparisons areunder way that will help provide this needed information.
Private Vendors
Several vendors are proposing complete data packageswith remote sensing techniques. States need help in eval-uating these proposals and need to share information ontheir use.
Remote Sensing Applications
To date, the use of remote sensing information in stateDOTs has been limited to right-of-way appraisal and ac-quisition, wetlands mapping, preliminary design, and de-tail design.
Data Sharing, Data Integration, and Data Fusion
Experience is showing that remote sensing informationis usually not stand-alone information. It must be fusedwith other data to both calibrate and complete the dataset. This raises a number of compatibility issues, includ-ing for multiple data, multiple projections, and docu-mentation (metadata).
Intermodal and Multimodal
To date, most of the reported development of remote sens-ing applications has been in the highway project develop-ment process. A number of desirable applications could bepursued in the intermodal and multimodal arena.
Funding for Remote Sensing
Funding is an issue raised by most states in their reports.Since most funding for remote sensing information cur-rently comes from project sources, there is a concern thatthe use and needs for other transportation purposes are notbeing considered. Planning and MPO needs were examplescited. Remote sensing information may also be valuablefor facilities management as well as for facility design.
Regulatory Agencies
There is a concern that regulatory agencies may not acceptinformation coming from remote sensing sources.
National Security
The events of September 11, 2001, have changed the bal-ance between the privacy of information and the desire todevelop information databases that can be readily shared.No one can currently predict where the balancing pointwill ultimately rest. Again, this issue can be both an oppor-tunity and a barrier for remote sensing.
Utilities
States have a number of issues when dealing with utilitieson remote sensing projects, including accuracy and lia-bility. Georgia appears to have developed a cooperativeprogram with its utility.
Staffing
Most states have problems training staff in new tech-niques and retaining the staff. Many states are outsourc-ing data collection, and existing staff need training incontract specifications and contract management.
Computer Networks
Issues arise on the capacity and speed of servers and net-works in handling the large amounts of data that comefrom remote sensing sources. Dealing with these issuesmust be part of the equation when considering using re-mote sensing data.
NEXT STEPS
In the summary of the meeting next steps were suggestedfor states to take on remote sensing, which included thefollowing:
1. Continue to look for partnerships and continue toparticipate in the current RSPA research effort with theuniversity consortia.
2. Use the new AASHTO task force on spatial infor-mation and the existing Transportation Research Board(TRB) committees to share information and advance thestate of the art.
3. Pursue pooled-funded studies through AASHTO.4. Conduct additional regional meetings similar to
the one held this summer among Minnesota, Iowa, andWisconsin.
5. Create a website and discussion forum.6. As part of the 2003 reauthorization of the Trans-
portation Equity Act for the 21st Century (TEA21), en-sure that remote sensing is sanctioned and that fundingis provided for demonstrations and other activities toadvance the state of the practice.
SUMMARY OF ROUNDTABLE FOR STATES 67
53864_TRB_p73_86 8/25/03 3:12 PM Page 67
STATE PRESENTATION SUMMARIES
Arkansas
Kit Carson, Surveys, Arkansas Highway and Transportation [email protected]
The following is a brief overview of the use ofremote sensing and spatial information by theArkansas Highway and Transportation Depart-
ment (AHTD). Also included is information related toefforts by other state government agencies as it pertainsto AHTD.
Current Programs and Funding
AHTD funds• Photogrammetry; and• GPS with extensive use of both static and real-time
kinematic (RTK)–Continuously operating reference stations (CORS)
•• Three AHTD, and•• 5 min. additional scheduled; and
–One cooperative National Geodetic Survey (NGS).
State agencies with county government participation fundthe development of a statewide GIS that is accessible onthe web with spatial data that includes aerial photog-raphy, geology, soils, cadastral, census, centerlines, criti-cal infrastructure, geodetic control, government unites,hydrography, land use and land cover, digital ortho-imagery, the Public Land Survey System, telecommunica-tions, transportation, and vertical control.
New Initiatives
The State of Arkansas is implementing GIS. This isupgrading of positional accuracy roadway centerlines forthe GIS base maps. This has been requested by utilitylocators (Arkansas OneCall) so they can better determinethe location of a specific utility. The desired precision is±5 ft. However, survey-grade RTK (GPS) is not consid-ered practical. A pilot project is under development usingdigital orthorectified quarter quadrangles (DOQQs) todigitize positions; ground truth with some level of GPS;and warping of other existing mapping data produced byAHTD to that map.
AHTD is scanning AHTD aerial photography andmaking it available on the state GIS website.
Strategies
• Centerline accuracy upgrade. Public and privateteams can perform the testing and develop an implemen-tation plan from the results, if the upgrade is successful.
• Implementation teams. Participation in the federal I-Team Initiative addresses the institutional and finan-cial barriers to the development of the National SpatialData Infrastructure (NSDI). It aims to offer a coherentset of institutional and financial incentives to make iteasy for all levels of government and the private sectorto collaborate in the building of the next-generation frame-work data.
Partnerships
AHTD is outsourcing county mapping aerial photography.
Barriers
Barriers to using remote sensing technology in Arkansasare
• Funding,• Staffing,• Time,• Involvement of multiple disciplines with multiple
formats and reaching agreement on the ultimate formatdisplayed,
• Time and staff for investigating newer remote sens-ing techniques such as LIDAR,
• User issues,• Data accessibility, and• Proper usage of data.
Florida
Russell G. Daly, Florida Department of [email protected]
Current Programs and Initiatives
1. State aerial photography and photogrammetricmapping program
2. County general highway mapping (mapping of landuse and land cover has been eliminated)
3. Generation of spatially correlated multipurpose andseamless GIS base maps for Florida research project,with airborne laser swath mapping (ALSM) and auto-matic data processing (ADP)
4. GPS statewide network
68 REMOTE SENSING FOR TRANSPORTATION 2001
53864_TRB_p73_86 8/25/03 3:12 PM Page 68

Funding for Remote Sensing and Spatial Information
1. Federal, state—approximately $2 million2. Federal Highway Administration (FHWA)—approx-
imately $0.5 million for county mapping3. State—$10.5 million under a 5-year contract started
in 19994. State—$3.7 million, originally for a 5-year project
started in 1997
New Initiatives and Drivers
1. Digital photography and digital photogrammetricmapping program driven by technology changes and dig-ital product demand
2. Improvement of digital county-mapping processesdriven by internal management
3. Evaluation of remote sensing tools and technologyfor applicability and business decisions
4. None5. RCI program improvement initiative
Successful Strategies
1. Photography and county mapping program cost–benefit study completed June 2001
2. Outsourcing of county map field verificationactivities
3. To be determined (TBD)4. TBD5. TBD
Partnerships
• FHWA, NGS, National Oceanographic Associationof America (NOAA), National Weather Service (NWS),and the Federal Aviation Administration
• Florida Department of Environmental Protection,Florida Department of Revenue, Florida DOT, FloridaDepartment of Management Services, and other stateand local agencies
• University of Florida
Barriers to Implementation
• Budget cuts and staff reductions• Lack of remote sensing technology marketing within
the Florida DOT• Buy-in from key internal customers and executive
management• Lack of education• User issues
–Unfamiliarity with remote sensing tools and tech-nology–Data usability, accuracy, and timeliness issues–Cost
Anita Pauline Vandervalk, TransportationStatistics Office, Florida Department of [email protected]
The Florida DOT has several ongoing initiativesrelated to the use of remote sensing to improvebusiness processes. This report summarizes the ac-
tivities surrounding improvement of the collection of trans-portation data. It will discuss an overall statewide effortand several pilot projects that support the goal of improv-ing the accuracy of transportation roadway feature data.
Roadway feature and characteristic data are collected inseveral areas of the department to support critical projectdevelopment and operations management functions. Ex-amples of these types of data include traffic lane width,pavement condition, traffic signs, and shoulder types. Mostof these data are currently collected in the field, and theiruseful accuracy is relative to their application. The accuracyis acceptable for some preliminary design work, mainte-nance, planning, and traffic operations uses, but not suf-ficient for roadway design or survey work. At the sametime, aerial photography is being flown for several pur-poses across the state, and the potential for redundancyin this effort is great. Therefore, the Planning group andSurvey and Mapping group joined together to establish atask team. The mission is to investigate the potential forcollecting data in the planning stages at an accuracy levelsuitable for preliminary design work. Other benefits in-clude more accurate and easier-to-collect data for mainte-nance operations as well as the ability to improve GIS basemaps through accurate centerline extraction. The benefitsof the overall effort include improved data integration,reduced redundancies in data collection, safer data collec-tion, wider use of data, and therefore increased efficiencyin production and potential long-term cost savings.
The intent of the task team is to make recommenda-tions to executive management on how remote sensingshould be used to collect data in the planning area. Thiswill expand to be applicable also to data collection inmaintenance, traffic operations, and safety offices. Themain activities of the task team are
1. Investigation of issues such as data accuracy needs.This is being accomplished by working closely with datacustomers such as environment, project development,and design engineers.
2. Investigation of the need for a system to store andprovide access to all potential aerial photography andassociated data.
SUMMARY OF ROUNDTABLE FOR STATES 69
53864_TRB_p73_86 8/25/03 3:12 PM Page 69
3. Management of several statewide pilots. Data arecollected at the district level, so district involvement inthe investigation of methods is critical. Several districtpilots have started that involve developing applicationsto extract feature data from existing aerial photogra-phy. The most noteworthy pilot started before theinvolvement of the central office, in the district thatcomprises 16 counties in the Florida panhandle. Theycurrently use remote sensing (2000-ft aerial photogra-phy, color film, x, y, z specification accuracy not greaterthan 6 in., and 3.4-in. resolution) to collect 31 roadwayinventory office and field features—all from a desktopPC in stereo (three-dimensional–x, y, z) mode. Video-logs are also integrated with the software tools. Theyhave linked their linear referencing system (mileposts)with the GPS coordinate system (x, y, z), and they pro-duce an accurate centerline that accommodates the ver-tical and horizontal undulations of the roadway. Theaccuracy of the field features is anywhere from 2 to 6 in.in x, y, z. They have also initiated a pilot program to seeif other units in the district (maintenance, construction,traffic operations, safety, design, environmental man-agement, emergency operations, production, right-of-way, public transportation, and bridge structures) canuse the data. Several units are very interested in the soft-ware tools and methodology. This pilot has been pre-sented in several statewide forums along with thestatewide task team efforts, and the concepts have beenwell received.
The department is also involved in an NCRST projectto investigate the feasibility of using commercial remotesensing technologies with GIS mobile mapping and GPSto develop accurate and comprehensive databases ofroadway features and characteristics. The project willmake recommendations on the cost–benefit applicable toFlorida’s data collection process. It will also make rec-ommendations applicable to other states.
All the above work will be completed next year. It willallow the Florida DOT to successfully move ahead andbegin incorporating new standards for data collectionbased on remote sensing technologies.
Iowa
Ian MacGillivray, Iowa Department of [email protected]
The Iowa DOT has several remote sensing projectsunder way. The projects include initiatives to ob-tain, distribute, and analyze remotely sensed data.
Other remote sensing projects that the Iowa DOT hasbeen involved with are also included in this summary.
Internal Initiatives
LIDAR
The Photogrammetry Section acquired LIDAR data fora project on US-30 in Linn, Cedar, and Clinton Counties,from the Lisbon Bypass to the city of DeWitt. The proj-ect includes seven bypass areas. The corridor covered 26 mi2 across hilly terrain. LIDAR data was acquired toevaluate the potential benefits of this technologythroughout the highway corridor development process.The LIDAR was flown at 3,000 ft above ground in June2001. LIDAR deliverables were
• MicroStation files with 10-ft digital elevation model(DEM) generated from the LIDAR and breaklines;
• MicroStation files of the LIDAR bare ground DEMsthat were generated from raw LIDAR data modified bysoftware to remove the vegetation canopy; and
• American Standard Code for Information Inter-change (ASCII) files containing bare ground LIDAR datathat were generated from raw LIDAR data modified bysoftware to remove the vegetation canopy.
The intent is to use this information to evaluate vari-ous alignments and establish a final alignment along the45-mi corridor. The selected alignment will be reflown at2,000 ft, and detailed photogrammetric and field surveyinformation will be added to the LIDAR data for the finaldesign phases. The Iowa DOT will compare the LIDARand photogrammetric products.
Image Cataloging Web System
The Iowa DOT is acquiring a large amount of digitalaerial photography for planning and engineering. Oftenthe same imagery was obtained by different parts of thedepartment and was redundantly stored on departmentcomputer systems. The Iowa DOT developed a system,under the guidance of its Aerial and Satellite ImageryTask Force, to acquire, catalog, and distribute aerialphotography. The U.S. Geological Survey (USGS) DOQQand digital raster graphs (DRGs) were obtained in geo-referenced digital files in tagged image file format. Thefiles were reprojected and compressed to make themmore usable in a production environment. Each file wasthen spatially cataloged by an automated process, and aGIS-enabled web page was developed to query availableimagery. Higher-accuracy imagery from individual coun-ties and from the Iowa DOT Photogrammetry Section isalso being included in this image catalog.
Acquisition and Evaluation of IKONOS Satellite Imagery
Iowa DOT contracted with Space Imaging to obtain 1-mresolution digital imagery of a wetland mitigation bank
70 REMOTE SENSING FOR TRANSPORTATION 2001
53864_TRB_p73_86 8/25/03 3:12 PM Page 70

area. The imagery was obtained from the IKONOS satel-lite in summer 2001. The 1-m panchromatic/4-m-colorbundled product was purchased, and imagery was ob-tained in four bands: near infrared (NIR), red (R), green(G), and blue (B). The project is 700 acres in size. The planis to use the satellite imagery as a seamless overhead viewof the project area and also to perform some simpleanalyses of the project area using the spectral bands.Specifically, the presence of hydrology, wet soils, andwetland vegetation will be looked for to learn what gen-eral trends can be observed from this type of imagery.Another application of the data will be change detection.The Iowa DOT will be able to remotely monitor the siteand, along with some ground truthing, quickly determinethe changes in vegetation and hydrology over time. Thiscould produce significant cost savings over a large area.
Projects External to DOT
Acquisition of New Statewide Imagery
The Iowa Geographic Information Council Remote Sens-ing Committee, under the leadership of the Iowa Depart-ment of Natural Resources, is developing partnershipswith federal, state, and local governments and the pri-vate sector to secure funding and requirements for acqui-sition of new statewide aerial imagery. The primaryproduct will be second-generation color infrared (CIR)DOQQs that will be certified by the USGS. Additionalproducts will include panchromatic images generatedfrom the CIR image and compressed format imagery formore efficient general use with Internet and networkapplications. Funding has been secured for the project,and a contract is being negotiated. The Iowa DOT ispartnering in this process by providing funding and tech-nical support.
University of Northern Iowa
Remote sensing is one part of the University of NorthernIowa (UNI) Science center for Teaching, Outreach, andResearch on Meteorology (STORM) project. Under thisproject, UNI has provided a 2-week short course on re-mote sensing, acquired and distributed ERDAS imageryon its website (www.uni.edu/storm/), and providedother teaching, outreach, and research related to remotesensing.
Iowa State University GIS Support and Research Facility
Iowa State University (ISU), in partnership with theMassachusetts Institute of Technology and Natural Re-sources Conservation Service, developed the Iowa Geo-graphic Image Map Server. This server provides Iowa
Landsat, DOQQs, and other imagery to the public. Theserver merges image tiles and provides output to users inseveral different resolutions and formats (see ortho.gis.iastate.edu/).
DOT Research Partnerships
ISU Center for Transportation Research and Education
The ISU Center for Transportation Research and Educa-tion has worked with the Iowa DOT on several remotesensing projects. Projects include assessments of
• Aerial photography for parking and travel demandvalidation;
• Aerial photography for collecting data elements forour linear referencing system;
• Stereo video-logging imagery for identifying road-side features;
• Aerial and satellite for collecting inventory andaccess management;
• LIDAR for location studies and preliminary design;and
• LIDAR for highway safety studies, bridge and culvertflooding risk, and pavement performance evaluation.
Mississippi State University
Mississippi State University and the Iowa DOT are coop-erating in a hyperspectral remote sensing research exper-iment. The research focuses on helping to solve environ-mental issues with remotely sensed hyperspectral data. Ofparticular interest are wetland-related issues frequentlyencountered during the development of transportationcorridors.
Kansas
Brian Charles Logan, Kansas Department of [email protected]
Issue
Participation in purchase of up-to-date remotely sensedEarth imagery data.
Indication of Issue’s Existence
Imagery presently used is outdated (1991). Current, up-to-date data are needed for applications and for takingadvantage of newer technologies.
SUMMARY OF ROUNDTABLE FOR STATES 71
53864_TRB_p73_86 8/25/03 3:12 PM Page 71

Other Background Information
Examples and users of identified categories of imageryapplications include
• Analysis and evaluation—corridors and accidentlocations, and discovery phase applications—for trafficengineering, transportation planning, and design sections;
• Data validation—state system, nonstate system,and rail networks, and GPS points—for transportationplanning, design sections in coordinating and trafficengineering;
• Data capture—networks and inventories for trans-portation planning and local projects sections for designand coordinating; and
• Visualization—for public involvement and litiga-tion for public involvement and chief counsel sections.
Selection criteria for imagery purchase, all of whichaffect cost, can include
• Capture device (type of camera) and source (air-plane versus satellite);
• Spatial resolution (fineness of image detail);• Accuracy (proximity of an object in the image to its
actual location);• Age of data and update and maintenance schedule;• Type of imagery [black-and-white (B/W) versus
multispectral];• Size (area of coverage);• Storage location (data storage and serving of data
will occur at the Kansas Data Access and Support Center);• Licensure, ownership, and distribution;• Value-added services such as geocoding, orthorecti-
fication, and network digitizing; and• Cost sharing with others participating via the GIS
Policy Board.
Options
1. Use 1991 imagery data and use traditional methodsto fill data gaps.
2. Elicit Requests for Proposals from vendors (GISPolicy Board).
Recommendation
Option 2.
Fiscal Impact
Cost ranges from $1.3 million to $8.5 million. The KansasDOT share would be 50% of total cost, not to exceed$650,000 for initial purchase. The other 50% would beprovided by the GIS Policy Board and from non-Kansas
sources such as the National Aerial Photography Pro-gram (NAPP), the Natural Resources Conservation Ser-vice, and USGS.
Policy Impact
A positive impact to the Kansas DOT will be realized. Theenterprise approach provides opportunities for use of acommon, standardized data source for unified GIS devel-opment, applications, and solution building and couldyield the synergy that results from a collaborative effort.
Maine
Gary Charles Williams, Maine Department of [email protected]
In late 1999, the Maine DOT started working with theTechnology Service Corporation (TSC) in the Com-mercial Technology Applications Program in Support
of the Department of Transportation Program on Re-mote Sensing Applications in Transportation (DTRS56-00-BAA-0005). The partnership was created to investi-gate remote sensing applications that could assist MaineDOT in determining possibilities for alternative route lo-cations for new highways and also to automatically up-date road networks within the GIS system with remotelysensed information.
The primary research involves the automation of routelocation analysis and cost estimation, which are done byhighway engineers when determining corridors for newhighway location studies. The Maine DOT uses tradi-tional methods of route determination. These methodsare time-consuming and labor-intensive and involve thepossible use of USGS quad sheets, aerial photogram-metry, national wetland information, and other existingpaper and electronic data. TSC’s research involves theuse of current IKONOS imagery, USGS digital terrainelevation data (DTED), and National Land Cover Data-set information. Aerial photographs and specific usercover layers can also be incorporated into the programthat has been created. A result of the work of StevenJaroszewski and the TSC team is an astonishing programthat can automatically generate highway corridors usingthe above-mentioned layers and also generate the costestimates for constructing the highway, purchasing therights-of-way, mitigating wetlands, and building bridges.
Maine DOT provided TSC with basic informationabout the existing Brewer/Holden I-395 extension projectthat is being developed traditionally by Maine DOT andits consultants. TSC was shown the takeoff point and wastasked with providing highway alternatives that wouldeither upgrade the existing highway network or create a
72 REMOTE SENSING FOR TRANSPORTATION 2001
53864_TRB_p73_86 8/25/03 3:12 PM Page 72

new highway connecting I-395 to Route 9. During arecent presentation to the Maine DOT, TSC’s StevenJaroszewski was able to automatically generate, with thedeveloped software, highway corridors that very closelyresembled the corridors that had taken the consultantengineering firm months to develop. In addition to thecorridors, the program also generated cost estimates foreach alternative. When Maine DOT changed parametersof the base information, the program was able to createnew data within minutes. The results of this researchcould revolutionize the way highway location studies areaccomplished in the near future. Mr. Jaroszewski will bepresenting the results of the study during this TRB meet-ing with NCRST.
Maine DOT is also involved with using airborne GPSphotogrammetry for all of its new photogrammetric map-ping projects and using aerial photography layered withdesign data for presentations at public hearings. The photo-grammetry unit is working with the public hearings unitto merge USGS DTED data, detailed survey and designinformation, graphic information, and aerial photographyto create drive-through and fly-over presentations for pub-lic hearings on planned highway construction. The depart-ment has investigated the use of close-range laser surveytechnology for bridges and is looking into the potentialof close-range digital photogrammetry for bridges. Thephotogrammetry unit has begun to look toward LIDARinformation for a large project that needs only digital ter-rain data to study the hydrology.
The utilities section of Maine DOT is working on asubsurface utility engineering (SUE) pilot project to accu-rately identify the location of underground utilities. As aside benefit, they were able to verify the accuracy ofground penetrating radar (GPR) that was demonstratedwithin the limits of that same project a couple weeks ear-lier. The data are now being processed, and the referencepoints are being located by survey. Shallow gas and tele-phone lines were among the findings. In several areas, theconsultant working on the SUE pilot project showedwhere the marks provided by the utility, or its contractedlocator, were off by several feet.
Minnesota
David M. Gorg, Minnesota Department of [email protected]
Minnesota is experiencing a program spike be-cause of special funding for Inter-RegionalCorridor initiatives. In FY 2001 $3.0 million
was invested in photogrammetric products and services.It is anticipated that $2.8 million will be invested in FY2002. Internal Minnesota DOT (MN/DOT) resources
consume approximately 30% to 34% of this budget; thebalance is outsourced to private partners.
New Initiatives and Drivers
MN/DOT continues to migrate from analytical to digitalphotogrammetry. Three soft-copy workstations havebeen added to the equipment arsenal in the last 24 months:1 Z/I Imagestation IV, 1 LH Systems DPW (NT), and 1Z/I stereo soft kit (SSK) system. Orthophoto productionnow accounts for almost 25% of MN/DOT’s photo-grammetric product market. MN/DOT will make anothersignificant investment in digital photogrammetry in thenext 90 days by purchasing a photogrammetric scanningsystem.
Coarse DEMs are being introduced to hydraulic, plan-ning, and preliminary design personnel. MN/DOT hascompleted 13 DEMs using LIDAR technology. Test datafor these projects are anticipated this winter in accordancewith the National Standard for Spatial Data Accuracy.
MN/DOT information technology support staff re-cently installed a multiterabyte server with fiber links totwo of the digital workstations to satisfy the large mem-ory appetite of digital projects. The next installation offiber links to mass memory will be added to the scanningsystem and SSK system.
Successful Strategies
MN/DOT is currently outsourcing a larger portion ofwork to private partners to meet current program deliv-ery expectations. Senior technical personnel within thephotogrammetric unit have been realigned into a newtechnical specialist class and are helping to oversee theconsultant program. The new technical specialist posi-tions are primarily technical, with added project man-agement duties.
MN/DOT has recently produced a product poster toeducate users about available photogrammetric products,including information on their accuracies, costs, and leadtimes.
Partnerships
A countywide orthophoto and a digital terrain model(DTM) are being used to support a 2-ft contour interval(CI) in Washington County. Opportunities for collabo-ration also exist in Ramsey, Hennepin, Olmsted, andChisago Counties and possibly others.
The Minnesota Department of Natural Resources hasrecently brought together many government agencies inthe state to investigate the idea of developing a Minnesota2-ft statewide DEM. This initiative is still very prelimi-nary but could have huge positive implications for photo-grammetry and remote sensing in the state. A statewide
SUMMARY OF ROUNDTABLE FOR STATES 73
53864_TRB_p73_86 8/25/03 3:12 PM Page 73

2- to 4-ft DEM would open the door for many remotesensing projects that are otherwise cost-prohibitive or toointimidating to potential users.
Barriers to Implementation
Funding is a barrier to implementation. Decision makerswho are in the heat of the program delivery battle for thecontrol funds for photogrammetric products. The processforces decision makers to worry about today’s program,leaving them potentially unaware of the benefits of invest-ing in products that could help future projects. In addi-tion, the needs of facilities management are perceived aslower priorities than the needs of program delivery.
User Issues
The MN/DOT photogrammetric unit is designing acorridor-mapping strategy in lieu of the existing project-specific program. The concept proposes aerial photogra-phy collection at the corridor level and assembly of prod-ucts of value to facility management, GIS, planning, andpreliminary design personnel. The corridorwide prod-ucts would be designed to carry MN/DOT through theproject’s construction limit phase. With additional verti-cal control, they would also be suitable for detail designmapping. The big picture is to have a product on theshelf in probable locations to establish construction lim-its and allow concurrent production of mapping for thedetail design level. The increased investment would min-imize project start-up time and allow photogrammetricdata to be used by other disciplines before the terrain ischanged and the aerial photography becomes outdated.
North Carolina
Keith Johnston, Highway Design Branch,Photogrammetry Unit, North CarolinaDepartment of [email protected]
The North Carolina DOT (NCDOT) is participatingin the USDOT Project DTR56-00-T-0011, entitledAirborne Sensor Fusion: A Fast-Track Approach to
NEPA Streamlining and Environmental Assessment, withprivate and university sector partners. EarthData Inter-national is coordinating the study effort and has partneredwith NCDOT, ITRES Research Limited, and MississippiState University. The goal of the study is to demonstratewhere remote sensing technology can be used to expediteenvironmental studies, transportation planning, prelimi-nary design, and permit approval.
Remote sensing in the study included acquisition ofhyperspectral image data, of GPS and inertial measure-ment unit (IMU)–controlled B/W film aerial photogra-phy, and of LIDAR terrain data. ITRES Research Limitedacquired 14-band 1-m resolution and 11-band 60-cmresolution hyperspectral image data with its CompactAirborne Spectrographic Imager (CASI) system in June2000. EarthData International acquired leaf-on LIDARterrain data in June 2000 and leaf-off LIDAR terrain dataand GPS/IMU controlled aerial photography in March2001. Mississippi State University is fusing several of thedata sources in an effort to delineate wetlands for theproject study area.
Product deliverables include 25-cm resolution digitalB/W orthophotography; 1-m resolution natural color,CIR, and classified digital orthophotography; bare earthLIDAR terrain data; GPS and IMU control data for theB/W aerial photography; and wetland delineation basedon the classified hyperspectral imagery and collateralsources.
NCDOT’s role in the study was to provide in-kindcontributions for analysis and evaluation of the deliver-able products. NCDOT selected Transportation Improve-ment Program (TIP) Project R-2606 in Randolph Countynear High Point for the study project. When discussionsbegan for undertaking this study, the R-2606 project cor-ridor had already been selected, and preliminary designwas nearing completion. Topographic mapping was avail-able to use in the data evaluation process, and surveys forfinal design for each portion of the project were sched-uled. Field wetland delineation data had already beencollected and were also available for comparison. Manyof these data were utilized in the deliverable productevaluation.
EarthData International delivered the majority of theproducts in late September 2001. NCDOT staff haveconcentrated their efforts on performing tests of the bareearth LIDAR terrain data with ground and photogram-metric survey data for comparison. Some results of thesecomparisons are
• Approximate 12- to 15-cm elevation bias and 11- to13-cm elevation random error on natural ground surface;and
• Approximate 34- to 44-cm elevation bias and 3- to6-cm elevation random error on paved roadway surface.
It was also found that contouring with bare earth LIDARterrain data is improved with the addition of breaklinedata, and bare earth LIDAR terrain data volumetric quan-tities matched final mapping quantities within 2% for an11,000-m segment of the R-2606 project.
Mississippi State University has been using the classi-fied hyperspectral imagery, hydrologically corrected ter-rain data, and soils data to predict wetland locations.Work on this portion of the project is still under way.
74 REMOTE SENSING FOR TRANSPORTATION 2001
53864_TRB_p73_86 8/25/03 3:12 PM Page 74

NCDOT’s goal for the study was to obtain vector wet-land delineation polygons from these remote sensing tech-niques. This has not been realized to date.
Issues that NCDOT sees with using LIDAR terrain datafor transportation preliminary design involve understand-ing its accuracy over different surface covers and condi-tions, computing and storage, and the cost scalability tothe size of typical transportation corridor study projects.
Other remote sensing activities in North Carolina in-clude the North Carolina Floodplain Mapping Program(NCFMP), a multiyear program to produce Flood Insur-ance Rate Maps (FIRMs) statewide. The state of NorthCarolina, through the Federal Emergency ManagementAgency’s (FEMA) Cooperating Technical Communitypartnership initiative, has been designated as a Cooperat-ing Technical State, meaning that North Carolina will as-sume primary ownership and responsibility for its FIRMS.
As part of a program to update and maintain FEMAFIRMs, NCFMP has employed LIDAR technology andconventional photogrammetric survey methods to collect,process, and conduct quality control on full-coverage,statewide elevation data. The work is prioritized by riverbasins, of which North Carolina has 17. LIDAR datahave been collected in six eastern river basins and arecurrently being processed and validated for accuracy.This territory is approximately 24,000 mi2 and includesthe river basins of Lumber, White–Oak, Tar–Pamlico,Cape Fear, Neuse, and Pasquotank. Delivery of the ini-tial data is expected over a period of several monthsbeginning in January 2002.
Collection of elevation data for subsequent riverbasins is subject to continuing state budget appropria-tions and cost–share contributions from other sources.
Oklahoma
Jay B. Adams, Oklahoma Department of [email protected]
Timothy M. Callahan, Oklahoma Department of [email protected]
The Geographical Resource Intranet Portal (GRIP)is a web browser application that provides easyaccess to Oklahoma DOT business data through
a map interface. GRIP is being developed as a 3-yearproject, with the first year focusing on 8 different busi-ness layers, 32 different map themes, and statewideaccess to digital imagery. GRIP is an intranet applicationand therefore is only available to users with access to theOklahoma DOT computer network.
GRIP was developed to provide a single source bywhich transportation professionals could retrieve infor-mation needed to make better decisions. The geographi-cal component of GRIP helps in the quick visualizationof relationships between data and projects. By providingeasy access to information, maps, and digital imagery, theGRIP application will enable quick responses to internaland external information requests.
Pennsylvania
L. Bradley Foltz, Photogrammetry and SurveyDivision, Bureau of Design, PennsylvaniaDepartment of [email protected]
The Pennsylvania Department of Transportation(PENNDOT) is working with the NGS to developHarrisburg International Airport as a test site for
LIDAR.
Geodetic Surveys
PENNDOT operates four CORS sites and is installingtwo new sites. This will give the department statewidecoverage. PENNDOT is setting up a test Virtual Refer-ence System south of Pittsburgh. If preliminary testinggoes well, the system will be expanded statewide.
In the past 2 years, all district survey crews have beenoutfitted with RTK GPS and robotic and reflectorlesstotal stations.
PENNDOT is operating two Cyrax scanners to pro-vide the state with high-density, three-dimensional mod-eling capabilities for structures that are difficult to surveyand land features such as expansive bridges, rock facewalls, historical buildings, and limited roadway surfaces.
Administration
PENNDOT has completed Phase 2 of five phases of itsweb-based archival and project management system.This will give customers easy access to photo and surveyinformation. See the website www.penndotpams.org(log in as “user” with password “pams”).
The Pennsylvania Department of Conservation andNatural Resources, as part of the National Map Projectwith USGS TopoGeo, is putting together a seamless digitalmap at 1�2400, 2-ft CI. The department is also workingwith NASA to start a LIDAR and radar project.
The state’s Department of Environmental Protectionhas purchased colorized 10-m SPOT data.
SUMMARY OF ROUNDTABLE FOR STATES 75
53864_TRB_p73_86 8/25/03 3:12 PM Page 75

Utah
Dennis Goreham, Automated GeographicReference Center, Utah Department of [email protected]
Utah has a long history of collaborative develop-ment of geographic information related to thestate’s transportation infrastructure. The goal has
always been to cooperatively develop and share the best(most accurate, current, and complete) information abouttransportation-related themes. This long-term effort wasfurther defined and focused in the Data Sharing Memo-randum of Understanding (MOU) signed by GovernorMike O. Leavitt and nine federal agencies in October1998. This MOU specified that “the participating agen-cies agree to share data for mutual benefit, in order tominimize duplication of efforts and expenditures, and toenhance intergovernmental cooperation.” The currentprojects that contribute to the ultimate goal of a statecomprehensive transportation database are briefly de-scribed below.
1�24,000 Single-Edition Quad Mapping
In 1995, the state of Utah and USGS signed an agreementto cooperatively fund the development of a Utah transpor-tation database derived from published 1�24,000 maps.The Forest Service has since joined this collaborativeeffort. Initially all 1,540 quad sheets were digitized. Be-cause these published maps average 23 years in age, a revi-sion process was began in 1998 with digital orthophotoquads and NAPP photography. Approximately 700 quadshave been revised to date. Starting with the revisions donein 2000, GPS data acquired by the counties were incor-porated into the product. The Forest Service is workingwith the counties to include roads they have placed in GPSthat are to be shown on future published maps.
RS2477 Inventory Project
Starting in 1999, the counties have been funded to par-ticipate in the RS2477 Rights-of-Way inventory andmapping project. Although a few counties had begun theinventory before they received the funding, most of thework has been done over the last 3 years. Almost $3 mil-lion has been distributed to the counties so far. All ruralcounties have received funding to purchase necessaryequipment, hire additional personnel, and receive train-ing and technical assistance. In return, they are to createdata compliant with the Utah Transportation Data Modeland make those data available to the Utah State Geo-
graphic Information Database (SGID) for general stateuses. The counties have been focusing on Class B and Droads, which make up the majority of the roads in ruralcounties.
Federal Aid Eligible Routes
The Utah DOT distributes funds for state Class B and Croads. The counties submit reports annually for their shareof these funds. Utah DOT spot-checks reports by placingsome of the routes in its GPS, but typically completes cov-erage within small areas. The Utah DOT has completedplacing in GPS several hundred miles of Class B and Croads, which it will make available to the Automated Geo-graphic Reference Center (AGRC) for related projects.
State and Federal Routes Mapping
The Utah DOT has mapped into the GPS all Class A stateand federal routes in Utah, representing approximately10,000 mi of the state’s estimated 125,000 mi of roads.This also will be available to AGRC for related projects.
County 1�100,000 Sheet Maps
The Utah DOT maintains 96 cartographic products, at1�100,000 scale, representing the roads in the state. Thesemaps currently use the transportation features from theSGID, but Utah DOT would like to start incorporatingthe GPS data from the counties and the cities.
Bureau of Land Management ResourceManagement Plans
The Bureau of Land Management was appropriated $19 million nationwide to update its Resource Manage-ment Plans. Several of these are in Utah covering all orparts of the east central counties. Next year, the bureauwill move to resource management areas south and westfrom these. Part of the planning process includes improv-ing the GIS data the bureau uses. It is working with thecounties to procure the best available transportation datafor these plans.
National Map Pilot Project
USGS has initiated a new program to develop a nationaldatabase for framework layers, including transportation.One urban (Salt Lake) and one rural (Grand) county willparticipate. The goal is to transactionally update thisnational database from data generated by state and localentities as change occurs. This database will be the pri-mary source for all federal agency geographic informa-tion needs.
76 REMOTE SENSING FOR TRANSPORTATION 2001
53864_TRB_p73_86 8/25/03 3:12 PM Page 76

TIGER Modernization
The U.S. Census Bureau is beginning a process to increasethe accuracy and currency of its topologically integratedgeographic encoding and referencing (TIGER) database.Again, because of Utah’s lead in digital transportationdata, it has been asked to participate as a pilot on this ini-tiative also. Utah is to identify one county that has com-plete data on road coordinates and attributes for testingthe Census Bureau’s modernization and attribute confla-tion processes.
Statewide Addressing Project
This is the most comprehensive of all the state’s currenttransportation-related activities. The state of Utah, BlueStakes, the Census Bureau, USDOT, Utah DOT, andComprehensive Emergency Management have initiatedan effort to create a high-accuracy road centerline (withaddresses) database for the state. This will initially be usedfor an application for utility companies, AOne Call@ noti-fication. Its use in aiding local enhanced 911 (E911) emer-gency efforts is also anticipated.
Utah has no central source for E911 data coordina-tion. Because of the method of funding distribution, localE911 providers develop their own standards and proce-dures. Currently there are no standards for addressing orfor the geographic data needed for emergency vehiclerouting. This project, funded by USDOT and the state ofUtah, will use the most accurate road coordinates avail-able, fully attributed to the Utah Transportation DataModel. It will benefit the AOne Call@ system, E911, wild-fire efforts, and many other applications of a completetransportation database.
Virginia
Donald W. Little, Surveys and Photogrammetry,Virginia Department of [email protected]
The Virginia Department of Transportation (VDOT)formed its own photogrammetric unit in 1957.Since those early days, and for the past 40-plus
years, the department has operated a very traditionalphotogrammetric unit. Remote sensing techniques havebeen incorporated in our everyday activities since 1957.Today, VDOT utilizes satellite and airborne imagery formany of its projects and has recently employed LIDARas another remote sensing tool.
The department’s survey unit initiated its first LIDARproject in 1998 to determine the adequacy of these data
for a route location study. The project was located in themountainous and heavily wooded terrain of southwestVirginia. Because of the steepness and ruggedness of theterrain, GPS-controlled photography was utilized to pro-duce stereo models for quality checking the LIDAR data.Photogrammetric breaklines were added for all majorand some minor breaks, and LIDAR spots were edited asnecessary. The majority of the data were derived fromLIDAR. Field cross sections were secured in areas notvisible by photogrammetric methods.
The survey unit’s second foray into LIDAR was foranother route location study in southwestern Virginia.This project, which covered 60 mi2, was initiated insummer 2000 and utilized LIDAR with airborne GPS-controlled photography for editing. Requirements in-cluded digital orthophotos and a DTM that would sup-port 4-ft contour accuracy. The DTM data, which werefield checked, met the project’s accuracy requirements.
The department has just completed two more LIDARprojects near Williamsburg. One project was to determinethe best approach to widen I-64 from four to six lanes inthe historic Williamsburg area, while the other was for thefinal design of a nearby I-64 section. For the final designproject, airborne GPS-controlled photography was uti-lized to produce stereo models for quality checking theLIDAR data. Photogrammetric breaklines were added forall major and minor breaks. Field survey breaklines wereadded for hydraulic features. LIDAR spots were closelyreviewed and edited within the VDOT right-of-way. Ofthe point-only data, 90% were derived from LIDAR. Toverify the accuracy of the LIDAR and photogrammetrydata, 20 field profiles were read. Detailed quality reviewsare currently under way to determine if these data meetaccuracy requirements for final design.
VDOT will continue to evaluate the latest remote sens-ing techniques and then determine their role in support-ing the department’s massive transportation program.
Dan Widner, Virginia Department of [email protected]
The Virginia Transportation Research Council andVirginia Commonwealth University have joinedfor a research project with three goals:
1. Testing technical feasibility of using multispectralimagery for monitoring wetland mitigation sites andareas affected by the presence of acidic soils;
2. Educating state and federal regulatory agencies onthe capabilities and limitations of this approach; and
3. Acquiring regulatory approval.
SUMMARY OF ROUNDTABLE FOR STATES 77
53864_TRB_p73_86 8/25/03 3:12 PM Page 77

The first goal was completed successfully, and Goals 2and 3 are in process.
VDOT is now part of a new Technology ApplicationProject (TAP) in conjunction with NCRST–Environmentand Mississippi State University. The goal is to demon-strate how multispectral imagery can be incorporatedinto an enterprise GIS and automated as a viable plan-ning tool for environmental assessment. The subject areais wetland identification for proposed construction sites.The end result will be a cookbook methodology forpotential use by other DOTs.
For this, VDOT is starting the third year of a 3-yeareffort to acquire and implement a new, more accurateand comprehensive statewide centerline file. Digital ortho-photography is being used extensively for quality assur-ance and in some cases (where available) data collection.This involves many data sources, including local GIS dataand digital orthophotography, but primarily data arecollected by a van equipped with GPS and inertial navi-gation that gathers photolog information every hundredthof a mile. These data are then developed into centerlinesvia terrestrial photogrammetric techniques.
At the state agency level, Virginia has an RFP on thestreet to fly the entire state at 1-in.�200-ft and 1-in�
400-ft scales. VDOT is being consulted for technicalspecifications as well as being asked to serve on the selec-tion committee.
VDOT sees tremendous potential in the use of remotesensing for asset management, will be following theresults of these partnerships, and may be interested inpursuing this further.
Washington
Elizabeth L. Lanzer, Washington StateDepartment of [email protected]
The agency supports substantial in-house aerialphotography, geodetic survey, and photogram-metry programs that generate all revenue through
the sale of products and services, at cost, to customerswithin the Washington State DOT (WSDOT), other gov-ernment agencies, and the public. Most work comes from
highway and modal projects and typically consists of fly-ing a data collection mission, creating any needed geo-detic control network points, then processing the datainto three-dimensional MicroStation design files and high-resolution orthophoto mosaics used by project engineers.Photogrammetry is now 100% in soft copy, and airborneGPS is used with the aerial photo platform.
The Washington Remote Sensing Consortium is coop-eratively acquiring Landsat7 data from the Earth Re-sources Observation Satellite (EROS) for the entire state.The funding is arranged as an annual subscription, andthen the account is used to acquire regular updates. Thecurrent rate is $5,000 per agency, with 16 or 17 federal,state, and local or tribal partners. EROS is producingthe first data set. The group is associated with a similarnational organization.
The state’s Environmental Affairs Office has becomeone of USDOT’s TAP partners with cooperative fundingto compare the costs and benefits of using remote sensingtechnologies for environmental information developmentwith traditional methods, within a highly urbanized cor-ridor that is undergoing programmatic NEPA evaluation.Image fusion will be used to create land use and landcover information from Landsat7 and high-resolutionorthophoto data. The $150,000 USDOT contribution ispart of a total $438,000 effort.
The Environmental Permit Streamlining Act of 2001directs the state environmental regulatory agencies to workwith WSDOT to improve the permitting process (www.wsdot.wa.gov/eesc/environmental). Using best availableinformation is key to this process. WSDOT is partneringwith other statewide efforts to sponsor information setsthat fill information gaps. These data are often required byregulatory agencies to get permits approved. This invest-ment in data gets WSDOT credit toward environmentalprotection. Remote sensing is a key data source and tech-nology for developing several needed information sets,such as current land use and land cover, the built environ-ment, and watershed characterizations. Its advantages arecurrency and spatial extent (statewide consistency). Mostsuccess is expected during early environmental documen-tation processes such as programmatic corridor analysis.At the project, site-specific stage remote sensing is morechallenging, because data collection costs and processingtime do not fit into the project schedule or because thetechnology has problems in certain local site conditions.
78 REMOTE SENSING FOR TRANSPORTATION 2001
53864_TRB_p73_86 8/25/03 3:12 PM Page 78
APPENDIX B
Conference Workshop Information
79
INTRODUCTION TO REMOTE SENSING
Roger L. King, Mississippi State [email protected]–Environment: www.ncrste.msstate.edu
SUCCESSFUL PUBLIC AND PRIVATE PARTNERSHIPSFOR PROCURING AND UTILIZING REMOTESENSING IMAGERY: THE CASE STUDY OFPIMA COUNTY
Val Noronha, University of California, Santa Barbara
[email protected]–Infrastructure: www.ncgia.ucsb.edu/ncrst
THE NATIONAL MAP: A FRAMEWORK FORINSTITUTIONAL INTEROPERABILITY
Joel L. Morrison, Ohio State [email protected]–Flows: www.ncrst.org/ncrst-f
APPLYING REMOTE SENSING TECHNOLOGYTO AIRPORTS
Michael T. McNerney, DMJM [email protected]
A FAST-TRACK APPROACH TO NATIONALENVIRONMENTAL POLICY ACT STREAMLININGAND ENVIRONMENTAL ASSESSMENT:TECHNOLOGY DEMONSTRATION PROJECT
Karen Schuckman, EarthData Technologies, LLC
53864_TRB_p87 8/25/03 3:12 PM Page 79

80
APPENDIX C
Listing of Technology Buffet Displays
MISSISSIPPI STATE UNIVERSITY CONSORTIUM
NATIONAL CENTER ON REMOTE SENSING INTRANSPORTATION–ENVIRONMENT
• Air Quality Analysis Using Differential AbsorptionLIDAR
• Regional-Scale Watershed Assessment• Regional Land Cover Classification and Change
Detection• Assessing the Need for Remotely Sensed Data for
Environmental Analysis• Hyperspectral Remote Sensing for Identification of
Wetlands
Associated Technology Application Projects
• Remote Sensing of Environmental Parameters forUse in Streamlining the NEPA Process, ICF Consulting,Gary Erenrich, [email protected]
• Airborne Sensor Fusion: A Fast-Track Approachto NEPA Streamlining and Environmental Assess-ment, EarthData Technologies, Karen Schuckman, [email protected]
Other Environmental Application Projects
• Integrating Imagery into the Transportation PlanningProcess—FHWA Small Business Innovation Research,Shenandoah Mountain Geographics, Inc., Bruce EdwardKiracofe
• NEPA Streamlining the Design of I-69 Through theUpper Mississippi Delta, U.S. Environmental ProtectionAgency, Cory W. Berish
OHIO STATE UNIVERSITY CONSORTIUM
NATIONAL CENTER ON REMOTESENSING IN TRANSPORTATION–FLOWS
• Satellite-Based Data: Proof of Concepts and Oper-ational Issues
• Statistical Modeling for Traffic Monitoring• Needs Assessment and Allocation of Imaging Re-
sources for Transportation Planning Management• Using Airborne-Based Data in Real-Time Network
State Estimation, Prediction, and Management• Truck Rest Area Availability and Utilization• Freight and Intermodal Flow Analysis• Spectral Research Program• Validation of Remote Sensing Techniques for Traf-
fic Flow• Traffic Management-Sensor and Platform Issues
Associated Technology Application Projects
• Remote Sensing Applications in Transit, Bridge-water State College
• Road Network Planning Tool, Technology ServicesCorporation
53864_TRB_p88_90 8/25/03 3:12 PM Page 80
LISTING OF TECHNOLOGY BUFFET DISPLAYS 81
Other Operations Application Projects
• Applications of Remote Sensing to Highway Oper-ations, Federal Highway Administration, Paul Pisano
UNIVERSITY OF CALIFORNIA, SANTA BARBARA CONSORTIUM
NATIONAL CENTER ON REMOTE SENSING INTRANSPORTATION–INFRASTRUCTURE
Road Centerlines
Using hyperspectral imagery to identify pavement ma-terials; linear filtering to distinguish roads from rooftops;vectorization and postprocessing to create centerlines;data modeling; cost-comparison against Global Position-ing System (GPS).
BridgeView
ArcView extension, presents different scales of imageryand geographic information system (GIS) layers as userzooms in on object of interest; interactive tools allow userto adjust location of bridge with reference to imagery, forcompliance with National Bridge Inventory requirements.
Asset Inventory
Feature extraction from large-scale photography; analy-sis of department of transportation user requirements;comparison of different scales of imagery and their util-ity with respect to user needs.
Airport Layout and Airspace Analysis
Use of light detection and ranging (LIDAR) and digitalphotography to create orthophotos for airport layoutplans and to identify potential obstructions to airspace;fostering cooperation with a regional GIS, digital ortho-photo project, and regional data center. Pima CountyAssociation of Governments
Associated Technology Application Projects
• Impact of Instant Imagery Access on a RegionalDatabase for Transportation Planning, Orbital ImagingCorporation (ORBIMAGE)
• Long-Term Monitoring of Changes in Trans-portation and Land Uses Associated with the CentralArtery/Third Harbor Tunnel in Boston, Massachusetts,University of Massachusetts, Amherst, Kitty Hancock
Other Infrastructure Projects
• Florida Department of Transportation RoadwayInventory Data Collection
UNIVERSITY OF NEW MEXICO CONSORTIUM
NATIONAL CENTER ON REMOTE SENSING INTRANSPORTATION–HAZARDS
Roadway Risk and Slide Hazards
Interferometric aperture radar (IFSAR)–derived digitalelevation model, Landsat imagery, and other remotelysensed data are used to assess the threat of avalanchesand slides to transportation infrastructure; automatedprocedure to assess roadway risks will be demonstrated.University of Utah
Road Network Updating
A semi-automated process to update existing road net-works in rapidly developing areas with satellite imageryand aerial photography is demonstrated. University ofNew Mexico
Rural Road Trafficability and Maintenance
Remotely sensed imagery is integrated with Dopplerradar, topographic data, soils, and transportation infra-structure maps to assess damage to roads and relatedinfrastructure resulting from localized rainfall and flood-ing. The system classifies road segments by surface con-dition and maintenance requirements, allowing the effi-cient deployment of maintenance resources followingsignificant rainfall and flooding events. University ofNew Mexico
Airport Glide Path Obstructions Identification
LlDAR and digital photography are used to identify glidepath obstructions in accordance with the National Imageand Mapping Agency and Federal Aviation Administra-
53864_TRB_p88_90 8/25/03 3:12 PM Page 81

82 REMOTE SENSING FOR TRANSPORTATION 2001
tion requirements for the Federal Airfield Initiative. BAESystems and University of New Mexico
Remote Sensing and Evacuation Planning
The integration of remotely sensed data into the OakRidge Evacuation Modeling System (OREMS) allows therapid updating of transportation infrastructure. The useof OREMS for evaluating alternative evacuation scenar-ios in response to changing road conditions and closuresis demonstrated. Oak Ridge National Laboratory
Citations and Annotated Bibliography for RemoteSensing and Transportation
An online comprehensive bibliography of articles, books,papers, and web pages addressing remote sensing andapplications for transportation provides a source of recentand historical uses of remote sensing. The ability to searchfor citations by subject, author, and year is provided inan easy-to-use browser-based environment. Citations canbe exported in text delimited, html, and EndNote formatsfor easy use in other programs and documents. GeorgeWashington University
53864_TRB_p88_90 8/25/03 3:12 PM Page 82

APPENDIX D
Abbreviations and Acronyms
83
AADT Average Annual Daily TrafficAASHTO American Association of State Highway
and Transportation OfficialsADAS Airborne Data Acquisition SystemADP Automatic Data ProcessingAGRC Automated Geographic Reference CenterAHTD Arkansas Highway and Transportation
DepartmentALSM Airborne Laser Swath MappingASCII American Standard Code for
Information InterchangeASPRS American Society for Photogrammetry
and Remote SensingATR Automatic Traffic RecorderAVIRIS Airborne Visible/Infrared Imaging
SpectrometerB/W Black and WhiteCA/T Central Artery/TunnelCASI Compact Airborne Spectrographic
ImagerCEO Chief Executive OfficerCI Contour IntervalCIR Color InfraredCNTH Center for Natural and Technological
HazardsCORS Continuously Operating Reference
StationsCTA Center for Transportation AnalysisDEM Digital Elevation ModelDIAL Differential Absorption LIDARDIGIT Digitally Integrated Geographic
Information Technologies
DMI Distance Measuring InstrumentDOQQ Digital Orthorectified Quarter
QuadrangleDOT Department of TransportationDRG Digital Raster GraphDTED Digital Terrain Elevation DataDTM Digital Terrain ModelE911 Enhanced 911EDAC Earth Data Analysis CenterEROS Earth Resources Observations SystemESRI Environmental Systems Research
InstituteFAA Federal Aviation AdministrationFEMA Federal Emergency Management AgencyFHWA Federal Highway AdministrationFIRM Flood Insurance Rate MapsFY Fiscal YearGASB-34 Governmental Accounting Standards
Board No. 34GIS Geographic Information SystemGIS-T Geographic Information Systems for
TransportationGPR Ground Penetrating RadarGPS Global Positioning SystemGRIP Geographical Resource Intranet PortalIFSAR Interferometric Synthetic Aperture RadarIMS Internet Map ServerIMU Inertial Measurement UnitINS Inertial Navigation SystemIRC Inter-Regional CorridorISU Iowa State UniversityIT Information Technology
53864_TRB_p91_92 8/25/03 3:12 PM Page 83

I-Teams Implementation TeamsITS Intelligent Transportation SystemJPL Jet Propulsion LaboratoryLIDAR Light Detection and RangingLRS Linear Referencing SystemMN/DOT Minnesota Department of
TransportationMOU Memorandum of UnderstandingMPO Metropolitan Planning OrganizationMSU Mississippi State UniversityNAFTA North American Foreign Trade
AssociationNAPP National Aerial Photography ProgramNASA National Aeronautics and Space
AdministrationNCDOT North Carolina Department of
TransportationNCFMP North Carolina Floodplain Mapping
ProgramNCRST National Consortium on Remote
Sensing in TransportationNCRST-E National Consortium on Remote
Sensing in Transportation–EnvironmentNCRST-F National Consortium on Remote
Sensing in Transportation–FlowsNCRST-H National Consortium on Remote
Sensing in Transportation–HazardsNCRST-I National Consortium on Remote
Sensing in Transportation–InfrastructureNEPA National Environmental Policy ActNGS National Geodetic SurveyNOAA National Oceanographic and
Atmospheric AdministrationNSDI National Spatial Data InfrastructureNWS National Weather ServiceOD Origin–DestinationOREMS Oak Ridge Evacuation Model SystemORNL Oak Ridge National LaboratoryPC Personal ComputerPCA Principal Component AnalysisPENNDOT Pennsylvania Department of
Transportation
PLSS Public Land Survey SystemR&D Research and DevelopmentRFP Request for ProposalsRGB Red, Green, BlueRMP Resource Management PlanRMS Root-Mean-SquareRMSE Root-Mean-Square-ErrorRSI Remote Sensing IndustryRSPA Research and Special Programs
AdministrationRS-T Remote Sensing for TransportationRTK Real-Time KinematicSAR Synthetic Aperture RadarSGID State Geographic Information DatabaseSHRP Strategic Highway Research ProgramSPI Space Policy InstituteSPOT Satellite Probatoire d’Observation
de la TerreSSK Stereo Soft KitSTORM Science Center for Teaching, Outreach,
and Research in MeteorologySUE Subsurface Utility EngineeringTAP Technical Application ProjectTBD To Be DeterminedTEA21 Transportation Equity Act for the
21st CenturyTIFF Tagged Image File FormatTIG Technology Implementation GroupTIGER Topologically Integrated Geographic
Encoding and ReferencingTIP Transportation Improvement ProgramTRB Transportation Research BoardTSC Technology Service CorporationUSDOT U.S. Department of TransportationUAV Uninhabited Aerial VehicleUBIT Under-Bridge Inspection TruckUNI University of Northern IowaUSGS United States Geological SurveyVDOT Virginia Department of TransportationVMT Vehicle Miles TraveledWSDOT Washington State Department of
Transportation
84 REMOTE SENSING FOR TRANSPORTATION 2001
53864_TRB_p91_92 8/25/03 3:12 PM Page 84

APPENDIX E
Conference Participants
85
Jay B. Adams, Oklahoma Department of Transportation,Oklahoma City
John Albasini, Veridian Systems Division, Stennis Space Center, Mississippi
Fred Anderson, Federal Aviation Administration, Oklahoma City
William P. Anderson, Boston University, MassachusettsWilliam Baer, Space Imaging, Thornton, ColoradoKarl Benedict, Earth Data Analysis Center, University of
New Mexico, AlbuquerqueCory W. Berish, U.S. Environmental Protection Agency,
Atlanta, GeorgiaWilliam Bernard, 3Di Technologies, Easton, MarylandRichard M. Biter, U.S. Department of Transportation,
Washington, D.C.William R. Black, Indiana University, BloomingtonCarol Brandt, Information Systems, Bureau of
Transportation Statistics, Washington, D.C.Aviva Brecher, U.S. Department of Transportation,
Cambridge, MassachusettsMichael S. Bronzini, George Mason University, Fairfax,
VirginiaAmelia Budge, University of New Mexico, AlbuquerqueTimothy M. Callahan, Oklahoma Department of
Transportation, Oklahoma CityKit Carson, Arkansas Highway and Transportation
Department, Little RockJohn J. Conrad, Washington State Department of
Transportation, OlympiaThomas Conroy, Fairfax County Government, Fairfax,
VirginiaTom Cova, University of Utah, Salt Lake CityRobert J. Czerniak, New Mexico State University, Las CrucesRussell G. Daly, Florida Department of Transportation,
TallahasseeMichael A. Domaratz, U.S. Geological Survey,
Washington, D.C.Denise Dunn, U.S. Railroad Administration, Washington, D.C.
David S. Ekern, Minnesota Department of Transportationand Association of State Highway and TransportationOfficials, Washington, D.C.
Lemuel C. Eldridge, Core Software Technology, Reston,Virginia
Craig Emrick, University of Florida, GainesvilleEllen G. Engleman, Research and Special Programs
Administration, U.S. Department of Transportation,Washington, D.C.
Gary Erenrich, ICF Consulting, Fairfax, VirginiaDavid Fletcher, GEODIGM, Albuquerque, New MexicoJ. Gary Flynn, The Champlain Institute, Reston, VirginiaL. Bradley Foltz, Pennsylvania Department of
Transportation, HarrisburgSteve Foster, Maryland State Highway Administration,
BaltimoreLynn Francis, DigitalGlobe, Longmont, ColoradoLawrence Friedl, Office of Research and Development, U.S.
Environmental Protection Agency, Washington, D.C.Meg Gardner, University of California at Santa BarbaraDavid R. P. Gibson, Federal Highway Administration,
McLean, VirginiaVicki Glenn, Frederick, MarylandPrem K. Goel, Ohio State University, ColumbusRichard B. Gomez, George Mason University, Fairfax,
VirginiaMichael F. Goodchild, University of California at
Santa BarbaraDennis Goreham, Automated Geographic Reference Center,
Utah Department of Transportation, Salt Lake CityDavid M. Gorg, Minnesota Department of Transportation,
St. PaulStephen Guptill, U.S. Geological Survey, Reston, VirginiaBill Gutelius, Optech Inc., North York, Ontario, CanadaTimothy L. Haithcoat, University of Missouri at ColumbiaMark E. Hallenbeck, Washington Department of
Transportation, SeattleShauna Hallmark, Iowa State University, Ames
53864_TRB_p93_96 8/25/03 3:11 PM Page 85
Lawrence Harman, GeoGraphics Laboratory, BridgewaterState College, Massachusetts
Jim L. Harpring, State of Alaska, Fort RichardsonStanford T. Harvey, Parsons Brinckerhoff, Richmond,
VirginiaLuther Upton Hatch, Auburn University Environmental
Institute, AlabamaGeorge Hepner, University of Utah, Salt Lake CityMark Hickman, University of Arizona, TucsonPat Hu, Center for Transportation Analysis, Oak Ridge
National Laboratory, TennesseeJan Husdal, University of Utah, Salt Lake CityFrancisco A. Iovino, University of California at
Santa BarbaraChristopher Jackson, Technology Service Corporation,
Alexandria, VirginiaJohn R. Jensen, University of South Carolina, ColumbiaKeith Johnston, North Carolina Department of
Transportation, RaleighTed Jones, Florida Department of Transportation, ChipleyGregory W. Jordan, Skycomp. Inc., Columbia, MarylandSandy Karlin, Federal Aviation Administration/NAColorado,
Silver Spring, MarylandJason S. King, Mississippi State University, Mississippi StateRoger L. King, Mississippi State University, Mississippi StateBruce Edward Kiracofe, Shenandoah Mountain Geographics,
Inc., Washington, D.C.Timothy A. Klein, Office of Innovation, Research and
Education, U.S. Department of Transportation, Washington, D.C.
Walter H. Kraft, PB Farradyne Inc., New YorkT. R. Lakshmanan, Boston University, MassachusettsElizabeth L. Lanzer, Washington State Department of
Transportation, OlympiaDonald T. Lauer, U.S. Geological Survey, Sioux Falls,
South DakotaCharles Laymon, Global Hydrology and Climate Center, U.S.
Railroad Administration, Huntsville, AlabamaChristopher Lee, California State University, Long BeachRussell Lee, Oak Ridge National Laboratory, TennesseeYuanjun Li, Baltimore Metropolitan Council, MarylandDonald W. Little, Virginia Department of Transportation,
RichmondBrian Charles Logan, Kansas Department of Transportation,
TopekaIan MacGillivray, Iowa Department of Transportation, AmesSteve Mah, ITRES Research Limited, Calgary, Alberta,
CanadaThomas Marchessault, U.S. Department of Transportation,
Washington, D.C.Jack Martin, Maryland State Highway Administration,
BaltimoreRobert W. Marx, U.S. Census Bureau, Washington, D.C.Mark R. McCord, Ohio State University, ColumbusJim McDonnell, American Association of State Highway and
Transportation Officials, Washington, D.C.Shaun McNamara, QED Consulting, LLC, Arlington,
VirginiaMichael T. McNerney, DMJM Aviation, Fort Worth, TexasCarolyn J. Merry, Professor, Ohio State University,
ColumbusKenneth S. Miller, Massachusetts Highway Department,
BostonPitu B. Mirchandani, University of Arizona, TucsonStanley A. Morain, University of New Mexico, AlbuquerqueJoel L. Morrison, Ohio State University, Columbus
Randy Murphy, Grafton Technologies, Inc., Newburyport,Massachusetts
Shashi Sathisan Nambisan, University of NevadaTransportation Research Center, Las Vegas
Val Noronha, University of California, Santa BarbaraCharles Gaston O’Hara, Mississippi State University,
Mississippi StateRick Odom, Questerra, Charlottesville, VirginiaLeni Oman, Washington State Department of
Transportation, OlympiaThomas M. Palmerlee, Transportation Research Board,
Washington, D.C.JiSang Park, University of Wisconsin, MadisonHarry Pavulaan, Federal Aviation Administration,
Washington, D.C.Harrison J. Pennel, Federal Aviation Administration,
Oklahoma CityElizabeth Anne Pentecost, U.S. Railroad Administration,
Washington, D.C.Rudy Persaud, Federal Highway Administration, McLean,
VirginiaRoger Petzold, Federal Highway Administration,
Washington, D.C.Henry Peyrebrune, Transportation Consultant, Delmar,
New YorkDiane Pierzinski, California Department of Transportation,
DavisJames R. Plasker, American Society for Photogrammetry and
Remote Sensing, Bethesda, MarylandJoanne R. Potter, Office of Natural Environment, Federal
Highway Administration, Washington, D.C.Donald George Price, Pacific Gas & Electric, San Ramon,
CaliforniaWilliam E. Roper, Chairman, George Washington University,
Washington, D.C.Raad A. Saleh, University of Wisconsin, MadisonMichael Sartori, University of Florida, GainesvilleFred N. Scharf, Transportation Research Board,
Washington, D.C.Charles Schmidt, New Hampshire Department of
Transportation, ConcordKaren Schuckman, EarthData Technologies, High Point,
North CarolinaWilliam G. Schuman, Iowa Department of Transportation,
AmesJim Sims, Southern California Association of Governments,
Los Angeles, CaliforniaRobert E. Skinner, Jr., Transportation Research Board,
Washington, D.C.Gregory Slater, Maryland State Highway Administration,
BaltimoreReg Souleyrette, Iowa State University, AmesPeter L. Sparacino, William J. Hughes Technical Center,
Federal Aviation Administration, Atlantic City, New Jersey
Bruce Spear, Federal Highway Administration, Washington, D.C.
Wayne Szameitat, Optech, Toronto, Ontario, CanadaK. T. Thirumalai, Research and Special Programs
Administration, U.S. Department of Transportation,Washington, D.C.
Michael R. Thomas, Stennis Space Center, NationalAeronautics and Space Administration, Mississippi
Greg Tilton, Research Systems Inc., Calverton, MarylandJohn Hartman Tull, Washington State Department of
Transportation, Olympia
86 REMOTE SENSING FOR TRANSPORTATION 2001
53864_TRB_p93_96 8/25/03 3:11 PM Page 86
Ronald W. Tweedie, Tweefarm, Delmar, New YorkWaheed Uddin, University of Mississippi, UniversityAnita Pauline Vandervalk, Florida Department of
Transportation, TallahasseeTimi Vann, Office of Earth Science, National Aeronautics
and Space Administration, Washington, D.C.Robert A. Venezia, Office of Earth Science, National
Aeronautics and Space Administration, Washington, D.C.Jim Vrabel, Sr., Research Systems Inc, Fairfax, VirginiaC. Michael Walton, University of Texas, AustinRichard P. Watson, Earth Data Analysis Center, University
of New Mexico, Albuquerque
Dan Widner, Virginia Department of Transportation,Richmond
Erin Harkins Wiley, Maryland State Highway Administration, Baltimore
Gary Charles Williams, Maine Department ofTransportation, Augusta
Ray A. Williamson, George Washington University, Washington, D.C.
Leslie Wollack, National States Geographic InformationCouncil, Washington, D.C.
Demin Xiong, Oak Ridge National Laboratory, TennesseeOsei Agyeman Yeboah, Auburn University, Alabama
CONFERENCE PARTICIPANTS 87
53864_TRB_p93_96 8/25/03 3:11 PM Page 87

53864_TRB_p93_96 8/25/03 3:11 PM Page 88