travel and tourism in maine the 2004 visitor study management report prepared for the: maine office...
TRANSCRIPT

Travel and Tourism in Maine The 2004 Visitor
StudyManagement Report
Prepared for the:Maine Office of Tourism
July 14, 2005

2
2004 Travel
Year
Table of Contents
Page
Background and Research Objectives 3
Research Method 4
Key Research Definitions 6
Summary and Conclusions 11
Results in DetailSize & Structure of the U.S. Travel Market 18Size & Structure of Maine’s Travel Market 34
Maine Travel Trends 37Maine’s Competitive Position: Overnight Trips 69Travel Expenditures 78Economic Impacts 98Overnight Marketable Trip Profile 111Traveler Priorities and Product Delivery 171

3
2004 Travel
Year
Background & Research Objectives
A multi-component program of Visitor Research has been conducted each year since 1996 by Longwoods International for the Maine Office of Tourism.
The program is designed to provide: an overview on the U.S. overnight travel market estimates of overnight and day visitor volumes to Maine a profile of Maine’s performance within its regional overnight
travel market visitor expenditures and economic impact estimates of travel
and tourism in Maine profiles of Maine’s overnight marketable trips and travelers.

4
2004 Travel
Year
Research Method
The program is comprised of three research studies; they are the:
Travel USA Monitor®
surveys the travel patterns of a representative sample of American adults (i.e. number and types of overnight trips, destinations, month of travel, and traveler demographics) and then,
returns to a representative sub-sample of them to obtain a detailed profile of trip planning and booking, the travel party, transportation, accommodation, activities, and related expenditures,
provides the U.S. Norm for comparison of state-specific findings.

5
2004 Travel
Year
Research Method cont’d
Maine Overnight Visitor Survey returns for detailed follow-up among the Maine overnight trip
visitors, identified through Travel USA®, for state-specific learning.
Maine Day Visitor Survey surveys a representative sample of residents in Maine’s day
trip market
to profile the number and types of Maine day trips and related expenditures.

6
2004 Travel
Year
Key Research Definitions
A TRIP is defined as any day or overnight (1+ nights away from home) journey for business or pleasure outside one’s community and not part of normal routine.
Trips are the number of individual adult person trips. If 1 adult takes a trip alone, it counts as 1 trip.
If two adults travel together, it counts as 2 trips. And, so on.
Adults may or may not have traveled with children.

7
2004 Travel
Year
Key Research Definitions
Trip-Type Segmentation Model
Reference is made to different types of trips in this report based on Longwoods’ proprietary segmentation model.
The model was developed and refined over 16 years, based on extensive consumer research, and allows for customized marketing strategies reflecting the unique profile, needs, and opportunities of a destination.
The segments are: Visits to Friends and Relatives (VFR) where the primary purpose of the
trip is to visit friends and family Marketable Trips
Includes all other pleasure trips and are so-called because choice of destination on these trips is discretionary and open, therefore, to marketing influence
Comprised of eleven discrete types, as described on the following page Business Trips made exclusively for business reasons
Comprised of three types: Sales/Service, Convention/Conference/Trade Shows, and Meetings.
8
2004 Travel
Year
Key Research Definitions
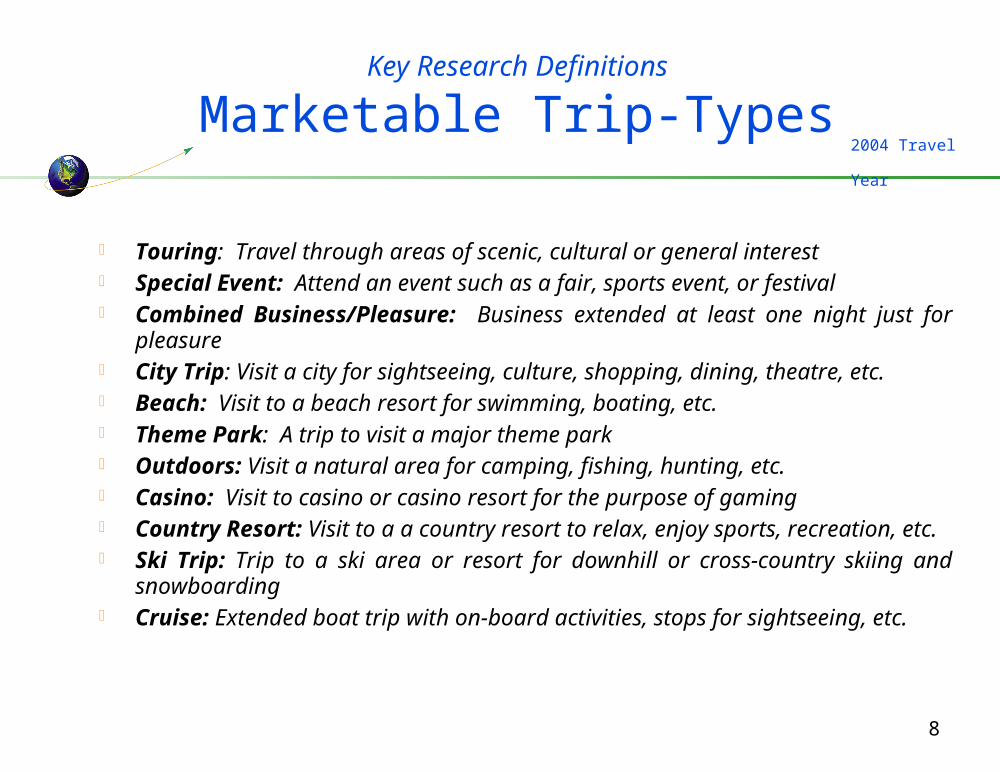
Marketable Trip-Types
Touring: Travel through areas of scenic, cultural or general interest Special Event: Attend an event such as a fair, sports event, or festival Combined Business/Pleasure: Business extended at least one night just for
pleasure City Trip: Visit a city for sightseeing, culture, shopping, dining, theatre, etc. Beach: Visit to a beach resort for swimming, boating, etc. Theme Park: A trip to visit a major theme park Outdoors: Visit a natural area for camping, fishing, hunting, etc. Casino: Visit to casino or casino resort for the purpose of gaming Country Resort: Visit to a a country resort to relax, enjoy sports, recreation, etc. Ski Trip: Trip to a ski area or resort for downhill or cross-country skiing and
snowboarding Cruise: Extended boat trip with on-board activities, stops for sightseeing, etc.

9
2004 Travel
Year
Key Research Definitions
Markets of Interest
Maine’s Regional Market Includes the New England states, Delaware, Maryland, New
Jersey, New York, Pennsylvania, and Washington, D.C.
Maine’s Day Trip Market Includes the states of Maine, Connecticut, Massachusetts,
New Hampshire, Rhode Island, and Vermont.

Summary and Conclusions

11
2004 Travel
Year
Maine’s U.S. Travel Market
The travel and tourism industry continues to be a significant and growing contributor to Maine’s economy.
An estimated 43.6 million day and overnight trips were taken to Maine in 2004, representing a ±0% trend versus 2003.
Overnight trips accounted for 8.9 million of these, down 1% versus 2003.
Day trips accounted for 34.7 million, ±0% versus 2003.

12
2004 Travel
Year
Travel Expenditures
U.S. travelers spent an estimated $6.2 billion in Maine in the year.
$4.5 billion of these expenditures were spent by out-of-state travelers.
The retail and food sector were the largest beneficiaries, capturing estimated $1.9 and $1.7 billion respectively, followed by:
transportation at $1.0 billion, recreation at $0.8 billion, and accommodations at $0.8 billion.
Day and overnight trips are both significant contributors, generating estimated spending of $3.5 and $2.7 billion respectively.

13
2004 Travel
Year
Economic Impact of Travel and Tourism
Based on these levels of traveler spending, travel and tourism in Maine directly and indirectly generated -
176,633 jobs in Maine
$3.8 billion in wages
over $531 million in tax revenues.
Spending by non-residents accounted for about 70% of the above totals.

14
2004 Travel
Year
Maine’s Market Position
Maine’s share of regional residents’ trips to anywhere softened for the third consecutive year - from 3.8% in 2001 to 3.5% in 2002, 3.3% in 2003, and 3.2% in 2004.
This share decline was apparent within the regional market as well. It declined from 5.5% to 5.3%.
Weather was an exacerbating factor for the state. It was a cold and wet summer with temperatures well below
average and precipitation well above average.

15
2004 Travel
Year
Overnight Marketable Travel Profile
Marketable pleasure trips continued to dominate Maine’s trip mix and the most important reasons among these for visiting were:
touring the state (32%)
enjoying the outdoors (20%)
for a beach vacation (14%)
attending a special event (11%)
Maine’s most important source of overnight marketable trips continued to be its regional market.

16
2004 Travel
Year
Product Delivery
Maine has an outstanding tourism product. Visitors hold favorable impressions.
The state’s signature strengths relate to: providing a Family Atmosphere,
being Unique, yet Worry-free
with Sightseeing, as well as Sports & Recreation.

Results in Detail

18
2004 Travel
Year
Performance of the U.S. Travel Market
American adults took an estimated 1.53 billion overnight trips in 2004.
Visits to Friends/Relatives accounted for 41% of them or 616 million trips.
Marketable Trips accounted for 43% or 647 million. Touring, Special Event, Outdoors, Casino, and Beach trips
were, in rank order, the largest Marketable Trip types.
Business Trips accounted for the balance 16% or 267 million trips.
19
2004 Travel
Year
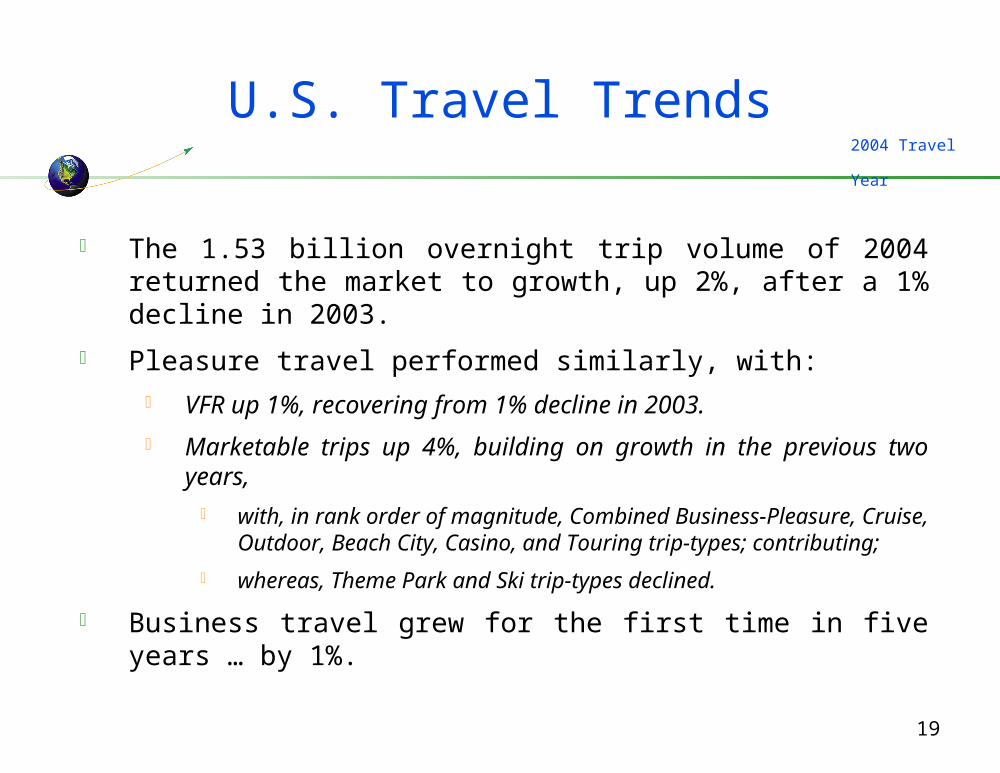
U.S. Travel Trends
The 1.53 billion overnight trip volume of 2004 returned the market to growth, up 2%, after a 1% decline in 2003.
Pleasure travel performed similarly, with: VFR up 1%, recovering from 1% decline in 2003.
Marketable trips up 4%, building on growth in the previous two years,
with, in rank order of magnitude, Combined Business-Pleasure, Cruise, Outdoor, Beach City, Casino, and Touring trip-types; contributing;
whereas, Theme Park and Ski trip-types declined.
Business travel grew for the first time in five years … by 1%.

20
2004 Travel
Year
Size of the U.S. Travel Market 2004 Overnight Trips
Total = 1.530 Billion
Marketable Pleasure647 Million
(43%)
Business267 Million
(16%)
Visit Friends/Relatives616 Million
(41%)

21
2004 Travel
Year
U.S. Overnight Marketable Trip Mix
2004 Travel Year
0 5 10 15 20
Percent
TouringSpecial Event
OutdoorsCasinoBeach
Business/PleasureCity
Theme ParkCruise
Country ResortSki
18
16
13
13
11
10
7
4
3
3
2

22
2004 Travel
Year
U.S. Market Trends 2004 vs. 2003
-10 -5 0 5 10
Percent Change
All Trips
Visit Friends/Relatives
Marketable Pleasure
Business Trips
2
1
4
1

23
2004 Travel
Year
U.S. Market Trends 2004 vs. 2003
-10 0 10 20
Percent Change
All Pleasure Trips
Combined Business/PleasureCruise
OutdoorsBeach
CityCasinoTouring
Visit Friends/RelativesSpecial Event
Country ResortTheme Park
Ski
2
19
11
8
6
4
2
2
1
-2
-4

24
2004 Travel
Year
Size of the U.S. Travel MarketOvernight Trips
1999 2000 2001 2002 2003 20040
500
1,000
1,500
2,000
Trip
s (M
illio
ns)
1,478 1,493 1,458 1,512 1,494 1,530
4% higherthan in 1999
Base: Overnight Trips
+1%+2% +4%-2% -1% +2%

25
2004 Travel
Year
U.S. VFR Trips
1999 2000 2001 2002 2003 20040
200
400
600
800
Trip
s (M
illio
ns)
570 578 589 615 609 616
Base: Overnight VFR Trips
8% higherthan in 1999
-1% -1%+1% +2% +4% +1%

26
2004 Travel
Year
U.S. Marketable Trips
1999 2000 2001 2002 2003 20040
200
400
600
800
Trip
s (M
illio
ns)
582 591 578 614 620 647
Base: Overnight Marketable Trips
11% higherthan in 1999
+1%+5% +2% -2% +6%
+4%

27
2004 Travel
Year
U.S. Business Trips
1999 2000 2001 2002 2003 20040
200
400
600
800
Trip
s (M
illio
ns)
324 324 291 283 265 267
Base: Overnight Business Trips
-3% -6%+3% ± 0% -10%
18% lowerthan in 1999
+1%

28
2004 Travel
Year
Marketable Trip Trends by State
2004 vs. 2003Percent Change
-1% to -10%
+1 to 10%
No change
+11% or more
-11% or more

29
2004 Travel
Year
Marketable Trip Trends by State
2003 vs. 2002Percent Change
-1% to -10%
+1 to 10%
No change
+11% or more
-11% or more

30
2004 Travel
Year
Marketable Trip Trends by State
2002 vs. 2001Percent Change Over Time
-1% to -10%
+1 to 10%
No change
+11% or more
-11% or more

31
2004 Travel
Year
Marketable Trip Trends by State
2001 vs. 2000Percent Change Over Time
-1% to -10%
+1 to 10%
No change
+11% or more
-11% or more

32
2004 Travel
Year
U.S. Marketable Trips % Change From 1994 to 2004
-20 0 20 40 60 80 100 120 140
Percent
CruiseCasino
City Beach
Special EventTheme Park
Business/PleasureTouringOutdoor
Country ResortSki
128
121
69
49
41
39
35
33
14
5
-11

Size & Structure of Maine’s Travel Market

34
2004 Travel
Year
Performance of Maine’s Travel Market
Maine’s combined Day and Overnight trip market totaled an estimated 43.6 million trips in 2004.
There were 34.7 million Day trips. 60% or 20.8 million of which were Marketable.
Shopping was the leading Marketable trip-type, followed by Outdoors, Touring, and Beach trips.
33% were VFR. 7% were Business trips.

35
2004 Travel
Year
Performance of Maine’s Travel Market cont’d
There were 8.9 million Overnight trips. 46% or 4.2 million of which were Marketable trips.
The leading types, in rank order, were Touring, Outdoors, Beach and Special Event trips.
41% were VFR. 13% were Business trips.
36
2004 Travel
Year
Performance of Maine’s Travel Market cont’d
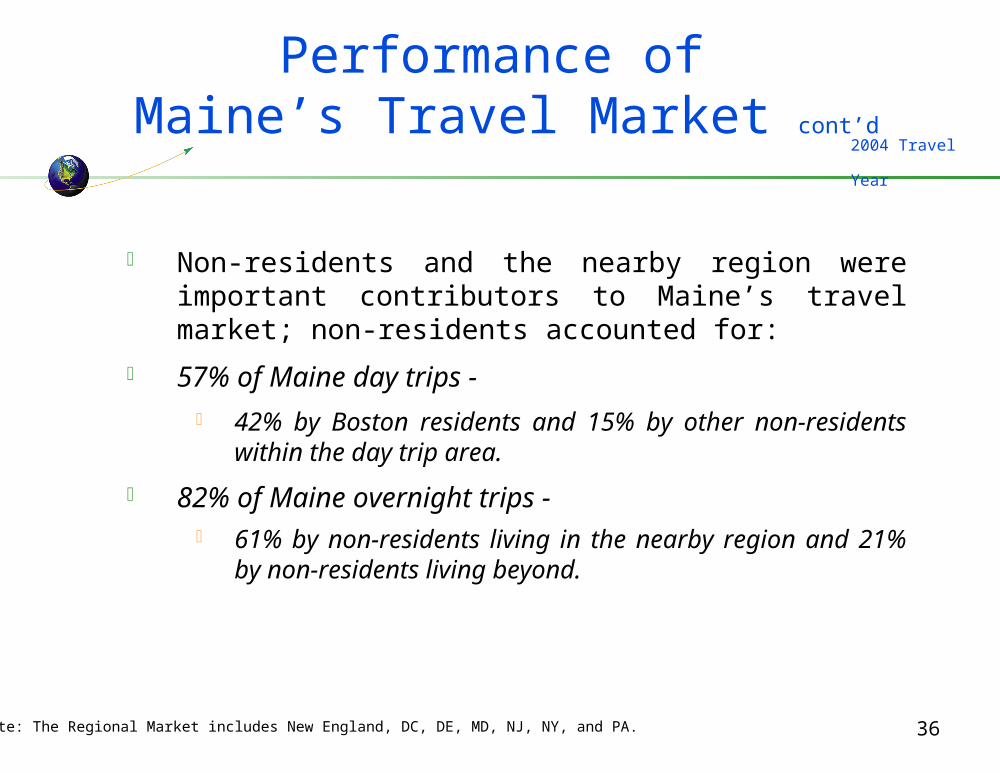
Non-residents and the nearby region were important contributors to Maine’s travel market; non-residents accounted for:
57% of Maine day trips - 42% by Boston residents and 15% by other non-residents
within the day trip area.
82% of Maine overnight trips - 61% by non-residents living in the nearby region and 21%
by non-residents living beyond.
Note: The Regional Market includes New England, DC, DE, MD, NJ, NY, and PA.

37
2004 Travel
Year
Maine Travel Trends
Maine’s overall travel market flattened out in 2004 after being down and up 2% in the previous two years. The number of trips was just shy of 2000 levels.
Day trips were flat for the second consecutive year.
Overnight trips were down by 1% for the second consecutive year.
Note: The Regional Market includes New England, DC, DE, MD, NJ, NY, and PA.

38
2004 Travel
Year
Maine Travel Trends cont’d
By Key Segments
Among Maine’s overnight trips: VFR dropped by 9% in 2004, to a level 11% lower than in 1999. Marketable trips held their own, recovering from a 4% decline in
2003. Volume was nonetheless 4% shy of 1999. Business trips grew by double-digit rates for the second
consecutive year to highest level in five years.

39
2004 Travel
Year
Size of Maine’s U.S. Travel Market
2004 Travel Year
Day Trips34.7 Million
(80%)Overnight Trips
8.9 Million(20%)
Total = 43.6 Million
Base: Total Overnight and Day Trips
40
2004 Travel
Year
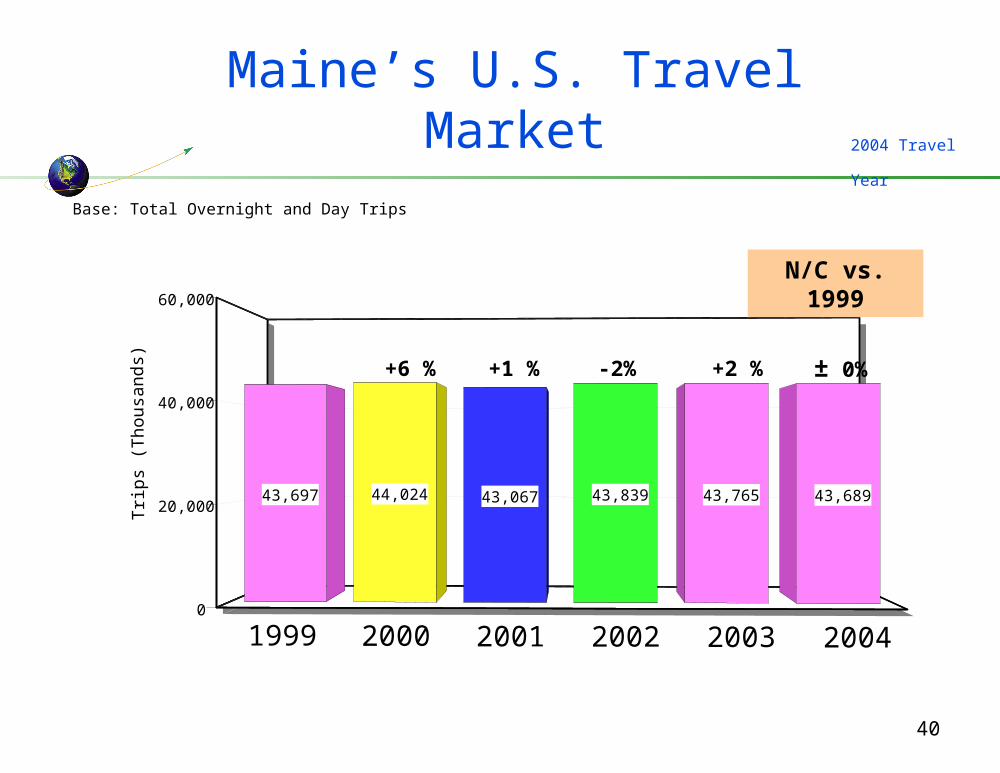
Maine’s U.S. Travel Market
1999 2000 2001 2002 2003 20040
20,000
40,000
60,000
Trip
s (T
hous
ands
)
43,697 44,024 43,067 43,839 43,765 43,689
± 0%+6 % -2%
Base: Total Overnight and Day Trips
+1 %
N/C vs. 1999
+2 %

41
2004 Travel
Year
Maine Overnight Trips
1999 2000 2001 2002 2003 20040
2,000
4,000
6,000
8,000
10,000
12,000
Trip
s (T
hous
ands
)
9,441 8,823 9,024 9,155 9,066 8,937
+1%- 6 % +2%
Base: Overnight Trips
+9%
5% lowerthan in 1999
-1% - 1 %

42
2004 Travel
Year
Maine Overnight VFR Trips
1999 2000 2001 2002 2003 20040
2,000
4,000
6,000
Trip
s (T
hous
ands
)
4,0853,635 3,926 3,966 3,968 3,629
+1%+14% +8%
Base: Overnight VFR Trips
- 11%± 0%
11% lowerthan in 1999
-9%

43
2004 Travel
Year
Maine Overnight Marketable Trips
1999 2000 2001 2002 2003 20040
2,000
4,000
6,000
Trip
s (T
hous
ands
)
4,323 4,268 4,289 4,332 4,151 4,153
Base: Overnight Marketable Trips
+10% -4%± 0% +1%-1%
4% lowerthan in 1999
±0%

44
2004 Travel
Year
Maine Overnight Business Trips
1999 2000 2001 2002 2003 20040
1,000
2,000
3,000
4,000
5,000
Trip
s (T
hous
ands
)
1,032 919 809 857 947 1,155
- 9%- 12% +6%
Base: Overnight Business Trips
- 11% +11%
12% higherthan in 1999
+22%

45
2004 Travel
Year
Marketable Trip MixOvernight Trips
0 10 20 30 40 50
Percent
TouringOutdoors
BeachSpecial Event
Business/PleasureCity
Country ResortCruise
SkiTheme Park
Casino
32
20
14
11
6
5
4
3
3
1
18
13
11
16
10
7
3
3
2
4
13
Maine US Norm
N/A
Base: Overnight Marketable Trips

46
2004 Travel
Year
Marketable Trip MixMaine Overnight Trips
0 10 20 30 40 50
Percent
TouringOutdoors
BeachSpecial Event
Business/PleasureCity
Country ResortCruise
SkiTheme Park
32
20
14
11
6
5
4
3
3
1
36
24
12
10
4
4
3
4
2
1
2004 2003
Base: Overnight Marketable Trips

47
2004 Travel
Year
Marketable Trip MixMaine Overnight Trips
0 10 20 30 40 50
Percent
TouringOutdoors
BeachSpecial Event
Business/PleasureCruise
CityCountry Resort
36
24
12
10
4
4
4
3
38
21
12
9
4
4
4
4
2003 2002
Base: Overnight Marketable Trips

Role of Maine andRegional Residents

49
2004 Travel
Year
Role of Maine Residentson Maine Overnight Trips
1999 2000 2001 2002 2003 20040
4,000
8,000
12,000
Tri
ps
(Th
ou
san
ds)
1,544 1,265 1,4071,988 1,890 1,644
7,8977,558 7,617
7,167 7,176 7,293
Residents Non-Residents
Base: Overnight Trips

50
2004 Travel
Year
Maine’s Regional Market
Includes New England, DC, DE, MD, NJ, NY, and PA

51
2004 Travel
Year
Role of Maine’s Regional Market
Maine Overnight Trips
Total: 8.9 Million
Other U.S. Markets1.9 Million
(21%)
Regional Market* 7.0 Million
(79 %)
* Trips taken to Maine by regional residents (residents of New England DC, DE, MD, NJ, NY, and PA)

52
2004 Travel
Year
Role of Regional Residentson Maine Overnight Trips*
1998 1999 2000 2001 2002 2003 20040
2
4
6
8
10
12T
rip
s (M
illio
ns)
7.07.7
7.0 7.1 6.7 7.0 7.0
1.6
1.7
1.8 1.9 2.4 2.1 1.9
Regional Residents Other U.S. Residents
Base: Overnight Trips
* Trips taken to Maine by regional residents (residents of New England DC, DE, MD, NJ, NY, and PA

53
2004 Travel
Year
Maine’s Overnight Trip Segments
Regional vs. Other U.S. Markets
0 20 40 60
Percent
Marketable Trips
VFR
Business Trips
49
39
12
46
41
13
Regional Market* Other U.S. Markets
* Trips taken to Maine by regional residents (residents of New England DC, DE, MD, NJ, NY, and PA)
Base: Overnight Trips

54
2004 Travel
Year
Maine Marketable Trip MixOvernight Trips by Market
* Trips taken to Maine by regional residents (residents of New England, DC, DE, MD, NJ, NY, and PA)
Base: Overnight Marketable Trips
0 20 40 60
Percent
TouringOutdoors
BeachSpecial Event
CityCountry Resort
Business-PleasureSki
CruiseTheme Park
29
26
16
12
5
5
4
3
1
1
56
9
3
6
4
2
11
8
1
Regional Market * Other U.S. Markets
<1%

Maine’s Day Trips

56
2004 Travel
Year
Maine’s Day Trips
1999 2000 2001 2002 2003 20040
9,000
18,000
27,000
36,000
45,000
Tri
ps
(Th
ou
san
nd
s)
34,256 35,201 34,043 34,684 34,699 34,752
+2%-4%+3%+5%
Base: Day Trips
±0%
1% higherthan in 1999
±0%

57
2004 Travel
Year
Maine’s Day Trip Segments
1999 2000 2001 2002 2003 20040
20
40T
rip
s (M
illio
ns)
2.8 2.7 2.6 3.2 2.5 2.4
11.5 12.5 12.8 11.5 11.2 11.5
20.0 20.0 18.6 20.0 21.0 20.8
Business Visit Friends/Relatives Marketable
34.0 34.7 35.2 34.3
Base: Day Trips
34.7 34.7 Million

58
2004 Travel
Year
Marketable Trip MixMaine Day Trips
0 10 20 30 40
Percent
Shopping
Outdoors
Beach
Touring
City
27
22
11
17
12
30
17
13
18
9
30
21
11
17
7
27
25
11
14
11
2001 2002 2003 2004
Base: Marketable Day Trips

59
2004 Travel
Year
Marketable Trip MixMaine Day Trips cont’d
0 10 20 30 40
Percent
Special Event
Cruise
Country Resort
Theme Park
Ski
7
0.1
1
1
2
7
1
1
1
1
8
1
0.4
2
2
8
1
1
3
2
2001 2002 2003 2004
Base: Marketable Day Trips

60
2004 Travel
Year
Role of Maine Residents Day Trips
Total = 34.7 Million
Maine Residents15.0 Million
(43%)
Boston14.4 Million
(42%)
Other Day Trip Region *5.3 Million
(15%)
* Includes Connecticut, Massachusetts, New Hampshire, Rhode Island, and Vermont
Base: Day Trips

61
2004 Travel
Year
Role of Maine Residentson Day Trips
1999 2000 2001 2002 2003 20040
10,000
20,000
30,000
40,000
Tri
ps (
Tho
usan
ds)
15,913 16,983 16,592 16,175 15,802 15,071
18,34318,218 17,451 18,509 18,897 19,680
Residents Non-Residents
Base: Day Trips

62
2004 Travel
Year
Role of Maine’s Residents Day Trips
1999 2000 2001 2002 2003 20040
10
20
30
40Tr
ips
(Mill
ions
)
4.0 4.1 3.7 3.5 4.6 5.3
14.4 14.1 13.7 14.9 14.3 14.4
15.9 17.016.6 16.2 15.8 15.0
Other Day Trip Region * Boston Residents
* Includes Connecticut, Massachusetts, New Hampshire, Rhode Island, and Vermont.
Base: Day Trips

Trip Summary

64
2004 Travel
Year
Trips To Maine — 2004
Day Trips Overnight Trips
Trip Purpose
Residents
Non-Residents
Total Day
Residents
Non-Residents
Total Overnight
All Trips
Marketable Pleasure
8.3
12.5
20.8
0.6
3.6
4.2
25.0
VFR
5.3
6.2
11.5
0.5
3.1
3.6
15.1
Business
1.4
1.0
2.4
0.5
0.6
1.1
3.5
Total
15.0
19.7
34.7
1.6
7.3
8.9
43.6
(Millions of trips)

65
2004 Travel
Year
Trips To Maine — 2003
Day Trips Overnight Trips
Trip Purpose
Residents
Non-Residents
Total Day
Residents
Non-Residents
Total Overnight
All Trips
Marketable Pleasure
9.7
11.3
21.0
0.8
3.4
4.2
25.2
VFR
4.6
6.6
11.2
0.8
3.2
4.0
15.2
Business
1.5
1.0
2.5
0.3
0.6
0.9
3.4
Total
15.8
18.9
34.7
1.9
7.2
9.1
43.8
(Millions of trips)

66
2004 Travel
Year
Trips To Maine — 2002
Day Trips Overnight Trips
Trip Purpose
Residents
Non-Residents
Total Day
Residents
Non-Residents
Total Overnight
All Trips
Marketable Pleasure
8.7
11.3
20.0
0.8
3.4
4.3
24.3
VFR
5.8
5.7
11.5
0.9
3.2
4.0
15.5
Business
1.7
1.5
3.2
0.2
0.6
0.8
4.0
Total
16.2
18.5
34.7
1.9
7.2
9.1
43.8
(Millions of trips)

67
2004 Travel
Year
Trips To Maine — 2001
Day Trips Overnight Trips
Trip Purpose
Residents
Non-Residents
Total Day
Residents
Non-Residents
Total Overnight
All Trips
Marketable Pleasure
9.6
9.0
18.6
0.7
3.6
4.3
22.9
VFR
5.6
7.2
12.8
0.6
3.3
3.9
16.7
Business
1.5
1.1
2.6
0.1
0.7
0.8
3.4
Total
16.6
17.4
34.0
1.4
7.6
9.0
43.0
(Millions of trips)

Maine’s Competitive Position:
Overnight Trips

69
2004 Travel
Year
Maine’s Competitive PositionWithin the U.S. Travel Market
Maine’s national ranking as a travel destination among the U.S. states has remained at 38th from 2002 through 2004.
Nonetheless, its rank for Outdoors trips dropped from the exceptional 19th spot in 2003 to a more typical 28th rank in 2004.

70
2004 Travel
Year
Maine’s Competitive Position U.S. Travel Market
Rank of Maine Among 50 U.S. States
1999 2000 2001 2002 2003 2004
All Trips 39 38 39 38 38 38Touring Trips 25 18 25 25 28 28Outdoors Trips 15 26 25 23 19 28Beach Trips 17 19 15 16 16 17Special Event Trips 48 42 39 44 39 41
Base: Overnight Trips

71
2004 Travel
Year
Maine’s Competitive PositionWithin the Regional Travel Market
Maine’s share of regional residents’ trips to anywhere softened for the third consecutive year – from 3.8% in 2001 and 3.5% in 2002 to 3.3% in 2003. and 3.2% in 2004.
This share decline was apparent within the regional market as well. It declined from 5.5% to 5.3%.
Weather was an exacerbating factor for the state. It was a cold and wet summer with temperatures well below
average and precipitation well above average.
Note: The Regional Market includes New England, DC, DE, MD, NJ, NY, and PA.

72
2004 Travel
Year
Maine’s Market Share Maine’s Share of Marketable Trips Taken by Regional Residents to Anywhere
1998 1999 2000 2001 2002 2003 20040
1
2
3
4
5
Per
cent
3.7 3.83.5
3.83.5 3.3 3.2
Base: Overnight Marketable Trips by Regional Residents to All Destinations
Note: The Regional Market includes New England, DC, DE, MD, NJ, NY, and PA.

73
2004 Travel
Year
Region’s Market Share Region’s Share of Marketable Trips Taken by Regional Residents to Anywhere
1999 2000 2001 2002 2003 20040
20
40
60
80
Per
cent
60.1 58.3 60.2 60.8 60.2 60.4
Base: Overnight Marketable Trips by Regional Residents to Anywhere
Note: The Regional Market includes New England, DC, DE, MD, NJ, NY, and PA.

74
2004 Travel
Year
Maine’s Intra-Region Market Share Maine’s Share of Marketable Trips Taken by Regional Residents Within the
Region
1999 2000 2001 2002 2003 20040
2
4
6
8
Per
cent
6.3 5.9 6.25.5 5.5 5.3
Base: Overnight Marketable Trips by Regional Residents Within the Region
Note: The Regional Market includes New England, DC, DE, MD, NJ, NY, and PA.

75
2004 Travel
Year
Maine’s Temperature in Summer 2004 (June-Aug)
Source: ‘Climate at a Glance’; National Climatic Data Center

76
2004 Travel
Year
Maine’s Precipitation in Summer 2004 (June-Aug)
Source: ‘Climate at a Glance’; National Climatic Data Center

Travel Expenditures

78
2004 Travel
Year
Traveler Expenditures
An estimated $6.2 billion was spent in Maine by travelers in 2004, representing stability in the market (-1% on 2003 and +1% in 2004) after robust growth in earlier years.
Day trips contributed 56% of the $6.2 billion (versus 80% of trips) or $3.5 billion.
Overnight trips contributed 44% (versus 20% of trips) or $2.7 billion.

79
2004 Travel
Year
Traveler Expenditures cont’d
Marketable Trips contributed $4.0 billion or 64% of the $6.2 billion total, followed in importance by:
VFR ($1.8 billion) and Business Trips ($0.4 billion).
Out-of-state travelers made a significant contribution to Maine’s economy,
spending $4.5 billion across Overnight ($2.4 billion) and Day trips ($2.1 billion).

80
2004 Travel
Year
Traveler Expenditures cont’d
The benefits by category, in rank order, are: Retail – 31% of the $6.2 billion total or $1.9 billion
Restaurant Food — 28% or $1.7 billion
Transportation — 15% or $1.0 billion
Accommodation — 13% or $0.8 billion
Recreation — 13% or $0.8 billion

81
2004 Travel
Year
Travel Expenditures In Maine2004 Travel Year
Total = $6.2 Billion
Day Trips$3.5 Billion
(56%)
Overnight Trips$2.7 Billion
(44%)

82
2004 Travel
Year
Total Travel Expenditures in Maine
Across Overnight & Day Trips
1999 2000 2001 2002 2003 20040
2,000
4,000
6,000
8,000
Do
llars
(M
illio
ns)
5,0225,385 5,613
6,204 6,135 6,199
Base: Total Overnight and Day Trips
+2% +7%+4%
+10% -1%
23% higherthan in 1999
+1%

83
2004 Travel
Year
Travel Expenditures in Maineon Overnight Trips
23% higherthan in 1999
Base: Overnight Trips
1999 2000 2001 2002 2003 2004$0
$1,000
$2,000
$3,000
$4,000
Do
llars
(M
illio
ns)
$2,194 $2,275 $2,443$2,640 $2,648 $2,689
± 0%
+3%+4%
+8%+7%
+2%

84
2004 Travel
Year
Travel Expenditures in Maineon Day Trips
24% higherthan in 1999
Base: Day Trips
1999 2000 2001 2002 2003 2004$0
$1,000
$2,000
$3,000
$4,000
$5,000
Do
llars
(M
illio
ns)
$2,828$3,110 $3,170
$3,564 $3,486 $3,510
-2%
+1% +10%+2%
+12% +1%

85
2004 Travel
Year
Travel Expenditures By Category
Retail$1.9 Billion
(31%)
Accommodations$0.8 Billion
(13%)
Recreation$0.8 Billion
(13%)
Transportation$1.0 Billion
(15%)
Restaurant Food $1.7 Billion
(28%)
Total = $6.2 Billion
Base: Total Overnight and Day Trips

86
2004 Travel
Year
Travel Expenditures by Category
Retail
1999 2000 2001 2002 2003 2004$0
$500
$1,000
$1,500
$2,000
$2,500
Do
llars
(M
illio
ns)
$1,931 $1,916 $1,931 $1,958 $1,910 $1,919
Base: Total Overnight and Day Trips
-2%+2% -1% +1% +1% +1%

87
2004 Travel
Year
Travel Expenditures by Category
Restaurant Food
1999 2000 2001 2002 2003 2004$0
$500
$1,000
$1,500
$2,000
$2,500
Dol
lars
(M
illio
ns)
$1,275
$1,556$1,671
$1,805 $1,709 $1,747
Base: Total Overnight and Day Trips
Note: Includes Restaurant Food & Beverage expenditures for Breakfast, Lunch , Dinner and Snacks
-5%
-4%
+22% +7% +8% +2%

88
2004 Travel
Year
Travel Expenditures by Category
Transportation
1999 2000 2001 2002 2003 2004$0
$500
$1,000
$1,500
$2,000
$2,500
Dol
lars
(M
illio
ns)
$721 $717 $778$986 $1,028 $946
Base: Total Overnight and Day Trips
+27% +4%
+5% -1% +9%-8%

89
2004 Travel
Year
Travel Expenditures by Category
Accommodations
1999 2000 2001 2002 2003 2004$0
$500
$1,000
$1,500
$2,000
$2,500
Do
llars
(M
illio
ns)
$608 $660 $701 $730 $731 $805
Base: Total Overnight and Day Trips
±0%
+10% +8% +6% +4%+10%

90
2004 Travel
Year
Travel Expenditures by Category
Recreation
1999 2000 2001 2002 2003 2004$0
$500
$1,000
$1,500
$2,000
$2,500
Dol
lars
(M
illio
ns)
$487 $536 $532$725 $779 $783
Base: Total Overnight and Day Trips
+7%+3% +10% -1%
+36%+1%

91
2004 Travel
Year
Travel Expenditures By SectorOvernight vs. Day Trips
$1.9 Billion
$0.8 Billion
$1.7 Billion
$1.0 Billion
$0.8 Billion
$0 $1 $2 $3
Billions of Dollars
Retail
Restaurant Food
Accommodations
Transportation
Recreation
$0.6
$0.6
$0.8
$0.4
$0.3
$1.3
$1.1
$0.6
$0.5
Overnight Day
Base: Total Overnight and Day Trips

92
2004 Travel
Year
Travel Expenditures By Purpose Of Trip
Total: $6.2 Billion
Marketable Pleasure Trips$4.0 Billion
(64%)
Business Trips$0.4 Billion
(7%)
Visit Friends/Relatives$1.8 Billion
(29%)
Base: Total Overnight and Day Trips

93
2004 Travel
Year
Travel Expenditures By Purpose Of Trip
$0 $1 $2 $3 $4
Billions of Dollars
Overnight
Day
$1.6
$2.4
$0.8
$1.0
$0.3
$0.1
Marketable Pleasure Visit Friends/Relatives Business
$3.5 Billion
$2.7 Billion
Base: Total Overnight and Day Trips

94
2004 Travel
Year
Travel ExpendituresRole Of Maine Residents
$0 $1 $2 $3 $4
Billions of Dollars
Overnight
Day
$0.3
$1.4
$2.4
$2.1
Residents Non-Residents
$3.5 Billion
$2.7 Billion
Base: Overnight and Day Trips

95
2004 Travel
Year
Travel Expenditures By Sectorby Residents of Maine
$502 Million
$113 Million
$454 Million
$306 Million
$292 Million
$0 $200 $400 $600 $800
Millions of Dollars
Retail
Restaurant Food
Accommodations
Transportation
Recreation
$37
$56
$113
$45
$19
$465
$398
$261
$273
Overnight Day
Base: Total Overnight and Day Trips

96
2004 Travel
Year
Travel Expenditures By Sectorby Non-Residents of Maine
$1,417 Million
$692 Million
$1,292 Million
$639 Million
$491 Million
$0 $500 $1,000 $1,500
Millions of Dollars
Retail
Restaurant Food
Accommodations
Transportation
Recreation
$543
$610
$692
$344
$228
$874
$682
$295
$263
Overnight Day
Base: Total Overnight and Day Trips

Economic Impacts of TourismTrips by Residents & Non-Residents

98
2004 Travel
Year
Economic Impacts
The economic impacts of tourism reported herein were provided by the Maine’s State Planning Office, based on Longwoods’ expenditure estimates.
Resident and Non-Resident travel generated: $13.4 billion in sales of goods and services
173,181 jobs, with a payroll of $3.8 billion
$549 million in tax revenues.

99
2004 Travel
Year
Economic Impacts cont’d
Non-Resident travel generated just over two-thirds of the total economic impact or:
$9.8 billion in sales of goods and services,
127,689 jobs with a payroll of $2.8 billion,
$375 million in tax revenues.

Economic Impacts of TourismTrips by Residents & Non-Residents

101
2004 Travel
Year
Economic Impact of TourismTrips by Residents & Non-Residents
2002 2003 2004
Total Sales $13.9 Billion $13.4 Billion $13.6 Billion
Total Taxes $556 Million $549 Million $531 Million
Jobs Created 181,090 173,181 176,633
Total Payroll $3.9 Billion $3.8 Billion $3.8 Billion
Base: Maine Trips by Residents & Non-Residents

102
2004 Travel
Year
Sales by Sector Trips by Residents & Non-Residents
Base: Maine Trips by Residents & Non-Residents
Total: $13.6 Billion
Services(43%)
Retail(43%)
Construction(2%)
Wholesale(12%)

103
2004 Travel
Year
Job Creation by Sector Trips by Residents & Non-Residents
Base: Maine Trips by Residents & Non-Residents
Total: 176,633
Services(62%)
Retail(33%)
Construction(2%)
Wholesale(3%)

104
2004 Travel
Year
Tax Revenues from Tourism Trips by Residents & Non-Residents
Base: Maine Trips by Residents & Non-Residents of Maine
Total: $531.3 Million
Sales Tax$293.6 Million
(55%)
Personal Income Tax$149.4 Million
(28%)
Gasoline Tax$88.3 Million
(17%)

Economic Impacts of TourismTrips by Non-Residents

106
2004 Travel
Year
Economic Impact of TourismTrips by Non-Residents
2002 2003 2004
Total Sales $9.5 Billion $9.4 Billion $9.8 Billion
Total Taxes $377 Million $384 Million $375 Million
Jobs Created 124,000 122,059 127,869
Total Payroll $2.7 Billion $2.6 Billion $2.8 Billion
Base: Trips by Non-Residents to Maine

107
2004 Travel
Year
Sales by SectorTrips by Non-Residents
Base: Trips by Non-Residents to Maine
Total: $9.8 Billion
Services(42%)
Retail(44%)
Construction(2%)
Wholesale(12%)

108
2004 Travel
Year
Job Creation by SectorTrips by Non-Residents
Base: Trips by Non-Residents to Maine
Total: 127,869
Services(63%)
Retail(32%)
Construction(2%)
Wholesale(3%)

109
2004 Travel
Year
Tax Revenues from TourismTrips by Non-Residents
Base: Trips by Non-Residents to Maine
Total: $375.4 Million
Sales Tax$213.1 Million
(57%)
Personal Income Tax$108.1 Million
(29%)
Gasoline Tax$54.2 Million
(14%)

Overnight Marketable Trip Profile

111
2004 Travel
Year
Overnight Marketable Trip Profile
This section of the report profiles Overnight Marketable Trips to Maine and draws comparisons to the U.S. Norm for such trips.
Maine’s Marketable Trip profile has remained fairly stable over the past few years, including the importance of the summer travel period. More than half of all overnight trips occur in July, August,
and September.

112
2004 Travel
Year
Season of Trip
Base: Overnight Marketable Trips
0 20 40 60 80
Percent
January-March
April-June
July-September
October-December
8
25
52
16
20
28
32
20
Maine US Norm

113
2004 Travel
Year
Month of Marketable Trips2001-2004
Jan Mar May July Sept Nov0
5
10
15
20
25
Per
cent
of A
nnua
l Vol
ume
2001 2002 2003 2004
Base: Overnight Marketable Trips

Sources of Business

115
2004 Travel
Year
Overnight Marketable Trip Profile
Sources of Business
Massachusetts was the most important source of non-resident overnight trips to Maine.
Massachusetts accounted for 38% of non-residents’ overnight Marketable trips and the Boston DMA itself for 36%.
The percentage of trips sourced from some DMA’s (including those of Boston and New York City) may exceed the percentage sourced from the city’s state because the DMA boundaries include some counties of adjoining states.
After Massachusetts, followed the states of New Hampshire (8%), New York (7%), Connecticut (6%), and Pennsylvania (5%).

116
2004 Travel
Year
Sources Of Businessfrom Out-of-State
States contributing more than 10%
States contributing 4% - 10%
DMAs contributing more than 4%
Base: Overnight Marketable Trips from Out-of-State

117
2004 Travel
Year
State Sources of Overnight Trips
From Out-of-State
0 10 20 30 40
Percent
MassachusettsNew Hampshire
New YorkConnecticut
PennsylvaniaCalifornia
Rhode IslandNew Jersey
MarylandOhio
VermontFloridaVirginia
Texas
38
8
7
6
5
4
4
3
2
2
2
2
2
2
Base: Overnight Marketable Trips from Out-of-State

118
2004 Travel
Year
Urban Sources Of Overnight Trips
from Out-of-State*
0 10 20 30 40
Percent
BostonNew York
Hartford/New HavenProvidence/New Bedford
Springfield/HolyokePhiladelphia
Burlington/PlattsburgAlbany/Schenectady
Los AngelesBaltimore
36
7
6
6
5
3
3
2
2
2
Base: Overnight Marketable Trips from Out-of-State
* DMA of residence

Demographics

120
2004 Travel
Year
Overnight Marketable Trip Profile
Demographics
The demographic profile of the average overnight traveler to Maine was similar to the average U.S. traveler but for being somewhat older -
44.7 years of age on average versus the U.S. Norm of 43.9

121
2004 Travel
Year
Age
Base: Overnight Marketable Trips
0 10 20 30 40
Percent
18-24 years25-34 years35-44 years45-54 years55-64 years
65+ years
8
18
31
16
14
13
12
20
24
20
13
12
Maine U.S. Norm
Maine U.S. NormAverage Age 44.7 43.9

122
2004 Travel
Year
Marital Status
Base: Overnight Marketable Trips
0 20 40 60 80
Percent
Married
Single
Divorced/Widowed
61
26
13
62
20
19
Maine U.S. Norm

123
2004 Travel
Year
Household Size
Base: Overnight Marketable Trips
0 20 40 60
Percent
1 member
2 members
3 members
4 members
5+ members
21
42
13
13
11
21
38
16
15
10
Maine U.S. Norm

124
2004 Travel
Year
Children in Household
Base: Overnight Marketable Trips
0 20 40 60 80
Percent
No Children Under 18
Any Child Between 13-17
Any Child Between 6-12
Any Child Under 6
68
8
15
12
67
13
15
13
Maine U.S. Norm

125
2004 Travel
Year
Employment
Base: Overnight Marketable Trips
0 20 40 60 80
Percent
Full time
Part time
Not Employed for Pay
62
15
23
64
14
22
Maine U.S. Norm

126
2004 Travel
Year
Occupation
Base: Overnight Marketable Trips by Those Employed
0 20 40 60 80
Percent
Manager/Professional
Other White Collar
Blue Collar
Other/Armed Forces
62
15
16
6
58
16
18
9
Maine U.S. Norm

127
2004 Travel
Year
Income
Base: Overnight Marketable Trips
0 20 40 60
Percent
$75K+
$50K-$74.9K
$25K-$49.9K
Under $25K
35
25
26
13
39
24
24
14
Maine U.S. Norm

128
2004 Travel
Year
Education
Base: Overnight Marketable Trips
0 20 40 60
Percent
Post-Graduate
College Graduate
Some College
High School or Less
21
31
23
25
17
30
27
26
Maine U.S. Norm

Trip Planning and Booking

130
2004 Travel
Year
Overnight Marketable Trip Profile
Travel Planning and Booking
Maine’s overnight visitors planned and booked further ahead than the U.S. Norm, using a variety of information sources:
the internet more often than any other single source including the advice of friends and relatives;
auto clubs, visitor bureaus, and books more commonly than the U.S. Norm.
Almost eight-in-ten of the trips were booked ahead in whole or part.
Of those booked in advance, 40% were booked over the internet compared with 6% through a travel agent.

131
2004 Travel
Year
Overnight Marketable Trip Profile
Travel Planning and Booking cont’d
The visitmaine.com website were used to plan 18% of Maine trips.
For 12%, they were used to help obtain more information about a destination already decided upon.
For 5%, they were used to help choose which destination to visit --- whether an area of the country, a state(s), and/or a destination(s) within a state.

132
2004 Travel
Year
Planning Cycle
Base: Overnight Marketable Trips
1 month or less 2 months 3-5 months 6 months or more0
20
40
60
80
Per
cent
25 26 2327
34
1722
27
Maine U.S. Norm

133
2004 Travel
Year
Information Sources Usedfor Planning
Base: Overnight Marketable Trips
0 20 40 60
Percent
Personal experienceOnline/Internet
Friends/Relatives' adviceBooks
Auto clubHotel/Resort
Visitors BureauMagazines
Toll-Free Number
48
33
27
19
16
13
13
7
5
44
36
21
13
5
21
7
8
10
Maine U.S. Norm

134
2004 Travel
Year
Information Sources Usedfor Planning cont’d
Base: Overnight Marketable Trips
0 20 40 60
Percent
Travel agentAirline/commercial carrier
Government tourism officeAssociation/club
NewspapersTV
Group tour company
4
4
4
3
3
2
2
9
9
3
6
2
2
4
Maine U.S. Norm

135
2004 Travel
Year
Use of the Internet for Trip Planning
1997 1998 1999 2000 2001 2002 2003 2004 1997 1998 1999 2000 2001 2002 20030
10
20
30
40
Pe
rce
nt
1216
21
30
25
3531
33
7
13
18
2932
3836
Maine U.S. Norm
Base: Overnight Marketable Trips

136
2004 Travel
Year
Use of Information Servicesfor Planning
Base: Overnight Marketable Trips
Office of Tourism visitmaine.com *0
5
10
15
20
25
Per
cent
13
16
12
1617
20
10
151518
2000 2001 2002 2003 2004
* Prior to 2003, numbers reflect use of visitmaine.com and/or maineattraction.com

137
2004 Travel
Year
Reason for Using Destination Website
Base: Overnight Marketable Trips
0 10 20 30
Percent
Used visitmaine.com
- To obtain info about a destination
- To help choose which destination to visit
18
12
5

138
2004 Travel
Year
Percent Who Booked In Advance
Base: Overnight Marketable Trips
Maine U.S. Norm0
20
40
60
80
100
Per
cent
79 80

139
2004 Travel
Year
Booking Cycle
Base: Overnight Marketable Trips Booked in Advance
1 month or less 2 months 3-5 months 6 months or more0
20
40
60
80
Per
cent
34
2028
18
42
22 19 17
Maine U.S. Norm

140
2004 Travel
Year
Methods of Booking
Base: Overnight Marketable Trips Booked in Advance
Travel Agent Internet0
10
20
30
40
50
60
Per
cent
6
40
13
46
Maine U.S. Norm

141
2004 Travel
Year
Use of Vacation Packages & Group Travel
Base: Overnight Marketable Trips
0 5 10 15 20 25
Percent
Pre-Paid package
Escorted group tour
9
4
19
5
Maine U.S. Norm

Marketable Trip Characteristics

143
2004 Travel
Year
Overnight Marketable Trip Profile
Trip Details
The average Travel Party size on Maine trips was 3.4 persons, and comprised of:
spouses (74%), children (26%) friends (22%) parents (9%) all other relatives (17%). Only 5% of people traveled on their own.

144
2004 Travel
Year
Overnight Marketable Trip Profile
Trip Details cont’d
The Maine trips lasted 6.3 nights on average, well beyond the 5.1 night U.S. Norm.
At either end of the scale were the one-third of trips that lasted 1-2 nights versus the four-in-ten that lasted 7+ nights.
The length of stay in Maine was, on average, 4.7 of the 6.3 nights.

145
2004 Travel
Year
Overnight Marketable Trip Profile
Trip Details cont’d
The vast majority of travelers arrived in Maine in their own car (73%).
Few arrived by plane (5%) versus the U.S. Norm (25%) while, more arrived by ferry/boat (5%) versus the U.S. Norm (2%).

146
2004 Travel
Year
Overnight Marketable Trip Profile
Trip Details cont’d
Almost four-in-ten of Marketable trip nights were spent in non-commercial accommodation.
Motels were the leading commercial choice with 17% of nights.

147
2004 Travel
Year
Size of Travel Party
Base: Overnight Marketable Trips
0 1 2 3
Average
Maine
U.S. Norm
2.8
2.8
0.6
0.5
Adults Children
Total: 3.4
Total: 3.3

148
2004 Travel
Year
Composition of Travel Party
Base: Overnight Marketable Trips
0 20 40 60 80
Percent
Spouse/PartnerChild(ren)Friend(s)
Other Relative(s)Parent(s)
Just MyselfBusiness Associate(s)
74
26
22
17
9
5
1
57
25
25
13
12
14
2
Maine U.S. Norm

149
2004 Travel
Year
Total Nights Away
Base: Overnight Marketable Trips
0 10 20 30 40
Percent
1 Night2 Nights
3-4 Nights5-6 Nights
7-13 Nights14+ Nights
12
19
19
13
30
7
13
17
30
13
20
6
Maine 2004 U.S. Norm
Maine U.S. NormAverage Number of Nights 6.3 5.1

150
2004 Travel
Year
Total Nights Away on Maine Trips
Base: Overnight Marketable Trips
0 10 20 30 40
Percent
1 Night2 Nights
3-4 Nights5-6 Nights
7-13 Nights14+ Nights
7
20
23
11
31
9
11
20
20
11
31
7
12
19
19
13
30
7
2002 2003 2004
Average Number of Nights 6.6 6.8 6.3

151
2004 Travel
Year
Length of Stay
Base: Overnight Marketable Trips
0 2 4 6 8
Average
Maine
U.S. Norm
4.7
3.8
1.6
1.4
This Place Other Places
Total: 6.3
Total: 5.2

152
2004 Travel
Year
Transportation Used to Enter Maine
Base: Overnight Marketable Trips from Out-of-state
0 20 40 60 80
Percent
Own CarTruck/Van/RV
Rental Car
Ferry/BoatPlane
Bus
73
7
7
5
5
3
59
9
5
2
25
3
Maine U.S. Norm
Personal
Commercial

153
2004 Travel
Year
Transportation Used in Maine
Base: Overnight Marketable Trips
0 20 40 60 80
Percent
Own CarRental Car
Truck/Van/RVBicycle/Motorcycle
Motor/sailboat
BusFerry/BoatShuttle van
TaxiOther
77
11
8
6
2
6
6
3
1
3
58
15
9
1
1
8
5
7
8
10
Maine U.S. Norm
Personal
Commercial

154
2004 Travel
Year
Accommodations Used*
* Percent of trip nights spent in each type of accommodation
Base: Overnight Marketable Trips
0 20 40 60
Percent
Own house/time-shareMotel
Friends/relatives' houseHotel
Rented house/condoCampground
B&B/Country InnWilderness Camp
Personal/friend/family boatCommercial ships/boats
Other
23
17
14
13
9
9
7
3
3
1
1
2
10
13
42
2
8
2
4
17
Maine U.S. Norm
N/A
N/A

Marketable Trip Experiences

156
2004 Travel
Year
Overnight Marketable Trip Profile
Trip Activities and Experiences
The most popular experiences on Maine trips were: visiting small towns/villages (64%)
the beach/ocean (59%)
eating a lobster (43%) and the unique local foods (34%)
wilderness areas (39%), touring scenic byways (36%), experiencing the natural environment (31%), and visiting historic areas (25%)
shopping for gifts and souvenirs (44%).

157
2004 Travel
Year
Sightseeing
Base: Overnight Marketable Trips
0 20 40 60 80
Percent
Small towns/villagesBeaches/ocean
Lakes/riversWilderness area
Scenic bywayNatural environment
Historic areasViewing wildlife
Wildlife I don't usually seeRural farming areas
Landmarks/historic sitesNational/State ParkBeautiful Fall colors
64
59
42
39
36
31
25
23
22
22
20
17
16
32
30
28
24
17
28
11
14
17
18
12
Maine U.S. Norm
Note: Where U.S. Norm is blank, the Norm is not available.Note: Where U.S. Norm is blank, the Norm is not available.Note: Where U.S. Norm is blank, the Norm is not available.

158
2004 Travel
Year
Sightseeing cont’d
Base: Overnight Marketable Trips
0 20 40 60 80
Percent
Interesting architectureDay cruise
Fair/exhibition/festivalArt museum/galleryHistorical museumShort guided tour
BirdwatchingWhale watching
Theme ParkPick-your-own farm/farm stand
ZooArts & Crafts
Cultural education programScience exhibit
12
10
8
7
6
5
5
5
4
3
3
3
2
1
17
4
5
5
9
3
9
4
9
Maine U.S. Norm
Note: Where U.S. Norm is blank, the Norm is not available.

159
2004 Travel
Year
Sports & Recreation
Base: Overnight Marketable Trips
0 20 40 60
Percent
Went to ocean beachHiking
Swam in a poolWent to lakeside beach
Swam in lake/riverMiniature golf
Used sauna/hot tubCanoeing
Freshwater fishingBicycling
Boardwalk activities
43
16
13
10
10
8
7
7
5
5
4
22
10
20
5
4
5
14
1
5
2
5
Maine U.S. Norm

160
2004 Travel
Year
Sports & Recreation cont’d
Base: Overnight Marketable Trips
0 20 40 60
Percent
Power boating/sailingOutdoor educational program
BackpackingDownhill skiing
Saltwater fishingHunting
Used pro outdoor tour guideSea kayaking
GolfTennis
4
3
3
2
2
2
2
1
1
1
3
2
1
3
1
4
1
Maine U.S. Norm
Note: Where U.S. Norm is blank, the Norm is not available.

161
2004 Travel
Year
Dining & Entertainment
Base: Overnight Marketable Trips
0 20 40 60
Percent
Ate a lobsterUnique local foods
Lobster bake/dinnerElegant restaurantsBar/disco/nightclub
Local musicMusical performanceShows/entertainment
Theatrical eventTheater/dance/symphony/opera
Rock concert
43
34
25
14
12
8
8
7
2
2
1
26
19
12
13
20
4
1
Maine U.S. NormNote: Where U.S. Norm is blank, the Norm is not available.

162
2004 Travel
Year
Shopping
Base: Overnight Marketable Trips
0 20 40 60
Percent
Gifts/Souvenirs
Outlet Shopping
L.L. Bean
Other Shopping
44
32
23
22

163
2004 Travel
Year
Overnight Marketable Trip Profile
Regions Visited
The most frequently visited regions within Maine were, in rank order:
the Southern Maine Coast and Greater Portland/Casco Bay (40-45%),
Mid-Coast, and Downeast Acadia (24%-25%), Maine Lakes & Mountains (16%), Maine Highlands and Kennebec & Moose River Valleys
(10%-11%), and … Aroostook (5%).
The leading main regional destinations were the Southern Maine Coast (29%) and Downeast Acadia (18%) and Greater Portland/Casco Bay (17%).

164
2004 Travel
Year
Regions Visited
Base: Overnight Marketable Trips
0 20 40 60
Percent
Southern Maine CoastGreater Portland/Casco Bay
Mid-CoastDowneast Acadia
Maine Lakes and MountainsMaine Highlands
Kennebec and Moose River ValleysAroostook County
45
40
25
24
16
11
10
5

165
2004 Travel
Year
Main Regional Destination
Base: Overnight Marketable Trips
0 10 20 30 40
Percent
Southern Maine CoastDowneast Acadia
Greater Portland & Casco BayMid-Coast
Maine Lakes & MountainsMaine Highlands
Kennebec & Moose River ValleysAroostook County
29
18
17
11
10
7
6
3

166
2004 Travel
Year
Most Visited Maine Destinations
Base: Overnight Marketable Trips
0 10 20 30 40
Percent
PortlandKittery
FreeportKennebunkport
OgunquitBar Harbor/Acadia Park
Old Orchard BeachBoothbay Harbor
32
28
26
26
23
21
19
12

167
2004 Travel
Year
Most Visited Maine Destinations cont’d
Base: Overnight Marketable Trips
0 10 20 30 40
Percent
CamdenRockland/Rockport
BangorSebago Lake
FryeburgBrunswick
Bethel/Sunday RiverMachias
Kingfield/Sugarloaf
11
11
9
8
5
4
4
4
4

168
2004 Travel
Year
Other Maine Destinations Visited
Base: Overnight Marketable Trips
0 10 20 30 40
Percent
Moosehead Lake
Lewiston
Augusta
Baxter State Park/Katahdin
Calais
The Forks
Jackman
4
4
3
3
3
3
3

169
2004 Travel
Year
Other Maine Destinations Visited cont’d
Base: Overnight Marketable Trips
0 10 20 30 40
Percent
Allagash WaterwayRangeley/Saddleback
St.John ValleyEastport/West Quoddy State
MadawaskaHoulton
Belgrade LakesPresque Isle
3
2
2
2
2
1
1
<1

Product DeliveryImpression of Visitors

171
2004 Travel
Year
Overnight Marketable Trip Profile
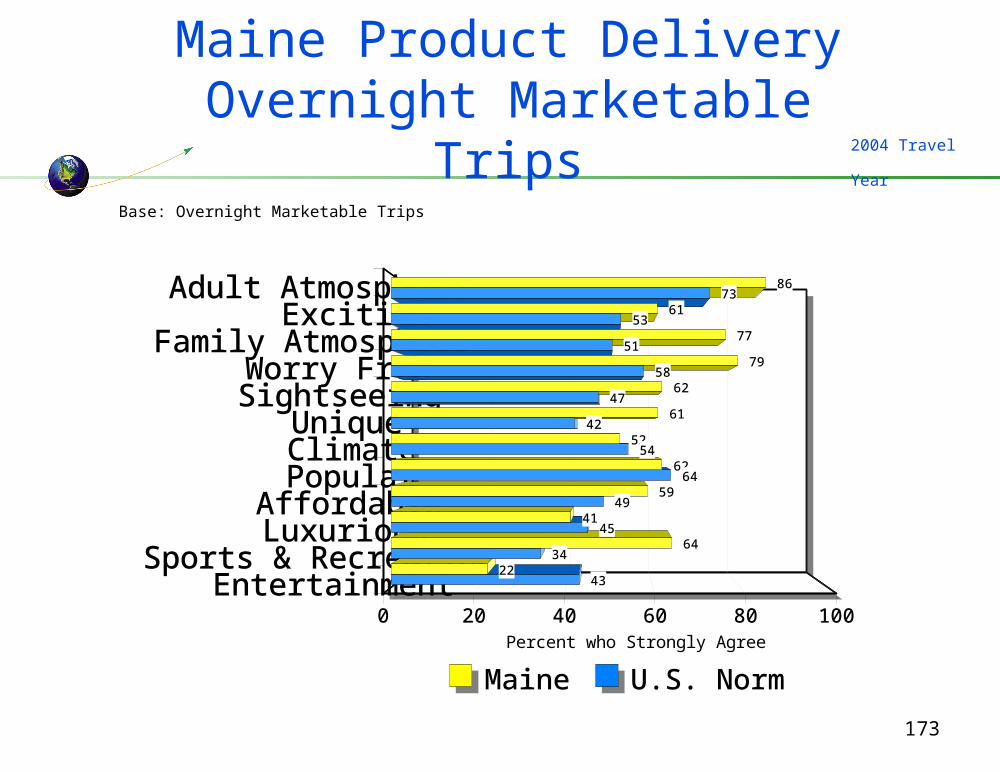
Product Delivery
In order to profile Maine’s product delivery, ratings of Maine by its recent visitors are compared to the U.S. Norm rating across all destinations and their recent visitors.
Maine’s outperforms the U.S. Norm most notably on: the Family Atmosphere, Worry-free, Unique, and Sports &
Recreation factors and on,
related individual attributes and particularly those related to outdoor activities and sports.
It under delivers versus the U.S. Norm most notably on: the Entertainment factor and particularly nightlife.

172
2004 Travel
Year
Traveler Priorities
Base: Overnight Marketable Trips
Relative Importance (Correlation Co-efficient)*
Adult AtmosphereExciting
Family AtmosphereWorry FreeSightseeing
UniqueClimatePopular
AffordableLuxurious
Sports & RecreationEntertainment
Importance
* A measure of the degree of correlation between each factor and the attribute “Would really enjoy visiting.”
173
2004 Travel
Year
Maine Product DeliveryOvernight Marketable Trips
Base: Overnight Marketable Trips
0 20 40 60 80 100Percent who Strongly Agree
Adult AtmosphereExciting
Family AtmosphereWorry Free
SightseeingUniqueClimatePopular
AffordableLuxurious
Sports & RecreationEntertainment
86
61
77
79
62
61
52
62
59
41
64
22
73
53
51
58
47
42
54
64
49
45
34
43
Maine U.S. Norm

174
2004 Travel
Year
Product Strengths vs. U.S. Norm
Base: Overnight Marketable Trips
-20 0 20 40 60 80Difference in Percent Who Strongly Agree
Excellent snow skiing/snowboardingGreat river rafting
Great canoeing/kayakingGood for hiking/backpacking
Excellent huntingExcellent mountain climbing
Great for mountain/off road bicyclingGood place for camping
Interesting B&B's/ InnsGood for viewing wildlife/birds
Beautiful sceneryInteresting small towns/villagesExcellent National/State Parks
Good for families to visit
56
51
46
44
44
43
42
39
38
34
33
31
30
28

175
2004 Travel
Year
Product Strengths vs. U.S. Norm cont’d
Base: Overnight Marketable Trips
-20 0 20 40 60 80Difference in Percent Who Strongly Agree
Not too crowdedSafe anywhere
Warm friendly peopleExcellent fishing
Children would enjoy Unique scenery
Good weather in summerGood place to relax
Great for boating/water sportsSafe in tourist areas
Must see destinationExcellent vacation value
Great beachesI’d really enjoy visitingUnique local cooking
26
26
24
24
24
23
23
21
20
20
20
18
18
16
16

176
2004 Travel
Year
Product Strengths vs. U.S. Norm cont’d
Base: Overnight Marketable Trips
-20 0 20 40 60 80Difference in Percent Who Strongly Agree
Beautiful gardens/parks
Affordable to eat there
Great for walking/strolling
Good for couples
Good vacation packages
Interesting local people
Lots to see and do
A fun place for a vacation
Unique vacation experience
15
14
14
14
14
12
12
12
11

177
2004 Travel
Year
Product Weaknesses vs. U.S. Norm
Base: Overnight Marketable Trips
-40 -20 0 20Difference in Percent Who Strongly Agree
Exciting casinosExciting nightlife/shows
Great live musicGood weather in spring
First class hotelsExcellent climate overall
Excellent museums/galleriesOften notice advertising
Great for theater/artsGreat for winter Trip
Good for meeting/conferenceWell-known landmarks
Great for professional/college sportsNoted for history
Exciting place
-29
-27
-27
-15
-13
-12
-11
-9
-9
-9
-9
-8
-8
-6
-6