travel and tourism in vietnam: demand and flow to … and tourism in vietnam: demand and flow to...
TRANSCRIPT
Travel and Tourism in Vietnam:
Demand and Flow to 2016
Reference code: TT0027MR_SP
Published: June 2012
www.timetric.com
Timetric
John Carpenter House
7 Carmelite Street
London EC4Y 0BS
United Kingdom
Tel: +44 (0)20 7936 6400
Fax: +44 (0)20 7336 6813
TABLE OF CONTENTS
Travel and Tourism in Vietnam: Key Trends and Opportunities to 2016 Published: June 2012
© This report is a licensed product and is not to be photocopied Page 2
Table of Contents
1 Introduction ................................................................................................................. 6
1.1 What is this Report About? ................................................................................................... 6
1.2 Definitions ............................................................................................................................. 6
1.3 Methodology ......................................................................................................................... 8
2 Executive Summary .................................................................................................. 10
3 Tourism Demand Factors ......................................................................................... 11
3.1 Typical Annual Employee Holiday Entitlement by Type ....................................................... 12
3.2 Total Population by Age ...................................................................................................... 13
3.3 Male Population by Age ...................................................................................................... 15
3.4 Female Population by Age .................................................................................................. 17
3.5 Number of Households ....................................................................................................... 19
3.6 Mean Household Income .................................................................................................... 21
3.7 Number of Trips by Season ................................................................................................ 23
3.8 Number of Trips by Residents ............................................................................................. 25
3.9 Average Length of Trips ...................................................................................................... 27
4 Tourism Flows ........................................................................................................... 29
4.1 Analysis of Tourism Flows .................................................................................................. 29
4.2 Total Domestic Trips ........................................................................................................... 31
4.3 Domestic Trips by Region ................................................................................................... 33
4.4 Domestic Trips by Purpose of Visit ..................................................................................... 35
4.4.1 Number of business trips by domestic tourists ............................................................................ 37
4.4.2 Number of leisure trips by domestic tourists ................................................................................ 39
4.4.3 Number of other personal trips by domestic tourists.................................................................... 41
4.5 Number of Overnight Stays on Domestic Trips ................................................................... 43
4.6 Total International Arrivals .................................................................................................. 45
4.7 Number of International Arrivals by Region of Origin ........................................................... 47
4.7.1 International arrivals by Country of origin – Asia-Pacific ............................................................. 49
4.7.2 International arrivals by Country of origin – Europe ..................................................................... 51
4.7.3 International arrivals by Country of origin – North America ......................................................... 52
4.8 International Arrivals by Purpose of Visit ............................................................................. 53
4.8.1 Inbound business tourist volume trend ........................................................................................ 55
4.8.2 Inbound leisure tourist volume trend ............................................................................................ 57
4.8.3 Inbound other tourist volume trend .............................................................................................. 59
4.9 Total International Departures ............................................................................................. 61
4.10 Number of International Departures by Destination ............................................................. 63
4.10.1 International departures to North America ................................................................................... 65
4.11 International Departures by Purpose of Visit ....................................................................... 66
4.11.1 Outbound business tourist volume trend ..................................................................................... 68
TABLE OF CONTENTS
Travel and Tourism in Vietnam: Key Trends and Opportunities to 2016 Published: June 2012
© This report is a licensed product and is not to be photocopied Page 3
4.11.2 Outbound leisure tourist volume trend ......................................................................................... 70
4.11.3 Outbound other tourist volume trend ........................................................................................... 72
4.12 Number of Overnight Stays on International Trips ............................................................... 74
5 Appendix .................................................................................................................... 76
5.1 Methodology ....................................................................................................................... 76
5.2 Contact Us .......................................................................................................................... 76
5.3 About Timetric..................................................................................................................... 76
5.4 Disclaimer ........................................................................................................................... 77
TABLE OF CONTENTS
Travel and Tourism in Vietnam: Key Trends and Opportunities to 2016 Published: June 2012
© This report is a licensed product and is not to be photocopied Page 4
List of Figures
Figure 1: Vietnam – Typical Holiday Entitlement of Employees per Annum, 2007–2011 ......................................................................... 12 Figure 2: Vietnam – Total Population by Age Group (% Share), 2007–2011 ........................................................................................... 13 Figure 3: Vietnam – Total Population by Age Group (% Share), 2011–2016 ........................................................................................... 14 Figure 4: Vietnam – Male Population by Age Group (% Share), 2007–2011 ........................................................................................... 15 Figure 5: Vietnam – Male Population by Age Group (% Share), 2011–2016 ........................................................................................... 16 Figure 6: Vietnam – Female Population by Age Group (% Share), 2007–2011 ....................................................................................... 17 Figure 7: Vietnam – Female Population by Age Group (% Share), 2011–2016 ....................................................................................... 18 Figure 8: Vietnam – Number of Households (Million), 2007–2011 ........................................................................................................... 19 Figure 9: Vietnam – Number of Households (Million), 2011–2016 ........................................................................................................... 20 Figure 10: Vietnam – Mean Household Income (US$), 2007–2011 ......................................................................................................... 21 Figure 11: Vietnam – Mean Household Income (US$), 2011–2016 ......................................................................................................... 22 Figure 12: Vietnam – Number of Trips by Season (% Share), 2007–2011 .............................................................................................. 23 Figure 13: Vietnam – Number of Trips by Season (% Share), 2011–2016 .............................................................................................. 24 Figure 14: Vietnam – Number of Trips by Residents (Million), 2007–2011 .............................................................................................. 25 Figure 15: Vietnam – Number of Trips by Residents (Million), 2011–2016 .............................................................................................. 26 Figure 16: Vietnam – Average Length of Trips (Nights), 2007–2011 ....................................................................................................... 27 Figure 17: Vietnam – Average Length of Trips (Nights), 2011–2016 ....................................................................................................... 28 Figure 18: Vietnam – Total Domestic Trips (Million), 2007–2011 ............................................................................................................ 31 Figure 19: Vietnam – Total Domestic Trips (Million), 2011–2016 ............................................................................................................ 32 Figure 20: Vietnam – Number of Domestic Trips by Region (% Share), 2011–2016................................................................................ 34 Figure 21: Vietnam – Domestic Trips by Purpose of Visit (% Share), 2007–2011 ................................................................................... 35 Figure 22: Vietnam – Domestic Trips by Purpose of Visit (% Share), 2011–2016 ................................................................................... 36 Figure 23: Vietnam – Domestic Business Trips (Million), 2007–2011 ...................................................................................................... 37 Figure 24: Vietnam – Domestic Business Trips (Million), 2011–2016 ...................................................................................................... 38 Figure 25: Vietnam – Domestic Leisure Trips (Million), 2007–2011 ......................................................................................................... 39 Figure 26: Vietnam – Domestic Leisure Trips (Million), 2011–2016 ......................................................................................................... 40 Figure 27: Vietnam – Other Personal Domestic Tourist Trips (Million), 2007–2011 ................................................................................. 41 Figure 28: Vietnam – Other Personal Domestic Tourist Trips (Million), 2011–2016 ................................................................................. 42 Figure 29: Vietnam – Number of Overnight Stays on Domestic Trips (Million), 2007–2011 ..................................................................... 43 Figure 30: Vietnam – Number of Overnight Stays on Domestic Trips (Million), 2011–2016 ..................................................................... 44 Figure 31: Vietnam – Total International Arrivals (Million), 2007–2011 .................................................................................................... 45 Figure 32: Vietnam – Total International Arrivals (Million), 2011–2016 .................................................................................................... 46 Figure 33: Vietnam – Number of International Arrivals by Region of Origin (% Share), 2011 and 2016 ................................................... 48 Figure 34: Vietnam – International Arrivals by Country of Origin – Asia-Pacific (% Share), 2007–2011 ................................................... 50 Figure 35: Vietnam – International Arrivals by Country of Origin – Europe (% Share), 2007–2011 .......................................................... 51 Figure 36: Vietnam – International Arrivals by Country of Origin – North America (% Share), 2007–2011 ............................................... 52 Figure 37: Vietnam – International Arrivals by Purpose of Visit (% Share), 2007–2011 ........................................................................... 53 Figure 38: Vietnam – International Arrivals by Purpose of Visit (% Share), 2011–2016 ........................................................................... 54 Figure 39: Vietnam – Inbound Business Tourist Volume (Thousand), 2007–2011 .................................................................................. 55 Figure 40: Vietnam – Inbound Business Tourist Volume (Thousand), 2011–2016 .................................................................................. 56 Figure 41: Vietnam – Inbound Leisure Tourist Volume (Million), 2007–2011 ........................................................................................... 57 Figure 42: Vietnam – Inbound Leisure Tourist Volume (Million), 2011–2016 ........................................................................................... 58 Figure 43: Vietnam – Inbound Other Tourist Volume (Thousand), 2007–2011 ........................................................................................ 59 Figure 44: Vietnam – Inbound Other Tourist Volume (Thousand), 2011–2016 ........................................................................................ 60 Figure 45: Vietnam – Total International Departures (Million), 2007–2011 .............................................................................................. 61 Figure 46: Vietnam – Total International Departures (Million), 2011–2016 .............................................................................................. 62 Figure 47: Vietnam – Number of International Departures by Destination (% Share), 2011–2016 ........................................................... 64 Figure 48: Vietnam – International Departures – North America (% Share), 2007–2011 ......................................................................... 65 Figure 49: Vietnam – International Departures by Purpose of Visit (% Share), 2007–2011 ..................................................................... 66 Figure 50: Vietnam – International Departures by Purpose of Visit (% Share), 2011–2016 ..................................................................... 67 Figure 51: Vietnam – Outbound Business Tourist Volume (Thousand), 2007–2011 ................................................................................ 68 Figure 52: Vietnam – Outbound Business Tourist Volume (Thousand), 2011–2016 ................................................................................ 69 Figure 53: Vietnam – Outbound Leisure Tourist Volume (Thousand), 2007–2011 .................................................................................. 70 Figure 54: Vietnam – Outbound Leisure Tourist Volume (Thousand), 2011–2016 .................................................................................. 71 Figure 55: Vietnam – Outbound Other Tourist Volume (Thousand), 2007–2011 ..................................................................................... 72 Figure 56: Vietnam – Outbound Other Tourist Volume (Thousand), 2011–2016 ..................................................................................... 73 Figure 57: Vietnam – Number of Overnight Stays (Million), 2007–2011 .................................................................................................. 74 Figure 58: Vietnam – Number of Overnight Stays (Million), 2011–2016 .................................................................................................. 75

TABLE OF CONTENTS
Travel and Tourism in Vietnam: Key Trends and Opportunities to 2016 Published: June 2012
© This report is a licensed product and is not to be photocopied Page 5
List of Tables
Table 1: Travel and Tourism Industry Definitions ...................................................................................................................................... 6 Table 2: Vietnam – Typical Holiday Entitlement of Employees per Annum, 2007–2011 .......................................................................... 12 Table 3: Vietnam – Total Population by Age Group (Million), 2007–2011 ................................................................................................ 13 Table 4: Vietnam – Total Population by Age Group (Million), 2011–2016 ................................................................................................ 14 Table 5: Vietnam – Male Population by Age Group (Million), 2007–2011 ................................................................................................ 15 Table 6: Vietnam – Male Population by Age Group (Million), 2011–2016 ................................................................................................ 16 Table 7: Vietnam – Female Population by Age Group (Million), 2007–2011 ............................................................................................ 17 Table 8: Vietnam – Female Population by Age Group (Million), 2011–2016 ............................................................................................ 18 Table 9: Vietnam – Number of Households (Million), 2007–2011 ............................................................................................................ 19 Table 10: Vietnam – Number of Households (Million), 2011–2016 .......................................................................................................... 20 Table 11: Vietnam – Mean Household Income (US$), 2007–2011 .......................................................................................................... 21 Table 12: Vietnam – Mean Household Income (US$), 2011–2016 .......................................................................................................... 22 Table 13: Vietnam – Number of Trips by Season (Million), 2007–2011 ................................................................................................... 23 Table 14: Vietnam – Number of Trips by Season (Million), 2011–2016 ................................................................................................... 24 Table 15: Vietnam – Number of Trips by Residents (Million), 2007–2011 ............................................................................................... 25 Table 16: Vietnam – Number of Trips by Residents (Million), 2011–2016 ............................................................................................... 26 Table 17: Vietnam – Average Length of Trips (Nights), 2007–2011 ........................................................................................................ 27 Table 18: Vietnam – Average Length of Trips (Nights), 2011–2016 ........................................................................................................ 28 Table 19: Vietnam – Total Domestic Trips (Million), 2007–2011 .............................................................................................................. 31 Table 20: Vietnam – Total Domestic Trips (Million), 2011–2016 .............................................................................................................. 32 Table 21: Vietnam – Number of Domestic Trips by Region (Thousand), 2007–2011 ............................................................................... 33 Table 22: Vietnam – Number of Domestic Trips by Region (Thousand), 2011–2016 ............................................................................... 34 Table 23: Vietnam – Domestic Trips by Purpose of Visit (Million), 2007–2011 ........................................................................................ 35 Table 24: Vietnam – Domestic Trips by Purpose of Visit (Million), 2011–2016 ........................................................................................ 36 Table 25: Vietnam – Domestic Business Trips (Million), 2007–2011 ....................................................................................................... 37 Table 26: Vietnam – Domestic Business Trips (Million), 2011–2016 ....................................................................................................... 38 Table 27: Vietnam – Domestic Leisure Trips (Million), 2007–2011 .......................................................................................................... 39 Table 28: Vietnam – Domestic Leisure Trips (Million), 2011–2016 .......................................................................................................... 40 Table 29: Vietnam – Other Personal Domestic Tourist Trips (Million), 2007–2011 .................................................................................. 41 Table 30: Vietnam – Other Personal Domestic Tourist Trips (Million), 2011–2016 .................................................................................. 42 Table 31: Vietnam – Number of Overnight Stays on Domestic Trips (Million), 2007–2011 ...................................................................... 43 Table 32: Vietnam – Number of Overnight Stays on Domestic Trips (Million), 2011–2016 ...................................................................... 44 Table 33: Vietnam – Total International Arrivals (Million), 2007–2011 ..................................................................................................... 45 Table 34: Vietnam – Total International Arrivals (Million), 2011–2016 ..................................................................................................... 46 Table 35: Vietnam – Number of International Arrivals by Region of Origin (Thousand), 2007–2011 ........................................................ 47 Table 36: Vietnam – Number of International Arrivals by Region of Origin (Thousand), 2011–2016 ........................................................ 48 Table 37: Vietnam – International Arrivals by Country of Origin – Asia-Pacific (Thousand), 2007–2011 .................................................. 49 Table 38: Vietnam – International Arrivals by Country of Origin – Europe (Thousand), 2007–2011 ......................................................... 51 Table 39: Vietnam – International Arrivals by Country of Origin – North America (Thousand), 2007–2011 .............................................. 52 Table 40: Vietnam – International Arrivals by Purpose of Visit (Thousand), 2007–2011 .......................................................................... 53 Table 41: Vietnam – International Arrivals by Purpose of Visit (Thousand), 2011–2016 .......................................................................... 54 Table 42: Vietnam – Inbound Business Tourist Volume (Thousand), 2007–2011 .................................................................................... 55 Table 43: Vietnam – Inbound Business Tourist Volume (Thousand), 2011–2016 .................................................................................... 56 Table 44: Vietnam – Inbound Leisure Tourist Volume (Million), 2007–2011 ............................................................................................ 57 Table 45: Vietnam – Inbound Leisure Tourist Volume (Million), 2011–2016 ............................................................................................ 58 Table 46: Vietnam – Inbound Other Tourist Volume (Thousand), 2007–2011 ......................................................................................... 59 Table 47: Vietnam – Inbound Other Tourist Volume (Thousand), 2011–2016 ......................................................................................... 60 Table 48: Vietnam – Total International Departures (Million), 2007–2011 ............................................................................................... 61 Table 49: Vietnam – Total International Departures (Million), 2011–2016 ............................................................................................... 62 Table 50: Vietnam – Number of International Departures by Destination (Thousand), 2007–2011 .......................................................... 63 Table 51: Vietnam – Number of International Departures by Destination (Thousand), 2011–2016 .......................................................... 64 Table 52: Vietnam – International Departures – North America (Thousand), 2007–2011 ........................................................................ 65 Table 53: Vietnam – International Departures by Purpose of Visit (Thousand), 2007–2011 .................................................................... 66 Table 54: Vietnam – International Departures by Purpose of Visit (Thousand), 2011–2016 .................................................................... 67 Table 55: Vietnam – Outbound Business Tourist Volume (Thousand), 2007–2011 ................................................................................. 68 Table 56: Vietnam – Outbound Business Tourist Volume (Thousand), 2011–2016 ................................................................................. 69 Table 57: Vietnam – Outbound Leisure Tourist Volume (Thousand), 2007–2011 .................................................................................... 70 Table 58: Vietnam – Outbound Leisure Tourist Volume (Thousand), 2011–2016 .................................................................................... 71 Table 59: Vietnam – Outbound Other Tourist Volume (Thousand), 2007–2011 ...................................................................................... 72 Table 60: Vietnam – Outbound Other Tourist Volume (Thousand), 2011–2016 ...................................................................................... 73 Table 61: Vietnam – Number of Overnight Stays (Million), 2007–2011 ................................................................................................... 74 Table 62: Vietnam – Number of Overnight Stays (Million), 2011–2016 ................................................................................................... 75
INTRODUCTION
Travel and Tourism in Vietnam: Key Trends and Opportunities to 2016 Published: June 2012
© This report is a licensed product and is not to be photocopied Page 6
1 Introduction
1.1 What is this Report About?
This report is the result of extensive research on travel and tourism in Vietnam, covering the demand
factors that influence tourism as well as analysis of the tourism flows with the country. It also provides
insights on the market size and forecast of travel and tourism in Vietnam.
1.2 Definitions
For the purposes of this report, the following timeframes apply:
Review period: 2007–2011
Forecast period: 2012–2016
Base Year: 2011
Note: the CAGRs calculated for the forecast period include the base year of 2011.
All values in tables, with the exception of compound annual growth rates (CAGRs), are displayed to one
decimal place, although smaller numbers may be displayed to two decimal places for clarity. Growth
rates may, as a result, appear inconsistent with absolute values due to this rounding method..
The key market categories featured in the report are defined below:
Table 1: Travel and Tourism Industry Definitions
Term Definition
Tourism demand factors Factors that influence the time and money spent on tourism. Typical tourism demand factors include the amount of holiday leave available to the average employee in the country, and mean household income.
Annual employee holiday entitlement
The number of days the average resident of a country will accrue annually through entitled holidays, including annual leave and public holidays. Public holidays are statutory holidays that a country’s residents are entitled to.
Domestic trip A trip taken to a destination within the traveler’s country of residence.
International trip A trip taken to a destination outside the traveler’s country of residence.
Trips taken by season The number of domestic and international trips undertaken by the residents of a country, segmented by four seasons: January–March, April–June, July–September and October–December.
Number of trips by residents
The number of trips undertaken by the residents of a country, segmented by domestic and international trips.
Average length of trip The average number of nights spent by the residents of a country, segmented by domestic and international trips.
Tourism flow factors Factors that influence the flow of tourists from one location to another.
Number of overnight stays
The total number of nights spent by the residents of a country on all tourism trips during a given year.
International arrivals The number of foreign nationals entering a country. For example, a person from Canada that visits France would be an international arrival to France.
Leisure trips Trips for holidaying, recreation, or visits to friends and relatives
Business trips Trips involving business as the primary purpose. It includes trips for meetings, incentives,

INTRODUCTION
Travel and Tourism in Vietnam: Key Trends and Opportunities to 2016 Published: June 2012
© This report is a licensed product and is not to be photocopied Page 7
Table 1: Travel and Tourism Industry Definitions
Term Definition
conventions and exhibitions (MICE) purposes, events and conferences.
Other trips Trips for purposes other than leisure or business, such as education, sports or pilgrimage.
International departures The total number of citizens leaving their home country and arriving in other countries. This will be higher than the total number of citizens leaving their home country, as a traveler might travel in more than one country after leaving their home country.
Source: Timetric analysis © Timetric
INTRODUCTION
Travel and Tourism in Vietnam: Key Trends and Opportunities to 2016 Published: June 2012
© This report is a licensed product and is not to be photocopied Page 8
1.3 Methodology
All travel and tourism reports are created by following a comprehensive, four-stage methodology. This
includes market study, research, analysis and quality control.
1) Market Study
A. Standardization
Definitions are specified using recognized industry classifications. The same definition is
used for every country.
Annual average currency exchange rates are used for the latest completed year. These
are then applied across both the historical and forecast data to remove exchange rate
fluctuations.
B. Internal audit
Review of in-house databases to gather existing data:
o Historic market databases and reports
o Company database
C. Trend monitoring
Review of the latest travel and tourism companies and industry trends
2) Research
A. Sources
Collection of the latest market-specific data from a wide variety of industry sources: o Government statistics
o Industry associations
o Company filings
o International organizations
o Travel and tourism agencies
B. Expert opinion
Collation of opinion taken from leading travel and tourism industry experts
Analysis of third-party opinion and forecasts: o Broker reports
o Media
o Official government sources
C. Data consolidation and verification
Consolidation of data and opinion to create historical datasets
Creation of models to benchmark data across sectors and geographies
INTRODUCTION
Travel and Tourism in Vietnam: Key Trends and Opportunities to 2016 Published: June 2012
© This report is a licensed product and is not to be photocopied Page 9
3) Analysis
A. Market forecasts
Feeding forecast data into market models: o Macroeconomic indicators
o Industry-specific drivers
Analysis of travel and tourism industry database to identify trends: o Latest travel and tourism trends
o Key drivers of the travel and tourism industry
B. Report Writing
Analysis of market data
Discussion of company and industry trends and issues
Review of financial deals and travel and tourism trends
4) Quality Control
A. Templates
Detailed process manuals
Standardized report templates and accompanying style guides
Complex forecasting tool used to ensure forecast methodologies are consistently applied
Quality control checklists
B. Quality Control process
Peer review
Senior-level QC
Random spot checks on data integrity
Benchmark checks across databases
Market data cross-checked for consistency with accumulated data from: o Company filings
o Government sources

EXECUTIVE SUMMARY
Travel and Tourism in Vietnam: Key Trends and Opportunities to 2016 Published: June 2012
© This report is a licensed product and is not to be photocopied Page 10
2 Executive Summary
Vietnam was ranked the fourteenth most attractive destination to develop a travel and tourism business
in across the Asia-Pacific region in 2011, according to the Travel and Tourism Competitive Index
(TTCI). Travel and tourism in Vietnam contributed 4.2% to the national GDP in 2011 and accounted for
3.0% of the country’s total employment in 2011. The total number of trips undertaken by residents
increased at a CAGR of 9.05% during the review period. The main reasons for this growth include
Vietnam’s growing economy, hosting of international fairs and exhibitions, government initiatives to
promote the country as an attractive tourist destination, and increasing level of leisure and business
travel.

VIETNAMESE TOURISM DEMAND FACTORS
Travel and Tourism in Vietnam: Key Trends and Opportunities to 2016 Published: June 2012
© This report is a licensed product and is not to be photocopied Page 11
3 Tourism Demand Factors
There are XX public holidays officially recognized by the Vietnamese government: New Year’s Day,
Vietnamese New Year or Lunar New Year that is observed for four days, Hung Kings Commemoration,
Vietnamese Liberation Day or Victory Day, International Labour Day, and Vietnam National Day. Annual
public holidays are widely observed by private companies, as well as state and local governments. The
employees in Vietnam also receive XX days paid holiday allowance after completing one year of
service.
There were XX.X million households in Vietnam in 2011, which contained XX.X persons per household.
A typical Vietnamese household has a mean income of US$XX. The country’s household income levels
were affected by the economic crisis in 2009, which led the growth rate of annual household incomes to
decelerate from XX.X% in 2008 to XX.X% in 2009. However, the mean household income continued to
increase at a slow pace since 2009.
VIETNAMESE TOURISM DEMAND FACTORS
Travel and Tourism in Vietnam: Key Trends and Opportunities to 2016 Published: June 2012
© This report is a licensed product and is not to be photocopied Page 12
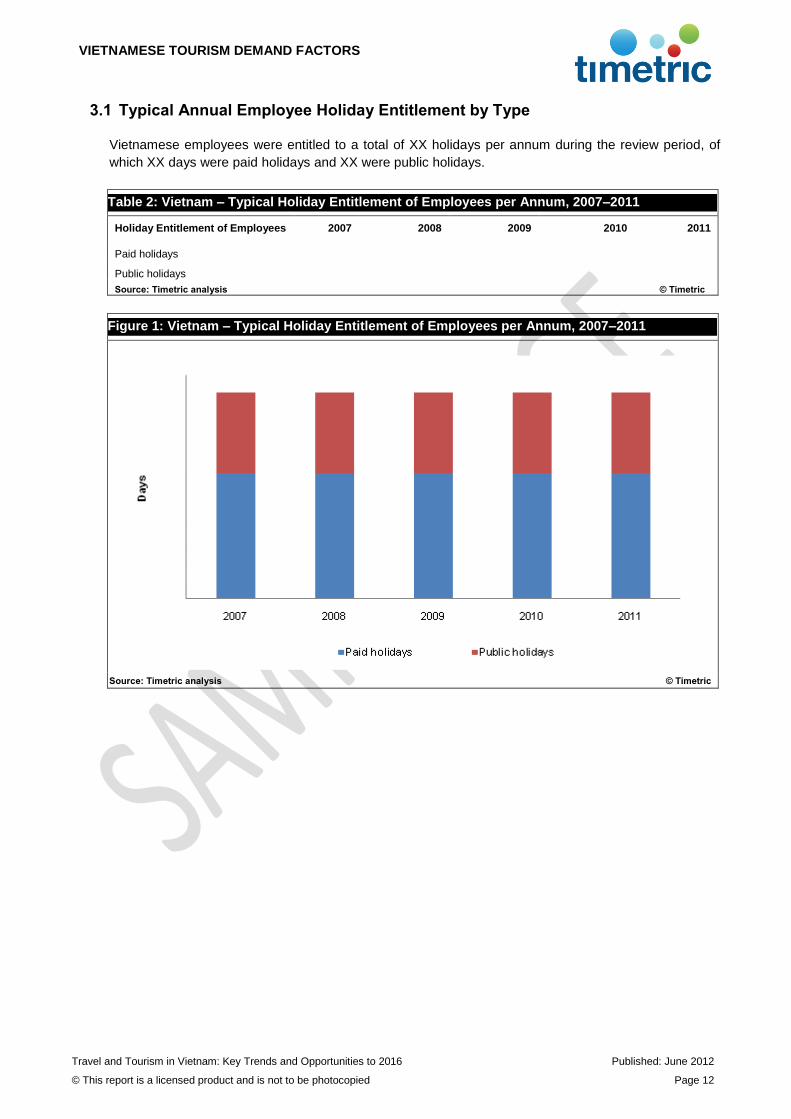
3.1 Typical Annual Employee Holiday Entitlement by Type
Vietnamese employees were entitled to a total of XX holidays per annum during the review period, of
which XX days were paid holidays and XX were public holidays.
Table 2: Vietnam – Typical Holiday Entitlement of Employees per Annum, 2007–2011
Holiday Entitlement of Employees 2007 2008 2009 2010 2011
Paid holidays
Public holidays Source: Timetric analysis © Timetric
Figure 1: Vietnam – Typical Holiday Entitlement of Employees per Annum, 2007–2011
Source: Timetric analysis © Timetric

VIETNAMESE TOURISM DEMAND FACTORS
Travel and Tourism in Vietnam: Key Trends and Opportunities to 2016 Published: June 2012
© This report is a licensed product and is not to be photocopied Page 13
3.2 Total Population by Age
Vietnam’s total population size increased from XX.X million in 2007 to XX.X million in 2011, at a CAGR
of XX.X% during the review period. The 0–14 years age group accounted for the largest share of
XX.X% of the total population in 2011, followed by the 15–24 years age group with the second-largest
share of XX.X% and the 25–34 years age group with the third-largest share of XX.X%.
Table 3: Vietnam – Total Population by Age Group (Million), 2007–2011
Age Group 2007 2008 2009 2010 2011 CAGR 2007–2011
0–14
15–24
25–34
35–44
45–54
55–64
65+
Total Source: US Census Bureau and Timetric analysis © Timetric
Figure 2: Vietnam – Total Population by Age Group (% Share), 2007–2011
Source: US Census Bureau and Timetric analysis © Timetric
VIETNAMESE TOURISM DEMAND FACTORS
Travel and Tourism in Vietnam: Key Trends and Opportunities to 2016 Published: June 2012
© This report is a licensed product and is not to be photocopied Page 14
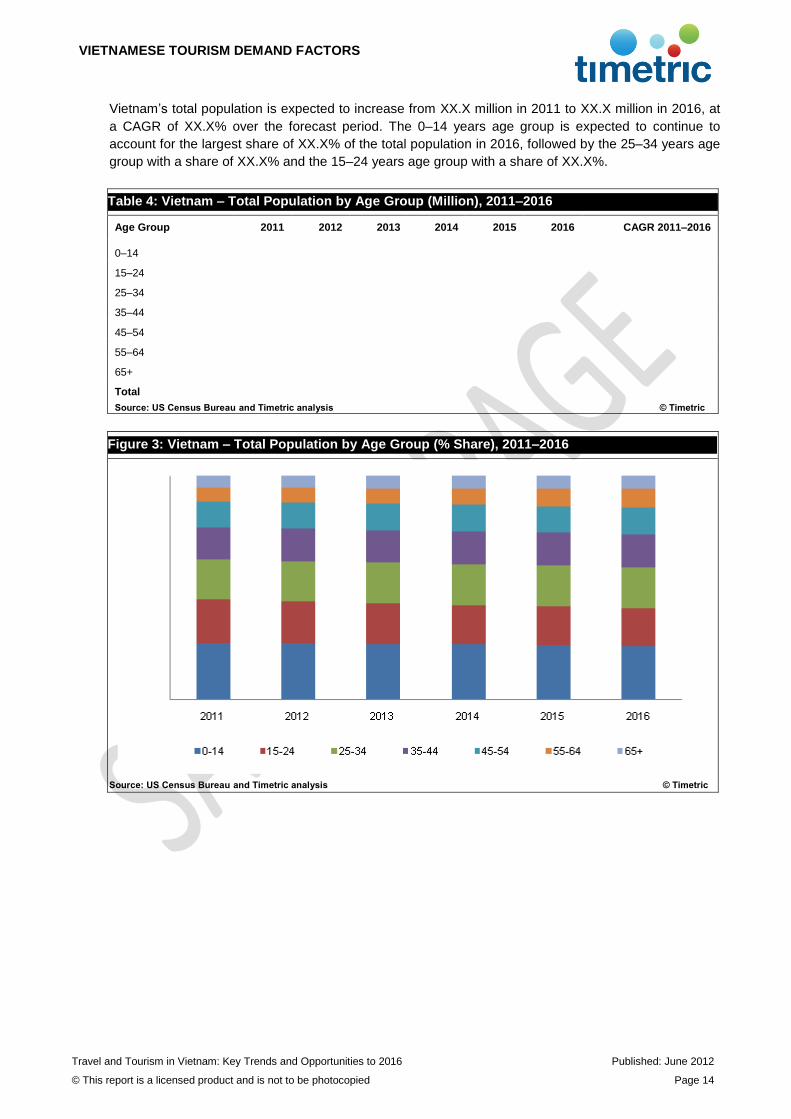
Vietnam’s total population is expected to increase from XX.X million in 2011 to XX.X million in 2016, at
a CAGR of XX.X% over the forecast period. The 0–14 years age group is expected to continue to
account for the largest share of XX.X% of the total population in 2016, followed by the 25–34 years age
group with a share of XX.X% and the 15–24 years age group with a share of XX.X%.
Table 4: Vietnam – Total Population by Age Group (Million), 2011–2016
Age Group 2011 2012 2013 2014 2015 2016 CAGR 2011–2016
0–14
15–24
25–34
35–44
45–54
55–64
65+
Total
Source: US Census Bureau and Timetric analysis © Timetric
Figure 3: Vietnam – Total Population by Age Group (% Share), 2011–2016
Source: US Census Bureau and Timetric analysis © Timetric
VIETNAMESE TOURISM DEMAND FACTORS
Travel and Tourism in Vietnam: Key Trends and Opportunities to 2016 Published: June 2012
© This report is a licensed product and is not to be photocopied Page 15
3.3 Number of Households
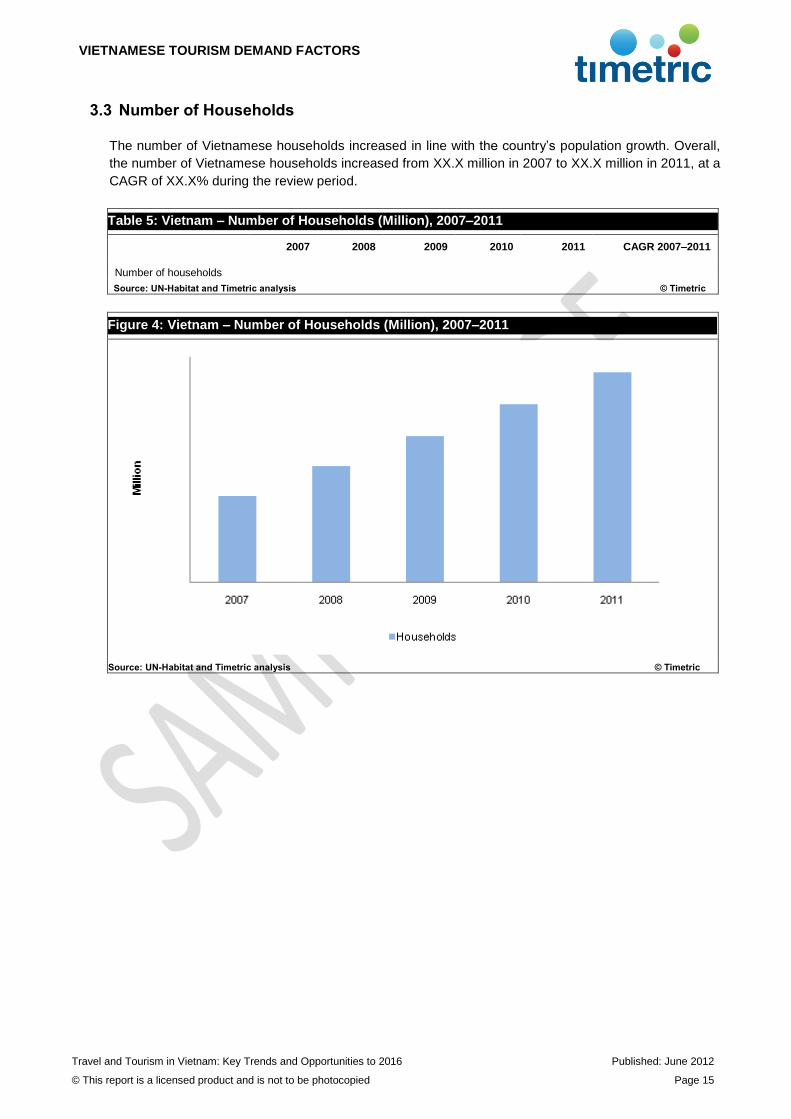
The number of Vietnamese households increased in line with the country’s population growth. Overall,
the number of Vietnamese households increased from XX.X million in 2007 to XX.X million in 2011, at a
CAGR of XX.X% during the review period.
Table 5: Vietnam – Number of Households (Million), 2007–2011
2007 2008 2009 2010 2011 CAGR 2007–2011
Number of households Source: UN-Habitat and Timetric analysis © Timetric
Figure 4: Vietnam – Number of Households (Million), 2007–2011
Source: UN-Habitat and Timetric analysis © Timetric
VIETNAMESE TOURISM DEMAND FACTORS
Travel and Tourism in Vietnam: Key Trends and Opportunities to 2016 Published: June 2012
© This report is a licensed product and is not to be photocopied Page 16
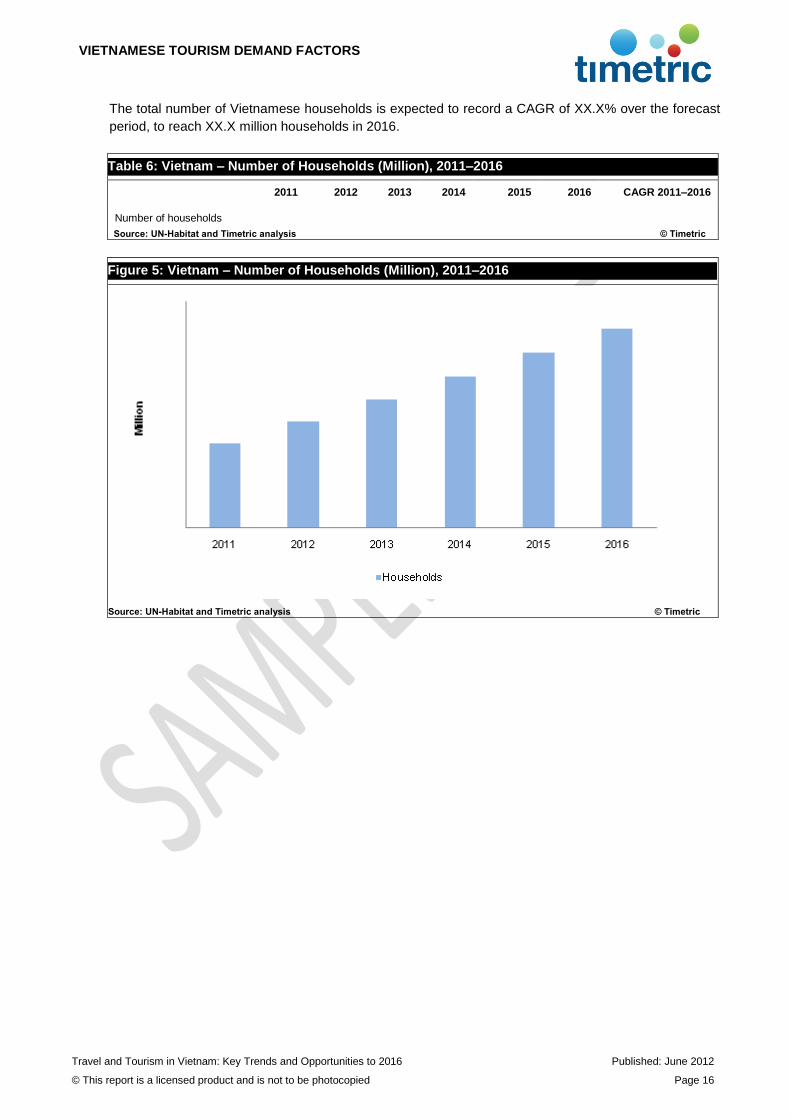
The total number of Vietnamese households is expected to record a CAGR of XX.X% over the forecast
period, to reach XX.X million households in 2016.
Table 6: Vietnam – Number of Households (Million), 2011–2016
2011 2012 2013 2014 2015 2016 CAGR 2011–2016
Number of households
Source: UN-Habitat and Timetric analysis © Timetric
Figure 5: Vietnam – Number of Households (Million), 2011–2016
Source: UN-Habitat and Timetric analysis © Timetric
VIETNAMESE TOURISM DEMAND FACTORS
Travel and Tourism in Vietnam: Key Trends and Opportunities to 2016 Published: June 2012
© This report is a licensed product and is not to be photocopied Page 17
3.4 Mean Household Income
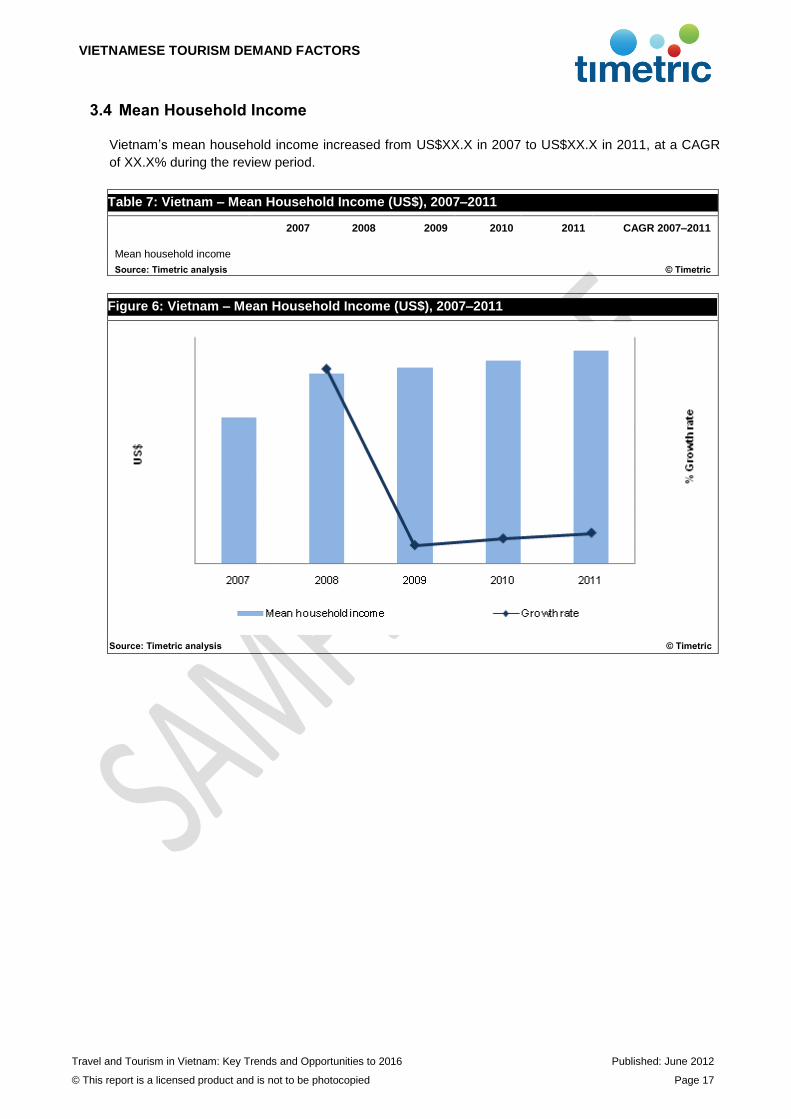
Vietnam’s mean household income increased from US$XX.X in 2007 to US$XX.X in 2011, at a CAGR
of XX.X% during the review period.
Table 7: Vietnam – Mean Household Income (US$), 2007–2011
2007 2008 2009 2010 2011 CAGR 2007–2011
Mean household income Source: Timetric analysis © Timetric
Figure 6: Vietnam – Mean Household Income (US$), 2007–2011
Source: Timetric analysis © Timetric
VIETNAMESE TOURISM DEMAND FACTORS
Travel and Tourism in Vietnam: Key Trends and Opportunities to 2016 Published: June 2012
© This report is a licensed product and is not to be photocopied Page 18
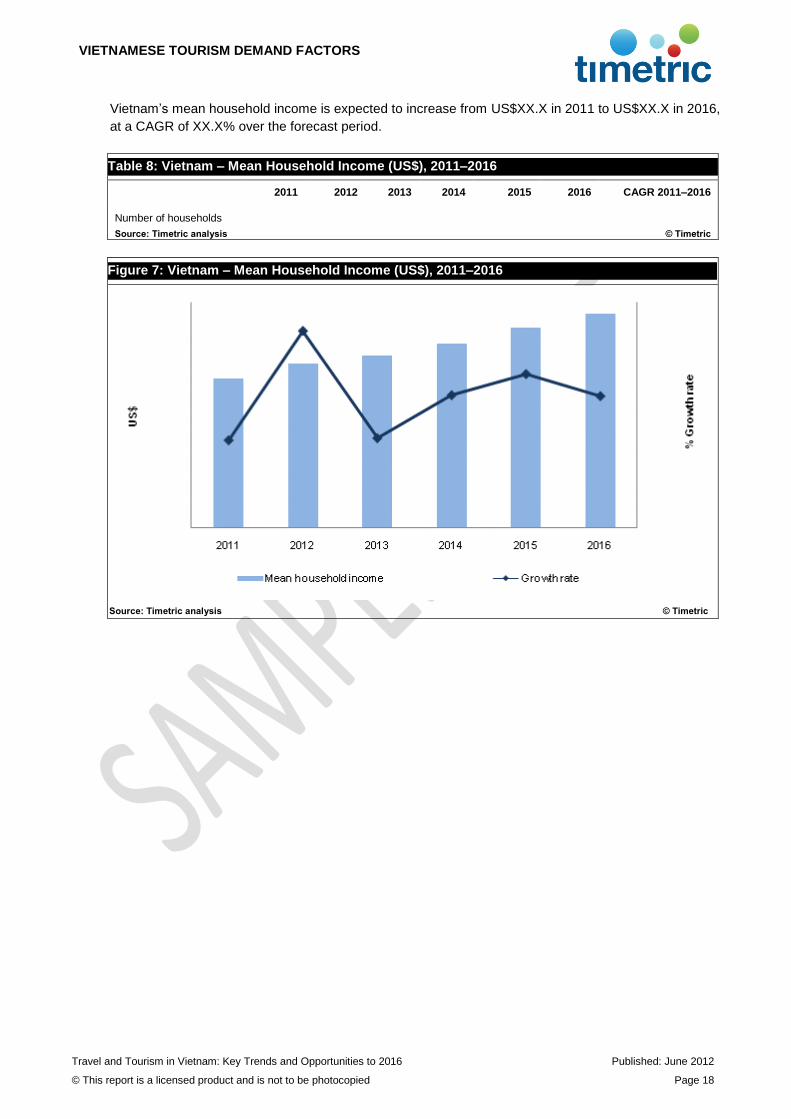
Vietnam’s mean household income is expected to increase from US$XX.X in 2011 to US$XX.X in 2016,
at a CAGR of XX.X% over the forecast period.
Table 8: Vietnam – Mean Household Income (US$), 2011–2016
2011 2012 2013 2014 2015 2016 CAGR 2011–2016
Number of households
Source: Timetric analysis © Timetric
Figure 7: Vietnam – Mean Household Income (US$), 2011–2016
Source: Timetric analysis © Timetric
VIETNAMESE TOURISM DEMAND FACTORS
Travel and Tourism in Vietnam: Key Trends and Opportunities to 2016 Published: June 2012
© This report is a licensed product and is not to be photocopied Page 19
3.5 Number of Trips by Season
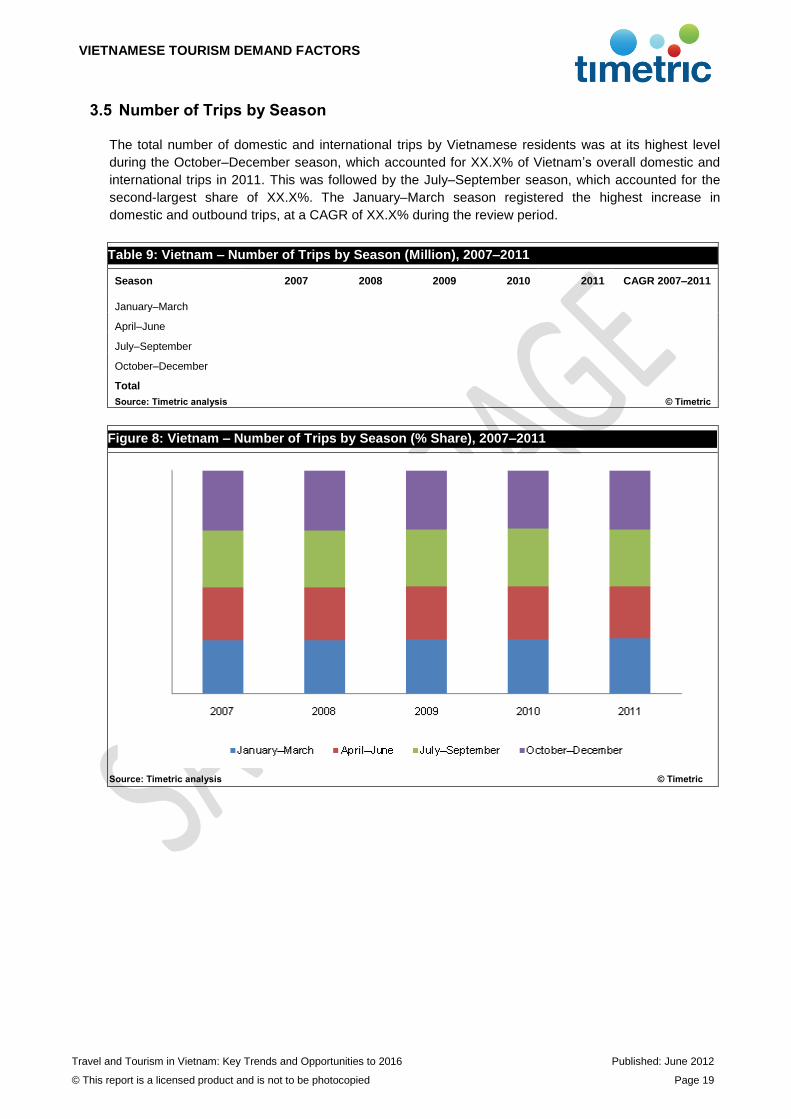
The total number of domestic and international trips by Vietnamese residents was at its highest level
during the October–December season, which accounted for XX.X% of Vietnam’s overall domestic and
international trips in 2011. This was followed by the July–September season, which accounted for the
second-largest share of XX.X%. The January–March season registered the highest increase in
domestic and outbound trips, at a CAGR of XX.X% during the review period.
Table 9: Vietnam – Number of Trips by Season (Million), 2007–2011
Season 2007 2008 2009 2010 2011 CAGR 2007–2011
January–March
April–June
July–September
October–December
Total Source: Timetric analysis © Timetric
Figure 8: Vietnam – Number of Trips by Season (% Share), 2007–2011
Source: Timetric analysis © Timetric
VIETNAMESE TOURISM DEMAND FACTORS
Travel and Tourism in Vietnam: Key Trends and Opportunities to 2016 Published: June 2012
© This report is a licensed product and is not to be photocopied Page 20
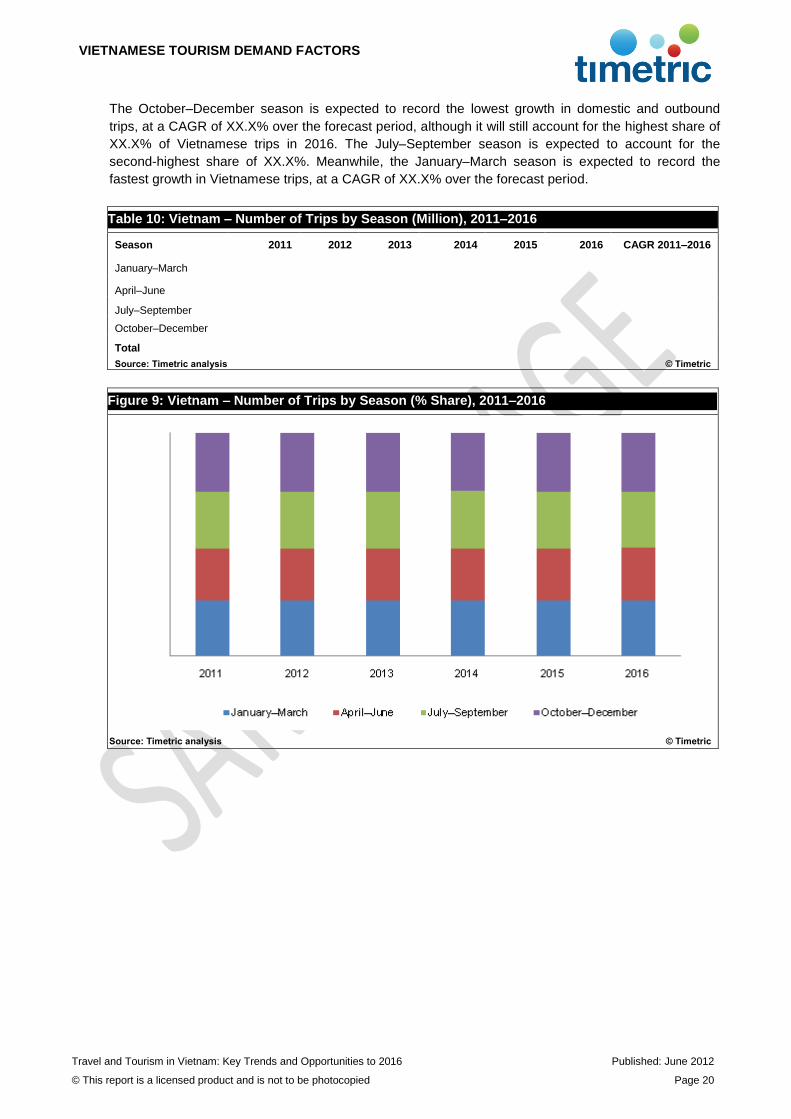
The October–December season is expected to record the lowest growth in domestic and outbound
trips, at a CAGR of XX.X% over the forecast period, although it will still account for the highest share of
XX.X% of Vietnamese trips in 2016. The July–September season is expected to account for the
second-highest share of XX.X%. Meanwhile, the January–March season is expected to record the
fastest growth in Vietnamese trips, at a CAGR of XX.X% over the forecast period.
Table 10: Vietnam – Number of Trips by Season (Million), 2011–2016
Season 2011 2012 2013 2014 2015 2016 CAGR 2011–2016
January–March
April–June
July–September
October–December
Total
Source: Timetric analysis © Timetric
Figure 9: Vietnam – Number of Trips by Season (% Share), 2011–2016
Source: Timetric analysis © Timetric
VIETNAMESE TOURISM DEMAND FACTORS
Travel and Tourism in Vietnam: Key Trends and Opportunities to 2016 Published: June 2012
© This report is a licensed product and is not to be photocopied Page 21
3.6 Number of Trips by Residents
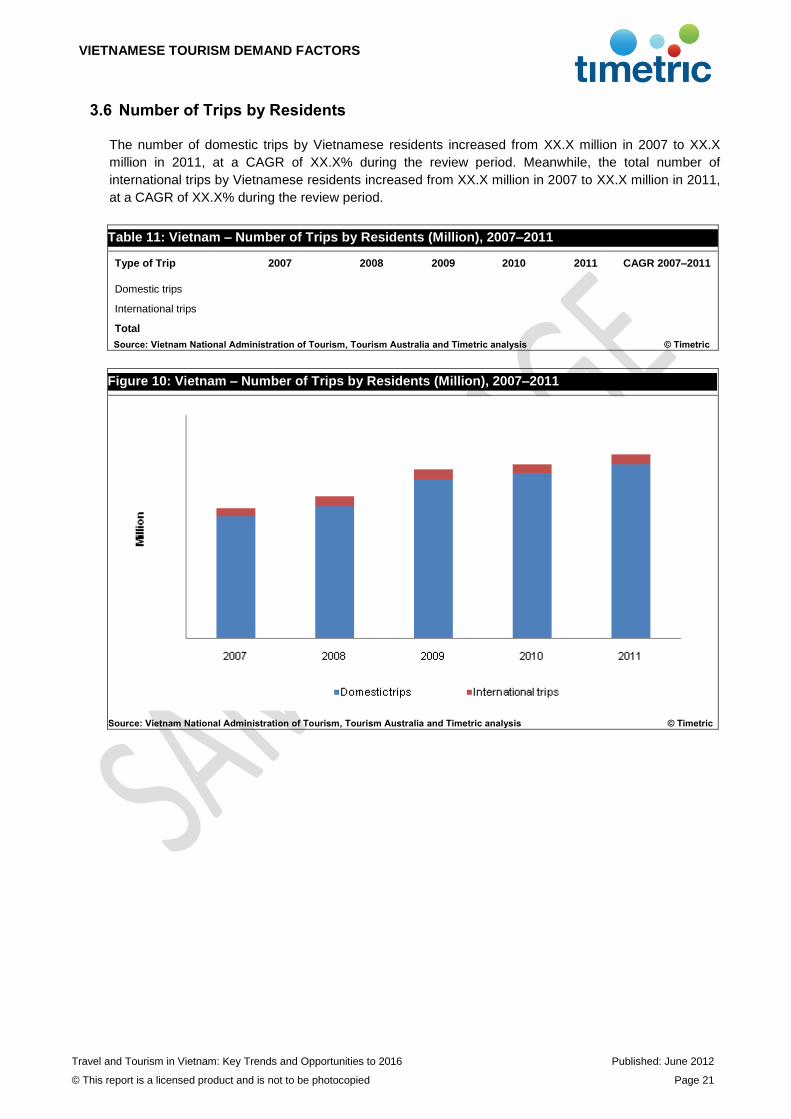
The number of domestic trips by Vietnamese residents increased from XX.X million in 2007 to XX.X
million in 2011, at a CAGR of XX.X% during the review period. Meanwhile, the total number of
international trips by Vietnamese residents increased from XX.X million in 2007 to XX.X million in 2011,
at a CAGR of XX.X% during the review period.
Table 11: Vietnam – Number of Trips by Residents (Million), 2007–2011
Type of Trip 2007 2008 2009 2010 2011 CAGR 2007–2011
Domestic trips
International trips
Total Source: Vietnam National Administration of Tourism, Tourism Australia and Timetric analysis © Timetric
Figure 10: Vietnam – Number of Trips by Residents (Million), 2007–2011
Source: Vietnam National Administration of Tourism, Tourism Australia and Timetric analysis © Timetric
VIETNAMESE TOURISM DEMAND FACTORS
Travel and Tourism in Vietnam: Key Trends and Opportunities to 2016 Published: June 2012
© This report is a licensed product and is not to be photocopied Page 22
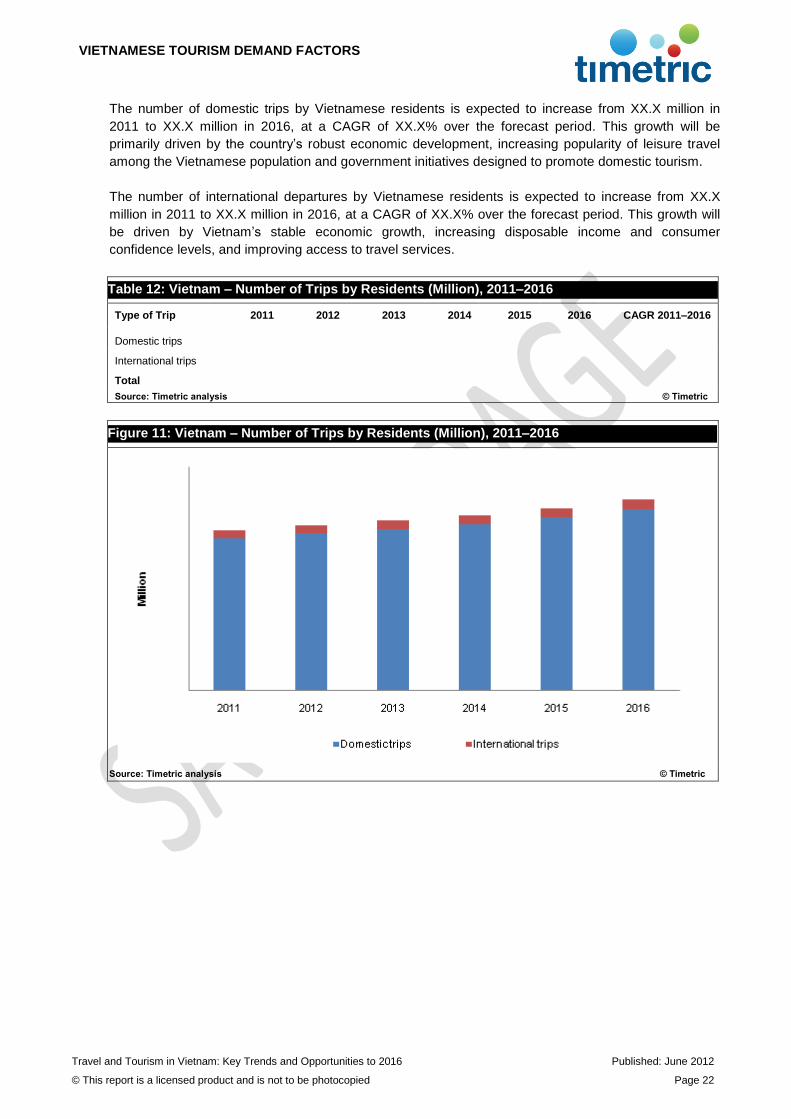
The number of domestic trips by Vietnamese residents is expected to increase from XX.X million in
2011 to XX.X million in 2016, at a CAGR of XX.X% over the forecast period. This growth will be
primarily driven by the country’s robust economic development, increasing popularity of leisure travel
among the Vietnamese population and government initiatives designed to promote domestic tourism.
The number of international departures by Vietnamese residents is expected to increase from XX.X
million in 2011 to XX.X million in 2016, at a CAGR of XX.X% over the forecast period. This growth will
be driven by Vietnam’s stable economic growth, increasing disposable income and consumer
confidence levels, and improving access to travel services.
Table 12: Vietnam – Number of Trips by Residents (Million), 2011–2016
Type of Trip 2011 2012 2013 2014 2015 2016 CAGR 2011–2016
Domestic trips
International trips
Total
Source: Timetric analysis © Timetric
Figure 11: Vietnam – Number of Trips by Residents (Million), 2011–2016
Source: Timetric analysis © Timetric
VIETNAMESE TOURISM DEMAND FACTORS
Travel and Tourism in Vietnam: Key Trends and Opportunities to 2016 Published: June 2012
© This report is a licensed product and is not to be photocopied Page 23
3.7 Average Length of Trips
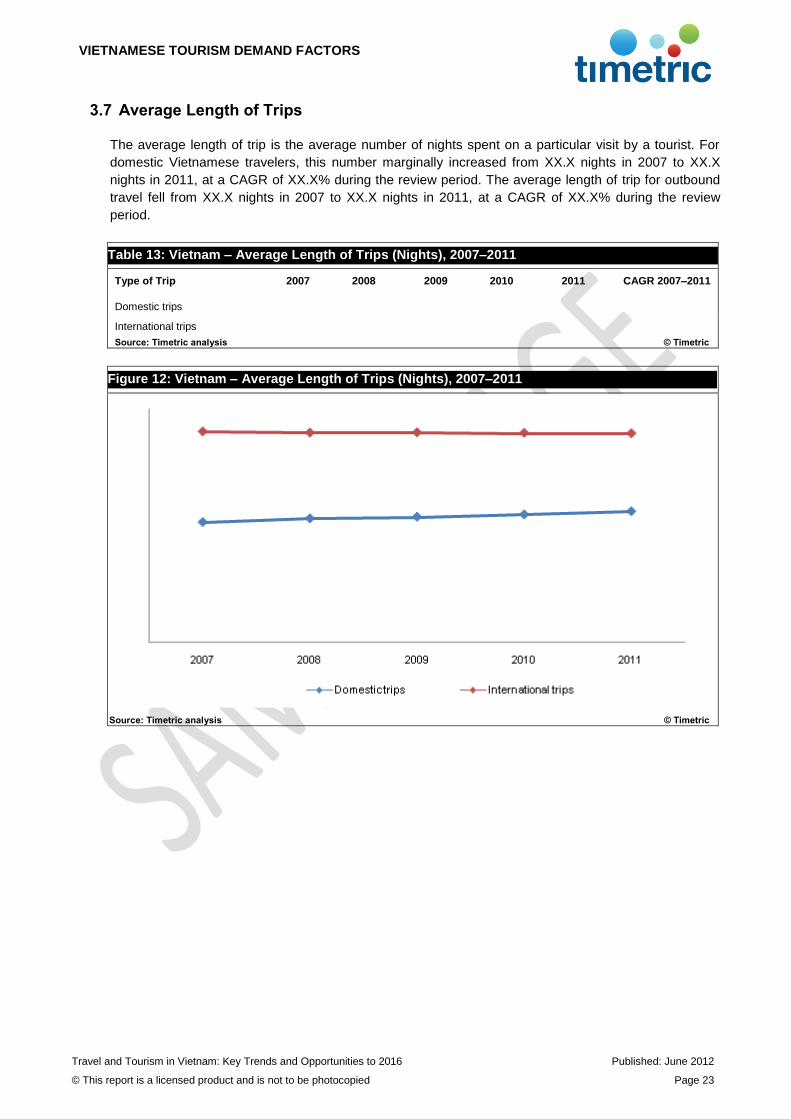
The average length of trip is the average number of nights spent on a particular visit by a tourist. For
domestic Vietnamese travelers, this number marginally increased from XX.X nights in 2007 to XX.X
nights in 2011, at a CAGR of XX.X% during the review period. The average length of trip for outbound
travel fell from XX.X nights in 2007 to XX.X nights in 2011, at a CAGR of XX.X% during the review
period.
Table 13: Vietnam – Average Length of Trips (Nights), 2007–2011
Type of Trip 2007 2008 2009 2010 2011 CAGR 2007–2011
Domestic trips
International trips Source: Timetric analysis © Timetric
Figure 12: Vietnam – Average Length of Trips (Nights), 2007–2011
Source: Timetric analysis © Timetric
VIETNAMESE TOURISM DEMAND FACTORS
Travel and Tourism in Vietnam: Key Trends and Opportunities to 2016 Published: June 2012
© This report is a licensed product and is not to be photocopied Page 24
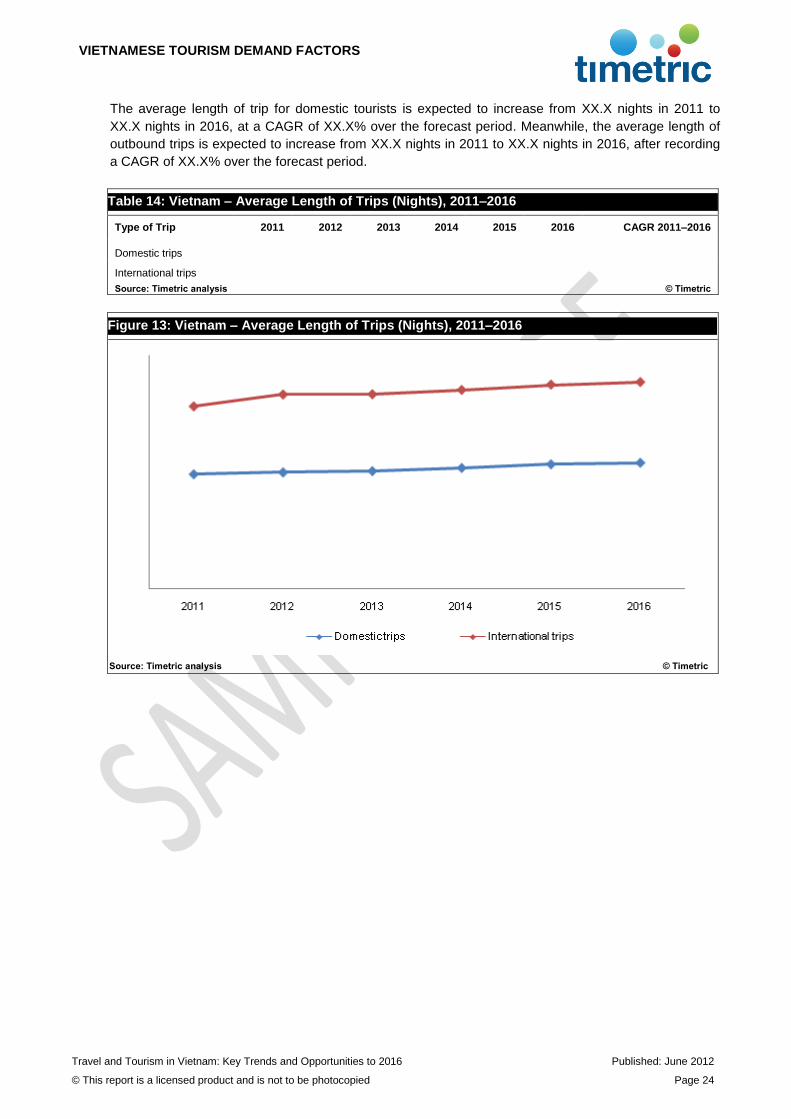
The average length of trip for domestic tourists is expected to increase from XX.X nights in 2011 to
XX.X nights in 2016, at a CAGR of XX.X% over the forecast period. Meanwhile, the average length of
outbound trips is expected to increase from XX.X nights in 2011 to XX.X nights in 2016, after recording
a CAGR of XX.X% over the forecast period.
Table 14: Vietnam – Average Length of Trips (Nights), 2011–2016
Type of Trip 2011 2012 2013 2014 2015 2016 CAGR 2011–2016
Domestic trips
International trips
Source: Timetric analysis © Timetric
Figure 13: Vietnam – Average Length of Trips (Nights), 2011–2016
Source: Timetric analysis © Timetric