treasure map - stlouisfed.org
TRANSCRIPT

Treasure MapBy Stuart J. Murphy / ISBN: 978-0-06-446738-4
Lesson AuthorsErin A. Yetter, Ph.D., Senior Economic Education SpecialistMark Bayles, Senior Economic Education Specialist
Standards and Benchmarks (see pages 14-15)
Lesson DescriptionStudents gain experience in geographic thinking using different types of maps to locateinformation. They begin by reviewing a current population map of the United Statesand answering questions about the map and its features. Next, they listen to the bookTreasure Map, a story about a group of students who go on a treasure hunt. The stu-dents then practice mapping by creating a floor plan of their classroom. Next, they usethis map to hunt for clues in the classroom. Finally, they practice their map-reading skillsby using a thematic map (population) to answer the clues and solve a puzzle.
Essential QuestionHow do we use maps to help us locate important information?
Grade Level2-4
Geography ConceptsThematic maps (Theme: population)
Floor plan
Legend
Geography skills
Map creation (floor plan)
Map reading (floor plan and population map)
©2016, Federal Reserve Banks of St. Louis and Philadelphia. Permission is granted to reprint or photocopy this lesson in its entirety for educational purposes, provided the user credits the Federal Reserve Bank of St. Louis, www.stlouisfed.org/education. 1
FEDERAL RESERVE BANKS OF ST. LOUIS AND PHILADELPHIA ECONOMIC EDUCATION

Treasure Map
©2016, Federal Reserve Banks of St. Louis and Philadelphia. Permission is granted to reprint or photocopy this lesson in its entirety for educational purposes, provided the user credits the Federal Reserve Bank of St. Louis, www.stlouisfed.org/education. 2
ObjectivesStudents will be able to
• define thematic map, floor plan, and legend;
• create a map to identify the locations of familiar places and objects in their classroom;
• use a map to locate familiar places in their classroom;
• use different types of maps (e.g., political, physical, and thematic) to locate information; and
• use the legend (key) on a map.
Time Required75-90 minutes
Materials• Treasure Map by Stuart J. Murphy (ISBN 978-0-06-446738-4)
• Visual 1, cut into cards
• Handouts 1, 2, and 3, one copy for each pair of students
• Handout 3—Answer Key
• Handout 4, one copy for each student
• One small prize for each student
• Crayons or markers
• Internet access
• Projector and screen or interactive whiteboard (i.e., SMART Board)
PreparationBefore students arrive, place the cards from Visual 1: Clues in various locations aroundthe room. They should be in places the students will be able to read easily (i.e., avoidplacing up too high), but not in plain view if possible. NOTE: You will mark the locationson a classroom floor plan the students create in class (see Step 11).
Procedure1. To begin the lesson, show the current population map of the United States at
http://geof.red/m/3CF. Ask the students to take a moment and look at the map. Discussthe following:

Treasure Map
©2016, Federal Reserve Banks of St. Louis and Philadelphia. Permission is granted to reprint or photocopy this lesson in its entirety for educational purposes, provided the user credits the Federal Reserve Bank of St. Louis, www.stlouisfed.org/education. 3
• What is this map showing? (Population)
• What is population? (Population is how many people live in an area. In this case,it is the population of each state.)
• How do you know the map is about population? (The title)
• What is the title of this map? (2015 Resident Population by State)
2. Tell the students that this is a thematic map, which is a map that focuses on one par-ticular idea or theme. The focus of this map, or its theme, is population. It shows howmany people live in each state in the United States.
3. Point to the legend and explain the following:
• Legend is another word for key. A legend explains the symbols found on a map.
• This map uses colors in its legend to represent different populations.
• States with smaller populations, or fewer people, are shown in warm colors (e.g.,red and orange), whereas states with large populations, or more people, areshown in cooler colors (e.g., blue and light blue).
• Legends sometimes use abbreviations. This legend uses K, which stands for 1,000.For example, TX with 27.47K is actually 27,470,000, or about 27 million.
4. Proceed as follows:
• Point to Maine and Texas and ask which one has the larger population, or morepeople? (Texas)
• How do you know Texas has the larger population? (Texas is dark blue, Maine isred. Students might also point to the data values on the states and say that 27.47Kis more than 1.33K)
5. Call on three students to come up to the map. Proceed as follows:
• Ask the first student to point to the states with the smallest populations. (Theyshould point to the red states: MT, ND, SD, WY, DE, RI, NH, VT, and ME.)
• Ask the next student to point to the states with the largest populations (Theyshould point to the dark blue states: CA, TX, GA, FL, NC, IL, OH, PA, and NY.)
• Call on the final student to point out the state you live in and ask the studentwhat the population is in your state. (Answers will vary.)
6. Tell the students they are going to hear the story Treasure Map. It is about a group ofchildren who use a map to find a buried treasure. Begin reading the story and pauseat page 6. Point to the map on page 7 and discuss the following:
Treasure Map
©2016, Federal Reserve Banks of St. Louis and Philadelphia. Permission is granted to reprint or photocopy this lesson in its entirety for educational purposes, provided the user credits the Federal Reserve Bank of St. Louis, www.stlouisfed.org/education. 4
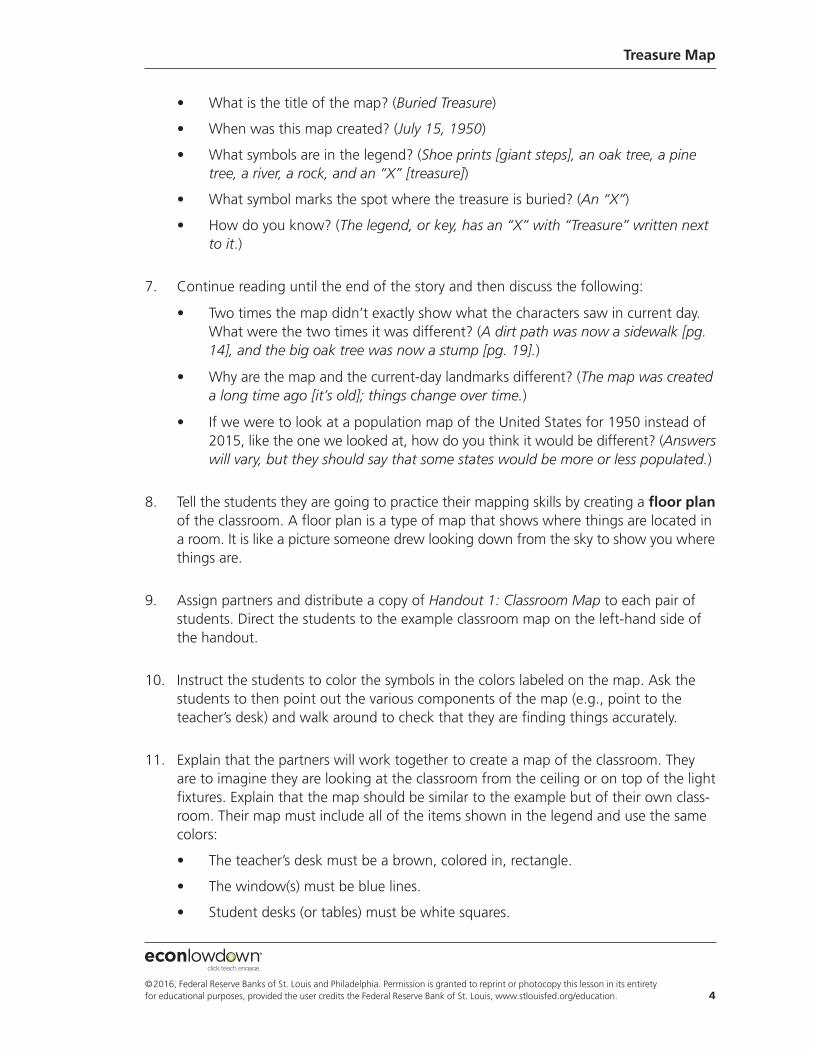
• What is the title of the map? (Buried Treasure)
• When was this map created? (July 15, 1950)
• What symbols are in the legend? (Shoe prints [giant steps], an oak tree, a pinetree, a river, a rock, and an “X” [treasure])
• What symbol marks the spot where the treasure is buried? (An “X”)
• How do you know? (The legend, or key, has an “X” with “Treasure” written nextto it.)
7. Continue reading until the end of the story and then discuss the following:
• Two times the map didn’t exactly show what the characters saw in current day.What were the two times it was different? (A dirt path was now a sidewalk [pg.14], and the big oak tree was now a stump [pg. 19].)
• Why are the map and the current-day landmarks different? (The map was createda long time ago [it’s old]; things change over time.)
• If we were to look at a population map of the United States for 1950 instead of2015, like the one we looked at, how do you think it would be different? (Answerswill vary, but they should say that some states would be more or less populated.)
8. Tell the students they are going to practice their mapping skills by creating a floor planof the classroom. A floor plan is a type of map that shows where things are located ina room. It is like a picture someone drew looking down from the sky to show you wherethings are.
9. Assign partners and distribute a copy of Handout 1: Classroom Map to each pair ofstudents. Direct the students to the example classroom map on the left-hand side ofthe handout.
10. Instruct the students to color the symbols in the colors labeled on the map. Ask thestudents to then point out the various components of the map (e.g., point to theteacher’s desk) and walk around to check that they are finding things accurately.
11. Explain that the partners will work together to create a map of the classroom. Theyare to imagine they are looking at the classroom from the ceiling or on top of the lightfixtures. Explain that the map should be similar to the example but of their own class-room. Their map must include all of the items shown in the legend and use the samecolors:
• The teacher’s desk must be a brown, colored in, rectangle.
• The window(s) must be blue lines.
• Student desks (or tables) must be white squares.

Treasure Map
©2016, Federal Reserve Banks of St. Louis and Philadelphia. Permission is granted to reprint or photocopy this lesson in its entirety for educational purposes, provided the user credits the Federal Reserve Bank of St. Louis, www.stlouisfed.org/education. 5
• Their desks must be marked with yellow stars.
• The chalkboard or whiteboard must be a green line.
• The classroom door(s) must be a red line.
• The American flag must be a red star.
Tell the students they may also add two additional legend symbols in the blank spaces,such as a classroom pet, library, activity center, or computer stations. (NOTE: Dependingon the age level, you may want to decide the additional symbols.)
12. Instruct the student pairs to bring you the maps (or raise their hands) when they arefinished so you can check their work. Allow time for students to work.
13. When each pair is finished creating their floor plan, proceed as follows:
• Check their map and then add a clue symbol to the legend (for example, an orangedot). Use that symbol to mark on their map the location of the clues (from Visual 1:Clues) that you hid around the room.
• Give the pair a copy of Handout 2: Population Map (or display Handout 2 on awhiteboard) and Handout 3: Clue Answers.
• Tell the pair they are going on a treasure hunt, just like in the story, as follows:
◦ They are to use the classroom map they created to find all four clues hiddenaround the classroom.
◦ They are to use the Handout 2 map (or the map shown on the whiteboard) toanswer the clue questions.
◦ After they find all four clues, they are to return to their desks and decode the secret message at the bottom of Handout 3.
◦ Once the pair is done, they are to bring completed Handout 3 to you.
14. Allow time for the student pairs to complete the tasks. As they bring their completedhandouts, check their work using Handout 3—Answer Key and award their treasure—a small prize.
Closure15. Review the important points of the lesson by discussing the following:
• What is a map that focuses on one particular idea or theme called? (A thematicmap)
• What was the theme of the U.S. map shown at the beginning of the lesson?(Population)

Treasure Map
©2016, Federal Reserve Banks of St. Louis and Philadelphia. Permission is granted to reprint or photocopy this lesson in its entirety for educational purposes, provided the user credits the Federal Reserve Bank of St. Louis, www.stlouisfed.org/education. 6
• What type of map shows where things are placed or located in a room? (A floorplan)
• What explains the symbols found on a map? (The legend)
• What is another word for a legend? (A key)
Assessment16. Distribute a copy of Handout 4: Assessment to each student. Instruct the students to
complete questions 1 to 10 using the map on the first page and questions 11 to 15using the map on the second page. Allow time for students to work and then reviewtheir answers.
Handout 4: Assessment—Answer Key
1. A thematic map
2. Population
3. The legend
4. 1,001-5,000
5. C, B, D, and J
6. 501-1,000
7. I
8. J
9. 2 (M and I)
10. B, E, K, Q, Y, Z, and I
11. A floor plan
12. Hannah’s New House
13. The living room
14. Terry’s
15. The legend
NOTE: The following lesson objectives were assessed formatively in the lesson with themain activity and thus are not included in the final summative assessment:
• Create a map to identify the locations of familiar places and objects in the class-room and
• use a map to locate familiar places in the classroom.

Treasure Map
©2016, Federal Reserve Banks of St. Louis and Philadelphia. Permission is granted to reprint or photocopy this lesson in its entirety for educational purposes, provided the user credits the Federal Reserve Bank of St. Louis, www.stlouisfed.org/education. 7
Visual 1: Clues
Clue 1 Clue 2
Clue 3 Clue 4
For each box, compare the populations
of the two states. Circle the state with
the larger population.
Circle the states that have less than1,900,001 people.
Circle the states that have more than
2,650,000 people.
Circle the box with thestates correctly orderedfrom smallest to largest
population.

Treasure Map
©2016, Federal Reserve Banks of St. Louis and Philadelphia. Permission is granted to reprint or photocopy this lesson in its entirety for educational purposes, provided the user credits the Federal Reserve Bank of St. Louis, www.stlouisfed.org/education. 8
Handout 1: Classroom Map
Legend
Example Classroom Floor Plan My Classroom Floor Plan
Teacher desk
Student desk
Window
Chalk/white board
Classroom door
American flag
Where I sit
Brown
Brown
Yellow
Red
Red
Blue
Green
Red
Yellow
Red
Green
Blue
Blue
Blue

Treasure Map
©2016, Federal Reserve Banks of St. Louis and Philadelphia. Permission is granted to reprint or photocopy this lesson in its entirety for educational purposes, provided the user credits the Federal Reserve Bank of St. Louis, www.stlouisfed.org/education. 9
Handout 2: Population Map
DE
RI
Legen
d
0 – 650,000
650,001 – 1,900,000
1,900,001 – 2,650,000
2,650,001 – 4,000,000
4,000,001 – 15,000,000
SOURC
E: GeoFRED, Federal Reserve Bank of St. Louis; http://geof.red/m/409.
Treasure Map
©2016, Federal Reserve Banks of St. Louis and Philadelphia. Permission is granted to reprint or photocopy this lesson in its entirety for educational purposes, provided the user credits the Federal Reserve Bank of St. Louis, www.stlouisfed.org/education. 10
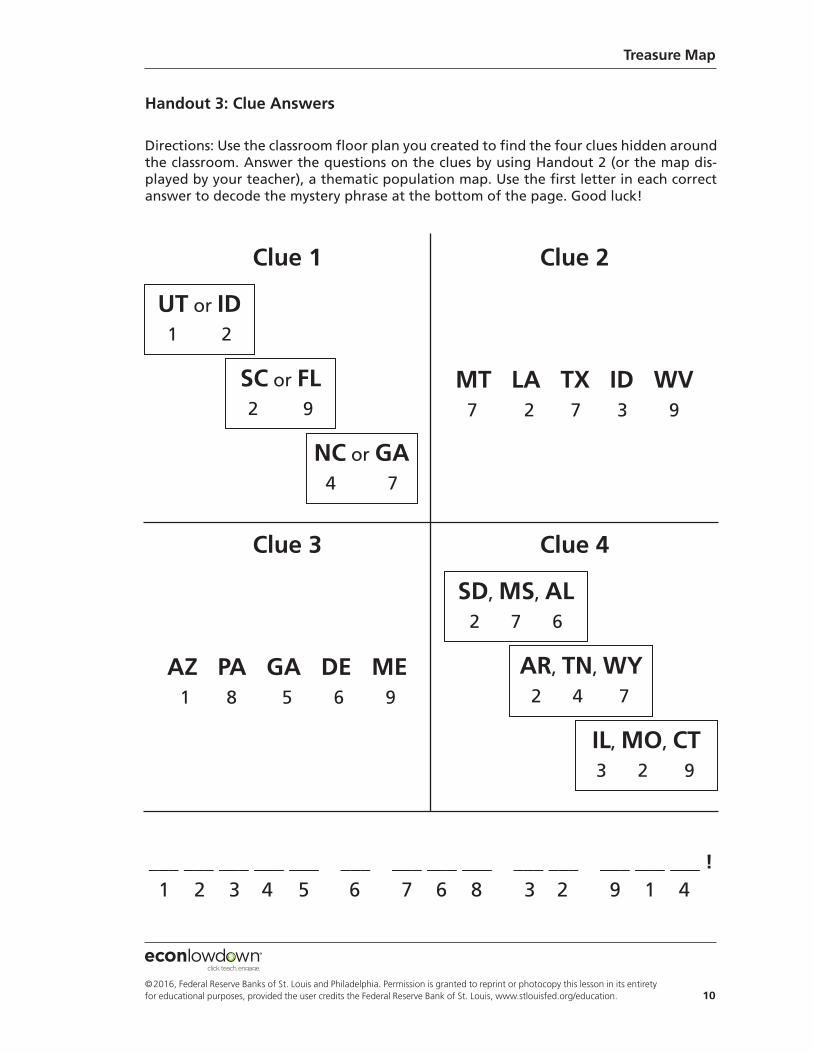
Handout 3: Clue Answers
Directions: Use the classroom floor plan you created to find the four clues hidden aroundthe classroom. Answer the questions on the clues by using Handout 2 (or the map dis-played by your teacher), a thematic population map. Use the first letter in each correctanswer to decode the mystery phrase at the bottom of the page. Good luck!
___ ___ ___ ___ ___ ___ ___ ___ ___ ___ ___ ___ ___ ___ !1 2 3 4 5 6 7 6 8 3 2 9 1 4
Clue 1 Clue 2
Clue 3 Clue 4
UT or ID1 2
SC or FL2 9
NC orGA4 7
SD,MS,AL2 7 6
AR, TN,WY2 4 7
IL,MO, CT3 2 9
MT LA TX ID WV7 2 7 3 9
AZ PA GA DE ME1 8 5 6 9

Treasure Map
©2016, Federal Reserve Banks of St. Louis and Philadelphia. Permission is granted to reprint or photocopy this lesson in its entirety for educational purposes, provided the user credits the Federal Reserve Bank of St. Louis, www.stlouisfed.org/education. 11
Handout 3: Clue Answers—Answer Key
Directions: Use the classroom floor plan you created to find the four clues hidden aroundthe classroom. Answer the questions on the clues by using Handout 2 (or the map dis-played by your teacher), a thematic population map. Use the first letter in each correctanswer to decode the mystery phrase at the bottom of the page. Good luck!
___ ___ ___ ___ ___ ___ ___ ___ ___ ___ ___ ___ ___ ___ !1 2 3 4 5 6 7 6 8 3 2 9 1 4
Clue 1 Clue 2
Clue 3 Clue 4
UT or ID1 2
SC or FL2 9
NC orGA4 7
SD,MS,AL2 7 6
AR, TN,WY2 4 7
IL,MO, CT3 2 9
MT LA TX ID WV7 2 7 3 9
AZ PA GA DE ME1 8 5 6 9
U S I N G A M A P I S F U N

Treasure Map
©2016, Federal Reserve Banks of St. Louis and Philadelphia. Permission is granted to reprint or photocopy this lesson in its entirety for educational purposes, provided the user credits the Federal Reserve Bank of St. Louis, www.stlouisfed.org/education. 12
Handout 4: Assessment (page 1 of 2) Name: _______________________________
Directions: Use the “Anystate, USA, Population” map to answer questions 1 to 10.Use the “Hannah’s New House” map to answer questions 11 to 15.
1. What type of map is this?
2. What is the map’s theme?
3. What explains the symbols found on the map?
4. How many people live in a town with this symbol: ?
5. Name four towns with 0-500 people.
6. How many people live in town G?
7. Circle the town with the most people: A B I
8. Circle the town with the fewest people: L K J
9. How many towns have over 100,000 people?
10. Put the following towns in order from smallest to largest number of people: K Q B Z I E Y
___ ___ ___ ___ ___ ___ ___
25,001-50,0000-500
501-1,000
5,001-25,000
Over 100,0001,001-5,000
50,001-100,000
D
BC
J
A
G
L
E
N
U
F
K
QV
P R
T
S
H
M
I
Y
X
W
Z
Water
Smallest Largest
Anystate, U
SA, P
opulation
LegendNumber of people

Treasure Map
©2016, Federal Reserve Banks of St. Louis and Philadelphia. Permission is granted to reprint or photocopy this lesson in its entirety for educational purposes, provided the user credits the Federal Reserve Bank of St. Louis, www.stlouisfed.org/education. 13
Handout 4: Assessment (page 2 of 2)
11. What type of map is this?
12. What is the title of this map?
13. When you come in the front door, what room are you in?
14. Whose bedroom is next to Hannah’s?
15. What is missing that would help explain the symbols used on this map?
Hannah’s New House
Terry’sbedroom
Hannah’sbedroom
Master bedroom Masterbathroom
KitchenDen
Dining room
Living room
Bathroom
Frontdoor

Treasure Map
©2016, Federal Reserve Banks of St. Louis and Philadelphia. Permission is granted to reprint or photocopy this lesson in its entirety for educational purposes, provided the user credits the Federal Reserve Bank of St. Louis, www.stlouisfed.org/education. 14
Standards and BenchmarksNational Geography Standards, Grade 4
Standard 1: How to use maps and other geographic representations, geospatial technologies,and spatial thinking to understand and communicate information.
Properties and Functions of Geographic Representations
1. Properties and functions of geographic representations—such as maps, globes, graphs,diagrams, aerial and other photographs, remotely sensed images, and geographic visualization
Therefore, the student is able to:
A. Identify and describe the properties (position and orientation, symbols, scale, perspective, coordinate systems) and functions of geographic representations, as exemplified by being able to
• Identify and describe the properties of a variety of maps and globes (e.g., title, legend, cardinal and intermediate directions, scale, sym bols, grid, principal parallels, meridians) and purposes (wayfinding, reference, thematic).
Using Geospatial Data to Construct Geographic Representations
2. Geospatial data are connected to locations on Earth’s surface
Therefore, the student is able to:
A. Identify examples of geospatial data, as exemplified by being able to
• Identify landmarks on the school grounds and describe their size, shape, and location.
• Identify the spatial location of each student’s assigned seat in the classroom.
• Identify the locations and types of trees in the neighborhood of the school.
B. Construct maps and graphs to display geospatial data, as exemplified by being able to
• Construct a map that displays geospatial data using symbols ex plained in a key (e.g., a sketch map to illustrate a narrative story, a map of cars in the school parking lot showing type and color, a class room map showing different types of tables, desks, and chairs).
3. Geospatial technologies—Internet- based mapping applications, GIS, GPS, geovisual-ization, and remote sensing—display geospatial data
Therefore, the student is able to:
A. Compare how different geospatial technologies are used to display geospatial data, as exemplified by being able to
• Identify and describe the types of information communicated by different Internet-based mapping technologies.
Treasure Map
©2016, Federal Reserve Banks of St. Louis and Philadelphia. Permission is granted to reprint or photocopy this lesson in its entirety for educational purposes, provided the user credits the Federal Reserve Bank of St. Louis, www.stlouisfed.org/education. 15
Using Geographic Representations
4. The interpretation of geographic representations
Therefore, the student is able to:
A. Describe and analyze the ways in which geographic representations communicate geospatial information, as exemplified by being able to
• Describe the purpose and components of a typical map key or leg end.
• Describe and analyze the similarities and differences in information displayedat different scales.
• Analyze the different ways of symbolizing geospatial data (e.g., graduated circles, cartograms, choropleth versus isopleth maps).