treasure valley metro survey · treasure valley metro survey september 2016 | 3 table 3-1 q3. not...
TRANSCRIPT
TREASURE VALLEY METRO SURVEY CONDUCTED SEPTEMBER 10 – 22, 2016
N = 1,000 Treasure Valley Adults + Up to N=100 Owyhee County Adults Margin of Error: +/- 3.1%
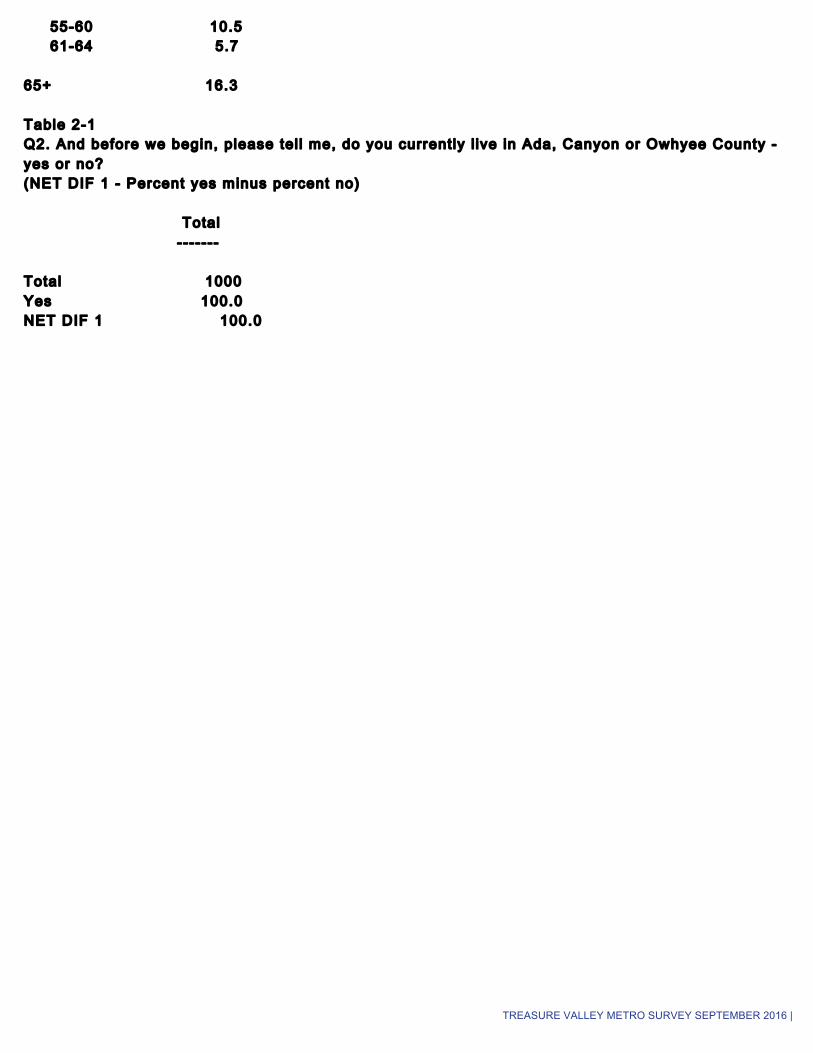
Table 1-1 Q1. First, to make sure we get a representative sample, can you please tel l me your current age? Total ------- Total 1000 18-34 28.6 18-29 20.5 30-34 8.1 35-44 21.9 35-39 11.3 40-44 10.6 45-54 17.0 55-64 16.2
TREASURE VALLEY METRO SURVEY SEPTEMBER 2016 | 2
55-60 10.5 61-64 5.7 65+ 16.3 Table 2-1 Q2. And before we begin, please tel l me, do you currently l ive in Ada, Canyon or Owhyee County - yes or no? (NET DIF 1 - Percent yes minus percent no) Total ------- Total 1000 Yes 100.0 NET DIF 1 100.0
TREASURE VALLEY METRO SURVEY SEPTEMBER 2016 | 3
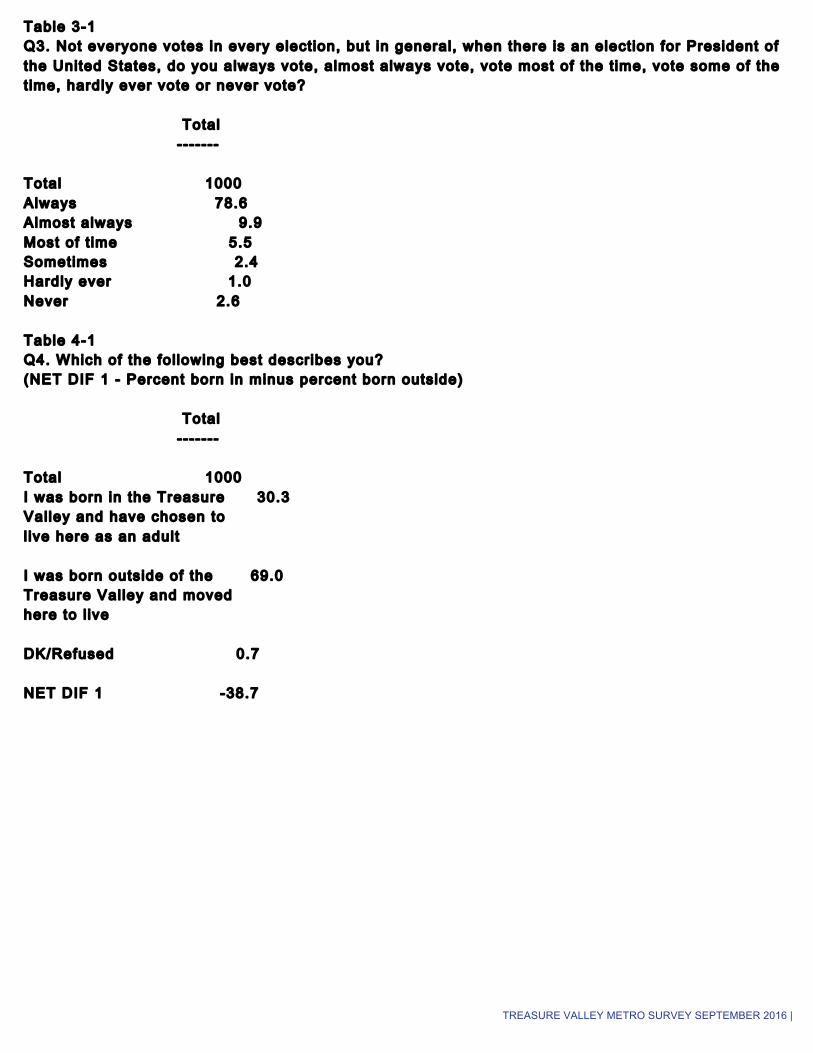
Table 3-1 Q3. Not everyone votes in every elect ion, but in general, when there is an elect ion for President of the United States, do you always vote, almost always vote, vote most of the t ime, vote some of the t ime, hardly ever vote or never vote? Total ------- Total 1000 Always 78.6 Almost always 9.9 Most of t ime 5.5 Sometimes 2.4 Hardly ever 1.0 Never 2.6 Table 4-1 Q4. Which of the fol lowing best describes you? (NET DIF 1 - Percent born in minus percent born outside) Total ------- Total 1000 I was born in the Treasure 30.3 Valley and have chosen to l ive here as an adult I was born outside of the 69.0 Treasure Valley and moved here to l ive DK/Refused 0.7 NET DIF 1 -38.7

TREASURE VALLEY METRO SURVEY SEPTEMBER 2016 | 4
Table 5-1 Q5A. What was the one, main reason you stayed in the Treasure Valley? Total ------- Total 303 Family 36.3 General l ike/ love of the 13.2 area Born here 11.6 Work 11.6 Quali ty of l i fe 8.6 Environment 8.6 Lifestyle 4.3 School/col lege 2.3 Other 1.3 Don't know/Refused 2.3 Table 6-1 Q5B. What was the one, main reason you moved to the Treasure Valley? Total ------- Total 690 Family 43.0 Employment 28.7 Quali ty of l i fe 9.1 College 6.5 Environment/outdoors/ 5.7 landscape/weather Cost of l iv ing 3.6

TREASURE VALLEY METRO SURVEY SEPTEMBER 2016 | 5
Other 1.6 Don't know/Refused 1.7
Table 7-1 Q6. What town or city do you l ive in or nearest to? Total ------- Total 1000 Ada 73.6 Boise 52.8 Eagle 3.7 Garden City 0.6 Hidden Spring 0.1 Kuna 2.0 Meridian 12.8 Star 1.6 Canyon 24.1 Bowmont 0.5 Caldwell 7.1 Greenleaf 0.2 Melba 1.2 Middleton 2.4 Nampa 11.4 Notus 0.3 Parma 0.6 Riverside 0.1 Wilder 0.3 Owyhee 1.8 Bruneau 0.5 Grand View 0.3 Homedale 0.3 Marsing 0.5 Riddle 0.2 DK/Refused 0.5

TREASURE VALLEY METRO SURVEY SEPTEMBER 2016 | 6
Table 8-1 Q7. What is the most important issue facing Idaho today? Total ------- Total 1000 Education 22.6 Jobs & Economy 20.1 The Government in general 5.6 Health Care 5.5 Immigration 4.0 Growth/Overpopulat ion 3.3 Cl imate change/The 3.1 Environment/water Moral Issues 2.6 Taxes/Budget & Funding 2.5 Low Wages 2.4 Gun Laws/2nd Amendment 2.4 Presidential Elect ion 2.2 Land 1.9 Roads/Infrastructure 1.8 Terrorism/National Security 1.4 Affordable Housing/ 0.8 Affordable Living Water 0.6 Other 2.2 Don't Know/Refused 15.0

TREASURE VALLEY METRO SURVEY SEPTEMBER 2016 | 7
Table 9-1 Q8. General ly speaking, how would rate the quali ty of l i fe in the Treasure Valley Region? (NET DIF 1 - Percent excel lent/good minus percent fair /poor) Total ------- Total 1000 Excellent/Good 92.1 Excel lent 49.3 Good 42.8 Fair/Poor 7.4 Fair 6.2 Poor 1.2 DK/Refused 0.5 Mean 1.6 NET DIF 1 84.7 Table 10-1 Q9. And thinking specif ical ly about your own neighborhood, how would rate the quali ty of l i fe? (NET DIF 1 - Percent excel lent/good minus percent fair /poor) Total ------- Total 1000 Excellent/Good 91.3 Excel lent 52.5 Good 38.8 Fair/Poor 8.4 Fair 6.3 Poor 2.1 DK/Refused 0.3 Mean 1.6 NET DIF 1 82.9 Table 11-1 Q10. Would you say that the Treasure Valley is growing too fast, too slow or about r ight? (NET DIF 1 - Percent too fast minus percent too slow) Total ------- Total 1000 Too fast 44.5 Too slow 2.8
TREASURE VALLEY METRO SURVEY SEPTEMBER 2016 | 8
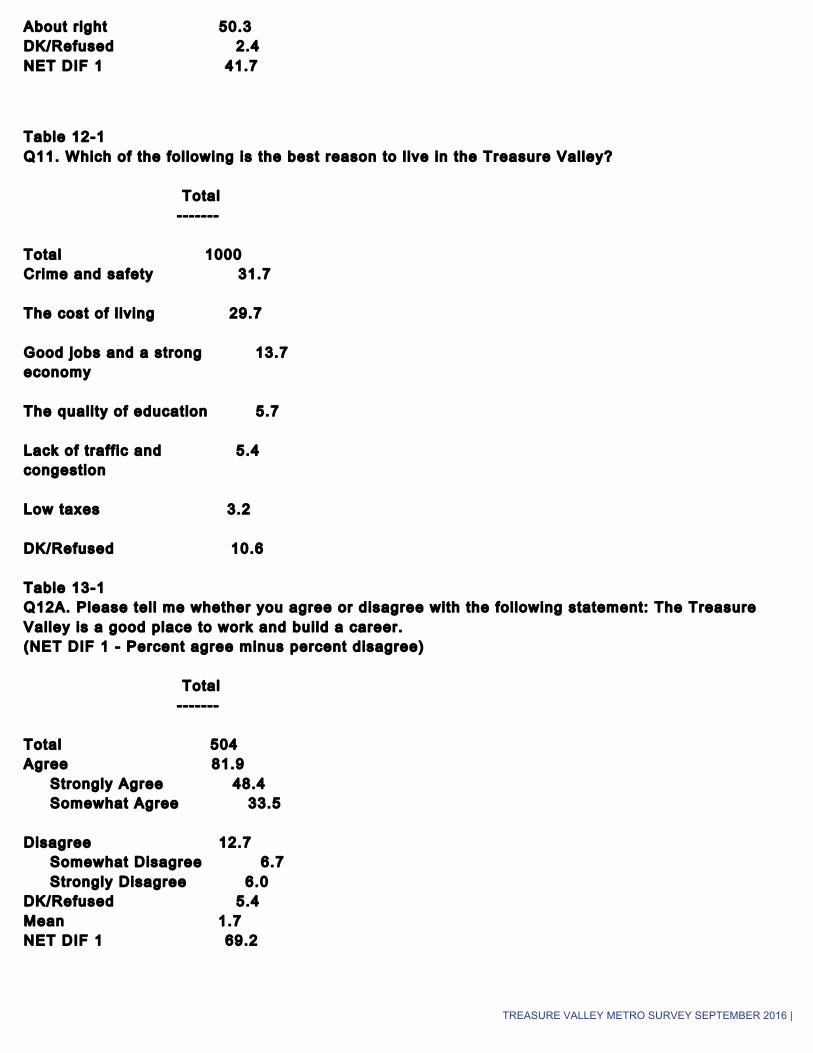
About r ight 50.3 DK/Refused 2.4 NET DIF 1 41.7
Table 12-1 Q11. Which of the fol lowing is the best reason to l ive in the Treasure Valley? Total ------- Total 1000 Crime and safety 31.7 The cost of l iv ing 29.7 Good jobs and a strong 13.7 economy The quali ty of education 5.7 Lack of traff ic and 5.4 congestion Low taxes 3.2 DK/Refused 10.6 Table 13-1 Q12A. Please tel l me whether you agree or disagree with the fol lowing statement: The Treasure Valley is a good place to work and bui ld a career. (NET DIF 1 - Percent agree minus percent disagree) Total ------- Total 504 Agree 81.9 Strongly Agree 48.4 Somewhat Agree 33.5 Disagree 12.7 Somewhat Disagree 6.7 Strongly Disagree 6.0 DK/Refused 5.4 Mean 1.7 NET DIF 1 69.2
TREASURE VALLEY METRO SURVEY SEPTEMBER 2016 | 9
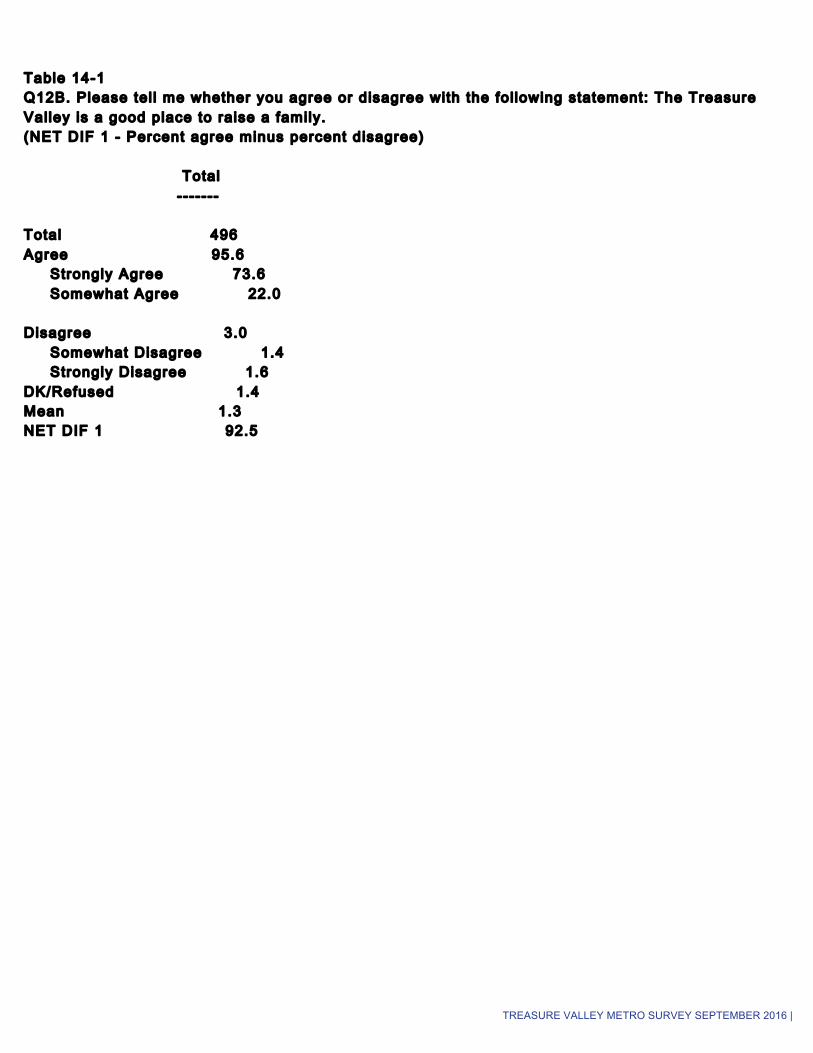
Table 14-1 Q12B. Please tel l me whether you agree or disagree with the fol lowing statement: The Treasure Valley is a good place to raise a family. (NET DIF 1 - Percent agree minus percent disagree) Total ------- Total 496 Agree 95.6 Strongly Agree 73.6 Somewhat Agree 22.0 Disagree 3.0 Somewhat Disagree 1.4 Strongly Disagree 1.6 DK/Refused 1.4 Mean 1.3 NET DIF 1 92.5
TREASURE VALLEY METRO SURVEY SEPTEMBER 2016 | 10
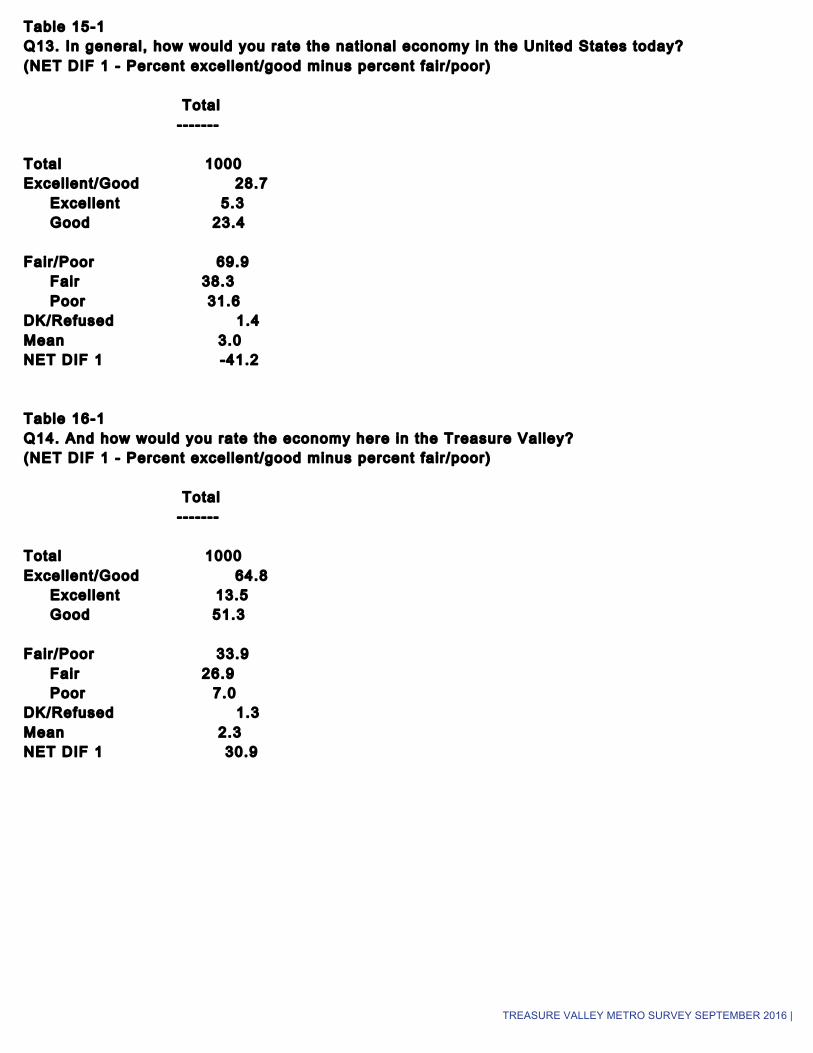
Table 15-1 Q13. In general, how would you rate the national economy in the United States today? (NET DIF 1 - Percent excel lent/good minus percent fair /poor) Total ------- Total 1000 Excellent/Good 28.7 Excel lent 5.3 Good 23.4 Fair/Poor 69.9 Fair 38.3 Poor 31.6 DK/Refused 1.4 Mean 3.0 NET DIF 1 -41.2 Table 16-1 Q14. And how would you rate the economy here in the Treasure Valley? (NET DIF 1 - Percent excel lent/good minus percent fair /poor) Total ------- Total 1000 Excellent/Good 64.8 Excel lent 13.5 Good 51.3 Fair/Poor 33.9 Fair 26.9 Poor 7.0 DK/Refused 1.3 Mean 2.3 NET DIF 1 30.9

TREASURE VALLEY METRO SURVEY SEPTEMBER 2016 | 11
Table 17-1 Q15. Which of the fol lowing sectors is most important to the Treasure Valley economy? Total ------- Total 1000 Agriculture 24.3 Small business 18.0 High tech 17.2 Education 10.3 Healthcare 9.7 Construction 9.0 The service industry 2.6 Banking and f inance 1.1 DK/Refused 7.8 Table 18-1 Q16. Over the next year do you think you or your family 's personal f inancial s i tuation wil l get better, worse or stay about the same? (NET DIF 1 - Percent better minus percent worse) Total ------- Total 1000 Better 31.2 Worse 9.1 Stay the same 58.3 DK/Refused 1.4 NET DIF 1 22.1

TREASURE VALLEY METRO SURVEY SEPTEMBER 2016 | 12
Table 19-1 Q17. Over the next year do you think unemployment rate in the Treasure Valley wil l go up, down or stay the same? (NET DIF 1 - Percent up minus percent down) Total ------- Total 1000 Up 19.6 Down 20.8 Stay the same 54.4 DK/Refused 5.2 NET DIF 1 -1.2 Table 20-1 Q18. Over the next year do you think housing costs in the Treasure Valley wil l go up, down or stay the same? (NET DIF 1 - Percent up minus percent down) Total ------- Total 1000 Up 75.9 Down 5.0 Stay the same 15.5 DK/Refused 3.6 NET DIF 1 70.9

TREASURE VALLEY METRO SURVEY SEPTEMBER 2016 | 13
Table 21-1 Q19. Over the next year do you think healthcare costs in the Treasure Valley wil l go up, down or stay the same? (NET DIF 1 - Percent up minus percent down) Total ------- Total 1000 Up 74.5 Down 2.4 Stay the same 19.0 DK/Refused 4.1 NET DIF 1 72.1 Table 22-1 Q20. Over the next year do you think gas costs in the Treasure Valley wil l go up, down or stay the same? (NET DIF 1 - Percent up minus percent down) Total ------- Total 1000 Up 56.7 Down 3.6 Stay the same 33.5 DK/Refused 6.2 NET DIF 1 53.1 Table 23-1 Q21. Compared to nearby communit ies, would you say your taxes are higher, lower or about the same? (NET DIF 1 - Percent higher minus percent lower) Total ------- Total 1000 Higher 26.5 Lower 15.1 About the same 49.8 DK/Refused 8.6 NET DIF 1 11.4

TREASURE VALLEY METRO SURVEY SEPTEMBER 2016 | 14
Table 24-1 Q22. Which level of government do you most often look to for services? Total ------- Total 1000 Federal 11.3 State 21.2 County 20.4 City 33.1 DK/Refused 14.0
Table 25-1 Q23. And from the same l ist, which level of government do you think should be providing you the most services? Total ------- Total 1000 Federal 13.8 State 35.6 County 13.9 City 27.9 DK/Refused 8.8 Table 26-1 Q24. Considering what you pay in taxes, would you say the government services you receive are excel lent, good, fair or poor? (NET DIF 1 - Percent excel lent/good minus percent fair /poor) Total ------- Total 1000 Excellent/Good 48.2 Excel lent 10.2 Good 38.0 Fair/Poor 49.2 Fair 29.3 Poor 19.9 DK/Refused 2.6 Mean 2.6 NET DIF 1 -1.0
TREASURE VALLEY METRO SURVEY SEPTEMBER 2016 | 15
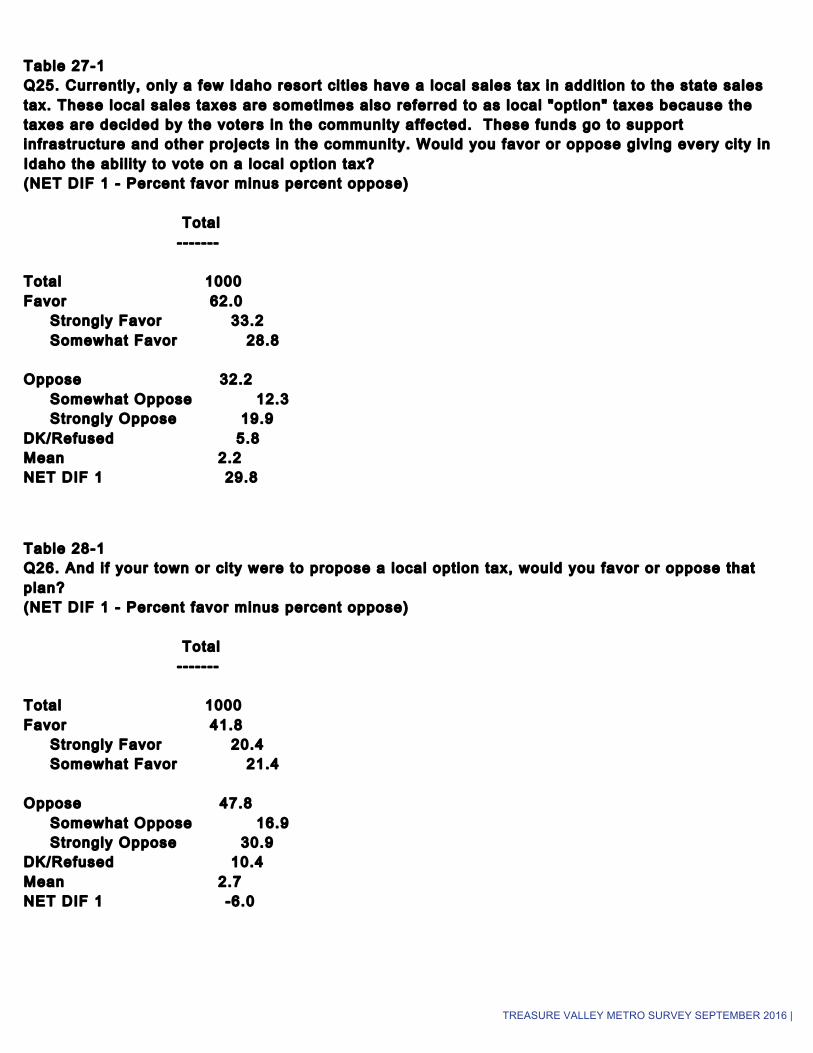
Table 27-1 Q25. Currently, only a few Idaho resort ci t ies have a local sales tax in addit ion to the state sales tax. These local sales taxes are sometimes also referred to as local "option" taxes because the taxes are decided by the voters in the community affected. These funds go to support infrastructure and other projects in the community. Would you favor or oppose giving every city in Idaho the abi l i ty to vote on a local option tax? (NET DIF 1 - Percent favor minus percent oppose) Total ------- Total 1000 Favor 62.0 Strongly Favor 33.2 Somewhat Favor 28.8 Oppose 32.2 Somewhat Oppose 12.3 Strongly Oppose 19.9 DK/Refused 5.8 Mean 2.2 NET DIF 1 29.8
Table 28-1 Q26. And i f your town or city were to propose a local option tax, would you favor or oppose that plan? (NET DIF 1 - Percent favor minus percent oppose) Total ------- Total 1000 Favor 41.8 Strongly Favor 20.4 Somewhat Favor 21.4 Oppose 47.8 Somewhat Oppose 16.9 Strongly Oppose 30.9 DK/Refused 10.4 Mean 2.7 NET DIF 1 -6.0

TREASURE VALLEY METRO SURVEY SEPTEMBER 2016 | 16
Table 29-1 Q27. General ly speaking, how would you rate the quali ty of education in Idaho's K-12 public schools? (NET DIF 1 - Percent excel lent/good minus percent fair /poor) Total ------- Total 1000 Excellent/Good 39.2 Excel lent 8.3 Good 30.9 Fair/Poor 54.8 Fair 31.9 Poor 22.9 DK/Refused 6.0 Mean 2.7 NET DIF 1 -15.6 Table 30-1
Q28. And thinking specif ical ly about your school distr ict, how would you rate the quali ty of K-12 public schools in your area? (NET DIF 1 - Percent excel lent/good minus percent fair /poor) Total ------- Total 1000 Excellent/Good 49.7 Excel lent 13.2 Good 36.5 Fair/Poor 41.2 Fair 25.5 Poor 15.7 DK/Refused 9.1 Mean 2.5 NET DIF 1 8.5

TREASURE VALLEY METRO SURVEY SEPTEMBER 2016 | 17
Table 31-1 Q29. I f your school distr ict were to receive addit ional funding, which of the fol lowing should be the highest prior i ty of education funding? Total ------- Total 1000 Raise teacher salaries to 25.4 retain exist ing teachers Increase start ing teacher 16.1 salaries to attract new teachers Technology in the classroom 12.9 New books and supplies for 9.9 students Extra-Curriculars such as 7.8 athlet ics and music programs Professional development for 5.9 exist ing teachers School Faci l i t ies and 5.7 Maintenance School Safety 2.6 None 2.1 Al l 8.2 DK/Refused 3.4

TREASURE VALLEY METRO SURVEY SEPTEMBER 2016 | 18
Table 32-1 Q30. And from the same l ist, which should be the second highest prior i ty? Total ------- Total 1000 Raise teacher salaries to 16.7 retain exist ing teachers Increase start ing teacher 14.8 salaries to attract new teachers Technology in the classroom 14.0 Extra-Curriculars such as 12.6 athlet ics and music programs New books and supplies for 10.7 students Professional development for 7.7 exist ing teachers School Faci l i t ies and 7.2 Maintenance School Safety 3.8 None 2.3 Al l 5.9 DK/Refused 4.3

TREASURE VALLEY METRO SURVEY SEPTEMBER 2016 | 19
Table 33-1 Q31A. Please tel l me whether you agree or disagree with the fol lowing statement: My school distr ict should raise addit ional tax revenue to increase education funding. (NET DIF 1 - Percent agree minus percent disagree) Total ------- Total 504 Agree 49.0 Strongly Agree 23.2 Somewhat Agree 25.8 Disagree 44.2 Somewhat Disagree 18.7 Strongly Disagree 25.6 DK/Refused 6.7 Mean 2.5 NET DIF 1 4.8
Table 34-1 Q31B. A recent study shows the state of Idaho ranks 49th out of the 50 states in per-pupil funding. Please tel l me whether you agree or disagree with the fol lowing statement: My school distr ict should raise addit ional tax revenue to increase education funding. (NET DIF 1 - Percent agree minus percent disagree) Total ------- Total 496 Agree 51.6 Strongly Agree 26.2 Somewhat Agree 25.4 Disagree 43.1 Somewhat Disagree 19.6 Strongly Disagree 23.6 DK/Refused 5.2 Mean 2.4 NET DIF 1 8.5

TREASURE VALLEY METRO SURVEY SEPTEMBER 2016 | 20
Table 35-1 Q32. Please tel l me whether you agree or disagree with the fol lowing statement: Access to high-quali ty, affordable preschool is beneficial to educational performance later in l i fe? (NET DIF 1 - Percent agree minus percent disagree) Total ------- Total 1000 Agree 71.2 Strongly Agree 50.9 Somewhat Agree 20.3 Disagree 23.1 Somewhat Disagree 10.9 Strongly Disagree 12.2 DK/Refused 5.7 Mean 1.8 NET DIF 1 48.1 Table 36-1 Q33. Would you be wil l ing to spend more in taxes to support access to high-quali ty, affordable preschool in your school distr ict - yes or no? (NET DIF 1 - Percent yes minus percent no) Total ------- Total 1000 Yes 51.9 No 43.1 DK/Refused 5.0 NET DIF 1 8.8

TREASURE VALLEY METRO SURVEY SEPTEMBER 2016 | 21
Table 37-1 Q34. How do you typical ly commute to work? Total ------- Total 1000 Driving 59.5 Biking 4.3 Walking 1.9 Public Transportat ion 0.7 Don't work 24.0 Work from home 8.2 DK/Refused 1.4 Table 38-1 Q35. In minutes, how long is your typical commute to work? Total ------- Total 664 Don't work 2.0 1-20 minutes 63.9 Less than 5 minutes 6.9 6-10 minutes 17.3 11-20 minutes 39.6 21-60 minutes 30.4 21-30 minutes 20.9 31-45 minutes 7.5 46-60 minutes 2.0 Over one hour 2.3 DK/Refused 1.5

TREASURE VALLEY METRO SURVEY SEPTEMBER 2016 | 22
Table 39-1 Q36. Which of the fol lowing statements comes closest to your own opinion? (NET DIF 1 - Percent enough minus percent more) Total ------- Total 1000 There are enough mass 27.8 transportat ion options in the Treasure Valley The Treasure Valley could 66.8 use more mass transportat ion options DK/Refused 5.4 NET DIF 1 -39.0
Table 40-1 Q37. I f the Treasure Valley were going to bui ld more mass transit , which of the fol lowing funding sources would you prefer? (NET DIF 1 - Percent tax minus percent none) Total ------- Total 1000 Tax 75.1 Sales Tax 23.2 Gas Tax 29.3 Property Tax 10.1 Income Tax 12.5 No Taxes/Don't Want to Build 18.2 DK/Refused 6.7 NET DIF 1 56.9

TREASURE VALLEY METRO SURVEY SEPTEMBER 2016 | 23
Table 41-1 Q38A. Would you say that you favor or oppose bui lding a new commuter rai l service on exist ing rai l l ine to l ink major residential, entertainment and employment centers throughout the Treasure Valley? (NET DIF 1 - Percent favor minus percent oppose) Total ------- Total 504 Favor 64.9 Strongly Favor 37.5 Somewhat Favor 27.4 Oppose 27.8 Somewhat Oppose 11.3 Strongly Oppose 16.5 DK/Refused 7.3 Mean 2.1 NET DIF 1 37.1 Table 42-1 Q38B. I f there were a funding mechanism such as a local option sales tax that could pay for some of the associated costs with bui lding a new commuter rai l service on exist ing rai l l ine to l ink major residential, entertainment and employment centers throughout the Treasure Valley, would you favor or oppose that plan? (NET DIF 1 - Percent favor minus percent oppose) Total ------- Total 496 Favor 56.9 Strongly Favor 34.1 Somewhat Favor 22.8 Oppose 37.1 Somewhat Oppose 14.9 Strongly Oppose 22.2 DK/Refused 6.0 Mean 2.3 NET DIF 1 19.8

TREASURE VALLEY METRO SURVEY SEPTEMBER 2016 | 24
Table 43-1 Q39A. Some local governments have recently al located increased funding to address the lack of affordable housing in the Treasure Valley. Would you say you favor or oppose spending government money to bui ld low-income housing faci l i t ies? (NET DIF 1 - Percent favor minus percent oppose) Total ------- Total 504 Favor 55.6 Strongly Favor 30.0 Somewhat Favor 25.6 Oppose 38.7 Somewhat Oppose 16.9 Strongly Oppose 21.8 DK/Refused 5.8 Mean 2.3 NET DIF 1 16.9

TREASURE VALLEY METRO SURVEY SEPTEMBER 2016 | 25
Table 44-1 Q39B. I t is est imated that over 30% of Boise residents quali fy for affordable housing, yet over 10,000 addit ional affordable housing units throughout the Treasure Valley are needed to house them. Some local governments have recently al located increased funding to address the lack of affordable housing in the Treasure Valley. Would you say you favor or oppose spending government money to bui ld low-income housing faci l i t ies? (NET DIF 1 - Percent favor minus percent oppose) Total ------- Total 496 Favor 59.3 Strongly Favor 30.4 Somewhat Favor 28.8 Oppose 35.7 Somewhat Oppose 14.1 Strongly Oppose 21.6 DK/Refused 5.0 Mean 2.3 NET DIF 1 23.6 Table 45-1 Q40. Do you think the majori ty of residents in your city can afford to buy a home - yes or no? (NET DIF 1 - Percent yes minus percent no) Total ------- Total 1000 Yes 43.8 No 49.4 DK/Refused 6.8 NET DIF 1 -5.6

TREASURE VALLEY METRO SURVEY SEPTEMBER 2016 | 26
Table 46-1 Q41. In general, would you say that homelessness in the Treasure Valley is a major problem, somewhat of a problem, small problem or not a problem at al l? (NET DIF 1 - Percent major/somewhat minus percent small /not problem) Total ------- Total 1000 Major/Somewhat 64.1 Major 14.7 Somewhat 49.4 Small/Not Problem 33.5 Small 27.6 Not a problem 5.9 DK/Refused 2.4 NET DIF 1 30.6 Table 47-1 Q42. And in the past year would you say homelessness in the Treasure Valley has gotten better, gotten worse or stayed about the same? (NET DIF 1 - Percent better minus percent worse) Total ------- Total 1000 Better 7.9 Worse 29.4 Stayed about the same 52.7 DK/Refused 10.0 NET DIF 1 -21.5

TREASURE VALLEY METRO SURVEY SEPTEMBER 2016 | 27
Table 48-1 Q43. In general, who should be most responsible for solving homelessness in the Treasure Valley? (NET DIF 1 - Percent privately minus percent public ly) Total ------- Total 1000 Privately funded 42.3 organizations l ike non-profi ts and rel igious charit ies Public ly funded government 45.6 programs DK/Refused 12.1 NET DIF 1 -3.3
Table 49-1 Q44A. How concerned are you about the loss of farmland as a result of urban growth in the Treasure Valley - extremely, very, somewhat or not at al l? (NET DIF 1 - Percent extremely/very minus percent somewhat/not) Total ------- Total 504 Extremely/Very 47.0 Extremely 24.4 Very 22.6 Somewhat/Not 51.6 Somewhat 31.9 Not at al l 19.6 DK/Refused 1.4 NET DIF 1 -4.6

TREASURE VALLEY METRO SURVEY SEPTEMBER 2016 | 28
Table 50-1 Q44B. And how concerned are you about the loss of family farmers as a result of urban growth in the Treasure Valley - extremely, very, somewhat or not at al l? (NET DIF 1 - Percent extremely/very minus percent somewhat/not) Total ------- Total 496 Extremely/Very 46.2 Extremely 26.2 Very 20.0 Somewhat/Not 51.8 Somewhat 32.5 Not at al l 19.4 DK/Refused 2.0 NET DIF 1 -5.6 Table 51-1 Q45. Which should be the prior i ty in the Treasure Valley? (NET DIF 1 - Percent increase minus percent preserve) Total ------- Total 1000 Increasing affordable 32.2 housing Preserving farmland 57.2 DK/Refused 10.6 NET DIF 1 -25.0

TREASURE VALLEY METRO SURVEY SEPTEMBER 2016 | 29
Table 52-1 Q46A. Please tel l me whether you agree or disagree with the fol lowing statement: Agriculture is an important part of the economy in the Treasure Valley. (NET DIF 1 - Percent agree minus percent disagree) Total ------- Total 504 Agree 93.7 Strongly Agree 63.3 Somewhat Agree 30.4 Disagree 3.6 Somewhat Disagree 2.4 Strongly Disagree 1.2 DK/Refused 2.8 Mean 1.4 NET DIF 1 90.1 Table 53-1 Q46B. Please tel l me whether you agree or disagree with the fol lowing statement: Agriculture is an important part of the culture in the Treasure Valley. (NET DIF 1 - Percent agree minus percent disagree) Total ------- Total 496 Agree 93.1 Strongly Agree 69.6 Somewhat Agree 23.6 Disagree 6.7 Somewhat Disagree 4.0 Strongly Disagree 2.6 DK/Refused 0.2 Mean 1.4 NET DIF 1 86.5

TREASURE VALLEY METRO SURVEY SEPTEMBER 2016 | 30
Table 54-1 Q47. In the past year, would you say there has been more crime, less cr ime, or about the same amount of cr ime in your neighborhood? (NET DIF 1 - Percent more minus percent less) Total ------- Total 1000 More 18.4 Less 14.6 About the same 63.9 DK/Refused 3.1 NET DIF 1 3.8
Table 55-1 Q48. In general, how would you describe the neighborhood where you l ive - extremely safe, very safe, somewhat safe or not safe at al l? (NET DIF 1 - Percent extremely/very minus percent somewhat/not) Total ------- Total 1000 Extremely/Very 81.8 Extremely safe 32.5 Very safe 49.3 Somewhat/Not 17.7 Somewhat safe 15.6 Not safe at al l 2.1 DK/Refused 0.5 NET DIF 1 64.1

TREASURE VALLEY METRO SURVEY SEPTEMBER 2016 | 31
Table 56-1 Q49. And how would you rate the relat ionship between the pol ice and residents in your community? (NET DIF 1 - Percent excel lent/good minus percent fair /poor) Total ------- Total 1000 Excellent/Good 85.6 Excel lent 37.1 Good 48.5 Fair/Poor 12.3 Fair 8.3 Poor 4.0 DK/Refused 2.1 Mean 1.8 NET DIF 1 73.3

TREASURE VALLEY METRO SURVEY SEPTEMBER 2016 | 32
Table 57-1 Q50. We hear a lot of talk these days about l iberals and conservatives. Here is a seven-point scale on which the pol i t ical v iews that people might hold are arranged from very l iberal to very conservative. Where would you place yourself on this scale, or haven't you thought much about this? (NET DIF 1 - Percent Conservative minus percent Liberal) Total ------- Total 1000 Liberal 26.4 Very Liberal 7.8 Liberal 7.2 Somewhat l iberal 11.4 Moderate 23.9 Conservative 40.7 Somewhat conservative 14.1 Conservative 12.3 Very Conservative 14.3 DK/Refused 9.0 NET DIF 1 14.3

TREASURE VALLEY METRO SURVEY SEPTEMBER 2016 | 33
Table 58-1 Q51. General ly speaking, do you usually think of yourself as a Republican, a Democrat, an Independent, or what? (NET DIF 1 - Percent Republican minus percent Liberal) Total ------- Total 1000 Republican 41.0 Strong Republican 20.4 Not very strong 9.7 Republican Independent lean 10.9 Republican Democrat 28.5 Strong Democrat 15.3 Not very strong 4.5 Democrat Independent lean 8.7 Democrat Pure Independent 20.6 Other 4.3 DK/Refused 5.6 NET DIF 1 12.5

TREASURE VALLEY METRO SURVEY SEPTEMBER 2016 | 34
Table 59-1 Q52. What racial or ethnic group best describes you? Total ------- Total 1000 White 88.1 Non-White 9.5 Latino or Hispanic 3.0 Black 1.8 Asian 0.5 Native American 0.8 Other 1.8 Two or more 1.6 DK/Refused 2 .4 Table 60-1 Q53. What is the highest level of education or training you have completed? Total ------- Total 1000 High school 18.7 Some high school 2.7 High school degree or 16.0 equivalent Some College/Assoc 33.9 Some col lege 20.6 Associate's Degree 13.3 Bachelor 's Degree 27.5 Graduate school 18.5 Some graduate school 3.0 Graduate degree 15.5 DK/Refused 1.4

TREASURE VALLEY METRO SURVEY SEPTEMBER 2016 | 35
Table 61-1 Q54. What is your rel igion? Total ------- Total 1000 Non-denominational Christ ian 21.0 Mainstream Protestant 19.1 Cathol ic 12.3 Mormon 9.5 Jewish 0.7 Atheist/Agnostic 9.1 Other 6.8 No Religion 15.2 DK/Refused 6.3
Table 62-1 Q55. What is your relat ionship status? Total ------- Total 1000 Married 60.1 Single 16.9 In a relat ionship 9.9 Widowed 5.9 Divorced 5.3 DK/Refused 1.9

TREASURE VALLEY METRO SURVEY SEPTEMBER 2016 | 36
Table 63-1 Q56. Do you currently have any chi ldren enrol led in K-12 schooling? (NET DIF 1 - Percent yes minus percent no) Total ------- Total 1000 Yes 32.2 No 66.6 DK/Refused 1.2 NET DIF 1 -34.4 Table 64-1 Q57. Do your chi ldren attend public, pr ivate or charter schools? Total ------- Total 322 Public 73.6 Private 10.6 Charter 12.7 DK/Refused 3.1 Table 65-1 Q59. Do you currently rent or own your home? (NET DIF 1 - Percent rent minus percent own) Total ------- Total 1000 Rent 22.5 Own 74.4 DK/Refused 3.1 NET DIF 1 -51.9

TREASURE VALLEY METRO SURVEY SEPTEMBER 2016 | 37
Table 66-1 Q60. And f inal ly, which of the fol lowing best describes your annual household income before taxes? Total ------- Total 1000 <$50,000 33.5 Under $25,000 12.8 $25,001-$50,000 20.7 $50,001 to $100,000 26.7 $50,001 to $75,000 17.1 $75,001 to $100,000 9.6 Over $100,000 16.8 DK/Refused 23.0 Table 67-1 Q61. Gender: (NET DIF 1 - Percent male minus percent female) Total ------- Total 1000 Male 51.0 Female 49.0 NET DIF 1 2.0 Table 68-1 Version Total ------- Total 1000 Version A 50.4 Version B 49.6