treatment of produced water from carbon sequestration … library/events/2017/crosscutting... ·...
TRANSCRIPT

| 1
Treatment of Produced Water from Carbon Sequestration Sites for Water Reuse, Mineral Recovery and Carbon UtilizationPerformer: Southern Research
PI: Jay Renew, P.E.
2017 Crosscutting Research Portfolio ReviewMarch 23, 2017
DE‐FE0024084
Period of Performance: October 1, 2014 to September 30, 2017
Southern Research Energy & Environment

2
• Select candidate CO2 sequestration reservoirs based on water chemistry and geologic properties
• Develop an integrated and adaptable concentration system
• Evaluate solidification & stabilization mixtures to immobilize residual contaminants
• Evaluate opportunities to recover valuable minerals, efficiently utilize CO2, and recover water
• Complete a technical readiness review and economic feasibility analysis
PROJECT GOALS AND OBJECTIVES
Southern Research Energy & Environment |

3
• Team
• Formation Characteristics
• Integrated Concentration System
• Solidification/Stabilization
• Remaining Work
TOPICS
Southern Research Energy & Environment |

4
This report was prepared as an account of work sponsored by an agency of the United States
Government. Neither the United States Government nor any agency thereof, nor any of their employees,
makes any warranty, express or implied, or assumes any legal liability or responsibility for the accuracy,
completeness, or usefulness of any information, apparatus, product, or process disclosed, or represents
that its use would not infringe privately owned rights. Reference herein to any specific commercial
product, process, or service by trade name, trademark, manufacturer, or otherwise does not necessarily
constitute or imply its endorsement, recommendation, or favoring by the United States Government or
any agency thereof. The views and opinions of authors expressed herein do not necessarily state or
reflect those of the United States Government or any agency thereof.
DISCLAIMER
The material in the following presentation is based upon work supported by the Departmentof Energy under Award Number DE‐FE0024084
Southern Research Energy & Environment |
5
TEAM
DiFilippo Consulting
Southern Research Energy & Environment |

6
FORMATION CHARACTERISTICS
Southern Research Energy & Environment |
Component (mg/L) Keg Mountain Mount Simon San Andres
TDS 18,419 88,900 190,459
Ca2+ 940 8,514 5,578
Na+ 5,019 22,545 63,014
Mg2+ 123 1,428 3,482
K+ 587 758 519
Cl‐ 9,212 53,700 116,600
SO42‐ 499 1,219 1,166
HCO3‐ 1,501 100 100

7
FORMATION CHARACTERISTICS
Southern Research Energy & Environment |
Component (mg/L) Keg Mountain Mount Simon San Andres
TDS 18,419 88,900 190,459
Ca2+ 940 8,514 5,578
Na+ 5,019 22,545 63,014
Mg2+ 123 1,428 3,482
K+ 587 758 519
Cl‐ 9,212 53,700 116,600
SO42‐ 499 1,219 1,166
HCO3‐ 1,501 100 100

8
FORMATION CHARACTERISTICS
Southern Research Energy & Environment |
Component (mg/L) Keg Mountain Mount Simon San Andres
TDS 18,419 88,900 190,459
Ca2+ 940 8,514 5,578
Na+ 5,019 22,545 63,014
Mg2+ 123 1,428 3,482
K+ 587 758 519
Cl‐ 9,212 53,700 116,600
SO42‐ 499 1,219 1,166
HCO3‐ 1,501 100 100

9
FORMATION CHARACTERISTICS
Southern Research Energy & Environment |
Component (mg/L) Keg Mountain Mount Simon San Andres
TDS 18,419 88,900 190,459
Ca2+ 940 8,514 5,578
Na+ 5,019 22,545 63,014
Mg2+ 123 1,428 3,482
K+ 587 758 519
Cl‐ 9,212 53,700 116,600
SO42‐ 499 1,219 1,166
HCO3‐ 1,501 100 100
10
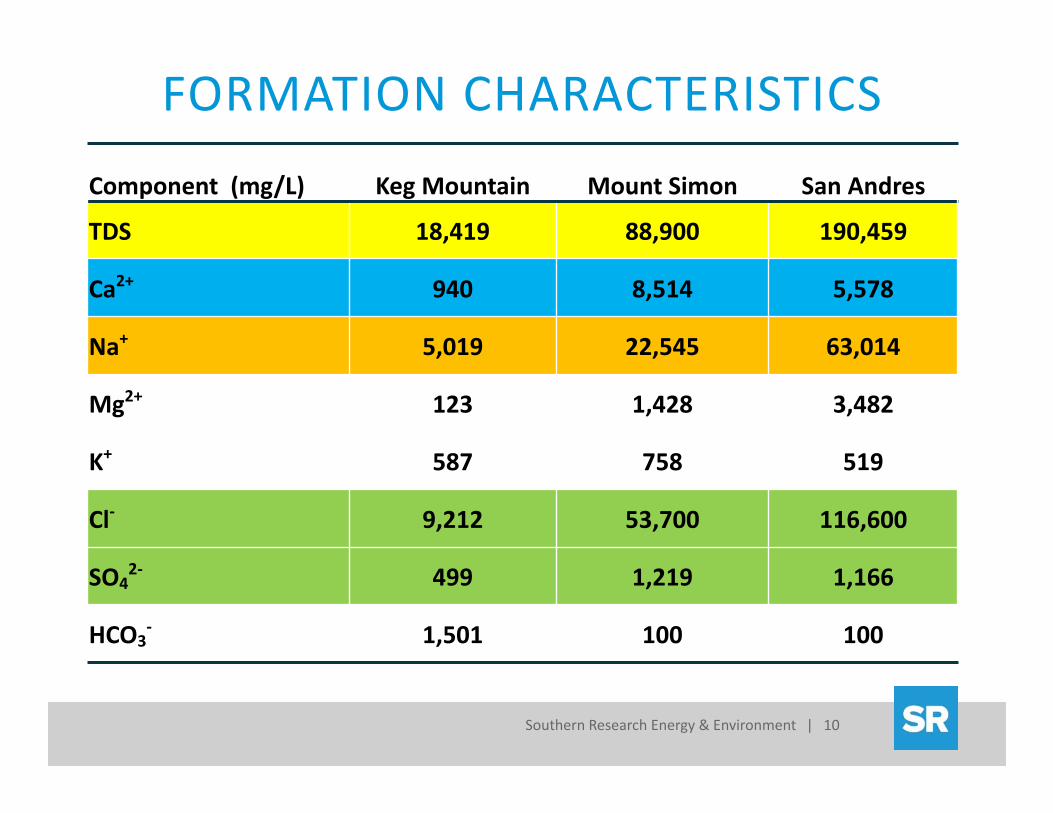
FORMATION CHARACTERISTICS
Southern Research Energy & Environment |
Component (mg/L) Keg Mountain Mount Simon San Andres
TDS 18,419 88,900 190,459
Ca2+ 940 8,514 5,578
Na+ 5,019 22,545 63,014
Mg2+ 123 1,428 3,482
K+ 587 758 519
Cl‐ 9,212 53,700 116,600
SO42‐ 499 1,219 1,166
HCO3‐ 1,501 100 100

11
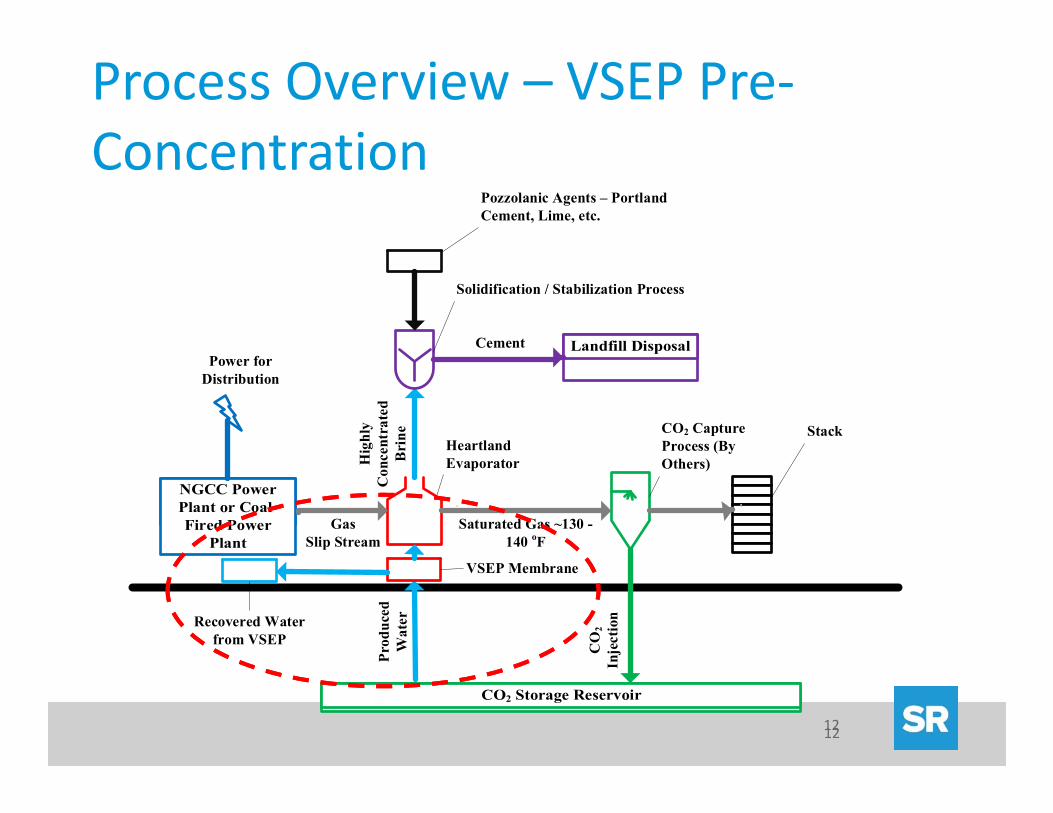
Process Overview
r r
Saturated Gas ~130 - 140 oF
Hig
hly
Con
cent
rate
d B
rine
Cement
GasSlip Stream
Prod
uced
W
ater
CO
2 In
ject
ion
Power for Distribution
Heartland Evaporator
Solidification / Stabilization Process
CO2 Capture Process (By Others)
Stack
Pozzolanic Agents – Portland Cement, Lime, etc.
12
r r
Saturated Gas ~130 - 140 oF
Hig
hly
Con
cent
rate
d B
rine
Cement
GasSlip Stream
Prod
uced
W
ater
CO
2 In
ject
ion
Power for Distribution
Heartland Evaporator
Solidification / Stabilization Process
CO2 Capture Process (By Others)
Stack
Pozzolanic Agents – Portland Cement, Lime, etc.
VSEP Membrane
Recovered Water from VSEP
Process Overview – VSEP Pre‐Concentration
12
13
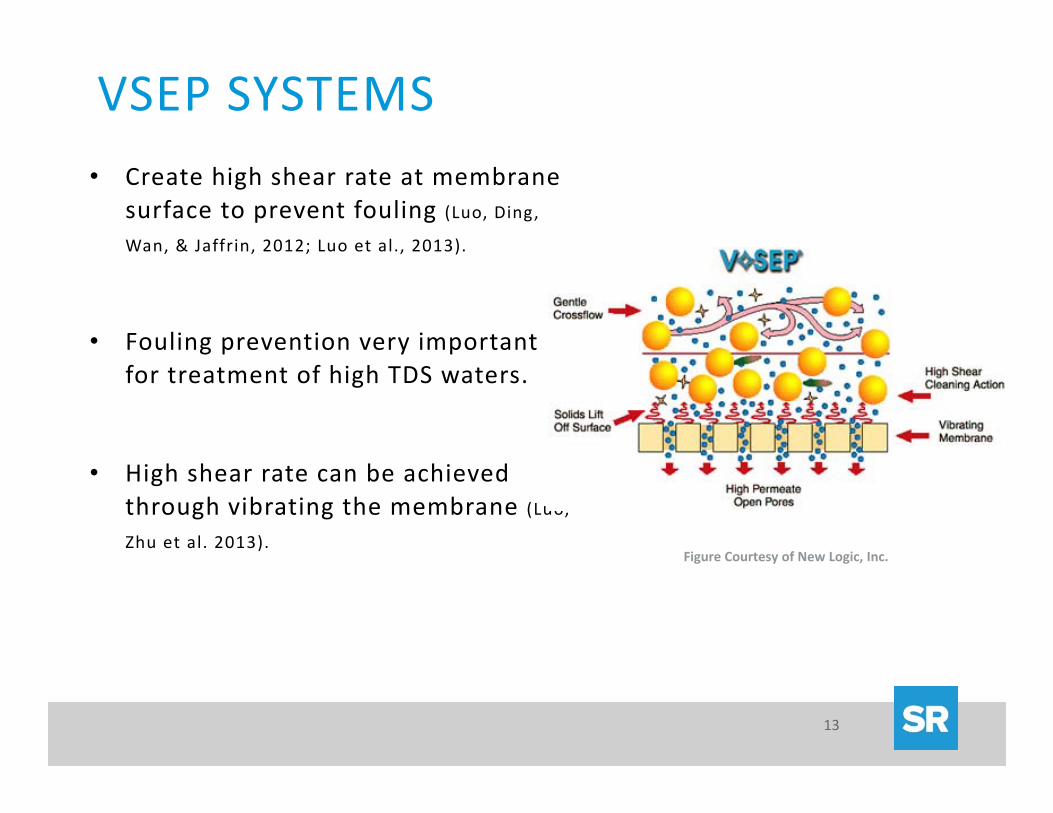
VSEP SYSTEMS• Create high shear rate at membrane
surface to prevent fouling (Luo, Ding, Wan, & Jaffrin, 2012; Luo et al., 2013).
• Fouling prevention very important for treatment of high TDS waters.
• High shear rate can be achieved through vibrating the membrane (Luo, Zhu et al. 2013).
Figure Courtesy of New Logic, Inc.

14
HEARTLAND CONCENTRATOR PROCESS
Southern Research Energy & Environment |

15
Scenario Evaluations Natural Gas Combined Cycle (NGCC) Scenario
500 MW (317 MW output from natural gas turbine / 183 MW supplemental HRSG turbine)
90% CO2 capture Waste heat from downstream of gas turbine / upstream of HRSG utilized Gas temperature = 1,149 oF Concentrate produced water to 65% total solids Assume 80% annual system capacity factor
Coal Scenario 500 MW Illinois basin coal‐fired power plant 90% CO2 capture Waste heat flue gas upstream of air pre‐heater utilized Gas temperature = 650 oF with plant heat rate of 10,000 BTU/kWh Concentrate produced water to 65% total solids Assume 80% annual system capacity factor

16
NGCC Hot Gas Take‐Off PointHot Gas Take‐Off Pt
From 1 CT

17
Calculation Assumptions
Notes1 ‐ Max evap rate based on 100% of ‘hot’ flue gas going to Heartland concentrator.2 ‐ NGCC scenario assumes 317 MW of electric generation from natural gas combustion turbine followed by HRSG that produces up to 183 MW of additional electric power.
Parameter NGCC Coal UnitGross Electrical Output 500 (317) 500 MWPlant Capacity Factor 80% 80%Plant Heat Rate (HHV) 6,715 9,800 BTU/kWhGas Energy Content 1,029 ‐‐ BTU/SCFCoal Energy Content ‐‐ 11,666 BTU/lb (wet)
Plant Fuel Input54,401 210 SCFM (gas) / Ton/Hr (Coal)
3,358 4,900 MMBTU/hr
Plant CO2 Emissions6,611 16,386 lb/min
1,389,973 3,444,961 Ton/Yr793 1,966 lb/mWh
CO2 Capture Rate 90% 90% %Concentrator Hot Gas Temp 1,149 650 oF
Maximum Evap Rate4,331,549 1,555,803 GPD3,008 1,080 GPM
18
Calculation Assumptions
Notes1 ‐ Max evap rate based on 100% of ‘hot’ flue gas going to Heartland concentrator.2 ‐ NGCC scenario assumes 317 MW of electric generation from natural gas combustion turbine followed by HRSG that produces up to 183 MW of additional electric power.
Parameter NGCC Coal UnitGross Electrical Output 500 (317) 500 MWPlant Capacity Factor 80% 80%Plant Heat Rate (HHV) 6,715 9,800 BTU/kWhGas Energy Content 1,029 ‐‐ BTU/SCFCoal Energy Content ‐‐ 11,666 BTU/lb (wet)
Plant Fuel Input54,401 210 SCFM (gas) / Ton/Hr (Coal)
3,358 4,900 MMBTU/hr
Plant CO2 Emissions6,611 16,386 lb/min
1,389,973 3,444,961 Ton/Yr793 1,966 lb/mWh
CO2 Capture Rate 90% 90% %Concentrator Hot Gas Temp 1,149 650 oF
Maximum Evap Rate4,331,549 1,555,803 GPD3,008 1,080 GPM

19
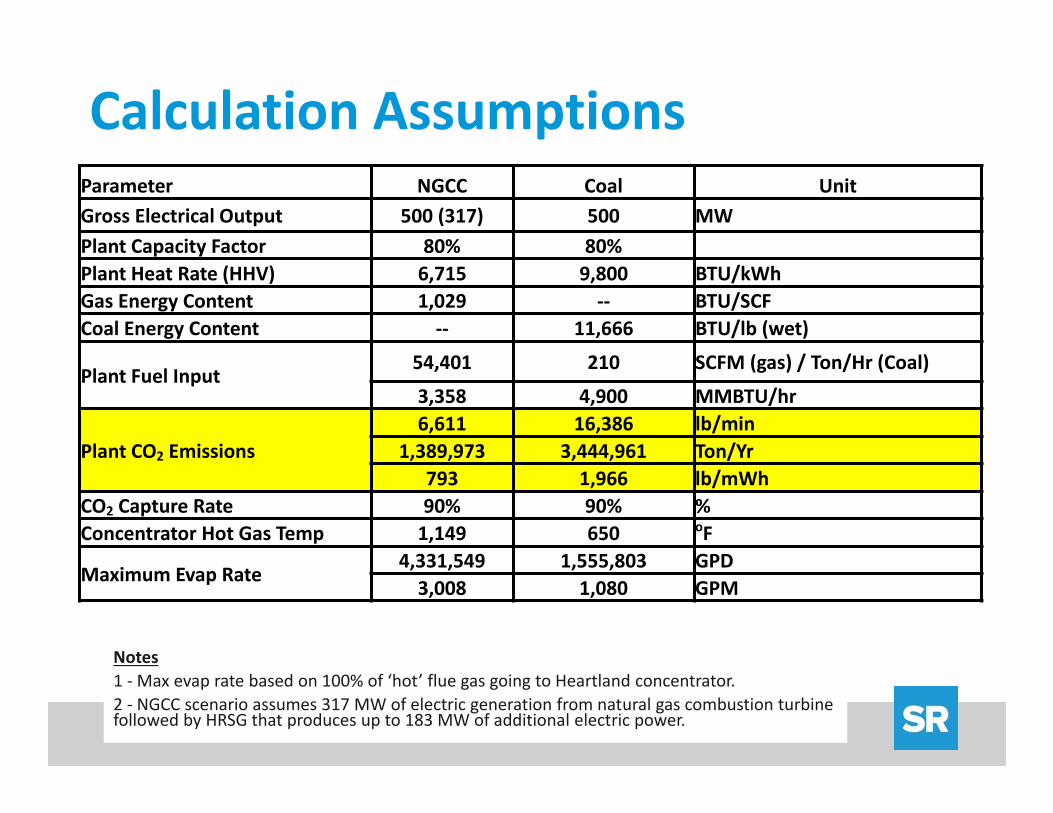
Calculation Assumptions
Notes1 ‐ Max evap rate based on 100% of ‘hot’ flue gas going to Heartland concentrator.2 ‐ NGCC scenario assumes 317 MW of electric generation from natural gas combustion turbine followed by HRSG that produces up to 183 MW of additional electric power.
Parameter NGCC Coal UnitGross Electrical Output 500 (317) 500 MWPlant Capacity Factor 80% 80%Plant Heat Rate (HHV) 6,715 9,800 BTU/kWhGas Energy Content 1,029 ‐‐ BTU/SCFCoal Energy Content ‐‐ 11,666 BTU/lb (wet)
Plant Fuel Input54,401 210 SCFM (gas) / Ton/Hr (Coal)
3,358 4,900 MMBTU/hr
Plant CO2 Emissions6,611 16,386 lb/min
1,389,973 3,444,961 Ton/Yr793 1,966 lb/mWh
CO2 Capture Rate 90% 90% %Concentrator Hot Gas Temp 1,149 650 oF
Maximum Evap Rate4,331,549 1,555,803 GPD3,008 1,080 GPM

20
Calculation Assumptions
Notes1 ‐ Max evap rate based on 100% of ‘hot’ flue gas going to Heartland concentrator.2 ‐ NGCC scenario assumes 317 MW of electric generation from natural gas combustion turbine followed by HRSG that produces up to 183 MW of additional electric power.
Parameter NGCC Coal UnitGross Electrical Output 500 (317 NG) 500 MWPlant Capacity Factor 80% 80%Plant Heat Rate (HHV) 6,715 9,800 BTU/kWhGas Energy Content 1,029 ‐‐ BTU/SCFCoal Energy Content ‐‐ 11,666 BTU/lb (wet)
Plant Fuel Input54,401 210 SCFM (gas) / Ton/Hr (Coal)
3,358 4,900 MMBTU/hr
Plant CO2 Emissions6,611 16,386 lb/min
1,389,973 3,444,961 Ton/Yr793 1,966 lb/mWh
CO2 Capture Rate 90% 90% %Concentrator Hot Gas Temp 1,149 650 oF
Maximum Evap Rate4,331,549 1,555,803 GPD3,008 1,080 GPM

21
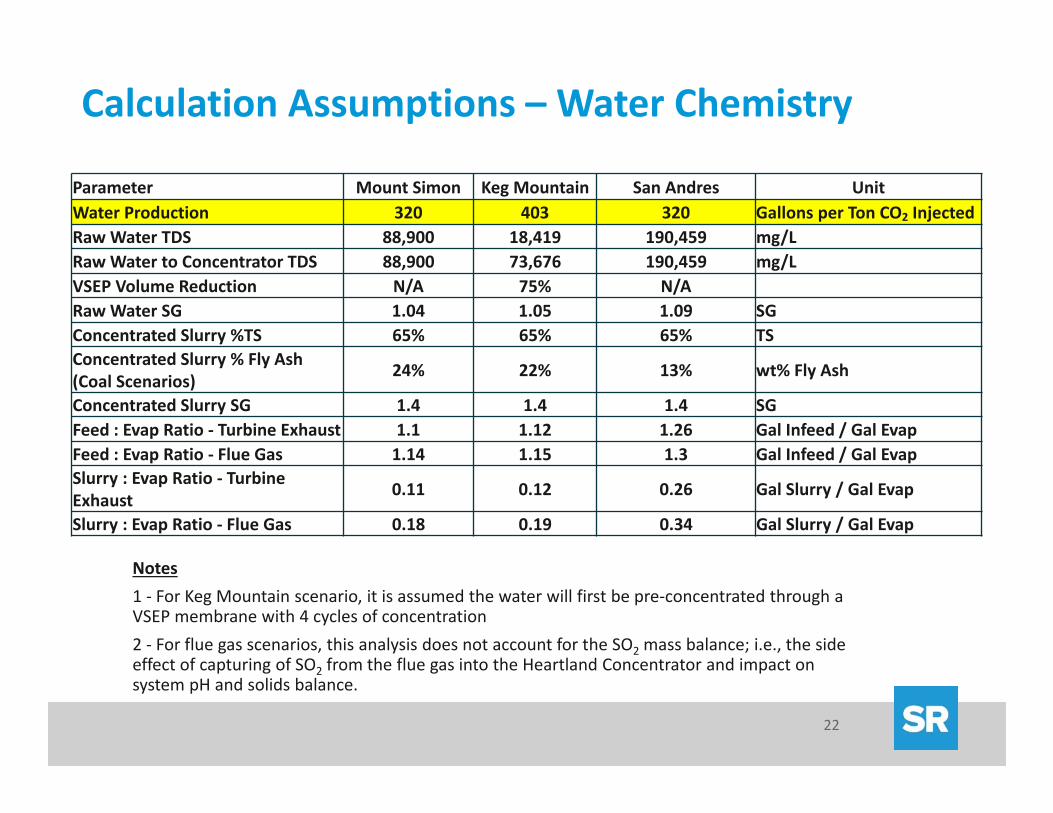
Notes1 ‐ For Keg Mountain scenario, it is assumed the water will first be pre‐concentrated through a VSEP membrane with 4 cycles of concentration2 ‐ For flue gas scenarios, this analysis does not account for the SO2 mass balance; i.e., the side effect of capturing of SO2 from the flue gas into the Heartland Concentrator and impact on system pH and solids balance.
Calculation Assumptions – Water Chemistry
Parameter Mount Simon Keg Mountain San Andres UnitWater Production 320 403 320 Gallons per Ton CO2 InjectedRaw Water TDS 88,900 18,419 190,459 mg/LRaw Water to Concentrator TDS 88,900 73,676 190,459 mg/LVSEP Volume Reduction N/A 75% N/ARaw Water SG 1.04 1.05 1.09 SGConcentrated Slurry %TS 65% 65% 65% TSConcentrated Slurry % Fly Ash (Coal Scenarios) 24% 22% 13% wt% Fly Ash
Concentrated Slurry SG 1.4 1.4 1.4 SGFeed : Evap Ratio ‐ Turbine Exhaust 1.1 1.12 1.26 Gal Infeed / Gal EvapFeed : Evap Ratio ‐ Flue Gas 1.14 1.15 1.3 Gal Infeed / Gal EvapSlurry : Evap Ratio ‐ Turbine Exhaust 0.11 0.12 0.26 Gal Slurry / Gal Evap
Slurry : Evap Ratio ‐ Flue Gas 0.18 0.19 0.34 Gal Slurry / Gal Evap
22
Notes1 ‐ For Keg Mountain scenario, it is assumed the water will first be pre‐concentrated through a VSEP membrane with 4 cycles of concentration2 ‐ For flue gas scenarios, this analysis does not account for the SO2 mass balance; i.e., the side effect of capturing of SO2 from the flue gas into the Heartland Concentrator and impact on system pH and solids balance.
Calculation Assumptions – Water Chemistry
Parameter Mount Simon Keg Mountain San Andres UnitWater Production 320 403 320 Gallons per Ton CO2 InjectedRaw Water TDS 88,900 18,419 190,459 mg/LRaw Water to Concentrator TDS 88,900 73,676 190,459 mg/LVSEP Volume Reduction N/A 75% N/ARaw Water SG 1.04 1.05 1.09 SGConcentrated Slurry %TS 65% 65% 65% TSConcentrated Slurry % Fly Ash (Coal Scenarios) 24% 22% 13% wt% Fly Ash
Concentrated Slurry SG 1.4 1.4 1.4 SGFeed : Evap Ratio ‐ Turbine Exhaust 1.1 1.12 1.26 Gal Infeed / Gal EvapFeed : Evap Ratio ‐ Flue Gas 1.14 1.15 1.3 Gal Infeed / Gal EvapSlurry : Evap Ratio ‐ Turbine Exhaust 0.11 0.12 0.26 Gal Slurry / Gal Evap
Slurry : Evap Ratio ‐ Flue Gas 0.18 0.19 0.34 Gal Slurry / Gal Evap
23
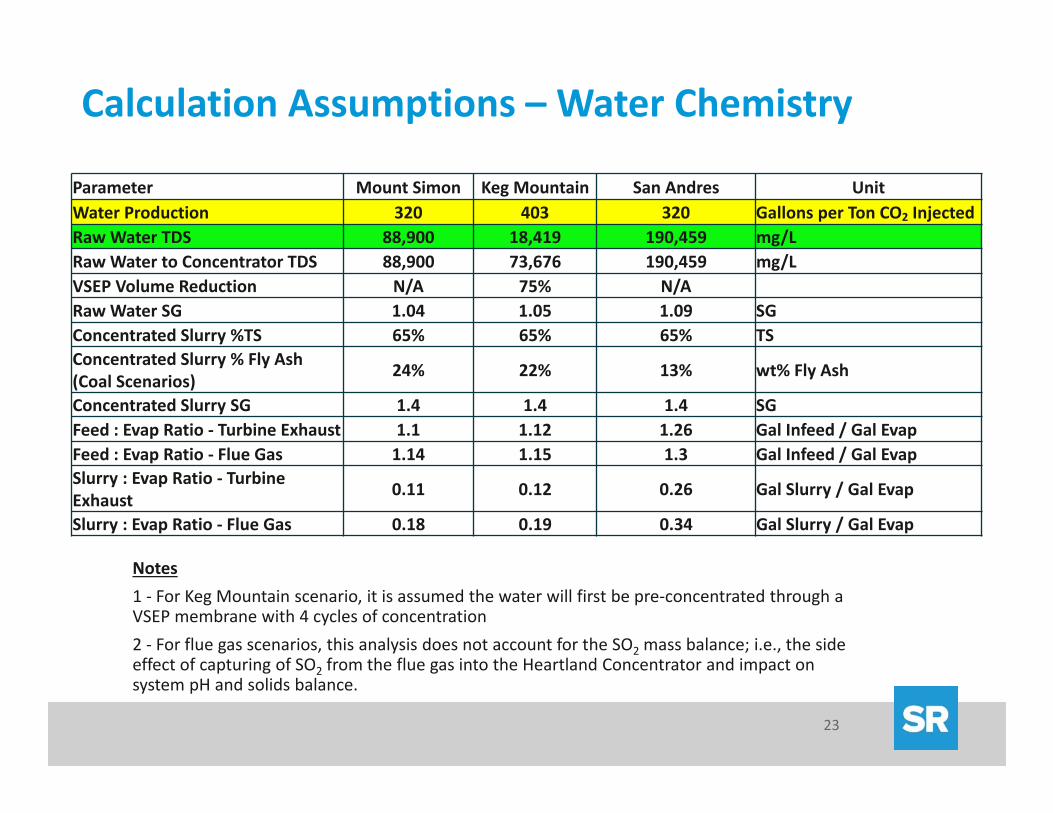
Notes1 ‐ For Keg Mountain scenario, it is assumed the water will first be pre‐concentrated through a VSEP membrane with 4 cycles of concentration2 ‐ For flue gas scenarios, this analysis does not account for the SO2 mass balance; i.e., the side effect of capturing of SO2 from the flue gas into the Heartland Concentrator and impact on system pH and solids balance.
Calculation Assumptions – Water Chemistry
Parameter Mount Simon Keg Mountain San Andres UnitWater Production 320 403 320 Gallons per Ton CO2 InjectedRaw Water TDS 88,900 18,419 190,459 mg/LRaw Water to Concentrator TDS 88,900 73,676 190,459 mg/LVSEP Volume Reduction N/A 75% N/ARaw Water SG 1.04 1.05 1.09 SGConcentrated Slurry %TS 65% 65% 65% TSConcentrated Slurry % Fly Ash (Coal Scenarios) 24% 22% 13% wt% Fly Ash
Concentrated Slurry SG 1.4 1.4 1.4 SGFeed : Evap Ratio ‐ Turbine Exhaust 1.1 1.12 1.26 Gal Infeed / Gal EvapFeed : Evap Ratio ‐ Flue Gas 1.14 1.15 1.3 Gal Infeed / Gal EvapSlurry : Evap Ratio ‐ Turbine Exhaust 0.11 0.12 0.26 Gal Slurry / Gal Evap
Slurry : Evap Ratio ‐ Flue Gas 0.18 0.19 0.34 Gal Slurry / Gal Evap

24
Notes1 ‐ For Keg Mountain scenario, it is assumed the water will first be pre‐concentrated through a VSEP membrane with 4 cycles of concentration2 ‐ For flue gas scenarios, this analysis does not account for the SO2 mass balance; i.e., the side effect of capturing of SO2 from the flue gas into the Heartland Concentrator and impact on system pH and solids balance.
Calculation Assumptions – Water Chemistry
Parameter Mount Simon Keg Mountain San Andres UnitWater Production 320 403 320 Gallons per Ton CO2 InjectedRaw Water TDS 88,900 18,419 190,459 mg/LRaw Water to Concentrator TDS 88,900 73,676 190,459 mg/LVSEP Volume Reduction N/A 75% N/ARaw Water SG 1.04 1.05 1.09 SGConcentrated Slurry %TS 65% 65% 65% TSConcentrated Slurry % Fly Ash (Coal Scenarios) 24% 22% 13% wt% Fly Ash
Concentrated Slurry SG 1.4 1.4 1.4 SGFeed : Evap Ratio ‐ Turbine Exhaust 1.1 1.12 1.26 Gal Infeed / Gal EvapFeed : Evap Ratio ‐ Flue Gas 1.14 1.15 1.3 Gal Infeed / Gal EvapSlurry : Evap Ratio ‐ Turbine Exhaust 0.11 0.12 0.26 Gal Slurry / Gal Evap
Slurry : Evap Ratio ‐ Flue Gas 0.18 0.19 0.34 Gal Slurry / Gal Evap
25
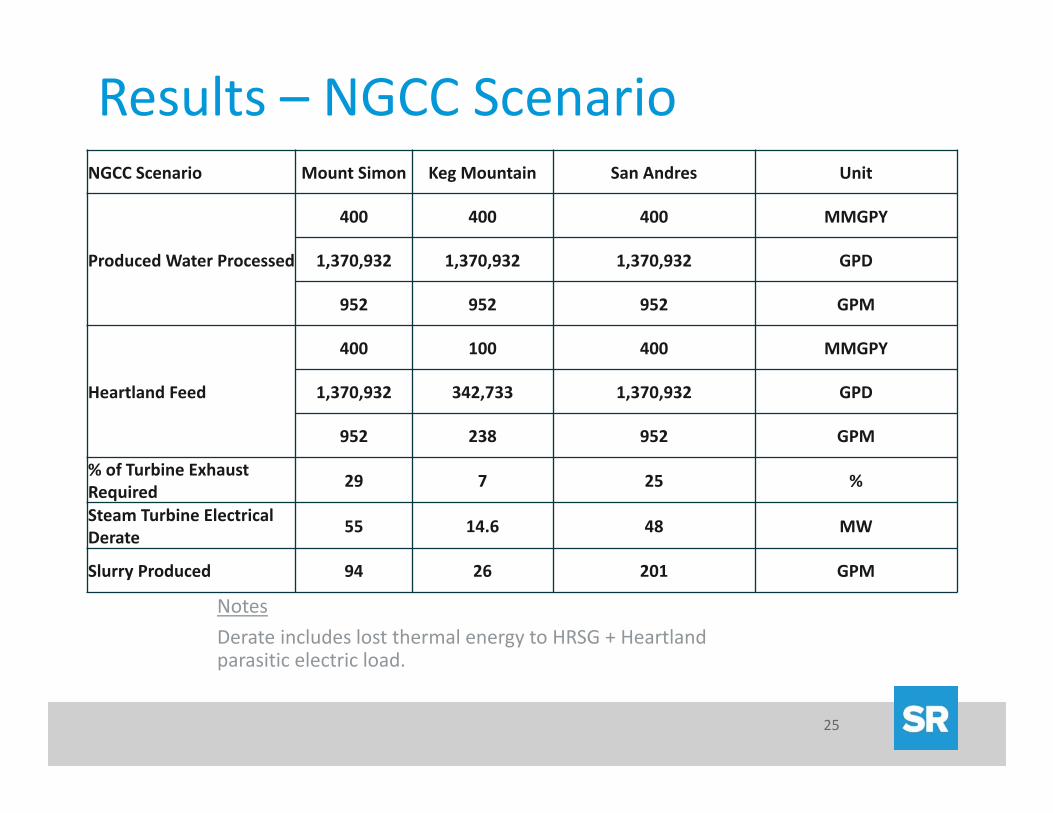
Results – NGCC Scenario
NotesDerate includes lost thermal energy to HRSG + Heartland parasitic electric load.
NGCC Scenario Mount Simon Keg Mountain San Andres Unit
Produced Water Processed
400 400 400 MMGPY
1,370,932 1,370,932 1,370,932 GPD
952 952 952 GPM
Heartland Feed
400 100 400 MMGPY
1,370,932 342,733 1,370,932 GPD
952 238 952 GPM
% of Turbine Exhaust Required 29 7 25 %
Steam Turbine Electrical Derate 55 14.6 48 MW
Slurry Produced 94 26 201 GPM

26
Results – NGCC Scenario
26
NotesDerate includes lost thermal energy to HRSG + Heartland parasitic electric load.
NGCC Scenario Mount Simon Keg Mountain San Andres Unit
Produced Water Processed
400 400 400 MMGPY
1,370,932 1,370,932 1,370,932 GPD
952 952 952 GPM
Heartland Feed
400 100 400 MMGPY
1,370,932 342,733 1,370,932 GPD
952 238 952 GPM
% of Turbine Exhaust Required 29 7 25 %
Steam Turbine Electrical Derate 55 14.6 48 MW
Slurry Produced 94 26 201 GPM

27
Results – NGCC Scenario
NotesDerate includes lost thermal energy to HRSG + Heartland parasitic electric load.
NGCC Scenario Mount Simon Keg Mountain San Andres Unit
Produced Water Processed
400 400 400 MMGPY
1,370,932 1,370,932 1,370,932 GPD
952 952 952 GPM
Heartland Feed
400 100 400 MMGPY
1,370,932 342,733 1,370,932 GPD
952 238 952 GPM
% of Turbine Exhaust Required 29 7 25 %
Steam Turbine Electrical Derate 55 14.6 48 MW
Slurry Produced 94 26 201 GPM

28
Results – NGCC Scenario
28
NotesDerate includes lost thermal energy to HRSG + Heartland parasitic electric load.
NGCC Scenario Mount Simon Keg Mountain San Andres Unit
Produced Water Processed
400 400 400 MMGPY
1,370,932 1,370,932 1,370,932 GPD
952 952 952 GPM
Heartland Feed
400 100 400 MMGPY
1,370,932 342,733 1,370,932 GPD
952 238 952 GPM
% of Turbine Exhaust Required 29 7 25 %
Steam Turbine Electrical Derate 55 14.6 48 MW
Slurry Produced 94 26 201 GPM

29
Results – NGCC Scenario
29
NotesDerate includes lost thermal energy to HRSG + Heartland parasitic electric load.
NGCC Scenario Mount Simon Keg Mountain San Andres Unit
Produced Water Processed
400 400 400 MMGPY
1,370,932 1,370,932 1,370,932 GPD
952 952 952 GPM
Heartland Feed
400 100 400 MMGPY
1,370,932 342,733 1,370,932 GPD
952 238 952 GPM
% of Turbine Exhaust Required 29 7 25 %
Turbine Electrical Derate 55 14.6 48 MW
Slurry Produced 94 26 201 GPM

30
Results – Coal Scenario
Notes1 ‐ Derate includes lost thermal energy to APH + Heartland parasitic electric load.2 ‐ Red highlight = Impossible scenario given flue gas requirement3 ‐ Yellow highlight = thermodynamically possible, but likely presents significant integration challenges with AQCS equipment and performance.
Coal Scenario A Mount Simon Keg Mountain San Andres Unit
Produced Water Processed
992 1,249 992 MMGPY
3,397,769 4,279,066 3,397,769 GPD
2,360 2,972 2,360 GPM
Heartland Feed
992 312 992 MMGPY
3,397,769 1,069,766 3,397,769 GPD
2,360 743 2,360 GPM
% of Flue Gas Required 192 60 168 %
Plant Derate 99 32.7 86 MW
Slurry Produced 370 125 618 GPM

31
Derate Comparison
0
10
20
30
40
50
60
70
80
90
100
Mount Simon Keg Mountain San Andres
Derate (M
W)
NGCC Coal

32
% of Flue Gas or Turbine Exhaust Required
0
20
40
60
80
100
120
140
160
180
200
Mount Simon Keg Mountain San Andres
% of F
lue Gas or T
urbine
Exh
aust Req
uired NGCC Coal

33
• Conduct bench scale studies to optimize mix formulations required for solidifying and stabilizing (S/S) solids
– Based on simulated brine with high concentrations
• Utilize leaching environmental assessment framework (LEAF) testing to determine leachability of constituents of concern.
SOLIDIFICATION / STABILIZATION
Southern Research Energy & Environment |
34
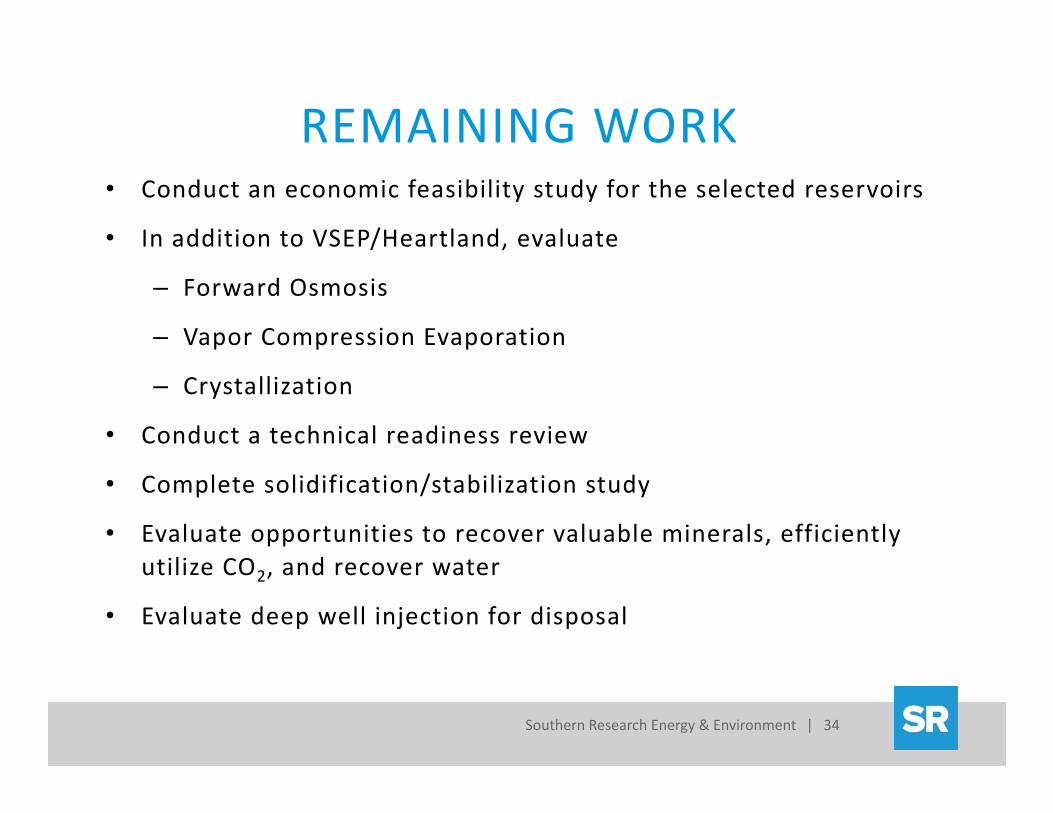
• Conduct an economic feasibility study for the selected reservoirs
• In addition to VSEP/Heartland, evaluate
– Forward Osmosis
– Vapor Compression Evaporation
– Crystallization
• Conduct a technical readiness review
• Complete solidification/stabilization study
• Evaluate opportunities to recover valuable minerals, efficiently utilize CO2, and recover water
• Evaluate deep well injection for disposal
REMAINING WORK
Southern Research Energy & Environment |
35
ACKNOWLEDGMENTSUSDOE for funding and Project Officer Maria Reidpath.

36
REFERENCES
Southern Research Energy & Environment |
Luo, J., L. Ding, Y. Wan and M. Y. Jaffrin (2012). "Threshold flux for shear‐enhanced nanofiltration: Experimental observation in dairy wastewater treatment." Journal of Membrane Science 409–410(0): 276‐284.Luo, J., Z. Zhu, L. Ding, O. Bals, Y. Wan, M. Y. Jaffrin and E. Vorobiev (2013). "Flux behavior in clarification of chicory juice by high‐shear membrane filtration: Evidence for threshold flux." Journal of Membrane Science 435(0): 120‐129.
