treb market watch october 2015 · toronto real estate board market watch, october 2015 number of...
TRANSCRIPT

Toronto EmploymentGrowthSeptember 2015 5.1%
Month October 20151 Year3 Year5 Year
2.89%3.39%4.64%
October 20151 Year3 Year5 Year
------
Market Watch For All TREB Member Inquiries:
(416) 443-8158For All Media/Public Inquiries:
(416) 443-8152
Record Home Sales for OctoberTORONTO, November 5, 2015 – Toronto Real Estate Board President Mark McLeanannounced that Greater Toronto Area REALTORS® reported 8,804 home salesthrough TREB’s MLS® System in October 2015. This is the best result on record forthe month of October.
“It is clear that many GTA households remain upbeat about home ownershipbecause owning a home represents a high quality, long-term investment. We willsee a big, new record this year for home sales reported through TREB’s MLS®System,” said Mr. McLean.
“Despite the record October result, I must point out that the Government of Ontariocould hamper home sales in the near future. The Wynne government is seriouslyconsidering allowing municipalities throughout Ontario to institute a second landtransfer tax on top of the existing provincial tax. Recent polling has shown that thegreat majority of Ontarians oppose this tax and would consider delaying a move ifthey were forced to bear the additional upfront cost,” added Mr. McLean.
The MLS® Home Price Index (HPI) Composite Benchmark was up by 10.3 per centyear over year in October. Over the same period, the average selling price for allhome types combined was up by 7.3 per cent to $630,876. Price growth continuedto be driven by the low-rise market segments.
“Record sales coupled with a constrained supply of listings in many GTAneighbourhoods has underpinned very strong price growth throughout 2015. Even ifwe do see a greater supply of low-rise listings in the marketplace over the next year,market conditions will remain tight enough to see continued price growth well-abovethe rate of inflation,” said Jason Mercer, TREB’s Director of Market Analysis.
TREB MLS® Sales Activity
8,804 8,512
October 2015 October 2014
TREB MLS® Average Price
$630,876
$587,945
October 2015 October 2014
Year-Over-Year Summary2015 2014 % Chg.
SalesNew ListingsActive ListingsAverage PriceAverage DOM
8,804 8,512 3.4%13,339 13,389 -0.4%16,180 17,497 -7.5%
$630,876 $587,945 7.3%22 25 -12.0%
Sources and Notes:
i - Statistics Canada, Quarter-over-quartergrowth, annualized
ii - Statistics Canada, Year-over-yeargrowth for the most recently reportedmonth
iii - Bank of Canada, Rate from mostrecent Bank of Canada announcement
iv - Bank of Canada, Rates for mostrecently completed month
Real GDP GrowthQ2 2015 (0.5%)
Toronto UnemploymentRate September 2015 6.9%
Inflation Rate (Yr./Yr. CPIGrowth) September 2015 1.0%
Bank of Canada OvernightRate October 2015 -- 0.50%
Prime Rate October 2015 -- 2.70%
Economic Indicators
Metrics Sales Average Price416 905 Total 416 905 Total
2015DetachedSemi - DetachedTownhouseCondo Apartment
1,077 3,023 4,100 $1,071,394 $734,745 $823,177381 542 923 $747,149 $512,234 $609,203347 1,030 1,377 $579,358 $456,585 $487,524
1,587 632 2,219 $406,792 $318,317 $381,593
Sales & Average Price By Major Home TypeOctober 2015
October 2015
i
ii
ii
iii
iv
DetachedSemi - DetachedTownhouseCondo Apartment
12.5% 9.1% 9.2%10.0% 13.8% 11.6%11.2% 10.1% 9.8%4.2% 3.0% 3.9%
DetachedSemi - DetachedTownhouseCondo Apartment
-9.7% 2.4% -1.1%1.9% 4.2% 3.2%-3.6% 9.1% 5.6%9.7% 9.7% 9.7%
1,7
1,7
1,7
1,7
Year-Over-Year Per Cent Change
Mortgage Rates

Toronto Real Estate Board
Market Watch, October 2015
SALES BY PRICE RANGE AND HOUSE TYPE OCTOBER 2015
2
Price Range Detached Semi-Detached Att/Row/Twnhouse Condo Townhouse Condo Apt Link Co-op Apt Det Condo Co-ownership Apt Total
$0 to $99,999$100,000 to $199,999$200,000 to $299,999$300,000 to $399,999$400,000 to $499,999$500,000 to $599,999$600,000 to $699,999$700,000 to $799,999$800,000 to $899,999$900,000 to $999,999$1,000,000 to $1,249,999$1,250,000 to $1,499,999$1,500,000 to $1,749,999$1,750,000 to $1,999,999$2,000,000+
1 0 0 1 9 0 0 0 0 1111 0 1 25 117 0 2 0 3 15988 30 16 111 687 3 1 0 4 940301 57 129 205 709 34 1 2 2 1,440492 228 199 208 349 26 3 1 0 1,506605 239 129 68 153 22 1 2 2 1,221600 157 100 22 90 38 0 0 0 1,007487 79 66 16 39 26 1 0 0 714408 49 14 10 20 8 0 0 0 509252 33 18 3 10 2 0 0 0 318337 29 12 8 16 1 0 0 0 403210 10 9 3 11 0 0 0 0 243106 8 1 2 2 0 0 0 0 11972 1 0 0 1 0 0 0 0 74130 3 1 0 6 0 0 0 0 140
Price Range Detached Semi-Detached Att/Row/Twnhouse Condo Townhouse Condo Apt Link Co-op Apt Det Condo Co-ownership Apt Total
$0 to $99,999$100,000 to $199,999$200,000 to $299,999$300,000 to $399,999$400,000 to $499,999$500,000 to $599,999$600,000 to $699,999$700,000 to $799,999$800,000 to $899,999$900,000 to $999,999$1,000,000 to $1,249,999$1,250,000 to $1,499,999$1,500,000 to $1,749,999$1,750,000 to $1,999,999$2,000,000+
15 0 1 11 80 0 2 0 2 111192 10 7 301 1,298 0 27 0 12 1,847940 359 245 1,224 6,735 52 19 1 25 9,600
3,174 860 1,321 2,117 6,788 351 13 23 18 14,6655,364 2,454 2,173 1,792 3,302 223 11 25 3 15,3476,698 2,282 1,420 682 1,479 211 10 21 6 12,8096,625 1,352 1,020 262 688 262 6 10 0 10,2255,018 707 555 163 365 218 1 5 0 7,0323,920 397 190 60 178 95 2 2 0 4,8442,604 197 104 42 89 20 2 1 0 3,0593,456 186 93 43 144 4 0 0 0 3,9262,067 99 36 13 79 0 0 1 0 2,2951,030 43 8 9 43 0 0 0 0 1,133672 22 3 2 26 0 2 0 0 727
1,342 27 7 4 71 0 0 0 0 1,451
SALES BY PRICE RANGE AND HOUSE TYPE YEAR-TO-DATE, 2015
Total SalesShare of Total SalesAverage Price
4,100 923 695 682 2,219 160 9 5 11 8,80446.6% 10.5% 7.9% 7.7% 25.2% 1.8% 0.1% 0.1% 0.1% 100.0%
$823,177 $609,203 $551,973 $421,846 $381,593 $561,546 $401,556 $437,780 $289,273 $630,876
Total SalesShare of Total SalesAverage Price
43,117 8,995 7,183 6,725 21,365 1,436 95 89 66 89,07148.4% 10.1% 8.1% 7.6% 24.0% 1.6% 0.1% 0.1% 0.1% 100.0%
$804,079 $577,700 $530,147 $409,018 $379,187 $548,299 $375,922 $504,717 $284,014 $622,118
1,7
1,7

Toronto Real Estate Board
Market Watch, October 2015
Number of Sales Dollar Volume Average Price Median Price New Listings SNLR (Trend) Active Listings Mos. Inv. (Trend) Avg. SP / LP Avg. DOMTREB TotalHalton Region
BurlingtonHalton HillsMiltonOakville
Peel RegionBramptonCaledonMississauga
City of TorontoToronto WestToronto CentralToronto East
York RegionAuroraE. GwillimburyGeorginaKingMarkhamNewmarketRichmond HillVaughanWhitchurch-Stouffville
Durham RegionAjaxBrockClaringtonOshawaPickeringScugogUxbridgeWhitby
Dufferin CountyOrangeville
Simcoe CountyAdjala-TosorontioBradford WestGwillimburyEssaInnisfilNew Tecumseth
8,804 $5,554,227,953 630,876 $525,944 13,339 62.7% 16,180 1.9 99% 22741 $498,453,329 672,677 $596,000 1,015 68.2% 1,329 1.8 98% 24174 $110,292,015 633,862 $569,500 213 73.3% 304 1.8 98% 2898 $56,288,200 574,369 $515,500 119 69.5% 164 2.0 98% 31
192 $105,590,492 549,950 $520,000 252 73.1% 243 1.3 99% 17277 $226,282,622 816,905 $730,000 431 62.3% 618 2.2 98% 23
1,760 $938,558,903 533,272 $485,500 2,689 63.3% 3,063 1.7 99% 22762 $375,647,684 492,976 $470,000 1,155 65.7% 1,096 1.4 98% 2177 $58,414,965 758,636 $653,000 124 59.6% 235 2.8 98% 31
921 $504,496,254 547,770 $490,000 1,410 61.7% 1,732 1.9 99% 223,431 $2,303,400,938 671,350 $525,888 5,593 57.4% 7,333 2.2 100% 23878 $510,974,857 581,976 $519,500 1,384 59.6% 1,807 2.1 100% 22
1,658 $1,277,321,917 770,399 $505,000 2,778 52.2% 4,116 2.7 100% 26895 $515,104,164 575,535 $560,000 1,431 66.6% 1,410 1.3 102% 18
1,604 $1,254,769,216 782,275 $705,000 2,439 63.6% 2,858 1.7 99% 2185 $57,306,000 674,188 $625,000 110 72.3% 126 1.5 100% 2026 $15,218,000 585,308 $545,000 49 63.3% 76 2.4 97% 3689 $34,830,130 391,350 $379,900 129 68.0% 166 2.0 98% 2541 $41,509,900 1,012,437 $920,000 72 49.3% 152 4.9 96% 39
453 $367,283,369 810,780 $743,000 720 60.5% 808 1.6 101% 21137 $85,203,700 621,925 $580,000 168 78.0% 142 1.0 100% 16342 $319,729,665 934,882 $825,000 502 61.3% 557 1.7 99% 22363 $278,121,384 766,175 $735,000 579 63.4% 663 1.8 99% 2168 $55,567,068 817,163 $689,500 110 65.4% 168 2.0 99% 19
989 $440,025,909 444,920 $407,500 1,273 74.0% 1,121 1.2 100% 18185 $90,104,300 487,050 $455,000 241 76.0% 150 0.8 100% 1612 $3,810,900 317,575 $259,950 22 60.0% 69 4.3 96% 71
149 $58,049,483 389,594 $365,000 175 74.7% 156 1.2 100% 18250 $84,660,455 338,642 $322,500 318 76.8% 242 0.9 100% 14125 $71,919,301 575,354 $505,000 188 71.0% 168 1.2 99% 2044 $20,255,700 460,357 $416,450 42 61.1% 79 2.9 97% 4536 $21,588,677 599,685 $551,450 40 62.6% 82 3.1 98% 27
188 $89,637,093 476,793 $468,250 247 76.8% 175 0.9 100% 1557 $22,351,200 392,126 $380,500 52 87.4% 59 1.4 99% 2257 $22,351,200 392,126 $380,500 52 87.4% 59 1.4 99% 22
222 $96,668,458 435,444 $412,250 278 70.3% 417 2.3 98% 2823 $11,505,300 500,230 $486,000 29 67.6% 52 3.6 99% 3358 $30,072,399 518,490 $510,000 72 74.0% 75 1.6 98% 2324 $8,989,509 374,563 $345,000 27 72.5% 43 2.3 98% 3351 $19,942,350 391,026 $377,000 81 61.0% 145 3.0 97% 3666 $26,158,900 396,347 $377,450 69 76.9% 102 2.0 98% 23
SUMMARY OF EXISTING HOME TRANSACTIONS ALL HOME TYPES, OCTOBER 2015ALL TREB AREAS
3
1 1 1 2 5498 3

Toronto Real Estate Board
Market Watch, October 2015
SUMMARY OF EXISTING HOME TRANSACTIONS ALL HOME TYPES, OCTOBER 2015CITY OF TORONTO MUNICIPAL BREAKDOWN
4
Number of Sales Dollar Volume Average Price Median Price New Listings SNLR (Trend) Active Listings Mos. Inv. (Trend) Avg. SP / LP Avg. DOMTREB TotalCity of Toronto TotalToronto West
Toronto W01Toronto W02Toronto W03Toronto W04Toronto W05Toronto W06Toronto W07Toronto W08Toronto W09Toronto W10
Toronto CentralToronto C01Toronto C02Toronto C03Toronto C04Toronto C06Toronto C07Toronto C08Toronto C09Toronto C10Toronto C11Toronto C12Toronto C13Toronto C14Toronto C15
Toronto EastToronto E01Toronto E02Toronto E03Toronto E04Toronto E05Toronto E06Toronto E07Toronto E08Toronto E09Toronto E10Toronto E11
8,804 $5,554,227,953 $630,876 $525,944 13,339 62.7% 16,180 1.9 99% 223,431 $2,303,400,938 $671,350 $525,888 5,593 57.4% 7,333 2.2 100% 23878 $510,974,857 $581,976 $519,500 1,384 59.6% 1,807 2.1 100% 2271 $46,093,010 $649,197 $502,000 103 53.7% 144 2.3 102% 1898 $71,250,483 $727,046 $686,500 108 69.6% 92 1.3 104% 1573 $38,290,200 $524,523 $520,000 98 65.1% 97 1.4 102% 2064 $33,447,100 $522,611 $530,000 135 62.3% 157 1.9 99% 20
117 $49,228,767 $420,759 $458,000 159 64.3% 224 2.0 99% 23110 $55,667,334 $506,067 $454,500 249 45.9% 416 3.5 100% 2730 $25,724,300 $857,477 $770,000 41 62.1% 46 1.6 100% 21
186 $133,525,563 $717,879 $636,500 283 58.2% 398 2.3 100% 2547 $26,484,500 $563,500 $585,000 74 71.0% 90 1.6 99% 2682 $31,263,600 $381,263 $418,450 134 66.3% 143 1.8 98% 22
1,658 $1,277,321,917 $770,399 $505,000 2,778 52.2% 4,116 2.7 100% 26482 $263,496,640 $546,674 $438,400 866 48.5% 1,339 3.3 99% 2981 $97,360,450 $1,201,981 $891,000 160 47.5% 273 3.4 99% 2250 $62,850,215 $1,257,004 $771,250 95 53.5% 126 2.4 99% 2675 $115,285,764 $1,537,144 $1,435,000 143 58.5% 167 1.9 102% 1634 $23,560,396 $692,953 $620,000 57 53.4% 104 2.7 102% 28
121 $97,429,155 $805,200 $562,800 177 54.8% 273 2.4 99% 26193 $94,206,007 $488,114 $413,000 277 53.6% 401 2.5 98% 2632 $36,924,393 $1,153,887 $832,500 50 58.3% 74 2.3 99% 1760 $47,044,742 $784,079 $623,000 94 57.9% 104 2.0 102% 1943 $37,058,831 $861,833 $409,000 47 65.1% 50 1.6 103% 1936 $95,407,063 $2,650,196 $2,108,000 90 49.9% 166 3.6 97% 3196 $67,933,508 $707,641 $593,500 129 64.9% 144 1.7 102% 24
187 $137,522,988 $735,417 $455,000 314 50.1% 493 2.9 99% 27168 $101,241,765 $602,630 $443,250 279 51.0% 402 2.7 99% 27895 $515,104,164 $575,535 $560,000 1,431 66.6% 1,410 1.3 102% 1879 $60,135,884 $761,214 $707,018 154 65.3% 124 1.1 105% 1173 $66,322,159 $908,523 $850,000 102 64.7% 106 1.2 102% 12
101 $73,017,235 $722,943 $707,000 183 69.8% 118 0.9 104% 12112 $53,239,944 $475,357 $547,450 172 67.6% 157 1.2 101% 2188 $47,090,765 $535,122 $470,900 136 67.9% 141 1.2 103% 1744 $29,441,714 $669,130 $583,750 61 63.5% 59 1.4 101% 1978 $36,449,576 $467,302 $397,500 139 62.2% 201 1.8 100% 2361 $30,937,900 $507,179 $550,000 91 68.7% 96 1.4 100% 18
111 $47,043,500 $423,815 $405,000 162 68.0% 168 1.5 101% 2660 $33,134,100 $552,235 $557,500 112 61.9% 122 1.5 101% 1988 $38,291,387 $435,129 $455,000 119 70.5% 118 1.2 100% 22
1 1 1 2 8 3 9 4 5

Toronto Real Estate Board
Market Watch, October 2015
SUMMARY OF EXISTING HOME TRANSACTIONS ALL HOME TYPES, YEAR-TO-DATE 2015ALL TREB AREAS
5
Number of Sales Dollar Volume Average Price Median Price New Listings Avg. SP / LP Avg. DOMTREB TotalHalton Region
BurlingtonHalton HillsMiltonOakville
Peel RegionBramptonCaledonMississauga
City of TorontoToronto WestToronto CentralToronto East
York RegionAuroraE. GwillimburyGeorginaKingMarkhamNewmarketRichmond HillVaughanWhitchurch-Stouffville
Durham RegionAjaxBrockClaringtonOshawaPickeringScugogUxbridgeWhitby
Dufferin CountyOrangeville
Simcoe CountyAdjala-TosorontioBradford WestGwillimburyEssaInnisfilNew Tecumseth
89,071 $55,412,639,338 $622,118 $522,000 146,274 100% 217,779 $5,189,557,318 $667,124 $580,000 11,715 98% 231,800 $1,071,978,608 $595,544 $545,000 2,516 98% 27907 $501,798,516 $553,251 $505,000 1,346 98% 27
2,101 $1,145,530,381 $545,231 $516,000 2,965 99% 172,971 $2,470,249,813 $831,454 $719,900 4,888 98% 2418,411 $9,689,732,035 $526,301 $482,500 29,914 99% 208,236 $4,021,847,566 $488,325 $465,000 12,812 99% 18870 $590,211,769 $678,404 $604,950 1,515 98% 27
9,305 $5,077,672,700 $545,693 $498,500 15,587 99% 2232,499 $21,508,859,147 $661,831 $520,000 58,625 101% 228,291 $4,723,171,959 $569,675 $510,000 14,373 101% 2315,421 $11,872,997,712 $769,924 $498,000 30,506 100% 258,787 $4,912,689,476 $559,086 $550,000 13,746 103% 1616,925 $13,124,585,759 $775,456 $695,000 27,367 101% 20
980 $721,632,291 $736,359 $650,000 1,385 100% 19298 $184,542,584 $619,270 $540,000 485 97% 28920 $377,122,339 $409,916 $390,000 1,397 98% 26360 $355,562,708 $987,674 $881,996 742 96% 40
4,689 $3,761,559,710 $802,209 $740,000 7,984 103% 171,546 $951,547,674 $615,490 $587,200 2,033 100% 173,401 $3,017,709,807 $887,301 $798,000 5,709 101% 193,901 $3,105,858,651 $796,170 $721,000 6,332 99% 20830 $649,049,995 $781,988 $675,500 1,300 99% 23
10,512 $4,631,867,132 $440,627 $415,000 14,519 100% 171,938 $950,487,224 $490,447 $465,000 2,570 101% 13192 $63,004,435 $328,148 $277,500 343 96% 45
1,740 $678,010,981 $389,661 $365,000 2,357 100% 182,682 $934,657,197 $348,493 $334,000 3,572 101% 141,315 $697,410,194 $530,350 $487,500 1,909 101% 16351 $164,300,597 $468,093 $428,950 590 98% 37300 $173,002,225 $576,674 $524,500 515 98% 33
1,994 $970,994,279 $486,958 $460,000 2,663 101% 14621 $243,685,553 $392,408 $370,000 736 99% 27621 $243,685,553 $392,408 $370,000 736 99% 27
2,324 $1,024,352,394 $440,771 $414,800 3,398 98% 32182 $93,487,200 $513,666 $488,700 281 97% 54664 $348,429,430 $524,743 $510,000 931 98% 24301 $111,386,674 $370,055 $325,000 421 98% 35580 $235,467,726 $405,979 $375,000 963 98% 34597 $235,581,364 $394,609 $370,000 802 98% 31
1 1 1 2 4 5

Toronto Real Estate Board
Market Watch, October 2015
SUMMARY OF EXISTING HOME TRANSACTIONS ALL HOME TYPES, YEAR-TO-DATE 2015CITY OF TORONTO MUNICIPAL BREAKDOWN
6
Number of Sales Dollar Volume Average Price Median Price New Listings Avg. SP / LP Avg. DOMTREB TotalCity of Toronto TotalToronto West
Toronto W01Toronto W02Toronto W03Toronto W04Toronto W05Toronto W06Toronto W07Toronto W08Toronto W09Toronto W10
Toronto CentralToronto C01Toronto C02Toronto C03Toronto C04Toronto C06Toronto C07Toronto C08Toronto C09Toronto C10Toronto C11Toronto C12Toronto C13Toronto C14Toronto C15
Toronto EastToronto E01Toronto E02Toronto E03Toronto E04Toronto E05Toronto E06Toronto E07Toronto E08Toronto E09Toronto E10Toronto E11
89,071 $55,412,639,338 $622,118 $522,000 146,274 100% 2132,499 $21,508,859,147 $661,831 $520,000 58,625 101% 228,291 $4,723,171,959 $569,675 $510,000 14,373 101% 23576 $400,720,486 $695,695 $520,000 1,095 103% 21801 $564,662,660 $704,947 $676,500 1,181 105% 16633 $333,757,971 $527,264 $527,000 1,007 102% 18717 $357,205,642 $498,195 $500,000 1,206 100% 22
1,111 $484,026,277 $435,667 $472,500 1,801 99% 261,154 $599,309,275 $519,332 $470,000 2,631 100% 28266 $232,227,818 $873,037 $817,750 449 102% 18
1,714 $1,167,924,287 $681,403 $541,944 3,032 99% 25472 $263,368,776 $557,985 $593,500 702 101% 22847 $319,968,767 $377,767 $416,000 1,269 99% 25
15,421 $11,872,997,712 $769,924 $498,000 30,506 100% 254,428 $2,258,912,572 $510,143 $418,950 9,405 99% 29710 $870,699,622 $1,226,337 $951,550 1,558 100% 28468 $566,678,273 $1,210,851 $810,500 885 100% 20867 $1,260,070,860 $1,453,369 $1,365,000 1,536 101% 19335 $241,799,478 $721,789 $782,000 660 101% 24
1,216 $884,720,020 $727,566 $488,000 2,292 100% 251,589 $779,671,295 $490,668 $418,000 3,058 99% 26308 $517,666,199 $1,680,734 $1,452,500 542 100% 21566 $454,367,674 $802,770 $643,250 984 103% 19392 $278,095,558 $709,427 $370,850 618 102% 20403 $894,791,164 $2,220,325 $1,840,000 831 98% 28780 $614,368,258 $787,652 $614,750 1,243 104% 19
1,819 $1,279,554,959 $703,439 $440,000 3,827 99% 281,540 $971,601,780 $630,910 $464,250 3,067 102% 248,787 $4,912,689,476 $559,086 $550,000 13,746 103% 16769 $566,444,710 $736,599 $710,000 1,205 107% 12655 $559,246,497 $853,811 $753,000 1,071 104% 12947 $655,036,740 $691,697 $666,000 1,406 105% 12
1,048 $490,639,469 $468,167 $525,000 1,614 102% 16917 $483,901,040 $527,700 $456,000 1,413 104% 17359 $237,399,572 $661,280 $585,000 602 101% 16887 $429,911,537 $484,680 $446,000 1,503 103% 20599 $309,593,619 $516,851 $513,500 885 100% 19
1,200 $495,405,816 $412,838 $365,000 1,862 102% 21606 $338,621,435 $558,781 $559,150 1,001 102% 17800 $346,489,041 $433,111 $433,250 1,184 102% 17
1 1 1 2 4 5

Toronto Real Estate Board
Market Watch, October 2015
SUMMARY OF EXISTING HOME TRANSACTIONS DETACHED HOUSES, OCTOBER 2015ALL TREB AREAS
7
Sales Dollar Volume Average Price Median Price New Listings Active Listings Avg. SP / LP Avg. DOMTREB TotalHalton Region
BurlingtonHalton HillsMiltonOakville
Peel RegionBramptonCaledonMississauga
City of TorontoToronto WestToronto CentralToronto East
York RegionAuroraE. GwillimburyGeorginaKingMarkhamNewmarketRichmond HillVaughanWhitchurch-Stouffville
Durham RegionAjaxBrockClaringtonOshawaPickeringScugogUxbridgeWhitby
Dufferin CountyOrangeville
Simcoe CountyAdjala-TosorontioBradford WestGwillimburyEssaInnisfilNew Tecumseth
4,100 $3,375,025,096 $823,177 $690,000 6,299 7,349 99% 21440 $360,988,920 $820,429 $707,000 606 910 98% 27106 $83,291,927 $785,773 $677,000 131 216 98% 3376 $48,137,000 $633,382 $610,000 96 144 97% 3390 $60,289,344 $669,882 $633,750 129 175 99% 22
168 $169,270,649 $1,007,563 $872,000 250 375 98% 24800 $554,159,269 $692,699 $635,000 1,322 1,553 98% 22432 $246,905,664 $571,541 $546,000 690 698 98% 2164 $52,324,575 $817,571 $675,500 103 214 97% 34
304 $254,929,030 $838,582 $753,500 529 641 98% 191,077 $1,153,890,992 $1,071,394 $840,000 1,775 1,873 101% 16330 $277,453,085 $840,767 $735,000 551 629 101% 17354 $583,713,191 $1,648,907 $1,367,500 543 645 100% 18393 $292,724,716 $744,847 $656,000 681 599 102% 15905 $879,700,362 $972,045 $862,000 1,415 1,704 99% 2043 $35,455,800 $824,553 $770,000 77 96 100% 1920 $12,763,500 $638,175 $591,750 38 68 97% 4373 $29,579,030 $405,192 $400,000 110 149 98% 2732 $36,177,900 $1,130,559 $1,076,500 56 123 95% 40
210 $230,513,574 $1,097,684 $960,000 341 342 101% 1784 $59,485,900 $708,165 $677,500 101 100 99% 17
200 $243,366,794 $1,216,834 $1,007,500 290 306 99% 20196 $187,724,984 $957,781 $857,063 319 368 99% 1847 $44,632,880 $949,636 $765,000 83 152 98% 22
664 $329,393,244 $496,074 $470,000 906 885 99% 20114 $63,083,600 $553,365 $529,500 153 87 100% 1611 $3,585,900 $325,991 $260,000 22 66 96% 7296 $41,818,983 $435,614 $421,500 121 131 100% 22
181 $66,278,046 $366,177 $349,900 241 197 100% 1467 $49,652,800 $741,087 $650,000 116 117 99% 2042 $19,634,700 $467,493 $429,000 40 77 97% 4731 $19,584,677 $631,764 $579,000 36 72 98% 26
122 $65,754,538 $538,972 $511,600 177 138 100% 1542 $18,234,900 $434,164 $414,250 37 45 99% 2642 $18,234,900 $434,164 $414,250 37 45 99% 26
172 $78,657,409 $457,311 $429,779 238 379 98% 3023 $11,505,300 $500,230 $486,000 29 52 99% 3341 $23,020,200 $561,468 $547,000 54 68 98% 2819 $7,448,359 $392,019 $365,000 22 39 98% 3247 $18,594,450 $395,627 $380,000 81 142 97% 3642 $18,089,100 $430,693 $410,000 52 78 98% 21
1 2 3 4 51 1 1

Toronto Real Estate Board
Market Watch, October 2015
SUMMARY OF EXISTING HOME TRANSACTIONS DETACHED HOUSES, OCTOBER 2015CITY OF TORONTO MUNICIPAL BREAKDOWN
8
Sales Dollar Volume Average Price Median Price New Listings Active Listings Avg. SP / LP Avg. DOMTREB TotalCity of Toronto TotalToronto West
Toronto W01Toronto W02Toronto W03Toronto W04Toronto W05Toronto W06Toronto W07Toronto W08Toronto W09Toronto W10
Toronto CentralToronto C01Toronto C02Toronto C03Toronto C04Toronto C06Toronto C07Toronto C08Toronto C09Toronto C10Toronto C11Toronto C12Toronto C13Toronto C14Toronto C15
Toronto EastToronto E01Toronto E02Toronto E03Toronto E04Toronto E05Toronto E06Toronto E07Toronto E08Toronto E09Toronto E10Toronto E11
4,100 $3,375,025,096 $823,177 $690,000 6,299 7,349 99% 211,077 $1,153,890,992 $1,071,394 $840,000 1,775 1,873 101% 16330 $277,453,085 $840,767 $735,000 551 629 101% 1715 $16,781,500 $1,118,767 $1,015,000 28 26 101% 1735 $34,889,133 $996,832 $905,000 33 24 105% 1430 $15,831,600 $527,720 $525,000 48 53 102% 2136 $23,248,700 $645,797 $635,000 87 102 98% 1519 $12,160,312 $640,016 $635,000 42 49 99% 2028 $20,249,190 $723,185 $671,500 48 57 103% 1223 $22,739,300 $988,665 $890,000 32 30 100% 1688 $95,259,000 $1,082,489 $889,300 125 175 100% 1823 $18,180,100 $790,439 $795,000 42 48 99% 1533 $18,114,250 $548,917 $527,500 66 65 99% 14
354 $583,713,191 $1,648,907 $1,367,500 543 645 100% 189 $11,755,711 $1,306,190 $1,230,000 10 12 103% 1813 $27,292,650 $2,099,435 $1,780,000 23 24 101% 1132 $49,842,259 $1,557,571 $893,000 47 57 97% 2958 $103,759,764 $1,788,961 $1,603,500 110 124 102% 1317 $17,230,500 $1,013,559 $950,000 21 27 103% 1651 $66,820,577 $1,310,207 $1,180,000 62 75 100% 211 $1,415,000 $1,415,000 $1,415,000 2 4 94% 348 $18,358,593 $2,294,824 $2,328,008 17 26 101% 1015 $20,596,200 $1,373,080 $1,425,000 15 14 103% 1214 $24,237,331 $1,731,238 $1,700,295 15 8 103% 1228 $88,060,275 $3,145,010 $2,800,000 50 99 97% 3432 $40,565,930 $1,267,685 $1,145,000 47 39 104% 1244 $72,473,800 $1,647,132 $1,467,500 75 91 101% 1832 $41,304,601 $1,290,769 $1,240,501 49 45 101% 17
393 $292,724,716 $744,847 $656,000 681 599 102% 1516 $17,371,091 $1,085,693 $972,541 34 29 110% 729 $34,672,350 $1,195,598 $1,080,000 30 32 100% 1351 $42,490,500 $833,147 $763,132 108 77 104% 1154 $34,983,170 $647,836 $610,000 91 70 102% 1625 $21,141,365 $845,655 $823,000 46 40 105% 1434 $23,210,814 $682,671 $602,000 47 43 101% 1624 $17,769,588 $740,400 $729,000 45 51 100% 1534 $23,233,100 $683,326 $605,000 60 63 101% 1451 $29,814,000 $584,588 $570,000 87 64 102% 1842 $27,699,000 $659,500 $628,500 80 79 101% 1633 $20,339,738 $616,356 $561,000 53 51 101% 20
1 1 1 1 2 3 4 5

Toronto Real Estate Board
Market Watch, October 2015
SUMMARY OF EXISTING HOME TRANSACTIONS SEMI-DETACHED HOUSES, OCTOBER 2015ALL TREB AREAS
9
Sales Dollar Volume Average Price Median Price New Listings Active Listings Avg. SP / LP Avg. DOMTREB TotalHalton Region
BurlingtonHalton HillsMiltonOakville
Peel RegionBramptonCaledonMississauga
City of TorontoToronto WestToronto CentralToronto East
York RegionAuroraE. GwillimburyGeorginaKingMarkhamNewmarketRichmond HillVaughanWhitchurch-Stouffville
Durham RegionAjaxBrockClaringtonOshawaPickeringScugogUxbridgeWhitby
Dufferin CountyOrangeville
Simcoe CountyAdjala-TosorontioBradford WestGwillimburyEssaInnisfilNew Tecumseth
923 $562,294,566 $609,203 $557,000 1,281 926 102% 1553 $27,826,800 $525,034 $500,000 58 38 99% 1511 $5,307,300 $482,482 $483,000 14 13 99% 205 $1,894,300 $378,860 $387,000 3 1 100% 1826 $13,037,200 $501,431 $503,000 24 12 100% 911 $7,588,000 $689,818 $589,000 17 12 97% 21
285 $144,159,140 $505,822 $490,500 435 343 100% 17134 $60,422,100 $450,911 $447,500 221 166 99% 176 $2,864,390 $477,398 $457,950 7 3 100% 11
145 $80,872,650 $557,742 $540,000 207 174 100% 17381 $284,663,830 $747,149 $685,000 535 379 103% 15129 $80,775,007 $626,163 $575,000 171 138 102% 15117 $109,688,297 $937,507 $858,818 168 120 103% 15135 $94,200,526 $697,782 $659,800 196 121 104% 13129 $79,357,088 $615,171 $610,000 162 116 100% 1614 $7,591,100 $542,221 $552,500 9 2 103% 181 $470,000 $470,000 $470,000 0 1 99% 32 $763,000 $381,500 $381,500 2 1 97% 340 - - - 0 0 - -23 $15,722,588 $683,591 $675,000 42 38 101% 1518 $9,269,700 $514,983 $531,000 25 16 102% 1519 $12,960,500 $682,132 $648,000 14 15 97% 2542 $27,122,900 $645,783 $642,500 54 35 101% 1210 $5,457,300 $545,730 $549,000 16 8 101% 1161 $21,323,809 $349,571 $305,000 75 38 101% 1516 $7,051,700 $440,731 $454,500 21 12 100% 160 - - - 0 0 - -6 $1,672,500 $278,750 $279,250 7 2 101% 1929 $8,330,409 $287,255 $275,000 32 17 102% 135 $2,403,500 $480,700 $474,000 10 5 99% 151 $286,000 $286,000 $286,000 0 0 104% 01 $300,000 $300,000 $300,000 0 0 112% 923 $1,279,700 $426,567 $427,500 5 2 101% 94 $1,120,000 $280,000 $292,500 5 3 99% 74 $1,120,000 $280,000 $292,500 5 3 99% 710 $3,843,899 $384,390 $360,000 11 9 100% 270 - - - 0 0 - -5 $2,140,899 $428,180 $465,999 6 3 101% 121 $320,000 $320,000 $320,000 1 1 98% 220 - - - 0 0 - -4 $1,383,000 $345,750 $330,250 4 5 98% 47
1 1 1 1 2 3 4 5

Toronto Real Estate Board
Market Watch, October 2015
SUMMARY OF EXISTING HOME TRANSACTIONS SEMI-DETACHED HOUSES, OCTOBER 2015CITY OF TORONTO MUNICIPAL BREAKDOWN
10
Sales Dollar Volume Average Price Median Price New Listings Active Listings Avg. SP / LP Avg. DOMTREB TotalCity of Toronto TotalToronto West
Toronto W01Toronto W02Toronto W03Toronto W04Toronto W05Toronto W06Toronto W07Toronto W08Toronto W09Toronto W10
Toronto CentralToronto C01Toronto C02Toronto C03Toronto C04Toronto C06Toronto C07Toronto C08Toronto C09Toronto C10Toronto C11Toronto C12Toronto C13Toronto C14Toronto C15
Toronto EastToronto E01Toronto E02Toronto E03Toronto E04Toronto E05Toronto E06Toronto E07Toronto E08Toronto E09Toronto E10Toronto E11
923 $562,294,566 $609,203 $557,000 1,281 926 102% 15381 $284,663,830 $747,149 $685,000 535 379 103% 15129 $80,775,007 $626,163 $575,000 171 138 102% 1510 $9,485,310 $948,531 $914,200 13 8 106% 929 $21,483,250 $740,802 $720,000 37 27 105% 1230 $17,588,100 $586,270 $587,500 33 27 102% 185 $2,889,000 $577,800 $590,000 9 7 105% 1540 $20,742,947 $518,574 $509,450 52 44 99% 183 $2,028,000 $676,000 $661,000 7 8 103% 80 - - - 0 0 - -4 $2,503,000 $625,750 $627,500 3 3 101% 81 $530,000 $530,000 $530,000 7 7 97% 257 $3,525,400 $503,629 $500,000 10 7 99% 18
117 $109,688,297 $937,507 $858,818 168 120 103% 1522 $22,071,800 $1,003,264 $970,000 47 32 105% 1224 $29,134,000 $1,213,917 $928,000 17 13 100% 2612 $9,458,956 $788,246 $819,409 14 10 106% 124 $3,599,000 $899,750 $887,000 7 4 109% 50 - - - 1 2 - -2 $1,415,000 $707,500 $707,500 3 5 101% 109 $8,918,000 $990,889 $893,500 14 12 98% 231 $1,455,000 $1,455,000 $1,455,000 7 7 97% 166 $5,358,565 $893,094 $895,000 9 4 103% 75 $5,755,000 $1,151,000 $1,140,000 3 1 107% 71 $888,000 $888,000 $888,000 3 1 111% 510 $6,677,888 $667,789 $634,500 18 12 105% 91 $1,260,000 $1,260,000 $1,260,000 0 0 97% 1720 $13,697,088 $684,854 $679,000 25 17 100% 17
135 $94,200,526 $697,782 $659,800 196 121 104% 1330 $24,041,812 $801,394 $796,556 56 33 107% 1132 $24,956,009 $779,875 $731,500 46 24 105% 1035 $24,905,717 $711,592 $701,031 45 19 106% 109 $4,154,088 $461,565 $475,000 12 6 97% 248 $4,944,000 $618,000 $622,600 9 8 102% 161 $700,000 $700,000 $700,000 4 3 101% 25 $2,955,000 $591,000 $628,000 6 12 99% 310 - - - 0 0 - -3 $1,429,000 $476,333 $458,000 2 0 104% 52 $1,149,500 $574,750 $574,750 6 8 99% 2010 $4,965,400 $496,540 $511,200 10 8 97% 22
1 1 1 1 2 3 4 5

Toronto Real Estate Board
Market Watch, October 2015
SUMMARY OF EXISTING HOME TRANSACTIONS CONDOMINIUM TOWNHOUSES, OCTOBER 2015ALL TREB AREAS
11
Sales Dollar Volume Average Price Median Price New Listings Active Listings Avg. SP / LP Avg. DOMTREB TotalHalton Region
BurlingtonHalton HillsMiltonOakville
Peel RegionBramptonCaledonMississauga
City of TorontoToronto WestToronto CentralToronto East
York RegionAuroraE. GwillimburyGeorginaKingMarkhamNewmarketRichmond HillVaughanWhitchurch-Stouffville
Durham RegionAjaxBrockClaringtonOshawaPickeringScugogUxbridgeWhitby
Dufferin CountyOrangeville
Simcoe CountyAdjala-TosorontioBradford WestGwillimburyEssaInnisfilNew Tecumseth
682 $287,698,650 $421,846 $399,000 885 979 99% 2157 $23,568,000 $413,474 $375,000 74 79 98% 2122 $9,289,900 $422,268 $419,450 29 29 99% 187 $1,928,400 $275,486 $257,000 7 6 98% 236 $1,988,800 $331,467 $327,450 7 6 99% 922 $10,360,900 $470,950 $417,300 31 38 98% 26
243 $94,432,869 $388,613 $393,500 297 264 99% 2052 $16,818,990 $323,442 $304,000 66 60 99% 222 $733,000 $366,500 $366,500 0 1 97% 49
189 $76,880,879 $406,777 $408,000 231 203 100% 19235 $112,641,913 $479,327 $439,400 341 455 100% 2270 $27,717,200 $395,960 $369,250 94 132 99% 2294 $56,928,374 $605,621 $509,250 134 189 100% 2171 $27,996,339 $394,315 $404,500 113 134 101% 2473 $36,333,068 $497,713 $490,000 95 114 99% 2113 $6,579,600 $506,123 $430,100 8 7 99% 160 - - - 0 1 - -2 $555,700 $277,850 $277,850 1 0 98% 120 - - - 0 0 - -35 $18,495,368 $528,439 $512,000 36 45 99% 238 $3,532,900 $441,613 $415,000 10 11 100% 187 $3,264,000 $466,286 $490,000 21 29 99% 217 $3,580,500 $511,500 $515,000 19 21 97% 271 $325,000 $325,000 $325,000 0 0 102% 1569 $19,494,500 $282,529 $284,000 73 64 99% 1814 $4,811,400 $343,671 $353,750 21 15 99% 171 $225,000 $225,000 $225,000 0 3 96% 587 $1,751,500 $250,214 $240,000 6 3 100% 1017 $3,430,300 $201,782 $210,000 21 18 101% 1816 $5,164,900 $322,806 $313,000 15 12 99% 200 - - - 0 1 - -1 $322,000 $322,000 $322,000 1 5 98% 813 $3,789,400 $291,492 $284,000 9 7 99% 184 $939,500 $234,875 $234,500 4 3 99% 124 $939,500 $234,875 $234,500 4 3 99% 121 $288,800 $288,800 $288,800 1 0 95% 120 - - - 0 0 - -1 $288,800 $288,800 $288,800 1 0 95% 120 - - - 0 0 - -0 - - - 0 0 - -0 - - - 0 0 - -
1 1 1 1 2 3 4 5

Toronto Real Estate Board
Market Watch, October 2015
SUMMARY OF EXISTING HOME TRANSACTIONS CONDOMINIUM TOWNHOUSES, OCTOBER 2015CITY OF TORONTO MUNICIPAL BREAKDOWN
12
Sales Dollar Volume Average Price Median Price New Listings Active Listings Avg. SP / LP Avg. DOMTREB TotalCity of Toronto TotalToronto West
Toronto W01Toronto W02Toronto W03Toronto W04Toronto W05Toronto W06Toronto W07Toronto W08Toronto W09Toronto W10
Toronto CentralToronto C01Toronto C02Toronto C03Toronto C04Toronto C06Toronto C07Toronto C08Toronto C09Toronto C10Toronto C11Toronto C12Toronto C13Toronto C14Toronto C15
Toronto EastToronto E01Toronto E02Toronto E03Toronto E04Toronto E05Toronto E06Toronto E07Toronto E08Toronto E09Toronto E10Toronto E11
682 $287,698,650 $421,846 $399,000 885 979 99% 21235 $112,641,913 $479,327 $439,400 341 455 100% 2270 $27,717,200 $395,960 $369,250 94 132 99% 228 $3,841,000 $480,125 $462,750 13 11 100% 117 $3,277,800 $468,257 $468,000 14 17 103% 92 $569,000 $284,500 $284,500 3 3 97% 238 $2,872,800 $359,100 $361,500 7 7 98% 1315 $4,289,500 $285,967 $305,000 20 36 98% 278 $4,542,100 $567,763 $537,050 12 26 98% 300 - - - 0 0 - -7 $3,245,000 $463,571 $510,000 5 7 100% 285 $2,573,000 $514,600 $530,000 3 5 100% 2310 $2,507,000 $250,700 $253,000 17 20 98% 3194 $56,928,374 $605,621 $509,250 134 189 100% 2130 $18,369,248 $612,308 $550,500 38 48 100% 192 $1,751,000 $875,500 $875,500 7 10 101% 161 $1,420,000 $1,420,000 $1,420,000 3 5 109% 30 - - - 2 2 - -2 $996,000 $498,000 $498,000 0 1 98% 273 $1,947,350 $649,117 $505,000 9 17 98% 304 $1,815,900 $453,975 $396,200 3 4 98% 122 $2,365,000 $1,182,500 $1,182,500 1 1 97% 162 $1,805,000 $902,500 $902,500 4 7 106% 461 $235,000 $235,000 $235,000 1 1 97% 214 $4,137,888 $1,034,472 $1,031,694 19 32 99% 374 $1,565,900 $391,475 $415,000 2 1 103% 1116 $9,062,000 $566,375 $509,500 21 25 99% 1923 $11,458,088 $498,178 $482,500 24 35 99% 2571 $27,996,339 $394,315 $404,500 113 134 101% 246 $3,445,139 $574,190 $524,500 10 7 99% 105 $2,800,900 $560,180 $459,900 3 10 97% 160 - - - 1 1 - -4 $1,634,000 $408,500 $409,000 9 9 100% 2917 $7,532,200 $443,071 $455,000 28 27 104% 201 $549,900 $549,900 $549,900 1 2 100% 1116 $2,690,300 $448,383 $445,150 13 21 100% 326 $1,895,900 $315,983 $341,500 5 6 101% 157 $1,819,300 $259,900 $305,000 11 12 98% 4411 $2,830,700 $257,336 $282,000 13 15 100% 258 $2,798,000 $349,750 $332,750 19 24 101% 16
1 1 1 1 2 3 4 5

Toronto Real Estate Board
Market Watch, October 2015
SUMMARY OF EXISTING HOME TRANSACTIONS CONDOMINIUM APARTMENT, OCTOBER 2015ALL TREB AREAS
13
Sales Dollar Volume Average Price Median Price New Listings Active Listings Avg. SP / LP Avg. DOMTREB TotalHalton Region
BurlingtonHalton HillsMiltonOakville
Peel RegionBramptonCaledonMississauga
City of TorontoToronto WestToronto CentralToronto East
York RegionAuroraE. GwillimburyGeorginaKingMarkhamNewmarketRichmond HillVaughanWhitchurch-Stouffville
Durham RegionAjaxBrockClaringtonOshawaPickeringScugogUxbridgeWhitby
Dufferin CountyOrangeville
Simcoe CountyAdjala-TosorontioBradford WestGwillimburyEssaInnisfilNew Tecumseth
2,219 $846,755,861 $381,593 $332,000 3,774 6,117 98% 3066 $22,318,810 $338,164 $305,000 109 185 98% 2622 $6,305,300 $286,605 $279,500 27 38 98% 253 $1,075,500 $358,500 $368,000 4 6 98% 5312 $3,993,450 $332,788 $343,750 17 16 99% 3029 $10,944,560 $377,399 $290,000 61 125 98% 24
302 $85,645,365 $283,594 $266,194 472 770 98% 3153 $12,686,650 $239,371 $235,000 71 95 98% 280 - - - 1 1 - -
249 $72,958,715 $293,007 $274,900 400 674 97% 311,587 $645,579,310 $406,792 $354,000 2,743 4,433 98% 30317 $108,360,065 $341,830 $310,000 524 865 98% 31
1,021 $465,259,416 $455,690 $391,000 1,846 3,065 98% 30249 $71,959,829 $288,995 $255,000 373 503 98% 25218 $80,904,976 $371,124 $340,000 385 658 98% 397 $3,148,000 $449,714 $342,500 3 9 97% 410 - - - 0 0 - -2 $335,000 $167,500 $167,500 2 4 99% 133 $1,525,000 $508,333 $535,000 9 21 96% 8883 $30,987,976 $373,349 $327,500 143 265 98% 396 $1,965,800 $327,633 $339,500 8 5 99% 1752 $17,312,000 $332,923 $337,250 101 165 97% 3865 $25,631,200 $394,326 $365,000 117 186 97% 400 - - - 2 3 - -43 $11,670,400 $271,405 $257,500 62 60 99% 2110 $2,598,400 $259,840 $254,250 11 14 97% 220 - - - 0 0 - -5 $1,063,000 $212,600 $215,000 5 8 102% 185 $906,500 $181,300 $188,000 8 5 100% 1713 $4,220,500 $324,654 $288,000 25 25 98% 220 - - - 1 1 - -0 - - - 0 0 - -10 $2,882,000 $288,200 $271,500 12 7 99% 242 $379,000 $189,500 $189,500 2 1 99% 222 $379,000 $189,500 $189,500 2 1 99% 221 $258,000 $258,000 $258,000 1 10 97% 490 - - - 0 0 - -0 - - - 0 1 - -0 - - - 0 0 - -0 - - - 0 1 - -1 $258,000 $258,000 $258,000 1 8 97% 49
1 1 1 1 2 3 4 5

Toronto Real Estate Board
Market Watch, October 2015
SUMMARY OF EXISTING HOME TRANSACTIONS CONDOMINIUM APARTMENT, OCTOBER 2015CITY OF TORONTO MUNICIPAL BREAKDOWN
14
Sales Dollar Volume Average Price Median Price New Listings Active Listings Avg. SP / LP Avg. DOMTREB TotalCity of Toronto TotalToronto West
Toronto W01Toronto W02Toronto W03Toronto W04Toronto W05Toronto W06Toronto W07Toronto W08Toronto W09Toronto W10
Toronto CentralToronto C01Toronto C02Toronto C03Toronto C04Toronto C06Toronto C07Toronto C08Toronto C09Toronto C10Toronto C11Toronto C12Toronto C13Toronto C14Toronto C15
Toronto EastToronto E01Toronto E02Toronto E03Toronto E04Toronto E05Toronto E06Toronto E07Toronto E08Toronto E09Toronto E10Toronto E11
2,219 $846,755,861 $381,593 $332,000 3,774 6,117 98% 301,587 $645,579,310 $406,792 $354,000 2,743 4,433 98% 30317 $108,360,065 $341,830 $310,000 524 865 98% 3138 $15,985,200 $420,663 $390,500 48 95 100% 2320 $7,011,300 $350,565 $297,500 18 22 102% 249 $3,284,500 $364,944 $375,000 12 13 100% 2412 $3,035,500 $252,958 $237,500 31 40 98% 4037 $9,834,508 $265,798 $265,000 39 85 98% 2967 $26,108,044 $389,672 $342,500 171 316 97% 345 $1,736,000 $347,200 $315,000 5 10 96% 4585 $31,546,563 $371,136 $300,100 145 208 98% 3214 $3,538,400 $252,743 $259,950 19 29 97% 4730 $6,280,050 $209,335 $211,500 36 47 97% 29
1,021 $465,259,416 $455,690 $391,000 1,846 3,065 98% 30398 $190,195,781 $477,879 $403,750 741 1,222 98% 3134 $28,381,300 $834,744 $568,000 103 212 97% 262 $1,197,000 $598,500 $598,500 29 45 97% 7010 $6,942,000 $694,200 $512,500 22 30 98% 2315 $5,333,896 $355,593 $327,000 35 73 99% 4164 $26,576,228 $415,254 $393,500 101 174 98% 31
167 $72,103,058 $431,755 $399,000 248 371 99% 2715 $10,085,800 $672,387 $613,000 18 33 99% 1835 $17,136,977 $489,628 $460,000 63 74 100% 2322 $5,691,500 $258,705 $229,500 26 39 97% 263 $2,320,900 $773,633 $821,000 18 34 101% 243 $14,960,800 $347,926 $325,000 57 87 98% 34
123 $51,352,188 $417,497 $370,000 210 368 98% 3190 $32,981,988 $366,467 $330,000 175 303 98% 34
249 $71,959,829 $288,995 $255,000 373 503 98% 2519 $8,914,324 $469,175 $489,000 42 48 99% 155 $2,670,900 $534,180 $449,900 19 36 98% 1711 $3,292,018 $299,274 $224,000 26 19 99% 2038 $8,443,950 $222,209 $197,000 51 61 98% 2632 $9,683,600 $302,613 $301,000 46 64 98% 208 $4,981,000 $622,625 $522,600 8 10 101% 2338 $9,968,688 $262,334 $259,500 66 112 98% 2719 $4,743,900 $249,679 $240,000 19 21 99% 2550 $13,981,200 $279,624 $273,450 62 92 98% 323 $465,900 $155,300 $169,900 7 15 98% 5926 $4,814,349 $185,167 $189,250 27 25 98% 24
1 1 1 1 2 3 4 5

Toronto Real Estate Board
Market Watch, October 2015
SUMMARY OF EXISTING HOME TRANSACTIONS LINK, OCTOBER 2015ALL TREB AREAS
15
Sales Dollar Volume Average Price Median Price New Listings Active Listings Avg. SP / LP Avg. DOMTREB TotalHalton Region
BurlingtonHalton HillsMiltonOakville
Peel RegionBramptonCaledonMississauga
City of TorontoToronto WestToronto CentralToronto East
York RegionAuroraE. GwillimburyGeorginaKingMarkhamNewmarketRichmond HillVaughanWhitchurch-Stouffville
Durham RegionAjaxBrockClaringtonOshawaPickeringScugogUxbridgeWhitby
Dufferin CountyOrangeville
Simcoe CountyAdjala-TosorontioBradford WestGwillimburyEssaInnisfilNew Tecumseth
160 $89,847,313 $561,546 $573,000 180 108 101% 157 $3,917,300 $559,614 $566,800 6 3 99% 113 $1,543,000 $514,333 $485,000 3 1 99% 110 - - - 0 0 - -1 $562,500 $562,500 $562,500 0 1 99% 83 $1,811,800 $603,933 $615,000 3 1 99% 1312 $6,570,000 $547,500 $565,500 11 14 99% 196 $3,050,000 $508,333 $530,000 6 7 98% 270 - - - 1 1 - -6 $3,520,000 $586,667 $590,000 4 6 100% 1219 $11,433,500 $601,763 $600,000 20 13 101% 161 $530,000 $530,000 $530,000 1 3 95% 283 $2,117,000 $705,667 $722,000 4 2 103% 915 $8,786,500 $585,767 $600,000 15 8 101% 1667 $47,005,263 $701,571 $705,000 100 64 101% 151 $632,500 $632,500 $632,500 1 1 105% 10 - - - 0 0 - -0 - - - 0 1 - -3 $1,637,500 $545,833 $545,000 3 2 98% 1353 $38,533,363 $727,045 $720,888 82 52 102% 152 $919,000 $459,500 $459,500 0 0 96% 343 $2,057,000 $685,667 $680,000 7 5 98% 154 $2,725,900 $681,475 $636,950 7 3 100% 101 $500,000 $500,000 $500,000 0 0 100% 2340 $15,240,200 $381,005 $368,750 34 10 101% 123 $1,190,500 $396,833 $393,500 2 1 100% 160 - - - 0 0 - -18 $6,361,100 $353,394 $345,000 14 4 101% 104 $1,324,100 $331,025 $299,000 4 1 100% 104 $1,789,000 $447,250 $424,500 3 0 102% 81 $335,000 $335,000 $335,000 1 0 102% 31 $427,500 $427,500 $427,500 1 1 102% 49 $3,813,000 $423,667 $400,500 9 3 102% 180 - - - 0 0 - -0 - - - 0 0 - -15 $5,681,050 $378,737 $352,000 9 4 98% 240 - - - 0 0 - -7 $2,976,500 $425,214 $442,000 6 1 98% 102 $662,150 $331,075 $331,075 1 1 97% 732 $732,900 $366,450 $366,450 0 1 98% 304 $1,309,500 $327,375 $332,250 2 1 99% 22
1 1 1 1 2 3 4 5

Toronto Real Estate Board
Market Watch, October 2015
SUMMARY OF EXISTING HOME TRANSACTIONS LINK, OCTOBER 2015CITY OF TORONTO MUNICIPAL BREAKDOWN
16
Sales Dollar Volume Average Price Median Price New Listings Active Listings Avg. SP / LP Avg. DOMTREB TotalCity of Toronto TotalToronto West
Toronto W01Toronto W02Toronto W03Toronto W04Toronto W05Toronto W06Toronto W07Toronto W08Toronto W09Toronto W10
Toronto CentralToronto C01Toronto C02Toronto C03Toronto C04Toronto C06Toronto C07Toronto C08Toronto C09Toronto C10Toronto C11Toronto C12Toronto C13Toronto C14Toronto C15
Toronto EastToronto E01Toronto E02Toronto E03Toronto E04Toronto E05Toronto E06Toronto E07Toronto E08Toronto E09Toronto E10Toronto E11
160 $89,847,313 $561,546 $573,000 180 108 101% 1519 $11,433,500 $601,763 $600,000 20 13 101% 161 $530,000 $530,000 $530,000 1 3 95% 280 - - - 0 0 - -0 - - - 0 0 - -0 - - - 0 0 - -0 - - - 0 0 - -0 - - - 0 1 - -0 - - - 0 0 - -0 - - - 0 0 - -0 - - - 0 0 - -1 $530,000 $530,000 $530,000 0 0 95% 280 - - - 1 2 - -3 $2,117,000 $705,667 $722,000 4 2 103% 90 - - - 0 0 - -0 - - - 0 0 - -0 - - - 0 0 - -0 - - - 0 0 - -0 - - - 0 0 - -1 $670,000 $670,000 $670,000 1 1 103% 70 - - - 0 0 - -0 - - - 0 0 - -0 - - - 0 0 - -0 - - - 0 0 - -0 - - - 0 0 - -0 - - - 0 0 - -0 - - - 1 1 - -2 $1,447,000 $723,500 $723,500 2 0 103% 1115 $8,786,500 $585,767 $600,000 15 8 101% 160 - - - 0 0 - -0 - - - 0 0 - -0 - - - 0 0 - -0 - - - 0 0 - -4 $2,694,600 $673,650 $674,500 3 0 101% 120 - - - 0 0 - -5 $3,066,000 $613,200 $600,000 7 4 101% 140 - - - 1 1 - -0 - - - 0 0 - -0 - - - 0 0 - -6 $3,025,900 $504,317 $494,000 4 3 102% 21
1 1 1 1 2 3 4 5

Toronto Real Estate Board
Market Watch, October 2015
SUMMARY OF EXISTING HOME TRANSACTIONS ATTACHED/ROW/TOWNHOUSE, OCTOBER 2015ALL TREB AREAS
17
Sales Dollar Volume Average Price Median Price New Listings Active Listings Avg. SP / LP Avg. DOMTREB TotalHalton Region
BurlingtonHalton HillsMiltonOakville
Peel RegionBramptonCaledonMississauga
City of TorontoToronto WestToronto CentralToronto East
York RegionAuroraE. GwillimburyGeorginaKingMarkhamNewmarketRichmond HillVaughanWhitchurch-Stouffville
Durham RegionAjaxBrockClaringtonOshawaPickeringScugogUxbridgeWhitby
Dufferin CountyOrangeville
Simcoe CountyAdjala-TosorontioBradford WestGwillimburyEssaInnisfilNew Tecumseth
695 $383,621,567 $551,973 $500,000 889 645 100% 15118 $59,833,499 $507,064 $469,950 162 114 100% 1510 $4,554,588 $455,459 $441,750 9 7 100% 207 $3,253,000 $464,714 $450,000 9 7 98% 1857 $25,719,198 $451,214 $455,000 75 33 100% 1244 $26,306,713 $597,880 $562,500 69 67 100% 17
117 $53,032,260 $453,267 $437,000 148 117 99% 1784 $35,204,280 $419,099 $426,000 100 70 100% 185 $2,493,000 $498,600 $491,000 12 15 99% 1028 $15,334,980 $547,678 $516,800 36 32 99% 17
112 $88,395,393 $789,245 $708,750 154 131 100% 1926 $15,052,500 $578,942 $592,500 37 30 100% 1655 $54,406,639 $989,212 $924,800 64 59 99% 2331 $18,936,254 $610,847 $580,000 53 42 101% 15
212 $131,468,459 $620,134 $610,000 281 202 101% 147 $3,899,000 $557,000 $566,000 12 11 101% 135 $1,984,500 $396,900 $410,000 11 6 99% 1210 $3,597,400 $359,740 $353,750 14 11 99% 153 $2,169,500 $723,167 $724,500 4 6 97% 949 $33,030,500 $674,092 $615,000 75 66 101% 1419 $10,030,400 $527,916 $543,000 24 10 103% 1161 $40,769,371 $668,350 $655,000 69 37 101% 1349 $31,335,900 $639,508 $618,750 63 50 101% 169 $4,651,888 $516,876 $519,000 9 5 100% 15
112 $42,903,756 $383,069 $387,000 123 64 101% 1328 $11,368,700 $406,025 $400,500 33 21 101% 130 - - - 0 0 - -17 $5,382,400 $316,612 $311,800 22 8 103% 814 $4,391,100 $313,650 $313,350 12 4 102% 1020 $8,688,601 $434,430 $406,500 19 9 100% 190 - - - 0 0 - -2 $954,500 $477,250 $477,250 2 4 98% 4131 $12,118,455 $390,918 $390,000 35 18 102% 125 $1,677,800 $335,560 $339,900 4 7 99% 145 $1,677,800 $335,560 $339,900 4 7 99% 1419 $6,310,400 $332,126 $316,000 17 10 98% 140 - - - 0 0 - -4 $1,646,000 $411,500 $420,000 5 2 98% 132 $559,000 $279,500 $279,500 3 2 99% 82 $615,000 $307,500 $307,500 0 1 100% 3211 $3,490,400 $317,309 $316,000 9 5 98% 12
1 1 1 1 2 3 4 5

Toronto Real Estate Board
Market Watch, October 2015
SUMMARY OF EXISTING HOME TRANSACTIONS ATTACHED/ROW/TOWNHOUSE, OCTOBER 2015CITY OF TORONTO MUNICIPAL BREAKDOWN
18
Sales Dollar Volume Average Price Median Price New Listings Active Listings Avg. SP / LP Avg. DOMTREB TotalCity of Toronto TotalToronto West
Toronto W01Toronto W02Toronto W03Toronto W04Toronto W05Toronto W06Toronto W07Toronto W08Toronto W09Toronto W10
Toronto CentralToronto C01Toronto C02Toronto C03Toronto C04Toronto C06Toronto C07Toronto C08Toronto C09Toronto C10Toronto C11Toronto C12Toronto C13Toronto C14Toronto C15
Toronto EastToronto E01Toronto E02Toronto E03Toronto E04Toronto E05Toronto E06Toronto E07Toronto E08Toronto E09Toronto E10Toronto E11
695 $383,621,567 $551,973 $500,000 889 645 100% 15112 $88,395,393 $789,245 $708,750 154 131 100% 1926 $15,052,500 $578,942 $592,500 37 30 100% 160 - - - 1 4 - -7 $4,589,000 $655,571 $699,000 6 2 102% 152 $1,017,000 $508,500 $508,500 2 1 102% 73 $1,401,100 $467,033 $464,100 1 1 98% 194 $1,968,500 $492,125 $490,000 6 6 98% 304 $2,740,000 $685,000 $680,000 11 9 99% 72 $1,249,000 $624,500 $624,500 1 2 101% 121 $773,000 $773,000 $773,000 4 3 99% 251 $478,000 $478,000 $478,000 1 0 99% 142 $836,900 $418,450 $418,450 4 2 98% 2055 $54,406,639 $989,212 $924,800 64 59 99% 2323 $21,104,100 $917,570 $850,000 26 20 101% 298 $10,801,500 $1,350,188 $1,392,500 8 9 100% 140 - - - 0 2 - -0 - - - 1 3 - -0 - - - 0 1 - -0 - - - 1 1 - -11 $9,659,049 $878,095 $810,000 10 10 96% 162 $2,695,000 $1,347,500 $1,347,500 3 2 95% 142 $2,148,000 $1,074,000 $1,074,000 2 2 100% 111 $1,140,000 $1,140,000 $1,140,000 2 1 99% 60 - - - 0 0 - -5 $3,483,990 $696,798 $686,000 4 3 100% 443 $3,375,000 $1,125,000 $1,035,000 6 5 99% 100 - - - 1 0 - -31 $18,936,254 $610,847 $580,000 53 42 101% 158 $6,363,518 $795,440 $761,250 12 7 102% 111 $722,000 $722,000 $722,000 4 3 100% 44 $2,329,000 $582,250 $577,000 3 2 102% 147 $4,024,736 $574,962 $575,000 9 9 100% 152 $1,095,000 $547,500 $547,500 4 2 104% 70 - - - 1 1 - -0 - - - 2 1 - -2 $1,065,000 $532,500 $532,500 6 5 100% 230 - - - 0 0 - -2 $989,000 $494,500 $494,500 6 5 102% 85 $2,348,000 $469,600 $478,000 6 7 98% 30
1 1 1 1 2 3 4 5

Toronto Real Estate Board
Market Watch, October 2015
SUMMARY OF EXISTING HOME TRANSACTIONS CO-OP APARTMENT, OCTOBER 2015ALL TREB AREAS
19
Sales Dollar Volume Average Price Median Price New Listings Active Listings Avg. SP / LP Average DOMTREB TotalHalton Region
BurlingtonHalton HillsMiltonOakville
Peel RegionBramptonCaledonMississauga
City of TorontoToronto WestToronto CentralToronto East
York RegionAuroraE. GwillimburyGeorginaKingMarkhamNewmarketRichmond HillVaughanWhitchurch-Stouffville
Durham RegionAjaxBrockClaringtonOshawaPickeringScugogUxbridgeWhitby
Dufferin CountyOrangeville
Simcoe CountyAdjala-TosorontioBradford WestGwillimburyEssaInnisfilNew Tecumseth
9 $3,614,000 $401,556 $435,000 19 29 99% 340 - - - 0 0 - -0 - - - 0 0 - -0 - - - 0 0 - -0 - - - 0 0 - -0 - - - 0 0 - -0 - - - 0 0 - -0 - - - 0 0 - -0 - - - 0 0 - -0 - - - 0 0 - -9 $3,614,000 $401,556 $435,000 19 29 99% 343 $854,000 $284,667 $199,000 6 7 101% 316 $2,760,000 $460,000 $462,500 13 19 98% 360 - - - 0 3 - -0 - - - 0 0 - -0 - - - 0 0 - -0 - - - 0 0 - -0 - - - 0 0 - -0 - - - 0 0 - -0 - - - 0 0 - -0 - - - 0 0 - -0 - - - 0 0 - -0 - - - 0 0 - -0 - - - 0 0 - -0 - - - 0 0 - -0 - - - 0 0 - -0 - - - 0 0 - -0 - - - 0 0 - -0 - - - 0 0 - -0 - - - 0 0 - -0 - - - 0 0 - -0 - - - 0 0 - -0 - - - 0 0 - -0 - - - 0 0 - -0 - - - 0 0 - -0 - - - 0 0 - -0 - - - 0 0 - -0 - - - 0 0 - -0 - - - 0 0 - -0 - - - 0 0 - -0 - - - 0 0 - -
1 1 1 1 2 3 4 5

Toronto Real Estate Board
Market Watch, October 2015
SUMMARY OF EXISTING HOME TRANSACTIONS CO-OP APARTMENT, OCTOBER 2015CITY OF TORONTO MUNICIPAL BREAKDOWN
20
Sales Dollar Volume Average Price Median Price New Listings Active Listings Avg. SP / LP Avg. DOMTREB TotalCity of Toronto TotalToronto West
Toronto W01Toronto W02Toronto W03Toronto W04Toronto W05Toronto W06Toronto W07Toronto W08Toronto W09Toronto W10
Toronto CentralToronto C01Toronto C02Toronto C03Toronto C04Toronto C06Toronto C07Toronto C08Toronto C09Toronto C10Toronto C11Toronto C12Toronto C13Toronto C14Toronto C15
Toronto EastToronto E01Toronto E02Toronto E03Toronto E04Toronto E05Toronto E06Toronto E07Toronto E08Toronto E09Toronto E10Toronto E11
9 $3,614,000 $401,556 $435,000 19 29 99% 349 $3,614,000 $401,556 $435,000 19 29 99% 343 $854,000 $284,667 $199,000 6 7 101% 310 - - - 0 0 - -0 - - - 0 0 - -0 - - - 0 0 - -0 - - - 0 0 - -0 - - - 0 0 - -0 - - - 0 0 - -0 - - - 3 4 - -1 $199,000 $199,000 $199,000 1 2 100% 382 $655,000 $327,500 $327,500 2 1 102% 280 - - - 0 0 - -6 $2,760,000 $460,000 $462,500 13 19 98% 360 - - - 4 5 - -0 - - - 1 4 - -1 $360,000 $360,000 $360,000 2 3 98% 380 - - - 0 0 - -0 - - - 0 0 - -0 - - - 0 0 - -0 - - - 0 0 - -4 $1,965,000 $491,250 $502,500 4 5 99% 320 - - - 0 0 - -0 - - - 0 0 - -0 - - - 0 0 - -1 $435,000 $435,000 $435,000 0 0 95% 490 - - - 0 0 - -0 - - - 2 2 - -0 - - - 0 3 - -0 - - - 0 0 - -0 - - - 0 1 - -0 - - - 0 0 - -0 - - - 0 2 - -0 - - - 0 0 - -0 - - - 0 0 - -0 - - - 0 0 - -0 - - - 0 0 - -0 - - - 0 0 - -0 - - - 0 0 - -0 - - - 0 0 - -
1 1 1 1 2 3 4 5

Toronto Real Estate Board
Market Watch, October 2015
SUMMARY OF EXISTING HOME TRANSACTIONS DETACHED CONDOMINIUM, OCTOBER 2015ALL TREB AREAS
21
Sales Dollar Volume Average Price Median Price New Listings Active Listings Avg. SP / LP Avg. DOMTREB TotalHalton Region
BurlingtonHalton HillsMiltonOakville
Peel RegionBramptonCaledonMississauga
City of TorontoToronto WestToronto CentralToronto East
York RegionAuroraE. GwillimburyGeorginaKingMarkhamNewmarketRichmond HillVaughanWhitchurch-Stouffville
Durham RegionAjaxBrockClaringtonOshawaPickeringScugogUxbridgeWhitby
Dufferin CountyOrangeville
Simcoe CountyAdjala-TosorontioBradford WestGwillimburyEssaInnisfilNew Tecumseth
5 $2,188,900 $437,780 $410,000 6 7 99% 410 - - - 0 0 - -0 - - - 0 0 - -0 - - - 0 0 - -0 - - - 0 0 - -0 - - - 0 0 - -1 $560,000 $560,000 $560,000 4 2 97% 271 $560,000 $560,000 $560,000 1 0 97% 270 - - - 0 0 - -0 - - - 3 2 - -0 - - - 0 0 - -0 - - - 0 0 - -0 - - - 0 0 - -0 - - - 0 0 - -0 - - - 1 0 - -0 - - - 0 0 - -0 - - - 0 0 - -0 - - - 0 0 - -0 - - - 0 0 - -0 - - - 1 0 - -0 - - - 0 0 - -0 - - - 0 0 - -0 - - - 0 0 - -0 - - - 0 0 - -0 - - - 0 0 - -0 - - - 0 0 - -0 - - - 0 0 - -0 - - - 0 0 - -0 - - - 0 0 - -0 - - - 0 0 - -0 - - - 0 0 - -0 - - - 0 0 - -0 - - - 0 0 - -0 - - - 0 0 - -0 - - - 0 0 - -4 $1,628,900 $407,225 $375,000 1 5 99% 440 - - - 0 0 - -0 - - - 0 0 - -0 - - - 0 0 - -0 - - - 0 0 - -4 $1,628,900 $407,225 $375,000 1 5 99% 44
1 1 1 1 2 3 4 5

Toronto Real Estate Board
Market Watch, October 2015
SUMMARY OF EXISTING HOME TRANSACTIONS DETACHED CONDOMINIUM, OCTOBER 2015CITY OF TORONTO MUNICIPAL BREAKDOWN
22
Sales Dollar Volume Average Price Median Price New Listings Active Listings Avg. SP / LP Avg. DOMTREB TotalCity of Toronto TotalToronto West
Toronto W01Toronto W02Toronto W03Toronto W04Toronto W05Toronto W06Toronto W07Toronto W08Toronto W09Toronto W10
Toronto CentralToronto C01Toronto C02Toronto C03Toronto C04Toronto C06Toronto C07Toronto C08Toronto C09Toronto C10Toronto C11Toronto C12Toronto C13Toronto C14Toronto C15
Toronto EastToronto E01Toronto E02Toronto E03Toronto E04Toronto E05Toronto E06Toronto E07Toronto E08Toronto E09Toronto E10Toronto E11
5 $2,188,900 $437,780 $410,000 6 7 99% 410 - - - 0 0 - -0 - - - 0 0 - -0 - - - 0 0 - -0 - - - 0 0 - -0 - - - 0 0 - -0 - - - 0 0 - -0 - - - 0 0 - -0 - - - 0 0 - -0 - - - 0 0 - -0 - - - 0 0 - -0 - - - 0 0 - -0 - - - 0 0 - -0 - - - 0 0 - -0 - - - 0 0 - -0 - - - 0 0 - -0 - - - 0 0 - -0 - - - 0 0 - -0 - - - 0 0 - -0 - - - 0 0 - -0 - - - 0 0 - -0 - - - 0 0 - -0 - - - 0 0 - -0 - - - 0 0 - -0 - - - 0 0 - -0 - - - 0 0 - -0 - - - 0 0 - -0 - - - 0 0 - -0 - - - 0 0 - -0 - - - 0 0 - -0 - - - 0 0 - -0 - - - 0 0 - -0 - - - 0 0 - -0 - - - 0 0 - -0 - - - 0 0 - -0 - - - 0 0 - -0 - - - 0 0 - -0 - - - 0 0 - -0 - - - 0 0 - -0 - - - 0 0 - -
1 1 1 1 2 3 4 5

Toronto Real Estate Board
Market Watch, October 2015
SUMMARY OF EXISTING HOME TRANSACTIONS CO-OWNERSHIP APARTMENT, OCTOBER 2015ALL TREB AREAS
23
Sales Dollar Volume Average Price Median Price New Listings Active Listings Avg. SP / LP Avg. DOMTREB TotalHalton Region
BurlingtonHalton HillsMiltonOakville
Peel RegionBramptonCaledonMississauga
City of TorontoToronto WestToronto CentralToronto East
York RegionAuroraE. GwillimburyGeorginaKingMarkhamNewmarketRichmond HillVaughanWhitchurch-Stouffville
Durham RegionAjaxBrockClaringtonOshawaPickeringScugogUxbridgeWhitby
Dufferin CountyOrangeville
Simcoe CountyAdjala-TosorontioBradford WestGwillimburyEssaInnisfilNew Tecumseth
11 $3,182,000 $289,273 $252,000 6 20 97% 390 - - - 0 0 - -0 - - - 0 0 - -0 - - - 0 0 - -0 - - - 0 0 - -0 - - - 0 0 - -0 - - - 0 0 - -0 - - - 0 0 - -0 - - - 0 0 - -0 - - - 0 0 - -11 $3,182,000 $289,273 $252,000 6 20 97% 392 $233,000 $116,500 $116,500 0 3 91% 278 $2,449,000 $306,125 $273,500 6 17 98% 421 $500,000 $500,000 $500,000 0 0 95% 360 - - - 0 0 - -0 - - - 0 0 - -0 - - - 0 0 - -0 - - - 0 0 - -0 - - - 0 0 - -0 - - - 0 0 - -0 - - - 0 0 - -0 - - - 0 0 - -0 - - - 0 0 - -0 - - - 0 0 - -0 - - - 0 0 - -0 - - - 0 0 - -0 - - - 0 0 - -0 - - - 0 0 - -0 - - - 0 0 - -0 - - - 0 0 - -0 - - - 0 0 - -0 - - - 0 0 - -0 - - - 0 0 - -0 - - - 0 0 - -0 - - - 0 0 - -0 - - - 0 0 - -0 - - - 0 0 - -0 - - - 0 0 - -0 - - - 0 0 - -0 - - - 0 0 - -0 - - - 0 0 - -
1 1 1 1 2 3 4 5
Toronto Real Estate Board
Market Watch, October 2015
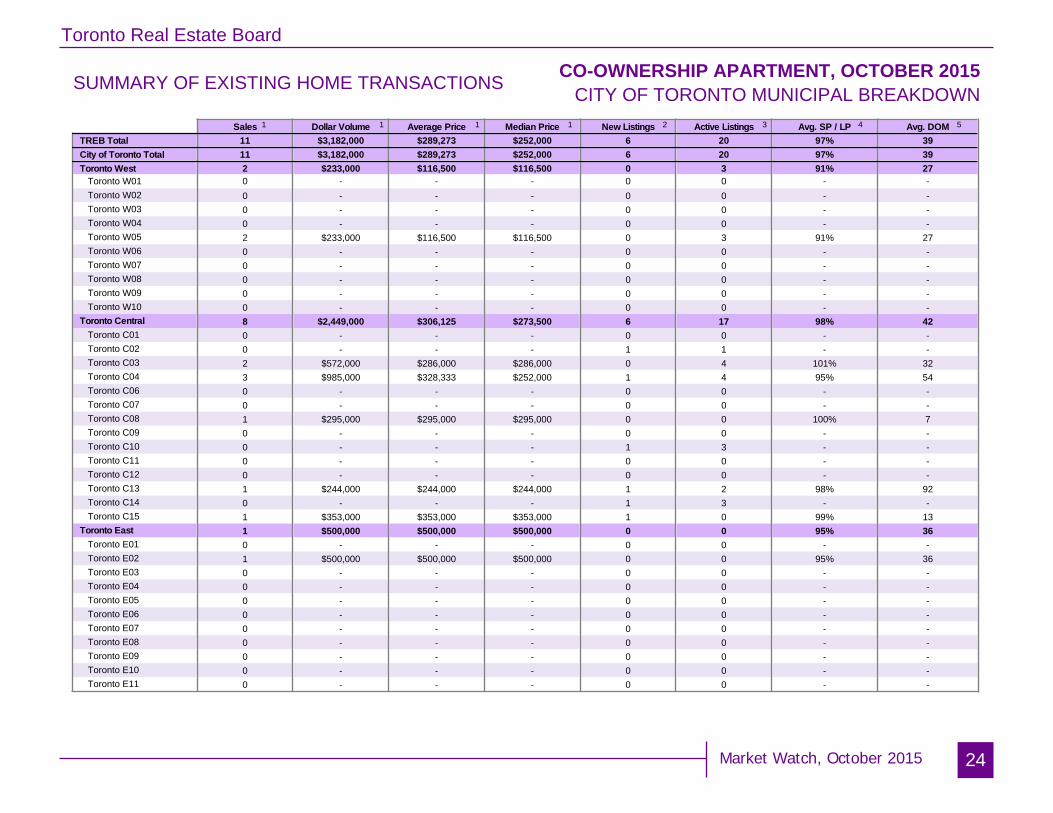
SUMMARY OF EXISTING HOME TRANSACTIONS CO-OWNERSHIP APARTMENT, OCTOBER 2015CITY OF TORONTO MUNICIPAL BREAKDOWN
24
Sales Dollar Volume Average Price Median Price New Listings Active Listings Avg. SP / LP Avg. DOMTREB TotalCity of Toronto TotalToronto West
Toronto W01Toronto W02Toronto W03Toronto W04Toronto W05Toronto W06Toronto W07Toronto W08Toronto W09Toronto W10
Toronto CentralToronto C01Toronto C02Toronto C03Toronto C04Toronto C06Toronto C07Toronto C08Toronto C09Toronto C10Toronto C11Toronto C12Toronto C13Toronto C14Toronto C15
Toronto EastToronto E01Toronto E02Toronto E03Toronto E04Toronto E05Toronto E06Toronto E07Toronto E08Toronto E09Toronto E10Toronto E11
11 $3,182,000 $289,273 $252,000 6 20 97% 3911 $3,182,000 $289,273 $252,000 6 20 97% 392 $233,000 $116,500 $116,500 0 3 91% 270 - - - 0 0 - -0 - - - 0 0 - -0 - - - 0 0 - -0 - - - 0 0 - -2 $233,000 $116,500 $116,500 0 3 91% 270 - - - 0 0 - -0 - - - 0 0 - -0 - - - 0 0 - -0 - - - 0 0 - -0 - - - 0 0 - -8 $2,449,000 $306,125 $273,500 6 17 98% 420 - - - 0 0 - -0 - - - 1 1 - -2 $572,000 $286,000 $286,000 0 4 101% 323 $985,000 $328,333 $252,000 1 4 95% 540 - - - 0 0 - -0 - - - 0 0 - -1 $295,000 $295,000 $295,000 0 0 100% 70 - - - 0 0 - -0 - - - 1 3 - -0 - - - 0 0 - -0 - - - 0 0 - -1 $244,000 $244,000 $244,000 1 2 98% 920 - - - 1 3 - -1 $353,000 $353,000 $353,000 1 0 99% 131 $500,000 $500,000 $500,000 0 0 95% 360 - - - 0 0 - -1 $500,000 $500,000 $500,000 0 0 95% 360 - - - 0 0 - -0 - - - 0 0 - -0 - - - 0 0 - -0 - - - 0 0 - -0 - - - 0 0 - -0 - - - 0 0 - -0 - - - 0 0 - -0 - - - 0 0 - -0 - - - 0 0 - -
1 1 1 1 2 3 4 5

Toronto Real Estate Board
Market Watch, October 2015
FOCUS ON THE MLS HOME PRICE INDEX INDEX AND BENCHMARK PRICE, OCTOBER 2015ALL TREB AREAS
25
Composite Single-Family Detached Single-Family Attached Townhouse ApartmentIndex Benchmark Yr./Yr. % Chg. Index Benchmark Yr./Yr. % Chg. Index Benchmark Yr./Yr. % Chg. Index Benchmark Yr./Yr. % Chg. Index Benchmark Yr./Yr. % Chg.
TREB TotalHalton RegionBurlingtonHalton HillsMiltonOakvillePeel RegionBramptonCaledonMississaugaCity of TorontoYork RegionAuroraEast GwillimburyGeorginaKingMarkhamNewmarketRichmond HillVaughanWhitchurch-StouffvilleDurham RegionAjaxBrockClaringtonOshawaPickeringScugogUxbridgeWhitbyDufferin CountyOrangevilleSimcoe CountyAdjala-TosorontioBradford WestGwillimburyEssaInnisfilNew Tecumseth
186.9 $570,400 10.33% 191.4 $712,200 11.67% 195.8 $553,600 11.06% 182.0 $398,100 10.57% 164.9 $331,400 5.23%196.1 $642,400 9.74% 193.7 $718,800 9.75% 197.0 $511,200 9.75% 182.9 $360,600 8.42% - - -202.0 $606,300 10.93% 201.7 $710,500 11.68% 202.0 $481,500 9.66% 188.2 $373,100 8.66% - - -176.9 $515,100 7.21% 175.5 $561,500 6.88% 189.5 $466,700 8.72% 169.6 $305,800 6.73% - - -185.1 $511,100 8.50% 172.5 $598,100 6.68% 189.5 $473,100 9.03% 169.9 $311,500 8.91% - - -205.2 $756,700 10.09% 204.1 $845,900 10.15% 207.1 $560,600 10.39% 186.4 $411,600 8.44% - - -177.1 $484,800 9.52% 179.3 $607,700 10.07% 182.6 $465,800 10.67% 182.0 $376,600 10.30% 150.1 $258,700 3.66%172.6 $440,500 11.14% 171.8 $502,500 10.62% 175.1 $412,500 11.53% 167.1 $310,300 10.74% 140.9 $220,500 8.47%161.7 $577,100 7.44% 161.9 $595,700 7.01% 176.7 $436,900 7.74% - - - - - -181.9 $509,000 8.40% 191.7 $715,700 10.05% 192.1 $524,800 10.09% 187.0 $401,600 10.26% 151.8 $266,300 2.85%185.9 $609,500 8.21% 197.4 $855,800 10.53% 201.0 $667,800 8.53% 185.1 $447,400 9.27% 167.6 $346,300 5.21%208.7 $716,200 14.17% 211.1 $829,900 14.79% 213.6 $618,900 14.59% 189.7 $482,000 14.35% 168.1 $364,700 7.07%195.9 $630,600 14.36% 195.1 $724,800 14.43% 203.2 $525,400 14.54% 156.9 $397,400 9.19% 168.8 $349,100 9.82%179.5 $581,800 11.01% 180.2 $593,900 10.82% 193.3 $409,300 13.97% - - - - - -175.6 $364,400 9.68% 185.2 $381,500 11.63% 184.5 $363,600 8.02% - - - - - -184.4 $781,700 6.59% 185.6 $783,100 6.18% 209.0 $489,500 10.17% - - - - - -217.6 $748,900 14.47% 225.6 $927,400 15.75% 221.5 $659,700 14.47% 202.1 $502,100 16.89% 168.2 $387,800 5.85%190.9 $563,000 14.93% 190.2 $640,300 15.98% 197.9 $466,700 16.00% 182.5 $368,500 8.89% 170.8 $287,600 9.07%220.5 $799,600 15.08% 235.2 $999,800 15.58% 224.5 $680,700 14.48% 174.0 $487,000 13.50% 163.7 $341,000 7.91%204.4 $738,900 13.94% 196.9 $819,600 14.41% 210.2 $639,600 14.68% 200.5 $547,800 14.25% 172.1 $381,900 7.70%210.1 $792,100 13.02% 209.2 $802,800 12.78% 188.1 $516,700 13.25% - - - - - -172.8 $406,500 13.02% 171.1 $446,000 12.57% 180.9 $362,500 13.92% 163.4 $267,900 13.39% 159.2 $286,200 9.57%183.8 $454,200 15.74% 182.3 $488,300 14.51% 191.2 $411,200 15.95% 177.1 $323,700 17.13% 152.4 $258,800 8.70%141.5 $267,400 8.18% 142.0 $268,900 8.07% - - - - - - - - -169.2 $358,000 13.71% 161.1 $387,200 11.80% 175.5 $335,100 14.11% 171.8 $307,500 8.19% 159.9 $226,300 8.63%164.8 $315,600 12.41% 164.3 $350,000 12.84% 174.6 $292,500 13.97% 140.4 $187,900 12.50% 153.3 $206,900 6.90%181.0 $489,400 12.70% 181.1 $565,900 12.48% 188.4 $439,100 13.22% 180.3 $323,700 14.84% 166.4 $325,800 10.71%163.0 $423,000 7.31% 167.1 $430,300 6.98% 157.6 $329,800 9.14% - - - - - -161.6 $494,100 11.53% 161.4 $499,900 10.93% 156.2 $383,300 9.08% - - - - - -173.9 $453,700 12.27% 175.3 $503,600 12.23% 177.9 $392,000 12.24% 163.6 $299,900 11.90% 154.7 $301,800 9.72%170.9 $391,700 10.33% 177.4 $404,200 10.60% 167.4 $313,800 10.20% - - - - - -170.9 $391,700 10.33% 177.4 $404,200 10.60% 167.4 $313,800 10.20% - - - - - -169.4 $361,200 12.93% 163.3 $361,800 11.47% 177.5 $340,600 14.96% - - - - - -138.4 $491,100 11.08% 138.4 $491,100 11.08% - - - - - - - - -192.6 $478,700 18.01% 172.7 $529,000 16.61% 195.1 $405,600 16.55% - - - - - -162.4 $380,400 13.41% 159.7 $403,800 12.78% 165.4 $281,800 13.83% - - - - - -165.4 $305,900 8.39% 165.0 $305,800 7.84% 182.8 $284,400 11.19% - - - - - -153.4 $354,300 14.65% 149.1 $384,000 14.25% 161.1 $307,600 14.83% - - - - - -
Toronto Real Estate Board
Market Watch, October 2015
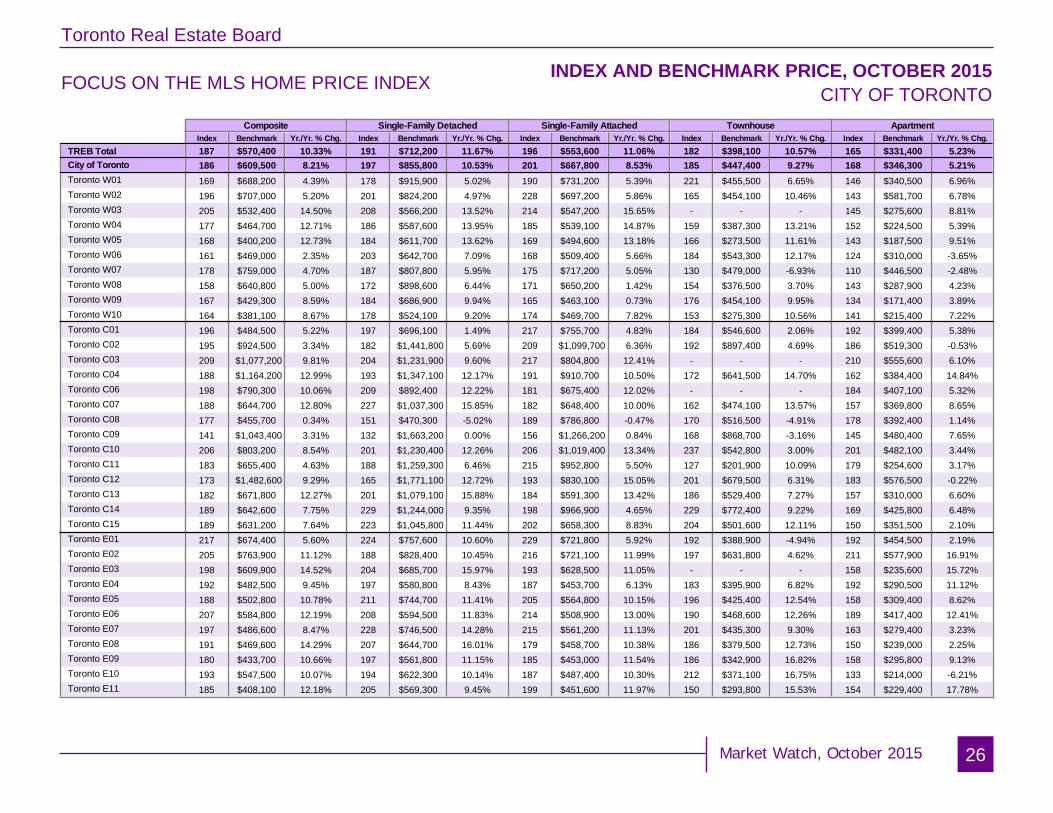
FOCUS ON THE MLS HOME PRICE INDEX INDEX AND BENCHMARK PRICE, OCTOBER 2015CITY OF TORONTO
26
Composite Single-Family Detached Single-Family Attached Townhouse ApartmentIndex Benchmark Yr./Yr. % Chg. Index Benchmark Yr./Yr. % Chg. Index Benchmark Yr./Yr. % Chg. Index Benchmark Yr./Yr. % Chg. Index Benchmark Yr./Yr. % Chg.
TREB TotalCity of TorontoToronto W01Toronto W02Toronto W03Toronto W04Toronto W05Toronto W06Toronto W07Toronto W08Toronto W09Toronto W10Toronto C01Toronto C02Toronto C03Toronto C04Toronto C06Toronto C07Toronto C08Toronto C09Toronto C10Toronto C11Toronto C12Toronto C13Toronto C14Toronto C15Toronto E01Toronto E02Toronto E03Toronto E04Toronto E05Toronto E06Toronto E07Toronto E08Toronto E09Toronto E10Toronto E11
187 $570,400 10.33% 191 $712,200 11.67% 196 $553,600 11.06% 182 $398,100 10.57% 165 $331,400 5.23%186 $609,500 8.21% 197 $855,800 10.53% 201 $667,800 8.53% 185 $447,400 9.27% 168 $346,300 5.21%169 $688,200 4.39% 178 $915,900 5.02% 190 $731,200 5.39% 221 $455,500 6.65% 146 $340,500 6.96%196 $707,000 5.20% 201 $824,200 4.97% 228 $697,200 5.86% 165 $454,100 10.46% 143 $581,700 6.78%205 $532,400 14.50% 208 $566,200 13.52% 214 $547,200 15.65% - - - 145 $275,600 8.81%177 $464,700 12.71% 186 $587,600 13.95% 185 $539,100 14.87% 159 $387,300 13.21% 152 $224,500 5.39%168 $400,200 12.73% 184 $611,700 13.62% 169 $494,600 13.18% 166 $273,500 11.61% 143 $187,500 9.51%161 $469,000 2.35% 203 $642,700 7.09% 168 $509,400 5.66% 184 $543,300 12.17% 124 $310,000 -3.65%178 $759,000 4.70% 187 $807,800 5.95% 175 $717,200 5.05% 130 $479,000 -6.93% 110 $446,500 -2.48%158 $640,800 5.00% 172 $898,600 6.44% 171 $650,200 1.42% 154 $376,500 3.70% 143 $287,900 4.23%167 $429,300 8.59% 184 $686,900 9.94% 165 $463,100 0.73% 176 $454,100 9.95% 134 $171,400 3.89%164 $381,100 8.67% 178 $524,100 9.20% 174 $469,700 7.82% 153 $275,300 10.56% 141 $215,400 7.22%196 $484,500 5.22% 197 $696,100 1.49% 217 $755,700 4.83% 184 $546,600 2.06% 192 $399,400 5.38%195 $924,500 3.34% 182 $1,441,800 5.69% 209 $1,099,700 6.36% 192 $897,400 4.69% 186 $519,300 -0.53%209 $1,077,200 9.81% 204 $1,231,900 9.60% 217 $804,800 12.41% - - - 210 $555,600 6.10%188 $1,164,200 12.99% 193 $1,347,100 12.17% 191 $910,700 10.50% 172 $641,500 14.70% 162 $384,400 14.84%198 $790,300 10.06% 209 $892,400 12.22% 181 $675,400 12.02% - - - 184 $407,100 5.32%188 $644,700 12.80% 227 $1,037,300 15.85% 182 $648,400 10.00% 162 $474,100 13.57% 157 $369,800 8.65%177 $455,700 0.34% 151 $470,300 -5.02% 189 $786,800 -0.47% 170 $516,500 -4.91% 178 $392,400 1.14%141 $1,043,400 3.31% 132 $1,663,200 0.00% 156 $1,266,200 0.84% 168 $868,700 -3.16% 145 $480,400 7.65%206 $803,200 8.54% 201 $1,230,400 12.26% 206 $1,019,400 13.34% 237 $542,800 3.00% 201 $482,100 3.44%183 $655,400 4.63% 188 $1,259,300 6.46% 215 $952,800 5.50% 127 $201,900 10.09% 179 $254,600 3.17%173 $1,482,600 9.29% 165 $1,771,100 12.72% 193 $830,100 15.05% 201 $679,500 6.31% 183 $576,500 -0.22%182 $671,800 12.27% 201 $1,079,100 15.88% 184 $591,300 13.42% 186 $529,400 7.27% 157 $310,000 6.60%189 $642,600 7.75% 229 $1,244,000 9.35% 198 $966,900 4.65% 229 $772,400 9.22% 169 $425,800 6.48%189 $631,200 7.64% 223 $1,045,800 11.44% 202 $658,300 8.83% 204 $501,600 12.11% 150 $351,500 2.10%217 $674,400 5.60% 224 $757,600 10.60% 229 $721,800 5.92% 192 $388,900 -4.94% 192 $454,500 2.19%205 $763,900 11.12% 188 $828,400 10.45% 216 $721,100 11.99% 197 $631,800 4.62% 211 $577,900 16.91%198 $609,900 14.52% 204 $685,700 15.97% 193 $628,500 11.05% - - - 158 $235,600 15.72%192 $482,500 9.45% 197 $580,800 8.43% 187 $453,700 6.13% 183 $395,900 6.82% 192 $290,500 11.12%188 $502,800 10.78% 211 $744,700 11.41% 205 $564,800 10.15% 196 $425,400 12.54% 158 $309,400 8.62%207 $584,800 12.19% 208 $594,500 11.83% 214 $508,900 13.00% 190 $468,600 12.26% 189 $417,400 12.41%197 $486,600 8.47% 228 $746,500 14.28% 215 $561,200 11.13% 201 $435,300 9.30% 163 $279,400 3.23%191 $469,600 14.29% 207 $644,700 16.01% 179 $458,700 10.38% 186 $379,500 12.73% 150 $239,000 2.25%180 $433,700 10.66% 197 $561,800 11.15% 185 $453,000 11.54% 186 $342,900 16.82% 158 $295,800 9.13%193 $547,500 10.07% 194 $622,300 10.14% 187 $487,400 10.30% 212 $371,100 16.75% 133 $214,000 -6.21%185 $408,100 12.18% 205 $569,300 9.45% 199 $451,600 11.97% 150 $293,800 15.53% 154 $229,400 17.78%

Toronto Real Estate Board
Market Watch, October 2015
HISTORIC ANNUAL STATISTICS
27
Year Sales Average Price20042005200620072008200920102011201220132014
83,501 $315,23184,145 $335,90783,084 $351,94193,193 $376,23674,552 $379,34787,308 $395,46085,545 $431,27689,096 $465,01485,496 $497,13087,049 $522,95892,783 $566,626
2014 MONTHLY STATISTICS
NOTES1 - Sales, dollar volume, average sale prices and median sale prices are based on firm transactions entered into the TorontoMLS® system between thefirst and last day of the month/period being reported.2 - New listings entered into the TorontoMLS® system between the first and last day of the month/period being reported.3 - Active listings at the end of the last day of the month/period being reported.4 - Ratio of the average selling price to the average listing price for firm transactions entered into the TorontoMLS® system between the first and last dayof the month/period being reported.5 - Average number of days on the market for firm transactions entered into the TorontoMLS® system between the first and last day of the month/periodbeing reported.6 - Due to past changes to TREB's service area, caution should be exercised when making historical comparisons.7 - Past monthly and year-to-date figures are revised on a monthly basis.8 - SNLR = Sales-to-New Listings Ratio. Calculated using a 12-month moving average (sales/new listings).9 - Mos. Inv. = Months of Inventory. Calculated using a 12-month moving average (active listings/sales).
2015 MONTHLY STATISTICS
*For historic annual sales and average price data over a longer time frame go to:
JanuaryFebruary
MarchAprilMayJuneJuly
AugustSeptember
OctoberNovemberDecember
Year to Date
4,318 $552,9256,296 $596,3478,889 $613,88411,255 $636,08611,645 $649,85411,911 $639,3879,823 $609,2437,956 $603,3128,174 $627,9038,804 $630,876
- -- -
89,071 $615,982
JanuaryFebruaryMarchAprilMayJuneJuly
AugustSeptember
OctoberNovemberDecemberAnnual
4,103 $526,9655,696 $552,8598,052 $558,0199,660 $578,35411,013 $584,94610,132 $569,1749,152 $550,6257,568 $546,4828,001 $574,4248,512 $587,9456,476 $577,5024,418 $556,259
92,783 $566,626
1,6,7
1,7
1,7
http://www.torontorealestateboard.com/market_news/market_watch/historic_stats/pdf/TREB_historic_statistics.pdf
Copyright® 2015 Toronto Real Estate Board
$622,11889,071