trends: 2011 south florida real estate mid-year upate
DESCRIPTION
A comprehensive study of real estate market activity in the first half of 2011, from Fort Lauderdale to Miami presented by Jorge FernandezTRANSCRIPT

TRENDS
2011 MID-YEAR UPDATE

2 0 1 1 THE FIRST 6 MONTHS
Basic economic theory tells us that as supply falls and demand rises, prices should increase. The real estate market in South Florida for the first six months of 2011 is representative of this basic economic theory.
Spurred by foreign buyers with cash offers, inventory of properties for sale had dropped to 5 year low by June 2011. Waterfront property sales led the way with price increases, bolstering an overall increase in the average sales price in both counties to a two year high point. Cash buyers continue to fuel the very high and very low end markets. Financing, although more available, is still slowing real recovery in the middle of the market.
Will this last? Talk of the shadow inventory and the possibility of a future correction seem to be the caveat to all of the apparent, and now indisputable, good news about the market. Most experts feel that there will be some increased inventory released by banks either through short sale or foreclosure sales coming in the next few months now that supply is low and prices are improved. While the inventory is needed, most agree that there is not enough shadow inventory to create any significant backsliding momentum in most of our market areas.
It is our privilege to share our Mid-Year 2011 Real Estate Market Trends with you and hope that you find the information useful information about the market in South Florida.
CORAL GABLESSantona Corner1430 S Dixie Highway, Suite 110Coral Gables, Florida 33146
Jorge FernandezONE Sotheby’s International Realty+1 305 216 [email protected]

MIAMI BEACHAtlantic Center Building119 Washington AvenueMiami Beach, Florida 33139
KEY BISCAYNEThe Galleria Mall328 Crandon Boulevard, Suite 222Key Biscayne, Florida 33149
FORT LAUDERDALELas Olas888 E Las Olas Boulevard, Suite 110Fort Lauderdale, Florida 33301
M I D - Y E A R U P D A T E 2 0 1 1

Key ObservationsInstant gratification is on the rise with South Florida real estate buyers. Properties in tip-top shape are garnering disproportionately higher prices than those that need work. Buyers are no longer attached to “decorator ready” and are looking not only for finished properties but are attracted to well-designed furniture packages that can be delivered within a short time of closing.
0 4 I T R E N D S O N E S O T H E B Y S R E A LT Y. C O M

90%ULTRA LUXURY The price differential on average between the Asking Price and Sales Price for residential properties over $1 million in Miami Dade County.
Source: Terradatum
41%
ON THE MOVEDid you know that one half of all local searches are performed on mobile devices? ONE Sotheby’s remains the only local iPad app in South Florida.
Source: Agent Genius
“While foreign purchasers make up about 7% of the U.S. residential real-estate market, their numbers have swelled: According to the National Association of Realtors, 18% of Realtors in the U.S. market reported selling a home to at least one international buyer in 2010, up from 12% in 2009. In the Greater Miami area, nearly 60% of all sales last year were to buyers from overseas. For sales of newly built condos downtown, that figure jumps to 90%, says the group.”
THE WALL STREET JOURNAL, MAY 2011
155LOOKING UP That’s the number of $1 million+ homes that closed in June 2011 in Miami Dade and Broward counties, making it the highest closing month in this price range so far this year.
Source: Terradatum
SIGNIFICANT SALESONE Sotheby’s International Realty sold this property on the Sunset Islands in Miami beach for a record-breaking $19.8 Million in June 2011. Source: Southeast Florida Regional MLS
SCORCHING ZIPS With 89 closed sales in excess of $1 million through the end of June 2011, 33160 continues to be the hottest high end market in South Florida. We’ve upgraded the sales status from “hot” to “scorching” since the number of sales is twice what they were this time last year. Source: Southeast Florida Regional MLS
SHRINKING INVENTORY On June 30, 2011 the inventory of $1 million plus homes in Miami Dade and Broward counties had dropped to the lowest point in five years. With just under 3,000 homes and condos on the market in this price range, inventory is down 41% since June 2006. Source: Southeast Florida Regional MLS
T R E N D S I 0 5
M I D - Y E A R U P D A T E 2 0 1 1
O N E S O T H E B Y S R E A LT Y. C O M

At a Glance: Mid-Year 2011The sale of $1 million homes in Miami-Dade and Broward counties represented 8% of the total sales thus far in 2011. In 2010, just 2.4% of all sales were over that price point. With limited financing resources still available in the market, the high-end market grows as an overall percentage due to the large number of cash buyers in this price range.
NUMBER OF HOMES
PRIC
E RA
NG
E
0
$10M+
$5M - $10M
$3M - $5M
$1M - $3M
$500K - $1M
1250 2500 3750 5000
Under $1 MillionOver $1 Million
Sold Mid-Year 2011On The Market
0 6 I T R E N D S
Source: Southeast Florida Regional MLS.Source: Southeast Florida Regional MLS.
O N E S O T H E B Y S R E A LT Y. C O M

Month by MonthOverall sales in all price ranges in Miami-Dade and Broward counties show a 15% increase in the number of sales over the same time period last year. The market is still showing some seasonality as March continues to be the month when the most properties closed in both counties.
SHADOW INVENTORY Short Sale and REO properties now represent only 2.9% of the homes and condos for sale in South Florida above $1 million. There are only 6 Bank-owned properties currently on the market with a Listing Price over $1 million.
Source: Southeast Florida Regional MLS. Active inventory count currentas of June 30,2011.
MARKET SHIFTNo longer a buyer’s market, inventory levels have dropped to a 5.2 month supply in Broward County. Six to nine months is considered a balanced market. Miami-Dade comes in at 7.7 months and falling. Both counties crested with 3-4 years’ supply in 2008. June 2011 is the lowest level in 5 years.Source: Terradatum
0Jan Feb Mar Apr May Jun
3000
6000
MONTH
NUM
BER
OF
HO
MES
SO
LD
Miami-Dade County Broward County
T R E N D S I 0 7
Source: Southeast Florida Regional MLS
Average Sales PriceShowing slow signs of recovery, the Average Sales Price in both counties is on an upward swing. The Average Sales Price in Broward County seems to show a slow and steady increase since dropping slightly in January and ending in June 2011 with a 2 year high of $197,000. Miami-Dade’s Average Sales Price shows a more dramatic climb this year, ending in June 2011 at a high of just under $300,000.
$0Jan Feb Mar Apr May JunJul Aug Sep Oct Nov Dec
$100K
$200K
$300K
MONTH
PRIC
E
Miami-Dade County Broward County
Source: Southeast Florida Regional MLS
M I D - Y E A R U P D A T E 2 0 1 1
O N E S O T H E B Y S R E A LT Y. C O M
5.2
Traditional SalesShort SalesBank-Owned Properties

CORAL GABLES COCOPLUM SNAPPER CREEK LAKES GABLES ESTATES
OLD CUTLER WATERFRONT PONCE DAVIS, HIGH PINES COCONUT GROVEPINECREST PALMETTO BAY
South of Miami
5935 Moss Ranch Road, PinecrestOffered at $4,149,000

O N E S O T H E B Y S R E A LT Y. C O M
C O M M U N I T Y P R O F I L E SI N D E P T H
Mid-Year 2010 29 $2,989,259 $2,500,000 10%Mid-Year 2011 20 $1,892,975 $1,282,250 -
Change -31% -37% -49%
T R E N D S I 0 9
Waterfront Properties
SingleFamily Homes
# of Transactions
AverageSales Price
MedianSales Price
% of REO Sales
Mid-Year 2010 186 $693,932 $525,000 10%Mid-Year 2011 212 $788,259 $575,000 11%
Change 14% 14% 10%
Condos($1M+)
# of Transactions
AverageSales Price
MedianSales Price
% of REO Sales
Non-Waterfront Properties
SingleFamily Homes
# of Transactions
AverageSales Price
MedianSales Price
% of REO Sales
2009 7 $1,357,500 $1,262,500 -2010 12 $2,101,455 $1,245,000 -
Change 71% 55% -1%
OVERVIEW
Coral GablesShowing better sales this year, non-waterfront properties in the Gables are moving at a brisk clip. The inventory of Single Family Homes has dropped below the 6 month mark, signaling a seller’s market and attributing to the price increases. The high-end condo market is up as well, with a significant increase in the number of sales and the Average Sales Price.
OVERVIEW
Coral GablesOne of the few areas to show a slowdown over
this time a year ago, single family waterfront homes in Coral Gables languished a bit in the
first half of the year. The Average Asking Price in this market is still at just under $5 million.
Pending sales increased in May and June and foretell a better summer sales season. It is also
interesting to note that the REO inventory has been absorbed, leaving no waterfront
foreclosures left to purchase.
10 Edgewater Drive #12A/C, Coral GablesOffered at $6,500,000 or $30,000/month
3200 Granada Boulevard, Coral GablesOffered at $3,900,000

O N E S O T H E B Y S R E A LT Y. C O MO N E S O T H E B Y S R E A LT Y. C O M
I N D E P T H C O M M U N I T Y P R O F I L E S I N D E P T H C O M M U N I T Y P R O F I L E S
1 0 I T R E N D S
CORAL GABLES
CocoplumCocoplum is one of the most prestigious guard
gated communities in Coral Gables, offering 24 hour roving security patrol, clubhouse,
gym, playground, tennis courts, basketball courts and marina. Sales of non-waterfront
homes increased a dramatic 175% in the first half of 2011 compared to 2010. Out of the 11 homes sold, only 1 was a bank owned
foreclosure. On the other hand, only one waterfront sale closed in the first half of 2011 compared to the 3 sales in 2010, despite the
average sales price dropping over 20%.
Waterfront Properties# of
TransactionsAverage
Sales PriceMedian
Sales Price% of
REO Sales
Single Family Homes
# of Transactions
AverageSales Price
MedianSales Price
% of REO Sales
Single Family Homes
Mid-Year 2010 4 $2,874,750 $2,925,000 -Mid-Year 2011 2 $2,450,000 $2,450,000 -
Change -50% -15% -16%
Non-Waterfront Properties
Mid-Year 2010 - - - -Mid-Year 2011 1 $2,350,000 $2,350,000 -
Change 100% 100% 100%
The full-service marina with full-time dock master and security is just one of the reasons Snapper Creek Lakes is a viable choice for luxury home buyers. The average price for listed homes is over $4.5 Million, showing that the most expensive properties are slower to sell. One waterfront home has sold in Snapper Creek Lakes thus far in 2011 with an impressive sales price of $2.35 Million. At time of publication, two non-waterfront homes closed in Snapper Creek Lakes, a 50% decrease in transactions from the same time period in 2010.
CORAL GABLES
Snapper Creek Lakes
Waterfront Properties# of
TransactionsAverage
Sales PriceMedian
Sales Price% of
REO Sales
# of Transactions
AverageSales Price
MedianSales Price
% of REO Sales
Single Family Homes
Single Family Homes
Mid-Year 2010 4 $2,012,500 $1,975,000 -Mid-Year 2011 11 $1,735,909 $1,500,000 9%
Change 175% -14% -24%
Non-Waterfront Properties
Mid-Year 2010 3 $2,865,000 $2,950,000 -Mid-Year 2011 1 $2,225,000 $2,225,000 -
Change -67% -22% -25%
190 Paloma Drive, CocoplumOffered at $5,600,000

T R E N D S I 1 1O N E S O T H E B Y S R E A LT Y. C O MO N E S O T H E B Y S R E A LT Y. C O M
I N D E P T H C O M M U N I T Y P R O F I L E S I N D E P T H C O M M U N I T Y P R O F I L E S
# of Transactions
AverageSales Price
MedianSales Price
% of REO Sales
Single Family Homes
Mid-Year 2010 0 - - -Mid-Year 2011 0 - - -
Change
All Properties
CORAL GABLES
Gables EstatesDesigned by Arvida in the 1960s, Gables Estates remains a prestigious and private
community. No transactions had taken place in Gables Estates at time of publication or during
the same time period last year, but there are pending sales, signalling some activity to look
forward to in the next six months.
400 Arvida Parkway, Gables EstatesOffered at $16,975,000
Ponce Davis, High PinesOne of the fastest-growing, non-waterfront
neighborhoods, Ponce Davis sits directly between Coral Gables and South Miami. Most impressively, the average sales price increased
by 25% - a figure which did not keep the number of transactions in Ponce Davis/High Pines from increasing slightly during the first
six months of 2011. # of Transactions
AverageSales Price
MedianSales Price
% of REO Sales
Single Family Homes
Mid-Year 2010 14 $1,208,036 $1,155,000 -Mid-Year 2011 16 $1,514,000 $1,225,000 -
Change 14% 25% 6%
Non-Waterfront Properties
4845 Southwest 80 Street, Ponce DavisOffered at $3,995,000
CORAL GABLES
Old Cutler Waterfront CommunitiesOld Cutler Bay, Hammock Oaks, Journey’s End
This year’s 2 transactions during this time period both occurred in Old Cutler Bay. There was the same amount of sales in Old Cutler Bay during the first six months of 2010. However, average and median sales price in Old Cutler Bay decreased. No sales in Hammock Oaks or Journey’s End had taken place at time of publication.
# of Transactions
AverageSales Price
MedianSales Price
% of REO Sales
Single Family Homes
Mid-Year 2010 5 $4,047,500 $4,047,500 -Mid-Year 2011 2 $2,275,000 $2,275,000 -
Change -60% -44% -44%
Waterfront Properties
601 Reinante Avenue, Old Cutler BayOffered at $5,750,000

1 2 I T R E N D S O N E S O T H E B Y S R E A LT Y. C O M
I N D E P T H C O M M U N I T Y P R O F I L E S
Coconut GroveThe Coconut Grove waterfront single family
home market continued to show signs of improvement in the first half of 2011, with an
increase in the amount of transactions and Average Sales Price. Our company holds the
record for the highest priced single family home sale in Coconut Grove with the sale of
a waterfront home at 3500 Curtis Lane for $13 Million in April 2011. Waterfront condos
dropped in the amount of transaction and prices as REO sales increased in this category.
Although waterfront condo average and median sales prices decreased, prices held
better than non-waterfront condos.
Non-Waterfront Properties# of
TransactionsAverage
Sales PriceMedian
Sales Price% of
REO Sales
Single Family Homes
Mid-Year 2010 75 $532,172 $499,999 16%Mid-Year 2011 101 $610,650 $510,000 25%
Change 35% 15% 2%
Condos
# of Transactions
AverageSales Price
MedianSales Price
% of REO Sales
Mid-Year 2010 98 $289,979 $209,450 33%Mid-Year 2011 119 $216,755 $150,000 34%
Change 21% -25% -28%
Waterfront Properties# of
TransactionsAverage
Sales PriceMedian
Sales Price% of
REO Sales
Single Family Homes
Mid-Year 2010 3 $5,216,667 $5,500,000 -Mid-Year 2011 4 $5,354,874 $3,175,000 -
Change 33% 3% -42%
Condos
# of Transactions
AverageSales Price
MedianSales Price
% of REO Sales
Mid-Year 2010 55 $779,448 $640,000 2%Mid-Year 2011 36 $764,738 $539,000 6%
Change -35% -2% -16%
Coconut GroveThe Coconut Grove non-waterfront single family home market was active compared to the first half of 2010 with a 35% increase in the amount of transactions. There was also an increase in average and median sales price despite the fact that 25% of transactions were REO sales. The amount of Coconut Grove non-waterfront condo transactions increased as both average and median sales price decreased. REO transactions continue to be a significant percentage of sales in this category.
3618 Matheson Avenue, Coconut GroveOffered at $2,975,000
3601 Matheson Avenue, Coconut GroveOffered at $2,495,000

T R E N D S I 1 3O N E S O T H E B Y S R E A LT Y. C O M
I N D E P T H C O M M U N I T Y P R O F I L E S
North Pinecrest# of
TransactionsAverage
Sales PriceMedian
Sales Price% of
REO Sales
Single Family Homes
Mid-Year 2010 46 $1,318,902 $1,020,000 2%Mid-Year 2011 37 $1,329,797 $915,000 5%
Change -20% 1% -10%
South Pinecrest# of
TransactionsAverage
Sales PriceMedian
Sales Price% of
REO Sales
Single Family Homes
Mid-Year 2010 43 $861,060 $675,000 9%Mid-Year 2011 56 $711,530 $586,750 9%
Change 30% -17% -13%
O N E S O T H E B Y S R E A LT Y. C O M
I N D E P T H C O M M U N I T Y P R O F I L E S
Non-Waterfront Properties# of
TransactionsAverage
Sales PriceMedian
Sales Price% of
REO Sales
Single Family Homes
Mid-Year 2010 102 $383,939 $362,500 22%Mid-Year 2011 130 $391,965 $385,000 18%
Change 27% 2% 6%
6500 Southwest 98 Street, PinecrestOffered at $4,999,999
6755 Southwest 152 Street, Palmetto BayOffered at $6,499,000
Palmetto BayPalmetto Bay has had a favorable year thus far. The amount of transactions for the first six months of 2011 has increased by 27% from this time last year despite increased sales prices. With REO transactions making up a smaller portion of the whole than in 2010, this neighborhood is experiencing favorable trends across the board.
PinecrestThe amount of transactions in North Pinecrest
decreased compared to 2010, as did the Median Sales Price. However, the Average Sales
Price increased despite an increase in REO transactions. South Pinecrest outperformed North Pinecrest in quantity of transactions,
which could be attributed to a decrease in both average and median sales prices.
1 4 I T R E N D S
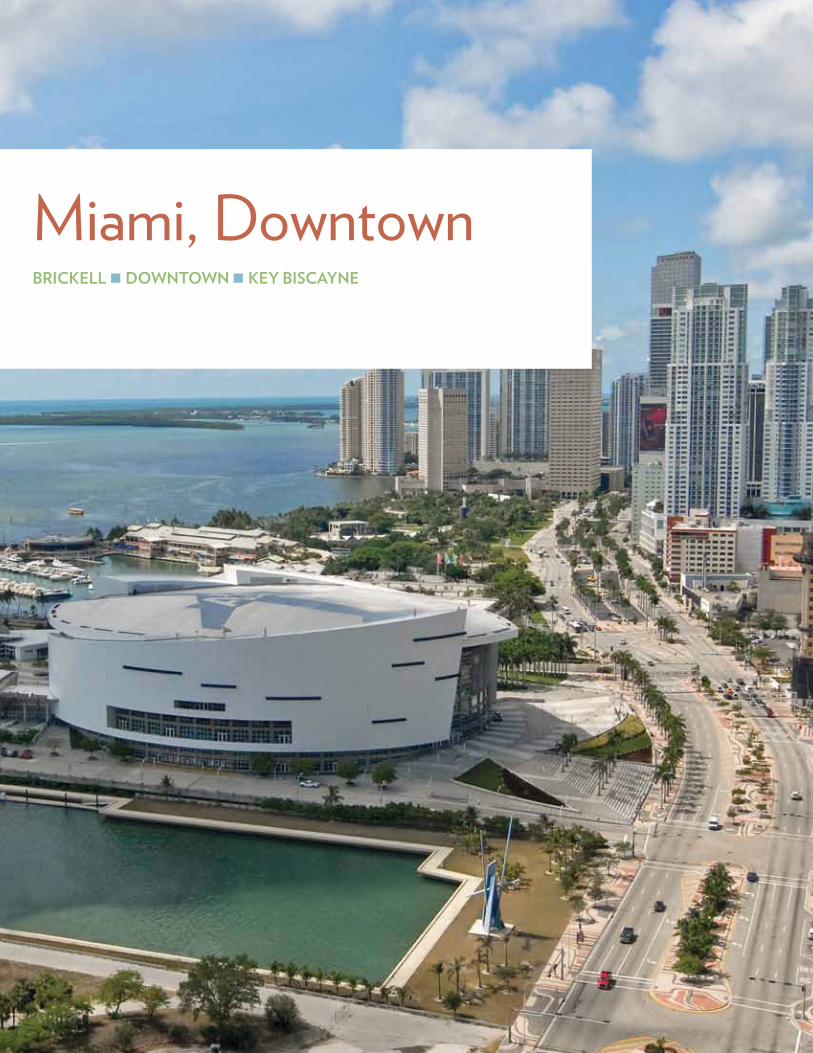
BRICKELL DOWNTOWN KEY BISCAYNE
Miami, Downtown

Waterfront Properties
Non-Waterfront Properties
I N D E P T H C O M M U N I T Y P R O F I L E S
T R E N D S I 1 5O N E S O T H E B Y S R E A LT Y. C O M
Waterfront Properties
Non-Waterfront Properties
Condos
# of Transactions
AverageSales Price
MedianSales Price
% of REO Sales
Mid-Year 2010 27 $210,566 $140,000 37%Mid-Year 2011 44 $238,620 $155,000 23%
Change 63% 13% 11%
Condos
# of Transactions
AverageSales Price
MedianSales Price
% of REO Sales
Mid-Year 2010 89 $385,498 $280,000 10%Mid-Year 2011 108 $436,232 $325,000 13%
Change 21% 13% 16%
DowntownJust like Brickell, the Downtown area is absorbing its inventory and developers are set to begin construction with condo/hotels and a possible gaming resort. Over the 6 month comparison, there were 31% more units sold with an average sales price increase of 10%. The non-waterfront area with the most REO had the largest number of sales, driving the REO inventory down by 14%. At time of publication the amount of active REO was a mere 1% of the inventory and short sales represented 7%. Rental rates on average are up 21% over last year, providing further proof that the downtown area remains a good investment with positive cash flow.
Condos
# of Transactions
AverageSales Price
MedianSales Price
% of REO Sales
Mid-Year 2010 107 $201,384 $165,000 28%Mid-Year 2011 156 $222,249 $200,250 38%
Change 46% 10% 21%
Condos
# of Transactions
AverageSales Price
MedianSales Price
% of REO Sales
Mid-Year 2010 307 $410,785 $245,000 19%
Mid-Year 2011 334 $430,022 $275,000 21%
Change 9% 5% 12%
BrickellBrickell continues to absorb its inventory primarily with international buyers, while developers are poised to begin building
again later this year, adding more condo, retail and mixed-use buildings. Overall,
18% more units sold and the average sales price continues an upward climb as we head
in to the second half of 2011. There was an increase of REO sales that helped with the inventory absorption. The distressed
inventory is depleting with only 2% of active REO and 7% Short Sales remaining at
time of publication. With investors taking advantage of this buyer’s market and the
influx of professionals seeking the live work environment, rental rates in the area have
driven up by an average of 12% over the same period.
1425 Brickell Avenue #48E, MiamiOffered at $3,400,000
Mint at Riverfront, MiamiFrom $240,000 to $1,250,000

O N E S O T H E B Y S R E A LT Y. C O MO N E S O T H E B Y S R E A LT Y. C O M
I N D E P T H C O M M U N I T Y P R O F I L E S I N D E P T H C O M M U N I T Y P R O F I L E S
# of Transactions
AverageSales Price
MedianSales Price
% of REO Sales
Key BiscayneStill a favorite for extraordinary living, Key
Biscayne waterfront homes continue to fare well with a whopping 133% increase in number of transactions and a steady average price per
square foot at $1,626.91. Despite impressive numbers, the first REO sale for this type of
property occurred in the first half of 2011.
Waterfront Properties
SingleFamily Homes
# of Transactions
AverageSales Price
MedianSales Price
% of REO Sales
Mid-Year 2010 3 $6,887,333 $6,750,000 -Mid-Year 2011 7 $6,972,857 $6,200,000 14%
Change 133% 1% -8%
Waterfront Properties
CondosMid-Year 2010 74 $1,040,926 $697,500 1%Mid-Year 2011 74 $982,357 $705,000 5%
Change 0% -6% 1%
Key BiscayneThe beautiful oceanfront buildings in the village of Key Biscayne are continuing to hold their value, with the same number of closings for about the same median price in both the first six months of 2010 and 2011. It is worthwhile to note that so far this year, depending on views and building location, price per square foot ranges largely from $223.46 all the way up to $1,058.61.
1 6 I T R E N D S
330 Harbor Drive, Key BiscayneOffered at $9,950,000
455 Grand Bay Drive #1025, Key BiscayneOffered at $550,000

T R E N D S I 1 7O N E S O T H E B Y S R E A LT Y. C O M
I N D E P T H C O M M U N I T Y P R O F I L E S
O N E S O T H E B Y S R E A LT Y. C O MO N E S O T H E B Y S R E A LT Y. C O M
I N D E P T H C O M M U N I T Y P R O F I L E S I N D E P T H C O M M U N I T Y P R O F I L E S
# of Transactions
AverageSales Price
MedianSales Price
% of REO Sales
Key BiscayneWhile the number of closings increased in quantity, the average selling price has
decreased by almost 20% - a trend justified by 12 sales under $1 Million for the first semester
of 2011 versus only 5 for the first semester of 2010. Current property offerings start
at $1,100,000, which should result in higher average selling prices in the future.
Non-Waterfront Properties
CondosMid-Year 2010 27 $357,519 $365,000 11%Mid-Year 2011 34 $230,994 $207,500 41%
Change 26% -35% -43%
SingleFamily Homes
# of Transactions
AverageSales Price
MedianSales Price
% of REO Sales
Mid-Year 2010 25 $1,551,128 $1,252,207 4%Mid-Year 2011 29 $1,258,159 $1,095,000 3%
Change 16% -19% -13%
Non-Waterfront Properties
Key BiscayneLive in Key Biscayne for $200,000? Yes, that was possible this year with non-waterfront closings nearly dominated by foreclosures, representing 42% of total and causing a 43% drop in median sales price. On a more optimistic note, 17 pending contracts at the time of publication indicate a slight upward trend, with less foreclosures in the mix.
1121 Crandon Boulevard #F302, Key BiscayneOffered at $1,595,000
462 Ridgewood Road, Key BiscayneOffered at $3,333,333 or $20,000/month

1 8 I T R E N D S
Miami BeachSOUTH BEACH MID BEACH NORTH BEACH SOUTH OF FIFTHFISHER ISLAND PALM, STAR, & HIBISCUS ISLANDS SUNSET ISLANDSVENETIAN & LA GORCE ISLANDS NORTH BAY ROAD & PINETREE DRIVE
7331 Belle Meade Island, Miami BeachOffered at $2,900,000

T R E N D S I 1 9O N E S O T H E B Y S R E A LT Y. C O M
I N D E P T H C O M M U N I T Y P R O F I L E S
Condos
# of Transactions
AverageSales Price
MedianSales Price
% of REO Sales
Non-Waterfront Properties
SingleFamily Homes
# of Transactions
AverageSales Price
MedianSales Price
% of REO Sales
Mid-Year 2010 332 $171,555 $130,000 24%Mid-Year 2011 489 $173,423 $123,000 37%
Change 47% 1% -5%
Mid-Year 2010 75 $764,000 $542,000 13%Mid-Year 2011 60 $757,000 $648,000 13%
Change -20% -1% -5%
Waterfront Properties
Condos
SingleFamily Homes
MedianSales Price
AverageSales Price
# of Transactions
# of Transactions
AverageSales Price
MedianSales Price
% of REO Sales
% of REO Sales
Mid-Year 2010 738 $600,573 $309,500 13%
Mid-Year 2011 981 $596,792 $293,000 23%Change 33% -1% -5%
Mid-Year 2010 43 $3,503,333 $2,959,000 5%
Mid-Year 2011 56 $2,912,833 $1,999,000 14%Change 30% -17% -32%
OVERVIEW
Miami BeachThe number of non-waterfront homes for sale in Miami Beach has dropped to the lowest point in the last 5 years. Although the number of sales is down, the Median Sales Price is up 20%. On the other hand, non-waterfront condos show a substantial increase in number of sales – a good portion due to the distressed inventory being depleted. Pricing has been modestly hit as a result.
OVERVIEW
Miami BeachWaterfront sales in Miami Beach rose 30%
year over year. The Average Sales Price and foreclosures are leading indicators for the
increase. Waterfront condos continue to make waves with a robust increase in the number of
sales. Despite the flushing out of the distressed condos inventory, a small 1% increase in price
per square foot demonstrates stabilization along the American Riviera.
1000 S Pointe Drive PH-4, Miami BeachOffered at $5,750,000
2110 Lucerne Avenue, Miami BeachOffered at $2,299,000

2 0 I T R E N D S O N E S O T H E B Y S R E A LT Y. C O MO N E S O T H E B Y S R E A LT Y. C O M
I N D E P T H C O M M U N I T Y P R O F I L E S I N D E P T H C O M M U N I T Y P R O F I L E S
# of Transactions
AverageSales Price
MedianSales Price
% of REO Sales
Mid-Year 2010 228 $516,630 $300,000 10%Mid-Year 2011 279 $439,760 $300,000 19%
Change 22% -15% 0%
Waterfront Properties
Condos
# of Transactions
AverageSales Price
MedianSales Price
% of REO Sales
Mid-Year 2010 124 $289,110 $239,000 26%Mid-Year 2011 201 $318,112 $222,500 25%
Change 62% 10% -7%
Waterfront Properties
Condos
# of Transactions
AverageSales Price
MedianSales Price
% of REO Sales
Mid-Year 2010 367 $684,755 $340,000 12%Mid-Year 2011 472 $749,501 $345,000 14%
Change 29% 9% 1%
Waterfront Properties
Condos
MIAMI BEACH
Mid BeachWaterfront Mid-Beach and Millionaire’s
Row have been the most stagnant of the Miami Beach markets, but still show an
increase in number of transactions sold. Price per square foot pricing was hit,
dropping 14% – perhaps a function of the distressed inventory being depleted.
MIAMI BEACH
South BeachWhile 2009 to 2010 statistics were relatively flat, 2011 is off to an impressive start with the number of transactions closing just short of a 30% increase. Meanwhile, price per square foot pricing has begun an uphill climb, with a 7% increase from mid-year 2010.
In the month of June 2011, ONE Sotheby’s International Realty closed $25,000,000 in sales at The Residences at W South Beach.
MIAMI BEACH
North BeachCanyon Ranch Resort and Akoya are the strong players in the North Beach Market, feeding a robust 62% sales volume increase in this sector. Interesting to note: 9 distressed sales closed at Akoya during the first half of 2011, while only 2 are active at the time of this post as the distressed inventory dries up.
5757 Collins Avenue #605, Miami BeachOffered at $1,226,000
The Residences at W South BeachFrom $660,000 to $6,500,000
6365 Collins Avenue #TS-01, Miami BeachOffered at $30,000/month
O N E S O T H E B Y S R E A LT Y. C O M

T R E N D S I 2 1O N E S O T H E B Y S R E A LT Y. C O MO N E S O T H E B Y S R E A LT Y. C O M
I N D E P T H C O M M U N I T Y P R O F I L E S I N D E P T H C O M M U N I T Y P R O F I L E S
# of Transactions
AverageSales Price
MedianSales Price
% of REO Sales
Mid-Year 2010 21 $1,936,325 $1,975,000 -Mid-Year 2011 26 $2,503,460 $2,000,000 4%
Change 24% 29% 1%
All Properties
Condos
# of Transactions
AverageSales Price
MedianSales Price
% of REO Sales
Mid-Year 2010 137 $1,007,315 $611,750 7%Mid-Year 2011 204 $1,179,740 $660,000 9%
Change 49% 17% 8%
All Properties
Condos
MIAMI BEACH
Fisher IslandThe typical sale on prestigious Fisher Island remains a 3 bedroom, 3 bathroom residence with approximately 3,000 square feet and a waterfront view. Number of closed transactions and price per square foot pricing are both up considerably, with price per square foot increasing by an impressive 19%.
MIAMI BEACH
South of FifthWith just short of a whopping 50% growth
in number of transactions closed, inventory down, and a 9% increase in price per square
foot pricing - the most coveted condominium neighborhood of Miami Beach continues to
demonstrate its popularity with today’s buyers.
T R E N D S I 2 1
300 S Pointe Drive PH-4004, Miami BeachOffered at $4,700,000
7161 Fisher Island Drive, Fisher IslandOffered at $5,500,000O N E S O T H E B Y S R E A LT Y. C O M

2 2 I T R E N D S O N E S O T H E B Y S R E A LT Y. C O MO N E S O T H E B Y S R E A LT Y. C O M
I N D E P T H C O M M U N I T Y P R O F I L E S I N D E P T H C O M M U N I T Y P R O F I L E S
O N E S O T H E B Y S R E A LT Y. C O M
I N D E P T H C O M M U N I T Y P R O F I L E S
MIAMI BEACH
Sunset IslandsWaterfront sales remain strong in the Sunset
Islands. Although waterfront homes sold at the same pace in the first half of 2011 as in the first
half of 2010, both Average and Median Sales Prices have nearly doubled. A home on Sunset
Island I went under contract during the first half of 2011, closing in July for $19.8 million.
This was second highest sale in Miami-Dade County at time of publication.# of
TransactionsAverage
Sales PriceMedian
Sales Price% of
REO Sales
Waterfront Properties
Single Family Homes 1647 North View Drive, Miami Beach
Offered at $10,750,000
MIAMI BEACH
Palm, Star & Hibiscus IslandsOnly Star and Hibiscus have seen waterfront sales during the first six months of 2011. The amount of sales in Star Island tripled and Average Sales Price more than doubled. This April, the sale of 13 Star Island for $25.5 million became the highest sale for a Single Family home in Miami-Dade County in over 5 years.
CondosMid-Year 2010 6 $6,091,666 $7,175,000 -Mid-Year 2011 6 $9,707,000 $9,707,500 -
Change 0% 59% 35%
Waterfront Properties# of
TransactionsAverage
Sales PriceMedian
Sales Price% of
REO Sales
Single Family Homes211 N Coconut Lane, Palm Island
Offered at $3,495,000
MIAMI BEACH
Venetian,La Gorce Island Although there were no waterfront sales on La Gorce Island during the first half of 2011, the Venetian Islands saw an increase in activity compared to the first half of 2010. Not only did sales increase by 30% on the Venetians, but Average Sales Price increased by 16% and Median Sales Price increased by 28%.
Mid-Year 2010 11 $5,751,500 $5,200,000 -Mid-Year 2011 9 $2,507,000 $2,500,000 -
Change -18% -56% -52%
Mid-Year 2010 2 $2,400,000 $2,400,000 -Mid-Year 2011 2 $4,625,000 $4,625,000 -
Change 0% 93% 93%
Waterfront Properties# of
TransactionsAverage
Sales PriceMedian
Sales Price% of
REO Sales
Single Family Homes94 la Gorce Circle, Miami Beach
Offered at $12,900,000

T R E N D S I 2 3O N E S O T H E B Y S R E A LT Y. C O MO N E S O T H E B Y S R E A LT Y. C O M
I N D E P T H C O M M U N I T Y P R O F I L E S I N D E P T H C O M M U N I T Y P R O F I L E S
O N E S O T H E B Y S R E A LT Y. C O M
MIAMI BEACH
North Bay Road, Pinetree Drive
Although the amount of sales dropped by 27%, prices have significantly increased on North Bay Road and Pinetree Drive. Average and Median
Sales Prices increased by over 20% on North Bay Road. Pinetree Drive prices had the most growth in the first half of 2011, with Average and Median
Sales Prices more than doubling.
MIAMI BEACH
Indian CreekThere have been no sales at Indian Creek during the first half of 2011. There were 3 homes on the market in this private island at time of publication.
Mid-Year 2010 11 $3,128,000 $3,133,500 -Mid-Year 2011 8 $5,035,000 $4,921,000 -
Change -27% 61% 57%
Waterfront Properties# of
TransactionsAverage
Sales PriceMedian
Sales Price% of
REO Sales
Single Family Homes
Waterfront Properties# of
TransactionsAverage
Sales PriceMedian
Sales Price% of
REO Sales
Single Family Homes
Mid-Year 2010 1 $9,300,000 $9,300,000 -Mid-Year 2011 0 $0 $0 -
Change -100% -100% -100%
4580 North Bay Road, Miami BeachOffered at $18,975,000
17 Indian Creek Drive, Miami BeachOffered at $32,500,000
I N D E P T H C O M M U N I T Y P R O F I L E S

2 4 I T R E N D S
BAL HARBOUR GOLDEN BEACH BAY HARBOR ISLANDSAVENTURA SUNNY ISLES
North of Miami
10295 Collins Avenue #1706, Bal HarbourOffered at $1,750,000
O N E S O T H E B Y S R E A LT Y. C O M
I N D E P T H C O M M U N I T Y P R O F I L E S
MedianSales Price
AverageSales Price
# of Transactions
MedianSales Price
AverageSales Price
# of Transactions
Non-Waterfront Properties
SingleFamily Homes
# of Transactions
AverageSales Price
MedianSales Price
% of REO Sales
Mid-Year 2010 1 $3,000,000 $3,000,000 -
Mid-Year 2011 5 $1,982,500 $1,250,000 -
Change 400% -34% -58%
T R E N D S I 2 5
SingleFamily Homes
% of REO Sales
% of REO Sales
Condos
Waterfront Properties
Mid-Year 2010 49 $970,462 $600,000 6%Mid-Year 2011 82 $810,287 $465,000 5%
Change 67% -17% -23%
Mid-Year 2010 1 $2,800,000 $2,800,000 -Mid-Year 2011 - - - -
Change - - -
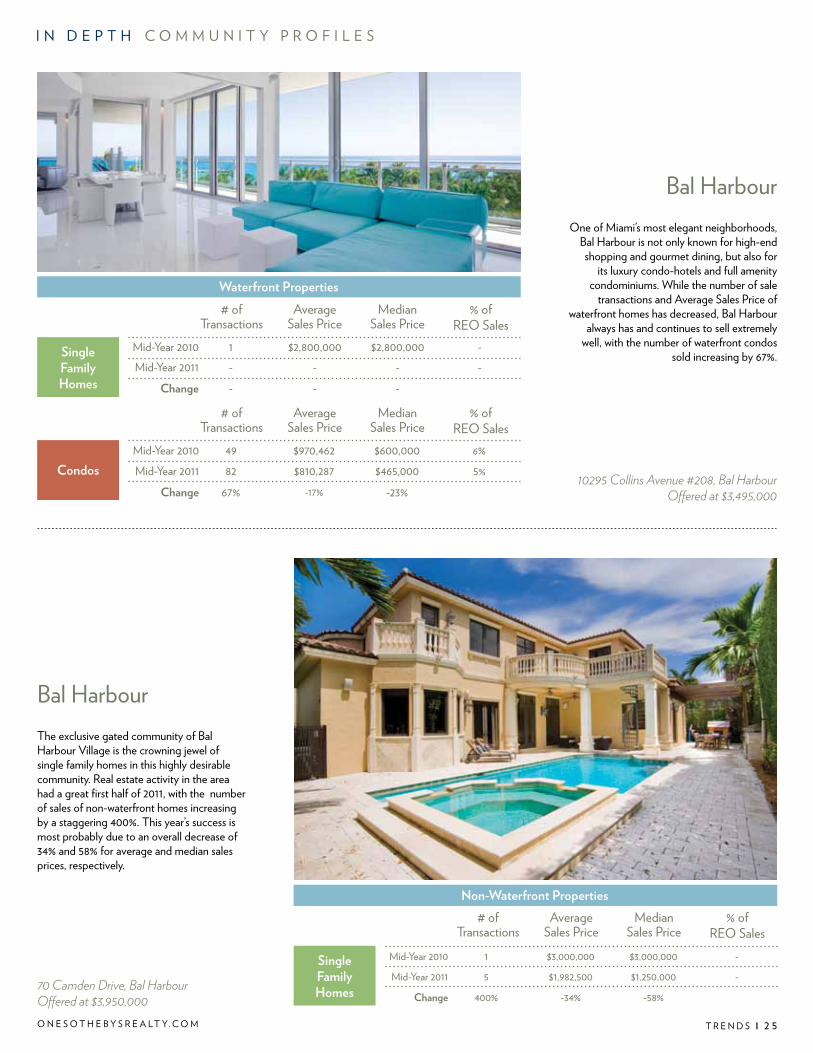
Bal HarbourOne of Miami’s most elegant neighborhoods,
Bal Harbour is not only known for high-end shopping and gourmet dining, but also for
its luxury condo-hotels and full amenity condominiums. While the number of sale
transactions and Average Sales Price of waterfront homes has decreased, Bal Harbour
always has and continues to sell extremely well, with the number of waterfront condos
sold increasing by 67%.
Bal HarbourThe exclusive gated community of Bal Harbour Village is the crowning jewel of single family homes in this highly desirable community. Real estate activity in the area had a great first half of 2011, with the number of sales of non-waterfront homes increasing by a staggering 400%. This year’s success is most probably due to an overall decrease of 34% and 58% for average and median sales prices, respectively.
10295 Collins Avenue #208, Bal HarbourOffered at $3,495,000
70 Camden Drive, Bal HarbourOffered at $3,950,000

O N E S O T H E B Y S R E A LT Y. C O M
I N D E P T H C O M M U N I T Y P R O F I L E S
2 6 I T R E N D S
Golden BeachWith the Atlantic on one side and the
intracoastal on the other, the exclusive Golden Beach is the only Miami-Dade County
community offering direct oceanfront luxury residences. With asking prices between $6 and $20 million, transactions of such properties are
scarce. However, there has been a significant increase (133%) in the number of intracoastal
waterfront properties sold since 2010, in spite of an increase of 90% for average sales price price . Transactions of non-waterfront
properties have increased by 50% while prices have remained relatively stable. There have
been no REO sales this year in Golden Beach, while the first half of 2010 the area saw 2 REO
sales of non-waterfront homes.Non-Waterfront Properties# of
TransactionsAverage
Sales PriceMedian
Sales Price% of
REO SalesMid-Year 2010 2 $725,000 $725,000 2Mid-Year 2011 3 $783,333 $890,000 0
Change 30% -3% -7%
# of Transactions
AverageSales Price
MedianSales Price
% of REO Sales
Mid-Year 2010 3 $1,900,000 $1,950,000 -Mid-Year 2011 7 $3,614,286 $2,500,000 -
Change 133% 90% 28%
Non-Waterfront Properties
Waterfront Properties
Single Family Homes
Single Family Homes
Bay Harbor IslandsLocated directly west of Bal Harbour and north of the Indian Creek Island, separated only by small waterways, Bay Harbor consists of two separate islands. The west island contains single family homes, some with stunning open bay views, while the east island contains a small business district, an A-rated public school, and primarily multi-family housing. While there were no sales of waterfront homes in the first half of 2010, there were 2 sales over $1 Million in the area in the first half of 2011.
AverageSales Price
MedianSales Price
% ofREO Sales
650 Golden Beach Drive, Golden BeachOffered at $2,750,000
10350 W Bay Harbor Drive, Bay Harbor IslandsOffered at $357,000
Waterfront Properties# of
Transactions
Single Family Homes
Mid-Year 2010 0 $0 $0 -Mid-Year 2011 2 $2,946,000 $2,946,000 -
Change 100% 100% 100%

O N E S O T H E B Y S R E A LT Y. C O M
I N D E P T H C O M M U N I T Y P R O F I L E S
T R E N D S I 2 7
AventuraWith inventory of waterfront condos in
Aventura dipping to just below 800, the supply of condos is at a 5-year low. In the
first 6 months of 2011, the number of closed transactions increased by an impressive 30%
versus the same time period in 2010, despite a minor 3% decrease in Average Sales Price.
Sunny IslesSunny Isles Beach has been the top destination for condo buyers in the last 2 years. Velocity continues to grow even while prices increase. Waterfront condominiums in the Sunny Isles area have shown an increased activity in the first semester of 2011, with the number of transactions increasing by almost one third from the same time period in 2010.
Mid-Year 2010 336 $376,796 $290,000 12%Mid-Year 2011 436 $366,510 $270,000 15%
Change 30% -3% -7%
Waterfront Properties# of
TransactionsAverage
Sales PriceMedian
Sales Price% of
REO Sales
Single Family HomesCondos
Waterfront Properties# of
TransactionsAverage
Sales PriceMedian
Sales Price% of
REO SalesMid-Year 2010 305 $472,033 $290,000 13%Mid-Year 2011 403 $505,047 $250,000 18%
Change 32% 7% -14%
Condos
Bellini at Williams Island, AventuraFrom $950,000 to $3,700,000
16047 Collins Avenue PH-3704, Sunny IslesOffered at $5,450,000

2 8 I T R E N D S
LAS OLAS ISLES HARBOR BEACH LAUDERDALE BY THE SEALIGHTHOUSE POINT RIO VISTA HILLSBORO BEACH
FORT LAUDERDALE BEACH VICTORIA PARKHOLLYWOOD & HALLANDALE BEACH CORAL RIDGE BAY COLONY
Fort Lauderdale
209 N Birch Road #1601, Fort LauderdaleOffered at $9,750,000

T R E N D S I 2 9O N E S O T H E B Y S R E A LT Y. C O M
I N D E P T H C O M M U N I T Y P R O F I L E S
Condos
# of Transactions
AverageSales Price
MedianSales Price
% of REO Sales
Waterfront Properties
SingleFamily Homes
# of Transactions
AverageSales Price
MedianSales Price
% of REO Sales
Mid-Year 2010 172 $992,063 $631,650 12%Mid-Year 2011 190 $1,098,336 $782,500 9%
Change 10% 11% 24%
Condos(1M+)
# of Transactions
AverageSales Price
MedianSales Price
% of REO Sales
Non-Waterfront Properties
Single Family Homes (1M+)
# of Transactions
AverageSales Price
MedianSales Price
% of REO Sales
Mid-Year 2010 5 $1,277,540 $1,125,000 -
Mid-Year 2011 7 $1,464,286 $1,300,000 -Change 40% 15% 16%
Mid-Year 2010 2 $1,112,500 $1,112,500 -
Mid-Year 2011 0 $0 $0 -Change -100% -100% -100%
Mid-Year 2010 651 $347,965 $247,000 13%Mid-Year 2011 734 $315,225 $230,000 13%
Change 13% -9% -7%
OVERVIEW
Fort LauderdaleSales of homes in this sector are up by 40%. Average and median sales prices have also increased by 15% and 16%, respectively. On the other hand, non-waterfront condos in this price range have seen no activity at all thus far in 2011.
OVERVIEW
Fort LauderdaleThere has been a flurry of activity for Fort
Lauderdale’s waterfront homes. Numbers of sales have increased by 10% over the same
period in 2010. Averages sales prices have also increased by 11%. The median sales prices have
increased by 24% and REOs have decreased, which paints a bright picture for the remainder
of 2011. Sales of waterfront condos have increased by 13% over the same time last year,
while both Average and Median Sales Prices have decreased.
4342 El Mar Drive #2, Fort LauderdaleOffered at $2,450,000
2798 NE 37 Drive, Fort LauderdaleOffered at $1,150,000

3 0 I T R E N D S
Waterfront Properties
Single Family Homes
Single Family Homes
Waterfront Properties
Single Family Homes
Single Family Homes
O N E S O T H E B Y S R E A LT Y. C O MO N E S O T H E B Y S R E A LT Y. C O M
I N D E P T H C O M M U N I T Y P R O F I L E S I N D E P T H C O M M U N I T Y P R O F I L E S
The exclusive community of Harbor Beach, boasting deep water dockage and a private beach club, has seen an increase in sales of 38% in the first 6 months of 2011. The Average Sales Price was down 18%, while Median Sales Price was up 9%. Transactions of non-waterfront properties in Harbor Beach have more than doubled since 2010. Average Sales Price is up 26% and Median Sales Price is up 18%.
FORT LAUDERDALE
Harbor Beach
FORT LAUDERDALE
Las Olas IslesThese exclusive waterfront finger isles off Las Olas Boulevard have seen an increase
of 60% in sales, which may be due to the prime location and attractive prices. Average
Sales Price is down by 11%. The number of non waterfront home sales off Las Olas has
maintained from this time last year. Average price is down 12% and median price is up 26%.
Non-Waterfront Properties# of
TransactionsAverage
Sales PriceMedian
Sales Price% of
REO SalesMid-Year 2010 3 $691,667 $585,000 -Mid-Year 2011 7 $874,286 $693,000 -
Change 133% 26% 18%
# of Transactions
AverageSales Price
MedianSales Price
% of REO Sales
Mid-Year 2010 8 $2,353,875 $1,462,500 -
Mid-Year 2011 11 $1,923,182 $1,600,000 -Change 38% -18% 9%
Non-Waterfront Properties
Waterfront Properties
Single Family Homes
Single Family Homes
# of Transactions
AverageSales Price
MedianSales Price
% of REO Sales
Non-Waterfront Properties# of
TransactionsAverage
Sales PriceMedian
Sales Price% of
REO Sales
Waterfront Properties
Single Family Homes
Single Family Homes
Mid-Year 2010 3 $835,900 $575,000 -Mid-Year 2011 3 $731,667 $725,000 -
Change 0% -12% 26%
Mid-Year 2010 25 $2,091,952 $1,450,000 4%Mid-Year 2011 40 $1,852,074 $1,460,000 13%
Change 60% -11% 1%
Non-Waterfront Properties
2550 Del Lago Drive, Fort LauderdaleOffered at $12,000,000
540 Lido Drive, Fort LauderdaleOffered at $2,495,000

O N E S O T H E B Y S R E A LT Y. C O MO N E S O T H E B Y S R E A LT Y. C O M
I N D E P T H C O M M U N I T Y P R O F I L E S I N D E P T H C O M M U N I T Y P R O F I L E S
Waterfront Properties# of
TransactionsAverage
Sales PriceMedian
Sales Price% of
REO SalesMid-Year 2010 23 $779,217 $707,000 9%Mid-Year 2011 39 $939,806 $755,000 5%
Change 70% 21% 7%
Non-Waterfront Properties# of
TransactionsAverage
Sales PriceMedian
Sales Price% of
REO SalesMid-Year 2010 18 $298,419 $310,000 11%
Mid-Year 2011 18 $330,972 $327,500 11%Change - 11% 6%
Single Family Homes
Single Family Homes
T R E N D S I 3 1
FORT LAUDERDALE
Lighthouse PointAs we move to the north of Fort Lauderdale, Lighthouse Point sales are up 70%, Average Sales Prices have seen increases of 21% and Median Sales Prices are up 7%. The number of non-waterfront sales have remained consistent with the mid-year 2010 sales, despite Average Sales Prices increasing by 11% and Median Sales Prices up by 6%.
FORT LAUDERDALE
Lauderdale by the SeaThe number of sales are down on this barrier
island. Average Sales Price has increased by 158%. The number of REO sales have
increased in waterfront and non-waterfront markets. Non-waterfront property sales are
down 25% in the area. Overall Average Sales Prices are down 62% and Median Sales Prices
are down 58%.
# of Transactions
AverageSales Price
MedianSales Price
% of REO Sales
Non-Waterfront Properties# of
TransactionsAverage
Sales PriceMedian
Sales Price% of
REO Sales
Waterfront Properties
Single Family Homes
Single Family Homes
Mid-Year 2010 8 $987,187 $855,000 13%Mid-Year 2011 6 $373,400 $355,450 33%
Change -25% -62% -58%
Mid-Year 2010 11 $452,045 $431,000 -Mid-Year 2011 5 $1,167,378 $860,000 20%
Change -55% 158% 100%
Non-Waterfront Properties
1600 S Ocean Blvd #1001, Fort LauderdaleOffered at $1,590,000
3930 NE 31 Avenue, Fort LauderdaleOffered at $1,299,000
O N E S O T H E B Y S R E A LT Y. C O MO N E S O T H E B Y S R E A LT Y. C O M
I N D E P T H C O M M U N I T Y P R O F I L E S I N D E P T H C O M M U N I T Y P R O F I L E S
3 2 I T R E N D S
Single Family Homes
Single Family Homes
Single Family Homes
Single Family Homes
O N E S O T H E B Y S R E A LT Y. C O MO N E S O T H E B Y S R E A LT Y. C O M
I N D E P T H C O M M U N I T Y P R O F I L E S I N D E P T H C O M M U N I T Y P R O F I L E S
Waterfront Properties# of
TransactionsAverage
Sales PriceMedian
Sales Price% of
REO SalesMid-Year 2010 10 $1,364,215 $1,277,950 10%Mid-Year 2011 8 $1,062,863 $1,076,450 -
Change -20% -22% -16%
Non-Waterfront Properties# of
TransactionsAverage
Sales PriceMedian
Sales Price% of
REO SalesMid-Year 2010 15 $440,667 $390,000 13%Mid-Year 2011 11 $572,455 $570,000 18%
Change -27% 30% 46%
Single Family Homes
Single Family Homes
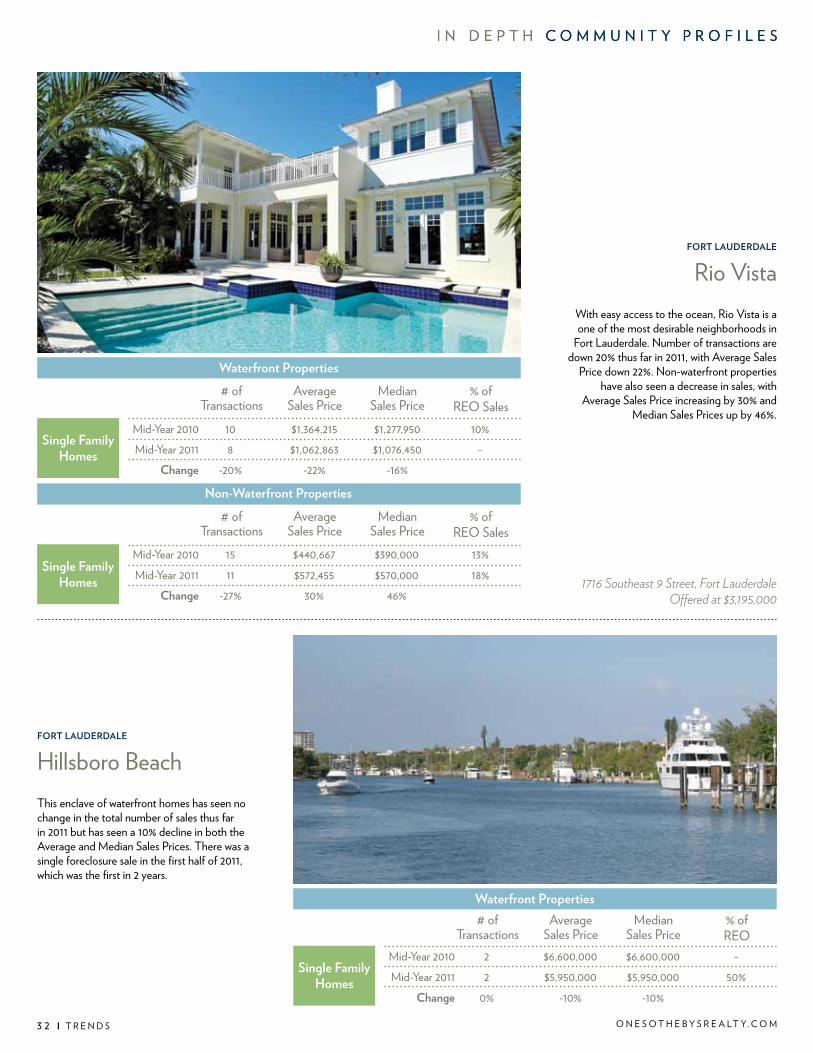
FORT LAUDERDALE
Rio VistaWith easy access to the ocean, Rio Vista is a one of the most desirable neighborhoods in
Fort Lauderdale. Number of transactions are down 20% thus far in 2011, with Average Sales
Price down 22%. Non-waterfront properties have also seen a decrease in sales, with
Average Sales Price increasing by 30% and Median Sales Prices up by 46%.
FORT LAUDERDALE
Hillsboro BeachThis enclave of waterfront homes has seen no change in the total number of sales thus far in 2011 but has seen a 10% decline in both the Average and Median Sales Prices. There was a single foreclosure sale in the first half of 2011, which was the first in 2 years.
Mid-Year 2010 2 $6,600,000 $6,600,000 -Mid-Year 2011 2 $5,950,000 $5,950,000 50%
Change 0% -10% -10%
Waterfront Properties# of
TransactionsAverage
Sales PriceMedian
Sales Price% ofREO
Single Family Homes
1716 Southeast 9 Street, Fort LauderdaleOffered at $3,195,000

T R E N D S I 3 3
Waterfront Properties
Single Family Homes
Single Family Homes
Waterfront Properties
Single Family Homes
Single Family Homes
O N E S O T H E B Y S R E A LT Y. C O MO N E S O T H E B Y S R E A LT Y. C O M
I N D E P T H C O M M U N I T Y P R O F I L E S I N D E P T H C O M M U N I T Y P R O F I L E S
O N E S O T H E B Y S R E A LT Y. C O MO N E S O T H E B Y S R E A LT Y. C O M
I N D E P T H C O M M U N I T Y P R O F I L E S I N D E P T H C O M M U N I T Y P R O F I L E S
Waterfront Properties
# of Transactions
AverageSales Price
MedianSales Price
% of REO Sales
Mid-Year 2010 1 $955,000 $955,000 -Mid-Year 2011 - - - -
Change - - -
Non-Waterfront Properties
# of Transactions
AverageSales Price
MedianSales Price
% of REO Sales
Mid-Year 2010 32 $368,107 $315,500 22%Mid-Year 2011 25 $399,297 $330,000 4%
Change -22% 8% 5%
Single Family Homes
Single Family Homes
Non-Waterfront Properties# of
TransactionsAverage
Sales PriceMedian
Sales Price% of
REO SalesMid-Year 2010 6 $581,483 $533,450 -Mid-Year 2011 8 $715,162 $539,000 13%
Change 33% 23% 1%
# of Transactions
AverageSales Price
MedianSales Price
% of REO Sales
Mid-Year 2010 222 $400,134 $310,000 7%Mid-Year 2011 232 $369,144 $247,500 9%
Change 5% -8% -20%
Non-Waterfront Properties
FORT LAUDERDALE
Victoria ParkThere have been no sales of waterfront
homes so far this year in Victoria Park. In non-waterfront homes, sales are down by 22%,
with Average Sales Price up 8% and Median Sales Price up 5%. The non-waterfront homes continue to be active with a decrease in sales
over this same time period last year, but REO inventory has been absorbed and prices are
now on the rise.
FORT LAUDERDALE
Fort Lauderdale BeachThe total number of waterfront homes sold in Fort Lauderdale Beach in mid-year 2011 has increased by 5%. Average Sales Price is down 8% and Median Sales Price is down 20%, which could be due to the number of REOs being slightly higher than this time last year. Non-waterfront homes in this sector have performed well this year, with the number of transactions up 33% and Average Sales Price up 23%.
Waterfront Properties
Single Family Homes
Single Family Homes
101 S Ft Lauderdale Bch #2801, Fort LauderdaleOffered at $2,999,000
431 N Victoria Park Road, Fort LauderdaleOffered at $979,000
Condos
# of Transactions
AverageSales Price
MedianSales Price
% of REO Sales
Non-Waterfront Properties
SingleFamily Homes
# of Transactions
AverageSales Price
MedianSales Price
% of REO Sales
Mid-Year 2010 764 $152,444 $120,250 40%Mid-Year 2011 734 $148,366 $111,000 39%
Change -4% -3% -8%
Mid-Year 2010 450 $86,578 $66,000 36%Mid-Year 2011 605 $85,650 $63,000 37%
Change 34% -1% -5%
Condos
SingleFamily Homes
# of Transactions
AverageSales Price
MedianSales Price
% of REO Sales
Waterfront Properties# of
TransactionsAverage
Sales PriceMedian
Sales Price% of
REO SalesMid-Year 2010 18 $1,206,042 $1,227,500 -Mid-Year 2011 12 $1,357,806 $1,247,444 -
Change -33% 13% 2%
Mid-Year 2010 634 $228,072 $170,000 21%Mid-Year 2011 760 $223,789 $158,000 26%
Change 20% -2% -7%
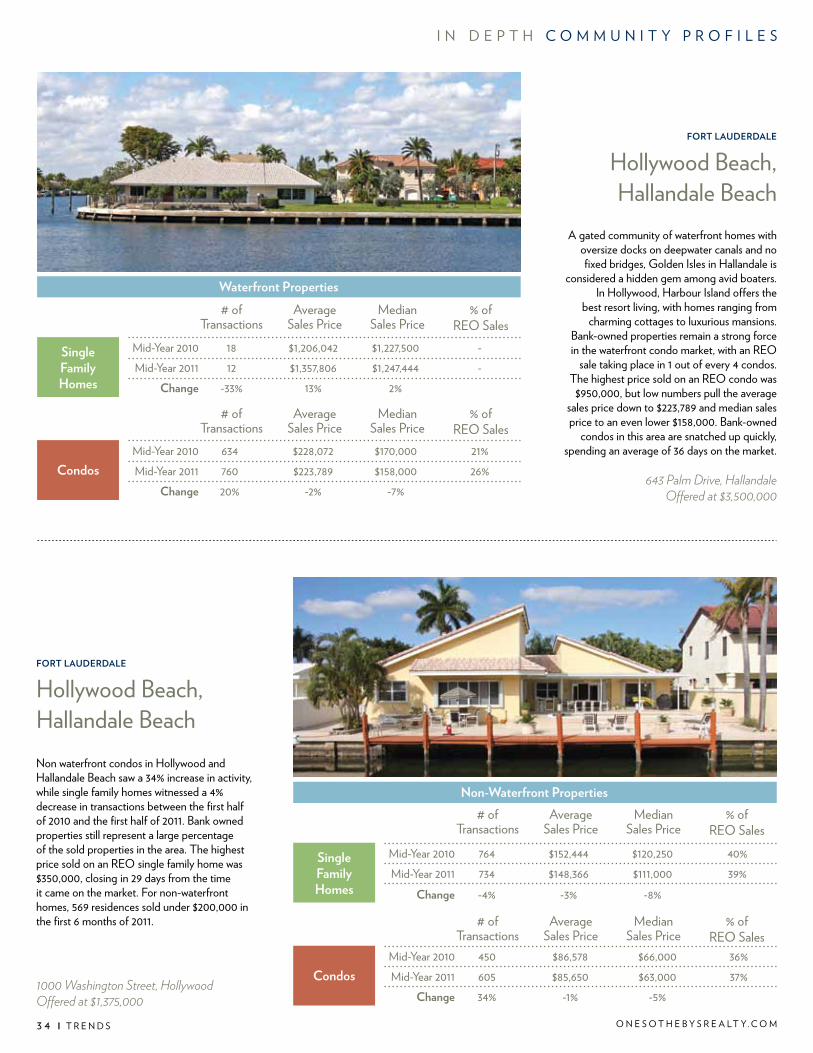
FORT LAUDERDALE
Hollywood Beach,Hallandale BeachNon waterfront condos in Hollywood and Hallandale Beach saw a 34% increase in activity, while single family homes witnessed a 4% decrease in transactions between the first half of 2010 and the first half of 2011. Bank owned properties still represent a large percentage of the sold properties in the area. The highest price sold on an REO single family home was $350,000, closing in 29 days from the time it came on the market. For non-waterfront homes, 569 residences sold under $200,000 in the first 6 months of 2011.
FORT LAUDERDALE
Hollywood Beach,Hallandale Beach
A gated community of waterfront homes with oversize docks on deepwater canals and no fixed bridges, Golden Isles in Hallandale is
considered a hidden gem among avid boaters. In Hollywood, Harbour Island offers the
best resort living, with homes ranging from charming cottages to luxurious mansions.
Bank-owned properties remain a strong force in the waterfront condo market, with an REO
sale taking place in 1 out of every 4 condos. The highest price sold on an REO condo was
$950,000, but low numbers pull the average sales price down to $223,789 and median sales price to an even lower $158,000. Bank-owned
condos in this area are snatched up quickly, spending an average of 36 days on the market.
3 4 I T R E N D S
1000 Washington Street, HollywoodOffered at $1,375,000
643 Palm Drive, HallandaleOffered at $3,500,000
O N E S O T H E B Y S R E A LT Y. C O M
I N D E P T H C O M M U N I T Y P R O F I L E S
Condos
SingleFamily Homes

T R E N D S I 3 5
FORT LAUDERDALE
Coral Ridge, The LandingsThe numbers of homes sold in Coral Ridge and The Landings has increased significantly by 59% and prices have seen an upward trend. Non-waterfront homes have kept pace with their waterfront counterparts, also experiencing increased number of sales and increased Average and Median Sales Prices.
Waterfront Properties
Non-Waterfront Properties# of
TransactionsAverage
Sales PriceMedian
Sales Price% of
REO SalesMid-Year 2010 33 $538,693 $480,000 9%Mid-Year 2011 41 $606,341 $470,000 17%
Change 24% 13% -2%
# of Transactions
AverageSales Price
MedianSales Price
% of REO Sales
Mid-Year 2010 27 $919,933 $705,000 11%Mid-Year 2011 43 $1,018,573 $875,000 12%
Change 59% 11% 24%
Non-Waterfront Properties
Single Family Homes
Single Family Homes
Mid-Year 2010 4 $2,606,875 $2,601,250 -
Mid-Year 2011 0 0 0 -Change -100% - -
Waterfront Properties# of
TransactionsAverage
Sales PriceMedian
Sales Price% of
REO Sales
Single Family Homes
FORT LAUDERDALE
Bay ColonyThis first half of 2011 has been quiet in this
private enclave of waterfront homes, with 11 properties on the market at time of publication.
30 N Compass Drive, Fort LauderdaleOffered at $1,750,000
5961 Bayview Drive, Fort LauderdaleOffered at $875,000
O N E S O T H E B Y S R E A LT Y. C O M
I N D E P T H C O M M U N I T Y P R O F I L E S
Waterfront Properties

Bellini at Williams Island, AventuraFrom $950,000 to $3,700,000
This material is based upon information that we consider reliable, but because it has been supplied by third parties, we cannot represent that it is accurate or complete, and it should not be relied upon as such. This offering is subject to errors, omissions, changes, including price, or withdrawal without notice. ©MMXI Sotheby’s International Realty Affiliates LLC. All Rights Reserved. Sotheby’s International Realty® is a licensed trademark to Sotheby’s International Realty Affiliates LLC. An Equal Opportunity Company. Equal Housing Opportunity. Each Office is Independently Owned And Operated.
Everything about Bellini is the best there is.
onesothebysrealty.com