trends - how is the south florida real estate market performing?
DESCRIPTION
What is happening in South Florida real estate market? ONE | Sotheby's International Realty Trends examines the market in detail.TRANSCRIPT

2015R E A L E S T A T E M A R K E T R E P O R T
O N E S O T H E B Y S R E A L T Y . C O M
14 | 2015 TRENDS Market Report
Three Hundred Collins, South Beach | 300Collins.com
For assistance with your real estate needs, please contact:
Enrique J. TejeraGlobal Real Estate AdvisorONE Sotheby’s International [email protected]
SearchMiamiBeach.com
For more information, please visit:

ONE Sotheby’s International Realty | 3
Looking back on ONE Sotheby’s International Realty’s seven years of operation, it’s telling to hear how the South Florida real estate market conversation now takes place with a drastically different tone. In the very first TRENDS market report published in 2010, it is stated that the general mood at the time was a sense of cautious optimism. Fast-forward to 2015, the year-to-year improvement of the market has led South Florida to become one of the most sought-after residential destinations in the world. Miami was ranked the happiest city to work in by Forbes Magazine and is now considered one of the top ten cities that matter to ultra-high-net-worth investors. By the same token, Fort Lauderdale, a prime destination for yacht owners and boating connoisseurs, is experiencing great demand due to its many canals and waterfront living options.
An ever-evolving real estate market must be analyzed in ever-evolving ways: this year’s report was prepared in conjunction with Integra Realty Resources (IRR) – Miami\Palm Beach, one of the nation’s leading real estate consulting firms. This joint publication is a new venture meant to provide insight into residential markets in Miami-Dade and Broward Counties.
Our two firms collaborated to provide this annual report to foster further dialogue regarding emerging market conditions at the submarket level. We endeavored to provide actionable insight into the direction of these various submarkets without the typical hyperbole or marketing fanfare.
IRR Miami was aided by interviews with ONE Sotheby’s International Realty associates and others in the marketplace, who provided important insight into the drivers in these various submarkets. To provide a consistent format for comparison, the team revised the methodology for quantifying the condominium value changes (see Methodology on page 5) and developed comparative statistics for the single-family, waterfront and non-waterfront markets.
The information contained herein is general to the market and should not be construed to represent advice on a specific property. We strongly encourage interaction with ONE Sotheby’s International Realty agents to provide relevant, property-specific advice. This report is meant to provide an overview of the major markets and submarkets for comparative purposes only and to frame some reasonable dimension of market activity and direction in the year to come.
We hope you find the report useful and even insightful, as you explore one of the most dynamic housing markets in the United States today. We stand ready to assist with further questions and comments and hope your feedback will improve future annual and quarterly reports.
Daniel de la Vega Anthony M. Graziano, MAI, CRE President & Managing Partner Senior Managing Director ONE Sotheby’s International Realty Integra Realty Resources
4 | 2015 TRENDS Market Report
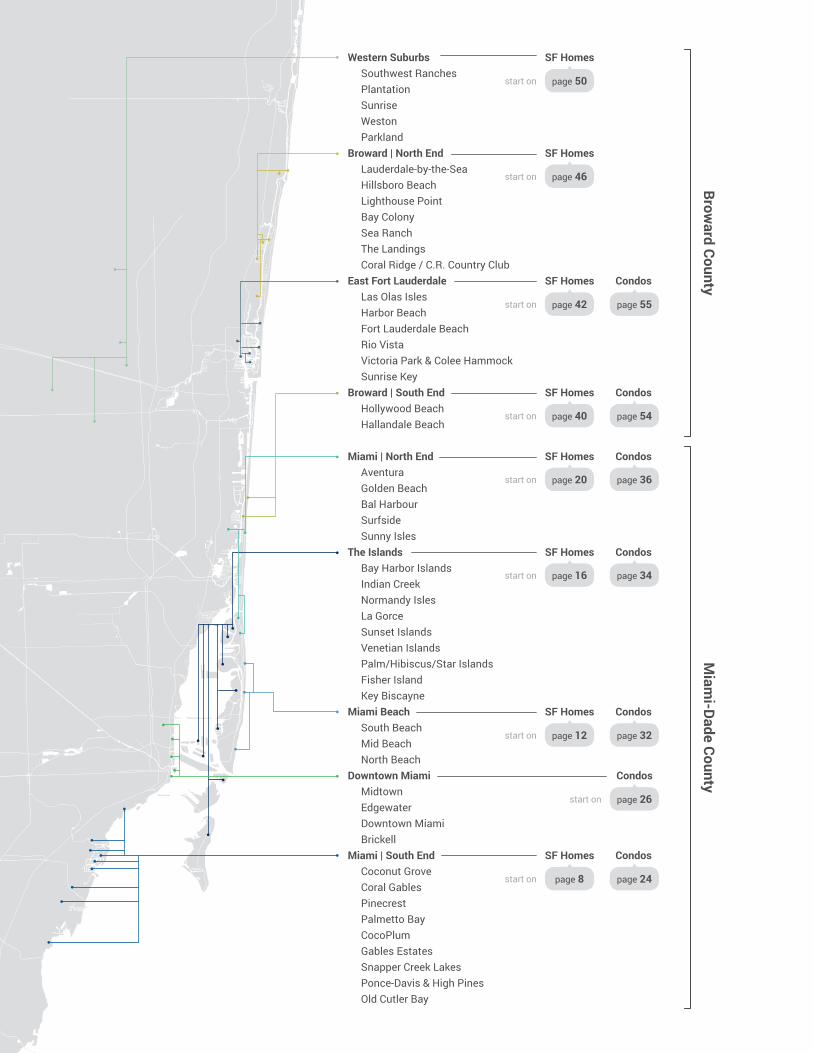
Western Suburbs Southwest Ranches Plantation Sunrise Weston ParklandBroward | North End Lauderdale-by-the-Sea Hillsboro Beach Lighthouse Point Bay Colony Sea Ranch The Landings Coral Ridge / C.R. Country Club East Fort Lauderdale Las Olas Isles Harbor Beach Fort Lauderdale Beach Rio Vista Victoria Park & Colee Hammock Sunrise KeyBroward | South End Hollywood Beach Hallandale Beach
Miami | North End Aventura Golden Beach Bal Harbour Surfside Sunny IslesThe Islands Bay Harbor Islands Indian Creek Normandy Isles La Gorce Sunset Islands Venetian Islands Palm/Hibiscus/Star Islands Fisher Island Key BiscayneMiami Beach South Beach Mid Beach North BeachDowntown Miami Midtown Edgewater Downtown Miami BrickellMiami | South End Coconut Grove Coral Gables Pinecrest Palmetto Bay CocoPlum Gables Estates Snapper Creek Lakes Ponce-Davis & High Pines Old Cutler Bay
SF Homes
SF Homes
SF Homes Condos
SF Homes Condos
SF Homes Condos
SF Homes Condos
SF Homes Condos
Condos
SF Homes Condos
Broward County
Miam
i-Dade County
page 50
page 46
page 42 page 55
page 40
page 20 page 36
page 16 page 34
page 12 page 32
page 26
page 8 page 24start on
start on
start on
start on
start on
start on
start on
start on
start on
page 54
ONE Sotheby’s International Realty | 5
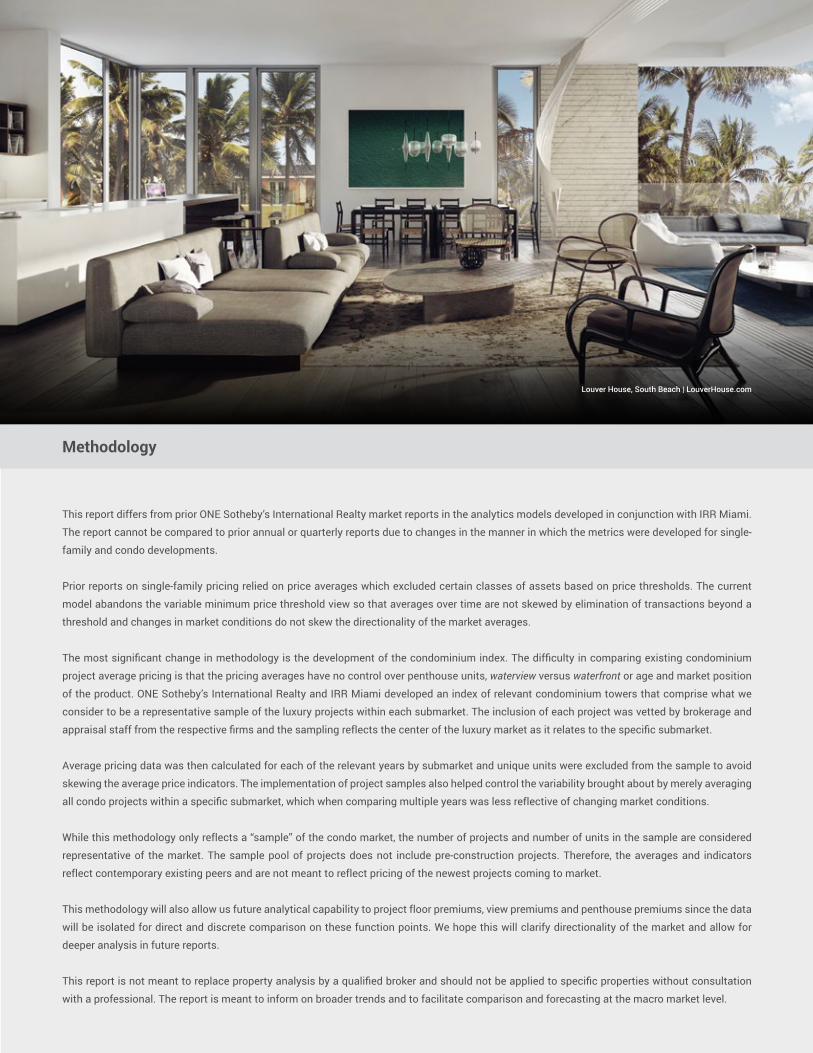
Methodology
This report differs from prior ONE Sotheby’s International Realty market reports in the analytics models developed in conjunction with IRR Miami.
The report cannot be compared to prior annual or quarterly reports due to changes in the manner in which the metrics were developed for single-
family and condo developments.
Prior reports on single-family pricing relied on price averages which excluded certain classes of assets based on price thresholds. The current
model abandons the variable minimum price threshold view so that averages over time are not skewed by elimination of transactions beyond a
threshold and changes in market conditions do not skew the directionality of the market averages.
The most significant change in methodology is the development of the condominium index. The difficulty in comparing existing condominium
project average pricing is that the pricing averages have no control over penthouse units, waterview versus waterfront or age and market position
of the product. ONE Sotheby’s International Realty and IRR Miami developed an index of relevant condominium towers that comprise what we
consider to be a representative sample of the luxury projects within each submarket. The inclusion of each project was vetted by brokerage and
appraisal staff from the respective firms and the sampling reflects the center of the luxury market as it relates to the specific submarket.
Average pricing data was then calculated for each of the relevant years by submarket and unique units were excluded from the sample to avoid
skewing the average price indicators. The implementation of project samples also helped control the variability brought about by merely averaging
all condo projects within a specific submarket, which when comparing multiple years was less reflective of changing market conditions.
While this methodology only reflects a “sample” of the condo market, the number of projects and number of units in the sample are considered
representative of the market. The sample pool of projects does not include pre-construction projects. Therefore, the averages and indicators
reflect contemporary existing peers and are not meant to reflect pricing of the newest projects coming to market.
This methodology will also allow us future analytical capability to project floor premiums, view premiums and penthouse premiums since the data
will be isolated for direct and discrete comparison on these function points. We hope this will clarify directionality of the market and allow for
deeper analysis in future reports.
This report is not meant to replace property analysis by a qualified broker and should not be applied to specific properties without consultation
with a professional. The report is meant to inform on broader trends and to facilitate comparison and forecasting at the macro market level.
Louver House, South Beach | LouverHouse.com
6 | 2015 TRENDS Market Report
Luxury SpotlightMiami-DadeSingle-Family Homes
General Statistics
The Miami-Dade housing market offers a broad
variety of single-family, attached and condo
real estate options. The general market has
experienced a significant recovery since 2011,
which dramatically increased through 2014.
The recent Case-Schiller index lists Miami as
one of the top two fastest growing housing
markets in terms of the CS value change index,
nearly double the national average. This trend
is expected to continue in 2015 due to a lack
of new, single-family homebuilding other than
spot-lot redevelopment, which will add major
inventory to level off pricing. These changes
are occurring across every value spectrum,
but none more dramatically than in the luxury
housing market segment.
There is very little developable land in Miami
and essentially no vacant land within the luxury
markets east of I-95. This is giving rise to tear-
down and redevelopment and is accelerating
the value appreciation within these markets.
The existing, single-family housing stock will
likely outperform the Florida housing market.
Observers lament that these rapid increases
in pricing are leading to an “affordability gap”,
where new residents cannot afford to own a
single-family home. This hurts Miami’s ability
to attract major employers and increases cost
of living, both of which could negatively affect
employment growth. Luxury markets, however,
are decoupled from employment growth.
We project the luxury, single-family market
will remain strong. While global economic
conditions are shifting, which may extend
market times, the level of demand for luxury,
single-family far outweighs current supply.
In 2014, the dominant trend was continued
price increases with fewer transactions. We
expect this will continue into 2015.
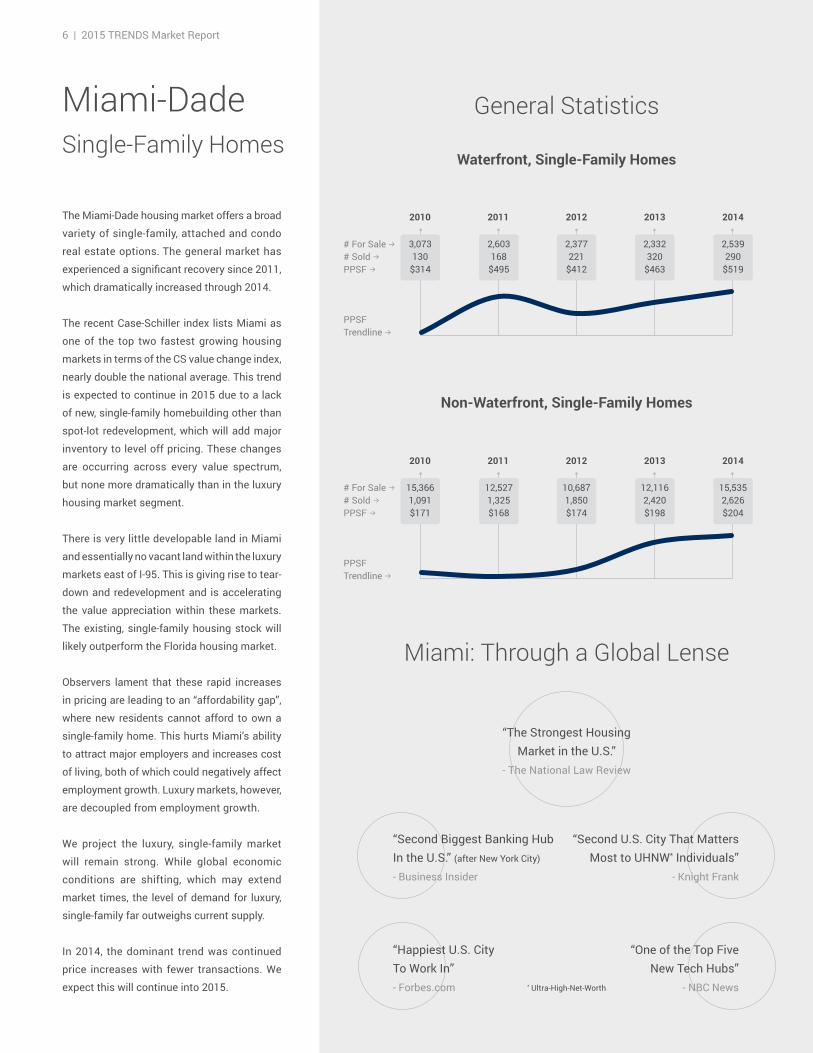
Miami: Through a Global Lense
“Happiest U.S. City To Work In”- Forbes.com
“Second Biggest Banking Hub In the U.S.” (after New York City)
- Business Insider
“One of the Top Five New Tech Hubs”
- NBC News
“The Strongest HousingMarket in the U.S.”
- The National Law Review
Non-Waterfront, Single-Family Homes
2010 2011 2012 2013 2014
15,366 1,091$171
12,527 1,325$168
10,687 1,850$174
12,116 2,420$198
15,535 2,626$204
# For Sale b# Sold bPPSF b
PPSF Trendline b
Waterfront, Single-Family Homes
2010 2011 2012 2013 2014
3,073 130
$314
2,603168
$495
2,377 221
$412
2,332 320
$463
2,539 290
$519
# For Sale b# Sold bPPSF b
PPSF Trendline b
“Second U.S. City That Matters Most to UHNW* Individuals”
- Knight Frank
* Ultra-High-Net-Worth

ONE Sotheby’s International Realty | 7
Luxury Spotlight
$1M to $5M TransactionsAverage Home Price
$5M to $10M TransactionsAverage Home Price
$10M+ TransactionsAverage Home Price
2010 2011 2012 2013 2014
$1,8
56,0
00
$1,8
78,0
00
$1,8
49,0
00
$1,8
71,0
00
$1,8
83,0
00
h
112
h
4,036
h
123
h
3,228
# Sold
# For Sale
h
288
h
3,046
h
280
h
3,363
h
171
h
2,856
2010 2011 2012 2013 2014
$6,7
50,0
00
$6,4
35,0
00
$5,9
23,0
00
$6,6
28,0
00
$6,8
17,0
00h
1
h
407
h
13
h
385
# Sold
# For Sale
h
15
h
408
h
23
h
459
h
12
h
466
2010 2011 2012 2013 2014
N/A
$17,
120,
000
$14,
486,
000
$15,
184,
000
$18,
274,
000
h
0
h
222
h
6
h
227
# Sold
# For Sale
h
6
h
277
h
6
h
350
h
5
h
268
9405 Old Cutler Lane, Coral Gables
Avg.
Hom
e Pr
ice
Tren
dlin
eh Av
g. H
ome
Pric
e Tr
endl
ine
h Avg.
Hom
e Pr
ice
Tren
dlin
eh
8 | 2015 TRENDS Market Report
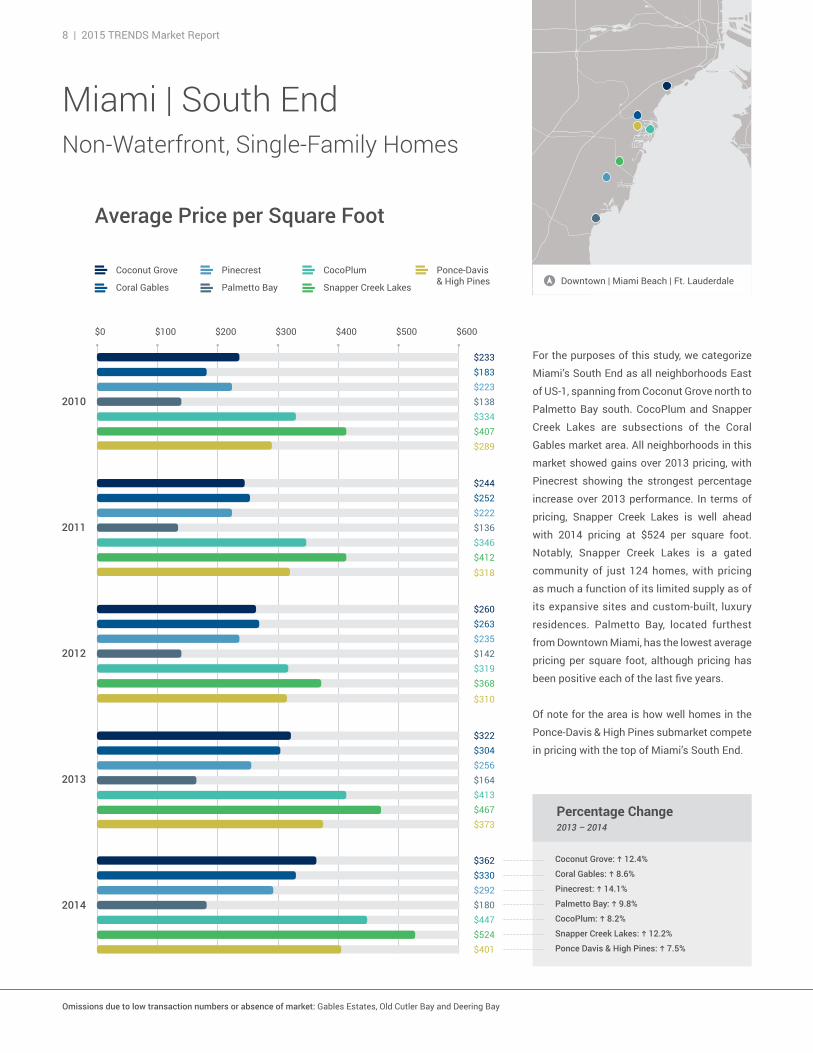
Miami | South EndNon-Waterfront, Single-Family Homes
Downtown | Miami Beach | Ft. LauderdaleCoconut Grove
Coral Gables
$600$500$400$300$200$100$0
Pinecrest
Palmetto Bay Snapper Creek Lakes
CocoPlum
$233$183$223$138$334$407$289
$244$252$222$136$346$412$318
$330$292$180$447$524$401
$260$263$235$142$319$368
$310
$322$304$256$164$413$467$373
Ponce-Davis& High Pines
Average Price per Square Foot
Coconut Grove: g 12.4%
Percentage Change2013 – 2014
For the purposes of this study, we categorize
Miami’s South End as all neighborhoods East
of US-1, spanning from Coconut Grove north to
Palmetto Bay south. CocoPlum and Snapper
Creek Lakes are subsections of the Coral
Gables market area. All neighborhoods in this
market showed gains over 2013 pricing, with
Pinecrest showing the strongest percentage
increase over 2013 performance. In terms of
pricing, Snapper Creek Lakes is well ahead
with 2014 pricing at $524 per square foot.
Notably, Snapper Creek Lakes is a gated
community of just 124 homes, with pricing
as much a function of its limited supply as of
its expansive sites and custom-built, luxury
residences. Palmetto Bay, located furthest
from Downtown Miami, has the lowest average
pricing per square foot, although pricing has
been positive each of the last five years.
Of note for the area is how well homes in the
Ponce-Davis & High Pines submarket compete
in pricing with the top of Miami’s South End.
$362
Ponce Davis & High Pines: g 7.5%
Pinecrest: g 14.1%
Coral Gables: g 8.6%
Palmetto Bay: g 9.8%
Snapper Creek Lakes: g 12.2%
CocoPlum: g 8.2%
Omissions due to low transaction numbers or absence of market: Gables Estates, Old Cutler Bay and Deering Bay
ONE Sotheby’s International Realty | 9
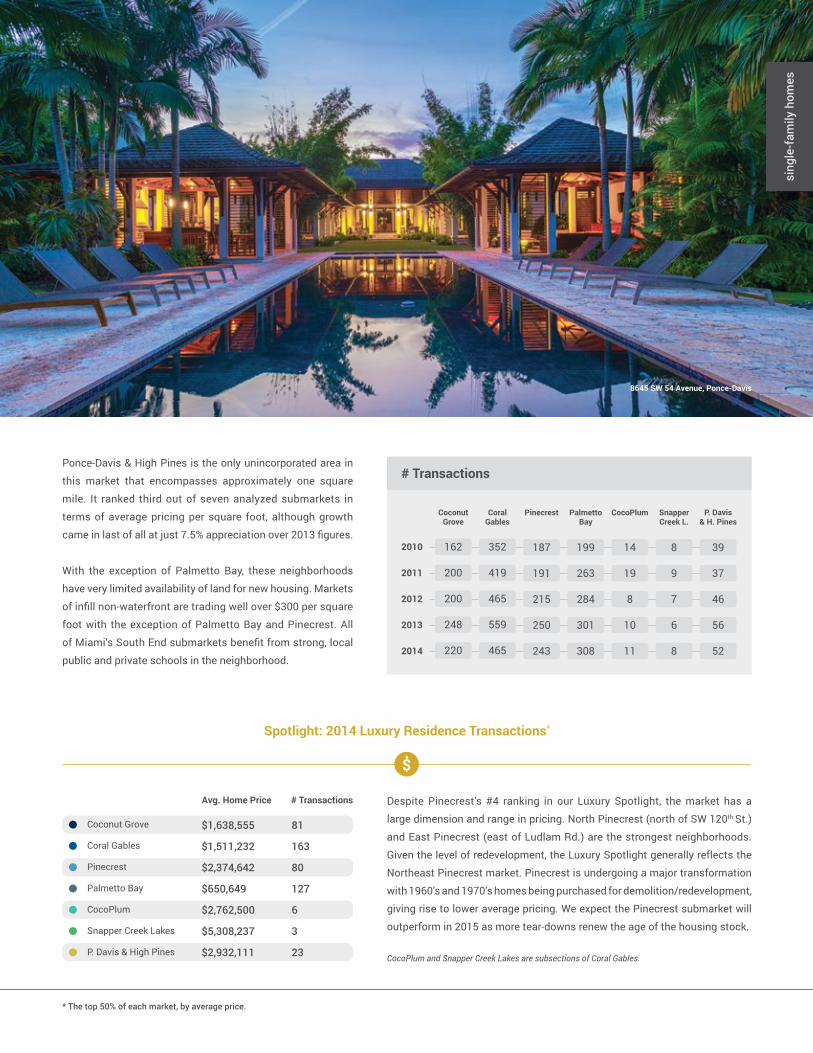
Despite Pinecrest’s #4 ranking in our Luxury Spotlight, the market has a
large dimension and range in pricing. North Pinecrest (north of SW 120th St.)
and East Pinecrest (east of Ludlam Rd.) are the strongest neighborhoods.
Given the level of redevelopment, the Luxury Spotlight generally reflects the
Northeast Pinecrest market. Pinecrest is undergoing a major transformation
with 1960’s and 1970’s homes being purchased for demolition/redevelopment,
giving rise to lower average pricing. We expect the Pinecrest submarket will
outperform in 2015 as more tear-downs renew the age of the housing stock.
sing
le-f
amily
hom
es
# Transactions
Coconut Grove
187 199 14 8 39
Coral Gables
191 263 19 9 37
Pinecrest
215 284 8 7 46
Palmetto Bay
250 301 10 6 56
CocoPlum
243 308 11 8 52
Snapper Creek L.
P. Davis & H. Pines
2010
2011
2012
2013
2014
162 352
200 419
200 465
248 559
220 465
Ponce-Davis & High Pines is the only unincorporated area in
this market that encompasses approximately one square
mile. It ranked third out of seven analyzed submarkets in
terms of average pricing per square foot, although growth
came in last of all at just 7.5% appreciation over 2013 figures.
With the exception of Palmetto Bay, these neighborhoods
have very limited availability of land for new housing. Markets
of infill non-waterfront are trading well over $300 per square
foot with the exception of Palmetto Bay and Pinecrest. All
of Miami’s South End submarkets benefit from strong, local
public and private schools in the neighborhood.
Coconut Grove
Coral Gables
Pinecrest
Palmetto Bay
CocoPlum
Snapper Creek Lakes
P. Davis & High Pines
Avg. Home Price # Transactions
$1,638,555 81
$1,511,232 163
$2,374,642 80
$650,649 127
$2,762,500 6
$5,308,237 3
$2,932,111 23
8645 SW 54 Avenue, Ponce-Davis
Spotlight: 2014 Luxury Residence Transactions*
* The top 50% of each market, by average price.
CocoPlum and Snapper Creek Lakes are subsections of Coral Gables.
10 | 2015 TRENDS Market Report
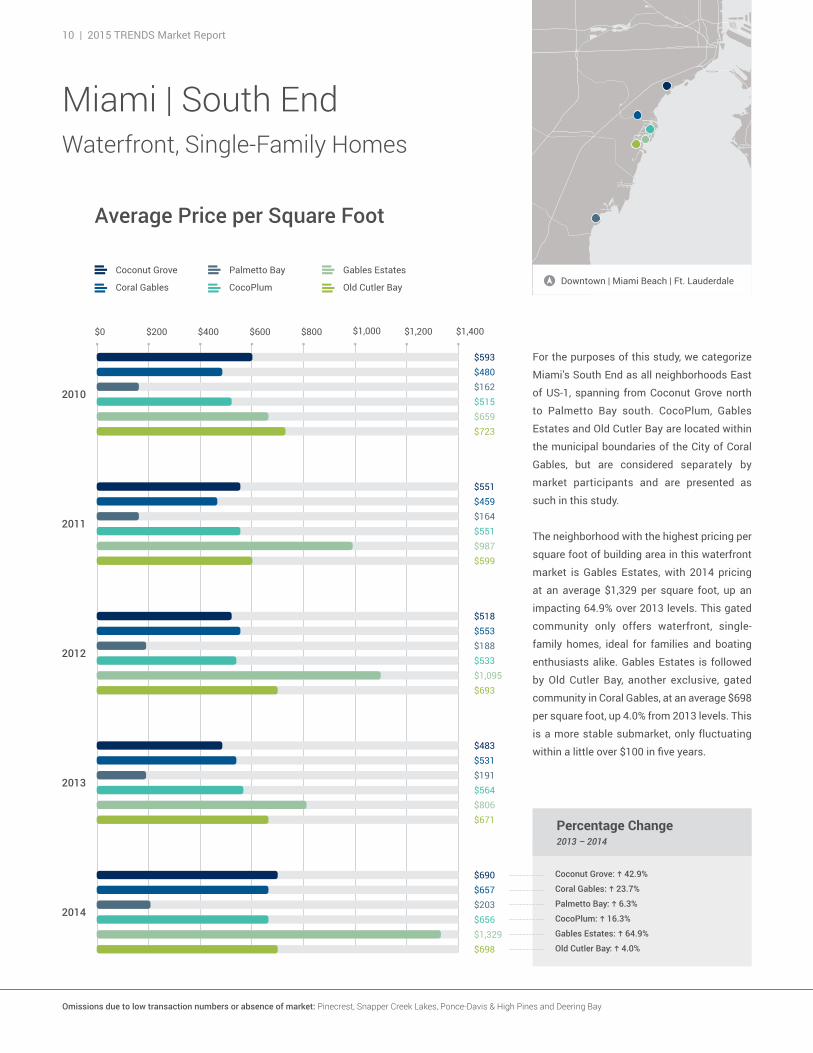
Miami | South EndWaterfront, Single-Family Homes
Omissions due to low transaction numbers or absence of market: Pinecrest, Snapper Creek Lakes, Ponce-Davis & High Pines and Deering Bay
Downtown | Miami Beach | Ft. Lauderdale
Percentage Change2013 – 2014
For the purposes of this study, we categorize
Miami’s South End as all neighborhoods East
of US-1, spanning from Coconut Grove north
to Palmetto Bay south. CocoPlum, Gables
Estates and Old Cutler Bay are located within
the municipal boundaries of the City of Coral
Gables, but are considered separately by
market participants and are presented as
such in this study.
The neighborhood with the highest pricing per
square foot of building area in this waterfront
market is Gables Estates, with 2014 pricing
at an average $1,329 per square foot, up an
impacting 64.9% over 2013 levels. This gated
community only offers waterfront, single-
family homes, ideal for families and boating
enthusiasts alike. Gables Estates is followed
by Old Cutler Bay, another exclusive, gated
community in Coral Gables, at an average $698
per square foot, up 4.0% from 2013 levels. This
is a more stable submarket, only fluctuating
within a little over $100 in five years.
Old Cutler Bay: g 4.0%
Coral Gables: g 23.7%
Coconut Grove: g 42.9%
Palmetto Bay: g 6.3%
Gables Estates: g 64.9%
CocoPlum: g 16.3%
Palmetto Bay
CocoPlum Old Cutler Bay
Gables EstatesCoconut Grove
Coral Gables
$1,200$1,000$800$600$400$200$0 $1,400
$593$480$162$515$659$723
$551$459$164$551$987$599
$518$553$188$533$1,095$693
$483$531$191$564$806$671
$690$657$203$656$1,329$698
Average Price per Square Foot
ONE Sotheby’s International Realty | 11
sing
le-f
amily
hom
es
# Transactions
Coconut Grove
18 9 3 4
Coral Gables
20 10 3 4
Palmetto Bay
23 13 12 5
CocoPlum
25 16 8 6
Gables Estates
25 12 8 9
Old Cutler
2010
2011
2012
2013
2014
10 56
8 57
8 86
4 77
10 76
Coconut Grove
Coral Gables
Palmetto Bay
CocoPlum
Gables Estates
Old Cutler Bay
Avg. Home Price # Transactions
$5,396,250 4
$6,452,708 25
$3,970,000 5
$5,216,667 3
$9,250,000 4
$4,125,000 4
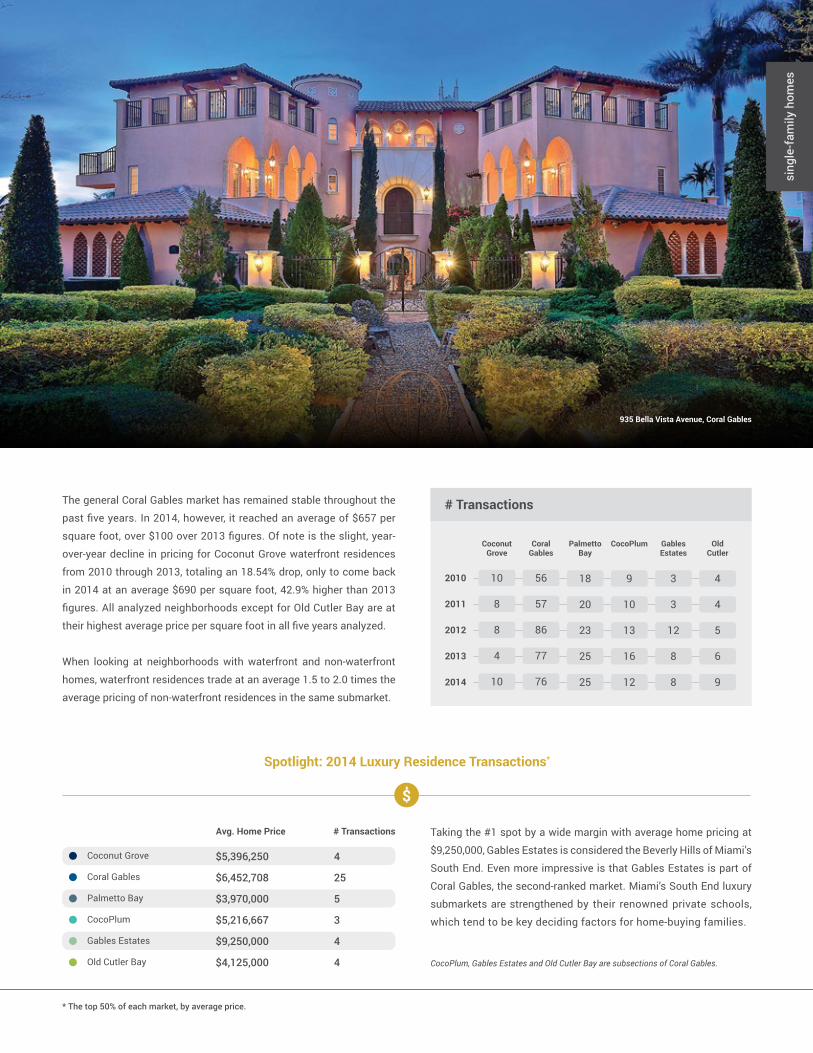
The general Coral Gables market has remained stable throughout the
past five years. In 2014, however, it reached an average of $657 per
square foot, over $100 over 2013 figures. Of note is the slight, year-
over-year decline in pricing for Coconut Grove waterfront residences
from 2010 through 2013, totaling an 18.54% drop, only to come back
in 2014 at an average $690 per square foot, 42.9% higher than 2013
figures. All analyzed neighborhoods except for Old Cutler Bay are at
their highest average price per square foot in all five years analyzed.
When looking at neighborhoods with waterfront and non-waterfront
homes, waterfront residences trade at an average 1.5 to 2.0 times the
average pricing of non-waterfront residences in the same submarket.
Taking the #1 spot by a wide margin with average home pricing at
$9,250,000, Gables Estates is considered the Beverly Hills of Miami’s
South End. Even more impressive is that Gables Estates is part of
Coral Gables, the second-ranked market. Miami’s South End luxury
submarkets are strengthened by their renowned private schools,
which tend to be key deciding factors for home-buying families.
* The top 50% of each market, by average price.
935 Bella Vista Avenue, Coral Gables
Spotlight: 2014 Luxury Residence Transactions*
CocoPlum, Gables Estates and Old Cutler Bay are subsections of Coral Gables.
12 | 2015 TRENDS Market Report
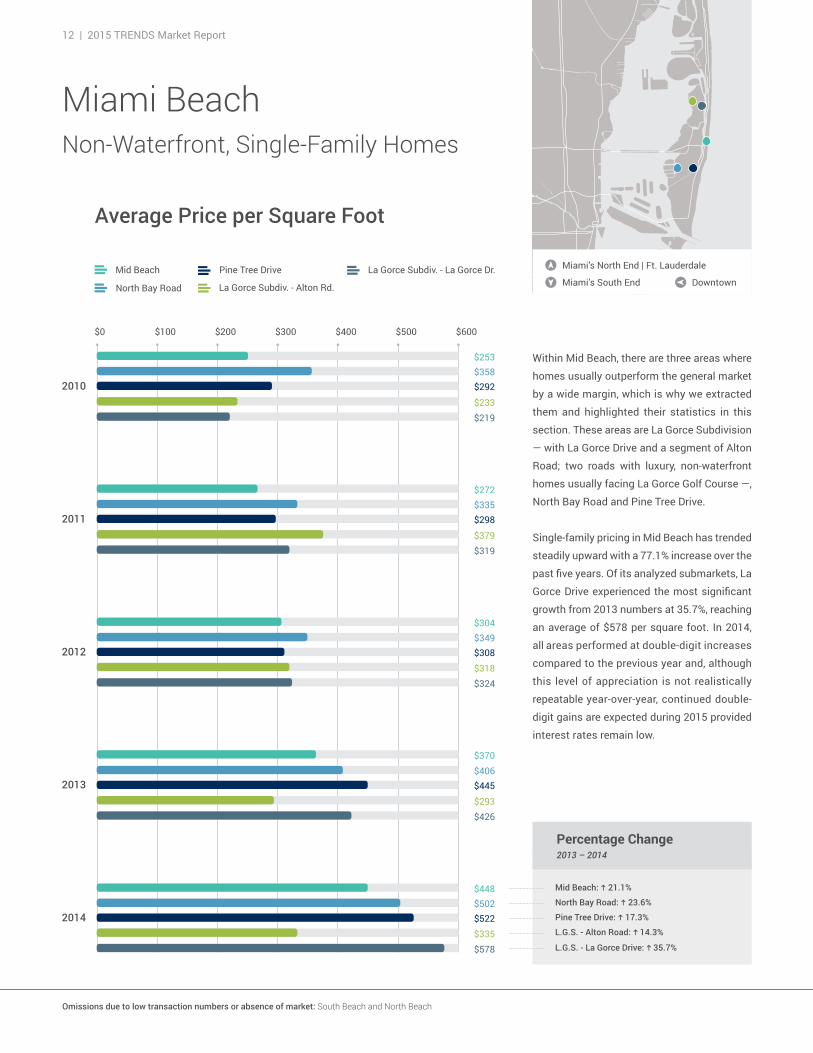
Within Mid Beach, there are three areas where
homes usually outperform the general market
by a wide margin, which is why we extracted
them and highlighted their statistics in this
section. These areas are La Gorce Subdivision
— with La Gorce Drive and a segment of Alton
Road; two roads with luxury, non-waterfront
homes usually facing La Gorce Golf Course —,
North Bay Road and Pine Tree Drive.
Single-family pricing in Mid Beach has trended
steadily upward with a 77.1% increase over the
past five years. Of its analyzed submarkets, La
Gorce Drive experienced the most significant
growth from 2013 numbers at 35.7%, reaching
an average of $578 per square foot. In 2014,
all areas performed at double-digit increases
compared to the previous year and, although
this level of appreciation is not realistically
repeatable year-over-year, continued double-
digit gains are expected during 2015 provided
interest rates remain low.
$400$300$200$100$0 $600
Miami BeachNon-Waterfront, Single-Family Homes
Average Price per Square Foot
Mid Beach
La Gorce Subdiv. - Alton Rd.North Bay Road
Pine Tree Drive
Percentage Change2013 – 2014
North Bay Road: g 23.6%
Mid Beach: g 21.1%
L.G.S. - Alton Road: g 14.3%
Pine Tree Drive: g 17.3%
$500
Omissions due to low transaction numbers or absence of market: South Beach and North Beach
La Gorce Subdiv. - La Gorce Dr.
$448
$335$522$502
$578
$370
$445$406
$293$426
$304
$308$349
$318$324
$272
$298$335
$379$319
$253
$292$358
$233$219
L.G.S. - La Gorce Drive: g 35.7%
Miami’s South End
Miami’s North End | Ft. Lauderdale
Downtown

ONE Sotheby’s International Realty | 13
Our Luxury Spotlight stars are North Bay Road, Pine Tree Drive and La Gorce
Drive, all three around the $2 million mark for non-waterfront homes. These
streets are the setting for many ultra-luxury, single-family homes, attracting high-
profile buyers from around the world. These properties also have a walkability
advantage over similarly priced homes in some of the islands, as they’re closer
to a plethora of entertainment options offered in Mid Beach and South Beach.
La Gorce Subdivision, North Bay Road and Pine Tree Drive are subsections of the Mid Beach market area.
sing
le-f
amily
hom
es
6222 Alton Road, Miami Beach
* The top 50% of each market, by average price.
Spotlight: 2014 Luxury Residence Transactions*
# Transactions
Mid Beach
2010
2011
2012
2013
2014
73
100
95
133
122
N. Bay Road
Pine Tree Drive
11 6
6 12
14 11
13 9
14 12
L.G.S.Alton Rd.
L.G.S.La Gorce Dr.
4 2
3 7
11 7
8 17
12 13
Avg. Home Price # Trans.
$1,960,099 41
$2,355,000 5
$2,632,143 7
Mid Beach
N. Bay Road
Pine Tree Drive
L.G.S. - Alton Road
L.G.S. - La Gorce Drive
$1,589,167
$2,395,180
6
5
“A member of La Gorce Country Club will certainly find a price premium worthy if
the residence sits on La Gorce Golf Course. The club has been known to extend
the privilege of providing golf cart access directly from homes to the golf course, a
feature that ultimately proves to be a weighing factor on potential buyers.”
– Dina Goldentayer, ONE Sotheby’s International Realty
Pine Tree Drive and North Bay Road are mostly known for their waterfront product,
but non-waterfront homes for both areas are in the $500-per-square-foot range,
outperforming the general Mid Beach market by 12% and 18% respectively. Alton
Road in La Gorce is the only analyzed submarket that didn’t reach Mid Beach’s
average pricing during 2014, most likely due to the price boost experienced by
the remaining submarkets and, ultimately, the general area.
14 | 2015 TRENDS Market Report
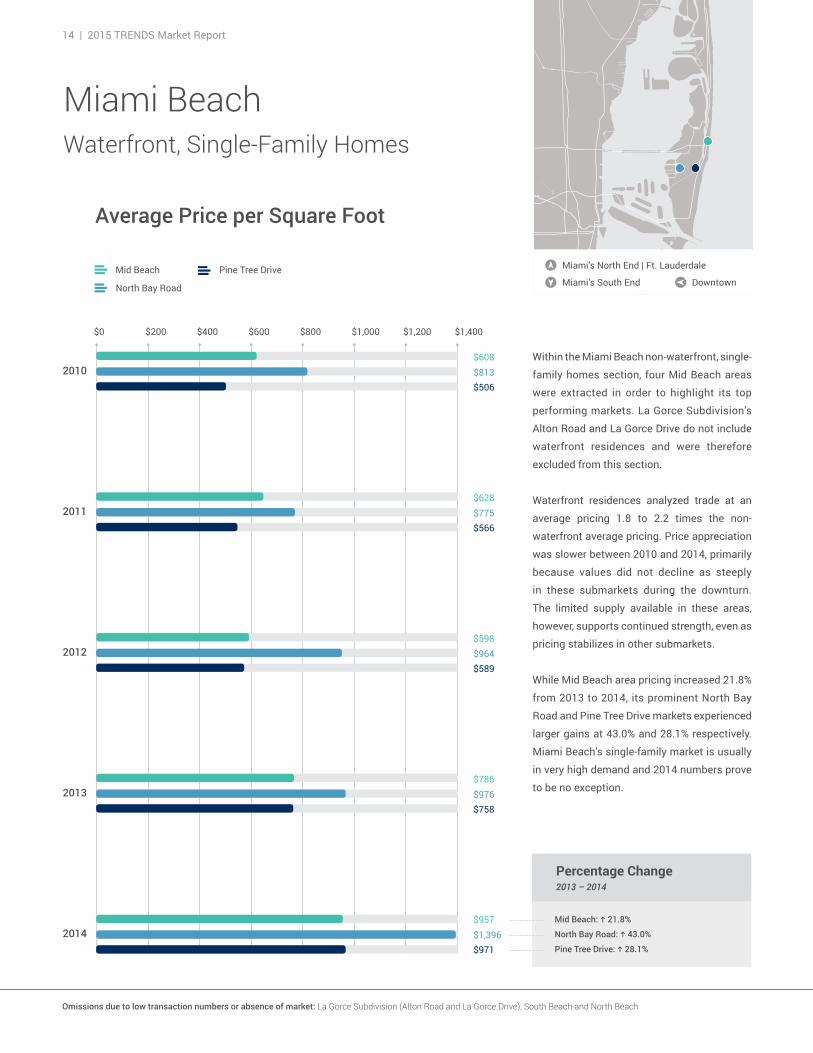
Within the Miami Beach non-waterfront, single-
family homes section, four Mid Beach areas
were extracted in order to highlight its top
performing markets. La Gorce Subdivision’s
Alton Road and La Gorce Drive do not include
waterfront residences and were therefore
excluded from this section.
Waterfront residences analyzed trade at an
average pricing 1.8 to 2.2 times the non-
waterfront average pricing. Price appreciation
was slower between 2010 and 2014, primarily
because values did not decline as steeply
in these submarkets during the downturn.
The limited supply available in these areas,
however, supports continued strength, even as
pricing stabilizes in other submarkets.
While Mid Beach area pricing increased 21.8%
from 2013 to 2014, its prominent North Bay
Road and Pine Tree Drive markets experienced
larger gains at 43.0% and 28.1% respectively.
Miami Beach’s single-family market is usually
in very high demand and 2014 numbers prove
to be no exception.
Miami BeachWaterfront, Single-Family Homes
Miami’s South End
Miami’s North End | Ft. Lauderdale
Downtown
Average Price per Square Foot
Percentage Change2013 – 2014
North Bay Road: g 43.0%
Mid Beach: g 21.8%
Pine Tree Drive: g 28.1%
$608
$506$813
$628
$566$775
$598
$589$964
$786
$758$976
$957
$971$1,396
$600$400$200$0 $1,400$1,000$800 $1,200
Omissions due to low transaction numbers or absence of market: La Gorce Subdivision (Alton Road and La Gorce Drive), South Beach and North Beach
Mid Beach
North Bay Road
Pine Tree Drive
ONE Sotheby’s International Realty | 15
Avg. Home Price # Trans.
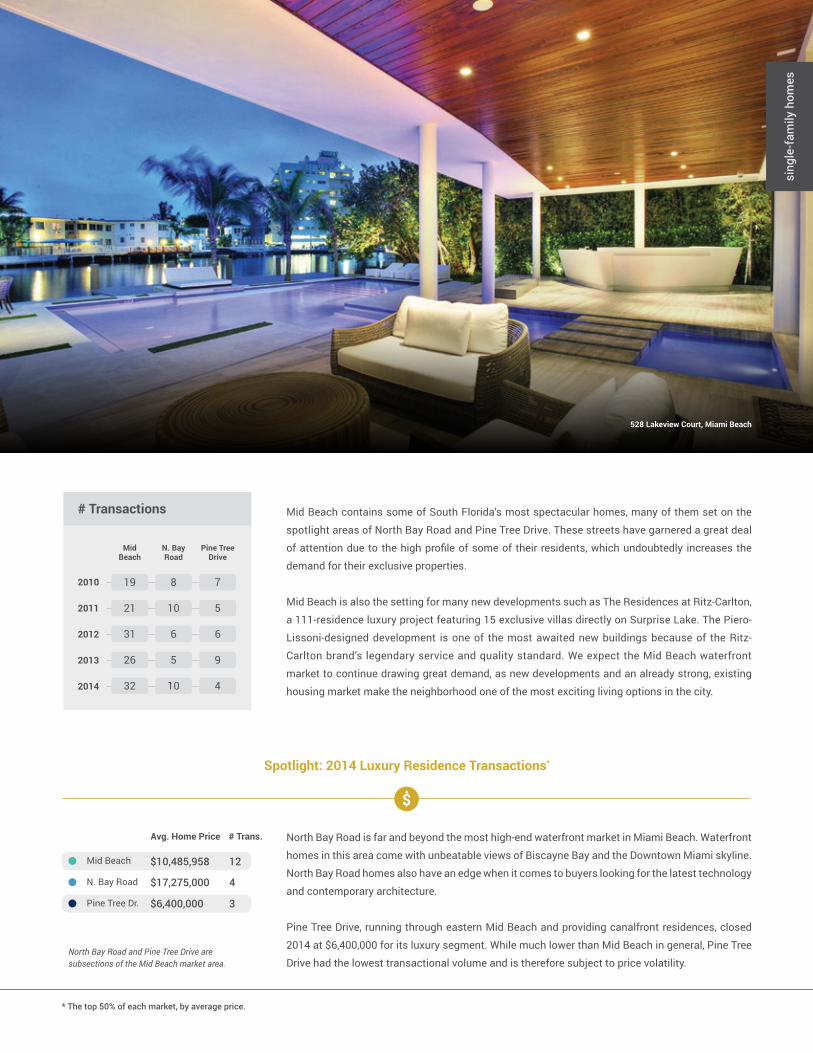
$10,485,958 12
$17,275,000 4
$6,400,000 3
Mid Beach
N. Bay Road
Pine Tree Dr.
# Transactions
Mid Beach
2010
2011
2012
2013
2014
19
21
31
26
32
N. Bay Road
Pine Tree Drive
8 7
10 5
6 6
5 9
10 4
North Bay Road is far and beyond the most high-end waterfront market in Miami Beach. Waterfront
homes in this area come with unbeatable views of Biscayne Bay and the Downtown Miami skyline.
North Bay Road homes also have an edge when it comes to buyers looking for the latest technology
and contemporary architecture.
Pine Tree Drive, running through eastern Mid Beach and providing canalfront residences, closed
2014 at $6,400,000 for its luxury segment. While much lower than Mid Beach in general, Pine Tree
Drive had the lowest transactional volume and is therefore subject to price volatility.North Bay Road and Pine Tree Drive are subsections of the Mid Beach market area.
sing
le-f
amily
hom
es
528 Lakeview Court, Miami Beach
* The top 50% of each market, by average price.
Spotlight: 2014 Luxury Residence Transactions*
Mid Beach contains some of South Florida’s most spectacular homes, many of them set on the
spotlight areas of North Bay Road and Pine Tree Drive. These streets have garnered a great deal
of attention due to the high profile of some of their residents, which undoubtedly increases the
demand for their exclusive properties.
Mid Beach is also the setting for many new developments such as The Residences at Ritz-Carlton,
a 111-residence luxury project featuring 15 exclusive villas directly on Surprise Lake. The Piero-
Lissoni-designed development is one of the most awaited new buildings because of the Ritz-
Carlton brand’s legendary service and quality standard. We expect the Mid Beach waterfront
market to continue drawing great demand, as new developments and an already strong, existing
housing market make the neighborhood one of the most exciting living options in the city.
16 | 2015 TRENDS Market Report
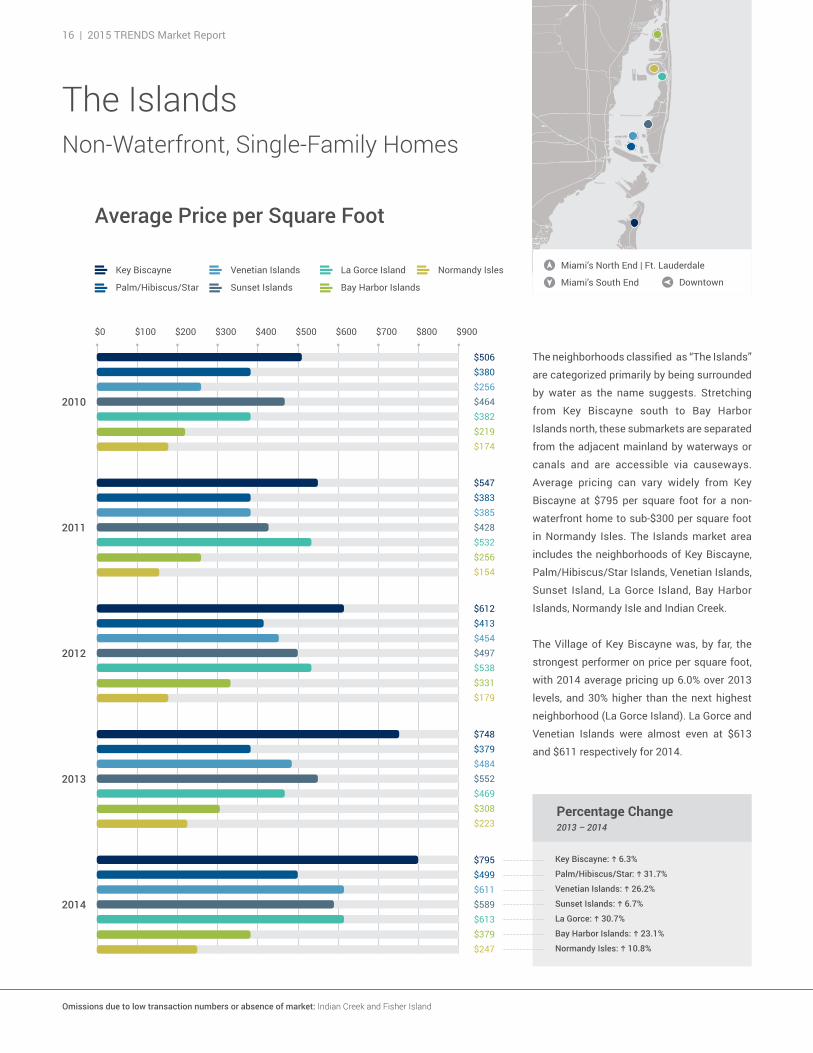
Key Biscayne: g 6.3%
Percentage Change2013 – 2014
The neighborhoods classified as “The Islands”
are categorized primarily by being surrounded
by water as the name suggests. Stretching
from Key Biscayne south to Bay Harbor
Islands north, these submarkets are separated
from the adjacent mainland by waterways or
canals and are accessible via causeways.
Average pricing can vary widely from Key
Biscayne at $795 per square foot for a non-
waterfront home to sub-$300 per square foot
in Normandy Isles. The Islands market area
includes the neighborhoods of Key Biscayne,
Palm/Hibiscus/Star Islands, Venetian Islands,
Sunset Island, La Gorce Island, Bay Harbor
Islands, Normandy Isle and Indian Creek.
The Village of Key Biscayne was, by far, the
strongest performer on price per square foot,
with 2014 average pricing up 6.0% over 2013
levels, and 30% higher than the next highest
neighborhood (La Gorce Island). La Gorce and
Venetian Islands were almost even at $613
and $611 respectively for 2014.
Normandy Isles: g 10.8%
Venetian Islands: g 26.2%
Palm/Hibiscus/Star: g 31.7%
Sunset Islands: g 6.7%
Bay Harbor Islands: g 23.1%
La Gorce: g 30.7%
$600$500$400$300$200$100$0 $900$800$700
Key Biscayne
Palm/Hibiscus/Star
The IslandsNon-Waterfront, Single-Family Homes
Venetian Islands
Sunset Islands
La Gorce Island Normandy Isles
Bay Harbor Islands
$506$380$256$464$382$219$174
$795$499$611$589$613$379$247
$547$383$385$428$532$256$154
$612$413$454$497$538$331$179
$748$379$484$552$469$308$223
Miami’s South End
Miami’s North End | Ft. Lauderdale
Downtown
Average Price per Square Foot
Omissions due to low transaction numbers or absence of market: Indian Creek and Fisher Island
sing
le-f
amily
hom
es
# Transactions
Key Biscayne
10 7 4 5 17
Palm/Hib./Star
14 4 5 8 17
VenetianIslands
19 6 2 7 36
Sunset Islands
23 8 2 9 30
La GorceIsland
19 7 4 19 26
Bay Harbor Islands
NormandyIsles
2010
2011
2012
2013
2014
59 4
63 5
63 6
59 5
63 2
The highest percentage gain in the non-waterfront category
for The Islands goes to Palm/Hibiscus/Star Islands with
31.7% appreciation over 2013 figures. The Venetian Islands
showed the strongest cumulative gain over the five-year
period, with average pricing up 139% over 2010 levels.
Normandy Isles is to “The Islands” what Palmetto Bay is to
Miami’s South End. The sleepier neighborhood with the largest
upside relative to its peers, Normandy Isles looks attractively
priced. Some of this pricing differential is embedded in the
older housing stock, but the spread ($247 versus competitive
island peers at $500+ PSF) is too great to be ignored.
Key Biscayne
Palm/Hibiscus/Star
Venetian Islands
Sunset Islands
La Gorce Island
Bay Harbor Islands
Normandy Isles
Avg. Home Price # Transactions
$3,310,731 26
$1,595,000 2
$2,193,889 9
$2,716,250 4
$6,500,000 1
$1,362,188 8
$627,885 13
The only non-waterfront inventory in the Palm/Hibiscus/Star chain is located
on Palm and Star Islands. These very few non-waterfront properties are what
some might consider “tear-downs” at $1.25 million – $1.4 million, making their
average pricing a great deal lower than it would normally be. La Gorce and
Key Biscayne hold the #1 and #2 spots in luxury average pricing. La Gorce is a
very lush, gated community, making it one of the most private neighborhoods
in Miami. Key Biscayne, located further south, is a 1.5-square-mile village
surrounded by acres of parks and beaches. Pricing in this exclusive island
usually remains high due to its low supply of homes and developable land.
Spotlight: 2014 Luxury Residence Transactions*
* The top 50% of each market, by average price.
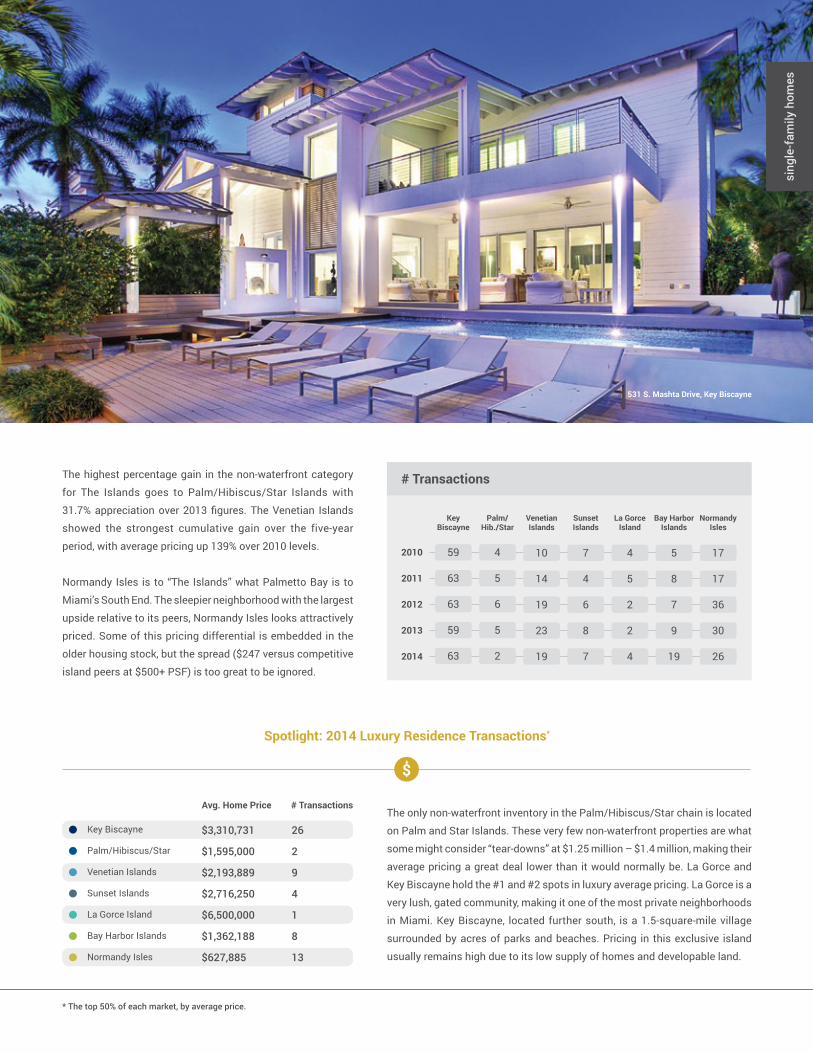
531 S. Mashta Drive, Key Biscayne
18 | 2015 TRENDS Market Report
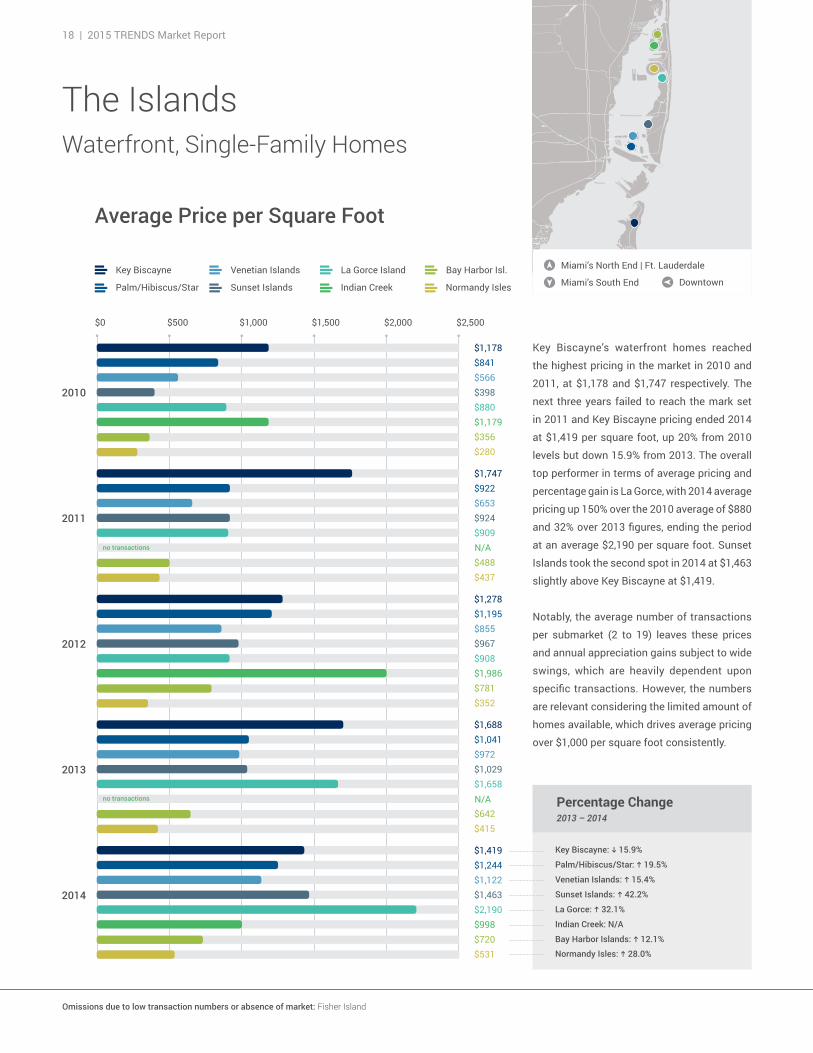
The IslandsWaterfront, Single-Family Homes
$2,500$2,000$1,500$1,000$500$0
$1,178$841$566$398$880$1,179$356$280
$1,747$922$653$924$909
$488$437
$1,278$1,195$855$967$908$1,986$781$352
$1,688$1,041$972$1,029$1,658
$642$415
$1,419$1,244$1,122$1,463$2,190$998$720$531
Miami’s South End
Miami’s North End | Ft. Lauderdale
Downtown
Average Price per Square Foot
Key Biscayne: h 15.9%
Percentage Change2013 – 2014
Key Biscayne’s waterfront homes reached
the highest pricing in the market in 2010 and
2011, at $1,178 and $1,747 respectively. The
next three years failed to reach the mark set
in 2011 and Key Biscayne pricing ended 2014
at $1,419 per square foot, up 20% from 2010
levels but down 15.9% from 2013. The overall
top performer in terms of average pricing and
percentage gain is La Gorce, with 2014 average
pricing up 150% over the 2010 average of $880
and 32% over 2013 figures, ending the period
at an average $2,190 per square foot. Sunset
Islands took the second spot in 2014 at $1,463
slightly above Key Biscayne at $1,419.
Notably, the average number of transactions
per submarket (2 to 19) leaves these prices
and annual appreciation gains subject to wide
swings, which are heavily dependent upon
specific transactions. However, the numbers
are relevant considering the limited amount of
homes available, which drives average pricing
over $1,000 per square foot consistently.
Bay Harbor Islands: g 12.1%
Venetian Islands: g 15.4%
Palm/Hibiscus/Star: g 19.5%
Sunset Islands: g 42.2%
Indian Creek: N/A
La Gorce: g 32.1%
Normandy Isles: g 28.0%
Key Biscayne
Palm/Hibiscus/Star
Venetian Islands
Sunset Islands
La Gorce Island Bay Harbor Isl.
Indian Creek Normandy Isles
N/A
N/A
no transactions
no transactions
Omissions due to low transaction numbers or absence of market: Fisher Island
ONE Sotheby’s International Realty | 19
sing
le-f
amily
hom
es
# Transactions
Key Biscayne
13 2 4 1 1
Palm/Hib./Star
20 6 2 0 3
VenetianIslands
17 17 2 3 1
Sunset Islands
15 12 2 0 4
La GorceIsland
18 10 2 2 5
Bay Harbor Islands
NormandyIsles
2010
2011
2012
2013
2014
7 9
9 12
16 12
8 11
9 19
11
8
15
21
9
IndianCreek
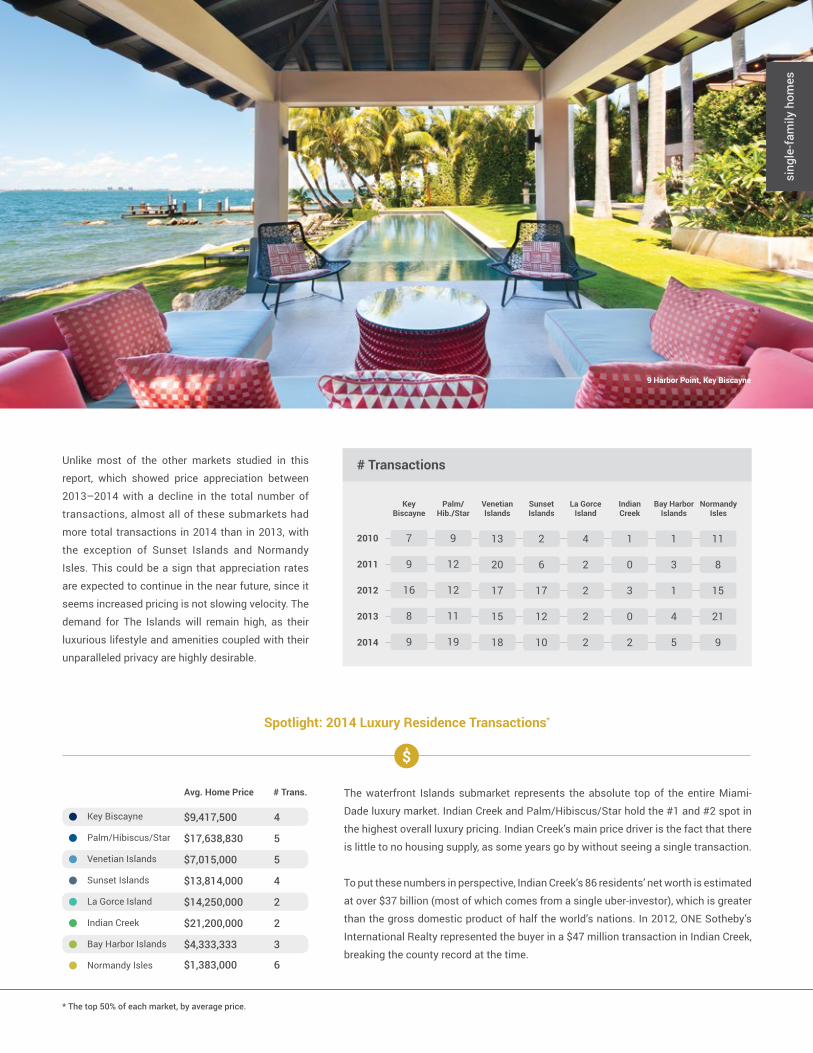
Unlike most of the other markets studied in this
report, which showed price appreciation between
2013–2014 with a decline in the total number of
transactions, almost all of these submarkets had
more total transactions in 2014 than in 2013, with
the exception of Sunset Islands and Normandy
Isles. This could be a sign that appreciation rates
are expected to continue in the near future, since it
seems increased pricing is not slowing velocity. The
demand for The Islands will remain high, as their
luxurious lifestyle and amenities coupled with their
unparalleled privacy are highly desirable.
Key Biscayne
Palm/Hibiscus/Star
Venetian Islands
Sunset Islands
La Gorce Island
Indian Creek
Bay Harbor Islands
Normandy Isles
Avg. Home Price # Trans.
$9,417,500 4
$17,638,830 5
$7,015,000 5
$13,814,000 4
$14,250,000 2
$21,200,000 2
$4,333,333 3
$1,383,000 6
The waterfront Islands submarket represents the absolute top of the entire Miami-
Dade luxury market. Indian Creek and Palm/Hibiscus/Star hold the #1 and #2 spot in
the highest overall luxury pricing. Indian Creek’s main price driver is the fact that there
is little to no housing supply, as some years go by without seeing a single transaction.
To put these numbers in perspective, Indian Creek’s 86 residents’ net worth is estimated
at over $37 billion (most of which comes from a single uber-investor), which is greater
than the gross domestic product of half the world’s nations. In 2012, ONE Sotheby’s
International Realty represented the buyer in a $47 million transaction in Indian Creek,
breaking the county record at the time.
Spotlight: 2014 Luxury Residence Transactions*
* The top 50% of each market, by average price.
9 Harbor Point, Key Biscayne
20 | 2015 TRENDS Market Report
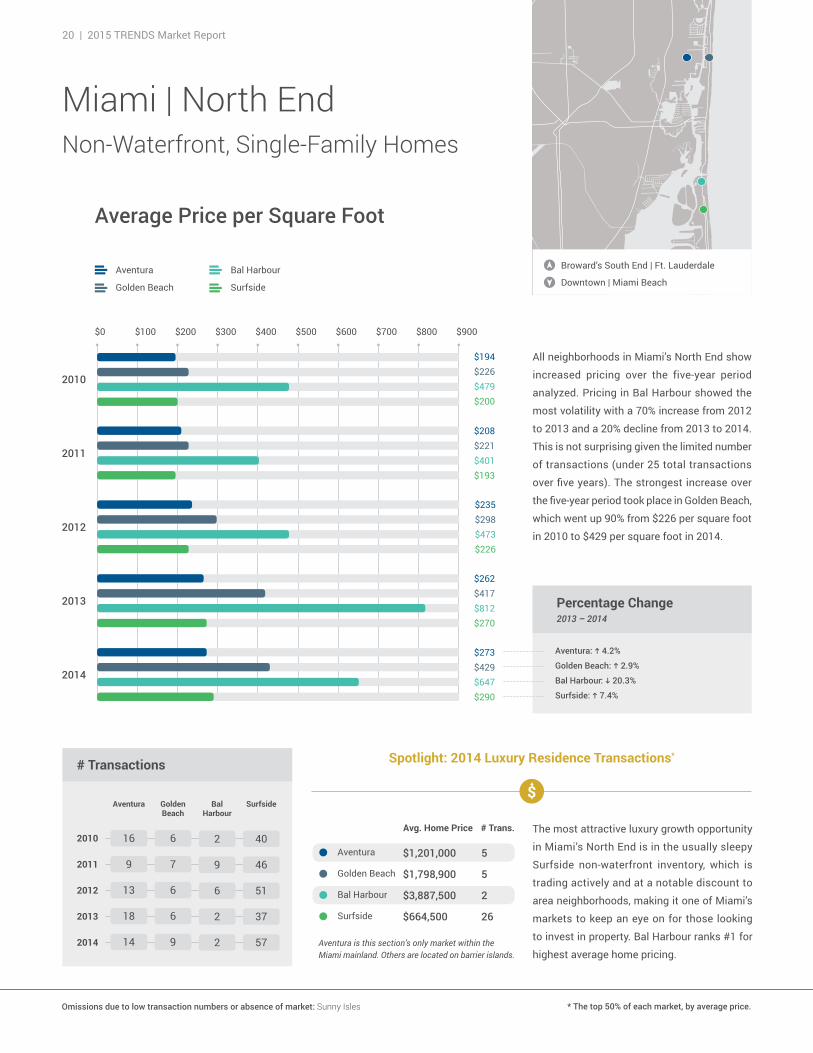
Percentage Change2013 – 2014
All neighborhoods in Miami’s North End show
increased pricing over the five-year period
analyzed. Pricing in Bal Harbour showed the
most volatility with a 70% increase from 2012
to 2013 and a 20% decline from 2013 to 2014.
This is not surprising given the limited number
of transactions (under 25 total transactions
over five years). The strongest increase over
the five-year period took place in Golden Beach,
which went up 90% from $226 per square foot
in 2010 to $429 per square foot in 2014.
Surfside: g 7.4%
Aventura: g 4.2%
Bal Harbour: h 20.3%
Golden Beach: g 2.9%
$600$500$400$300$200$100$0 $900$800$700
Aventura
Golden Beach
Bal Harbour
Surfside
Average Price per Square Foot
Miami | North EndNon-Waterfront, Single-Family Homes
$194$226$479$200
$208$221$401$193
$262$417$812$270
$273$429$647$290
$235$298$473$226
Downtown | Miami Beach
Broward’s South End | Ft. Lauderdale
# Transactions
Aventura
2 40
Golden Beach
9 46
BalHarbour
6 51
Surfside
2 37
2 57
2010
2011
2012
2013
2014
16 6
9 7
13 6
18 6
14 9
Aventura
Golden Beach
Bal Harbour
Surfside
Avg. Home Price # Trans.
$1,201,000 5
$1,798,900 5
$3,887,500 2
$664,500 26
The most attractive luxury growth opportunity
in Miami’s North End is in the usually sleepy
Surfside non-waterfront inventory, which is
trading actively and at a notable discount to
area neighborhoods, making it one of Miami’s
markets to keep an eye on for those looking
to invest in property. Bal Harbour ranks #1 for
highest average home pricing.
Omissions due to low transaction numbers or absence of market: Sunny Isles * The top 50% of each market, by average price.
Spotlight: 2014 Luxury Residence Transactions*
Aventura is this section’s only market within the Miami mainland. Others are located on barrier islands.

ONE Sotheby’s International Realty | 21
sing
le-f
amily
hom
es
Miami | North EndWaterfront, Single-Family Homes
$1,200$1,000$800$600$400$200$0 $1,400
Downtown | Miami Beach
Broward’s South End | Ft. LauderdaleAventura
Golden Beach
Bal Harbour
Surfside
Average Price per Square Foot
Percentage Change2013 – 2014
Pricing volatility in the waterfront category for
this market area is again dominated by the Bal
Harbour neighborhood, with the top average
price of $1,287 per square foot in 2013, 48%
higher than the next highest neighborhood for
any time period analyzed. Bal Harbour sales
volume for waterfront homes has averaged
one annual sale, limiting the reliability of the
analysis for this area. But for those listing a
Bal Harbour waterfront home, the market price
point will probably start at $1,200 per SF.
Surfside: h 14.9%
Aventura: g 8.9%
Bal Harbour: N/A
Golden Beach: g 16.4%$356$867
$607
$256$552
$353
$327$745$1,287$713
$300$791$796$338
$273$629$885$285
# Transactions
Aventura
1 3
Golden Beach
0 4
BalHarbour
1 3
Surfside
3 2
0 7
2010
2011
2012
2013
2014
20 8
15 16
22 11
31 14
25 7
Aventura
Golden Beach
Bal Harbour
Surfside
Avg. Home Price # Trans.
$881,429 7
$9,400,000 2
N/A 0
$3,550,000 3
no transactions N/A
no transactions N/A
Located on a barrier island separating the
Intracoastal Waterway from the ocean, the
high-end Golden Beach community offers one
of the only “on the sand”, single-family home
markets in Miami-Dade County, taking the #1
spot in Miami’s North End Luxury Spotlight by
a wide margin at an average $9,400,000. Bal
Harbour had no transactions during 2014.
Omissions due to low transaction numbers or absence of market: Sunny Isles * The top 50% of each market, by average price.
Spotlight: 2014 Luxury Residence Transactions*
Aventura is this section’s only market within the Miami mainland. Others are located on barrier islands.
22 | 2015 TRENDS Market Report
Luxury Spotlight
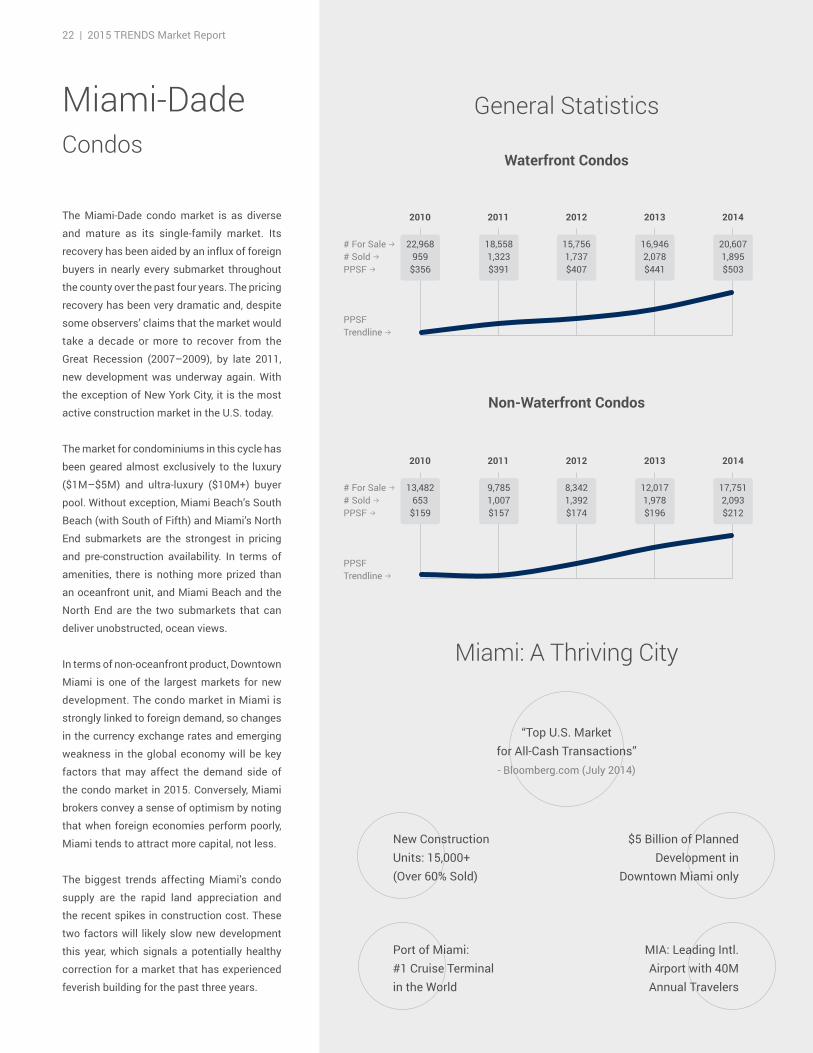
Non-Waterfront Condos
2010 2011 2012 2013 2014
13,482 653
$159
# For Sale b# Sold bPPSF b
9,785 1,007$157
8,342 1,392$174
12,017 1,978$196
17,7512,093$212
PPSF Trendline b
Waterfront Condos
2010 2011 2012 2013 2014
22,968 959
$356
# For Sale b# Sold bPPSF b
18,5581,323$391
15,756 1,737$407
16,946 2,078$441
20,607 1,895$503
PPSF Trendline b
Miami-DadeCondos
General Statistics
The Miami-Dade condo market is as diverse
and mature as its single-family market. Its
recovery has been aided by an influx of foreign
buyers in nearly every submarket throughout
the county over the past four years. The pricing
recovery has been very dramatic and, despite
some observers’ claims that the market would
take a decade or more to recover from the
Great Recession (2007–2009), by late 2011,
new development was underway again. With
the exception of New York City, it is the most
active construction market in the U.S. today.
The market for condominiums in this cycle has
been geared almost exclusively to the luxury
($1M–$5M) and ultra-luxury ($10M+) buyer
pool. Without exception, Miami Beach’s South
Beach (with South of Fifth) and Miami’s North
End submarkets are the strongest in pricing
and pre-construction availability. In terms of
amenities, there is nothing more prized than
an oceanfront unit, and Miami Beach and the
North End are the two submarkets that can
deliver unobstructed, ocean views.
In terms of non-oceanfront product, Downtown
Miami is one of the largest markets for new
development. The condo market in Miami is
strongly linked to foreign demand, so changes
in the currency exchange rates and emerging
weakness in the global economy will be key
factors that may affect the demand side of
the condo market in 2015. Conversely, Miami
brokers convey a sense of optimism by noting
that when foreign economies perform poorly,
Miami tends to attract more capital, not less.
The biggest trends affecting Miami’s condo
supply are the rapid land appreciation and
the recent spikes in construction cost. These
two factors will likely slow new development
this year, which signals a potentially healthy
correction for a market that has experienced
feverish building for the past three years.
Miami: A Thriving City
“Top U.S. Market for All-Cash Transactions” - Bloomberg.com (July 2014)
Port of Miami: #1 Cruise Terminal in the World
New Construction Units: 15,000+(Over 60% Sold)
MIA: Leading Intl. Airport with 40M Annual Travelers
$5 Billion of Planned Development in
Downtown Miami only
ONE Sotheby’s International Realty | 23
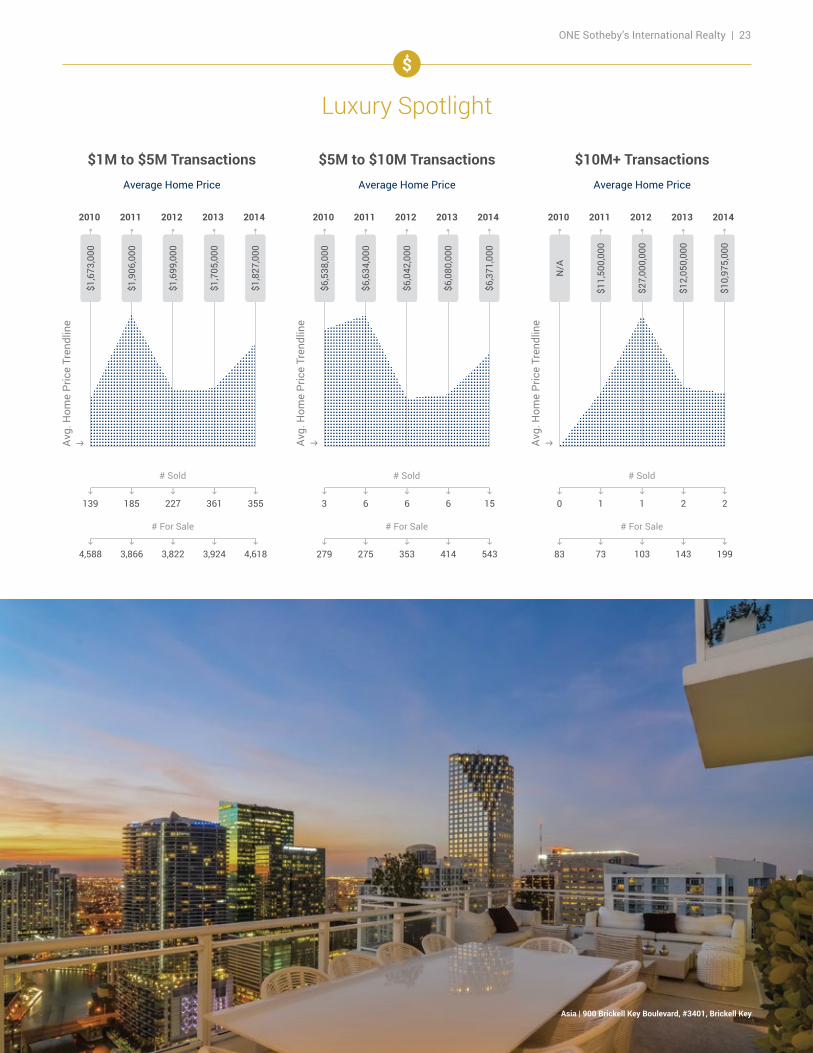
Luxury Spotlight
$1M to $5M TransactionsAverage Home Price
$5M to $10M TransactionsAverage Home Price
$10M+ TransactionsAverage Home Price
2010 2011 2012 2013 2014
$1,6
73,0
00
$1,9
06,0
00
$1,6
99,0
00
$1,7
05,0
00
$1,8
27,0
00
h
139
h
4,588
h
185
h
3,866
# Sold
# For Sale
h
361
h
3,924
h
355
h
4,618
h
227
h
3,822
2010 2011 2012 2013 2014
$6,5
38,0
00
$6,6
34,0
00
$6,0
42,0
00
$6,0
80,0
00
$6,3
71,0
00h
3
h
279
h
6
h
275
# Sold
# For Sale
h
6
h
414
h
15
h
543
h
6
h
353
2010 2011 2012 2013 2014
N/A
$11,
500,
000
$27,
000,
000
$12,
050,
000
$10,
975,
000
h
0
h
83
h
1
h
73
# Sold
# For Sale
h
2
h
143
h
2
h
199
h
1
h
103
Asia | 900 Brickell Key Boulevard, #3401, Brickell Key
Avg.
Hom
e Pr
ice
Tren
dlin
eh Av
g. H
ome
Pric
e Tr
endl
ine
h Avg.
Hom
e Pr
ice
Tren
dlin
eh
24 | 2015 TRENDS Market Report
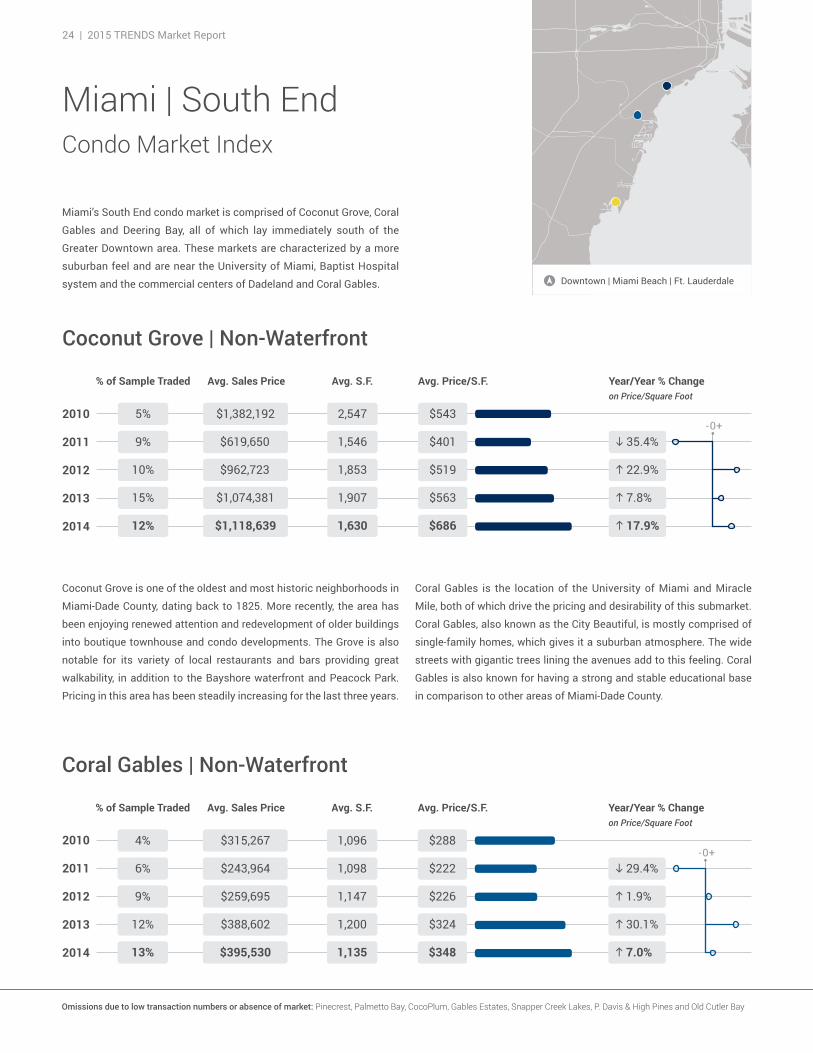
Miami | South EndCondo Market Index
Miami’s South End condo market is comprised of Coconut Grove, Coral
Gables and Deering Bay, all of which lay immediately south of the
Greater Downtown area. These markets are characterized by a more
suburban feel and are near the University of Miami, Baptist Hospital
system and the commercial centers of Dadeland and Coral Gables.
Coconut Grove is one of the oldest and most historic neighborhoods in
Miami-Dade County, dating back to 1825. More recently, the area has
been enjoying renewed attention and redevelopment of older buildings
into boutique townhouse and condo developments. The Grove is also
notable for its variety of local restaurants and bars providing great
walkability, in addition to the Bayshore waterfront and Peacock Park.
Pricing in this area has been steadily increasing for the last three years.
Downtown | Miami Beach | Ft. Lauderdale
-0+
Coral Gables | Non-Waterfront
% of Sample Traded
4%
6%
9%
12%
13%
Avg. Sales Price Avg. S.F. Avg. Price/S.F. Year/Year % Changeon Price/Square Foot
g 30.1%
g 1.9%
h 29.4%
g 7.0%
$324
$226
$222
$348
$288
1,200
1,147
1,098
1,135
1,096$315,267
$243,964
$259,695
$388,602
$395,530
2010
2011
2012
2013
2014
Coral Gables is the location of the University of Miami and Miracle
Mile, both of which drive the pricing and desirability of this submarket.
Coral Gables, also known as the City Beautiful, is mostly comprised of
single-family homes, which gives it a suburban atmosphere. The wide
streets with gigantic trees lining the avenues add to this feeling. Coral
Gables is also known for having a strong and stable educational base
in comparison to other areas of Miami-Dade County.
Coconut Grove | Non-Waterfront
% of Sample Traded
5%
9%
10%
15%
12%
Avg. Sales Price Avg. S.F. Avg. Price/S.F. Year/Year % Changeon Price/Square Foot
g 7.8%
g 22.9%
h 35.4%
g 17.9%
$563
$519
$401
$686
$543
1,907
1,853
1,546
1,630
2,547$1,382,192
$619,650
$962,723
$1,074,381
$1,118,639
2010
2011
2012
2013
2014
-0+
Omissions due to low transaction numbers or absence of market: Pinecrest, Palmetto Bay, CocoPlum, Gables Estates, Snapper Creek Lakes, P. Davis & High Pines and Old Cutler Bay
ONE Sotheby’s International Realty | 25
-0+2010
2011
2012
2013
2014
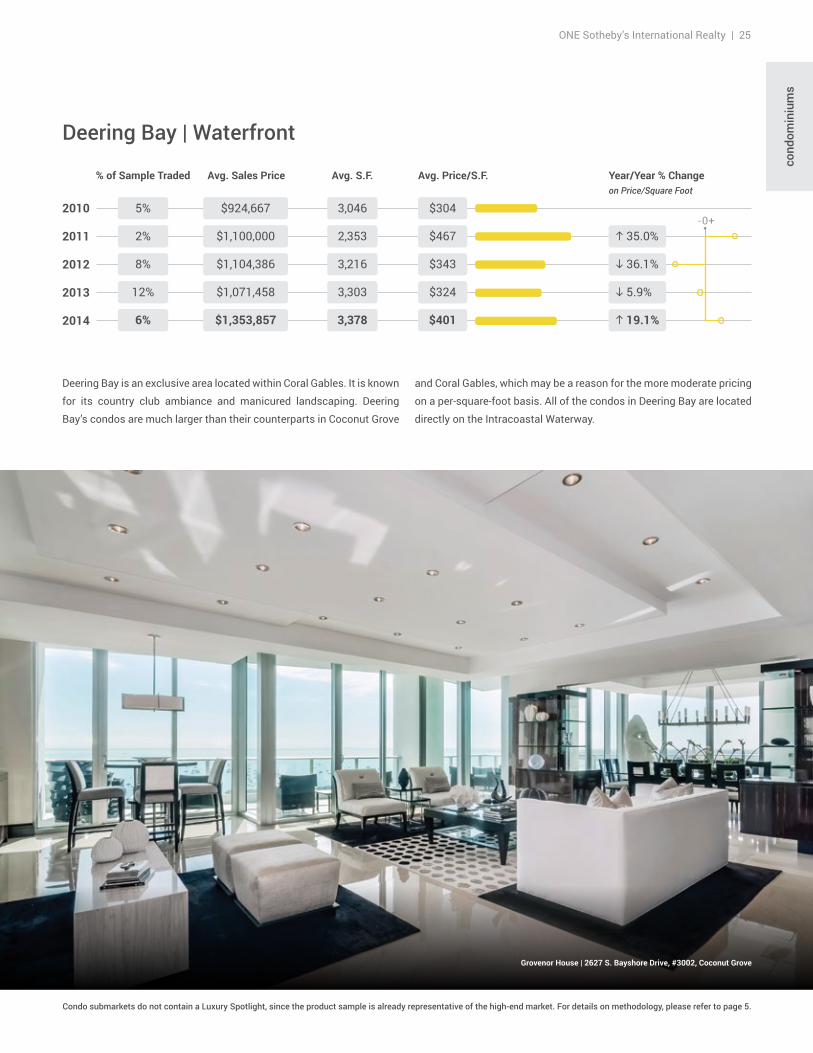
Deering Bay | Waterfront
% of Sample Traded
5%
2%
8%
12%
6%
Avg. Sales Price Avg. S.F. Avg. Price/S.F. Year/Year % Changeon Price/Square Foot
h 5.9%
h 36.1%
g 35.0%
g 19.1%
$324
$343
$467
$401
$304
3,303
3,216
2,353
3,378
3,046$924,667
$1,100,000
$1,104,386
$1,071,458
$1,353,857
cond
omin
ium
s
Deering Bay is an exclusive area located within Coral Gables. It is known
for its country club ambiance and manicured landscaping. Deering
Bay’s condos are much larger than their counterparts in Coconut Grove
and Coral Gables, which may be a reason for the more moderate pricing
on a per-square-foot basis. All of the condos in Deering Bay are located
directly on the Intracoastal Waterway.
Grovenor House | 2627 S. Bayshore Drive, #3002, Coconut Grove
Condo submarkets do not contain a Luxury Spotlight, since the product sample is already representative of the high-end market. For details on methodology, please refer to page 5.
26 | 2015 TRENDS Market Report
BrickellCondo Market Index
Miami’s South End
Downtown | Midtown | Miami’s North End
-0+2010
2011
2012
2013
2014
Brickell | Waterfront
% of Sample Traded
26%
27%
8%
12%
8%
Avg. Sales Price Avg. S.F. Avg. Price/S.F. Year/Year % Changeon Price/Square Foot
g 6.5%
g 16.2%
g 7.4%
g 8.7%
$549
$513
$430
$602
$398
1,405
1,556
1,177
1,471
1,153$459,376
$506,243
$798,965
$771,402
$884,786
-0+2010
2011
2012
2013
2014
Brickell | Non-Waterfront
% of Sample Traded
10%
10%
18%
14%
8%
Avg. Sales Price Avg. S.F. Avg. Price/S.F. Year/Year % Changeon Price/Square Foot
g 18.7%
g 5.1%
g 4.0%
g 3.6%
$422
$343
$326
$438
$313
981
994
963
989
921$287,943
$313,513
$341,253
$414,273
$432,750
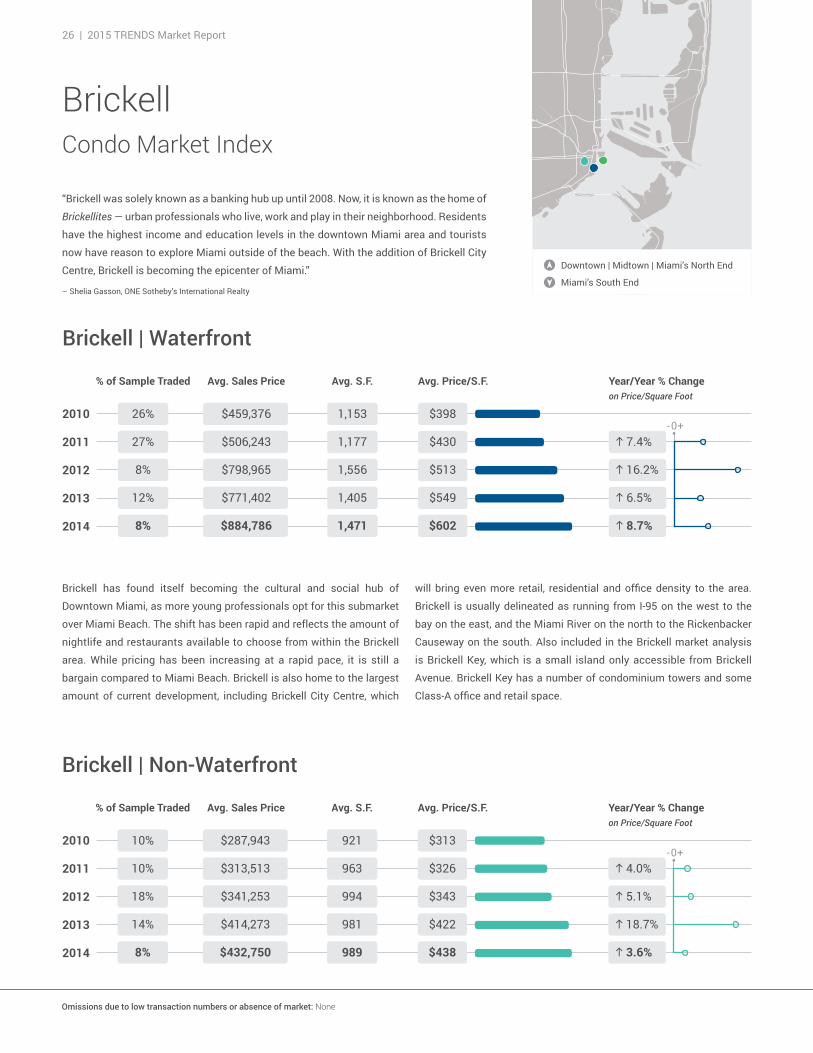
“Brickell was solely known as a banking hub up until 2008. Now, it is known as the home of
Brickellites — urban professionals who live, work and play in their neighborhood. Residents
have the highest income and education levels in the downtown Miami area and tourists
now have reason to explore Miami outside of the beach. With the addition of Brickell City
Centre, Brickell is becoming the epicenter of Miami.”
– Shelia Gasson, ONE Sotheby’s International Realty
Brickell has found itself becoming the cultural and social hub of
Downtown Miami, as more young professionals opt for this submarket
over Miami Beach. The shift has been rapid and reflects the amount of
nightlife and restaurants available to choose from within the Brickell
area. While pricing has been increasing at a rapid pace, it is still a
bargain compared to Miami Beach. Brickell is also home to the largest
amount of current development, including Brickell City Centre, which
will bring even more retail, residential and office density to the area.
Brickell is usually delineated as running from I-95 on the west to the
bay on the east, and the Miami River on the north to the Rickenbacker
Causeway on the south. Also included in the Brickell market analysis
is Brickell Key, which is a small island only accessible from Brickell
Avenue. Brickell Key has a number of condominium towers and some
Class-A office and retail space.
Omissions due to low transaction numbers or absence of market: None
ONE Sotheby’s International Realty | 27
-0+2010
2011
2012
2013
2014
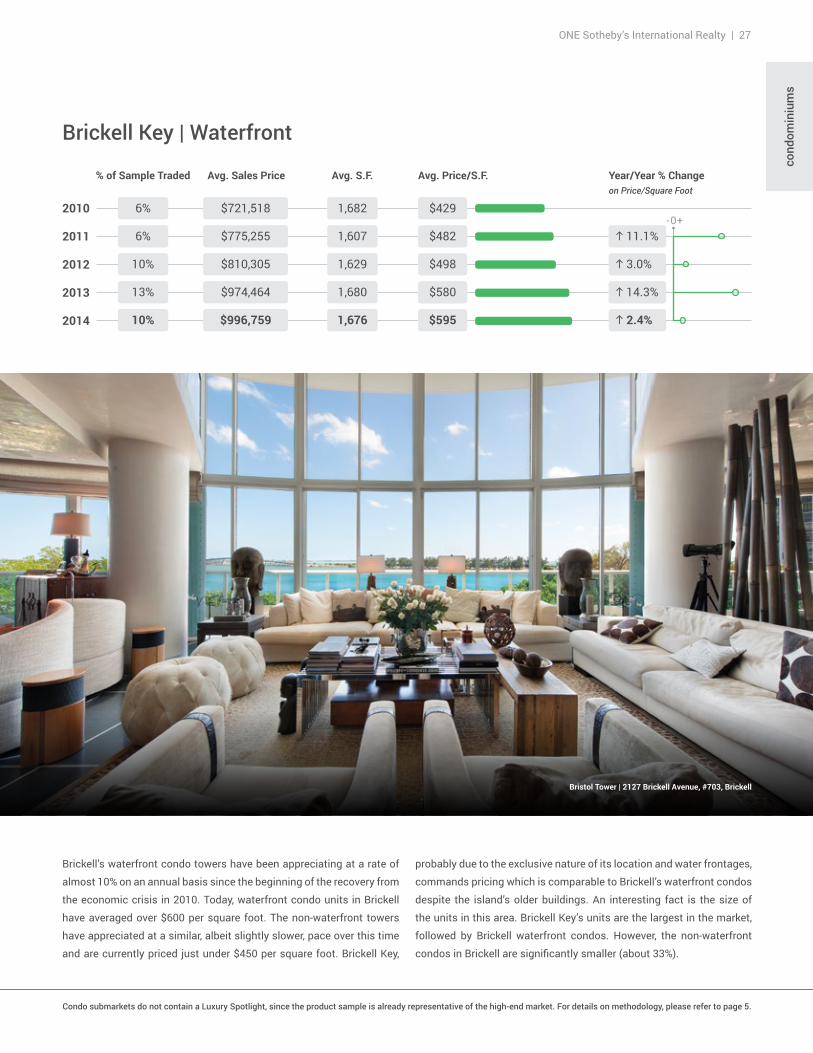
Brickell Key | Waterfront
% of Sample Traded
6%
6%
10%
13%
10%
Avg. Sales Price Avg. S.F. Avg. Price/S.F. Year/Year % Changeon Price/Square Foot
g 14.3%
g 3.0%
g 11.1%
g 2.4%
$580
$498
$482
$595
$429
1,680
1,629
1,607
1,676
1,682$721,518
$775,255
$810,305
$974,464
$996,759
cond
omin
ium
s
Brickell’s waterfront condo towers have been appreciating at a rate of
almost 10% on an annual basis since the beginning of the recovery from
the economic crisis in 2010. Today, waterfront condo units in Brickell
have averaged over $600 per square foot. The non-waterfront towers
have appreciated at a similar, albeit slightly slower, pace over this time
and are currently priced just under $450 per square foot. Brickell Key,
probably due to the exclusive nature of its location and water frontages,
commands pricing which is comparable to Brickell’s waterfront condos
despite the island’s older buildings. An interesting fact is the size of
the units in this area. Brickell Key’s units are the largest in the market,
followed by Brickell waterfront condos. However, the non-waterfront
condos in Brickell are significantly smaller (about 33%).
Bristol Tower | 2127 Brickell Avenue, #703, Brickell
Condo submarkets do not contain a Luxury Spotlight, since the product sample is already representative of the high-end market. For details on methodology, please refer to page 5.
28 | 2015 TRENDS Market Report
Downtown MiamiCondo Market Index
Brickell | Miami’s South End
Midtown | Miami’s North End
-0+2010
2011
2012
2013
2014
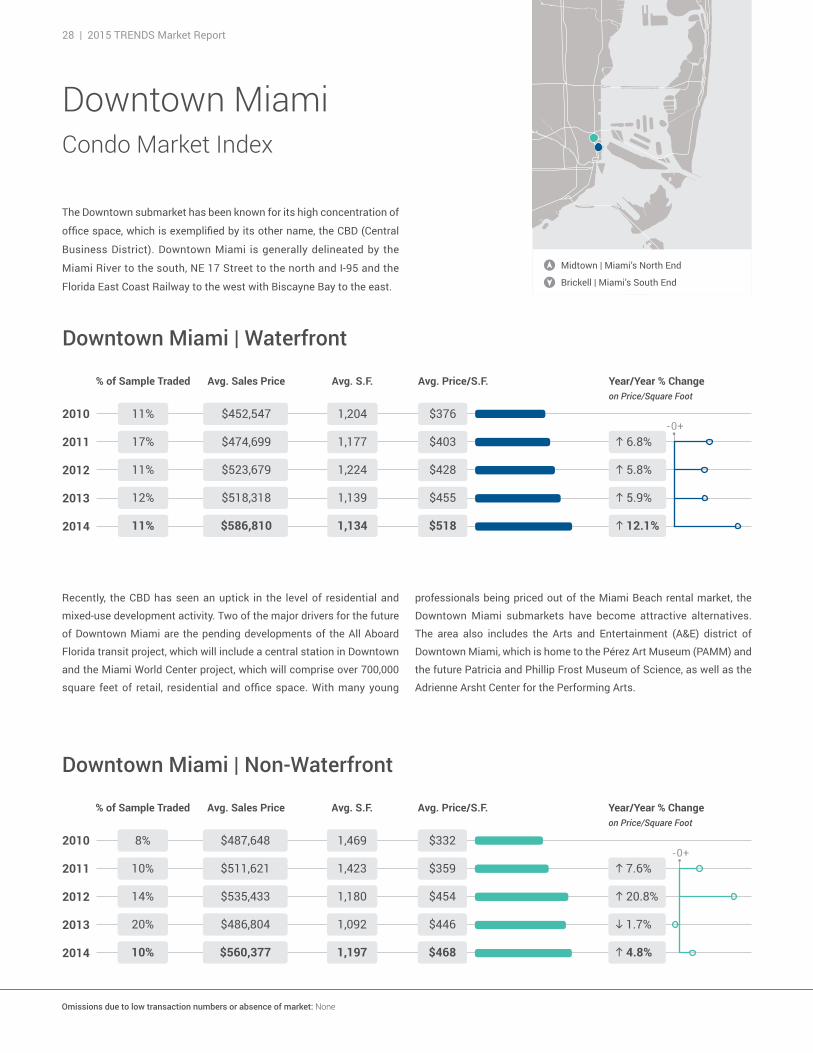
Downtown Miami | Waterfront
% of Sample Traded
11%
17%
11%
12%
11%
Avg. Sales Price Avg. S.F. Avg. Price/S.F. Year/Year % Changeon Price/Square Foot
g 5.9%
g 5.8%
g 6.8%
g 12.1%
$455
$428
$403
$518
$376
1,139
1,224
1,177
1,134
1,204$452,547
$474,699
$523,679
$518,318
$586,810
-0+2010
2011
2012
2013
2014
Downtown Miami | Non-Waterfront
% of Sample Traded
8%
10%
14%
20%
10%
Avg. Sales Price Avg. S.F. Avg. Price/S.F. Year/Year % Changeon Price/Square Foot
h 1.7%
g 20.8%
g 7.6%
g 4.8%
$446
$454
$359
$468
$332
1,092
1,180
1,423
1,197
1,469$487,648
$511,621
$535,433
$486,804
$560,377
The Downtown submarket has been known for its high concentration of
office space, which is exemplified by its other name, the CBD (Central
Business District). Downtown Miami is generally delineated by the
Miami River to the south, NE 17 Street to the north and I-95 and the
Florida East Coast Railway to the west with Biscayne Bay to the east.
Recently, the CBD has seen an uptick in the level of residential and
mixed-use development activity. Two of the major drivers for the future
of Downtown Miami are the pending developments of the All Aboard
Florida transit project, which will include a central station in Downtown
and the Miami World Center project, which will comprise over 700,000
square feet of retail, residential and office space. With many young
professionals being priced out of the Miami Beach rental market, the
Downtown Miami submarkets have become attractive alternatives.
The area also includes the Arts and Entertainment (A&E) district of
Downtown Miami, which is home to the Pérez Art Museum (PAMM) and
the future Patricia and Phillip Frost Museum of Science, as well as the
Adrienne Arsht Center for the Performing Arts.
Omissions due to low transaction numbers or absence of market: None
ONE Sotheby’s International Realty | 29
cond
omin
ium
s
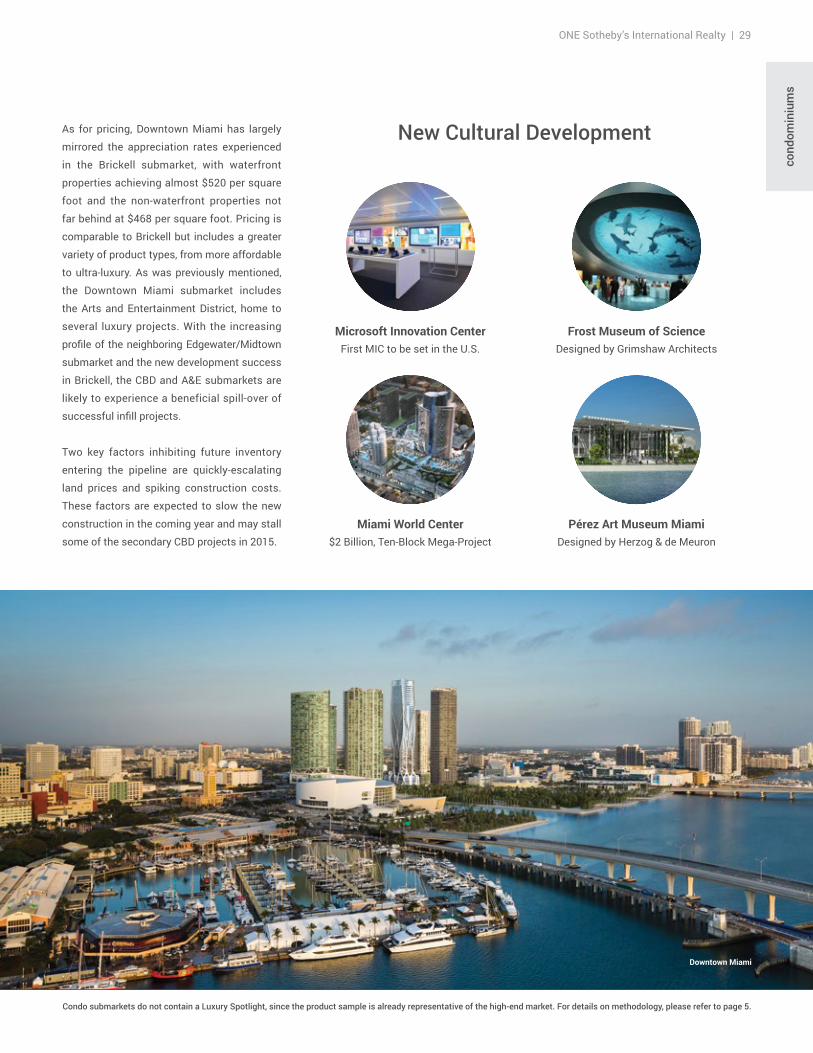
As for pricing, Downtown Miami has largely
mirrored the appreciation rates experienced
in the Brickell submarket, with waterfront
properties achieving almost $520 per square
foot and the non-waterfront properties not
far behind at $468 per square foot. Pricing is
comparable to Brickell but includes a greater
variety of product types, from more affordable
to ultra-luxury. As was previously mentioned,
the Downtown Miami submarket includes
the Arts and Entertainment District, home to
several luxury projects. With the increasing
profile of the neighboring Edgewater/Midtown
submarket and the new development success
in Brickell, the CBD and A&E submarkets are
likely to experience a beneficial spill-over of
successful infill projects.
Two key factors inhibiting future inventory
entering the pipeline are quickly-escalating
land prices and spiking construction costs.
These factors are expected to slow the new
construction in the coming year and may stall
some of the secondary CBD projects in 2015.
New Cultural Development
Microsoft Innovation CenterFirst MIC to be set in the U.S.
Condo submarkets do not contain a Luxury Spotlight, since the product sample is already representative of the high-end market. For details on methodology, please refer to page 5.
Miami World Center$2 Billion, Ten-Block Mega-Project
Frost Museum of ScienceDesigned by Grimshaw Architects
Pérez Art Museum MiamiDesigned by Herzog & de Meuron
Downtown Miami

30 | 2015 TRENDS Market Report
Edgewater & MidtownCondo Market Index
Downtown | Brickell | Miami’s South End
Miami’s North End | Ft. Lauderdale
-0+2010
2011
2012
2013
2014
Edgewater | Waterfront
% of Sample Traded
1%
1%
2%
3%
1%
Avg. Sales Price Avg. S.F. Avg. Price/S.F. Year/Year % Changeon Price/Square Foot
h 5.9%
h 36.1%
g 68.3%
g 19.1%
$324
$343
$467
$401
$148
3,303
3,216
2,353
3,378
1,128$167,000
$1,100,000
$1,104,386
$1,071,458
$1,353,857
-0+2010
2011
2012
2013
2014
Edgewater | Non-Waterfront
% of Sample Traded
8%
9%
10%
17%
11%
Avg. Sales Price Avg. S.F. Avg. Price/S.F. Year/Year % Changeon Price/Square Foot
g 18.3%
h 21.8%
g 27.0%
g 3.2%
$333
$272
$331
$344
$242
1,156
1,142
1,100
1,106
1,152$278,485
$364,299
$310,387
$384,652
$379,903
The Edgewater/Midtown submarket is comprised of East Edgewater
and the Midtown district just west of Biscayne Boulevard and West
Edgewater. Edgewater is located on the eastern strip of coastal land
immediately north of Downtown Miami (aka the CBD), with Midtown
found on the west side of the Florida East Coast Railway.
Edgewater had been overlooked for over a decade leading up to 2012,
when Jorge Pérez of the Related Group announced that he would be
developing a four-tower residential/resort project within the Edgewater
submarket known as the Paraiso Bay master development. Related’s
plan called for about 1,400 residential units, luxury amenities and an
elaborate, bayfront walkway within the two-acre development site.
Paraiso Bay was just the first of various residential and mixed-use
developments to be announced in the neighborhood later on. There
are now over 1,500 condo units currently under construction with more
than 2,000 more units in the planning pipeline. Much of the charm and
appeal of the Biscayne Corridor area is the easy accessibility to the
Miami CBD, the interstate highways and Miami Beach. Additionally, the
area is significantly less congested than the Central Business District
and condo residences are typically much larger and more affordable
than they are in comparable developments elsewhere in the Greater
Downtown Miami market.
Omissions due to low transaction numbers or absence of market: None
ONE Sotheby’s International Realty | 31
-0+2010
2011
2012
2013
2014
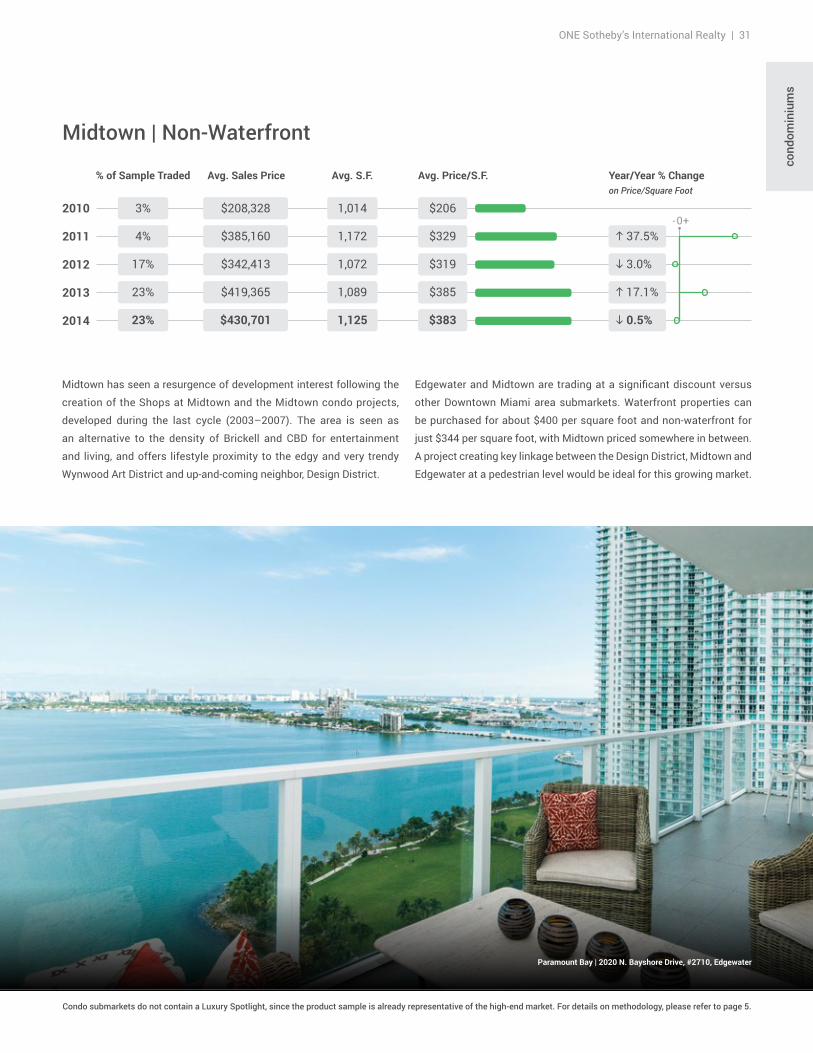
Midtown | Non-Waterfront
% of Sample Traded
3%
4%
17%
23%
23%
Avg. Sales Price Avg. S.F. Avg. Price/S.F. Year/Year % Changeon Price/Square Foot
g 17.1%
h 3.0%
g 37.5%
h 0.5%
$385
$319
$329
$383
$206
1,089
1,072
1,172
1,125
1,014$208,328
$385,160
$342,413
$419,365
$430,701
cond
omin
ium
s
Paramount Bay | 2020 N. Bayshore Drive, #2710, Edgewater
Condo submarkets do not contain a Luxury Spotlight, since the product sample is already representative of the high-end market. For details on methodology, please refer to page 5.
Midtown has seen a resurgence of development interest following the
creation of the Shops at Midtown and the Midtown condo projects,
developed during the last cycle (2003–2007). The area is seen as
an alternative to the density of Brickell and CBD for entertainment
and living, and offers lifestyle proximity to the edgy and very trendy
Wynwood Art District and up-and-coming neighbor, Design District.
Edgewater and Midtown are trading at a significant discount versus
other Downtown Miami area submarkets. Waterfront properties can
be purchased for about $400 per square foot and non-waterfront for
just $344 per square foot, with Midtown priced somewhere in between.
A project creating key linkage between the Design District, Midtown and
Edgewater at a pedestrian level would be ideal for this growing market.
32 | 2015 TRENDS Market Report
Miami BeachCondo Market Index
Miami’s South End
Miami’s North End | Ft. Lauderdale
-0+2010
2011
2012
2013
2014
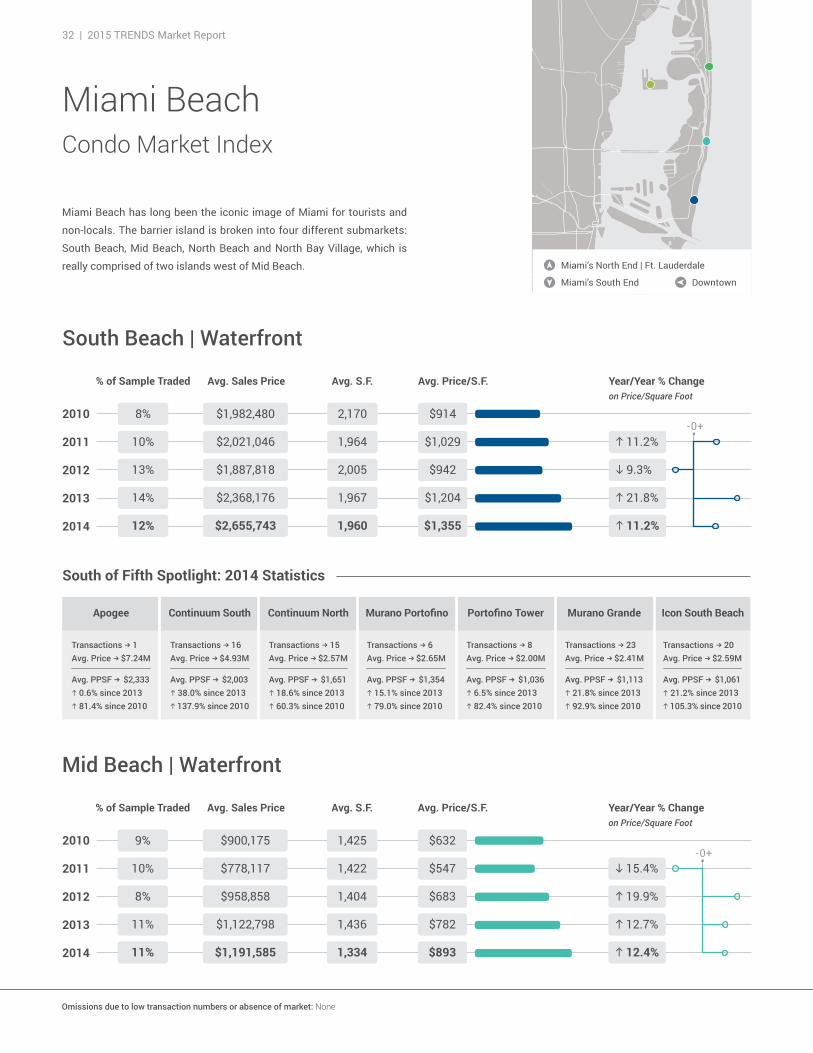
South Beach | Waterfront
% of Sample Traded
8%
10%
13%
14%
12%
Avg. Sales Price Avg. S.F. Avg. Price/S.F. Year/Year % Changeon Price/Square Foot
g 21.8%
h 9.3%
g 11.2%
g 11.2%
$1,204
$942
$1,029
$1,355
$914
1,967
2,005
1,964
1,960
2,170$1,982,480
$2,021,046
$1,887,818
$2,368,176
$2,655,743
-0+2010
2011
2012
2013
2014
Mid Beach | Waterfront
% of Sample Traded
9%
10%
8%
11%
11%
Avg. Sales Price Avg. S.F. Avg. Price/S.F. Year/Year % Changeon Price/Square Foot
g 12.7%
g 19.9%
h 15.4%
g 12.4%
$782
$683
$547
$893
$632
1,436
1,404
1,422
1,334
1,425$900,175
$778,117
$958,858
$1,122,798
$1,191,585
Miami Beach has long been the iconic image of Miami for tourists and
non-locals. The barrier island is broken into four different submarkets:
South Beach, Mid Beach, North Beach and North Bay Village, which is
really comprised of two islands west of Mid Beach. Downtown
South of Fifth Spotlight: 2014 Statistics
Omissions due to low transaction numbers or absence of market: None
Apogee Continuum South Continuum North Murano Portofino Murano Grande Icon South BeachPortofino Tower
Transactions b 1 Avg. Price b $7.24M
Avg. PPSF b $2,333g 0.6% since 2013g 81.4% since 2010
Transactions b 16 Avg. Price b $4.93M
Avg. PPSF b $2,003g 38.0% since 2013g 137.9% since 2010
Transactions b 15 Avg. Price b $2.57M
Avg. PPSF b $1,651g 18.6% since 2013g 60.3% since 2010
Transactions b 6 Avg. Price b $2.65M
Avg. PPSF b $1,354g 15.1% since 2013g 79.0% since 2010
Transactions b 8 Avg. Price b $2.00M
Avg. PPSF b $1,036g 6.5% since 2013g 82.4% since 2010
Transactions b 23 Avg. Price b $2.41M
Avg. PPSF b $1,113g 21.8% since 2013g 92.9% since 2010
Transactions b 20 Avg. Price b $2.59M
Avg. PPSF b $1,061g 21.2% since 2013g 105.3% since 2010
ONE Sotheby’s International Realty | 33
-0+2010
2011
2012
2013
2014
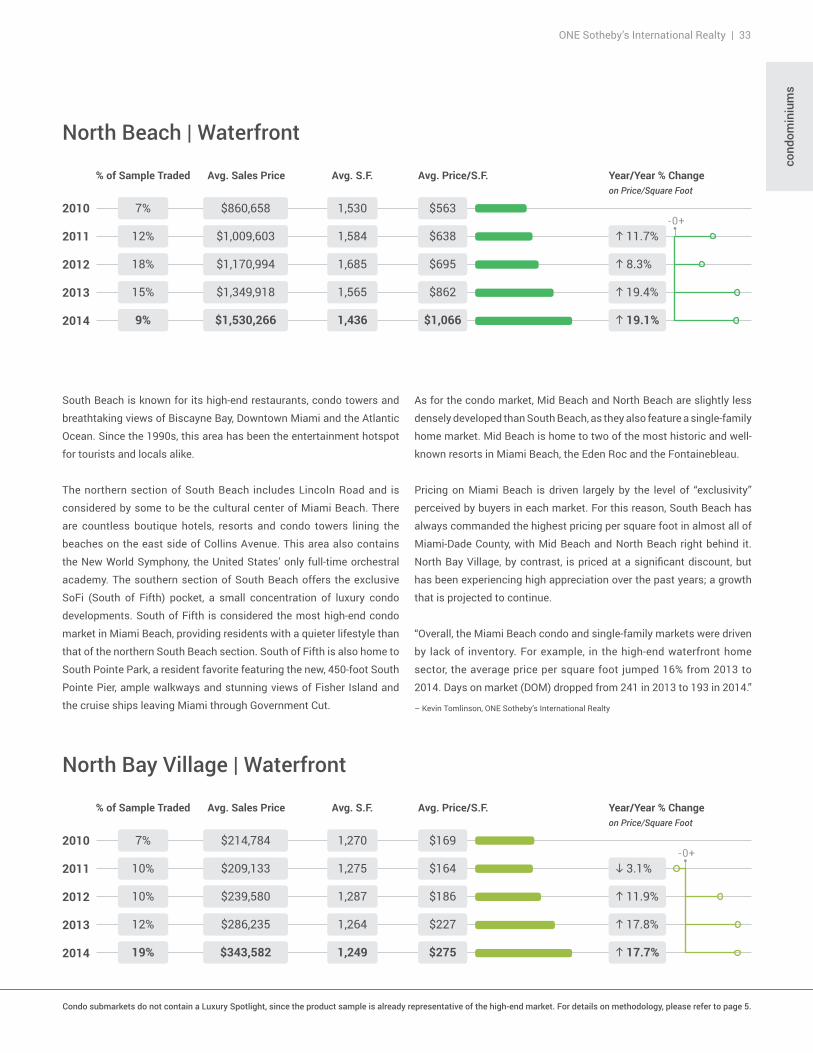
North Beach | Waterfront
% of Sample Traded
7%
12%
18%
15%
9%
Avg. Sales Price Avg. S.F. Avg. Price/S.F. Year/Year % Changeon Price/Square Foot
g 19.4%
g 8.3%
g 11.7%
g 19.1%
$862
$695
$638
$1,066
$563
1,565
1,685
1,584
1,436
1,530$860,658
$1,009,603
$1,170,994
$1,349,918
$1,530,266
-0+2010
2011
2012
2013
2014
North Bay Village | Waterfront
% of Sample Traded
7%
10%
10%
12%
19%
Avg. Sales Price Avg. S.F. Avg. Price/S.F. Year/Year % Changeon Price/Square Foot
g 17.8%
g 11.9%
h 3.1%
g 17.7%
$227
$186
$164
$275
$169
1,264
1,287
1,275
1,249
1,270$214,784
$209,133
$239,580
$286,235
$343,582
As for the condo market, Mid Beach and North Beach are slightly less
densely developed than South Beach, as they also feature a single-family
home market. Mid Beach is home to two of the most historic and well-
known resorts in Miami Beach, the Eden Roc and the Fontainebleau.
Pricing on Miami Beach is driven largely by the level of “exclusivity”
perceived by buyers in each market. For this reason, South Beach has
always commanded the highest pricing per square foot in almost all of
Miami-Dade County, with Mid Beach and North Beach right behind it.
North Bay Village, by contrast, is priced at a significant discount, but
has been experiencing high appreciation over the past years; a growth
that is projected to continue.
“Overall, the Miami Beach condo and single-family markets were driven
by lack of inventory. For example, in the high-end waterfront home
sector, the average price per square foot jumped 16% from 2013 to
2014. Days on market (DOM) dropped from 241 in 2013 to 193 in 2014.”
– Kevin Tomlinson, ONE Sotheby’s International Realty
cond
omin
ium
s
Condo submarkets do not contain a Luxury Spotlight, since the product sample is already representative of the high-end market. For details on methodology, please refer to page 5.
South Beach is known for its high-end restaurants, condo towers and
breathtaking views of Biscayne Bay, Downtown Miami and the Atlantic
Ocean. Since the 1990s, this area has been the entertainment hotspot
for tourists and locals alike.
The northern section of South Beach includes Lincoln Road and is
considered by some to be the cultural center of Miami Beach. There
are countless boutique hotels, resorts and condo towers lining the
beaches on the east side of Collins Avenue. This area also contains
the New World Symphony, the United States’ only full-time orchestral
academy. The southern section of South Beach offers the exclusive
SoFi (South of Fifth) pocket, a small concentration of luxury condo
developments. South of Fifth is considered the most high-end condo
market in Miami Beach, providing residents with a quieter lifestyle than
that of the northern South Beach section. South of Fifth is also home to
South Pointe Park, a resident favorite featuring the new, 450-foot South
Pointe Pier, ample walkways and stunning views of Fisher Island and
the cruise ships leaving Miami through Government Cut.
34 | 2015 TRENDS Market Report
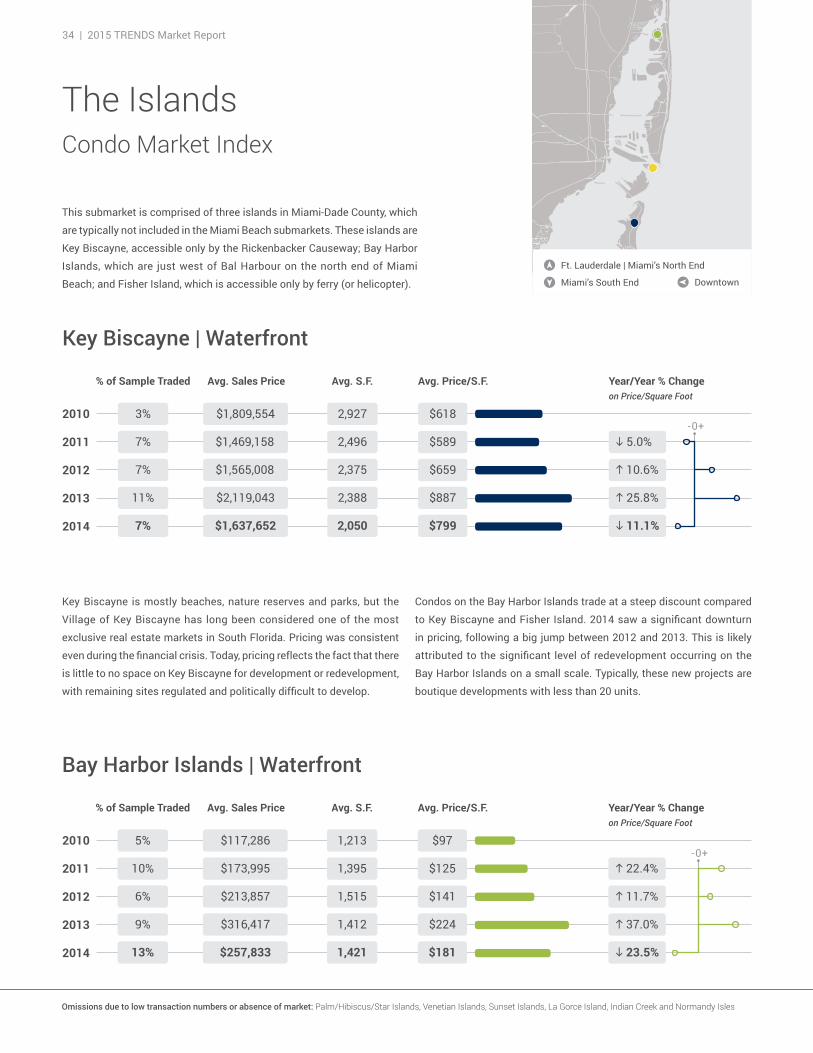
The IslandsCondo Market Index
-0+2010
2011
2012
2013
2014
Key Biscayne | Waterfront
% of Sample Traded
3%
7%
7%
11%
7%
Avg. Sales Price Avg. S.F. Avg. Price/S.F. Year/Year % Changeon Price/Square Foot
g 25.8%
g 10.6%
h 5.0%
h 11.1%
$887
$659
$589
$799
$618
2,388
2,375
2,496
2,050
2,927$1,809,554
$1,469,158
$1,565,008
$2,119,043
$1,637,652
-0+2010
2011
2012
2013
2014
Bay Harbor Islands | Waterfront
% of Sample Traded
5%
10%
6%
9%
13%
Avg. Sales Price Avg. S.F. Avg. Price/S.F. Year/Year % Changeon Price/Square Foot
g 37.0%
g 11.7%
g 22.4%
h 23.5%
$224
$141
$125
$181
$97
1,412
1,515
1,395
1,421
1,213$117,286
$173,995
$213,857
$316,417
$257,833
This submarket is comprised of three islands in Miami-Dade County, which
are typically not included in the Miami Beach submarkets. These islands are
Key Biscayne, accessible only by the Rickenbacker Causeway; Bay Harbor
Islands, which are just west of Bal Harbour on the north end of Miami
Beach; and Fisher Island, which is accessible only by ferry (or helicopter). Miami’s South End
Ft. Lauderdale | Miami’s North End
Downtown
Key Biscayne is mostly beaches, nature reserves and parks, but the
Village of Key Biscayne has long been considered one of the most
exclusive real estate markets in South Florida. Pricing was consistent
even during the financial crisis. Today, pricing reflects the fact that there
is little to no space on Key Biscayne for development or redevelopment,
with remaining sites regulated and politically difficult to develop.
Condos on the Bay Harbor Islands trade at a steep discount compared
to Key Biscayne and Fisher Island. 2014 saw a significant downturn
in pricing, following a big jump between 2012 and 2013. This is likely
attributed to the significant level of redevelopment occurring on the
Bay Harbor Islands on a small scale. Typically, these new projects are
boutique developments with less than 20 units.
Omissions due to low transaction numbers or absence of market: Palm/Hibiscus/Star Islands, Venetian Islands, Sunset Islands, La Gorce Island, Indian Creek and Normandy Isles
ONE Sotheby’s International Realty | 35
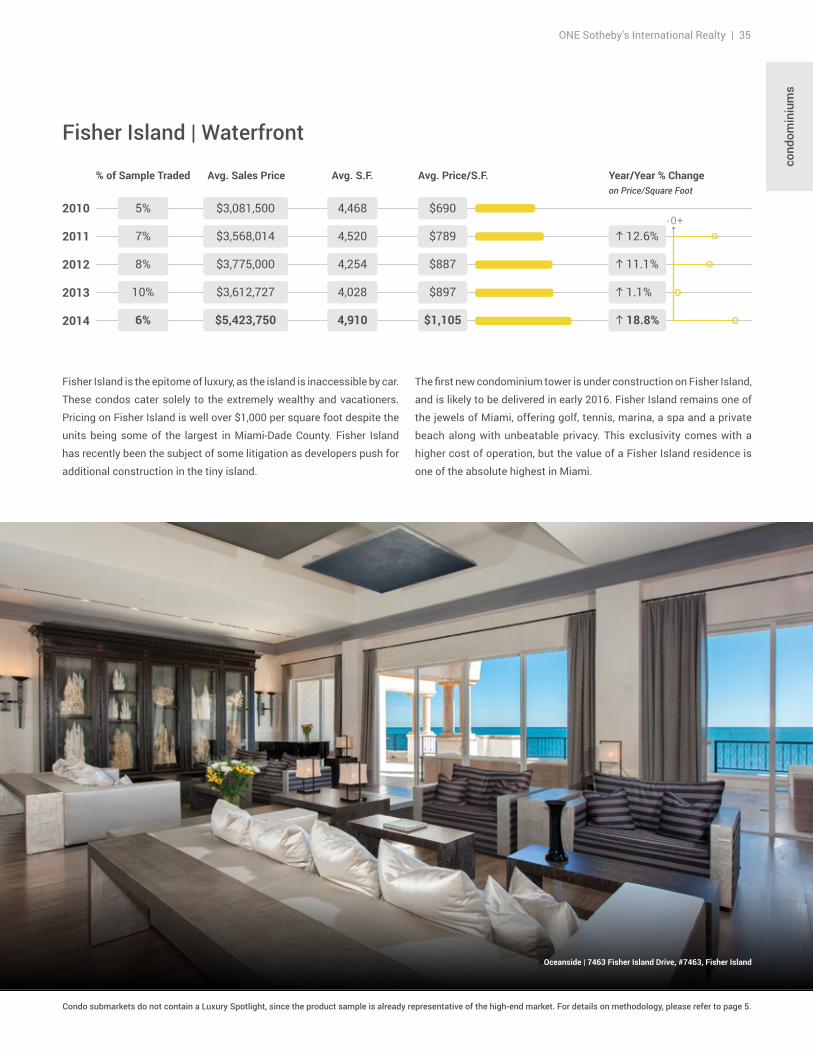
Fisher Island is the epitome of luxury, as the island is inaccessible by car.
These condos cater solely to the extremely wealthy and vacationers.
Pricing on Fisher Island is well over $1,000 per square foot despite the
units being some of the largest in Miami-Dade County. Fisher Island
has recently been the subject of some litigation as developers push for
additional construction in the tiny island.
-0+2010
2011
2012
2013
2014
Fisher Island | Waterfront
% of Sample Traded
5%
7%
8%
10%
6%
Avg. Sales Price Avg. S.F. Avg. Price/S.F. Year/Year % Changeon Price/Square Foot
g 1.1%
g 11.1%
g 12.6%
g 18.8%
$897
$887
$789
$1,105
$690
4,028
4,254
4,520
4,910
4,468$3,081,500
$3,568,014
$3,775,000
$3,612,727
$5,423,750
cond
omin
ium
s
The first new condominium tower is under construction on Fisher Island,
and is likely to be delivered in early 2016. Fisher Island remains one of
the jewels of Miami, offering golf, tennis, marina, a spa and a private
beach along with unbeatable privacy. This exclusivity comes with a
higher cost of operation, but the value of a Fisher Island residence is
one of the absolute highest in Miami.
Condo submarkets do not contain a Luxury Spotlight, since the product sample is already representative of the high-end market. For details on methodology, please refer to page 5.
Oceanside | 7463 Fisher Island Drive, #7463, Fisher Island
36 | 2015 TRENDS Market Report
Miami | North EndCondo Market Index
Downtown | Miami Beach
Broward’s South End | Ft. Lauderdale
-0+2010
2011
2012
2013
2014
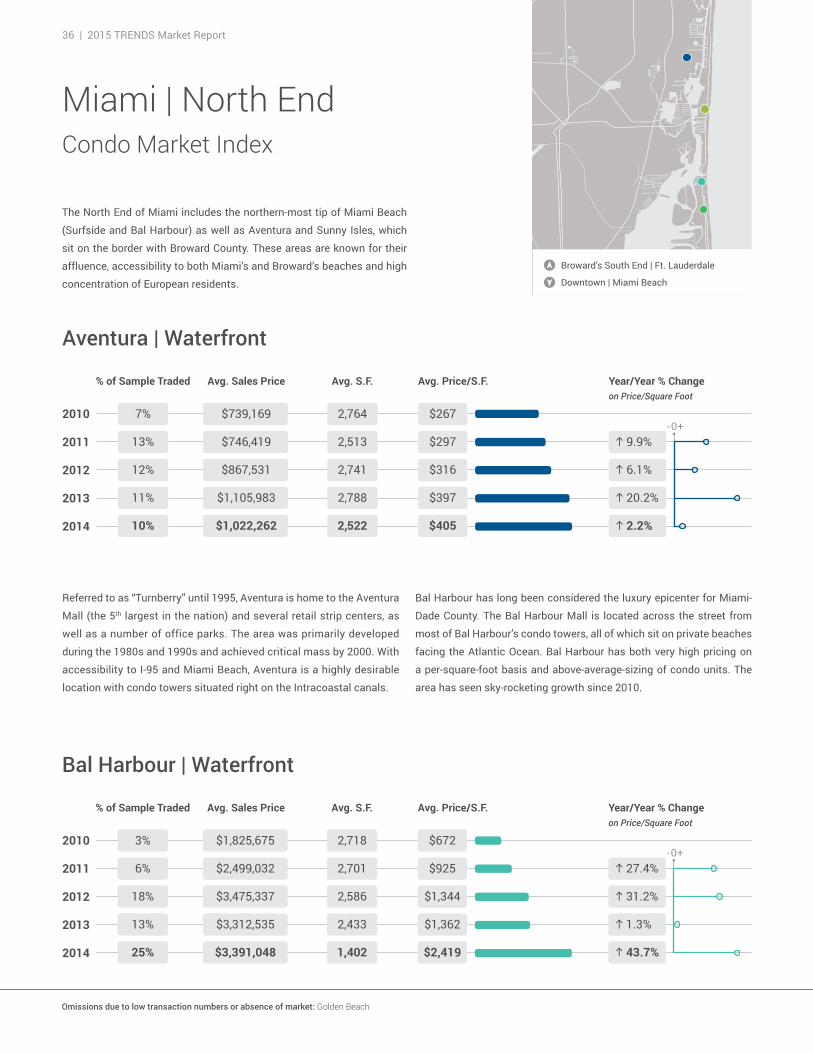
Aventura | Waterfront
% of Sample Traded
7%
13%
12%
11%
10%
Avg. Sales Price Avg. S.F. Avg. Price/S.F. Year/Year % Changeon Price/Square Foot
g 20.2%
g 6.1%
g 9.9%
g 2.2%
$397
$316
$297
$405
$267
2,788
2,741
2,513
2,522
2,764$739,169
$746,419
$867,531
$1,105,983
$1,022,262
-0+2010
2011
2012
2013
2014
Bal Harbour | Waterfront
% of Sample Traded
3%
6%
18%
13%
25%
Avg. Sales Price Avg. S.F. Avg. Price/S.F. Year/Year % Changeon Price/Square Foot
g 1.3%
g 31.2%
g 27.4%
g 43.7%
$1,362
$1,344
$925
$2,419
$672
2,433
2,586
2,701
1,402
2,718$1,825,675
$2,499,032
$3,475,337
$3,312,535
$3,391,048
The North End of Miami includes the northern-most tip of Miami Beach
(Surfside and Bal Harbour) as well as Aventura and Sunny Isles, which
sit on the border with Broward County. These areas are known for their
affluence, accessibility to both Miami’s and Broward’s beaches and high
concentration of European residents.
Referred to as “Turnberry” until 1995, Aventura is home to the Aventura
Mall (the 5th largest in the nation) and several retail strip centers, as
well as a number of office parks. The area was primarily developed
during the 1980s and 1990s and achieved critical mass by 2000. With
accessibility to I-95 and Miami Beach, Aventura is a highly desirable
location with condo towers situated right on the Intracoastal canals.
Bal Harbour has long been considered the luxury epicenter for Miami-
Dade County. The Bal Harbour Mall is located across the street from
most of Bal Harbour’s condo towers, all of which sit on private beaches
facing the Atlantic Ocean. Bal Harbour has both very high pricing on
a per-square-foot basis and above-average-sizing of condo units. The
area has seen sky-rocketing growth since 2010.
Omissions due to low transaction numbers or absence of market: Golden Beach
ONE Sotheby’s International Realty | 37
cond
omin
ium
s
-0+2010
2011
2012
2013
2014
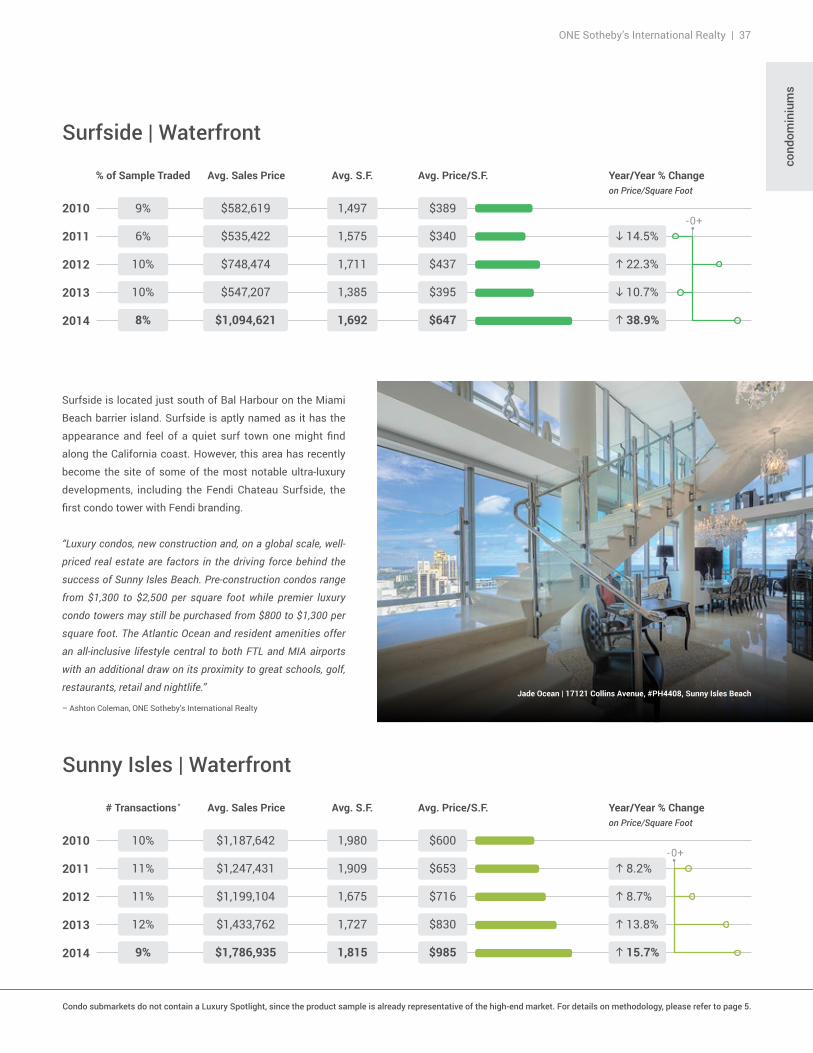
Surfside | Waterfront
% of Sample Traded
9%
6%
10%
10%
8%
Avg. Sales Price Avg. S.F. Avg. Price/S.F. Year/Year % Changeon Price/Square Foot
h 10.7%
g 22.3%
h 14.5%
g 38.9%
$395
$437
$340
$647
$389
1,385
1,711
1,575
1,692
1,497$582,619
$535,422
$748,474
$547,207
$1,094,621
-0+2010
2011
2012
2013
2014
Sunny Isles | Waterfront
# Transactions *
10%
11%
11%
12%
9%
Avg. Sales Price Avg. S.F. Avg. Price/S.F. Year/Year % Changeon Price/Square Foot
g 13.8%
g 8.7%
g 8.2%
g 15.7%
$830
$716
$653
$985
$600
1,727
1,675
1,909
1,815
1,980$1,187,642
$1,247,431
$1,199,104
$1,433,762
$1,786,935
Surfside is located just south of Bal Harbour on the Miami
Beach barrier island. Surfside is aptly named as it has the
appearance and feel of a quiet surf town one might find
along the California coast. However, this area has recently
become the site of some of the most notable ultra-luxury
developments, including the Fendi Chateau Surfside, the
first condo tower with Fendi branding.
“Luxury condos, new construction and, on a global scale, well-
priced real estate are factors in the driving force behind the
success of Sunny Isles Beach. Pre-construction condos range
from $1,300 to $2,500 per square foot while premier luxury
condo towers may still be purchased from $800 to $1,300 per
square foot. The Atlantic Ocean and resident amenities offer
an all-inclusive lifestyle central to both FTL and MIA airports
with an additional draw on its proximity to great schools, golf,
restaurants, retail and nightlife.”
– Ashton Coleman, ONE Sotheby’s International Realty
Condo submarkets do not contain a Luxury Spotlight, since the product sample is already representative of the high-end market. For details on methodology, please refer to page 5.
Jade Ocean | 17121 Collins Avenue, #PH4408, Sunny Isles Beach
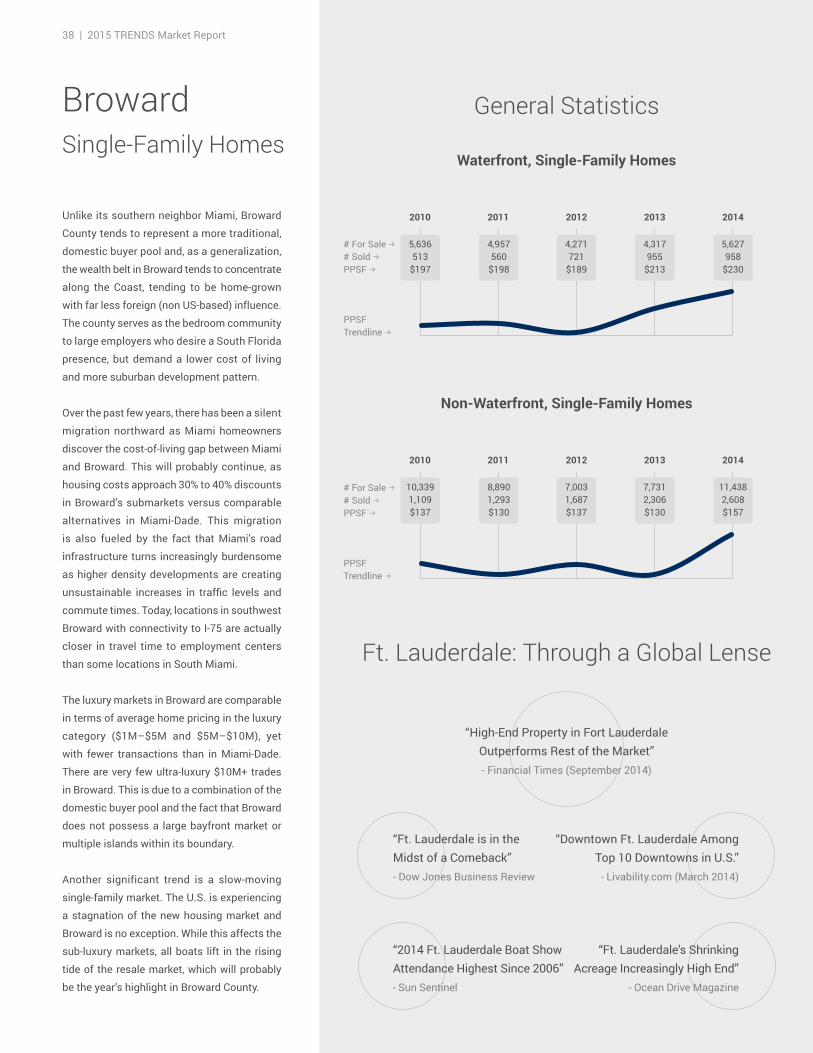
38 | 2015 TRENDS Market Report
Luxury SpotlightGeneral Statistics
Unlike its southern neighbor Miami, Broward
County tends to represent a more traditional,
domestic buyer pool and, as a generalization,
the wealth belt in Broward tends to concentrate
along the Coast, tending to be home-grown
with far less foreign (non US-based) influence.
The county serves as the bedroom community
to large employers who desire a South Florida
presence, but demand a lower cost of living
and more suburban development pattern.
Over the past few years, there has been a silent
migration northward as Miami homeowners
discover the cost-of-living gap between Miami
and Broward. This will probably continue, as
housing costs approach 30% to 40% discounts
in Broward’s submarkets versus comparable
alternatives in Miami-Dade. This migration
is also fueled by the fact that Miami’s road
infrastructure turns increasingly burdensome
as higher density developments are creating
unsustainable increases in traffic levels and
commute times. Today, locations in southwest
Broward with connectivity to I-75 are actually
closer in travel time to employment centers
than some locations in South Miami.
The luxury markets in Broward are comparable
in terms of average home pricing in the luxury
category ($1M–$5M and $5M–$10M), yet
with fewer transactions than in Miami-Dade.
There are very few ultra-luxury $10M+ trades
in Broward. This is due to a combination of the
domestic buyer pool and the fact that Broward
does not possess a large bayfront market or
multiple islands within its boundary.
Another significant trend is a slow-moving
single-family market. The U.S. is experiencing
a stagnation of the new housing market and
Broward is no exception. While this affects the
sub-luxury markets, all boats lift in the rising
tide of the resale market, which will probably
be the year’s highlight in Broward County.
BrowardSingle-Family Homes
Waterfront, Single-Family Homes
Non-Waterfront, Single-Family Homes
Ft. Lauderdale: Through a Global Lense
2010 2011 2012 2013 2014
10,339 1,109$137
8,890 1,293$130
7,003 1,687$137
7,7312,306$130
11,438 2,608$157
# For Sale b# Sold bPPSF b
PPSF Trendline b
2010 2011 2012 2013 2014
5,636 513
$197
4,957560
$198
4,271 721
$189
4,317 955
$213
5,627 958
$230
# For Sale b# Sold bPPSF b
PPSF Trendline b
“High-End Property in Fort Lauderdale Outperforms Rest of the Market” - Financial Times (September 2014)
“2014 Ft. Lauderdale Boat Show Attendance Highest Since 2006” - Sun Sentinel
“Ft. Lauderdale is in the Midst of a Comeback” - Dow Jones Business Review
“Ft. Lauderdale’s Shrinking Acreage Increasingly High End”
- Ocean Drive Magazine
“Downtown Ft. Lauderdale Among Top 10 Downtowns in U.S.”
- Livability.com (March 2014)
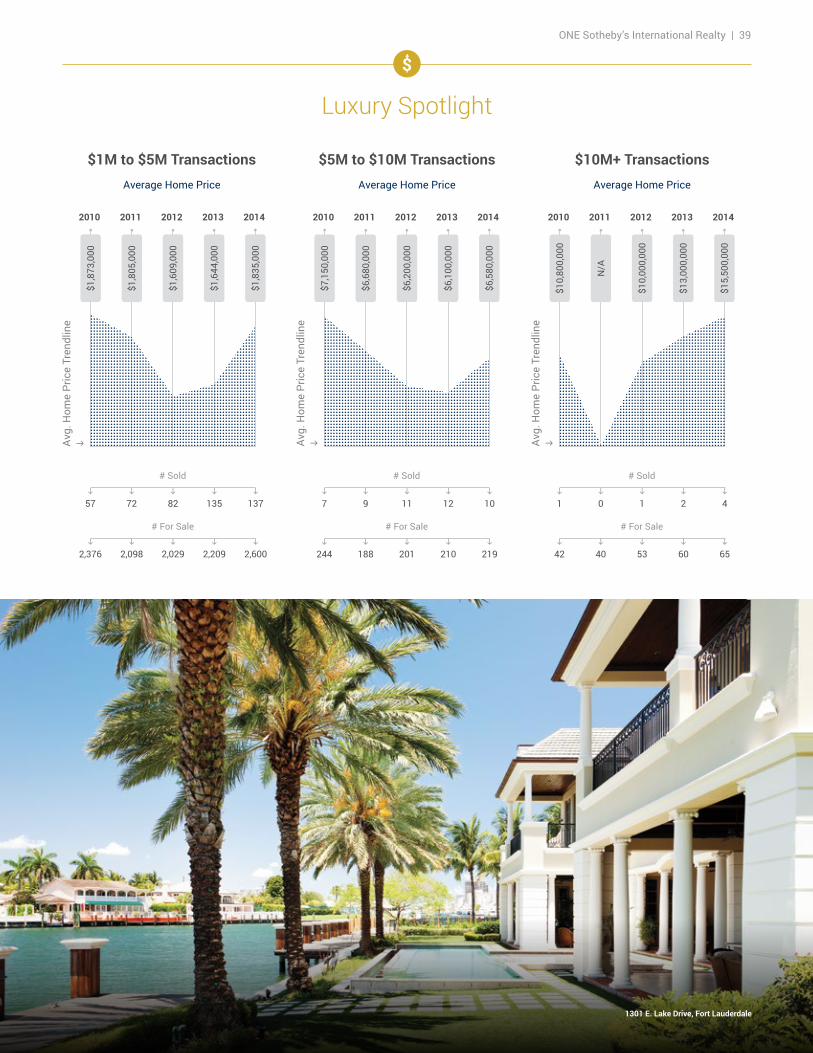
ONE Sotheby’s International Realty | 39
$1M to $5M TransactionsAverage Home Price
$5M to $10M TransactionsAverage Home Price
$10M+ TransactionsAverage Home Price
2010 2011 2012 2013 2014
$1,8
73,0
00
$1,8
05,0
00
$1,6
09,0
00
$1,6
44,0
00
$1,8
35,0
00
h
57
h
2,376
h
72
h
2,098
# Sold
# For Sale
h
135
h
2,209
h
137
h
2,600
h
82
h
2,029
2010 2011 2012 2013 2014
$7,1
50,0
00
$6,6
80,0
00
$6,2
00,0
00
$6,1
00,0
00
$6,5
80,0
00h
7
h
244
h
9
h
188
# Sold
# For Sale
h
12
h
210
h
10
h
219
h
11
h
201
2010 2011 2012 2013 2014
$10,
800,
000
N/A
$10,
000,
000
$13,
000,
000
$15,
500,
000
h
1
h
42
h
0
h
40
# Sold
# For Sale
h
2
h
60
h
4
h
65
h
1
h
53
Luxury Spotlight
Avg.
Hom
e Pr
ice
Tren
dlin
eh Av
g. H
ome
Pric
e Tr
endl
ine
h Avg.
Hom
e Pr
ice
Tren
dlin
eh
1301 E. Lake Drive, Fort Lauderdale
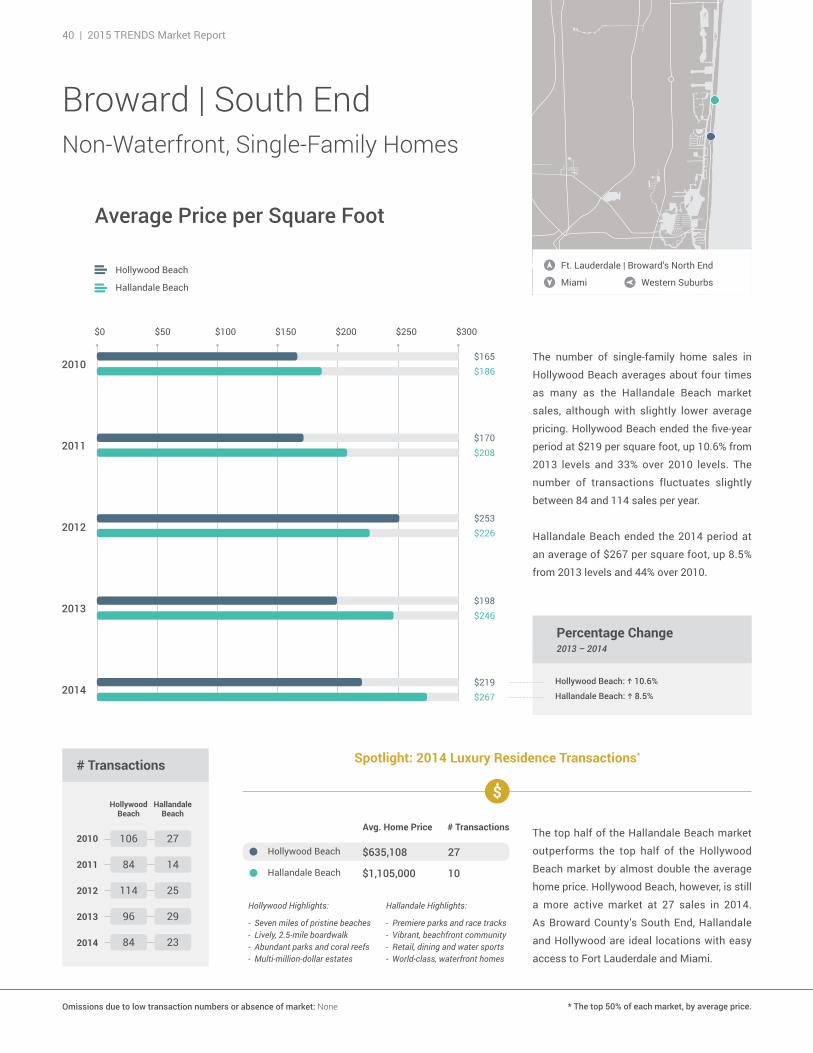
40 | 2015 TRENDS Market Report
Percentage Change2013 – 2014
The number of single-family home sales in
Hollywood Beach averages about four times
as many as the Hallandale Beach market
sales, although with slightly lower average
pricing. Hollywood Beach ended the five-year
period at $219 per square foot, up 10.6% from
2013 levels and 33% over 2010 levels. The
number of transactions fluctuates slightly
between 84 and 114 sales per year.
Hallandale Beach ended the 2014 period at
an average of $267 per square foot, up 8.5%
from 2013 levels and 44% over 2010.
Hallandale Beach: g 8.5%
Hollywood Beach: g 10.6%
Hallandale Beach
Hollywood Beach
Average Price per Square Foot
# Transactions
Hollywood Beach
Hallandale Beach
2010
2011
2012
2013
2014
106 27
84 14
114 25
96 29
84 23
Broward | South EndNon-Waterfront, Single-Family Homes
$165$186
Miami
Ft. Lauderdale | Broward’s North End
Western Suburbs
$219$267
$170$208
$198$246
$300$200$100$0 $250$150$50
$253$226
Hollywood Beach
Hallandale Beach
Avg. Home Price # Transactions
$635,108 27
$1,105,000 10
* The top 50% of each market, by average price.Omissions due to low transaction numbers or absence of market: None
Spotlight: 2014 Luxury Residence Transactions*
The top half of the Hallandale Beach market
outperforms the top half of the Hollywood
Beach market by almost double the average
home price. Hollywood Beach, however, is still
a more active market at 27 sales in 2014.
As Broward County’s South End, Hallandale
and Hollywood are ideal locations with easy
access to Fort Lauderdale and Miami.
Hollywood Highlights:
- Seven miles of pristine beaches- Lively, 2.5-mile boardwalk- Abundant parks and coral reefs- Multi-million-dollar estates
Hallandale Highlights:
- Premiere parks and race tracks- Vibrant, beachfront community- Retail, dining and water sports- World-class, waterfront homes
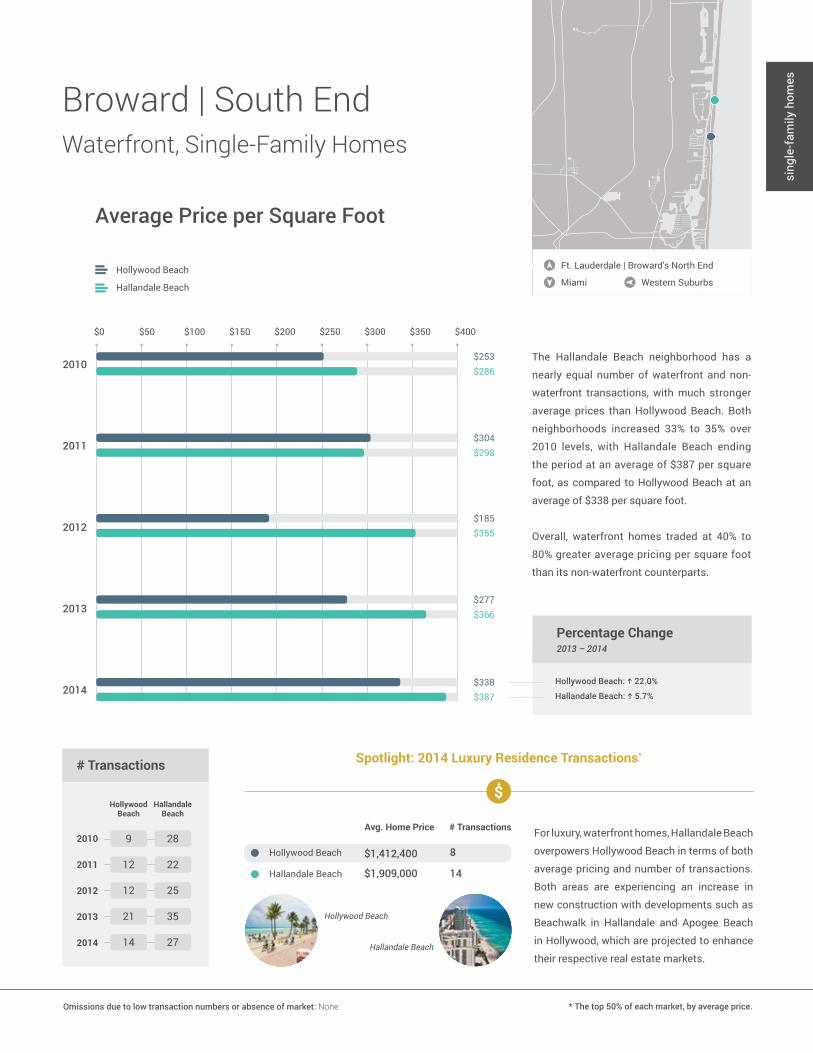
ONE Sotheby’s International Realty | 41
The Hallandale Beach neighborhood has a
nearly equal number of waterfront and non-
waterfront transactions, with much stronger
average prices than Hollywood Beach. Both
neighborhoods increased 33% to 35% over
2010 levels, with Hallandale Beach ending
the period at an average of $387 per square
foot, as compared to Hollywood Beach at an
average of $338 per square foot.
Overall, waterfront homes traded at 40% to
80% greater average pricing per square foot
than its non-waterfront counterparts.
Average Price per Square Foot
sing
le-f
amily
hom
es
Broward | South EndWaterfront, Single-Family Homes
$253$286
$338$387
$304$298
$400$200$150$100$50$0 $250 $300 $350
Miami
Ft. Lauderdale | Broward’s North End
Western SuburbsHallandale Beach
Hollywood Beach
Percentage Change2013 – 2014
Hallandale Beach: g 5.7%
Hollywood Beach: g 22.0%
# Transactions
Hollywood Beach
Hallandale Beach
2010
2011
2012
2013
2014
9 28
12 22
12 25
21 35
14 27
$185$355
$277$366
Hollywood Beach
Hallandale Beach
Avg. Home Price # Transactions
$1,412,400 8
$1,909,000 14
* The top 50% of each market, by average price.Omissions due to low transaction numbers or absence of market: None
Spotlight: 2014 Luxury Residence Transactions*
For luxury, waterfront homes, Hallandale Beach
overpowers Hollywood Beach in terms of both
average pricing and number of transactions.
Both areas are experiencing an increase in
new construction with developments such as
Beachwalk in Hallandale and Apogee Beach
in Hollywood, which are projected to enhance
their respective real estate markets.
Hollywood Beach
Hallandale Beach
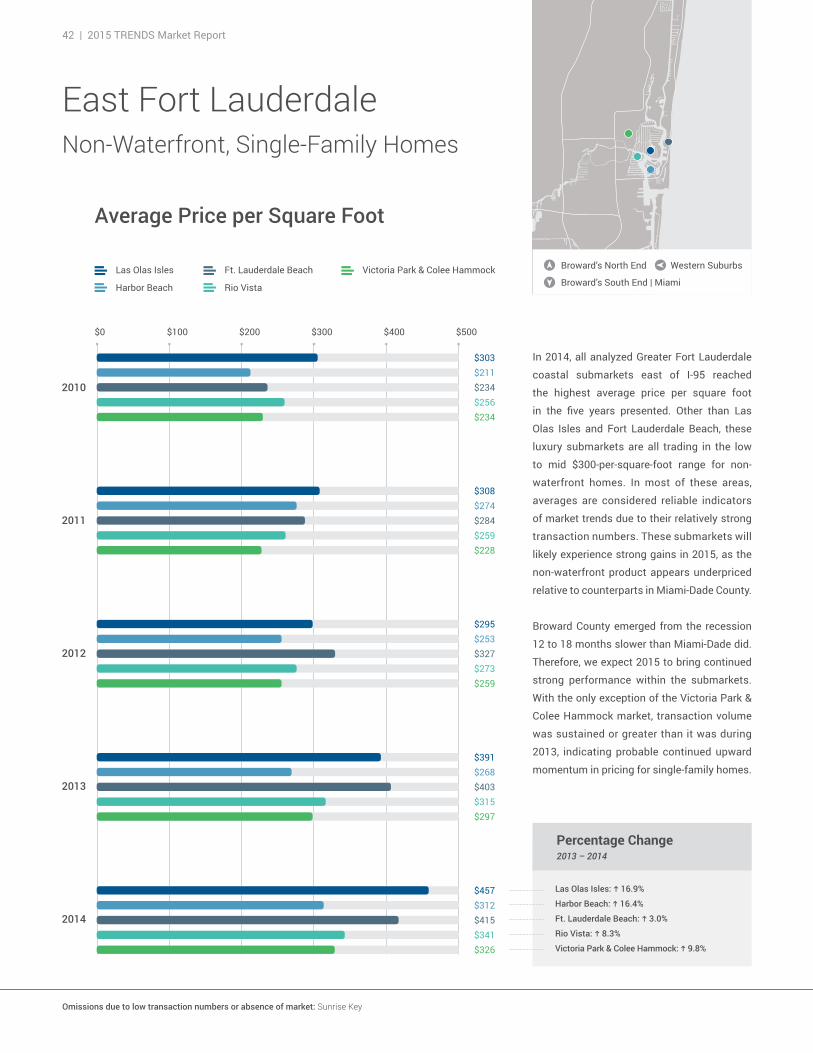
42 | 2015 TRENDS Market Report
Percentage Change2013 – 2014
In 2014, all analyzed Greater Fort Lauderdale
coastal submarkets east of I-95 reached
the highest average price per square foot
in the five years presented. Other than Las
Olas Isles and Fort Lauderdale Beach, these
luxury submarkets are all trading in the low
to mid $300-per-square-foot range for non-
waterfront homes. In most of these areas,
averages are considered reliable indicators
of market trends due to their relatively strong
transaction numbers. These submarkets will
likely experience strong gains in 2015, as the
non-waterfront product appears underpriced
relative to counterparts in Miami-Dade County.
Broward County emerged from the recession
12 to 18 months slower than Miami-Dade did.
Therefore, we expect 2015 to bring continued
strong performance within the submarkets.
With the only exception of the Victoria Park &
Colee Hammock market, transaction volume
was sustained or greater than it was during
2013, indicating probable continued upward
momentum in pricing for single-family homes.
Victoria Park & Colee Hammock: g 9.8%
Las Olas Isles: g 16.9%
Harbor Beach: g 16.4%
Rio Vista: g 8.3%
Ft. Lauderdale Beach: g 3.0%
Harbor Beach
Las Olas Isles Ft. Lauderdale Beach
Rio Vista
Victoria Park & Colee Hammock
Average Price per Square Foot
East Fort LauderdaleNon-Waterfront, Single-Family Homes
$500$400$300$200$100$0
$457$312$415$341$326
$391$268$403$315$297
$295$253$327$273$259
$308$274$284$259$228
$303$211$234$256$234
Omissions due to low transaction numbers or absence of market: Sunrise Key
Broward’s South End | Miami
Broward’s North End Western Suburbs
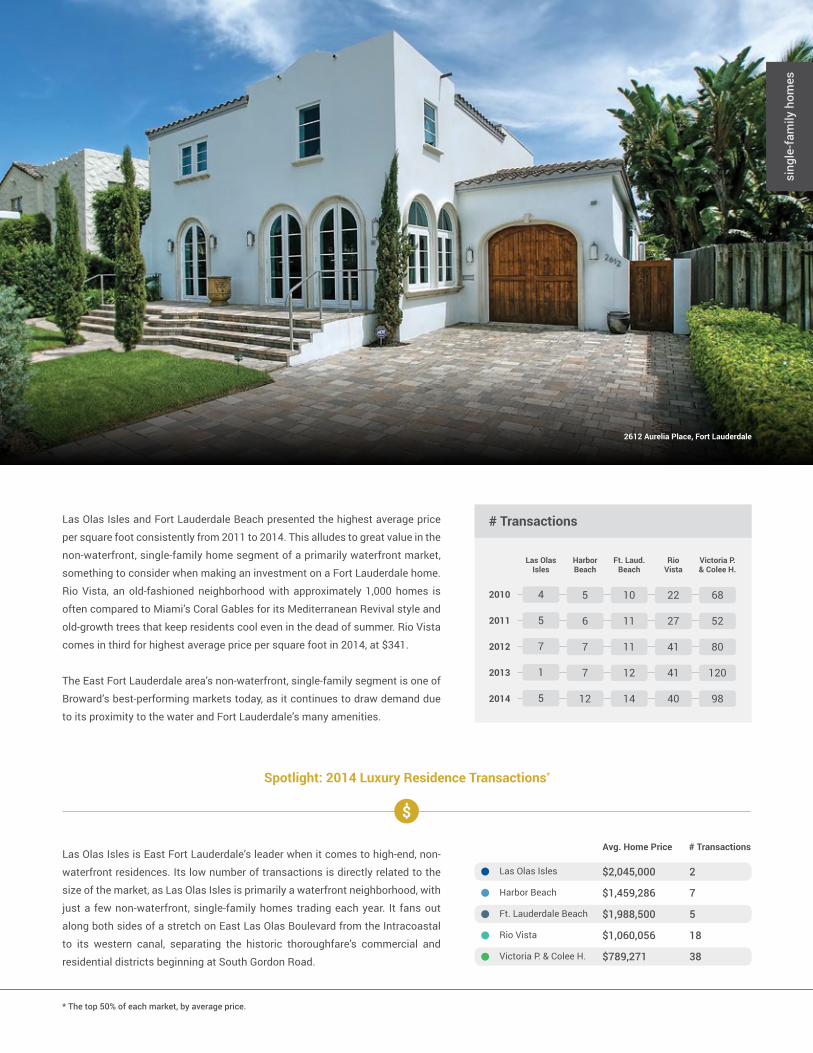
ONE Sotheby’s International Realty | 43
sing
le-f
amily
hom
es
# Transactions
5 10 22 68
Las Olas Isles
6 11 27 52
HarborBeach
7 11 41 80
Ft. Laud.Beach
7 12 41 120
RioVista
12 14 40 98
Victoria P.& Colee H.
2010
2011
2012
2013
2014
4
5
7
1
5
Las Olas Isles and Fort Lauderdale Beach presented the highest average price
per square foot consistently from 2011 to 2014. This alludes to great value in the
non-waterfront, single-family home segment of a primarily waterfront market,
something to consider when making an investment on a Fort Lauderdale home.
Rio Vista, an old-fashioned neighborhood with approximately 1,000 homes is
often compared to Miami’s Coral Gables for its Mediterranean Revival style and
old-growth trees that keep residents cool even in the dead of summer. Rio Vista
comes in third for highest average price per square foot in 2014, at $341.
The East Fort Lauderdale area’s non-waterfront, single-family segment is one of
Broward’s best-performing markets today, as it continues to draw demand due
to its proximity to the water and Fort Lauderdale’s many amenities.
Las Olas Isles
Harbor Beach
Ft. Lauderdale Beach
Rio Vista
Victoria P. & Colee H.
Avg. Home Price # Transactions
$2,045,000 2
$1,459,286 7
$1,988,500 5
$1,060,056 18
$789,271 38
* The top 50% of each market, by average price.
Spotlight: 2014 Luxury Residence Transactions*
2612 Aurelia Place, Fort Lauderdale
Las Olas Isles is East Fort Lauderdale’s leader when it comes to high-end, non-
waterfront residences. Its low number of transactions is directly related to the
size of the market, as Las Olas Isles is primarily a waterfront neighborhood, with
just a few non-waterfront, single-family homes trading each year. It fans out
along both sides of a stretch on East Las Olas Boulevard from the Intracoastal
to its western canal, separating the historic thoroughfare’s commercial and
residential districts beginning at South Gordon Road.
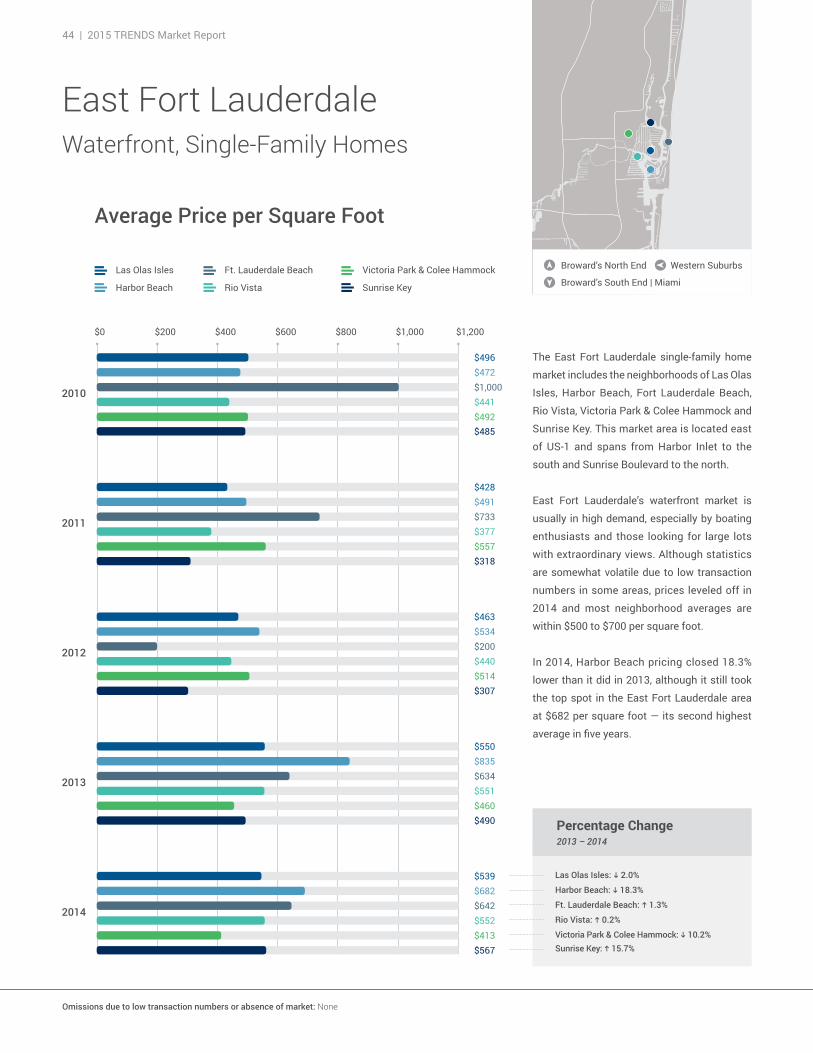
44 | 2015 TRENDS Market Report
East Fort LauderdaleWaterfront, Single-Family Homes
$567
$539$682$642$552$413
$490
$550$835$634$551$460
$307
$463$534$200$440$514
$318
$428$491$733$377$557
$485
$496$472$1,000$441$492
Broward’s South End | Miami
Broward’s North End Western Suburbs
$1,200$800$600$400$200$0 $1,000
Sunrise Key
Average Price per Square Foot
Percentage Change2013 – 2014
Sunrise Key: g 15.7%
Las Olas Isles: h 2.0%
Harbor Beach: h 18.3%
Rio Vista: g 0.2%
Ft. Lauderdale Beach: g 1.3%
Harbor Beach
Las Olas Isles Ft. Lauderdale Beach
Rio Vista
Victoria Park & Colee Hammock
Omissions due to low transaction numbers or absence of market: None
Victoria Park & Colee Hammock: h 10.2%
The East Fort Lauderdale single-family home
market includes the neighborhoods of Las Olas
Isles, Harbor Beach, Fort Lauderdale Beach,
Rio Vista, Victoria Park & Colee Hammock and
Sunrise Key. This market area is located east
of US-1 and spans from Harbor Inlet to the
south and Sunrise Boulevard to the north.
East Fort Lauderdale’s waterfront market is
usually in high demand, especially by boating
enthusiasts and those looking for large lots
with extraordinary views. Although statistics
are somewhat volatile due to low transaction
numbers in some areas, prices leveled off in
2014 and most neighborhood averages are
within $500 to $700 per square foot.
In 2014, Harbor Beach pricing closed 18.3%
lower than it did in 2013, although it still took
the top spot in the East Fort Lauderdale area
at $682 per square foot — its second highest
average in five years.
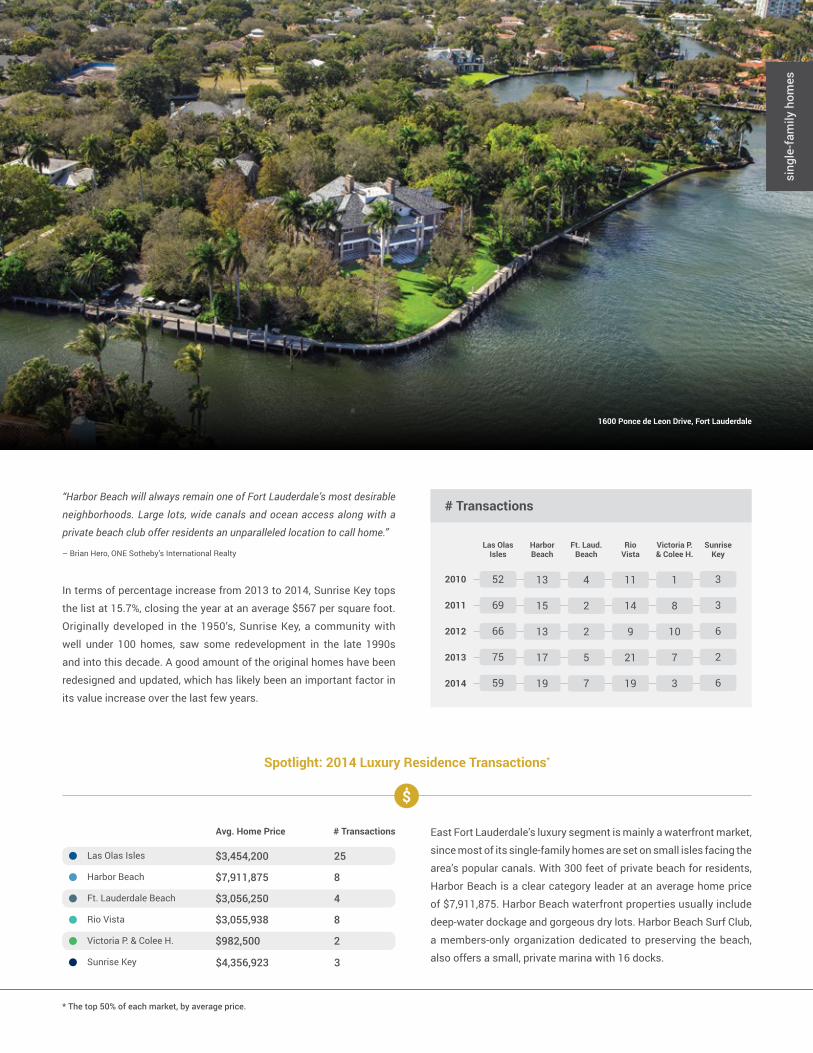
ONE Sotheby’s International Realty | 45
1600 Ponce de Leon Drive, Fort Lauderdale
sing
le-f
amily
hom
es
# Transactions
13 4 11 1
Las Olas Isles
15 2 14 8
HarborBeach
13 2 9 10
Ft. Laud.Beach
17 5 21 7
RioVista
19 7 19 3
Victoria P.& Colee H.
2010
2011
2012
2013
2014
52
69
66
75
Sunrise Key
3
3
6
2
659
Spotlight: 2014 Luxury Residence Transactions*
* The top 50% of each market, by average price.
“Harbor Beach will always remain one of Fort Lauderdale’s most desirable
neighborhoods. Large lots, wide canals and ocean access along with a
private beach club offer residents an unparalleled location to call home.”
– Brian Hero, ONE Sotheby’s International Realty
In terms of percentage increase from 2013 to 2014, Sunrise Key tops
the list at 15.7%, closing the year at an average $567 per square foot.
Originally developed in the 1950’s, Sunrise Key, a community with
well under 100 homes, saw some redevelopment in the late 1990s
and into this decade. A good amount of the original homes have been
redesigned and updated, which has likely been an important factor in
its value increase over the last few years.
Las Olas Isles
Harbor Beach
Ft. Lauderdale Beach
Rio Vista
Victoria P. & Colee H.
Sunrise Key
Avg. Home Price # Transactions
$3,454,200 25
$7,911,875 8
$3,056,250 4
$3,055,938 8
$982,500 2
$4,356,923 3
East Fort Lauderdale’s luxury segment is mainly a waterfront market,
since most of its single-family homes are set on small isles facing the
area’s popular canals. With 300 feet of private beach for residents,
Harbor Beach is a clear category leader at an average home price
of $7,911,875. Harbor Beach waterfront properties usually include
deep-water dockage and gorgeous dry lots. Harbor Beach Surf Club,
a members-only organization dedicated to preserving the beach,
also offers a small, private marina with 16 docks.
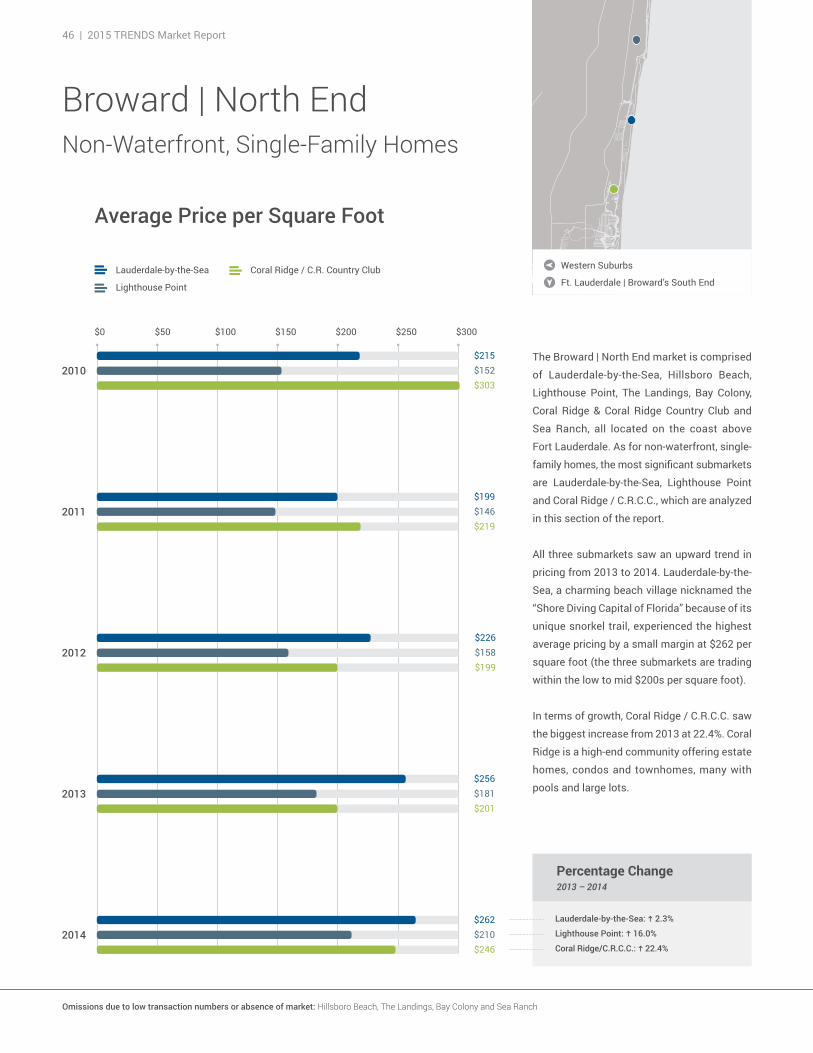
46 | 2015 TRENDS Market Report
$300$200$150$100$50$0 $250
Percentage Change2013 – 2014
Coral Ridge/C.R.C.C.: g 22.4%
Lighthouse Point: g 16.0%
Lauderdale-by-the-Sea: g 2.3%
Broward | North EndNon-Waterfront, Single-Family Homes
$215$152$303
$199$146$219
$262$210$246
$256$181$201
$226$158$199
Ft. Lauderdale | Broward’s South End
Western SuburbsLauderdale-by-the-Sea
Lighthouse Point
Average Price per Square Foot
Coral Ridge / C.R. Country Club
Omissions due to low transaction numbers or absence of market: Hillsboro Beach, The Landings, Bay Colony and Sea Ranch
The Broward | North End market is comprised
of Lauderdale-by-the-Sea, Hillsboro Beach,
Lighthouse Point, The Landings, Bay Colony,
Coral Ridge & Coral Ridge Country Club and
Sea Ranch, all located on the coast above
Fort Lauderdale. As for non-waterfront, single-
family homes, the most significant submarkets
are Lauderdale-by-the-Sea, Lighthouse Point
and Coral Ridge / C.R.C.C., which are analyzed
in this section of the report.
All three submarkets saw an upward trend in
pricing from 2013 to 2014. Lauderdale-by-the-
Sea, a charming beach village nicknamed the
“Shore Diving Capital of Florida” because of its
unique snorkel trail, experienced the highest
average pricing by a small margin at $262 per
square foot (the three submarkets are trading
within the low to mid $200s per square foot).
In terms of growth, Coral Ridge / C.R.C.C. saw
the biggest increase from 2013 at 22.4%. Coral
Ridge is a high-end community offering estate
homes, condos and townhomes, many with
pools and large lots.
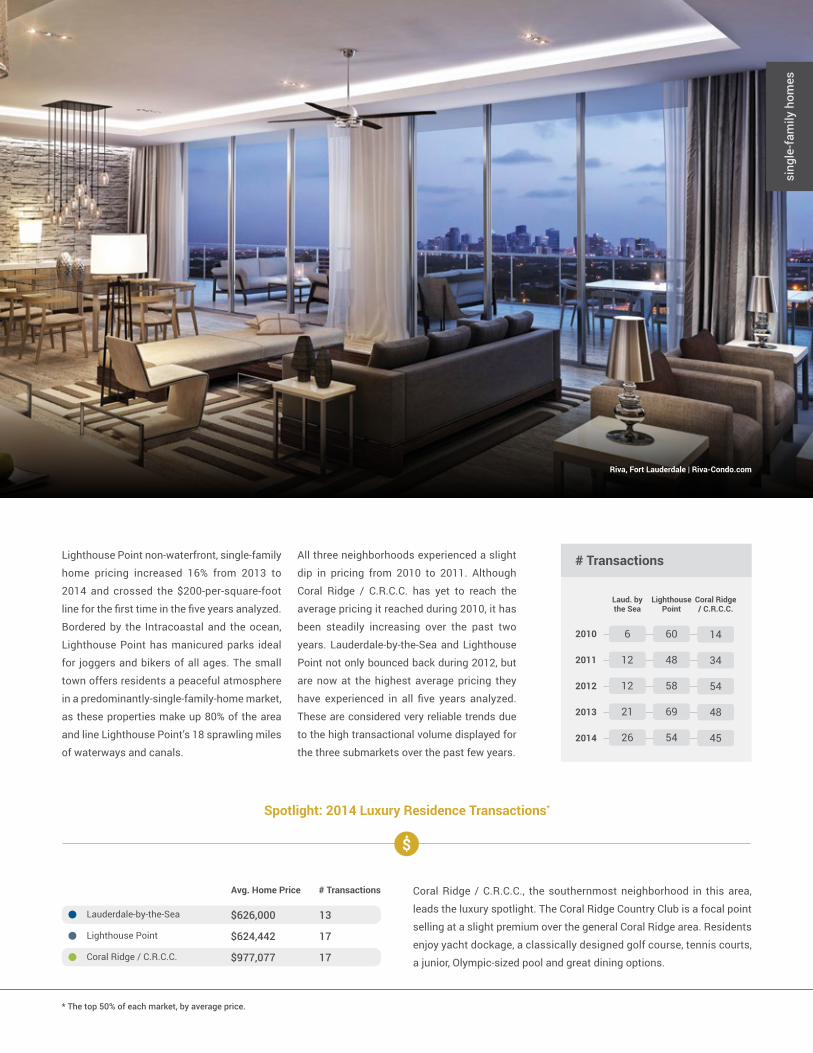
ONE Sotheby’s International Realty | 47
sing
le-f
amily
hom
es
# Transactions
Laud. bythe Sea
14
Lighthouse Point
34
Coral Ridge/ C.R.C.C.
54
48
45
2010
2011
2012
2013
2014
6 60
12 48
12 58
21 69
26 54
Lauderdale-by-the-Sea
Lighthouse Point
Coral Ridge / C.R.C.C.
Avg. Home Price # Transactions
$626,000 13
$624,442 17
$977,077 17
Spotlight: 2014 Luxury Residence Transactions*
* The top 50% of each market, by average price.
Coral Ridge / C.R.C.C., the southernmost neighborhood in this area,
leads the luxury spotlight. The Coral Ridge Country Club is a focal point
selling at a slight premium over the general Coral Ridge area. Residents
enjoy yacht dockage, a classically designed golf course, tennis courts,
a junior, Olympic-sized pool and great dining options.
Lighthouse Point non-waterfront, single-family
home pricing increased 16% from 2013 to
2014 and crossed the $200-per-square-foot
line for the first time in the five years analyzed.
Bordered by the Intracoastal and the ocean,
Lighthouse Point has manicured parks ideal
for joggers and bikers of all ages. The small
town offers residents a peaceful atmosphere
in a predominantly-single-family-home market,
as these properties make up 80% of the area
and line Lighthouse Point’s 18 sprawling miles
of waterways and canals.
All three neighborhoods experienced a slight
dip in pricing from 2010 to 2011. Although
Coral Ridge / C.R.C.C. has yet to reach the
average pricing it reached during 2010, it has
been steadily increasing over the past two
years. Lauderdale-by-the-Sea and Lighthouse
Point not only bounced back during 2012, but
are now at the highest average pricing they
have experienced in all five years analyzed.
These are considered very reliable trends due
to the high transactional volume displayed for
the three submarkets over the past few years.
Riva, Fort Lauderdale | Riva-Condo.com
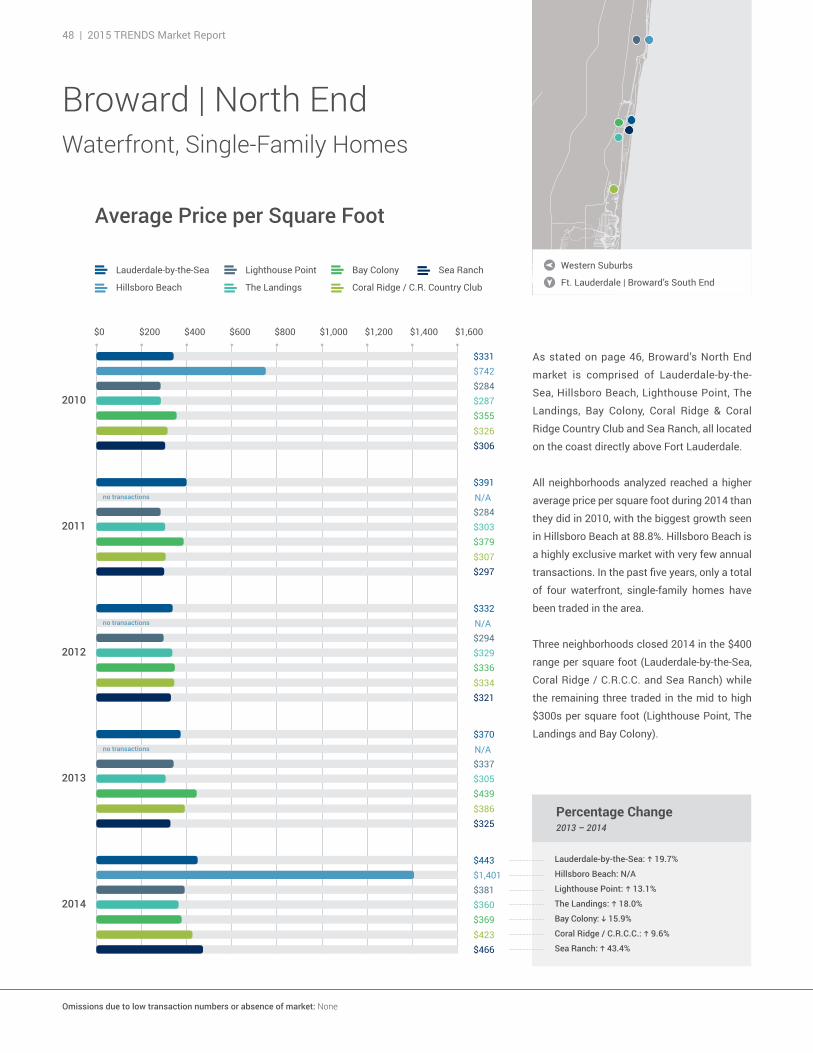
48 | 2015 TRENDS Market Report
Broward | North EndWaterfront, Single-Family Homes
Ft. Lauderdale | Broward’s South End
Western SuburbsLighthouse Point
The Landings
Bay ColonyLauderdale-by-the-Sea
Hillsboro Beach
Average Price per Square Foot
Percentage Change2013 – 2014
Sea Ranch: g 43.4%
Lighthouse Point: g 13.1%
The Landings: g 18.0%
Coral Ridge / C.R.C.C.: g 9.6%
Bay Colony: h 15.9%
Coral Ridge / C.R. Country Club
Sea Ranch
$800$600$400$0 $1,600$1,200$1,000$200 $1,400
$331$742$284$287$355$326$306
$443$1,401$381$360$369$423$466
$332
$294$329$336$334$321
N/Ano transactions
$370
$337$305$439$386$325
N/Ano transactions
$391
$284$303$379$307$297
N/Ano transactions
Lauderdale-by-the-Sea: g 19.7%
Hillsboro Beach: N/A
As stated on page 46, Broward’s North End
market is comprised of Lauderdale-by-the-
Sea, Hillsboro Beach, Lighthouse Point, The
Landings, Bay Colony, Coral Ridge & Coral
Ridge Country Club and Sea Ranch, all located
on the coast directly above Fort Lauderdale.
All neighborhoods analyzed reached a higher
average price per square foot during 2014 than
they did in 2010, with the biggest growth seen
in Hillsboro Beach at 88.8%. Hillsboro Beach is
a highly exclusive market with very few annual
transactions. In the past five years, only a total
of four waterfront, single-family homes have
been traded in the area.
Three neighborhoods closed 2014 in the $400
range per square foot (Lauderdale-by-the-Sea,
Coral Ridge / C.R.C.C. and Sea Ranch) while
the remaining three traded in the mid to high
$300s per square foot (Lighthouse Point, The
Landings and Bay Colony).
Omissions due to low transaction numbers or absence of market: None
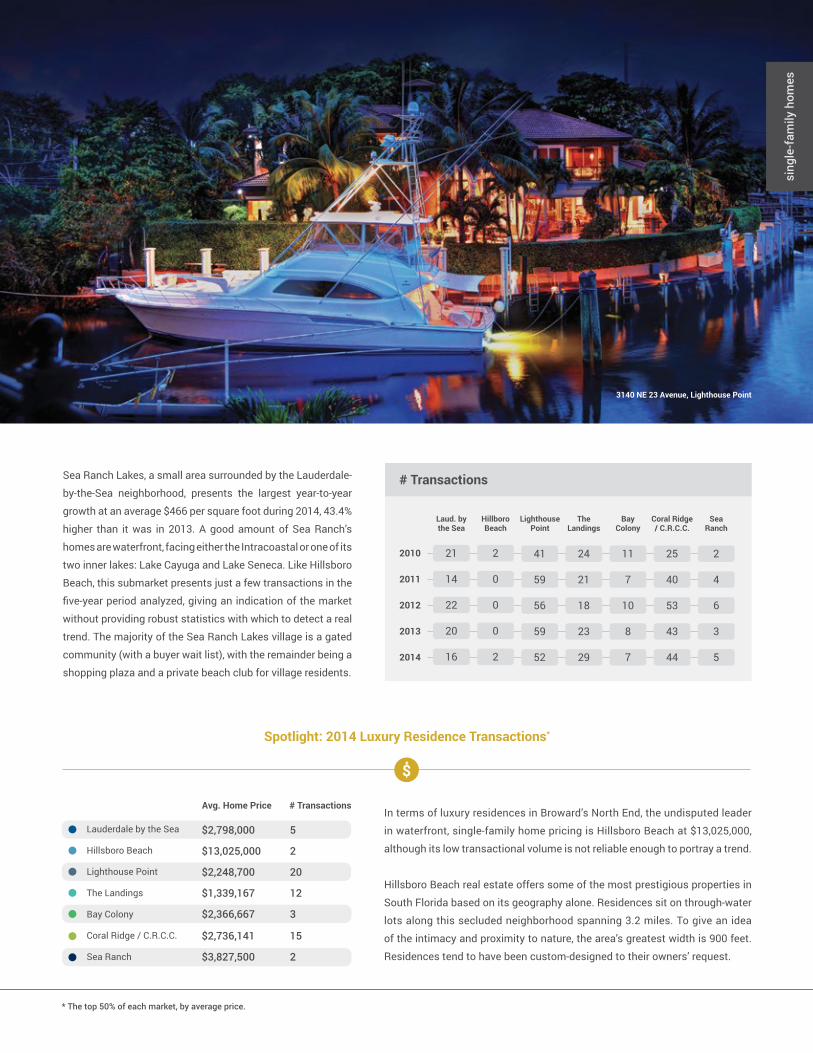
ONE Sotheby’s International Realty | 49
sing
le-f
amily
hom
es
Spotlight: 2014 Luxury Residence Transactions*
* The top 50% of each market, by average price.
# Transactions
Laud. bythe Sea
41 24 11
HillboroBeach
59 21 7
Lighthouse Point
56 18 10
The Landings
59 23 8
Bay Colony
52 29 7
2010
2011
2012
2013
2014
21 2
14 0
22 0
20 0
16 2
25 2
40 4
53 6
Coral Ridge/ C.R.C.C.
43 3
SeaRanch
44 5
Lauderdale by the Sea
Hillsboro Beach
Lighthouse Point
The Landings
Bay Colony
Coral Ridge / C.R.C.C.
Sea Ranch
Avg. Home Price # Transactions
$2,798,000 5
$13,025,000 2
$2,248,700 20
$1,339,167 12
$2,366,667 3
$2,736,141
$3,827,500
15
2
In terms of luxury residences in Broward’s North End, the undisputed leader
in waterfront, single-family home pricing is Hillsboro Beach at $13,025,000,
although its low transactional volume is not reliable enough to portray a trend.
Hillsboro Beach real estate offers some of the most prestigious properties in
South Florida based on its geography alone. Residences sit on through-water
lots along this secluded neighborhood spanning 3.2 miles. To give an idea
of the intimacy and proximity to nature, the area’s greatest width is 900 feet.
Residences tend to have been custom-designed to their owners’ request.
Sea Ranch Lakes, a small area surrounded by the Lauderdale-
by-the-Sea neighborhood, presents the largest year-to-year
growth at an average $466 per square foot during 2014, 43.4%
higher than it was in 2013. A good amount of Sea Ranch’s
homes are waterfront, facing either the Intracoastal or one of its
two inner lakes: Lake Cayuga and Lake Seneca. Like Hillsboro
Beach, this submarket presents just a few transactions in the
five-year period analyzed, giving an indication of the market
without providing robust statistics with which to detect a real
trend. The majority of the Sea Ranch Lakes village is a gated
community (with a buyer wait list), with the remainder being a
shopping plaza and a private beach club for village residents.
3140 NE 23 Avenue, Lighthouse Point
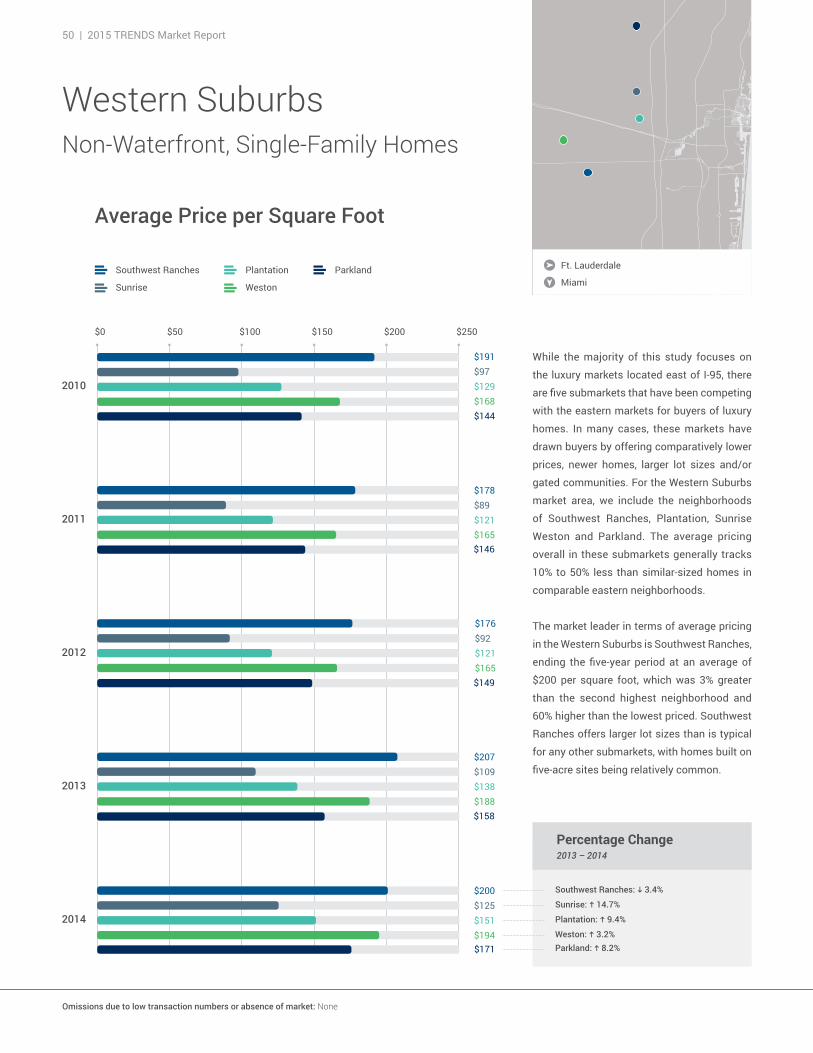
50 | 2015 TRENDS Market Report
Western SuburbsNon-Waterfront, Single-Family Homes
Miami
Ft. Lauderdale
Percentage Change2013 – 2014
While the majority of this study focuses on
the luxury markets located east of I-95, there
are five submarkets that have been competing
with the eastern markets for buyers of luxury
homes. In many cases, these markets have
drawn buyers by offering comparatively lower
prices, newer homes, larger lot sizes and/or
gated communities. For the Western Suburbs
market area, we include the neighborhoods
of Southwest Ranches, Plantation, Sunrise
Weston and Parkland. The average pricing
overall in these submarkets generally tracks
10% to 50% less than similar-sized homes in
comparable eastern neighborhoods.
The market leader in terms of average pricing
in the Western Suburbs is Southwest Ranches,
ending the five-year period at an average of
$200 per square foot, which was 3% greater
than the second highest neighborhood and
60% higher than the lowest priced. Southwest
Ranches offers larger lot sizes than is typical
for any other submarkets, with homes built on
five-acre sites being relatively common.
Weston: g 3.2%
Southwest Ranches: h 3.4%
Plantation: g 9.4%
Sunrise: g 14.7%
$250$200$150$100$50$0
Southwest Ranches
Sunrise
Plantation
Weston
Average Price per Square Foot
Parkland
$191$97$129$168$144
$178$89$121$165$146
$176$92$121$165$149
$207$109$138$188$158
$200$125$151$194$171 Parkland: g 8.2%
Omissions due to low transaction numbers or absence of market: None
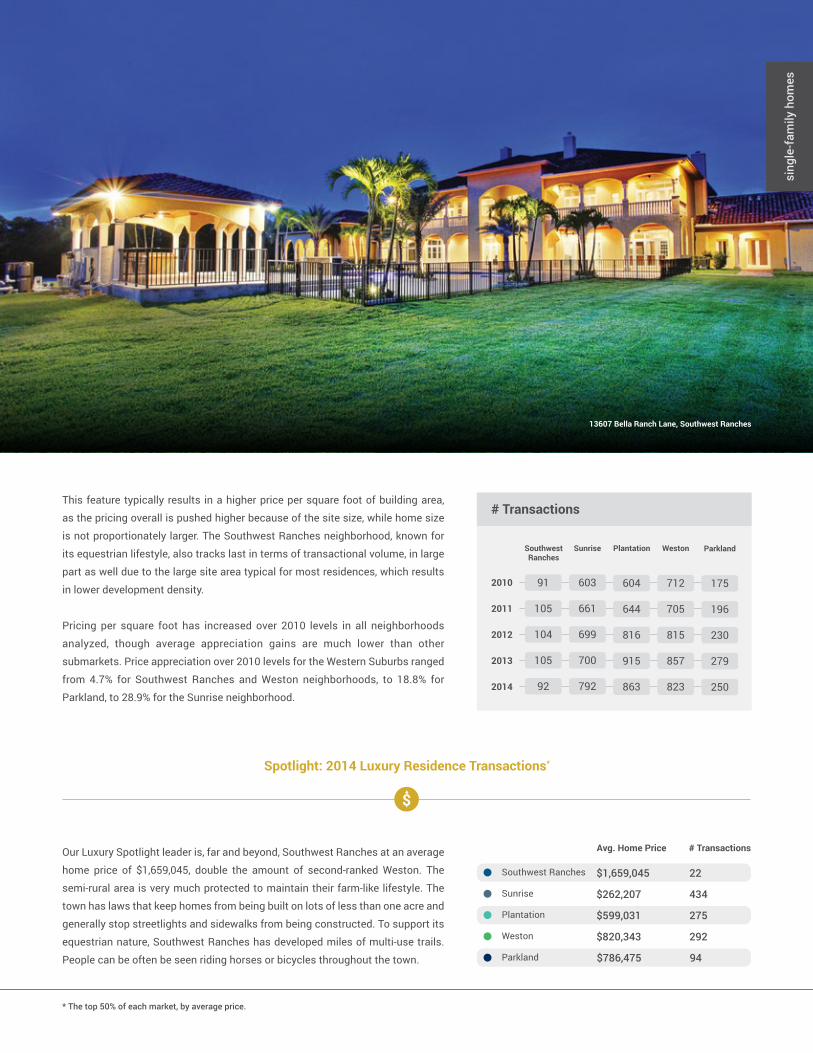
ONE Sotheby’s International Realty | 51
This feature typically results in a higher price per square foot of building area,
as the pricing overall is pushed higher because of the site size, while home size
is not proportionately larger. The Southwest Ranches neighborhood, known for
its equestrian lifestyle, also tracks last in terms of transactional volume, in large
part as well due to the large site area typical for most residences, which results
in lower development density.
Pricing per square foot has increased over 2010 levels in all neighborhoods
analyzed, though average appreciation gains are much lower than other
submarkets. Price appreciation over 2010 levels for the Western Suburbs ranged
from 4.7% for Southwest Ranches and Weston neighborhoods, to 18.8% for
Parkland, to 28.9% for the Sunrise neighborhood.
sing
le-f
amily
hom
es
* The top 50% of each market, by average price.
Spotlight: 2014 Luxury Residence Transactions*
# Transactions
SouthwestRanches
604 712
Sunrise
644 705
Plantation
816 815
Weston
915 857
863 823
2010
2011
2012
2013
2014
91 603
105 661
104 699
105 700
92 792
175
196
230
Parkland
279
250
Southwest Ranches
Sunrise
Plantation
Weston
Parkland
Avg. Home Price # Transactions
$1,659,045 22
$262,207 434
$599,031 275
$820,343 292
$786,475 94
Our Luxury Spotlight leader is, far and beyond, Southwest Ranches at an average
home price of $1,659,045, double the amount of second-ranked Weston. The
semi-rural area is very much protected to maintain their farm-like lifestyle. The
town has laws that keep homes from being built on lots of less than one acre and
generally stop streetlights and sidewalks from being constructed. To support its
equestrian nature, Southwest Ranches has developed miles of multi-use trails.
People can be often be seen riding horses or bicycles throughout the town.
13607 Bella Ranch Lane, Southwest Ranches
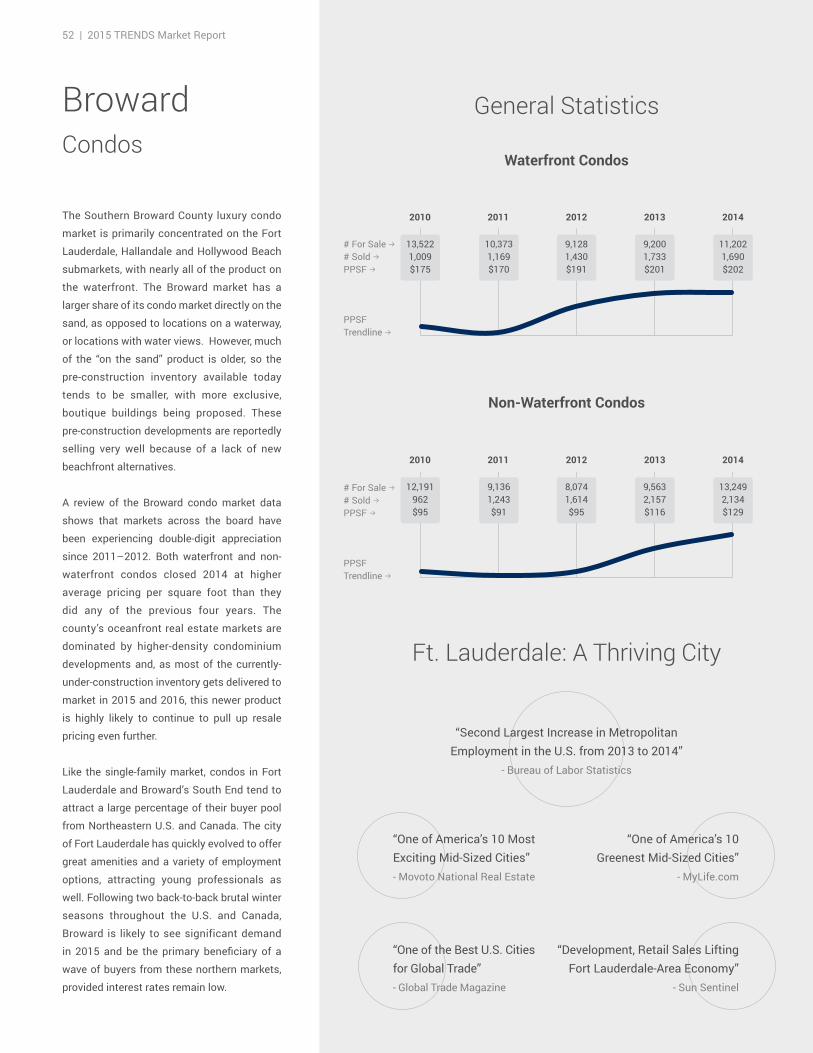
52 | 2015 TRENDS Market Report
Luxury Spotlight
Non-Waterfront Condos
Waterfront Condos
General Statistics
Ft. Lauderdale: A Thriving City
BrowardCondos
The Southern Broward County luxury condo
market is primarily concentrated on the Fort
Lauderdale, Hallandale and Hollywood Beach
submarkets, with nearly all of the product on
the waterfront. The Broward market has a
larger share of its condo market directly on the
sand, as opposed to locations on a waterway,
or locations with water views. However, much
of the “on the sand” product is older, so the
pre-construction inventory available today
tends to be smaller, with more exclusive,
boutique buildings being proposed. These
pre-construction developments are reportedly
selling very well because of a lack of new
beachfront alternatives.
A review of the Broward condo market data
shows that markets across the board have
been experiencing double-digit appreciation
since 2011–2012. Both waterfront and non-
waterfront condos closed 2014 at higher
average pricing per square foot than they
did any of the previous four years. The
county’s oceanfront real estate markets are
dominated by higher-density condominium
developments and, as most of the currently-
under-construction inventory gets delivered to
market in 2015 and 2016, this newer product
is highly likely to continue to pull up resale
pricing even further.
Like the single-family market, condos in Fort
Lauderdale and Broward’s South End tend to
attract a large percentage of their buyer pool
from Northeastern U.S. and Canada. The city
of Fort Lauderdale has quickly evolved to offer
great amenities and a variety of employment
options, attracting young professionals as
well. Following two back-to-back brutal winter
seasons throughout the U.S. and Canada,
Broward is likely to see significant demand
in 2015 and be the primary beneficiary of a
wave of buyers from these northern markets,
provided interest rates remain low.
2010 2011 2012 2013 2014
12,191 962$95
9,136 1,243$91
8,0741,614$95
9,563 2,157$116
13,2492,134$129
# For Sale b# Sold bPPSF b
PPSF Trendline b
2010 2011 2012 2013 2014
13,522 1,009$175
10,3731,169$170
9,128 1,430$191
9,200 1,733$201
11,202 1,690$202
# For Sale b# Sold bPPSF b
PPSF Trendline b
“Second Largest Increase in Metropolitan Employment in the U.S. from 2013 to 2014”
- Bureau of Labor Statistics
“One of the Best U.S. Cities for Global Trade” - Global Trade Magazine
“One of America’s 10 Most Exciting Mid-Sized Cities” - Movoto National Real Estate
“Development, Retail Sales Lifting Fort Lauderdale-Area Economy”
- Sun Sentinel
“One of America’s 10 Greenest Mid-Sized Cities”
- MyLife.com
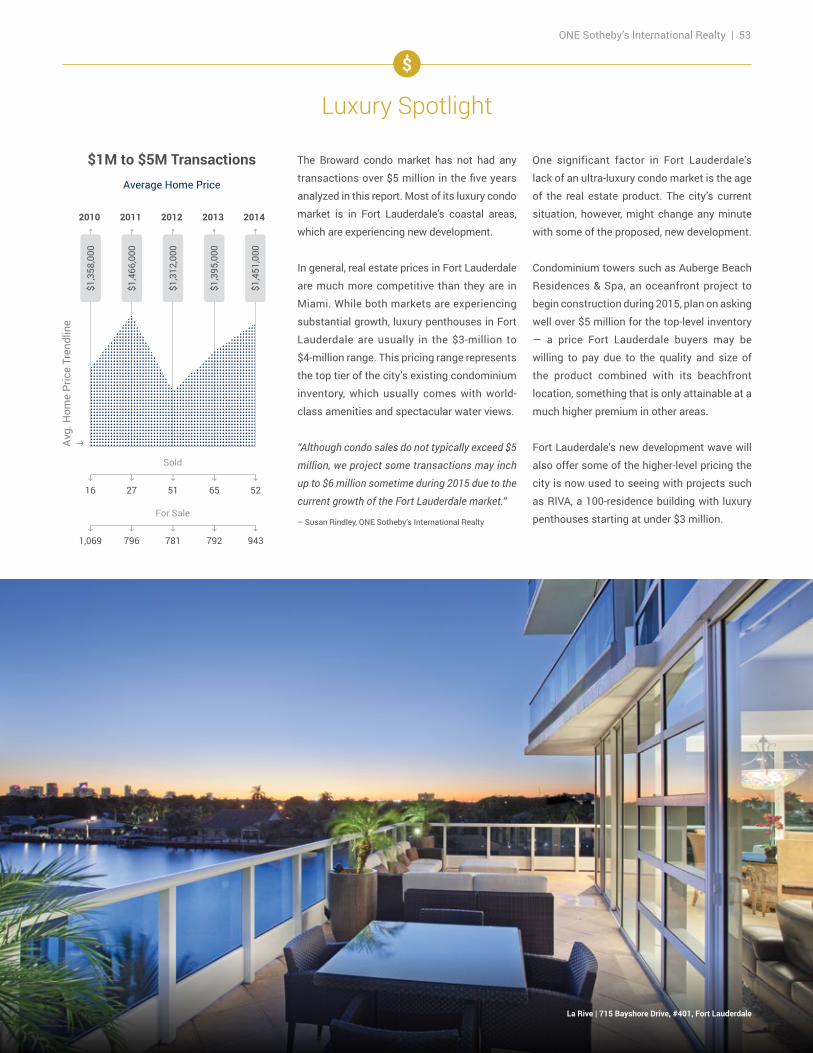
ONE Sotheby’s International Realty | 53
Luxury Spotlight
$1M to $5M TransactionsAverage Home Price
2010 2011 2012 2013 2014
$1,3
58,0
00
$1,4
66,0
00
$1,3
12,0
00
$1,3
95,0
00
$1,4
51,0
00
h
16
h
1,069
h
27
h
796
Sold
For Sale
h
65
h
792
h
52
h
943
h
51
h
781
Avg.
Hom
e Pr
ice
Tren
dlin
eh
La Rive | 715 Bayshore Drive, #401, Fort Lauderdale
The Broward condo market has not had any
transactions over $5 million in the five years
analyzed in this report. Most of its luxury condo
market is in Fort Lauderdale’s coastal areas,
which are experiencing new development.
In general, real estate prices in Fort Lauderdale
are much more competitive than they are in
Miami. While both markets are experiencing
substantial growth, luxury penthouses in Fort
Lauderdale are usually in the $3-million to
$4-million range. This pricing range represents
the top tier of the city’s existing condominium
inventory, which usually comes with world-
class amenities and spectacular water views.
“Although condo sales do not typically exceed $5
million, we project some transactions may inch
up to $6 million sometime during 2015 due to the
current growth of the Fort Lauderdale market.“
– Susan Rindley, ONE Sotheby’s International Realty
One significant factor in Fort Lauderdale’s
lack of an ultra-luxury condo market is the age
of the real estate product. The city’s current
situation, however, might change any minute
with some of the proposed, new development.
Condominium towers such as Auberge Beach
Residences & Spa, an oceanfront project to
begin construction during 2015, plan on asking
well over $5 million for the top-level inventory
— a price Fort Lauderdale buyers may be
willing to pay due to the quality and size of
the product combined with its beachfront
location, something that is only attainable at a
much higher premium in other areas.
Fort Lauderdale’s new development wave will
also offer some of the higher-level pricing the
city is now used to seeing with projects such
as RIVA, a 100-residence building with luxury
penthouses starting at under $3 million.
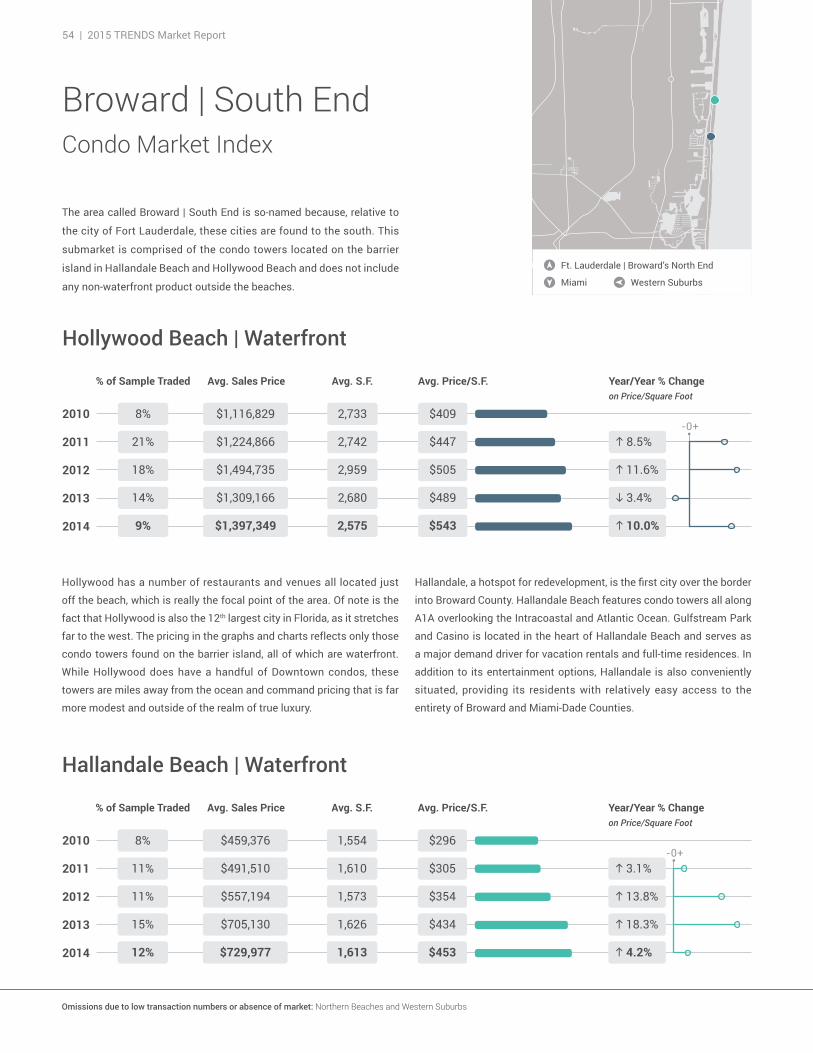
54 | 2015 TRENDS Market Report
Broward | South EndCondo Market Index
Miami
Ft. Lauderdale | Broward’s North End
-0+2010
2011
2012
2013
2014
Hollywood Beach | Waterfront
% of Sample Traded
8%
21%
18%
14%
9%
Avg. Sales Price Avg. S.F. Avg. Price/S.F. Year/Year % Changeon Price/Square Foot
h 3.4%
g 11.6%
g 8.5%
g 10.0%
$489
$505
$447
$543
$409
2,680
2,959
2,742
2,575
2,733$1,116,829
$1,224,866
$1,494,735
$1,309,166
$1,397,349
-0+2010
2011
2012
2013
2014
Hallandale Beach | Waterfront
% of Sample Traded
8%
11%
11%
15%
12%
Avg. Sales Price Avg. S.F. Avg. Price/S.F. Year/Year % Changeon Price/Square Foot
g 18.3%
g 13.8%
g 3.1%
g 4.2%
$434
$354
$305
$453
$296
1,626
1,573
1,610
1,613
1,554$459,376
$491,510
$557,194
$705,130
$729,977
Western Suburbs
Omissions due to low transaction numbers or absence of market: Northern Beaches and Western Suburbs
The area called Broward | South End is so-named because, relative to
the city of Fort Lauderdale, these cities are found to the south. This
submarket is comprised of the condo towers located on the barrier
island in Hallandale Beach and Hollywood Beach and does not include
any non-waterfront product outside the beaches.
Hollywood has a number of restaurants and venues all located just
off the beach, which is really the focal point of the area. Of note is the
fact that Hollywood is also the 12th largest city in Florida, as it stretches
far to the west. The pricing in the graphs and charts reflects only those
condo towers found on the barrier island, all of which are waterfront.
While Hollywood does have a handful of Downtown condos, these
towers are miles away from the ocean and command pricing that is far
more modest and outside of the realm of true luxury.
Hallandale, a hotspot for redevelopment, is the first city over the border
into Broward County. Hallandale Beach features condo towers all along
A1A overlooking the Intracoastal and Atlantic Ocean. Gulfstream Park
and Casino is located in the heart of Hallandale Beach and serves as
a major demand driver for vacation rentals and full-time residences. In
addition to its entertainment options, Hallandale is also conveniently
situated, providing its residents with relatively easy access to the
entirety of Broward and Miami-Dade Counties.
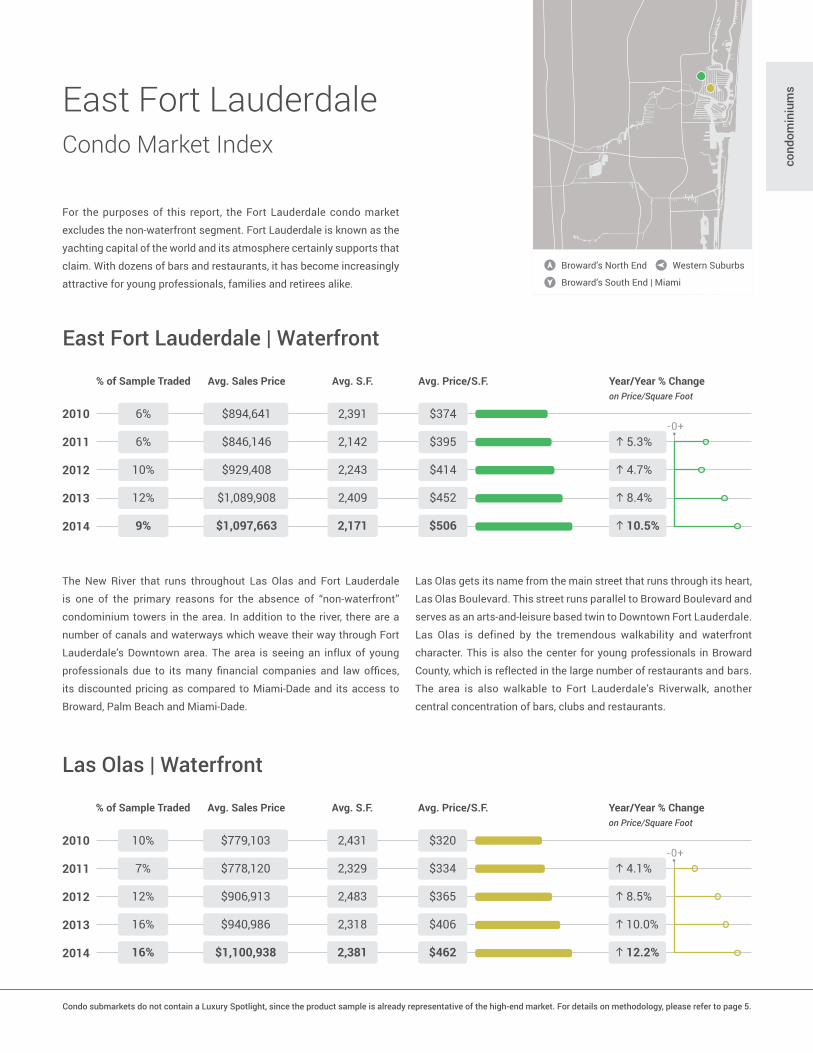
ONE Sotheby’s International Realty | 55
East Fort LauderdaleCondo Market Index
-0+2010
2011
2012
2013
2014
East Fort Lauderdale | Waterfront
% of Sample Traded
6%
6%
10%
12%
9%
Avg. Sales Price Avg. S.F. Avg. Price/S.F. Year/Year % Changeon Price/Square Foot
g 8.4%
g 4.7%
g 5.3%
g 10.5%
$452
$414
$395
$506
$374
2,409
2,243
2,142
2,171
2,391$894,641
$846,146
$929,408
$1,089,908
$1,097,663
-0+2010
2011
2012
2013
2014
Las Olas | Waterfront
% of Sample Traded
10%
7%
12%
16%
16%
Avg. Sales Price Avg. S.F. Avg. Price/S.F. Year/Year % Changeon Price/Square Foot
g 10.0%
g 8.5%
g 4.1%
g 12.2%
$406
$365
$334
$462
$320
2,318
2,483
2,329
2,381
2,431$779,103
$778,120
$906,913
$940,986
$1,100,938
cond
omin
ium
s
Broward’s South End | Miami
Broward’s North End Western Suburbs
Condo submarkets do not contain a Luxury Spotlight, since the product sample is already representative of the high-end market. For details on methodology, please refer to page 5.
The New River that runs throughout Las Olas and Fort Lauderdale
is one of the primary reasons for the absence of “non-waterfront”
condominium towers in the area. In addition to the river, there are a
number of canals and waterways which weave their way through Fort
Lauderdale’s Downtown area. The area is seeing an influx of young
professionals due to its many financial companies and law offices,
its discounted pricing as compared to Miami-Dade and its access to
Broward, Palm Beach and Miami-Dade.
Las Olas gets its name from the main street that runs through its heart,
Las Olas Boulevard. This street runs parallel to Broward Boulevard and
serves as an arts-and-leisure based twin to Downtown Fort Lauderdale.
Las Olas is defined by the tremendous walkability and waterfront
character. This is also the center for young professionals in Broward
County, which is reflected in the large number of restaurants and bars.
The area is also walkable to Fort Lauderdale’s Riverwalk, another
central concentration of bars, clubs and restaurants.
For the purposes of this report, the Fort Lauderdale condo market
excludes the non-waterfront segment. Fort Lauderdale is known as the
yachting capital of the world and its atmosphere certainly supports that
claim. With dozens of bars and restaurants, it has become increasingly
attractive for young professionals, families and retirees alike.

56 | 2015 TRENDS Market Report
Area Development Name CompletionUnit Sizes (S.F.)
Park Grove
Brickell City Centre
Brickell Flatiron
SLS Lux
One Thousand Museum
Miami World Center
Three Hundred Collins
Louver House
Glass Miami Beach
1 Hotel & Residences
Shore Club Residences
Residences at Ritz-Carlton
L’Atelier
Beach House 8
The Bath Club Estates
The Surf Club Residences
Oceana Bal Harbour
Kai at Bay Harbor
Marina Palms
Mansions at Acqualina
Jade Signature
Turnberry Ocean Club
Armani Casa
Muse
Beachwalk
Paramount
Auberge Beach Residences
Adagio on the Bay
Riva
Metropica
Pre-construction Market SpotlightOur Picks for the Top 30 New Condos Rising in South Florida
Coconut Grove
Brickell
Brickell
Brickell
Downtown Miami
Downtown Miami
South Beach
South Beach
South Beach
South Beach
South Beach
Miami Beach
Miami Beach
Miami Beach
Miami Beach
Surfside
Bal Harbour
Bay Harbor Islands
Aventura
Sunny Isles
Sunny Isles
Sunny Isles
Sunny Isles
Sunny Isles
Hollywood Beach
Fort Lauderdale
Fort Lauderdale
Fort Lauderdale
Fort Lauderdale
Sunrise
2017
2015
2017
2017
2017
2018
2016
2016
2015
2014
2015
2016
2017
2014
2015
2016
2016
2016
2015
2015
2016
2018
2017
2017
2015
2016
2017
2014
2016
2016
747 – 3,590
870 – 3,200
898 – 2,310
945 – 1,780
4,600 – 9,800
1,290 – 2,380
2,530 – 3,150
2,090 – 2,430
1,930 – 3,370
830 – 4,000
1,000 – 4,000
1,750 – 6,530
2,300 – 8,000
3,780 – 5,240
5,620 – 10,200
1,200 – 8,000
1,320 – 4,200
1,100 – 1,800
1,820 – 2,600
4,800 – 16,000
1,380 – 4,950
2,750 – 10,000
1,350 – 3,750
2,360 – 5,800
1,090 – 1,850
1,930 – 3,480
1,500 – 5,000
3,280 – 3,420
1,500 – 2,500
740 – 1,300
# Units
289
790
552
450
83
482
19
12
10
163
85
111
20
8
13
150
240
58
234
79
192
154
260
68
300
95
171
12
100
263
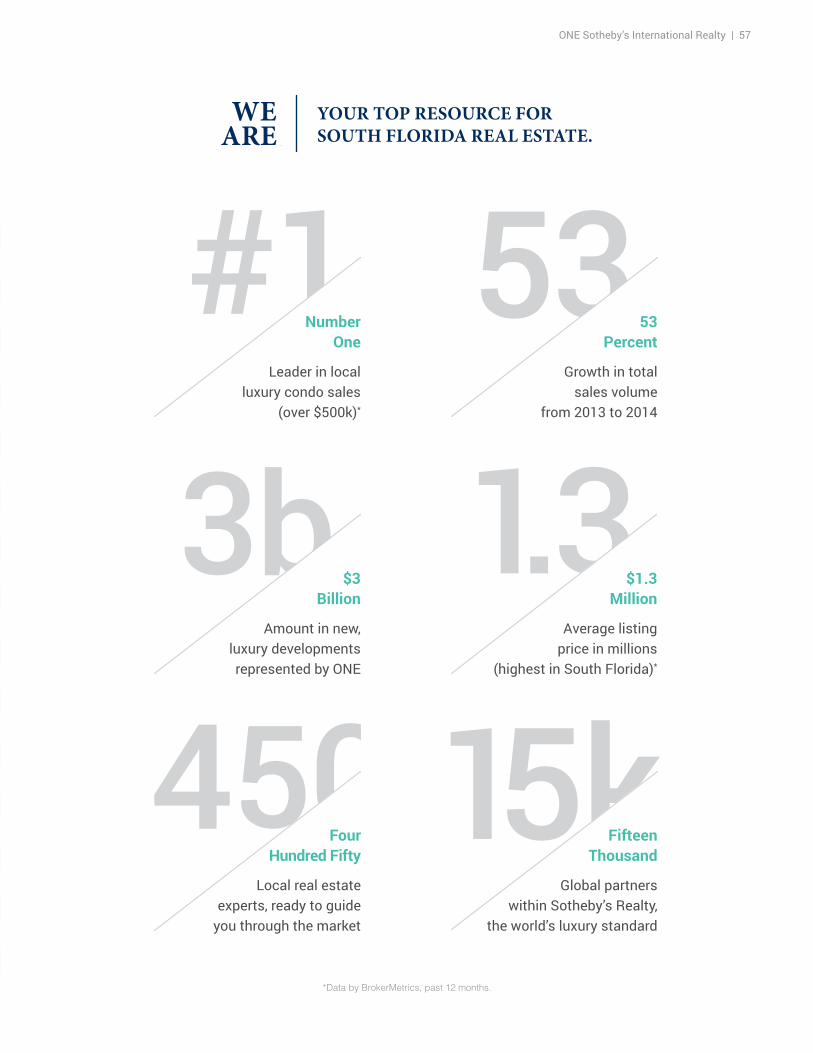
ONE Sotheby’s International Realty | 57
YOUR TOP RESOURCE FOR SOUTH FLORIDA REAL ESTATE.
*Data by BrokerMetrics, past 12 months.
53Percent
Growth in totalsales volume
from 2013 to 2014
Number One
Leader in local luxury condo sales
(over $500k)*
$3 Billion
Amount in new, luxury developments represented by ONE
$1.3 Million
Average listing price in millions
(highest in South Florida)*
Four Hundred Fifty
Local real estate experts, ready to guide
you through the market
Fifteen Thousand
Global partnerswithin Sotheby’s Realty,
the world’s luxury standard
AVENTURA · BAY HARBOR · BRICKELL · CORAL GABLES · FORT LAUDERDALE · KEY BISCAYNE · MIAMI BEACH · SUNNY ISLES
©MMXV ONE Sotheby’s International Realty, licensed real estate broker. Sotheby’s International Realty® is a licensed trademark to Sotheby’s International Realty Affiliates LLC. An Equal Opportunity Company. Equal Housing Opportunity. Each Office is Independently Owned and Operated. Statistics provided by Integra Realty Resources – Miami\Palm Beach. The information contained herein is deemed accurate but not guaranteed.