trends in college pricing 2014 - unauthorized · pdf file · 2017-04-21pricing 2014...
TRANSCRIPT

2014Trends in
COLLEGE PRICING 2014
Trends in Higher Education Series

See the Trends in Higher Education website at trends.collegeboard.org
for the figures and tables in this report and for more information and data.
About the College BoardThe College Board is a mission-driven not-for-profit organization that connects
students to college success and opportunity. Founded in 1900, the College
Board was created to expand access to higher education. Today, the membership
association is made up of over 6,000 of the world’s leading educational institutions
and is dedicated to promoting excellence and equity in education. Each year, the
College Board helps more than seven million students prepare for a successful
transition to college through programs and services in college readiness and
college success — including the SAT® and the Advanced Placement Program®.
The organization also serves the education community through research and
advocacy on behalf of students, educators, and schools. For further information,
visit www.collegeboard.org.
Trends in Higher EducationThe Trends in Higher Education publications include the annual Trends in College
Pricing and Trends in Student Aid reports and the Education Pays series, along with
How College Shapes Lives and other research reports and topical analysis briefs.
These reports are designed to provide a foundation of evidence to strengthen policy
discussions and decisions.
The tables supporting all of the graphs in this report, a PDF version of the report, and
a PowerPoint file containing individual slides for all of the graphs are available on
our website trends.collegeboard.org.
Please feel free to cite or reproduce the data in this report for noncommercial purposes with proper attribution.
For inquiries or requesting hard copies, please contact: [email protected].
© 2014 The College Board. College Board, Advanced Placement Program, SAT, and the acorn logo are registered
trademarks of the College Board. All other products and services may be trademarks of their respective owners.
Visit the College Board on the Web: www.collegeboard.org.

3
Highlights
Between 2013-14 and 2014-15, average published tuition and fee prices increased by 2.9% for in-state students in the public four-year sector, by 3.3% for out-of-state students in the public four-year sector and for in-district students at public two-year colleges, and by 3.7% at private nonprofit four-year institutions. These increases are higher than the 2.0% increase in the Consumer Price Index between July 2013 and July 2014, but in all sectors these price increases are lower than the average annual increases in the past five years, the past 10 years, and the past 30 years.
Trends in College Pricing 2014 reports on the prices charged by colleges and universities in 2014-15, how prices have changed over time, and how they vary within and across types of institutions, states, and regions. We also include information on the estimated net prices students and families pay after taking financial aid into consideration. Data on institutional revenues and expenditures and on changing enrollment patterns over time supplement the data on prices to provide a clearer picture of the circumstances of students and the institutions in which they study.
PUBLISHED TUITION AND FEES AND ROOM AND BOARDThe increases in in-state published tuition and fees at public four-year institutions of 2.9% in 2014-15 and 2.8% in 2013-14 are the only increases since 1974-75 that have been less than 3% (not adjusted for inflation).
– Average published tuition and fees for in‐state students in the public four‐year sector increased by $254 (2.9%), from $8,885 in 2013-14 to $9,139 in 2014-15. Room and board charges are $9,804.
– Average published out-of-state tuition and fees at public four- year institutions rose by $735 (3.3%), from $22,223 in 2013-14 to $22,958 in 2014-15. Average total charges are $32,762.
– Average published tuition and fees at private nonprofit four-year institutions rose by $1,100 (3.7%), from $30,131 to $31,231 in 2014-15. Average total charges are $42,419.
– Average published tuition and fees at public two-year colleges increased by $106 (3.3%), from $3,241 in 2013-14 to $3,347 in 2014-15.
– Estimated average tuition and fees for full-time students in the for-profit sector increased by about $190 (1.3%), from $15,040 in 2013-14 to $15,230 in 2014-15.
– About two-thirds of full-time students pay for college with the assistance of grant aid; many receive federal tax credits and deductions to help cover expenses.
VARIATION IN TUITION AND FEESAmong full-time undergraduates at public and private nonprofit four-year institutions, the median published tuition and fee price in 2014-15 is $11,550.
– Twelve percent of full-time students in the public four-year sector attend institutions that did not increase their tuition prices at all in 2014-15 and another 43% faced increases below 3%; 5% of students attend institutions that increased their prices by 9% or more.
– In the private nonprofit four-year sector, 65% of full-time students attend institutions that increased their tuition and fees by between 3% and 6% in 2014-15; 30% attend institutions that increased their prices by less than 3%, and 2% faced increases of 9% or more.
– The average published in-state tuition and fee price for undergraduates enrolled at public master’s universities is $7,968, compared to $10,075 at public doctoral universities.
– The average published tuition and fee price for undergraduates enrolled at private nonprofit master’s universities is $27,594, compared to $39,008 at private doctoral universities.
Differences Across States
– Published in-state tuition and fees at public four-year institutions range from $4,646 in Wyoming and $6,138 in Alaska to $14,419 in Vermont and $14,712 in New Hampshire.
– In-district tuition and fees at public two-year colleges range from $1,429 in California and $1,645 in New Mexico to $6,500 in New Hampshire and $7,320 in Vermont.
– In 2014-15, published tuition and fees for in-state students at flagship universities range from $4,646 at the University of Wyoming and $6,099 at the University of Montana to $16,552 at the University of New Hampshire and $18,464 at Penn State.
– In 15 states, average in-state tuition and fees at public four-year institutions increased by less than 10% in inflation-adjusted dollars between 2009-10 and 2014-15. In 18 states the increase was 20% or more.
– California’s 58% inflation-adjusted increase in average published tuition and fees for full-time students at public two-year colleges between 2009-10 and 2014-15 was second only to Louisiana’s 62%, but California’s price remains the lowest in the country.
– In 2014-15, the published out-of-state tuition and fees at public four-year institutions range from $9,910 in South Dakota and $14,876 in Wyoming to $31,982 in Michigan and $34,331 in Vermont.

4
WHAT STUDENTS ACTUALLY PAYBetween 2009-10 and 2014-15, the average net tuition and fee price paid by in-state students at public four-year colleges increased from about $2,030 (in 2014 dollars) to an estimated $3,030.
– Despite increasing published prices, the average net tuition and fee prices that students paid after taking grant aid and tax benefits into consideration declined between 2004-05 and 2009-10 in public two-year and four-year institutions and in private nonprofit four-year institutions.
– Full-time students enrolled in private nonprofit institutions receive an average of about $18,870 in grant aid and federal tax benefits to help them pay for college. Average aid is about $6,110 at public four-year institutions and about $5,090 at public two-year colleges.
– In 2011-12, full-time dependent students from the lowest income quartile paid average net tuition and fees, after grant aid, of $11,300 in the for-profit sector, compared to $2,530 at the lowest-price and $9,860 at the highest-price nonprofit institutions.
– On average, in 2011-12, full-time in-state students at public four-year universities from families with incomes below $30,000 received enough grant aid from all sources combined to cover tuition and fees and to have about $2,300 left to put toward room, board, and other expenses.
INSTITUTIONAL FINANCESOver the 10 years from 2001-02 to 2011-12, average education expenditures per full-time equivalent (FTE) student increased by a total of 6% in inflation-adjusted dollars at public doctoral universities and declined by 7% at public two-year colleges.
– In 2013-14, public colleges and universities received an average of $7,161 per FTE student in state funding — 23% less than the $9,290 (in 2013 dollars) they received in 2007-08.
– Total state appropriations declined by 16%, from $90.5 billion (in 2013 dollars) in 2007-08 to $76.2 billion in 2013-14; public FTE enrollment increased by 9% over these six years.
– In 2013-14, state appropriations per FTE student for public colleges and universities ranged from $3,184 in New Hampshire and $3,494 in Colorado to $14,045 in Wyoming and $18,857 in Alaska.
– Between 1991 and 2011, the percentage of FTE staff members who were faculty increased from 31% to 34% at public institutions and from 29% to 34% at private institutions.
ENROLLMENT PATTERNSBetween 2010 and 2012, total enrollment in both public and private nonprofit four-year institutions increased by 2%. Enrollment declined by 6% in public two-year colleges and by 10% in for-profit institutions.
– Growth in public higher education enrollment between 2002 and 2012 ranged from 3% in Illinois to 37% in Florida.
– The percentage of students beginning college in fall 2012 who enrolled at institutions in their home states ranged from 53% in Vermont and 56% in New Hampshire to 90% in California and Arizona and 91% in Utah.
– In 2012-13, only 2% of the 2,580 four-year degree-granting colleges and universities in the United States accepted less than 25% of their applicants; 35% of these institutions accepted 90% or more of their applicants.
COLLEGE AFFORDABILITYAverage income was lower in inflation-adjusted dollars in 2013 than it had been in 2003 for all but the highest-income families.
– The $70,821 increase (in 2013 dollars) in the average income of the top 20% of families between 1983 and 2013 compares to an increase of $8,936 for the middle quintile and to an increase of $578 for the lowest quintile of families.
– Average published tuition and fees for in-state students attending public four-year colleges rose by $6,324 (in 2014 dollars) between 1983 and 2013 — 71% of the increase in income ($8,936) of the middle 20% of families and 9% of the increase in income ($70,821) of the 20% of families in the highest-income bracket.

5
Figures and tables that are only available online at trends.collegeboard.org.
Contents
3 Highlights
7 Introduction
10 Published Charges by Sector, 2014-15
TABLE 1A Average Published Undergraduate Charges by Sector, 2014-15
11 Published Charges by Carnegie Classification, 2014-15
TABLE 1B Average Published Undergraduate Charges by Carnegie Classification, 2014-15
12 Student Budgets, 2014-15 FIGURE 1 Average Estimated Undergraduate Budgets, 2014-15
13 Regional Variation in Charges FIGURE 2 Average Published Undergraduate Charges by Sector and Region, 2014-15
TABLE 4 Published Tuition and Fees by Region over Time
14 Variation in Tuition and Fees, 2014-15
FIGURE 3 Distribution of Full-Time Four-Year Undergraduates by Tuition and Fees, 2014-15
15 Variation in Tuition and Fee Increases, 2014-15
FIGURE 4 Distribution of Full-Time Four-Year Undergraduates by Increases in Tuition and Fees
16 Published Charges over Time FIGURE 5 Average Rates of Growth of Published Charges by Decade
FIGURE 6 Published Tuition and Fees Relative to 1984-85, by Sector
17 Published Charges over Time TABLE 2A Tuition and Fees and Room and Board over Time, 1974-75 to 2014-15, Selected Years
TABLE 2B Tuition and Fees and Room and Board over Time, 2004-05 to 2014-15
TABLE 2 Tuition and Fees and Room and Board over Time
TABLE 3 Tuition and Fees and Room and Board over Time (Unweighted)
18 Tuition and Fees by State — Public Two-Year
FIGURE 7 2014-15 In-District Tuition and Fees at Public Two-Year Institutions by State and Five-Year Percentage Change
TABLE 5 Tuition and Fees by Sector and State over Time
19 Tuition and Fees by State — Public Four-Year In-State
FIGURE 8 2014-15 In-State Tuition and Fees at Public Four-Year Institutions by State and Five-Year Percentage Change
20 Tuition and Fees by State — Public Four-Year Out-of-State
FIGURE 9 2014-15 Out-of-State Tuition and Fees at Public Four-Year Institutions by State and Five-Year Percentage Change
21 Tuition and Fees by State — Flagship Universities
FIGURE 10 2014-15 Tuition and Fees at Flagship Universities and Five-Year Percentage Change
TABLE 6 Tuition and Fees at Flagship Universities over Time
22 Average Net Price — Public Two-Year
FIGURE 11 Average Net Price over Time for Full-Time Students at Public Two-Year Institutions
TABLE 7 Average Net Price over Time for Full-Time Students, by Sector
23 Average Net Price — Public Four-Year
FIGURE 12 Average Net Price over Time for Full-Time Students at Public Four-Year Institutions
24 Average Net Price — Private Nonprofit Four-Year
FIGURE 13 Average Net Price over Time for Full-Time Students at Private Nonprofit Four-Year Institutions
25 Net Price by Income — Public Institutions
FIGURE 14A Net Price at Public Four-Year Institutions by Residency, Dependency Status, and Income, 2011-12
FIGURE 14B Net Price at Public Two-Year Institutions by Dependency Status and Income, 2011-12
FIGURE 2013_12 Net Price by Income over Time: Public Sector
26 Net Price by Income — Private Institutions
FIGURE 15A Net Price at Private Nonprofit Four-Year Institutions by Published Tuition and Fees and Income, 2011-12
FIGURE 15B Net Price at For-Profit Institutions by Dependency Status and Income, 2011-12
FIGURE 2013_13 Net Price by Income over Time: Private Sector
Figures and tables that are only available online at trends.collegeboard.org.

6
Contents — Continued
27 Institutional Revenues —State Funding
FIGURE 16A Annual Percentage Change in State Funding and Public Tuition and Fees over Time
FIGURE 16B Total and Per-Student State Funding and Public Enrollment over Time
28 Institutional Revenues — State Funding
FIGURE 17A State Funding per $1,000 in Personal Income over Time
FIGURE 17B State Funding per Student and per $1,000 in Personal Income by State, 2013-14
29 Institutional Revenues FIGURE 18A Institutional Revenues per Student at Public Institutions over Time
FIGURE 18B Institutional Revenues per Student at Private Nonprofit Institutions over Time
30 Institutional Revenues and Expenditures
FIGURE 19A Net Tuition Revenues, Subsidies, and Education Expenditures per Student at Public Institutions over Time
FIGURE 19B Net Tuition Revenues, Subsidies, and Education Expenditures per Student at Private Nonprofit Institutions over Time
31 Endowments FIGURE 20 Endowment Assets per Student, 2011-12
32 Endowments FIGURE 21A Changes in Private Sector Endowment Assets over Time
FIGURE 21B Endowment Spending Rates over Time
33 Family Income FIGURE 22A Changes in Family Income over Time
FIGURE 22B Family Income by Selected Characteristics, 2013
34 Enrollment Patterns over Time FIGURE 23 Enrollment by Level of Enrollment and Attendance Status over Time
35 Enrollment and Degrees Granted
FIGURE 24 Degrees Granted by Type and Sector over Time
FIGURE 25 Distribution of Undergraduate Enrollment by Sector, 2012
36 Public Enrollment by State FIGURE 26A Enrollment at Public Institutions by State, 2012
FIGURE 26B Percentage of All Public Enrollment in Two-Year Colleges by State, 2012
37 Changes in Public Enrollment by State
FIGURE 27 Ten-Year Percentage Increase in Total Public Enrollment by State
38 Migration FIGURE 28 Percentage of First-Time Students Staying in State and Percentage Who Were State Residents, 2012
39 Selectivity and Completion FIGURE 29A Distribution of Four-Year Institutions and Enrollment by Acceptance Rate, 2012-13
FIGURE 29B Bachelor’s Degree Completion Rate of 2006 Cohort by Institution’s Acceptance Rate
40 Faculty and Staff FIGURE 30A Composition of Staff over Time
FIGURE 30B Percentage of Full-Time Faculty with Tenure over Time
41 Notes and Sources TABLE A1A Number of Institutions Included in Table 1A Analysis
TABLE A1B Number of Institutions Included in Table 1B Analysis
TABLE A2 Consumer Price Index
Figures and tables that are only available online at trends.collegeboard.org.

7
Introduction
Between 2013-14 and 2014-15, the percentage increases in published tuition and fees in all sectors were lower than the average annual increases in the past five years, the past 10 years, and the past 30 years. College price increases are not accelerating. But they are accumulating. Tuition and fees have been rising in real terms for decades. The inflation-adjusted average published price for in-state students at public four-year universities is 42% higher than it was 10 years ago and more than twice as high as it was 20 years ago. In the private nonprofit four-year sector, the increases were 24% over 10 years and 66% over 20 years.
With the price of college rising faster than the prices of most other goods and services, despite the high financial payoff to college, people perceive themselves as giving up increasing amounts of other things to pay for college. Even more important is the reality that real incomes have not increased for more than a decade, except at the top of the income scale. Much of the growth in the earnings gap between college graduates and high school graduates has been the result of declining wages at the lower end of the distribution, as opposed to increases for those with a college education.
Assuring that our nation continues to provide postsecondary education to all who are motivated and can benefit is a prerequisite for both a healthy economy and a society that provides meaningful paths to rewarding and independent lives for all individuals. While published college prices can be misleading because most students receive financial aid that reduces the amount they actually have to pay, these prices provide an important indication of social priorities, of opportunities, and of the struggles facing many students and families as they plan their futures.
Trends in College Pricing 2014 reports on the published prices in 2014-15 and in previous years. We also incorporate the latest data reported in Trends in Student Aid 2014 in calculating the net prices students and families pay after taking financial aid into consideration. The information in this report provides the basis for a better understanding of college financing and for the analysis of policy options designed to reduce the barriers to a more educated population.
PUBLISHED PRICES FOR ONE YEAR OF FULL -TIME STUDY
The prices reported in Trends in College Pricing are for one year of full-time study. Many students enroll part time, and prorating these prices does not always give an accurate picture of the published prices students face, much less of the net prices generated by the grant assistance and tax benefits provided by federal and state governments, colleges and universities, and employers and other private sources.
But even for full-time students, one-year prices at “two-year” and “four-year” institutions may not be adequate indicators of the cost to students of pursuing postsecondary certificates and degrees. Among students who began their studies full time at a four-year institution in 2005, 39% had completed bachelor’s degrees at their first institution after four years and 59% had completed after six years. In other words, about one-third of bachelor’s degree recipients took longer than four years to complete their degrees. Not all of these students paid more than four years of full-time tuition — they may have taken time off or enrolled part time for at least a semester. But for many of those who took longer than four years to earn their degrees, tuition and fees (before accounting for grant aid) were likely to be considerably more than four times the one-year price.
Taking more than two years to earn an associate degree or more than four years to earn a bachelor’s degree has financial implications beyond tuition and fee expenses. Forgone earnings from reduced participation in the labor force constitute the largest portion of the cost of college for most students. The more quickly students earn their degrees, the more time they have to earn college-level wages and reap the financial benefits of postsecondary education. Bachelor’s degree recipients between the ages of 25 and 34, for example, had median earnings 71% ($17,614) higher than those with high school diplomas in 2013 (U.S. Census Bureau, 2013 Income Data, Table PINC-03).
PAST AND FUTURE
As Figure 5 illustrates, the rate of growth of published tuition and fees is not accelerating over time. In both the public and private nonprofit four-year sectors, the inflation-adjusted increase in prices was smaller between 2004-05 and 2014-15 than over the previous decade, and the increase between 2009-10 and 2014-15 was smaller than the increase over the previous five years.
But Figure 6 shows how the price increases accumulate over time. The average published tuition and fee price in the public four-year sector is 3.25 times its level of 30 years ago, after adjusting for inflation. In the public two-year and private nonprofit four-year sectors, the prices are about 2.5 times their 1984-85 levels.
Institutional expenditures tell only a small part of the story behind these rising prices. As Figure 19B reveals, outside of private doctoral universities, per-student educational expenditures have not risen rapidly over the past decade. They have declined by 7% in the public two-year sector — where tuition and fees increased by 28% in constant dollars between 2004-05 and 2014-15. As in other sectors, net tuition revenues in the public two-year sector constitute a growing share of the budget. For public institutions, declining state revenues per student are a major factor behind this

8
trend. State funding for higher education is cyclical (Figure 16A), but there is also a long-term downward trend in this subsidy to postsecondary students.
PUBLISHED AND NET PRICES
Although it is generally the published prices that make headlines, the net prices paid by individual students are what matter the most for college access and affordability. We estimate that in 2014-15, while the average published in-state tuition and fee price at public four-year institutions is $9,139, the average net price is about $3,030. Grants and tax credits and deductions cover the remainder for the average full-time student.
As Figures 11, 12, and 13 indicate, the difference between the published tuition and fee prices and the average net prices that students pay has grown over time as grant aid and education tax benefits have come to play a larger role. In particular, from 2008-09 to 2010-11, the federal government markedly increased its funding for students, causing average net prices for students to decrease in years when tuition was rising rapidly. Private nonprofit colleges continue to increase their institutional grant aid, but for public four-year college students, the $800 increase in published tuition and fees (in 2014 dollars) between 2010-11 and 2014-15 was not met by an increase in grant aid per student.
These averages across sectors conceal considerable variation among students. As Figure 14 reveals, in 2011-12, full-time in-state students at public four-year institutions from families with incomes below $30,000 received enough grant aid from all sources combined to cover tuition and fees and have about $2,300 left to put toward room, board, and other expenses. Average aid covered tuition and fees for dependent students from families with incomes below $65,000, as well as for independent students at public two-year colleges. Despite the reality that, as documented in Trends in Student Aid 2014, significant amounts of student aid are allocated on the basis of factors other than financial need, net prices are positively correlated with family incomes.
TUITION AND FEES VERSUS TOTAL CHARGES
In addition to tuition and fees, we report room and board charges for residential students, living costs for commuter students, and other components of student budgets. Whether students live on campus or off campus, they must pay for housing and food, buy books and supplies, and cover transportation and other basic living costs.
Many of these expenses are not really part of the cost of attending college, but are expenses people face whether or not they are in school. The largest real college cost many students face is forgone earnings. It is very difficult to succeed in college while working full time. However, the cost of students’ time is difficult to measure, and we make no attempt to do so in this report. Because students tend to think of living expenses as part of the cost of going to college, and because they must come up with the funds to cover these outlays, it is useful to use these expenses as a proxy for forgone earnings.
The cost of living poses a significant hurdle for many students. Even those who receive grant aid sufficient to cover tuition and fee charges may struggle to cover living expenses. It is not so much the prices charged by institutions, but the very real costs students incur by devoting their time to school and forgoing the income needed to support themselves and their families while in school that create the burden for these students.
COLLEGE AFFORDABILITY
Understanding the difficulties many students and families face in covering postsecondary education expenses is not possible without taking trends in the level and distribution of incomes into consideration. As documented in Figure 22A, incomes have declined over the past decade for families at all but the top of the income distribution. Economic inequality in the United States has been growing over recent decades. For example, the share of all income going to the 20% of families with the lowest incomes declined from 4.9% in 1983 to 3.8% in 2013, while the share going to the top 5% of families rose from 15.3% to 21.2%.
Current income is not the only benchmark for college affordability, since students also borrow against their future incomes to help finance their education. Understanding reasonable debt levels must be part of the discussion of college prices and how students and families pay those prices.
In addition to the very different circumstances facing students from different backgrounds and of different ages, there is considerable variation in prices across sectors and across states and regions, as well as among institutions within these categories. College students in the United States have a wide variety of educational institutions from which to choose, with many different price tags and with different levels of financial aid. One of the problems many students face is how to make sense of all the options and complex pricing structures.

9
Postsecondary education is an investment that pays off well for most people. The investment also pays off for society as a whole, with individual students reaping only a portion of the benefits of their education. The information on college prices, enrollments, and revenue and expenditure patterns reported in Trends in College Pricing 2014 is best understood in combination with information on student aid reported in Trends in Student Aid 2014 and the information on the returns to education included in the College Board’s publications, Education Pays 2013 and How College Shapes Lives.
INTERPRETING THE DATA
Measuring Tuition
A growing number of institutions charge different prices for different years of study and/or for different academic majors. We are able to incorporate some, but not all, of these differences in our price estimates. Another complexity is that some two-year colleges are offering a small number of four-year degrees or providing course work that leads to four-year degrees awarded on other campuses. Although we make every effort to adjust our methodology to accommodate these changes, it is impossible to draw precise lines between sectors and to develop exact measures. Over time, as institutional pricing structures become increasingly complicated, the average prices we are able to report may be less representative of the experiences of individual students.
Trends in College Pricing 2014 presents detailed pricing data for public two-year and four-year colleges and private nonprofit four-year institutions. While we provide an estimate of the average charges at for-profit institutions, because of the relatively small sample of those institutions from which we are able to collect data and the complex pricing structures prevalent in this sector, it is important to interpret that information with caution. Full-time equivalent undergraduate enrollment in the for-profit sector declined by about 24% between fall 2010 and fall 2013 (IPEDS preliminary data), while overall enrollment declined by 5%. Still, the experiences of the 1.1 million undergraduates in that sector are an important component of the postsecondary landscape.
Price Changes
While the information reported here provides a best approximation of trends in college charges over time, we caution readers about placing too much reliance on either precise dollar amounts or precise annual percentage changes. Each year we revise the average prices calculated the previous year to account for corrected data we receive from institutions and to provide an enrollment-weighted average based on the most recent available data on the number of full-time students attending each institution. If, over time, increasing numbers of students were to enroll in the lower-priced institutions within a sector, our measure of the average price increase would be lower than if enrollment were stable. Details relating to our methodology and to other technical issues and data reliability can be found at the end of the report in the Notes and Sources section.
The tables supporting all of the graphs in the Trends publications, PDF versions of the publications, PowerPoint files containing individual slides for all of the graphs, and other detailed data on student aid and college pricing are available on our website at trends.collegeboard.org. Please feel free to cite or reproduce the data in Trends for noncommercial purposes with proper attribution.

10 For detailed data behind the graphs and additional information, please visit: trends.collegeboard.org.
Published Charges by Sector, 2014-15The average published tuition and fee price for in-state students enrolled full time at public four-year colleges and universities is $9,139 in 2014-15, $254 (2.9%) higher than in 2013-14.
– The average published tuition and fee price for full-time out-of-state students at public four-year institutions is about 2.5 times as high as the price for in-state students. The average out-of-state tuition premium increased from $13,338 in 2013-14 to $13,819 in 2014-15.
– The average published in-district tuition and fee price for students enrolled full time at public two-year colleges increased by $106 (3.3%) between 2013-14 and 2014-15.
– The average published tuition and fee price for students enrolled full time at private nonprofit four-year colleges and universities increased by $1,100 (3.7%) between 2013-14 and 2014-15.
– Prices at for-profit institutions have risen more slowly in recent years than prices in other sectors, but the estimated $15,230 average tuition and fee price in 2014-15 is more than four times as high as the average price at public two-year colleges and 67% higher than the average in-state price at public four-year institutions.
ALSO IMPORTANT:
– About two-thirds of undergraduate students enrolled full time in 2011-12 received grants that reduced the actual price of college (NCES, NPSAS, 2012). In addition, many states and institutions grant tuition waivers to groups such as veterans, teachers, or dependents of employees. See Figures 11, 12, and 13 for estimates of net prices paid by students and Trends in Student Aid 2014 for details about student aid.
– About one out of six full-time public two-year students are in California, which has the lowest tuition and fee price in that sector. Excluding California raises the average published price of public two-year colleges from $3,347 to $3,701.
– The total price of a college education depends on how long a student is enrolled before completing a degree. Many students spend more than four years earning a bachelor’s degree. Average time to degree is longer in public than in private nonprofit institutions.
– In fall 2012, 61% of students at public two-year colleges were enrolled part time, as were 23% of undergraduates at public four-year, 18% at private nonprofit four-year, and 28% at for-profit institutions. (NCES, Digest of Education Statistics 2013, Table 303.60)
Public Two-Year In-District
Public Four-Year In-State
Public Four-Year
Out-of-State
Private Nonprofit Four-Year For-Profit
Tuition and Fees
2014-15 $3,347 $9,139 $22,958 $31,231 $15,230
2013-14 $3,241 $8,885 $22,223 $30,131 $15,040
$ Change $106 $254 $735 $1,100 $190
% Change 3.3% 2.9% 3.3% 3.7% 1.3%
Room and Board
2014-15 $7,705 $9,804 $9,804 $11,188 —
2013-14 $7,540 $9,498 $9,498 $10,824 —
$ Change $165 $306 $306 $364 —
% Change 2.2% 3.2% 3.2% 3.4% —
Tuition and Fees and Room and Board
2014-15 $11,052 $18,943 $32,762 $42,419 —
2013-14 $10,781 $18,383 $31,721 $40,955 —
$ Change $271 $560 $1,041 $1,464 —
% Change 2.5% 3.0% 3.3% 3.6% —
NOTES: Prices in Table 1A are not adjusted for inflation. Prices reported for 2013-14 have been revised and may differ from those reported in Trends in College Pricing 2013. Public two-year room and board charges are based on commuter housing and food costs. Tuition and fee figures for the for-profit sector should be interpreted with caution because of the low response rate.
SOURCE: The College Board, Annual Survey of Colleges.
Enrollment-weighted tuition and fees weight the price charged by each institution by the number of full-time students enrolled in fall 2013. Public four-year in-state charges are weighted by total fall 2013 full-time enrollment in each institution, including both in-state students and out-of-state students. Out-of-state tuition and fees are computed by adding the average in-state price to the out-of-state premium weighted by the number of full-time out-of-state students enrolled at each institution. Room and board charges are weighted by the number of students residing on campus for four-year institutions and by the number of commuter students for public two-year institutions.
— Sample too small to provide reliable information.
TABLE 1A Average Published Charges for Full-Time Undergraduates by Type
and Control of Institution, 2014-15 (Enrollment-Weighted)

11For detailed data behind the graphs and additional information, please visit: trends.collegeboard.org.
Published Charges by Carnegie Classification, 2014-15
TABLE 1B Average Published Charges for Full-Time Undergraduates by
Carnegie Classification, 2014-15 (Enrollment-Weighted)
NOTES: Prices in Table 1B are not adjusted for inflation. Prices reported for 2013-14 have been revised and may differ from those reported in Trends in College Pricing 2013. Special-focus institutions are not included in Table 1B. These institutions enroll less than 1% of all full-time undergraduate students in the public four-year sector and about 5% of all full-time undergraduate students in the private nonprofit four-year sector. See Notes and Sources on page 41 for definitions of the institutional categories in Table 1B.
SOURCE: The College Board, Annual Survey of Colleges.
Enrollment-weighted tuition and fees weight the price charged by each institution by the number of full-time students enrolled in fall 2013. Public four-year in-state charges are weighted by total fall 2013 full-time enrollment in each institution, including both in-state students and out-of-state students. Room and board charges are weighted by the number of students residing on campus.
In 2014-15, average published tuition and fee prices for full-time in-state students in the public four-year sector range from $7,142 at bachelor’s colleges and $7,968 at master’s universities to $10,075 at public doctoral universities.
– The average published tuition and fee price for full-time undergraduates at private nonprofit master’s universities is 71% of the price at private nonprofit doctoral universities — $27,594 versus $39,008.
– Average room and board charges at private nonprofit institutions range from $10,165 at bachelor’s colleges to $12,979 at doctoral universities.
ALSO IMPORTANT:
– Within each sector, the average institutional grant aid is higher at higher-price institutions. As a result, the differences in the published prices across types of institutions in each sector are greater than the differences in net prices. For example, in 2011-12, public doctoral universities awarded an average of $1,300 per full-time in-state student in institutional grant aid, compared to $700 for public master’s universities. (NCES, NPSAS, 2012)
– In the private nonprofit sector, institutional grant aid in 2011-12 averaged $10,700 per full-time student at doctoral universities, $7,600 at master’s universities, and $10,000 at bachelor’s colleges. (NCES, NPSAS, 2012)
– Over the five years from 2009-10 to 2014-15, the average published tuition and fee price for in-state students has risen by 17% beyond inflation at public doctoral universities, by 16% at public master’s universities, and by 10% at public bachelor’s colleges. (Trends in College Pricing 2010 and 2014, Table 1B; calculations by the authors)
– Over the five years from 2009-10 to 2014-15, average published tuition and fees have risen by 9% beyond inflation at private nonprofit doctoral universities, by 7% at private nonprofit master’s universities, and by 13% at private nonprofit bachelor’s colleges. (Trends in College Pricing 2010 and 2014, Table 1B; calculations by the authors)
Public Four-Year In-State Private Nonprofit Four-Year
Doctoral Master’s Bachelor’s Doctoral Master’s Bachelor’s
Tuition and Fees
2014-15 $10,075 $7,968 $7,142 $39,008 $27,594 $29,404
2013-14 $9,805 $7,740 $6,891 $37,445 $26,697 $28,450
$ Change $270 $228 $251 $1,563 $897 $954
% Change 2.8% 2.9% 3.6% 4.2% 3.4% 3.4%
Room and Board
2014-15 $10,208 $9,109 $9,472 $12,979 $10,824 $10,165
2013-14 $9,882 $8,839 $9,171 $12,595 $10,471 $9,810
$ Change $326 $270 $301 $384 $353 $355
% Change 3.3% 3.1% 3.3% 3.0% 3.4% 3.6%
Tuition and Fees and Room and Board
2014-15 $20,283 $17,077 $16,614 $51,987 $38,418 $39,569
2013-14 $19,687 $16,579 $16,062 $50,040 $37,168 $38,260
$ Change $596 $498 $552 $1,947 $1,250 $1,309
% Change 3.0% 3.0% 3.4% 3.9% 3.4% 3.4%
Percentage Distribution of Full-Time Undergraduates
Fall 2013 57% 36% 6% 28% 38% 29%

12 For detailed data behind the graphs and additional information, please visit: trends.collegeboard.org.
Student Budgets, 2014-15
FIGURE 1 Average Estimated Full-Time Undergraduate Budgets by Sector, 2014-15 (Enrollment-Weighted)
Tuition and fees constitute 39% of the total budget for in-state students living on campus at public four-year colleges and universities and 21% of the budget for public two-year college students who pay for off-campus housing.
– Student budgets are constructed by institutional financial aid offices. These budgets form the basis for determining the total cost of attendance, which can affect the amount of financial aid for which students are eligible.
– Tuition and fees differ more across sectors than room and board and other components of student budgets. As a result, while the average in-state published tuition and fee price at public four-year institutions is 2.7 times as high as the price at public two-year colleges, the total student budget is only 1.4 times as high.
– The average in-state published tuition and fee price at public four-year institutions is 29% of the average at private nonprofit four-year institutions, but the average student budget is 51% as high.
ALSO IMPORTANT:
– According to the National Association of College Stores, the average price of a new textbook increased from $62 (in 2011 dollars) in 2006-07 to $68 in 2011-12. Students also rely on textbook rentals, used books, and digital resources. (http://www.nacs.org/research/industrystatistics/higheredfactsfigures.aspx)
NOTES: Expense categories are based on institutional budgets for students as reported by colleges and universities in the Annual Survey of Colleges. Figures for tuition and fees and room and board mirror those reported in Table 1A. Other expense categories are the average amounts allotted in determining total cost of attendance and do not necessarily reflect actual student expenditures.
SOURCE: The College Board, Annual Survey of Colleges.
$0 $5,000 $10,000 $15,000 $20,000 $25,000 $30,000 $35,000 $40,000 $45,000 $50,000
Other ExpensesTransportationBooks and SuppliesRoom and BoardTuition and Fees
Private Nonpro�t Four-Year On-Campus
Public Four-Year Out-of-State On-Campus
Public Four-Year In-State On-Campus
Public Two-Year In-District Commuter $3,347 $7,705
$1,328
$1,735
$2,210 $16,325
$9,139 $9,804
$1,225
$1,146
$2,096 $23,410
$22,958 $9,804
$1,225
$1,146
$2,096 $37,229
$31,231 $11,188
$1,244
$1,002
$1,607
$46,272
Undergraduate Budget
Sect
or
13For detailed data behind the graphs and additional information, please visit: trends.collegeboard.org.
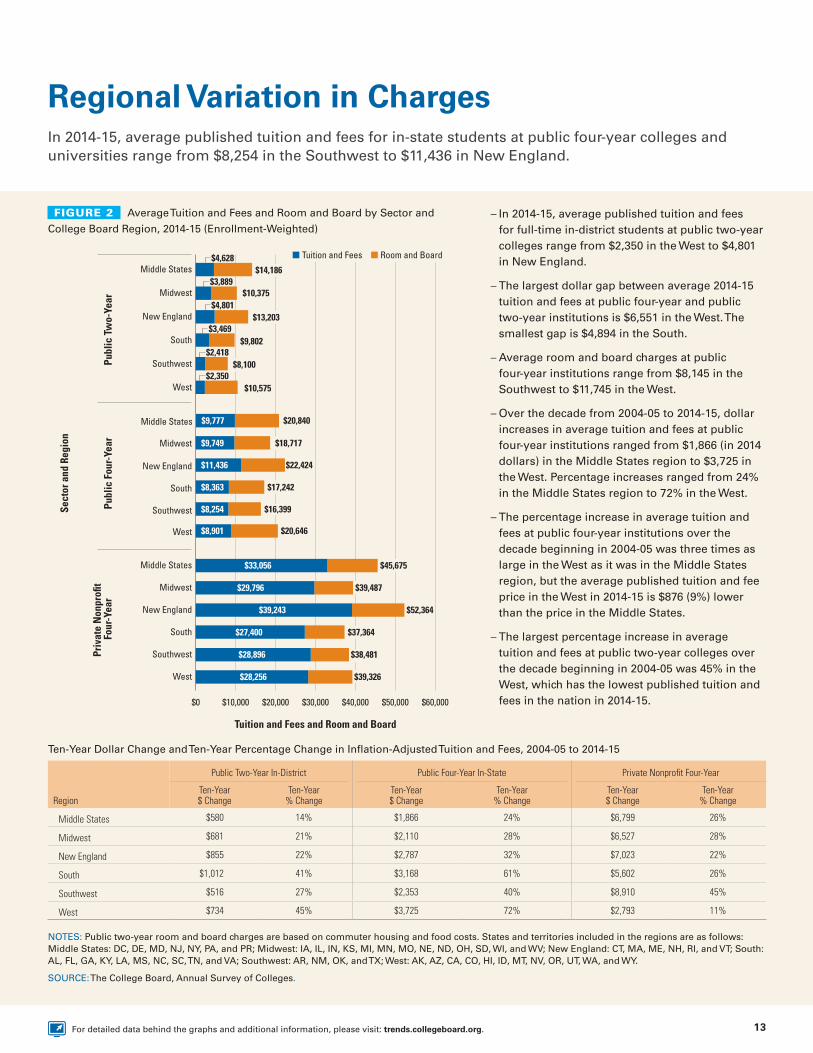
Regional Variation in Charges
FIGURE 2 Average Tuition and Fees and Room and Board by Sector and
College Board Region, 2014-15 (Enrollment-Weighted)
In 2014-15, average published tuition and fees for in-state students at public four-year colleges and universities range from $8,254 in the Southwest to $11,436 in New England.
– In 2014-15, average published tuition and fees for full-time in-district students at public two-year colleges range from $2,350 in the West to $4,801 in New England.
– The largest dollar gap between average 2014-15 tuition and fees at public four-year and public two-year institutions is $6,551 in the West. The smallest gap is $4,894 in the South.
– Average room and board charges at public four-year institutions range from $8,145 in the Southwest to $11,745 in the West.
– Over the decade from 2004-05 to 2014-15, dollar increases in average tuition and fees at public four-year institutions ranged from $1,866 (in 2014 dollars) in the Middle States region to $3,725 in the West. Percentage increases ranged from 24% in the Middle States region to 72% in the West.
– The percentage increase in average tuition and fees at public four-year institutions over the decade beginning in 2004-05 was three times as large in the West as it was in the Middle States region, but the average published tuition and fee price in the West in 2014-15 is $876 (9%) lower than the price in the Middle States.
– The largest percentage increase in average tuition and fees at public two-year colleges over the decade beginning in 2004-05 was 45% in the West, which has the lowest published tuition and fees in the nation in 2014-15.
NOTES: Public two-year room and board charges are based on commuter housing and food costs. States and territories included in the regions are as follows: Middle States: DC, DE, MD, NJ, NY, PA, and PR; Midwest: IA, IL, IN, KS, MI, MN, MO, NE, ND, OH, SD, WI, and WV; New England: CT, MA, ME, NH, RI, and VT; South: AL, FL, GA, KY, LA, MS, NC, SC, TN, and VA; Southwest: AR, NM, OK, and TX; West: AK, AZ, CA, CO, HI, ID, MT, NV, OR, UT, WA, and WY.
SOURCE: The College Board, Annual Survey of Colleges.
Region
Public Two-Year In-District Public Four-Year In-State Private Nonprofit Four-Year
Ten-Year $ Change
Ten-Year % Change
Ten-Year $ Change
Ten-Year % Change
Ten-Year $ Change
Ten-Year % Change
Middle States $580 14% $1,866 24% $6,799 26%
Midwest $681 21% $2,110 28% $6,527 28%
New England $855 22% $2,787 32% $7,023 22%
South $1,012 41% $3,168 61% $5,602 26%
Southwest $516 27% $2,353 40% $8,910 45%
West $734 45% $3,725 72% $2,793 11%
Publ
ic T
wo-
Year
Publ
ic F
our-
Year
Priv
ate
Non
pro�
t Fo
ur-Y
ear
Sect
or a
nd R
egio
n
Tuition and Fees and Room and Board
$0 $10,000 $20,000 $30,000 $40,000 $50,000 $60,000
West
Southwest
South
New England
Midwest
Middle States
West
Southwest
South
New England
Midwest
Middle States
West
Southwest
South
New England
Midwest
Middle States $14,186
$10,375
$13,203
$9,802
$8,100
$10,575
$20,840$9,777
$9,749
$11,436
$8,363
$8,254
$8,901
$18,717
$22,424
$17,242
$16,399
$20,646
$45,675
$39,487
$52,364
$37,364
$38,481
$39,326
$4,628
$3,889
$4,801
$3,469
$2,418
$2,350
$33,056
$29,796
$39,243
$27,400
$28,896
$28,256
Room and BoardTuition and Fees
Ten-Year Dollar Change and Ten-Year Percentage Change in Inflation-Adjusted Tuition and Fees, 2004-05 to 2014-15

14 For detailed data behind the graphs and additional information, please visit: trends.collegeboard.org.
Variation in Tuition and Fees, 2014-15Half of all full-time undergraduates at public and private nonprofit four-year colleges and universities attend institutions that have published tuition and fees of $11,550 or less, and half attend institutions with published tuition and fees of $11,550 or more.
– In 2014-15, among all full-time public four-year college students, including both in-state and out-of-state students, 41% are enrolled in institutions with published tuition and fee levels between $6,000 and $8,999; 17% face published prices of $15,000 or more.
NOTES: For out-of-state students enrolled in public four-year institutions, the nonresident premium has been added to in-state tuition and fees. Some out-of-state students benefit from reciprocity agreements, which allow students from neighboring states to pay less than the full out-of-state price. The distribution of students across institutions is based on the latest available enrollment data, which are for fall 2013. Percentages may not sum to 100 because of rounding.
SOURCE: The College Board, Annual Survey of Colleges.
FIGURE 3 Distribution of Full-Time Undergraduates at Four-Year Institutions by Published Tuition and Fees, 2014-15
– In 2014-15, among all full-time students at private nonprofit four-year colleges, 13% are enrolled in institutions with published tuition and fees below $15,000 and 17% face published prices of $45,000 or more.
Percentage of Full-Time Undergraduates
Public and Private Nonpro�t Four-Year Combined Public Four-Year Private Nonpro�t Four-Year
Tuiti
on a
nd F
ees
(Median = $11,550) (Median = $9,390) (Median = $32,340)
Under $6,000
$6,000 to $8,999
$9,000 to $11,999
$12,000 to $14,999
$15,000 to $17,999
$18,000 to $20,999
$21,000 to $23,999
$24,000 to $26,999
$27,000 to $29,999
$30,000 to $32,999
$33,000 to $35,999
$36,000 to $38,999
$39,000 to $41,999
$42,000 to $44,999
$45,000 and over
0% 10% 20% 30% 40% 50%0% 10% 20% 30% 40% 50%0% 10% 20% 30% 40% 50%
4.5%
29.3%
17.9%
9.3%
3.9%
3.6%
3.3%
4.0%
4.6%
3.5%
3.5%
3.2%
2.2%
2.1%
5.2%
4.4%
41.2%
24.9%
12.5%
4.1%
3.7%
1.7%
2.2%
2.2%
1.2%
1.0%
0.3%
0.3%
0.1%
0.0%
4.7%
3.1%
2.5%
2.2%
3.4%
3.2%
6.7%
7.8%
9.8%
8.5%
8.8%
9.5%
6.4%
6.7%
16.7%

15For detailed data behind the graphs and additional information, please visit: trends.collegeboard.org.
Variation in Tuition and Fee Increases, 2014-15The average increase in published tuition and fees at public four-year institutions in 2014-15 was 2.9% for in-state and 3.3% for out-of-state undergraduates, but 12% of full-time students in the sector attend institutions that did not increase their tuition and fees and 5% faced price increases of 9% or more.
– The average increase in tuition and fees at private nonprofit four-year colleges and universities in 2014-15 was 3.7% with 65% of the full-time undergraduates in this sector attending institutions that increased their tuition and fees by between 3% and 6%.
– Thirty percent of undergraduates in the private nonprofit four-year sector attend institutions that increased their prices by less than 3%, while 2% faced increases of 9% or more.
NOTES: For out-of-state students enrolled in public four-year institutions, the nonresident premium has been added to in-state tuition and fees. Some out-of-state students benefit from reciprocity agreements, which allow students from neighboring states to pay less than the full out-of-state price. The distribution of students across institutions is based on the latest available enrollment data, which are for fall 2013. Percentages may not sum to 100 because of rounding.
SOURCE: The College Board, Annual Survey of Colleges.
FIGURE 4 Distribution of Full-Time Undergraduates at Four-Year Institutions by Percentage Increase and Dollar Increase in Published
Tuition and Fees, 2014-15
– The median 2014-15 dollar increase in published tuition and fees was $268 for public four-year students and $1,140 for private nonprofit four-year students.
ALSO IMPORTANT:
– Increases in published prices do not necessarily correspond to increases in the amounts that students pay. The amounts students pay also depend on the amount of grant aid they receive.
0% 20% 40% 60% 80%
Under $200
$200 to $399
$400 to $599
$600 to $799
$800 to $999
$1,000 to $1,199
$1,200 to $1,399
$1,400 to $1,599
$1,600 to $1,799
$1,800 to $1,999
$2,000 or more
0% 20% 40% 60% 80%
Percentage of Full-Time Undergraduates
0%
0.1 to 2.9%
3 to 5.9%
6 to 8.9%
9% or More
6% 12%
5%
2%
8%
3%
6%
43%
24%
33%
65%
42%
10%
28%
6%
13%
6%
7%
8%
4%
12%
2%
12%
1%
14%
1%
12%
0.3%
10%
0.4%
7%
1%
4%Public Four-Year
Private Nonpro�t Four-YearPercentage Increase Dollar Increase
Am
ount
s
Perc
enta
ge

16 For detailed data behind the graphs and additional information, please visit: trends.collegeboard.org.
Published Charges over TimeIn both the public four-year and the private nonprofit four-year sectors, the inflation-adjusted rate of increase in published tuition and fee prices was lower over the most recent decade, from 2004-05 to 2014-15, than over either of the preceding two decades.
– Because the unusually rapid increases in the middle of the decade were more than offset by small price increases since 2012-13, average published tuition and fees at public four-year colleges and universities increased less rapidly between 2004-05 and 2014-15 than over the two preceding decades.
– The average annual inflation-adjusted increase in published tuition and fees at private nonprofit four-year institutions declined from 4.0% to 3.0% to 2.2% over the three decades from 1984-85 to 2014-15.
– The rapid increase in tuition and fees at public two-year colleges between 1984-85 and 1994-95, followed by two decades of more moderate increases, has yielded an average annual growth rate of 3.1% per year beyond inflation in this 30-year period.
– Over the 30 years from 1984-85 to 2014-15, average published tuition and fees at private four-year institutions rose by 146%, from $12,716 (in 2014 dollars) to $31,231. The average published price at public two-year colleges rose by 150%, from $1,337 to $3,347, and the increase for in-state students at public four-year institutions was 225%, from $2,810 to $9,139.
ALSO IMPORTANT:
– Freshman students are more likely than upper-level students to live on campus. For example, two-thirds of 2003-04 beginning full-time undergraduates at public four-year institutions and three-quarters of those at private nonprofit four-year institutions lived on campus. By 2006-07, only 20% of these students who were enrolled full time at public colleges and 50% of those at private colleges lived on campus. (NCES, Beginning Postsecondary Students Longitudinal Study 2009)
FIGURE 5 Average Annual Percentage Increase in Inflation-Adjusted Published
Prices by Decade, 1984-85 to 2014-15
FIGURE 6 Inflation-Adjusted Published Tuition and Fees Relative to 1984-85,
1984-85 to 2014-15 (1984-85 = 1.0)
NOTES: Each bar in Figure 5 shows the average annual rate of growth of published prices in inflation-adjusted dollars over a 10-year period. For example, from 2004-05 to 2014-15, average published tuition and fees at private nonprofit four-year colleges rose by an average of 2.2% per year beyond increases in the Consumer Price Index. Average tuition and fee prices reflect in-district charges for public two-year institutions and in-state charges for public four-year institutions.
SOURCES: The College Board, Annual Survey of Colleges; NCES, Integrated Postsecondary Education Data System (IPEDS).
NOTES: Figure 6 shows published tuition and fees by sector, adjusted for inflation, relative to 1984-85 published prices. For example, a value of 3.25 indicates that the tuition and fee price in the public four-year sector in 2014-15 is 3.25 times as high as it was in 1984-85, after adjusting for increases in the Consumer Price Index. Average tuition and fee prices reflect in-district charges for public two-year institutions and in-state charges for public four-year institutions.
SOURCES: The College Board, Annual Survey of Colleges; NCES, IPEDS.
Tuition and Fees and Room and Board
PublicFour-Year
Private Nonpro�tFour-Year
Tuition and Fees
PublicTwo-Year
PublicFour-Year
Private Nonpro�tFour-Year
2004-05 to 2014-151994-95 to 2004-051984-85 to 1994-95
4.0%4.4% 4.6%
3.2%
2.3%
3.0%
4.0%
2.2%2.7%
3.0%
2.2%
3.5%
2.5%2.1%
2.8%
0%
1%
2%
3%
4%
5%
Aver
age
Ann
ual P
erce
ntag
e In
crea
se
14-1512-1310-1108-0906-0704-0502-0300-0198-9996-9794-9592-9390-9188-8986-8784-85
Private Nonpro�t Four-Year
2.46
Public Two-Year2.50
Public Four-Year3.25
Academic Year
In�a
tion-
Adj
uste
d Pu
blis
hed
Tuiti
on
and
Fees
Rel
ativ
e to
198
4-85
0.0
0.5
1.0
1.5
2.0
2.5
3.0
3.5

17For detailed data behind the graphs and additional information, please visit: trends.collegeboard.org.
Published Charges over TimeAfter increases as high as 9.5% beyond inflation in 2009-10 and 6.5% in 2010-11, average published tuition and fee prices for full-time in-state students at public four-year institutions increased by less than 1% in real terms in 2013-14 and again in 2014-15.
– Increases in inflation-adjusted published tuition and fees in the public two-year and private nonprofit four-year sectors were also below 2% in both 2013-14 and 2014-15.
– In the public four-year sector, the increase in published tuition and fees from $2,810 (in 2014 dollars) in 1984-85 to $9,139 in 2014-15 is an increase of 225%, or 4.0% per year over 30 years. The increase over the most recent five years, from 2009-10 to 2014-15, was 17%, or 3.2% per year.
– In the public two-year sector, the increase in published tuition and fees from $1,337 (in 2014 dollars) in 1984-85 to $3,347 in 2014-15 is an increase of 150%, or 3.1% per year over 30 years. The increase over the most recent five years, from 2009-10 to 2014-15, is 18%, or 3.3% per year.
– In the private nonprofit four-year sector, the increase in published tuition and fees from $12,716 (in 2014 dollars) in 1984-85 to $31,231 in 2014-15 is 146%, or 3.0% per year over 30 years. The increase over the most recent five years, from 2009-10 to 2014-15, is 10%, or 1.9% per year.
ALSO IMPORTANT:
– The increases in the net prices that students actually pay, after taking grant aid and tax benefits into consideration, have been smaller over the long term than increases in published prices. See Figures 11, 12, and 13 for details on net prices over time.
TABLE 2A Average Tuition and Fees and Room and Board in 2014 Dollars, 1974-75 to 2014-15, Selected Years
Tuition and Fees in 2014 Dollars Tuition and Fees and Room and Board in 2014 Dollars
Private Nonprofit Four-Year
Five-Year % Change
Public Four-Year
Five-Year % Change
Public Two-Year
Five-Year % Change
Private Nonprofit Four-Year
Five-Year % Change
Public Four-Year
Five-Year % Change
1974-75 $10,273 — $2,469 — $1,336 — $16,475 — $7,938 —
1979-80 $10,511 2% $2,405 −3% $1,157 −13% $16,339 −1% $7,587 −4%
1984-85 $12,716 21% $2,810 17% $1,337 16% $19,342 18% $8,427 11%
1989-90 $16,591 30% $3,248 16% $1,611 20% $24,049 24% $9,030 7%
1994-95 $18,814 13% $4,343 34% $2,103 31% $26,487 10% $10,628 18%
1999-2000 $22,179 18% $4,805 11% $2,357 12% $30,692 16% $11,548 9%
2004-05 $25,215 14% $6,448 34% $2,615 11% $34,549 13% $14,310 24%
2009-10 $28,476 13% $7,825 21% $2,842 9% $38,799 12% $16,855 18%
2014-15 $31,231 10% $9,139 17% $3,347 18% $42,419 9% $18,943 12%
TABLE 2B Average Tuition and Fees and Room and Board in 2014 Dollars, 2004-05 to 2014-15
Tuition and Fees in 2014 Dollars Tuition and Fees and Room and Board in 2014 Dollars
Private Nonprofit Four-Year
One-Year % Change
Public Four-Year
One-Year % Change
Public Two-Year
One-Year % Change
Private Nonprofit Four-Year
One-Year % Change
Public Four-Year
One-Year % Change
2004-05 $25,215 — $6,448 — $2,615 — $34,549 — $14,310 —
2005-06 $25,581 1.5% $6,696 3.8% $2,660 1.7% $35,046 1.4% $14,772 3.2%
2006-07 $26,117 2.1% $6,795 1.5% $2,653 −0.3% $35,705 1.9% $15,029 1.7%
2007-08 $26,787 2.6% $7,081 4.2% $2,624 −1.1% $36,593 2.5% $15,507 3.2%
2008-09 $26,881 0.4% $7,148 0.9% $2,580 −1.7% $36,610 0.0% $15,567 0.4%
2009-10 $28,476 5.9% $7,825 9.5% $2,842 10.2% $38,799 6.0% $16,855 8.3%
2010-11 $29,251 2.7% $8,337 6.5% $2,997 5.5% $39,850 2.7% $17,680 4.9%
2011-12 $29,405 0.5% $8,728 4.7% $3,135 4.6% $40,043 0.5% $18,092 2.3%
2012-13 $30,146 2.5% $8,991 3.0% $3,280 4.6% $41,022 2.4% $18,528 2.4%
2013-14 $30,731 1.9% $9,062 0.8% $3,306 0.8% $41,771 1.8% $18,749 1.2%
2014-15 $31,231 1.6% $9,139 0.8% $3,347 1.2% $42,419 1.6% $18,943 1.0%
NOTE: Average tuition and fee prices reflect in-district charges for public two-year institutions and in-state charges for public four-year institutions.
SOURCES: The College Board, Annual Survey of Colleges; NCES, IPEDS data.

18 For detailed data behind the graphs and additional information, please visit: trends.collegeboard.org.
Tuition and Fees by State — Public Two-Year In 2014-15, average published tuition and fee prices for in-district students at public two-year institutions range from $1,429 in California and $1,645 in New Mexico to $6,500 in New Hampshire and $7,320 in Vermont.
– California’s 58% inflation-adjusted increase in average published tuition and fees for full-time students at public two-year colleges between 2009-10 and 2014-15 was second only to Louisiana’s 62%. Nonetheless, California’s price, the lowest in the country, is almost $2,000 below the national average of $3,347.
– In three of the four states that did not increase public two-year college prices in inflation-adjusted dollars between 2009-10 and 2014-15, the price remains above the national average.
ALSO IMPORTANT:
– California enrolled 21% of the nation’s full-time equivalent (FTE) public two-year and 8% of the nation’s public four-year FTE students in fall 2012. (Digest of Education Statistics 2013, Table 304.60)
– The difference between average published in-state tuition and fees at public four-year institutions and average in-district published tuition and fees at public two-year institutions ranges from $1,927 in Wyoming and $1,970 in South Dakota to $8,568 in New Jersey and $9,243 in Illinois.
SOURCE: The College Board, Annual Survey of Colleges.
FIGURE 7 Average 2014-15 In-District Tuition and Fees at Public Two-Year Institutions by State and Five-Year Percentage Change in
Inflation-Adjusted Tuition and Fees
Calif
orni
aN
ew M
exic
oTe
xas
Nor
th C
arol
ina
Ariz
ona
Mis
siss
ippi
Kans
asN
evad
aW
yom
ing
Neb
rask
aM
isso
uri
Ark
ansa
sFl
orid
aM
onta
naUn
ited
Stat
esM
ichi
gan
Utah
Wes
t Virg
inia
Dela
war
eM
aine
Haw
aii
Okla
hom
aIll
inoi
sGe
orgi
aLo
uisi
ana
Idah
oCo
nnec
ticut
Colo
rado
Tenn
esse
eRh
ode
Isla
ndA
lask
aM
aryl
and
Indi
ana
Nor
th D
akot
aA
laba
ma
Was
hing
ton
Wis
cons
inN
ew J
erse
yKe
ntuc
kyOh
ioIo
wa
Virg
inia
Oreg
onSo
uth
Caro
lina
Penn
sylv
ania
New
Yor
kM
assa
chus
etts
Min
nes o
taSo
uth
Dako
taN
ew H
amps
hire
Verm
ont
60%
0%
20%
10%
40%
30%
50%
Five
-Yea
r Per
cent
age
Chan
ge
State
-10%
58%
23%18%
62%
9%
$1,4
29$1
,645
$3,3
47 $3,6
83
$7,3
20$6
,500
$7,000
$6,000
$5,000
$4,000
$3,000
$2,000
$1,000
2014
-15
In-D
istr
ict T
uitio
n an
d Fe
es
$0
CA NM TX NC AZ
MS KS NV
WY
NE
MO AR FL MT
US MI
UT WV DE ME HI OK IL GA LA ID CT CO TN RI AK
MD IN ND AL
WA WI
NJ KY OH IA VA OR SC PA NY
MA
MN SD NH VT

19For detailed data behind the graphs and additional information, please visit: trends.collegeboard.org.
Tuition and Fees by State — Public Four-Year In-StateIn 2014-15, average published tuition and fee prices for in-state students at public four-year institutions range from $4,646 in Wyoming and $6,138 in Alaska to $14,419 in Vermont and $14,712 in New Hampshire.
– In 15 states, average in-state tuition and fees at public four-year institutions increased by less than 10% in inflation-adjusted dollars between 2009-10 and 2014-15. In eight of those states, the 2014-15 prices are below the national average of $9,139; in seven of those states, the prices are above the national average.
– In 18 states, average in-state tuition and fees at public four-year institutions increased by 20% or more in inflation-adjusted dollars between 2009-10 and 2014-15. In 11 of those states, the 2014-15 prices are below the national average of $9,139; in seven of those states, the prices are above the national average.
ALSO IMPORTANT:
– As Figure 17B indicates, Alaska and Wyoming, with the lowest in-state tuition and fees, had the highest state appropriations per FTE student in the country in 2013-14. New Hampshire and Vermont, with the highest prices, had the lowest and the sixth lowest appropriations per student, respectively.
– Four of the five states with the smallest public four-year price increases between 2009-10 and 2014-15 were among the 15 states that did not reduce appropriations (in current dollars) for higher education between FY09 and FY14.
– Four of the five states with the largest public four-year price increases between 2009-10 and 2014-15 were among the 14 states that reduced appropriations for higher education by 12% or more (in current dollars) between FY09 and FY14.
FIGURE 8 Average 2014-15 In-State Tuition and Fees at Public Four-Year Institutions by State and Five-Year Percentage Change in
Inflation-Adjusted Tuition and Fees
SOURCE: The College Board, Annual Survey of Colleges.
$0
$2,000
$4,000
$6,000
$8,000
$10,000
$12,000
$14,000
2014
-15
In-S
tate
Tui
tion
and
Fees
Five
-Yea
r Per
cent
age
Chan
ge
State
0%
10%
20%
30%
40%
50%
60%
NHVTPANJILMI
SCDEMARIVAWACTMNAZOHHICOALMEKYUSCAINORTXWI
MDTNMOGAKSIASDARNDNELANY
OKMS
NC
WVIDNVFLMT
NMUTAKWY
New
Ham
pshi
reVe
rmon
tPe
nnsy
lvan
iaN
ew J
erse
yIll
inoi
sM
ichi
gan
Sout
h Ca
rolin
aDe
law
are
Mas
sach
uset
tsRh
ode
Isla
ndVi
rgin
iaW
ashi
ngto
nCo
nnec
ticut
Min
neso
taAr
izona
Ohio
Haw
aii
Colo
rado
Alab
ama
Mai
neKe
ntuc
kyU
nite
d St
ates
Calif
orni
aIn
dian
aOr
egon
Texa
sW
isco
nsin
Mar
ylan
dTe
nnes
see
Mis
sour
iGe
orgi
aKa
nsas
Iow
aSo
uth
Dako
taAr
kans
asN
orth
Dak
ota
Neb
rask
aLo
uisi
ana
New
Yor
kOk
laho
ma
Mis
siss
ippi
Nor
th C
arol
ina
Wes
t Virg
inia
Idah
oN
evad
aFl
orid
aM
onta
naN
ew M
exic
oUt
ahAl
aska
Wyo
min
g$4
,646 $6
,138
13%
13% 17
% 20%
8%
$9,1
39
$14,
712
$14,
419

20 For detailed data behind the graphs and additional information, please visit: trends.collegeboard.org.
Tuition and Fees by State — Public Four-Year Out-of-StateIn 2014-15, the highest average published out-of-state tuition and fees at public four-year institutions are in Vermont ($34,331) and Michigan ($31,982). For the nation as a whole, the average out-of-state tuition and fee price at public four-year institutions is $22,958.
FIGURE 9 Average 2014-15 Out-of-State Tuition and Fees at Public Four-Year Institutions by State and Five-Year Percentage Change in
Inflation-Adjusted Tuition and Fees
– The lowest average published out-of-state tuition and fees for public four-year colleges and universities in 2014-15 are $9,910 in South Dakota and $14,876 in Wyoming.
– Over the five years from 2009-10 to 2014-15, percentage changes in average public four-year out-of-state tuition and fees ranged from inflation-adjusted declines of 2% in Rhode Island and 1% in Wisconsin to increases of 34% in Hawaii and 58% in Louisiana. Rhode Island’s out-of-state tuition remains higher than the national average and Louisiana’s remains lower.
ALSO IMPORTANT:
– The difference between average in-state and out-of-state published tuition and fees ranges from $2,257 in South Dakota and $6,823 in Minnesota to $19,912 in Vermont and $20,073 in Michigan.
– Because of reciprocity agreements, not all out-of-state students pay the prices reported here, even before taking financial aid into consideration. See http://www.nasfaa.org/students/state___regional_college_tuition_discounts.aspx for details.
NOTE: The percentages on the x-axis in the top graph represent the proportion of fall 2012 first-time freshman students in each state who were state residents.
SOURCES: The College Board, Annual Survey of Colleges; NCES, Digest of Education Statistics 2013, Table 309.10.
$0
State (and Percentage of First-Time Freshman Students Who Were State Residents)
$22,
958
$20,
877
$34,
331
$31,
982
$9,9
10
12%
58%
10%
11%21
%15
%So
uth
Dako
taW
yom
ing
Arka
nsas
Min
neso
taOk
laho
ma
Mis
siss
ippi
New
Yor
kN
orth
Dak
ota
New
Mex
ico
Wes
t Virg
inia
Neb
rask
aUt
ahM
isso
uri
Alas
kaId
aho
Wis
cons
inKa
nsas
Nev
ada
Flor
ida
Mon
tana
Loui
sian
aKe
ntuc
kyM
aryl
and
Ohio
Texa
sM
aine
Alab
ama
Nor
th C
arol
ina
Uni
ted
Stat
esIo
wa
Penn
sylv
ania
Mas
sach
uset
tsGe
orgi
aTe
nnes
see
New
Jer
sey
Calif
orni
aIll
inoi
sN
ew H
amps
hire
Arizo
naRh
ode
Isla
ndHa
wai
iW
ashi
ngto
nOr
egon
Colo
rado
Conn
ectic
utIn
dian
aSo
uth
Caro
lina
Dela
war
eVi
rgin
iaM
ichi
gan
Verm
ont
$19,
702
-1%
$25,
786
-2%
$17,
350
$14,
876
17%
$26,
768
34%
2014
-15
Out
-of-
Stat
e Tu
ition
and
Fee
sFi
ve-Y
ear P
erce
ntag
e Ch
ange
60%
0%
20%
40%
-20%
$5,000
$10,000
$15,000
$20,000
$25,000
$30,000
$35,000
$40,000
SD (6
5%)
WY
(62%
)AR
(80%
)M
N (7
9%)
OK (7
6%)
MS
(82%
)N
Y (8
0%)
ND
(49%
)N
M (8
4%)
WV
(49%
)N
E (7
9%)
UT (6
9%)
MO
(77%
)AK
(80%
)ID
(69%
)W
I (79
%)
KS (7
7%)
NV
(89%
)FL
(84%
)M
T (7
2%)
LA (8
6%)
KY (8
0%)
MD
(80%
)OH
(82%
)TX
(92%
)M
E (6
7%)
AL (7
1%)
NC
(83%
)U
S (8
0%)
IA (6
1%)
PA (7
3%)
MA
(62%
)GA
(85%
)TN
(82%
)N
J (9
1%)
CA (9
0%)
IL (8
4%)
NH
(51%
)AZ
(63%
)RI
(44%
)HI
(80%
)W
A (8
3%)
OR (7
3%)
CO (7
8%)
CT (6
9%)
IN (7
7%)
SC (7
8%)
DE (6
0%)
VA (7
5%)
MI (
88%
)VT
(34%
)

21For detailed data behind the graphs and additional information, please visit: trends.collegeboard.org.
Tuition and Fees by State — Flagship UniversitiesIn 2014-15, published tuition and fees for full-time in-state students at flagship universities range from $4,646 at the University of Wyoming and $6,099 at the University of Montana to $16,552 at the University of New Hampshire and $18,464 at Penn State–University Park.
– Changes in published tuition and fees for in-state students at flagship universities over the five years from 2009-10 to 2014-15 ranged from declines of less than 1% at the University of Texas–Austin and the University of Maine to increases of 51% at Louisiana State University and 59% at the University of Georgia.
– In 2014-15, published tuition and fees for out-of-state students at flagship universities range from $10,104 at the University of South Dakota and $14,876 at the University of Wyoming to
$41,906 at the University of Michigan–Ann Arbor and $42,184 at the University of Virginia.
– In 17 states, the flagship universities increased their published tuition and fee price by less than 1% (not adjusted for inflation) in 2014-15 (online Table 6).
– In 12 states, tuition and fees at flagship universities increased by 5% or more (not adjusted for inflation) in 2014-15 (online Table 6).
FIGURE 10 2014-15 Tuition and Fees at Flagship Universities and Five-Year Percentage Change in Inflation-Adjusted Tuition and Fees,
2009-10 to 2014-15
NOTE: The percentages on the x-axis in the top graph represent the proportion of fall 2012 first-time freshman students in each institution who were state residents.
SOURCES: The College Board, Annual Survey of Colleges; NCES, IPEDS data.
Penn
Sta
te U
niv.
−Uni
vers
ity P
ark
Univ
. of N
HUn
iv. o
f VT
Univ
. of M
I−An
n Ar
bor
Univ
. of I
L−Ur
bana
-Cha
mpa
ign
Rutg
ers,
Sta
te U
niv.
of N
JUn
iv. o
f MN
−Tw
in C
ities
Univ
. of M
A−Am
hers
tUn
iv. o
f VA
Univ
. of C
A−Be
rkel
eyUn
iv. o
f CT
Univ
. of R
IUn
iv. o
f WA
Univ
. of D
EUn
iv. o
f CO−
Boul
der
Univ
. of S
C−Co
lum
bia
Univ
. of A
ZUn
iv. o
f GA
Univ
. of H
I−M
anoa
Univ
. of M
EUn
iv. o
f KY
Univ
. of W
I−M
adis
onIN
Uni
v.−B
loom
ingt
onUn
iv. o
f MO−
Colu
mbi
aUn
iv. o
f TN
−Kno
xvill
eOH
Sta
te U
niv.
−Col
umbu
sUn
iv. o
f OR
Univ
. of A
LUn
iv. o
f TX−
Aust
inUn
iv. o
f KS
Univ
. of M
D−Co
llege
Par
kSU
NY−
Buffa
loUn
iv. o
f OK
LA S
tate
Uni
v. &
A&
M C
olle
geUn
iv. o
f NC−
Chap
el H
illUn
iv. o
f AR
Univ
. of N
E−Li
ncol
nUn
iv. o
f IA
Univ
. of S
DUn
iv. o
f UT
Univ
. of N
DUn
iv. o
f MS
Wes
t VA
Univ
.Un
iv. o
f ID
Univ
. of N
V–Re
noUn
iv. o
f NM
Univ
. of F
LUn
iv. o
f AK
Fairb
anks
Univ
. of M
TUn
iv. o
f WY
WY (
50%
)M
T (7
4%)
AK (8
9%)
FL (8
8%)
NM
(88%
)N
V (7
5%)
ID (7
0%)
WV
(42%
)M
S (4
8%)
ND
(32%
)U
T (7
0%)
SD (6
1%)
IA (4
7%)
NE
(77%
)AR
(53%
)N
C (8
3%)
LA (7
9%)
OK (6
0%)
NY (
82%
)M
D (6
9%)
KS (6
8%)
TX (8
9%)
AL (4
5%)
OR (4
8%)
OH (7
5%)
TN (9
0%)
MO
(63%
)IN
(61%
)W
I (56
%)
KY (6
7%)
ME
(73%
)H
I (68
%)
GA (8
8%)
AZ (6
0%)
SC (5
4%)
CO (5
7%)
DE
(40%
)W
A (6
7%)
RI (4
8%)
CT (7
1%)
CA (7
1%)
VA (6
5%)
MA
(73%
)M
N (6
3%)
NJ
(87%
)IL
(75%
)M
I (58
%)
VT (2
3%)
NH
(45%
)PA
(57%
)
In-State Tuition and FeesOut-of-State PremiumTotal Out-of-State Tuition and Fees
2014
-15
Tuiti
on a
nd F
ees
60%
0%
20%
40%
80%
Five
-Yea
r % C
hang
e in
In-S
tate
Tui
tion
and
Fees
$5,000
$10,000
$15,000
$20,000
$25,000
$30,000
$35,000
$40,000
$0
Institution (and Percentage of First-Time Freshman Students Who Were State Residents)
$14,
876
$4,6
46
$16.
552
$18,
464
$6,0
99
$10,
104
51%
<1%
<1%
59%
$42,
184
$41,
906

22 For detailed data behind the graphs and additional information, please visit: trends.collegeboard.org.
Average Net Price — Public Two-Year
FIGURE 11 Average Published and Net Prices in 2014 Dollars, Full-Time
In-District Undergraduate Students at Public Two-Year Institutions, 1994-95 to 2014-15
Increases in average grant aid for full-time students in public two-year colleges have been sufficient to prevent average net prices, including living costs, from rising over time.
– Between 2004-05 and 2014-15, the average published tuition and fees at public two-year colleges increased by $730 (28%) after adjusting for inflation. Average combined grant aid and tax benefits increased by more than $2,000 over the decade.
– Since 2008-09, full-time students at public two-year colleges have received enough grant aid and tax benefits to cover published tuition and fees as well as a portion of other expenses.
– On average, after grant aid full-time students at public two-year colleges must cover about $6,000 in housing and food costs in 2014-15, in addition to books and supplies, transportation, and other living expenses.
ALSO IMPORTANT:
– The national average published tuition and fee price of $3,350 for full-time students at public two-year colleges in 2014-15 rises to $3,700 if California is excluded. The average net price is also higher if California, with the lowest tuition and fees and about one-sixth of the nation’s public two-year full-time college students, is not included in the estimate.
NOTES: Because information on grant aid for 2014-15 is not yet available, the net price for 2014-15 is estimated based on 2013-14 financial aid. Prices and grant aid are rounded to the nearest $10.
SOURCES: The College Board, Annual Survey of Colleges; Trends in Student Aid 2014.
Pric
e
-$4,000
-$2,000
$0
$2,000
$4,000
$6,000
$8,000
$10,000
$12,000
Net Tuition and Fees
Published Tuition and Fees
Net TFRB
Published Tuition and Fees and Room and Board (TFRB)
14-1512-1310-1108-0906-0704-0502-0300-0198-9996-9794-95
Academic Year
94-95 98-99 02-03 04-05 06-07 08-09 10-11 12-13 14-15
Published Tuition and Fees $2,100 $2,270 $2,210 $2,620 $2,650 $2,580 $3,000 $3,280 $3,350
Published Tuition and Fees and Room and Board (TFRB) $8,820 $9,320 $9,760 $9,950 $10,320 $10,290 $11,060 $10,920 $11,050
Net Tuition and Fees $590 −$190 −$570 −$180 $70 −$370 −$1,680 −$1,540 −$1,740
Net TFRB $7,310 $6,860 $6,980 $7,150 $7,740 $7,340 $6,380 $6,100 $5,960
Grant Aid and Tax Benefits per Student $1,510 $2,460 $2,780 $2,800 $2,580 $2,950 $4,680 $4,820 $5,090
Average Published and Net Prices and Total Grant Aid per Student in 2014 Dollars, Full-Time In-District Undergraduate Students at Public Two-Year Institutions, 1994-95 to 2014-15, Selected Years

23For detailed data behind the graphs and additional information, please visit: trends.collegeboard.org.
94-95 98-99 02-03 04-05 06-07 08-09 10-11 12-13 14-15
Published Tuition and Fees $4,340 $4,740 $5,420 $6,450 $6,800 $7,150 $8,340 $8,990 $9,140
Published Tuition and Fees and Room and Board (TFRB) $10,630 $11,340 $12,790 $14,310 $15,030 $15,570 $17,680 $18,530 $18,940
Net Tuition and Fees $2,020 $1,610 $1,570 $2,290 $2,540 $2,500 $2,140 $3,150 $3,030
Net TFRB $8,310 $8,210 $8,940 $10,150 $10,770 $10,920 $11,480 $12,690 $12,830
Grant Aid and Tax Benefits per Student $2,320 $3,130 $3,850 $4,160 $4,260 $4,650 $6,200 $5,840 $6,110
Average Published and Net Prices and Average Grant Aid in 2014 Dollars, Full-Time In-State Undergraduate Students at Public Four-Year Institutions, 1994-95 to 2014-15, Selected Years
FIGURE 12 Average Published and Net Prices in 2014 Dollars, Full-Time
In-State Undergraduate Students at Public Four-Year Institutions, 1994-95 to 2014-15
After declining from $2,680 (in 2014 dollars) in 2007-08 to $2,030 in 2009-10, the estimated average net tuition and fee price paid by full-time in-state students at public four-year institutions has risen to about $3,030 in 2014-15.
– In 2014-15, full-time students at public four-year colleges receive an average of about $6,110 in a combination of grant aid from all sources and education tax credits and deductions.
– In 2009-10, both the federal Pell Grant program and expanded education tax credits helped to reduce the net prices facing undergraduate students.
– Between 2010-11 and 2012-13, published tuition and fees in the public four-year sector increased by 8% ($650 in 2014 dollars), while estimated grant aid per student declined, leading to rapid growth in the net prices facing students.
– In addition to an estimated average net tuition and fee price of $3,030, students living on campus at public four-year colleges and universities face an average room and board charge of $9,800, leading to total net charges of $12,830 in 2014-15.
ALSO IMPORTANT:
– Average net prices conceal considerable differences among students both within institutions and across institutions within the sector.
NOTES: Because information on grant aid for 2014-15 is not yet available, the net price for 2014-15 is estimated based on 2013-14 financial aid. The estimate of average grant aid does not account for differences between the aid received by in-state and out-of-state students. Prices and grant aid are rounded to the nearest $10.
SOURCES: The College Board, Annual Survey of Colleges; Trends in Student Aid 2014.
Pric
e
$0
$2,000
$4,000
$6,000
$8,000
$10,000
$12,000
$14,000
$16,000
$18,000
$20,000
Net Tuition and Fees
Published Tuition and Fees
Net TFRB
Published Tuition and Fees and Room and Board (TFRB)
14-1512-1310-1108-0906-0704-0502-0300-0198-9996-9794-95
Academic Year
Average Net Price — Public Four-Year

24 For detailed data behind the graphs and additional information, please visit: trends.collegeboard.org.
Average Net Price — Private Nonprofit Four-Year
NOTE: Because information on grant aid for 2014-15 is not yet available, the net price for 2014-15 is estimated based on 2013-14 financial aid. Prices and grant aid are rounded to the nearest $10.
SOURCES: The College Board, Annual Survey of Colleges; Trends in Student Aid 2014.
FIGURE 13 Average Published and Net Prices in 2014 Dollars, Full-Time
Undergraduate Students at Private Nonprofit Four-Year Institutions, 1994-95
to 2014-15
The average net tuition and fee price at private nonprofit four-year colleges declined by about 18% ($2,640 in 2014 dollars) between 2007-08 and 2010-11. Since 2010-11, the net price for this sector has leveled off, fluctuating between $12,000 and $12,400.
14-1512-1310-1108-0906-0704-0502-0300-0198-9996-9794-95
$5,000
$0
$10,000
$15,000
$20,000
$25,000
$30,000
$35,000
$40,000
$45,000
Pric
e
Academic Year
Net Tuition and Fees
Published Tuition and Fees
Net TFRB
Published Tuition and Fees and Room and Board (TFRB)
SOURCES: The College Board, Annual Survey of Colleges; Trends in Student Aid 2014.
94-95 98-99 02-03 04-05 06-07 08-09 10-11 12-13 14-15
Published Tuition and Fees $18,810 $21,470 $23,890 $25,220 $26,120 $26,880 $29,250 $30,150 $31,230
Published Tuition and Fees and Room and Board (TFRB) $26,490 $29,870 $32,900 $34,550 $35,700 $36,610 $39,850 $41,020 $42,420
Net Tuition and Fees $10,590 $11,900 $13,710 $14,170 $14,420 $13,860 $12,010 $12,120 $12,360
Net TFRB $18,270 $20,300 $22,720 $23,500 $24,000 $23,590 $22,610 $22,990 $23,550
Grant Aid and Tax Benefits per Student $8,220 $9,570 $10,180 $11,050 $11,700 $13,020 $17,240 $18,030 $18,870
Average Published and Net Prices and Total Grant Aid per Student in 2014 Dollars, Full-Time Undergraduate Students at Private Nonprofit Four-Year Institutions, 1994-95 to 2014-15, Selected Years
– Full-time undergraduates at private nonprofit four-year colleges receive an average of about $18,870 in grant aid from all sources and education tax benefits to help them pay the 2014-15 published tuition and fees of $31,230.
– The average net tuition and fees at private nonprofit four-year colleges and universities rose fairly steadily from 1994-95 through 2007-08, at the rate of about 2.5% per year beyond inflation before beginning to decline in 2008-09.
– Tuition and fees and room and board charges combined, net of grant aid and education tax credits and deductions, average $23,550 for private nonprofit college students in 2014-15.
ALSO IMPORTANT:
– In 2011-12, 67% of full-time students at private nonprofit four-year institutions received grant aid from their institutions. Thirty-six percent received federal grant aid and 24% received state grant aid. (NCES, NPSAS, 2012)

25For detailed data behind the graphs and additional information, please visit: trends.collegeboard.org.
Net Price by Income — Public Institutions
NOTES: Family income quartiles are based on all dependent undergraduate students across all sectors. Lowest: less than $30,000; second: $30,000 to $64,999; third: $65,000 to $105,999; highest: $106,000 or higher. Total grant aid includes veterans’ benefits. Includes full-time undergraduate students who were U.S. citizens or permanent residents.
SOURCE: NCES, National Postsecondary Student Aid Study, 2012.
– At public four-year institutions, in-state students from the lowest family income quartile had to cover about $11,020 for living costs and other expenses from sources other than grant aid.
– At public four-year institutions, the difference between average net tuition and fees for in-state and out-of-state students in 2011-12 ranged from $8,590 for the lowest income quartile to $10,980 for full-time students from families with incomes of $106,000 or higher.
– On average, in 2011-12, full-time independent students at public two-year colleges, as well as dependent students from families in both the lowest and the second income quartiles, received enough grant aid from all sources combined to cover tuition and fees as well as a portion of living and other expenses.
ALSO IMPORTANT:
– Tax credits and deductions are not included in the net price estimates in Figures 14A, 14B, 15A, and 15B. Total subsidies from federal education tax credits and deductions increased from about $7 billion in 2008 to about $17 billion in 2012.
On average, in 2011-12, full-time in-state students at public four-year universities from families with incomes below $30,000 received enough grant aid to cover tuition and fees and have about $2,320 left to put toward room, board, and other expenses.
FIGURE 14A Published and Net Prices of Full-Time Students at Public Four-Year Institutions, by State Residency, Dependency Status, and
Family Income, 2011-12
FIGURE 14B Published and Net Prices of Full-Time Students at Public
Two-Year Institutions, by Dependency Status and Family Income, 2011-12
$0
$5,000
-$5,000
$10,000
$15,000
$20,000
$25,000
$30,000
$35,000
Independent Students
Dependent Students’Family Income Quartile
Dependent Students’Family Income Quartile
HighestThirdSecondLowest Independent Students
HighestThirdSecondLowest
State Residency, Dependency Status, and Family Income
Pric
e
Published Tuition and Fees Net Tuition and FeesNontuition Expenses
$13,
340
$7,3
90$1
3,34
0
-$2,
320
$13,
530
$7,9
70
$13,
530
$1,4
40
$13,
590
$8,1
50
$13,
590
$5,3
50
$14,
200
$8,6
20
$14,
200
$6,3
30
$14,
710
$6,8
00
$14,
710
$280
$14,
480
$17,
510
$14,
480
$6,2
70
$13,
310
$18,
680
$13,
310
$10,
750
$14,
260
$18,
250
$14,
260
$14,
080
$14,
100
$21,
150
$14,
100
$17,
310
$15,
360
$12,
790
$15,
360
$6,5
80
In-State
Out-of-State
$0
$5,000
-$5,000
$10,000
$15,000
$20,000
$25,000
$30,000
Independent Students
Dependent Students’Family Income Quartile
HighestThirdSecondLowest
Dependency Status and Family Income
Published Tuition and FeesNontuition Expenses
Net Tuition and Fees
Pric
e
$11,
150
$2,6
10
$11,
150
-$3,
080
$11,
250
$2,8
50
$11,
250
-$31
0
$11,
390
$2,9
50
$11,
390
$1,9
00
$11,
740
$2,8
70
$11,
740
$2,0
50
$13,
440
$2,5
90
$13,
440
-$1,
810

26 For detailed data behind the graphs and additional information, please visit: trends.collegeboard.org.
Net Price by Income — Private Institutions
NOTES: Family income quartiles are based on all dependent undergraduate students across all sectors. Lowest: less than $30,000; second: $30,000 to $64,999; third: $65,000 to $105,999; highest: $106,000 or higher. Total grant aid includes veterans’ benefits. Includes full-time undergraduate students who were U.S. citizens or permanent residents.
SOURCE: NCES, National Postsecondary Student Aid Study, 2012.
– Average grant aid for students from families with incomes below $30,000 covers over three-quarters of published tuition and fees at private nonprofit colleges and universities in all price categories.
– Particularly for low-income students, the differences in the net prices of institutions in different tuition categories are smaller than the differences in published prices.
– At private nonprofit institutions with published tuition and fees of $36,421 or higher in 2011-12, average prices net of grant aid from all sources ranged from $9,860 for dependent students from the lowest family income quartile to $29,110 for those from the highest income quartile.
– At private nonprofit institutions with published tuition and fees of $22,104 or lower in 2011-12, average prices net of grant aid from all sources ranged from $2,530 for dependent students from the lowest family income quartile to $8,820 for those from the highest income quartile.
– For dependent students from the lower half of the income distribution, the average net tuition and fee price in the for-profit sector is higher than in private nonprofit institutions in all price categories.
In 2011-12, full-time dependent students from the lowest income quartile paid average net tuition and fees, after grant aid, of $11,300 in the for-profit sector, compared to $2,530 at the lowest-price and $9,860 at the highest-price nonprofit institutions.
FIGURE 15A Published and Net Prices of Full-Time Dependent Students at Private Nonprofit Four-Year Institutions, by Tuition and Fees
and Family Income, 2011-12
FIGURE 15B Published and Net Prices of Full-Time Students at For-Profit
Institutions, by Dependency Status and Family Income, 2011-12
Dependent Students’ Family Income
Pric
e
Net Tuition and Fees
Nontuition Expenses
Published Tuition and Fees
$0
$10,000
$20,000
$30,000
$40,000
$50,000
$60,000
Lowest Tuition Group($22,104 or Lower)
Second Tuition Group($22,105 to $28,727)
Third Tuition Group($28,728 to $36,420)
Highest Tuition Group($36,421 or Higher)
HighestThirdSecondLowest HighestThirdSecondLowest HighestThirdSecondLowest HighestThirdSecondLowest
$13,
550
$16,
550
$13,
550
$2,5
30
$13,
630
$17,
350
$13,
630
$4,5
80
$13,
350
$16,
410
$13,
350
$7,4
80
$14,
880
$16,
750
$14,
880
$8,8
20
$14,
090
$25,
560
$14,
090
$3,1
90
$12,
990
$25,
830
$12,
990
$6,6
50
$13,
640
$25,
710
$13,
640
$11,
750
$14,
180
$25,
790
$14,
180
$12,
370
$14,
970
$32,
240
$14,
970
$5,7
50
$14,
680
$32,
030
$14,
680
$9,9
70
$15,
190
$32,
360
$15,
190
$14,
760
$15,
570
$32,
530
$15,
570
$18,
450
$15,
290
$41,
890
$15,
290
$9,8
60
$15,
350
$40,
510
$15,
350
$13,
300
$15,
820
$40,
480
$15,
820
$20,
720
$15,
780
$41,
410
$15,
780
$29,
110
Pric
e
Net Tuition and FeesNontuition ExpensesPublished Tuition and Fees
$0
$10,000
$20,000
$30,000
$40,000
$50,000
Dependent Students’Family Income Quartile
HighestThirdSecondLowest Independent Students
$12,
880
$17,
630
$12,
880
$11,
300
$13,
350
$17,
930
$13,
350
$13,
720
$13,
970
$19,
290
$13,
970
$18,
040
$15,
590
$19,
330
$15,
590
$17,
460
$14,
000
$14,
570
$14,
000
$9,0
60
Dependency Status and Family Income

27For detailed data behind the graphs and additional information, please visit: trends.collegeboard.org.
Institutional Revenues — State Funding
NOTES: Enrollment figures are fall FTE enrollments for public two-year and four-year institutions, with fall 2013 estimated based on preliminary IPEDS data. Funding is for both two-year and four-year institutions and includes tax revenues and other state funds for higher education, but excludes funding for capital expenditures. Tuition and fees reflect an FTE enrollment-weighted average of two-year and four-year prices.
SOURCES: The College Board, Annual Survey of Colleges; Illinois State University, Grapevine reports; NCES, Digest of Education Statistics 2013, Table 307.10; NCES, IPEDS Fall 2013 Preliminary Enrollment Data; calculations by the authors.
– The $7,161 per-student state funding in 2013-14 reflects an increase of $361 per student from the low point of $6,800 (in 2013 dollar) in 2011-12.
– Total state fiscal support declined by 16%, from $90.5 billion in 2007-08 (in 2013 dollars) to $76.2 billion in 2013-14, while FTE enrollment in public institutions increased by 9% over these six years.
– The sharp declines in per-student state funding in recent years were accompanied by rapid increases in public college tuition and fees. As state funding started to recover in 2012-13 and 2013-14, tuition increases were smaller.
– Similar combinations of declining per-student state funding and large price increases occurred in the early 1990s and the early 2000s.
ALSO IMPORTANT:
– From fall 2002 to fall 2012, total FTE enrollment in public institutions in the United States increased by 30%. Enrollment increases ranged from less than 3% in Illinois to 36% in Arkansas and Georgia, and to 37% in Florida. (Figure 27)
– Between 2008-09 and 2013-14, total inflation-adjusted state funding for higher education increased by 27% in Illinois and by 52% in North Dakota. Appropriations declined by 37% in Arizona and by 38% in Louisiana, and by more than 20% in seven additional states. (Illinois State University, Grapevine data, Table 1; calculations by the authors)
In 2013-14, public colleges and universities received an average of $7,161 per full-time equivalent (FTE) student in state funding — 23% less than the $9,290 (in 2013 dollars) per FTE student they received in 2007-08.
FIGURE 16A Annual Percentage Change in Inflation-Adjusted Per-Student
State Funding for Higher Education and in Tuition and Fees at Public Institutions,
1983-84 to 2013-14
FIGURE 16B Total and Per-Student State Funding for Higher Education in 2013
Dollars, and Public FTE Enrollment, 1983-84 to 2013-14
Tuition and Fees
Funding per FTE Student
-15%
-10%
-5%
0%
5%
10%
15%
Perc
enta
ge C
hang
e
Academic Year
13-1410-1107-0804-0501-0298-9995-9692-9389-9086-8783-84
13-1407-08 10-1101-0295-9689-90 04-0598-9992-9386-8783-84
Total Funding (Billions)
Public FTE Enrollment (Millions)
$0
$20
$40
$60
$80
$100
($)0
($)2
($)4
($)6
($)8
($)10
$120 ($)12 Public FTE Enrollment (in M
illions) and State Funding per FTE
(in Thousands of 2013 Dollars)
Academic Year
Funding per FTE (Thousands)
Tota
l Sta
te F
undi
ng
(in B
illio
ns o
f 201
3 D
olla
rs)

28 For detailed data behind the graphs and additional information, please visit: trends.collegeboard.org.
Institutional Revenues — State Funding
NOTE: The Bureau of Economic Analysis (BEA) measure of personal income is the sum of income from all sources received by individuals, including earnings (net of social insurance taxes but not income taxes), interest, dividends, rental income, and transfer payments.
SOURCES: Illinois State University, Grapevine reports; calculations by the authors.
SOURCES: Illinois State University, Grapevine reports; calculations by the authors.
FIGURE 17B State Funding for Higher Education per Student and per $1,000 in Personal Income, by State, 2013-14
– In 2013-14, state funding per full-time equivalent (FTE) student for the operating expenses of public colleges and universities ranged from $3,184 in New Hampshire and $3,494 in Colorado to $14,045 in Wyoming and $18,857 in Alaska.
– A given level of funding per $1,000 in personal income yields higher per-student support in states with higher levels of personal income (and also in states with lower college enrollment rates).
– For example, both Missouri and New Jersey provided about $4 per $1,000 in personal income, but Missouri’s $4,975 in fiscal support per FTE student was considerably smaller than New Jersey’s $7,484 figure.
– Kentucky and Minnesota each provided about $7,100 per student in funding, but Kentucky provided $7.44 per $1,000 in personal income while Minnesota provided $5.42.
ALSO IMPORTANT:
– Between 2008-09 and 2013-14, state funding per FTE student declined by more than 20% (after adjusting for inflation) in 9 states and by 10% to 20% in another 17 states.
The portion of state resources going to support higher education, measured by funding per $1,000 in personal income, has declined steadily in recent decades.
FIGURE 17A Average State Funding for Higher Education per $1,000 in
Personal Income, 1989-90 to 2013-14
Academic Year
13-1409-10 11-1207-0805-0603-0401-0299-0097-9895-9693-9491-9289-90
$0
$2
$4
$6
$8
$10
$12
Stat
e Fu
ndin
g pe
r$1
,000
in P
erso
nal I
ncom
e
$9.74
$7.43$6.83
$5.45
$0
$2
$4
$6
$8
$10
$12
$14
$16
$18
$20
$0
$2,000
$4,000
$6,000
$8,000
$10,000
$12,000
$14,000
$16,000
$18,000
$20,000
New
Ham
pshi
reCo
lora
doAr
izona
Oreg
onM
ichi
gan
Verm
ont
Miss
ouri
Wisc
onsin
Penn
sylva
nia
Ohio
Rhod
e Is
land
Sout
h Ca
rolin
aKa
nsas
Mon
tana
Sout
h Da
kota
Virg
inia
Iow
aW
ashi
ngto
nId
aho
Utah
Loui
siana
Wes
t Virg
inia
Mas
sach
uset
tsIn
dian
aDe
law
are
Florid
aN
evad
aUn
ited
Stat
esM
inne
sota
Kent
ucky
Arka
nsas
Okla
hom
aM
ississ
ippi
Texa
sAl
abam
aM
aine
New
Jer
sey
Calif
orni
aM
aryla
ndGe
orgi
aTe
nnes
see
New
Mex
ico
Neb
rask
aN
ew Yo
rkN
orth
Dak
ota
Nor
th C
arol
ina
Illin
ois
Conn
ectic
utHa
wai
iW
yom
ing
Alas
ka
Stat
e Fu
ndin
g pe
r FTE
Stu
dent
State Funding per $1,000 in Personal Income
State
Funding per Public FTE Student Funding per $1,000 in Personal Income
$3,1
84$3
,494 $4
.02
$4,9
75
$7,0
72$7
,089
$5.4
2$7
.44
$7,1
30
$3.9
9$7
,484
$14,
045
$18,
857

29For detailed data behind the graphs and additional information, please visit: trends.collegeboard.org.
Institutional RevenuesBetween 2006-07 and 2011-12, revenues from state and local appropriations per full-time equivalent (FTE) student declined by 29%, from $9,760 (in 2011 dollars) to $6,910 at public doctoral universities and by 26%, from $6,520 to $4,830 at public master’s universities.
– In 2001-02, state and local appropriations ranged from 44% of revenues at public doctoral universities to 62% at public two-year colleges. By 2011-12, this source of revenue for public institutions had declined to 27% at doctoral universities and to 51% at two-year colleges.
– Between 2001-02 and 2011-12, the composition of revenues changed less at private nonprofit than at public institutions. However, net tuition revenues grew from 59% of the total to 62% at private nonprofit doctoral universities, from 90% to 96% at private nonprofit master’s universities, and from 88% to 95% at private nonprofit bachelor’s colleges.
– Between 2006-07 and 2011-12, the most rapid growth in net tuition revenue per FTE student was 30% (in inflation-adjusted dollars) at public master’s universities. The slowest growth was 3% at private nonprofit bachelor’s colleges.
ALSO IMPORTANT:
– Over the 10 years from 2001-02 to 2011-12, revenue from private gifts, investment returns, and endowment income at private doctoral universities was about 72% as large as the sum of the revenue sources described in Figure 18B. The corresponding percentages were 66% for private bachelor’s colleges and 20% for private master’s institutions.
– Revenues from private gifts, investment returns, and endowment income fluctuate markedly from year to year. These sources provided more than the income from other sources combined at private doctoral universities in 2006-07, but generated losses slightly greater than the total revenues from other sources in 2008-09.
– Revenues from auxiliary enterprises such as residence and dining facilities, hospitals, and independent operations, not included in Figures 18A and 18B, are usually dedicated to running those operations.
FIGURE 18A Institutional Revenues per Full-Time Equivalent (FTE) Student
in 2011 Dollars at Public Institutions, 2001-02, 2006-07, and 2011-12
FIGURE 18B Institutional Revenues per Full-Time Equivalent (FTE) Student
in 2011 Dollars at Private Nonprofit Institutions, 2001-02, 2006-07, and 2011-12
NOTES: Net tuition revenue is the amount of revenue an institution takes in from tuition and fees, net of all institutional grant aid provided to students. Some of this revenue comes in the form of financial aid to students from federal and state governments and from other sources. Figures 18A and 18B exclude revenues from private gifts, investment returns, and endowment income, which fluctuate considerably at many institutions from year to year. Institutional averages are weighted by 12-month FTE enrollments.
SOURCES: The Delta Cost Project, 2000-01 to 2009-10; NCES, IPEDS 2011-12 finance data; calculations by the authors.
Revenue Source
Public Private Nonprofit
Doctoral Master’s Bachelor’s Two-Year Doctoral Master’s Bachelor’s
Net Tuition Revenue
2001-02 24% 32% 31% 22% 59% 90% 88%
2006-07 30% 40% 38% 25% 58% 92% 90%
2011-12 39% 53% 49% 36% 62% 96% 95%
State and Local Appropriations
2001-02 44% 55% 54% 62% 2% 3% 3%
2006-07 37% 46% 47% 60% 3% 3% 3%
2011-12 27% 35% 37% 51% 1% 0% 0%
Federal Appropriations and Federal, State, and Local Grants and Contracts
2001-02 32% 13% 15% 16% 39% 7% 9%
2006-07 34% 13% 15% 15% 39% 5% 7%
2011-12 34% 12% 14% 14% 38% 4% 5%
Percentage of Institutional Revenues from Various Sources
State and Local Appropriations
Federal Appropriations and Federal, State, and Local Grants and Contracts
Net Tuition Revenue
Institution Type and Academic Year
$0
$10,000
$20,000
$30,000
$40,000
Reve
nue
in 2
011
Dol
lars
Private Nonpro�t Doctoral
11-1206-0701-02
Private Nonpro�t Master’s
11-1206-0701-02
Private Nonpro�t Bachelor’s
11-1206-0701-02
$18,740
$600
$12,540
$20,530
$1,030
$13,570
$22,180
$260
$13,480
$12,520
$470
$990
$13,700
$390
$800
$14,960
$30
$630
$13,170
$520
$1,290
$14,220
$510
$1,120
$14,680
$30
$720
State and Local Appropriations
Federal Appropriations and Federal, State, and Local Grants and Contracts
Net Tuition Revenue
Institution Type and Academic Year
$0
$10,000
$20,000
$30,000
$40,000
Reve
nue
in 2
011
Dol
lars
Public Doctoral
11-1206-0701-02
$8,150 $8,930 $8,890
Public Master’s
11-1206-0701-02
$1,770 $1,890 $1,700
Public Bachelor’s
11-1206-0701-02
$2,090
Public Two-Year
11-1206-0701-02
$1,500 $1,520 $1,230$10,980 $9,760 $6,910
$7,520 $6,520 $4,830$6,790
$6,610 $4,860$5,910 $6,180 $4,560
$6,040 $7,870 $10,030 $4,410 $5,620 $7,310 $3,990 $5,400 $6,400 $2,080 $2,620 $3,210
$1,890 $1,890

30 For detailed data behind the graphs and additional information, please visit: trends.collegeboard.org.
Institutional Revenues and ExpendituresFrom 2001-02 to 2011-12, educational expenditures per full-time equivalent (FTE) student at public doctoral universities increased by 6% in inflation-adjusted dollars. Average net tuition revenues increased by 66%, while subsidies per FTE student declined by 32%, from $9,680 in 2011 dollars to $6,570.
– At public two-year colleges, average educational expenditures per FTE student declined by 7% over the decade. Net tuition revenues increased by 54%, while subsidies per FTE student declined by 26%, from $6,670 in 2011 dollars to $4,920.
– In 2001-02, net tuition revenues covered 38% of education and related expenditures at public doctoral universities, while the other 62% constituted subsidies to students. At private nonprofit doctoral universities, net tuition revenues covered 56% of expenditures and 44% constituted subsidies to students.
– In 2011-12, net tuition revenues covered a higher percentage of education and related expenditures at public doctoral universities (60%) than at private nonprofit doctoral universities (55%).
ALSO IMPORTANT:
– Doctoral and master’s universities enroll both undergraduate and graduate students while bachelor’s institutions enroll almost exclusively undergraduate students. Because average expenditures on graduate students are generally higher than average expenditures on undergraduate students, per-student revenues and expenditures at different types of institutions are not strictly comparable.
– In addition to the amounts included in “educational and related expenditures,” institutional budgets also include expenditures for other purposes such as research, public service, and auxiliary enterprises.
FIGURE 19A Net Tuition Revenues, Subsidies, and Education and Related
Expenditures per Full-Time Equivalent (FTE) Student in 2011 Dollars at Public
Institutions, 2001-02, 2006-07, and 2011-12
Institution Type and Academic Year
$0
$10,000
$20,000
$30,000
$40,000
Educ
atio
n an
d Re
late
d Ex
pend
iture
s (in
201
1 D
olla
rs)
Public Doctoral
11-1206-0701-02
Public Master’s
11-1206-0701-02
Public Bachelor’s
11-1206-0701-02
Public Two-Year
11-1206-0701-02$2,080$6,040 $7,870 $10,030 $4,410 $5,620 $7,310 $3,990 $5,400 $6,400 $2,620 $3,210
$9,680$8,400 $6,570
$7,330 $6,050 $4,730$6,990 $5,960 $5,520
$6,670 $6,320 $4,920
$15,720 $16,270 $16,600
$11,740 $11,670 $12,040 $10,980 $11,360 $11,920$8,750 $8,940 $8,130
SubsidyNet Tuition Revenue
Institution Type and Academic Year
$0
$10,000
$20,000
$30,000
$40,000
Private Nonpro�t Doctoral
11-1206-0701-02
Private Nonpro�t Master’s
11-1206-0701-02
Private Nonpro�t Bachelor’s
11-1206-0701-02
Educ
atio
n an
d Re
late
d Ex
pend
iture
s (in
201
1 D
olla
rs)
$33,230
$37,690$40,320
$14,680 $15,160 $16,090
$20,460 $20,960 $21,080$14,490
$17,160$18,140
$2,160 $1,460 $1,130
$7,290 $6,740 $6,400
$18,740 $20,530 $22,180 $12,520 $13,700 $14,960 $13,170 $14,220 $14,680
SubsidyNet Tuition Revenue
FIGURE 19B Net Tuition Revenues, Subsidies, and Education and Related
Expenditures per Full-Time Equivalent (FTE) Student in 2011 Dollars at Private
Nonprofit Institutions, 2001-02, 2006-07, and 2011-12
NOTES: Net tuition revenue is the amount of revenue an institution takes in from tuition and fees, net of all institutional grant aid provided to students. Some of this revenue comes in the form of financial aid from federal and state governments and other sources. Education and related expenditures include spending on instruction, student services, and the education share of spending on central academic and administrative support, as well as operations and maintenance. Expenditures for both undergraduate and graduate students are included in these estimates. Institutional averages are weighted by 12-month FTE enrollments.
SOURCES: The Delta Cost Project, 2000-01 to 2009-10; NCES, IPEDS 2011-12 finance data; calculations by the authors.
Public
Doctoral Master’s Bachelor’s Two-Year
2001-02 38% 38% 36% 24%
2006-07 48% 48% 48% 29%
2011-12 60% 61% 54% 39%
Private Nonprofit
Doctoral Master’s Bachelor’s
2001-02 56% 85% 64%
2006-07 54% 90% 68%
2011-12 55% 93% 70%
Percentage of Education and Related Expenditures
Covered by Net Tuition Revenues

31For detailed data behind the graphs and additional information, please visit: trends.collegeboard.org.
EndowmentsIn 2011-12, the 10% of students enrolled in the private doctoral universities with the highest endowments per student benefited from endowments averaging $1.06 million per full-time equivalent (FTE) student. The median endowment per FTE student in this sector was $65,700.
– There is a wide range of institutional wealth even within the top decile of private doctoral universities. In 2011-12, endowment per FTE student at these 11 universities ranged from $490,000 to $2.17 million. Assuming a 4% annual spending rate, this yields annual budget supplements ranging from $20,000 to $87,000 per FTE student.
– In 2011-12, the 10% of students enrolled in the private nonprofit bachelor’s colleges with the highest endowments per student benefited from endowments averaging $453,000 per FTE student. The median endowment per student in this sector was $33,800.
– Three out of 12 public doctoral universities in the top decile had endowments exceeding $100,000 per FTE student in 2011-12. The median for this sector was $15,500.
ALSO IMPORTANT:
– Ten private doctoral universities hold 45% of the total endowment assets of all private nonprofit four-year institutions combined; 10 public doctoral universities hold 36% of the total endowment assets of all public four-year institutions combined.
– By law, the principal of some endowment funds must be preserved in perpetuity and restricted endowment funds can only be used to support purposes specified by the donor. Institutions have more flexibility over the use of unrestricted endowment funds.
– Average expenditures on graduate students are higher than average expenditures on undergraduate students, so endowment differences between doctoral universities and bachelor’s institutions overstate the differences in the subsidies available to undergraduate students from endowment income.
FIGURE 20 Endowment Assets per Full-Time Equivalent (FTE) Student at
Four-Year Colleges and Universities by Decile, 2011-12
NOTES: The value of endowment assets is as of the end of FY12. Based on data for 105 private doctoral, 342 private master’s, 463 private bachelor’s, 170 public doctoral, 258 public master’s, and 94 public bachelor’s institutions. The average endowment per student for each decile is calculated by ordering the institutions in the sector by assets per student and dividing the students in the sector into deciles. Total assets in institutions enrolling 10% of students in the sector are divided by the number of students in those institutions.
SOURCES: National Association of College and University Business Officers (NACUBO) Endowment Study; NCES, IPEDS finance data; calculations by the authors.
$0
$100,000
$200,000
$300,000
$400,000
$500,000
$600,000
$700,000
$800,000
$900,000
$1,000,000
$1,100,000
Highest Decile 2nd 3rd 4th 5th 6th 7th 8th 9th Lowest Decile
Carnegie Classi�cation
Bachelor’s(Median = $33,800)(Mean = $86,000)
Master’s(Median = $11,900)(Mean = $17,800)
Doctoral(Median = $65,700)(Mean = $201,300)
Endo
wm
ent A
sset
s pe
r FTE
Stu
dent
Private Nonpro�t Four-Year
Carnegie Classi�cation
Bachelor’s(Median = $1,300)
(Mean = $3,700)
Master’s(Median = $2,900)(Mean = $3,700)
Doctoral(Median = $15,500)(Mean = $24,700)
Endo
wm
ent A
sset
s pe
r FTE
Stu
dent
Public Four-Year
$0
$10,000
$20,000
$30,000
$40,000
$50,000
$60,000
$70,000
$80,000
$90,000
$100,000

32 For detailed data behind the graphs and additional information, please visit: trends.collegeboard.org.
Endowments At the end of 2011-12, the average endowment per full-time equivalent (FTE) student at private nonprofit colleges and universities was about 15% higher (after adjusting for inflation) than it had been at the 2008-09 low point, but still far below the peak in 2006-07.
– The average endowment per FTE student at private nonprofit four-year institutions peaked at about $136,000 (in 2011 dollars) in 2006-07 and fell to $93,000 in 2008-09. In 2011-12, the average endowment per FTE student was about $107,000.
– In 2009-10, institutions with endowments exceeding $500 million increased their spending rates sharply, while those with small endowments lowered their spending rates.
– By 2012-13, spending rates were converging again and ranged from 4.1% for institutions with endowments under $25 million to 4.8% for those with assets of $1 billion or more.
ALSO IMPORTANT:
– According to NACUBO, the overall average endowment spending rate for public institutions was 4.1% in 2011-12, compared to 4.6% for private nonprofit colleges and universities.
FIGURE 21A Private Nonprofit Four-Year College and University Endowment
Assets per Full-Time Equivalent (FTE) Student Relative to 2002-03
FIGURE 21B Average Reported Spending Rates for College and University Endowments by Endowment Size, 2000-01 to 2012-13
NOTES: The value of endowment assets is as of the end of June (i.e., June 2012 for 2011-12). Based on data from 1,018 private nonprofit institutions reporting each year from 2002-03 through 2011-12.
SOURCES: National Association of College and University Business Officers (NACUBO) Endowment Study; NCES, IPEDS finance data; calculations by the authors. Data are from NACUBO where available.
SOURCES: 2013 NACUBO-Commonfund Study of Endowments; 2008 NACUBO Endowment Study.
Endowment Size 2000-01 2001-02 2002-03 2003-04 2004-05 2005-06 2006-07 2007-08 2008-09 2009-10 2010-11 2011-12 2012-13
Under $25 Million 4.9% 4.7% 4.8% 4.6% 4.8% 4.6% 4.6% 4.1% 3.9% 3.5% 3.7% 3.7% 4.1%
$25 Million to $50 Million 4.9% 4.9% 5.0% 4.8% 4.7% 4.8% 4.8% 4.3% 4.3% 4.1% 4.0% 3.8% 4.3%
$51 Million to $100 Million 5.3% 5.3% 5.2% 4.9% 4.7% 4.7% 4.8% 4.6% 4.7% 4.6% 4.5% 4.3% 4.4%
$101 Million to $500 Million 4.9% 5.1% 5.2% 4.9% 4.7% 4.6% 4.5% 4.2% 4.4% 4.9% 5.0% 4.3% 4.4%
$501 Million to $1 Billion 4.5% 5.1% 5.3% 5.2% 4.8% 4.5% 4.4% 4.5% 4.9% 5.7% 5.2% 4.7% 4.6%
Over $1 Billion 4.2% 4.9% 5.3% 5.2% 4.7% 4.6% 4.4% 4.2% 4.6% 5.6% 5.2% 4.7% 4.8%
Average Reported Spending Rates for College and University Endowments, 2000-01 to 2012-13
1.001.13
1.211.32
1.45 1.39
.991.06
1.20 1.14
0.00
0.20
0.40
0.60
0.80
1.00
1.20
1.40
1.60
2011-122010-112009-102008-092007-082006-072005-062004-052003-042002-03
Academic Year
Ratio
Aver
age
Spen
ding
Rat
e
Academic Year
2012-132011-122010-112009-102008-092007-082006-072005-062004-052003-042002-032001-022000-01
0.0%
4.0%
5.0%
6.0%
Under $25 Million
$25 Million to $50 Million
$51 Million to $100 Million
$101 Million to $500 Million
$501 Million to $1 Billion
Over $1 Billion

33For detailed data behind the graphs and additional information, please visit: trends.collegeboard.org.
Family IncomeWith a deep recession followed by a recovery characterized by very slow increases in income, average income was lower in inflation-adjusted dollars in 2013 than it had been in 2003 for all but the highest-income families.
– The $16,109 average income for the 20% of families with the lowest incomes in 2013 represented an 8% decline in real terms over a decade. The average income of the middle 20% of families was $63,916 in 2013, a 5% decline over 10 years. A 1% increase over the decade for the top 5% of families yielded an average income of $358,722 in 2013.
– The $70,821 increase (in 2013 dollars) in the average income of the top 20% of families between 1983 and 2013 compares to an increase of $8,936 for the middle quintile and an increase of $578 for the lowest quintile of families over 30 years.
– In 2013, when median family income for all families was $63,815, the median income for families headed by individuals ages 45 to 54 — the age bracket of most parents of traditional-age college students — was $79,246 (24% higher than the overall median).
– In 2013, the median income for black and Hispanic families was less than 60% of the median income for white families.
– In 2013, the $103,256 median family income for families headed by a four-year college graduate was more than twice the median income for families headed by a high school graduate.
ALSO IMPORTANT:
– The share of all income going to the 20% of families with the lowest incomes has steadily declined, from 4.9% in 1983 to 4.1% in 1993 and 2003, to 3.8% in 2013. The share of income going to the top 5% of families rose from 15.3% in 1983 to 20.3% in 1993, to 20.5% in 2003, and to 21.2% in 2013.
– Average published tuition and fees for in-state students attending public four-year colleges rose by $6,324 (in 2014 dollars) over this 30-year period — 71% of the increase in income ($8,936) of the middle 20% of families and 9% of the increase in income ($70,821) of the 20% of families in the highest-income bracket.
FIGURE 22A Percentage Change in Inflation-Adjusted Mean Family Income
by Quintile, 1983–1993, 1993–2003, and 2003–2013
FIGURE 22B Median Family Income by Selected Characteristics, 2013
SOURCES: U.S. Census Bureau, Current Population Survey, 2014 Annual Social and Economic Supplement, Table F-1, Table F-3, Table F-5, and FINC-01; calculations by the authors.
Lowest 20% Second 20% Third 20% Fourth 20% Highest 20% Top 5%
$ Change 1983–2013 $578 $3,779 $8,936 $18,849 $70,821 $162,829
% Change 1983–2013 4% 11% 16% 24% 52% 83%
2013 Income Bracket$28,894 or less
$28,895 to $50,520
$50,521 to $78,000
$78,001 to $121,059
$121,060 or higher
$217,032 or higher
2013 Mean Income $16,109 $39,514 $63,916 $97,207 $206,687 $358,722
Years
0%
14%
-8%
4%
12%
-5%
7%
14%
-5%
11%16%
-4%
30%
17%
0%
55%
7%1%Pe
rcen
tage
Cha
nge
Top 5%Highest 20%Fourth 20%Third 20%Second 20%Lowest 20%
-10%
0%
10%
20%
30%
40%
50%
2003–20131993–20031983–1993
$0 $20,000 $40,000 $60,000 $80,000 $100,000 $120,000
Bachelor's or HigherAssociate
Some CollegeHigh School
Less Than High School
65 and over55–6445–5435–4425–3415–24
Black Alone, Non-HispanicHispanic
White Alone, Non-HispanicAsian Alone, Non-Hispanic
WestSouth
MidwestNortheast
Education
Age
Race/Ethnicity
Region
Char
acte
rist
ic
Median Family Income
$71,365
$65,974
$58,401
$66,016
$76,402
$72,624$42,269
$41,588
$34,291$52,804
$70,239$79,246
$74,915
$51,486
$32,214
$51,154$59,517
$67,103
$103,256

34 For detailed data behind the graphs and additional information, please visit: trends.collegeboard.org.
FIGURE 23 Postsecondary Fall Enrollment by Attendance Status and Level of
Enrollment (with Percentage of All Students Enrolled in Each Sector), 1995 to 2012,
Selected Years
Enrollment Patterns over TimeAfter increasing by 21% between 2005 and 2010, total postsecondary fall enrollment declined by 2% between 2010 and 2012.
– Between 2010 and 2012, total enrollment in both public and private nonprofit four-year institutions increased by 2%. Enrollment declined by 6% in public two-year colleges and by 10% in for-profit institutions.
– There were 1.65 million more full-time undergraduate students and 1.12 million more part-time undergraduate students in 2012 than in 2005.
– After increasing from 2% in 1995 to 11% in 2010, the percentage of all students enrolled in the for-profit sector declined to 10% in 2012.
– The percentage of all undergraduate students who were enrolled full time increased from 58% in 1995 to 60% in 2000 and to 63% in 2005, 2010, and 2012.
– In 2012, 42% of all graduate students were enrolled in private nonprofit four-year colleges and universities. In contrast, 20% of full-time and 7% of part-time undergraduate students were enrolled in this sector.
ALSO IMPORTANT:
– Students enrolled in non-degree-granting institutions may be eligible for federal student aid if they are working toward certificates at accredited institutions.
– All of the students reported in Figure 23 were enrolled in institutions that participate in federal student aid programs. In the late 2000s, about 600,000–800,000 students were enrolled in for-profit institutions that do not participate in these programs. (S. Cellini & C. Goldin, “Does Federal Student Aid Raise Tuition? New Evidence on For-Profit Colleges,” NBER Working Paper 17827)
NOTES: Percentages on the y-axis represent the enrollment in each sector as a percentage of total enrollment. Non-degree-granting institutions do not award associate, baccalaureate, or graduate degrees. Percentages may not sum to 100 because of rounding.
SOURCE: NCES, IPEDS enrollment data.
50%
52%
53%
55%
57%
58%
57%
57%
65%
64%
61%
41%
61%
61%
63%
64%
64%
19%
19%
19%
16%
13%
12%
12%
12%
35%
35%
38%
59%
38%
19%
17%
17%
18%
63%
12%17%
17%
29%
29%
30%
31%
31%
1%
1%
1%
20%
20%
19%
18%
17%
14%
1%
Publ
ic T
wo-
Year
Publ
ic F
our-
Year
Priv
ate
Non
pro�
t Fou
r-Ye
arFo
r-Pr
o�t
1995 (37%)
2000 (37%)
2005 (35%)
2010 (34%)
2012 (33%)
1995 (41%)
2000 (39%)
2005 (38%)
2010 (37%)
2012 (38%)
1995 (20%)
2000 (20%)
2005 (19%)
2010 (18%)
2012 (19%)
1995 (2%)
2000 (4%)
2005 (7%)
2010 (11%)
2012 (10%)
Enrollment (Millions)
Sect
or
0 1 2 3 4 5 6 7 8 9
Non-Degree-Granting Institutions
AllGraduate
Part-Time Undergraduate
Full-Time Undergraduate
240,000
673,000
1,323,000
2,426,000
2,175,000
2,854,000
3,052,000
3,412,000
3,823,000
3,916,000
5,815,000
6,056,000
6,838,000
7,925,000
8,093,000
5,277,000
5,758,000
6,235,000
7,285,000
6,845,000

35For detailed data behind the graphs and additional information, please visit: trends.collegeboard.org.
Enrollment and Degrees Granted
NOTES: Graduate degrees include master’s, first professional, and doctoral degrees. Percentages may not sum to 100 because of rounding.
SOURCES: NCES, Digest of Education Statistics 2013, Table 318.40; Postsecondary Institutions and Cost of Attendance in 2013-14; Degrees and Other Awards Conferred, 2012-13; and12-Month Enrollment, 2012-13: First Look (Provisional Data) (NCES 2014-066rev).
– Just under half of the degrees awarded in 2012-13 were bachelor’s degrees, 25% were graduate degrees, and 27% were associate degrees.
– Because 61% of public two-year college students were enrolled part time in fall 2012, students in this sector represented 38% of all undergraduate students, but only 24% of full-time undergraduate students.
– In fall 2012, 46% of full-time undergraduates — and 38% of all undergraduates — were enrolled in public four-year institutions.
ALSO IMPORTANT:
– In addition to the 18.1 million undergraduate students enrolled in degree-granting institutions in fall 2012, there were 572,000 undergraduates enrolled in non-degree-granting institutions. Fifty-six percent of these students attended for-profit institutions. Many non-degree-seeking students are working toward vocational certificates. (NCES, IPEDS data)
In 2002-03, the for-profit sector awarded 14% of all associate, 2% of all bachelor’s, and 3% of all graduate degrees. A decade later, this sector awarded 18% of all associate, 8% of bachelor’s, and 9% of graduate degrees.
NOTES: Includes only students enrolled in degree-granting institutions. Percentages may not sum to 100 because of rounding.
SOURCES: NCES, Digest of Education Statistics 2013, Table 303.60.
FIGURE 25 Undergraduate Enrollment by Sector, Fall 2012
All Degree-Granting
Public Private Nonprofit
For-Profit
Four- Year
Two- Year
Four- Year
Four- Year
Two-Year
PercentageEnrolled Part Time
37% 23% 61% 18% 30% 11%
Percentage of Undergraduate Students Enrolled Part
Time in Fall 2012, by Sector
FIGURE 24 Degrees Granted by Type of Degree and Sector, 2002-03, 2007-08,
and 2012-13
For-Pro�tPrivate Nonpro�tPublic
Asso
ciat
eBa
chel
or’s
Grad
uate
2,000,0000 400,000 800,000 1,200,000 1,600,000
02-03
07-08
12-13
02-03
07-08
12-13
02-03
07-08
12-13
Degrees Granted
Type
of D
egre
e
77%6%
18%
77%6%
17%
79%7%
14%
63% 29% 8%
64% 31% 5%
65% 33%2%
47% 44% 9%
48% 44%7%
51% 46%3%
1,007,000
750,000
634,000
1,840,000
1,563,000
1,349,000
927,000
780,000
640,000
For-Pro�t Four-Year
Private Nonpro�t Four-Year
Public Four-Year
For-Pro�t Two-Year
Public Two-Year
AllUndergraduates
Full-TimeUndergraduate
Students46%
38%
20%
15% 7%
7% 24%
38%
3%
2%
0% 20% 40% 60% 80% 100%

36 For detailed data behind the graphs and additional information, please visit: trends.collegeboard.org.
Public Enrollment by StateIn fall 2012, 21% of the full-time equivalent (FTE) enrollment in degree-granting public institutions in the United States was in either California or Texas.
– California and Texas accounted for 29% of the nation’s full-time equivalent (FTE) enrollment in public two-year colleges and 17% of the total in public four-year institutions.
– Some state public higher education systems rely almost exclusively on four-year institutions, while in other states, many students enroll in community colleges. In fall 2012, 56% of
California’s public enrollments, but only 2% of Alaska’s, were in public two-year colleges.
– In three states, 50% or more of public FTE enrollments were in public two-year colleges in 2012. In nine states, that percentage was below 20%.
FIGURE 26A Full-Time Equivalent (FTE) Enrollment in Public Degree-Granting Institutions, by State, Fall 2012
NOTES: Based on FTE fall enrollments. All of the students who are not included in the percentages reported in Figure 26B are enrolled in public four-year colleges and universities.
SOURCE: NCES, Digest of Education Statistics 2013, Table 307.20.
FIGURE 26B Percentage of All Public Full-Time Equivalent (FTE) Enrollment in Two-Year Colleges, by State, Fall 2012
33,4
00
78,0
00 161,
800
194,
400
221,
800 39
4,10
0
1,40
2,40
0
20,3
00
914,
800
39,7
00 130,
800 30
0,10
0
Public Two-YearPublic Four-Year
Fall
FTE
Enro
llmen
t
0
200,000
400,000
600,000
800,000
1,000,000
1,200,000
1,400,000
State
Calif
orni
aTe
xas
Flor
ida
Ohio
New
Yor
k
Mic
higa
nIll
inoi
sN
orth
Car
olin
aPe
nnsy
lvan
iaGe
orgi
aVi
rgin
iaN
ew J
erse
yIn
dian
aW
ashi
ngto
nAr
izona
Wis
cons
inM
aryl
and
Min
neso
taAl
abam
aCo
lora
doM
isso
uri
Tenn
esse
eLo
uisi
ana
Kent
ucky
Mas
sach
uset
tsSo
uth
Caro
lina
Oreg
onOk
laho
ma
Kans
asM
issi
ssip
piIo
wa
Utah
Arka
nsas
New
Mex
ico
Conn
ectic
utN
ebra
ska
Wes
t Virg
inia
Nev
ada
Idah
oHa
wai
iN
orth
Dak
ota
Mon
tana
Mai
neSo
uth
Dako
taN
ew H
amps
hire
Dela
war
eRh
ode
Isla
ndW
yom
ing
Verm
ont
Alas
ka
0%
10%
20%
30%
40%
60%
50%
Perc
enta
ge
State
2%8%
56%
Calif
orni
aW
yom
ing
Illin
ois
Arizo
naM
issi
ssip
piN
ew M
exic
oOr
egon
New
Jer
sey
Nor
th C
arol
ina
Min
neso
taTe
xas
New
Yor
kHa
wai
iSo
uth
Caro
lina
Was
hing
ton
Mar
ylan
dM
assa
chus
etts
Kans
asU
nite
d St
ates
Virg
inia
Mis
sour
iCo
nnec
ticut
Neb
rask
aKe
ntuc
kyM
ichi
gan
Arka
nsas
Tenn
esse
eRh
ode
Isla
ndM
aine
Alab
ama
Loui
sian
aOk
laho
ma
Wis
cons
in
Idah
oCo
lora
doGe
orgi
aDe
law
are
Penn
sylv
ania
New
Ham
pshi
reIn
dian
aW
est V
irgin
iaM
onta
naSo
uth
Dako
taVe
rmon
t
Nor
th D
akot
aN
evad
aFl
orid
aAl
aska
Iow
a
Ohio
Utah
16%
25% 28
% 31% 35
% 37% 40
% 44% 48
%
56%

37For detailed data behind the graphs and additional information, please visit: trends.collegeboard.org.
Changes in Public Enrollment by State
NOTE: Based on FTE fall enrollment in degree-granting public two-year and four-year institutions.
SOURCES: NCES, Digest of Education Statistics 2013, Table 307.20; Digest of Education Statistics 2004, Table 201.
Growth in public higher education enrollment between 2002 and 2012 ranged from 3% in Illinois to 37% in Florida.
FIGURE 27 Percentage Increase in Full-Time Equivalent (FTE) Enrollment in Public Institutions, by State, Fall 2002 to Fall 2012
– Full-time equivalent (FTE) enrollment in public institutions in the United States increased by 1.7 million between fall 2002 and fall 2012. Texas accounted for 12% of these new enrollments, Florida for 9%, and New York for 6%. Despite its relatively small rate of growth, California accounted for 5% of the new enrollments, as did Georgia, where the number of public college students grew rapidly.
– California enrolled 13% of the nation’s public postsecondary FTE students in 2012, down from 15% a decade earlier.
ALSO IMPORTANT:
– In the nation as a whole, between 2002 and 2012, growth in public four-year enrollments (25%) was more rapid than growth in public two-year enrollments (10%). Public two-year colleges in some states began offering a small number of bachelor’s degrees and some were reclassified as four-year institutions, contributing to this imbalance in growth rates.
– The most rapid growth in four-year public enrollments over the decade was in Florida and Nevada, where a number of two-year colleges were reclassified as four-year.
– The most rapid growth in two-year public enrollments over the decade was in West Virginia and Idaho.
Perc
enta
ge In
crea
se
State
37%
36%
27%
21%
19%
17%
14%
13%
3% 6%
30%
25%
12%
Flor
ida
Geor
gia
Arka
nsas
N
ew M
exic
o Te
xas
Idah
o Or
egon
N
orth
Car
olin
a So
uth
Caro
lina
New
Jer
sey
Verm
ont
Arizo
na
Nev
ada
Indi
ana
Virg
inia
M
aryl
and
Mis
sour
i M
assa
chus
etts
Ut
ah
Haw
aii
Conn
ectic
ut
New
Yor
k M
issi
ssip
pi
Tenn
esse
e U
nite
d St
ates
Colo
rado
W
est V
irgin
ia
Ohio
Ke
ntuc
ky
Wyo
min
g Rh
ode
Isla
nd
Alab
ama
Penn
sylv
ania
N
ew H
amps
hire
M
onta
na
Sout
h Da
kota
Io
wa
Was
hing
ton
Neb
rask
a N
orth
Dak
ota
Dela
war
e M
aine
Ok
laho
ma
Mic
higa
n Al
aska
Ka
nsas
M
inne
sota
W
isco
nsin
Ca
lifor
nia
Loui
sian
a Ill
inoi
s
0%
10%
20%
30%
40%
50%
60%

38 For detailed data behind the graphs and additional information, please visit: trends.collegeboard.org.
MigrationThe percentage of students beginning college in fall 2012 who enrolled at institutions in their home state ranged from 53% in Vermont and 56% in New Hampshire to 90% in California and Arizona, and 91% in Utah.
– The percentage of first-year students enrolled in degree-granting institutions in the state who were residents of the state ranged from 34% in Vermont and 44% in Rhode Island to 90% in California, 91% in New Jersey, and 92% in Texas.
– In California, a high percentage of students stay in state for college (90%) and most students enrolled in the state are residents (90%). In West Virginia, a similar percentage stay in state (87%), but there is a high level of in-migration, so a relatively low percentage of enrolled students are state residents (49%).
– In Rhode Island, a relatively low percentage of students stay in state for college (69%) and only 44% of the students enrolled in the state are residents. In New Jersey, a similar percentage of students stay in state for college (63%), but there is little in-migration, and 91% of the enrolled students are state residents.
– Arizona ranks high in terms of percentage of residents staying in state for college but enrolls an unusually large percentage of out-of-state students because of the University of Phoenix’s large number of online students. In fall 2012, the University of Phoenix–Online Campus enrolled a total of 14,275 first-time undergraduate students, 17% of the total first-time undergraduate students enrolled in the state. (NCES, IPEDS fall 2012 enrollment data; calculations by the authors)
ALSO IMPORTANT:
– The percentage of beginning college students who were residents of the states in which they were enrolled was 80% in both 2002 and 2012. The percentage of students who stayed in their own states to begin college increased from 81% in 2002 to 82% in 2012. (NCES, Digest of Education Statistics 2013, Table 309.10; Digest of Education Statistics 2004, Table 204)
NOTE: Based on headcount enrollment.
SOURCE: NCES, Digest of Education Statistics 2013, Table 309.10.
FIGURE 28 Percentage of First-Time Students Staying in State and Percentage of First-Time Students Who Were State Residents, 2012
Utah
Ar
izona
Ca
lifor
nia
Texa
s M
ichi
gan
Flor
ida
Loui
sian
a Ok
laho
ma
Iow
a So
uth
Caro
lina
Arka
nsas
W
est V
irgin
ia
Indi
ana
Nor
th C
arol
ina
Kent
ucky
Ka
nsas
Al
abam
a N
ew M
exic
o M
issi
ssip
pi
Ohio
M
isso
uri
Tenn
esse
e Or
egon
Pe
nnsy
lvan
ia
Wis
cons
in
New
Yor
k U
nite
d St
ates
Vi
rgin
ia
Neb
rask
a Ge
orgi
a Co
lora
do
Mon
tana
N
evad
a W
yom
ing
Sout
h Da
kota
W
ashi
ngto
n Id
aho
Min
neso
ta
Nor
th D
akot
a Ill
inoi
s M
aine
M
assa
chus
etts
De
law
are
Haw
aii
Rhod
e Is
land
M
aryl
and
Alas
ka
New
Jer
sey
Conn
ectic
ut
New
Ham
pshi
re
Verm
ont
Percentage of Students Who Were State Residents
Percentage of Students Staying In State
0%
20%
40%
60%
80%
100%
Perc
enta
ge o
f Fir
st-T
ime
Stud
ents
State
34%
44%
91%
92%
80%
49%
53%
56%
63%
69%
82%
87%
90%
90%
91%
90%

39For detailed data behind the graphs and additional information, please visit: trends.collegeboard.org.
Selectivity and Completion
FIGURE 29A Percentage Distribution of Four-Year Degree-Granting
Institutions and Distribution of Fall Full-Time Equivalent (FTE) Undergraduate
Enrollment, by Acceptance Rate, 2012-13
In 2012-13, only 2% of the 2,580 four-year degree-granting colleges and universities in the United States accepted less than 25% of their applicants, while 35% of these institutions accepted 90% or more of their applicants.
– Institutions accepting 75% or more of their applicants enrolled 41% of four-year college students in 2012-13. Those with acceptance rates below 50% enrolled 18% of the students.
– Institutional selectivity is highly correlated with graduation rates. Only 33% of students who began full time at open-admission four-year institutions in 2006 and 48% of those who began at institutions accepting at least 90% of their applicants earned four-year degrees at their first institution within six years.
– At the four-year institutions that accept less than 25% of applicants, where students generally have strong academic preparation, 86% of students who began their studies full time in 2006 had completed four-year degrees at their first institution by fall 2012.
ALSO IMPORTANT:
– At open-admission four-year institutions, 20% of the students were enrolled part time, compared to 3% at those with acceptance rates below 25% and 9% overall.
– The completion rates reported here are from IPEDS data, which measure degree completion only of first-time, full-time students at the institution in which they first enrolled. Part-time and returning students are excluded. Students who transfer to other institutions are not counted as graduates.
– In fall 2012, there were 1,700 two-year degree-granting institutions in the U.S., including 934 in the public two-year sector, 97 in the private nonprofit sector, and 669 in the for-profit sector. Among students who began their studies full time at these institutions in fall 2009, 20%, 62%, and 63% had earned associate degrees or short-term certificates by 2012 at their original institution in the three sectors, respectively. (NCES, Digest of Education Statistics 2013, Tables 317.40 and 326.20)
Six-
Year
Com
plet
ion
Rate
0%
20%
40%
60%
80%
100%
48%
59%
33%
72%
56%60%
86%
Acceptance Rate
Less than 25%
Accepted
25% to 49.9% Accepted
50% to 74.9% Accepted
75% to 89.9%Accepted
90%or More
Accepted
Open Admission
(No Application Criteria)
Total
NOTE: Excludes institutions not enrolling first-time degree/certificate-seeking undergraduates.
SOURCES: NCES, IPEDS fall 2012 data; calculations by the authors.
SOURCE: NCES, Digest of Education Statistics 2013, Table 326.10.
FIGURE 29B Overall Six-Year Bachelor’s Degree Completion Rate of 2006
Cohort at Four-Year Institutions by Acceptance Rate of Institution
0% 10% 20% 30% 40% 50% 60% 70% 80% 90% 100%
Institutions
FTE Undergraduate Enrollment
50% to 74.9% Accepted
75% to 89.9% Accepted
90% or More Accepted
Open Admission(No Application Criteria)
Less than 25% Accepted
25% to 49.9% Accepted
27%
16%
8%
6%
18%
19%
33%
41%
12%
15%
2%
3%
Percentage

40 For detailed data behind the graphs and additional information, please visit: trends.collegeboard.org.
Faculty and StaffThe percentage of staff who were faculty members increased between 1991-92 and 2001-02, and again between 2001-02 and 2011-12, at both public and private nonprofit colleges and universities.
– The growing “Other Professionals” category includes student, academic, and institutional support functions that require a bachelor’s degree or comparable experience. Examples include human resources specialists, accountants and auditors, computer specialists, counselors, librarians, and coaches.
– The number of executive/managerial/administrative employees per 100 full-time
equivalent (FTE) students increased from 2.4 to 3.1 at private nonprofit institutions between 2001 and 2011. The number of nonprofessional staff per 100 FTE students declined from 9.5 to 7.5 over these years.
– At public institutions, the number of faculty per 100 FTE students declined from 6.2 to 5.9 between 2001 and 2011. The total number of staff per 100 FTE students at these institutions declined from 19.2 to 17.3 over this decade.
– The percentage of faculty with tenure at public four-year institutions with tenure systems declined from 70% to 65% between 1993-94 and 2011-12. At private nonprofit institutions, the decline was from 50% to 44%.
ALSO IMPORTANT:
– The percentage of institutions that have tenure systems declined from 92% to 91% in the public four-year sector, from 62% to 58% in the public two-year sector, and from 66% to 60% at private nonprofit four-year institutions between 1993-94 and 2011-12. (NCES, Digest of Education Statistics 2013, Table 316.80)
– About 2% of for-profit institutions had tenure systems in 2011-12. (NCES, Digest of Education Statistics 2013, Table 316.80)
FIGURE 30A Composition of Staff in Degree-Granting Postsecondary
Institutions, 1991-92, 2001-02, and 2011-12
Public Private Nonprofit For-Profit
1991 2001 2011 1991 2001 2011 1991 2001 2011
Faculty 5.7 6.2 5.9 7.9 8.4 9.2 3.0 4.2 4.0
Graduate Assistants 0.9 1.0 1.1 0.5 0.7 0.9 0.0 0.2 0.0
Executive/Administrative/Managerial 1.1 0.9 1.0 2.5 2.4 3.1 1.1 1.1 1.4
Other Professionals 3.4 4.3 4.3 5.1 6.5 6.6 1.3 2.5 3.3
Nonprofessional Staff 7.4 6.7 5.0 11.5 9.5 7.5 1.9 1.9 1.3
TOTAL 18.4 19.2 17.3 27.5 27.5 27.4 7.3 10.0 10.0
Number of Full-Time Equivalent (FTE) Staff per 100 FTE Students, 1991, 2001, and 2011
NOTES: Numbers are as of fall of each academic year. Public sector numbers combine two-year and four-year institutions. Percentages may not sum to 100 and components may not sum to totals because of rounding.
SOURCE: NCES, Digest of Education Statistics 2012, Table 285.
FIGURE 30B Percentage of Full-Time Faculty with Tenure at Institutions with a
Tenure System, 1993-94, 1999-2000, 2009-10, and 2011-12
SOURCE: NCES, Digest of Education Statistics 2013, Table 316.80.
Perc
enta
ge o
f Ful
l-Ti
me
Facu
lty w
ith T
enur
e
Sector
Private Nonpro�t Four-Year
Public Four-Year
Public Two-Year
All0%
10%
20%
30%
40%
50%
60%
70%
1999-2000 2009-10 2011-121993-94
56% 54%49% 49%
56% 53%48% 48%
70% 68%64% 65%
50% 48%44% 44%
Cont
rol o
f Ins
titut
ion
Percentage of Staff
For-P
ro�t
Priv
ate
Non
pro�
tPu
blic
91-92
01-02
11-12
91-92
01-02
11-12
91-92
01-02
11-12
0% 10% 20% 30% 40% 50% 60% 70% 80% 90% 100%
Executive/ Administrative/ Managerial
Graduate Assistants
Other Professionals
Nonprofessional Staff
Faculty
34% 6% 6% 25% 29%
32% 5% 5% 22% 35%
31% 5% 6% 19% 40%
34% 3% 11% 24% 28%
31%2%
9% 24% 35%
29%2%
9% 19% 42%
40% 14% 33% 13%
42%2%
12% 25% 19%
41%0%
0%
15% 17% 26%

41
Notes and Sources
THE ANNUAL SURVEY OF COLLEGES
Prices described in this report are based on data reported to the College Board by colleges and universities in the Annual Survey of Colleges. Data for 2014-15 are from an online questionnaire distributed in October 2013, with data collected and reviewed through early September 2014. Tuition and fee figures are based on charges to full-time undergraduate students over the course of a nine-month academic year of 30 semester hours or 45 quarter hours. For those institutions with tuition and fees that vary by year of study, weighted average undergraduate tuition levels are used in the analysis. We are not able to estimate differences in tuition and fees by program but rely on the prices reported by institutions.
ENROLLMENT-WEIGHTED AND UNWEIGHTED DATA
This report provides enrollment-weighted average prices. Charges reported by colleges with larger full-time enrollments are weighted more heavily than those of institutions with smaller enrollments.
Enrollment-weighted and unweighted averages describe different phenomena. The weighted averages may be more helpful to students and families in anticipating future education expenses. Some researchers, policy analysts, and academic administrators find unweighted averages useful in studying longitudinal trends and evaluating a particular institution’s practices against a larger set. Thus, the College Board computes both weighted and unweighted averages. Tables reporting unweighted tuition data can be found online at trends.collegeboard.org.
The most recent enrollment data available are for fall 2013. For 2013-14 and earlier years, prices are weighted by same-year enrollments. For 2014-15, prices are weighted by fall 2013 full-time enrollments. In other words, the percentage changes reported in Tables 1A and 1B reflect only price changes, not changes in enrollment patterns. In contrast, the historical data on changes in enrollment-weighted prices reported in Tables 2A and 2B reflect changes in both prices and the distribution of full-time students across institutions.
Weighted averages for each price are based on relevant populations:
– In-state tuition and fees are weighted by full-time undergraduate enrollment.
–Out-of-state tuition and fees are calculated by adding the nonresident premium, weighted by full-time out-of-state enrollment, to average in-state tuition and fees. Data are not available on out-of-state students receiving a waiver of the full tuition premium or a portion of it.
–Out-of-district charges for public two-year college students are not accounted for in the average prices reported here.
–Resident room and board charges are weighted by the number of undergraduates living in campus housing at each institution.
–Estimated other student budget components are weighted as follows:
–Books and supplies are weighted by full-time undergraduate enrollment.
–Resident transportation and other resident expenses are weighted by the number of undergraduates living in campus housing.
–Commuter room and board, commuter transportation, and other commuter expenses are weighted by the number of commuting undergraduates at each institution.
INSTITUTIONS INCLUDED IN CALCULATIONS
Out of the 3,678 public two-year, public four-year, private nonprofit four-year, and for-profit institutions that were surveyed in both 2012 and 2013, 3,105 were included in this year’s analysis, including over 98% of the surveyed schools in the public and private nonprofit sectors and 39% of those in the for-profit sector. Our imputation process allows us to include schools for which we are missing one year of data. We exclude from our calculations military academies and other institutions that report zero tuition. Tables A1A and A1B describe the number of institutions that were included in this analysis, by sector and Carnegie Classification, respectively.
REVISIONS OF BASE-YEAR VALUES
The prices for 2013-14 used in this analysis differ somewhat from the 2013-14 averages reported last year. One factor contributing to the revision is the reweighting of the prices, shifting from fall 2012 to fall 2013 full-time enrollment figures. The base-year numbers also shift because some institutions submit revised tuition figures for the previous year. The recomputed average for 2013-14 tuition and fees at public four-year institutions is $8 lower than the level we reported last year for in-state students and $20 higher for out-of-state students. Compared to the average tuition and fee prices we reported last year, the recomputed average for 2013-14 tuition and fees is $23 lower for public two-year in-district students and $37 higher for private nonprofit four-year students.
Carnegie Classification
Number of Institutions
Surveyed in Both 2012 and 2013
Number of Institutions Included in T&F Analysis
Number of Institutions in Analysis with Imputed
T&F for Either Year
Public Doctoral In-State 175 175 100% 0 0%
Public Master’s In-State 265 265 100% 1 0%
Public Bachelor’s In-State 133 128 96% 2 2%
Private Nonprofit Doctoral 103 103 100% 1 1%Private Nonprofit Master’s 357 354 99% 4 1%
Private Nonprofit Bachelor’s 504 496 98% 11 2%
TABLE A1B Number of Institutions Included in Tuition and Fees
(T&F) Analysis in Table 1B
Sector
Number of Institutions
Surveyed in Both 2012 and 2013
Number of Institutions Included in T&F Analysis
Number of Institutions in Analysis with Imputed
T&F for Either Year
Public Two-Year 999 991 99% 6 1%
Public Four-Year 588 580 99% 6 1%
Private Nonprofit Four-Year 1,229 1,201 98% 28 2%
For-Profit 862 333 39% 58 17%
TOTAL 3,678 3,105 84% 98 3%
TABLE A1A Number of Institutions Included in Tuition and Fees
(T&F) Analysis in Table 1A

42
LONGITUDINAL DATA
In Tables 2A and 2B, tuition averages from years prior to 1987-88 are extracted from the Integrated Postsecondary Education Data System (IPEDS). The two data sets, IPEDS and the College Board’s Annual Survey of Colleges, track very closely, but IPEDS averages are weighted by full-time equivalent enrollments, while the Annual Survey of Colleges prices are weighted by full-time enrollments. In addition, IPEDS tuition and fee data may be based on 24 semester hours while the Annual Survey of Colleges data are based on 30 semester hours. Annual historical data are available online at trends.collegeboard.org.
NET PRICE CALCULATIONS
The calculations of average net price for full-time undergraduates in Figures 11, 12, and 13, as well as the calculations in online Table 7, are a best approximation and are based on the aggregate amounts of each type of aid reported in Trends in Student Aid 2014 and on the allocation of each type of aid across institution types and between part-time and full-time students reported in 1993, 1996, 2000, 2004, 2008, and 2012 National Postsecondary Student Aid Study (NPSAS) data when such detailed information is not available in specific program data. Because financial aid data for 2014-15 are not yet available, amounts for that year are estimated based on past years. Total charges for public two-year students include an estimate of housing and food expenses for students not living with their parents, based on commuter room and board expenses reported by institutions when available and derived from public four-year room and board charges for earlier years in the analysis. The net price estimates reported here are not exactly comparable to those that appeared in 2013 because some figures have been updated.
Net price and grant totals in Figures 11, 12, and 13 are not comparable to those in Figures 14A, 14B, 15A, and 15B, which are based on NPSAS data over time. In addition, Figures 11, 12, and 13 take into account tax benefits and deductions, while Figures 14A, 14B, 15A, and 15B do not.
INSTITUTIONAL REVENUES AND EXPENDITURES
Figures 18A, 18B, 19A, and 19B are based on data from the IPEDS Delta Cost data and the IPEDS 2011-12 finance data. Delta Cost data combine IPEDS data with information from the Financial Institution Shared Assessments Program database beginning in 1994. Further details and the entire database are available at nces.ed.gov/ipeds/deltacostproject/. Because Delta Cost data are not available for 2011-12, revenues and expenditures for that year are based on IPEDS data and calculations by the authors to match Delta Cost definitions and categories.
ENDOWMENTS
Data on endowments are from the National Association of College and University Business Officers (NACUBO) and Commonfund Institute, supplemented by data from IPEDS for institutions for which NACUBO or Commonfund data are not available. Public university foundation endowment assets are included.
INFLATION ADJUSTMENT
The Consumer Price Index for all urban consumers (CPI-U) is used to adjust for inflation. We use the CPI-U in July of the year in which the academic year begins. See www.bls.gov/data/ for changes in the CPI-U over time. Table A2 provides CPI data for 2004 through 2014. Additional historical data are available online. Each Factor column provides the user with a multiplication factor equal to the CPI in the base year (say, 2014) divided by the CPI of the year in question. A simple multiplication of a current-year figure by the associated factor will yield a constant-dollar result.
CARNEGIE CLASSIFICATION 2010: BASIC CLASSIFICATION
“Doctoral universities” include institutions that award at least 20 doctoral degrees per year (excluding doctoral degrees that qualify recipients for entry into professional practice, such as the J.D., M.D., Pharm.D., DPT, etc.); “master’s colleges and universities” include institutions that award at least 50 master’s degrees per year; “bachelor’s colleges” include institutions where bachelor’s degrees represent at least 10% of all undergraduate degrees and that award fewer than 50 master’s degrees or fewer than 20 doctoral degrees per year. All of the categories above exclude “special focus institutions” and “tribal colleges.”
Academic Year
CPI (As of July at the Beginning of the
Academic Year)
Factor Used in Trends in College Pricing to
Convert to 2014 Dollars
Factor Used in Trends in Student Aid
to Convert to 2013 Dollars
2004-05 189.400 1.2579 1.2333
2005-06 195.400 1.2193 1.1955
2006-07 203.500 1.1708 1.1479
2007-08 208.300 1.1438 1.1214
2008-09 219.964 1.0831 1.0620
2009-10 215.351 1.1063 1.0847
2010-11 218.011 1.0928 1.0715
2011-12 225.922 1.0546 1.0340
2012-13 229.104 1.0399 1.0196
2013-14 233.596 1.0199 1.0000
2014-15 238.250 1.0000
TABLE A2 Consumer Price Index: All Urban Consumers, Not
Seasonally Adjusted, All Items, U.S. City Average, 1982-84=100

43For detailed data behind the graphs and additional information, please visit: trends.collegeboard.org.
Trends in College Pricing was authored by Sandy Baum, senior fellow at the
Urban Institute and research professor at the George Washington University
Graduate School of Human Development, and Jennifer Ma, policy research
scientist at the College Board, with invaluable assistance from D’Wayne Bell
and Diane Cardenas Elliott.
Contact Information for the Authors
Sandy Baum, [email protected]
Jennifer Ma, [email protected]
Trends in College Pricing and its companion report, Trends in Student Aid, are
supplemented by a website that makes detailed data available for reference
and downloading. The PDF versions of these reports, along with PowerPoint
slides of all the graphs, are available on the Web: trends.collegeboard.org.
Hard copies may be requested by contacting [email protected].
Tables, graphs, and data in this report or excerpts thereof may be reproduced
or cited, for noncommercial purposes only, provided that the following
attribution is included:
Source: Trends in College Pricing.
© 2014 The College Board.
www.collegeboard.org
ACKNOWLEDGMENTS
This publication benefited from comments by Jack Buckley, Melanie Corrigan,
Michael Hurwitz, and Anne Sturtevant. Barbara Kridl and her colleagues at
RTI International provided expert graphic design work, as well as advice on
content. The publication would not have been possible without the cooperation
and support of many people at the College Board, including Doris Chow,
Jessica Howell, Donovan Hylton, Silvia Ivanova, Kathryn McGinley, and
Suzette Stone-Busa.
We thank all of those who contributed to the data collection for this
publication, including institutional research department staff and campus
administrators who provided us with invaluable data through the Annual
Survey of Colleges. We thank Samuel Barbett of the U.S. Department of
Education for providing us with IPEDS enrollment data and Kenneth Redd of
NACUBO for providing us with the NACUBO endowment data.
DEFINING TERMS
“Costs” refer to the expenditures associated
with delivering instruction, including physical
plant and salaries.
“Prices” are the expenses that students and
parents face.
“Published price” is the price institutions charge
for tuition and fees as well as room and board,
in the case of students residing on campus. A
full student expense budget also includes books,
supplies, transportation, and other basic living
costs.
“Net price” is what the student and/or family must
cover after grant aid and savings from tax credits
and deductions are subtracted.
“General subsidies” make it possible for
institutions to charge less than the actual costs of
instruction. State, federal, and local appropriations,
as well as private philanthropy, reduce the prices
faced by all students — whether or not they receive
financial aid.

214b-9335
www.collegeboard.org
trends.collegeboard.org