trends in college pricing and student aid 2021
TRANSCRIPT

TRENDS IN HIGHER EDUCATION SERIES
Trends in College Pricing
and Student Aid 2021
COLLEGE PRICING
STUDENT AID

Trends in College Pricing and Student Aid 2021 was authored by Jennifer Ma, senior policy research scientist at College Board and Matea Pender, policy research scientist at College Board.
Contact Information for the Authors [email protected]
Tables, graphs, and data in this report or excerpts thereof may be reproduced or cited, for noncommercial purposes only, provided that the following attribution is included:
Source: Ma, Jennifer and Matea Pender (2021), Trends in College Pricing and Student Aid 2021, New York: College Board. © 2021 College Board.
www.collegeboard.org
research.collegeboard.org/trends
ACKNOWLEDGMENTS
We thank Dean Bentley, Jessica Howell, and Michael Hurwitz for their thoughtful reviews. We also thank the cooperation and support of many colleagues at College Board, including Connie Betterton, Mark Bloniarz, Auditi Chakravarty, Karen Lanning, Kevin Morris, Jose Rios, Ashley Robinson-Spann, Michael Slevin, Kayla Tompkins, Marquis Woods, and the Annual Survey of Colleges team.
We thank all of those who contributed to the data collection for this publication, especially Tara Marini of the Office of Federal Student Aid, Mike Solomon of the Illinois Student Aid Commission, and institutional research department staff and campus administrators who provided us with invaluable data through the Annual Survey of Colleges.
BFF Media Work provided expert graphic design work.
DEFINING TERMS
“Costs” refer to the expenditures associated with delivering instruction, including physical plant and salaries.
“Prices” are the expenses that students and parents face.
“Published price” is the price institutions charge for tuition and fees as well as room and board, in the case of students residing on campus. A full student expense budget also includes allowances for books and course materials, supplies, transportation, and other personal expenses.
“Net price” is what the student and/or family must cover after grant aid is subtracted.
“General subsidies” make it possible for institutions to charge less than the actual costs of instruction. State, federal, and local appropriations, as well as private philanthropy, reduce the prices faced by all students—whether or not they receive financial aid.
MAR-1311October 2021
Highlights
3
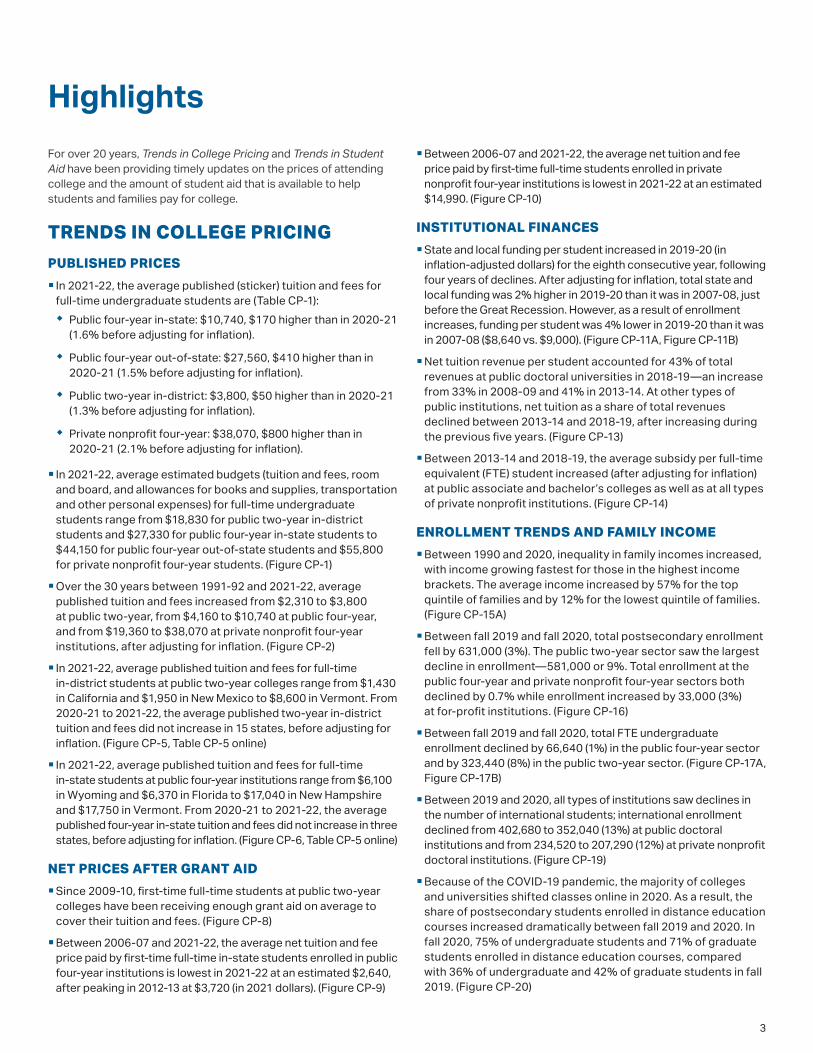
For over 20 years, Trends in College Pricing and Trends in Student Aid have been providing timely updates on the prices of attending college and the amount of student aid that is available to help students and families pay for college.
TRENDS IN COLLEGE PRICING PUBLISHED PRICES�■ In 2021-22, the average published (sticker) tuition and fees for
full-time undergraduate students are (Table CP-1):w Public four-year in-state: $10,740, $170 higher than in 2020-21
(1.6% before adjusting for inflation).
w Public four-year out-of-state: $27,560, $410 higher than in 2020-21 (1.5% before adjusting for inflation).
w Public two-year in-district: $3,800, $50 higher than in 2020-21 (1.3% before adjusting for inflation).
w Private nonprofit four-year: $38,070, $800 higher than in 2020-21 (2.1% before adjusting for inflation).
�■ In 2021-22, average estimated budgets (tuition and fees, room and board, and allowances for books and supplies, transportation and other personal expenses) for full-time undergraduate students range from $18,830 for public two-year in-district students and $27,330 for public four-year in-state students to $44,150 for public four-year out-of-state students and $55,800 for private nonprofit four-year students. (Figure CP-1)
�■Over the 30 years between 1991-92 and 2021-22, average published tuition and fees increased from $2,310 to $3,800 at public two-year, from $4,160 to $10,740 at public four-year, and from $19,360 to $38,070 at private nonprofit four-year institutions, after adjusting for inflation. (Figure CP-2)
�■ In 2021-22, average published tuition and fees for full-time in-district students at public two-year colleges range from $1,430 in California and $1,950 in New Mexico to $8,600 in Vermont. From 2020-21 to 2021-22, the average published two-year in-district tuition and fees did not increase in 15 states, before adjusting for inflation. (Figure CP-5, Table CP-5 online)
�■ In 2021-22, average published tuition and fees for full-time in-state students at public four-year institutions range from $6,100 in Wyoming and $6,370 in Florida to $17,040 in New Hampshire and $17,750 in Vermont. From 2020-21 to 2021-22, the average published four-year in-state tuition and fees did not increase in three states, before adjusting for inflation. (Figure CP-6, Table CP-5 online)
NET PRICES AFTER GRANT AID �■Since 2009-10, first-time full-time students at public two-year colleges have been receiving enough grant aid on average to cover their tuition and fees. (Figure CP-8)
�■Between 2006-07 and 2021-22, the average net tuition and fee price paid by first-time full-time in-state students enrolled in public four-year institutions is lowest in 2021-22 at an estimated $2,640, after peaking in 2012-13 at $3,720 (in 2021 dollars). (Figure CP-9)
�■Between 2006-07 and 2021-22, the average net tuition and fee price paid by first-time full-time students enrolled in private nonprofit four-year institutions is lowest in 2021-22 at an estimated $14,990. (Figure CP-10)
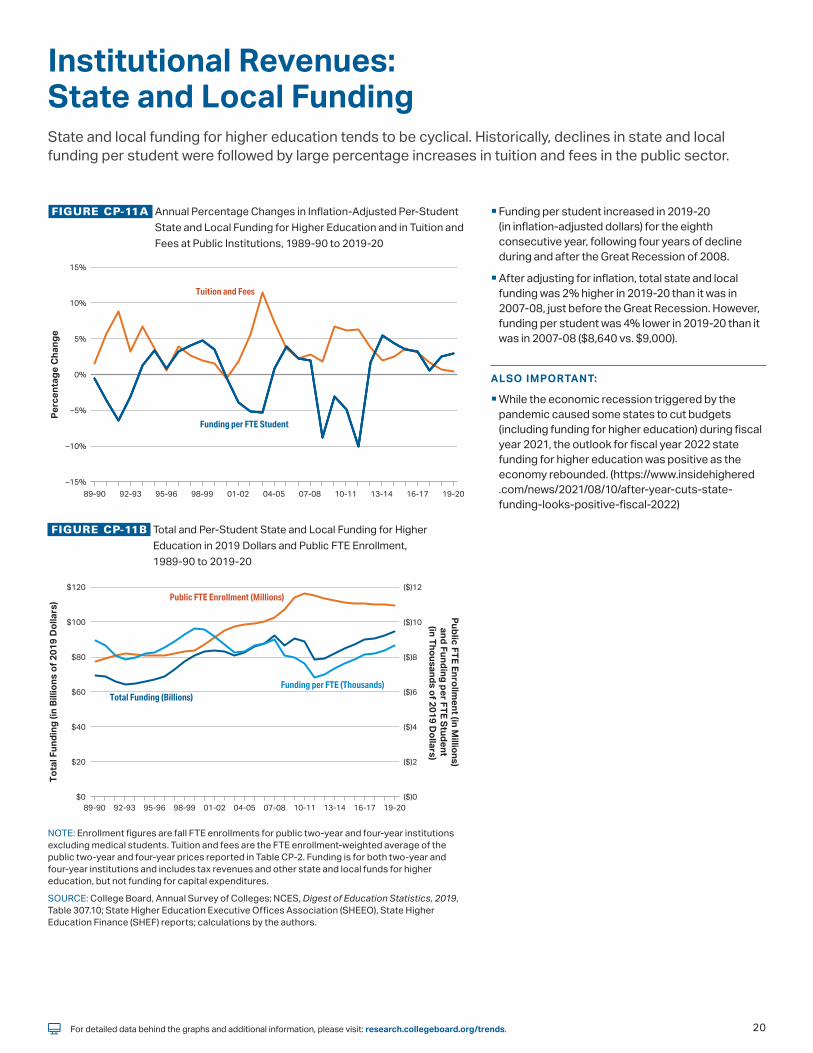
INSTITUTIONAL FINANCES �■State and local funding per student increased in 2019-20 (in inflation-adjusted dollars) for the eighth consecutive year, following four years of declines. After adjusting for inflation, total state and local funding was 2% higher in 2019-20 than it was in 2007-08, just before the Great Recession. However, as a result of enrollment increases, funding per student was 4% lower in 2019-20 than it was in 2007-08 ($8,640 vs. $9,000). (Figure CP-11A, Figure CP-11B)
�■Net tuition revenue per student accounted for 43% of total revenues at public doctoral universities in 2018-19—an increase from 33% in 2008-09 and 41% in 2013-14. At other types of public institutions, net tuition as a share of total revenues declined between 2013-14 and 2018-19, after increasing during the previous five years. (Figure CP-13)
�■Between 2013-14 and 2018-19, the average subsidy per full-time equivalent (FTE) student increased (after adjusting for inflation) at public associate and bachelor’s colleges as well as at all types of private nonprofit institutions. (Figure CP-14)
ENROLLMENT TRENDS AND FAMILY INCOME �■Between 1990 and 2020, inequality in family incomes increased, with income growing fastest for those in the highest income brackets. The average income increased by 57% for the top quintile of families and by 12% for the lowest quintile of families. (Figure CP-15A)
�■Between fall 2019 and fall 2020, total postsecondary enrollment fell by 631,000 (3%). The public two-year sector saw the largest decline in enrollment—581,000 or 9%. Total enrollment at the public four-year and private nonprofit four-year sectors both declined by 0.7% while enrollment increased by 33,000 (3%) at for-profit institutions. (Figure CP-16)
�■Between fall 2019 and fall 2020, total FTE undergraduate enrollment declined by 66,640 (1%) in the public four-year sector and by 323,440 (8%) in the public two-year sector. (Figure CP-17A, Figure CP-17B)
�■Between 2019 and 2020, all types of institutions saw declines in the number of international students; international enrollment declined from 402,680 to 352,040 (13%) at public doctoral institutions and from 234,520 to 207,290 (12%) at private nonprofit doctoral institutions. (Figure CP-19)
�■Because of the COVID-19 pandemic, the majority of colleges and universities shifted classes online in 2020. As a result, the share of postsecondary students enrolled in distance education courses increased dramatically between fall 2019 and 2020. In fall 2020, 75% of undergraduate students and 71% of graduate students enrolled in distance education courses, compared with 36% of undergraduate and 42% of graduate students in fall 2019. (Figure CP-20)

TRENDS IN STUDENT AID
4
TYPES OF STUDENT AID �■ In 2020-21, undergraduate students received an average of $14,800 per FTE student in financial aid: $10,050 in grants, $3,780 in federal loans, $880 in education tax credits, and $90 in Federal Work-Study (FWS). (Figure SA-1, Table SA-3 online)
�■ In 2020-21, graduate students received an average of $26,920 per FTE student in financial aid: $8,860 in grants, $17,540 in federal loans, $460 in tax credits, and $60 in FWS. (Figure SA-1, Table SA-3 online)
�■ In 2020-21, undergraduate and graduate students received $234.9 billion in grants, FWS, federal loans, and federal tax credits. In addition, students borrowed about $12 billion from nonfederal sources. (Table SA-1 online)
FEDERAL STUDENT AID �■Total federal grant aid decreased by 32% in inflation-adjusted dollars between 2010-11 and 2020-21. Pell Grants declined by 39% ($16.4 billion) and veterans’ benefits declined by 3% ($405 million). (Table SA-1 online)
�■ In 2020-21, average benefits from the Post-9/11 GI Bill program were nearly $16,000, compared with just over $4,200 per Pell Grant recipient. There were 6.2 million Pell Grants recipients compared with 614,000 veterans’ benefits recipients. (Figure SA-7)
�■Between 2010-11 and 2020-21, federal loans to undergraduates fell by 47%, while federal loans to graduate students declined by 7%. (Figure SA-3, Figure SA-4)
�■FWS and Federal Supplemental Educational Opportunity Grants (FSEOG) combined provided $2.0 billion to undergraduate students in 2020-21—1% of the total aid. (Figure SA-3)
�■Average HEERF I funding per FTE student was higher at institutions with higher shares of Pell Grant recipients. For example, in the public four-year sector, average HEERF I funding amounts were $680 at institutions where less than 30% of undergraduate students received Pell and $2,750 at institutions where more than 60% of undergraduate students received Pell. (Figure SA-20A)
PELL GRANTS �■Pell Grant expenditures rose from $36.2 billion (in 2020 dollars) in 2009-10 to $42.3 billion in 2010-11 but declined to $26.0 billion by 2020-21. (Figure SA-15B)
�■The number of Pell Grant recipients declined by 3.3 million (35%) since peaking in 2011-12. (Figure SA-15B)
�■The average Pell Grant per recipient was $3,360 (in 2020 dollars) in 2001-02. It peaked at $4,550 in 2010-11, and fell to $4,220 in 2020-21. (Figure SA-16)
�■The $6,495 maximum Pell Grant in 2021-22 is 14% higher in inflation-adjusted dollars than it was in 2001-02. (Figure SA-16)
OTHER SOURCES OF GRANT AID �■Between 2010-11 and 2020-21, institutional grant aid for undergraduate students increased by 62% ($22.0 billion in 2020 dollars). (Figure SA-3)
�■Between 2010-11 and 2020-21, institutional grant aid rose by $25.6 billion (in 2020 dollars) reaching a total of $71.1 billion in 2020-21. Institutional grants accounted for about half of all grant aid for undergraduate and graduate students in 2020-21. (Figure SA-5)
�■State grant aid per FTE undergraduate student increased for the eighth consecutive year in 2019-20, to $980—an increase of $230 (31%) since 2011-12. State grant aid per FTE undergraduate student ranged from under $200 in eight states to over $1,000 in 18 states. (Figure SA-17A, Figure SA-18A)
STUDENT BORROWING �■After rapid growth in annual borrowing between 2005-06 and 2010-11, total federal loans to undergraduate students declined by 46% ($38.6 billion in 2020 dollars) between 2010-11 and 2020-21; federal loans to graduate students decreased by 7% ($2.7 billion). (Figure SA-9A)
�■ In 2020-21, after the tenth consecutive decline in annual education borrowing, students and parents borrowed $95.9 billion, down from $135.1 billion (in 2020 dollars) in 2010-11. (Figure SA-6)
�■Average federal loans per student peaked in 2010-11 for both undergraduate and graduate students. Federal loans per FTE undergraduate student declined to $3,780 in 2020-21, from a peak of $6,160 (in 2020 dollars) in 2010-11. Federal loans per FTE graduate student declined to $17,540 in 2020-21, from a peak of $20,280 in 2010-11. (Figure SA-1)
�■The share of annual federal education loans going to graduate students (who constitute about 16% of all students) rose from 32% ($24.1 billion out of $74.5 billion in 2020 dollars) in 2005-06 to 47% ($39.0 billion out of $83.7 billion) in 2020-21. (Figure SA-9A)
�■ In 2020-21, 432,000 graduate students borrowed through the grad PLUS program; 1.5 million borrowed unsubsidized loans. The average amount borrowed through the PLUS program was $8,080 higher than the average unsubsidized loan ($26,880 vs. $18,800). (Figure SA-9B)
�■Nonfederal education loans fell from about $28 billion (in 2020 dollars) in 2007-08 to $9 billion in 2010-11, before increasing to about $12 billion in 2020-21. (Figure SA-6)
STUDENT DEBT �■As of March 2021, 54% of borrowers with outstanding education debt owed less than $20,000; 45% of the outstanding federal education loan debt was held by the 10% of borrowers owing $80,000 or more. (Figure SA-10)
�■As of March 2021, 23% of the $1.59 trillion outstanding federal loan balance was held by borrowers who were 50 or older, up from 18% in 2017. (Figure SA-12A)
�■ In 2019-20, 55% of bachelor’s degree recipients from public and private nonprofit four-year colleges and universities graduated with debt and had an average debt level of $28,400. Average debt per bachelor’s degree recipient, including both those who borrowed and those who did not, was $15,600 for the two sectors combined. (Figure SA-14)
55
Contents3 Highlights
7 Introduction
TRENDS IN COLLEGE PRICING10 Published Charges,
2020-21 and 2021-22TABLE CP-1 Average Published Undergraduate Charges by Sector and by Carnegie Classification,
2020-21 and 2021-22
11 Student Budgets, 2021-22 FIGURE CP-1 Average Estimated Undergraduate Budgets, 2021-22
12 Published Tuition and Fees over Time
FIGURE CP-2 Published Tuition and Fees over Time
FIGURE CP-3 Published Tuition and Fees Relative to 1991-92, by Sector
13 Published Charges over Time FIGURE CP-4 Ten-Year Percentage Changes in Published Charges, by Decade
TABLE CP-2 Tuition and Fees and Room and Board over Time
TABLE CP-3 Tuition and Fees over Time (Unweighted)
TABLE CP-4 Tuition and Fees by Region over Time
14 Tuition and Fees by State: Public Two-Year
FIGURE CP-5 2021-22 In-District Tuition and Fees at Public Two-Year Institutions by State and Five-Year Percentage Changes
TABLE CP-5 Tuition and Fees by Sector and State over Time
15 Tuition and Fees by State: Public Four-Year
FIGURE CP-6 2021-22 Tuition and Fees at Public Four-Year Institutions by State and Five-Year Percentage Changes
16 Tuition and Fees by State: Flagship Universities
FIGURE CP-7 2021-22 Tuition and Fees at Flagship Universities and Five-Year Percentage Changes
TABLE CP-6 Tuition and Fees at Flagship Universities over Time
17 Average Net Price: Public Two-Year
FIGURE CP-8 Average Net Price over Time for First-Time Full-Time Students at Public Two-Year Institutions
18 Average Net Price: Public Four-Year
FIGURE CP-9 Average Net Price over Time for First-Time Full-Time Students at Public Four-Year Institutions
19 Average Net Price: Private Nonprofit Four-Year
FIGURE CP-10 Average Net Price over Time for First-Time Full-Time Students at Private Nonprofit Four-Year Institutions
20 Institutional Revenues: State and Local Funding
FIGURE CP-11A Annual Percentage Changes in State and Local Funding and Public Tuition and Fees over Time
FIGURE CP-11B Total and Per-Student State and Local Funding and Public Enrollment over Time
21 Institutional Revenues: State and Local Funding
FIGURE CP-12 2019-20 State and Local Funding per Student and per $1,000 in Personal Income and 10-Year Percentage Changes in Inflation-Adjusted Funding per Student, by State
22 Institutional Revenues: Public Institutions
FIGURE CP-13 Institutional Revenues per Student at Public Institutions over Time
23 Institutional Revenues and Expenditures
FIGURE CP-14 Net Tuition Revenues, Subsidies, and Education Expenditures per Student over Time
24 Family Income FIGURE CP-15A Family Income over Time by Quintile
FIGURE CP-15B Family Income by Selected Characteristics, 2020
25 Enrollment Patterns over Time FIGURE CP-16 Enrollment by Level of Enrollment and Attendance Status over Time
26 Public Undergraduate Enrollment by State
FIGURE CP-17A One-Year Percentage Change in Public Four-Year Undergraduate Enrollment by State, Fall 2019 to Fall 2020
FIGURE CP-17B One-Year Percentage Change in Public Two-Year Undergraduate Enrollment by State, Fall 2019 to Fall 2020
27 Enrollment by Race/Ethnicity FIGURE CP-18A Distribution of Undergraduate Enrollment by Sector Within Race/Ethnicity, Fall 2020
FIGURE CP-18B Distribution of Undergraduate Enrollment by Race/Ethnicity Within Sectors, Fall 2020
28 International Enrollment FIGURE CP-19 Enrollment of International Undergraduate and Graduate Students by Institution Type, 2009, 2019, and 2020
29 Enrollment in Distance Education Courses
FIGURE CP-20 Percentage of Postsecondary Students Enrolled in Distance Education Courses, Fall 2012, Fall 2019, and Fall 2020
Figures and tables that are only available online at research.collegeboard.org/trends.

6
TRENDS IN STUDENT AID31 Total Student Aid TABLE SA-1 Total Student Aid and Nonfederal Loans in 2020 Dollars over Time
TABLE SA-1 Total Student Aid and Nonfederal Loans in 2020 Dollars over Time: All Students, Undergraduate Students, and Graduate Students
TABLE SA-2 Total Student Aid and Nonfederal Loans in Current Dollars over Time: All Students, Undergraduate Students, and Graduate Students
32 Aid per Student FIGURE SA-1 Average Aid per Student over Time
TABLE SA-3 Average Aid per Student over Time: All Postsecondary Students, Undergraduate Students, and Graduate Students
33 Grants, Loans, and Other Aid FIGURE SA-2 Composition of Total Aid and Nonfederal Loans over Time
TABLE SA-4 Total Aid and Nonfederal Loans in Current and Constant Dollars over Time: All Students, Undergraduate Students, and Graduate Students
34 Total Undergraduate Student Aid FIGURE SA-3 Total Undergraduate Student Aid by Source and Type over Time
35 Total Graduate Student Aid FIGURE SA-4 Total Graduate Student Aid by Source and Type over Time
36 Sources of Grant Aid FIGURE SA-5 Total Grant Aid by Source over Time
37 Types of Loans FIGURE SA-6 Total Federal and Nonfederal Loans by Type over Time
38 Federal Aid FIGURE SA-7 Number of Recipients by Federal Aid Program, 2020-21
FIGURE SA-8 Percentage Distribution of Federal Aid Funds by Sector, 2019-20
TABLE SA-5 Federal Aid per Recipient by Program over Time in Current and Constant Dollars
TABLE SA-7 Percentage Distribution of Federal Aid Funds by Sector over Time
39 Federal Loans: Annual Borrowing
FIGURE SA-9A Total Annual Amount Borrowed in Federal Loans over Time
FIGURE SA-9B Average Annual Amount Borrowed in Federal Loans over Time
TABLE SA-6 Federal Loans in Current and Constant Dollars over Time: All Postsecondary Students, Undergraduate Students, and Graduate Students
40 Federal Loans: Borrowing and Balances
FIGURE SA-10 Distribution of Borrowers and Debt by Outstanding Balance, FY2021
FIGURE SA-11 Percentage of Undergraduates Borrowing Federal Loans over Time
41 Federal Loans: Outstanding Debt by Age
FIGURE SA-12A Distribution of Outstanding Federal Loan Dollars and Borrowers by Borrower Age
FIGURE SA-12B Distribution of Borrowers by Outstanding Balance and Age, FY2021
42 Federal Loans: Outstanding Debt by Repayment Plan and Repayment Status
FIGURE SA-13A Distribution of Outstanding Federal Direct Loan Dollars and Recipients by Repayment Plan
FIGURE SA-13B Repayment Status of Federal Education Loan Portfolio
43 Cumulative Debt: Bachelor’s Degree Recipients
FIGURE SA-14 Cumulative Debt of Bachelor’s Degree Recipients at Four-Year Institutions over Time
44 Pell Grants FIGURE SA-15A Undergraduate Enrollment and Percentage Receiving Pell Grants over Time
FIGURE SA-15B Total Pell Grant Expenditures and Number of Recipients over Time
45 Pell Grants FIGURE SA-16 Published Prices at Four-Year Institutions, Maximum Pell, and Average Pell over Time
46 State Grants FIGURE SA-17A Need-Based and Non-Need-Based State Grants per Undergraduate Student over Time
FIGURE SA-17B Percentage of State Grant Aid Based on Need by State, 2019-20
47 State Grants FIGURE SA-18A State Grant Aid per Undergraduate Student by State, 2019-20
FIGURE SA-18B State Grant Expenditures as a Percentage of Total State Support for Higher Education by State, 2019-20
48 Average Institutional Grant Aid by Sector
FIGURE SA-19A Average Institutional Grant Aid in 2018 Dollars per First-Time Full-Time Student over Time
FIGURE SA-19B Percentage of First-Time Full-Time Students Receiving Institutional Grant Aid over Time
49 Higher Education Emergency Relief Fund
FIGURE SA-20A Average HEERF I Funding Per FTE Student, by Share of Pell Enrollees and by Sector
FIGURE SA-20B Distribution of HEERF I Funding and Full-Time Equivalent (FTE) Students by Sector
50 Notes and Sources
Contents—Continued

7
IntroductionShortly after the World Health Organization declared COVID-19 a pandemic in March 2020, most colleges and universities in the United States moved instruction online as governors ordered shutdowns to contain the spread of COVID-19. During the 2020-21 academic year, colleges adopted a wide range of instructional approaches, including in-person, online, and hybrid models.1 This fall, most colleges fully resumed in-person instruction for the 2021-22 academic year.
In 2020-21, many colleges froze or had very small increases in tuition and yet, many institutions, and especially two-year colleges, experienced declines in enrollment. In 2021-22, we continue to see historically low increases in average published tuition and fees before adjusting for inflation: 1.3% for public two-year in-district students, 1.6% for public four-year in-state students, 1.5% for public four-year out-of-state students, and 2.1% for private nonprofit four-year students. These increases are lower than the inflation rate in the first eight months of 2021. As a result, average tuition and fees declined across all three sectors in 2021-22 after adjusting for inflation.
IMPACTS OF THE PANDEMIC ON HIGHER EDUCATION
Enrollment
The newly released fall 2020 enrollment data from the Department of Education confirm findings from the National Student Clearinghouse2 that total postsecondary enrollment declined in 2020. However, enrollment changes were uneven across enrollment levels, sectors, states, and demographic groups. Between 2019 and 2020, total undergraduate enrollment declined by 698,000 and graduate enrollment increased by 67,000. Across sectors, the public two-year sector saw the largest decline in enrollment—581,000 (9%); public four-year and private nonprofit four-year sectors saw enrollment declines of less than 1% while the for-profit sector saw its enrollment increase by 3%. (Figure CP-16)
At the state level, nine states experienced increases in postsecondary enrollment at public four-year colleges while all but one state experienced declines in enrollment at public two-year colleges. (Figure CP-17A, Figure CP-17B)
While the enrollment patterns we present in this report are descriptive in nature, a recent study shows similar results after taking into account pre-pandemic trends and student demographic shifts.3
There are differences in the pandemic’s impact on postsecondary enrollment across demographic groups as well. While international student enrollment grew rapidly in the decade from 2009 to 2019, it declined by more than 10% from 2019 to 2020. (Figure CP-19)
The Department of Education’s fall 2020 enrollment data also confirm a dramatic increase in the share of students taking classes online: 75% of undergraduate students took some classes online in 2020, up from 36% in 2019. In fall 2020, 44% of undergraduate students took all classes online, up from 15% in 2019 (Figure CP-20). Although research is scant on the long-term impact of online learning, there is some evidence that suggests earnings of students at for-profit colleges where most students are exclusively online are lower than earnings of students at other for-profit schools.4
Enrollment changes have direct implications for institutions’ tuition revenues with net tuition revenue being the largest revenue source for public four-year and private nonprofit four-year institutions.5
State and Local Funding
In addition to tuition revenue, public institutions also rely heavily on state and local funding. In 2018-19, this source provided 27% of total revenues at public doctoral institutions, 39% at public master’s institutions, 44% at public bachelor’s institutions, and 55% at public two-year colleges (Figure CP-13). Generally, state and local funding declines during economic recessions. During the Great Recession of 2008, per-student state and local funding for higher education declined by 9% between 2007-08 and 2008-09, and the annual declines persisted through the 2011-12 academic year before rising for eight consecutive years. After adjusting for inflation, total state and local funding was 2% higher in 2019-20 than it was in 2007-08, just before the Great Recession. (Figure CP-11B)
The economic shutdowns in the second quarter of 2020 caused dramatic reductions in state tax revenues and some states announced funding cuts to higher education in the 2021 fiscal year. Though many feared that more states would announce funding cuts to higher education, the outlook for fiscal year 2022 state funding for higher education turned positive as the economy rebounded.6
The federal government passed the Coronavirus Aid, Relief, and Economic Security (CARES) Act in March 2020, which provided economic relief for state and local governments as well as $14 billion in Higher Education Emergency Relief Fund I (HEERF I) for higher education institutions and students. Additional funding for higher education in the amount of $21.2 billion (HEERF II) and $39.6 billion (HEEFR III) was authorized in December 2020 and March 2021, respectively. (Page 49)
1 https://www.chronicle.com/article/heres-a-list-of-colleges-plans-for-reopening-in-the-fall/2 https://nscresearchcenter.org/current-term-enrollment-estimates/ctee_report_fall_2020/3 https://research.collegeboard.org/pdf/enrollment-retention-covid2020.pdf
4 Gainfully Employed? Assessing the Employment and Earnings of For-Profit College Students Using Administrative Data5 NCES, Digest of Education Statistics, Tables 333.10 and 333.50.6 https://www.educationdive.com/news/state-lawmakers-wrestle-with-scope-and-timing-of-higher-ed-budget-cuts/578787/; https://www.insidehighered.com/news/2021/08/10/after-year-cuts-state-funding-looks-positive-fiscal-2022.

8
FAMILY INCOME, TUITION, AND COLLEGE AFFORDABILITY
In the last 30 years, income inequality grew as the average income increased by 57% for the highest fifth of families and by 12% for the lowest fifth of families. The latest income data from the U.S. Census Bureau show that median household income decreased by 2.9% between 2019 and 2020.7 In 2020, median incomes for Black and Hispanic families were 60% and 62%, respectively, of the median for white families. Median income for families with at least one four-year college graduate was more than twice the median for families headed by a high school graduate. (Figure CP-15A, Figure CP-15B)
Recognizing the struggles students and families face in paying for college, especially during a pandemic, many colleges and universities did not raise tuition between the 2019-2020 and 2020-2021 academic years. In 2021-22, this tuition freeze continued as the average published two-year in-district tuition and fees remain flat in 15 states and the average public four-year in-state tuition and fees are unchanged in three states. (Table CP-5 online)
In addition to providing financial relief for higher education institutions and students, the CARES Act suspended federal student loan payments, ended collections on defaulted federal student loans, and suspended interest accrual on all federal student loans through September 30, 2020. Subsequent Executive Orders extended the student loan provisions through the end of January 2022.8 Consequently, as of June 30, 2021, nearly 70% of all outstanding Direct Loan balances were in forbearance, compared with about 10% two years earlier. (Figure SA-13B)
It is still early to understand the full impact of HEERF funding on higher education, but student borrowing and debt were both declining prior to the pandemic, and it appears that this downward trend continues. For example, in 2020-21, total annual federal borrowing declined for the tenth consecutive year to $83.7 billion (in 2020 dollars), from a peak of $126.0 billion in 2010-11 (Table SA-1 online). The average amount of annual federal loans per FTE undergraduate student also declined during this period, from a peak of $6,160 (in 2020 dollars) in 2010-11 to $3,780 in 2020-21 (Figure SA-1).
Federal Pell Grants, which are awarded to students from lower-income households, have been declining since the expansion of the program during the Great Recession. Between 2010-11 and 2020-21, total Pell Grant expenditures decreased by 39% (from $42.3 billion to $26.0 billion in 2020 dollars) and the number of Pell Grant recipients declined by about a third, from 9.3 million to 6.2 million. (Figure SA-15B).
Under the CARES Act, the U.S. Department of Education distributed funds to institutions using a congressionally mandated formula, which required 75% of the funds to be distributed based on full-time equivalent (FTE) enrollment of Pell recipients and the remaining 25% based on the FTE enrollment of non-Pell recipients. Unlike the permanent maximum Pell Grant increase legislated through the American Recovery and Reinvestment Act of 2009 that led to increased benefits for more students, the CARES Act did not change the foundations of the Pell program.
WHAT IS NEW IN THIS YEAR’S REPORT
HEERF I Funding Analysis
In this report, we show that, on average, public institutions received more HEERF I funding per student than private nonprofit and for-profit institutions. In addition, schools with higher shares of Pell recipients received more funding per student than schools with lower shares of Pell recipients (Figure SA-20A).
Student Debt by Age
Many borrowers continue to hold education debt well into adulthood. Figure SA-12A shows that nearly a quarter of the $1.59 trillion outstanding federal loan balance was held by borrowers aged 50 and older, up from 18% in 2017 (Figure SA-12A). These borrowers may have borrowed for their own education or for their children’s education.
The long-term impact of the pandemic on students and institutions remains to be seen. As with previous years’ Trends reports, we will continue to include new relevant information as it becomes available.
Inflation Adjustment
We provide much of our data in constant dollars, adjusting values for changes in the annual Consumer Price Index (CPI). Since the 2021 annual CPI is not yet available, we use the change in the CPI from January−August 2020 to January−August 2021 to measure inflation between 2020-21 and 2021-22.
The average of January−August 2021 CPI is 3.9% higher than the average of January−August 2020 CPI. This 3.9% inflation is higher than the increases in tuition and fees across all three sectors.
7 https://www.census.gov/newsroom/press-releases/2021/income-poverty-health-insurance-coverage.html8 https://studentaid.gov/announcements-events/coronavirus

TRENDS IN HIGHER EDUCATION SERIES
Trends in College Pricing
2021

10For detailed data behind the graphs and additional information, please visit: research.collegeboard.org/trends.
Published Charges, 2020-21 and 2021-22In 2021-22, the average published (sticker) tuition and fee price for full-time in-state students at public four-year institutions is $10,740, $170 (1.6% before adjusting for inflation) higher than it was in 2020-21.
TABLE CP-1 Average Published Charges for Full-Time Undergraduates, 2020-21 and 2021-22
Sector Carnegie Classification
Public Two-Year In-District
Public Four-Year In-State
Public Four-Year
Out-of-State
Private Nonprofit Four-Year For-Profit
Public Four-Year Private Nonprofit Four-Year
Doctoral Master’s Bachelor’s Doctoral Master’s Bachelor’s
Tuition and Fees
2021-22 $3,800 $10,740 $27,560 $38,070 — $11,620 $9,000 $8,940 $45,830 $29,670 $38,290
2020-21 $3,750 $10,570 $27,150 $37,270 $15,780 $11,430 $8,880 $8,880 $44,840 $28,900 $37,720
$ Change $50 $170 $410 $800 — $190 $120 $60 $990 $770 $570
% Change 1.3% 1.6% 1.5% 2.1% — 1.7% 1.4% 0.7% 2.2% 2.7% 1.5%
Room and Board
2021-22 $9,330 $11,950 $11,950 $13,620 — $12,500 $10,980 $11,060 $15,530 $12,800 $12,640
2020-21 $9,150 $11,720 $11,720 $13,310 — $12,230 $10,790 $10,840 $15,210 $12,550 $12,330
Tuition and Fees and Room and Board
2021-22 $13,130 $22,690 $39,510 $51,690 — $24,120 $19,980 $20,000 $61,360 $42,470 $50,930
2020-21 $12,900 $22,290 $38,870 $50,580 — $23,660 $19,670 $19,720 $60,050 $41,450 $50,050
Percentage of Undergraduates Enrolled Full Time
Fall 2020 35% 80% 82% 68% 83% 75% 53% 87% 75% 87%
NOTE: Prices in Table CP-1 are not adjusted for inflation. Tuition prices reported for 2020-21 have been revised and may differ from those reported in Trends in College Pricing and Student Aid 2020. The latest tuition and fee estimate available for the for-profit sector is for 2020-21. Carnegie groupings are based on 2018 Carnegie classification, which categorizes more institutions as doctoral than previous years’ Carnegie classification.
SOURCE: College Board, Annual Survey of Colleges; NCES, IPEDS Fall 2020 Enrollment data and IPEDS 2020 Institutional Characteristics data.
Enrollment-weighted tuition values represent the price charged by each institution weighted by the number of full-time undergraduate students enrolled in fall 2020. Public four-year in-state charges are weighted by total fall 2020 full-time undergraduate enrollment in each institution, including both in-state students and out-of-state students. Out-of-state tuition and fees are computed by adding the average in-state price to the out-of-state premium weighted by the number of full-time out-of-state undergraduate students enrolled at each institution. Room and board charges for 2020 and 2021 are calculated by applying the median one-year percent change to the previous year’s average. In Trends in College Pricing 2019 and earlier editions, room and board charges were weighted by the number of undergraduate students residing on campus for four-year institutions and by the number of commuter students for public two-year institutions.
�■ In 2021-22, the average published tuition and fee price for full-time in-district students at public two-year institutions is $3,800, $50 (1.3% before adjusting for inflation) higher than it was in 2020-21.
�■ In 2021-22, the average published tuition and fee price for full-time students at private nonprofit four-year institutions is $38,070, $800 (2.1% before adjusting for inflation) higher than it was in 2020-21.
�■ In fall 2020, 35% of all undergraduate students at the public two-year sector were enrolled full time, compared with more than 80% at public four-year and private nonprofit four-year sectors.
�■Within public four-year and private nonprofit four-year sectors, doctoral institutions have higher prices than master’s and bachelor’s institutions.
ALSO IMPORTANT:
�■The prices shown in Table CP-1 are for full-time students. Prices for part-time students are typically less than those for full-time students.
�■The prices shown in Table CP-1 are for one academic year. The total price of a college education depends on how long a student is enrolled before completing a degree—frequently more than four years for a bachelor’s degree and more than two years for an associate degree.

11For detailed data behind the graphs and additional information, please visit: research.collegeboard.org/trends.
Student Budgets, 2021-22In 2021-22, average budgets for full-time undergraduate students range from $18,830 for public two-year in-district students and $27,330 for public four-year in-state students to $44,150 for public four-year out-of-state students and $55,800 for private nonprofit four-year students.
FIGURE CP-1 Average Estimated Full-Time Undergraduate Budgets (Enrollment-Weighted) by Sector, 2021-22
$0 $10,000 $20,000 $30,000 $40,000 $50,000
Other ExpensesTransportationBooks and SuppliesRoom and BoardTuition and Fees
Undergraduate Budget
$38,070
$1,060$1,810
$1,240
$13,620 $55,800Private Nonprofit
Four-YearOn-Campus
$27,560
$11,950
$1,230
$1,240
$2,170 $27,330
$11,950
$1,230
$1,240
$2,170 $44,150Public Four-Year
Out-of-StateOn-Campus
$10,740Public Four-Year
In-StateOn-Campus
$3,800 $9,330 $2,400 $18,830
$1,840
$1,460
Public Two-YearIn-District
Commuter
$460
$460
$780
$1,000
$1,240
$1,460
Four-Year
Public Two-Year
Books and Supplies
Course Materials Other Supplies
NOTE: Expense categories are based on institutional budgets for students as reported in the College Board’s Annual Survey of Colleges. Figures for tuition and fees and room and board mirror those reported in Table CP-1. Data for books and supplies, transportation, and other expenses are projected and reflect the average amounts allotted in determining the total cost of attendance and do not necessarily reflect actual student expenditures. Books and supplies may include course materials such as hardcopy textbooks, online textbooks, textbook rentals, and other supplies such as a personal computer used for study.
SOURCE: College Board, Annual Survey of Colleges; NCES, IPEDS Fall 2020 Enrollment data; Student Watch and Student Monitor.
�■Student budgets are constructed by institutional financial aid offices. These budgets form the basis for determining the total cost of attendance, which can affect the amount of financial aid for which students are eligible.
�■Room and board and other components of student budgets vary less across sectors than tuition and fees. As a result, while the average published in-district tuition and fee price at public two-year colleges is 35% of the in-state price at public four-year institutions, the total public two-year in-district student budget is 69% of the public four-year in-state student budget ($18,830 vs. $27,330).
�■The average in-state published tuition and fee price at public four-year institutions is 28% of the average price at private nonprofit four-year institutions; the average total public four-year in-state student budget is about half the average private nonprofit four-year student budget ($27,330 vs. $55,800).
ALSO IMPORTANT:
�■ In the last decade, average student spending on college textbooks and digital course materials declined by 36%. (Student Watch and Student Monitor: 2021 Reports)

12For detailed data behind the graphs and additional information, please visit: research.collegeboard.org/trends.
Published Tuition and Fees over TimeBetween 1991-92 and 2021-22, the average tuition and fees increased from $2,310 to $3,800 at public two-year, from $4,160 to $10,740 at public four-year, and from $19,360 to $38,070 at private nonprofit four-year institutions, after adjusting for inflation.
FIGURE CP-2 Average Published Tuition and Fees in 2021 Dollars by Sector, 1991-92 to 2021-22
91-92 96-97 01-02 06-07 11-12 16-17 21-22
$19,360
$26,380
$33,320
$38,070
$4,160$5,720
$9,890$10,740
$2,310
$2,440$3,550 $3,800
$0
$10,000
$20,000
$30,000
$40,000
Publ
ishe
d Tu
ition
and
Fee
s in
202
1 D
olla
rs
Private Nonprofit Four-Year
Public Four-Year
Public Two-Year
FIGURE CP-3 Inflation-Adjusted Published Tuition and Fees Relative to 1991-92, 1991-92 to 2021-22 (1991-92 = 1.0)
91-92 96-97 01-02 06-07 11-12 16-17 21-22
1.54
2.38
2.58
1.97
1.651.72
1.0
1.5
2.0
2.5
3.0
Infla
tion-
Adju
sted
Pub
lishe
d Tu
ition
and
Fee
sRe
lativ
e to
199
1-92
Private Nonprofit Four-Year
Public Four-Year
Public Two-Year
1.361.06
1.38
NOTE: Figure CP-3 shows published tuition and fees by sector, adjusted for inflation, relative to 1991-92 published prices. For example, a value of 2.58 indicates that the tuition and fee price in the public four-year sector in 2021-22 is 2.58 times as high as it was in 1991-92, after adjusting for increases in the Consumer Price Index. Average tuition and fee prices reflect in-district charges for public two-year institutions and in-state charges for public four-year institutions.
SOURCE: College Board, Annual Survey of Colleges; NCES, IPEDS Fall Enrollment data.
�■ In 2021-22, the average published tuition and fee price at public two-year colleges is 35% of the average price at public four-year institutions; it was 56% in 1991-92.
�■ In 2021-22, the average published tuition and fee price at public four-year institutions is 2.58 times as high as it was in 1991-92, after adjusting for inflation.
ALSO IMPORTANT:
�■The increases in the net prices that students actually pay, after taking grant aid into consideration, have been smaller over the long term than increases in published prices. See Figures CP-8, CP-9, and CP-10 for details on estimated average net prices over time.
�■Over the 30-year period from 1990 to 2020, median family income in the United States increased by 23% (from $68,098 to $84,008), after adjusting for inflation. (U.S. Census Bureau, 2020 Income Table F-7; calculations by the authors)

13For detailed data behind the graphs and additional information, please visit: research.collegeboard.org/trends.
Published Charges over TimeAfter adjusting for inflation, the average published tuition and fees declined in all three sectors between 2020-21 and 2021-22.
FIGURE CP-4 Ten-Year Percentage Changes in Inflation-Adjusted Published Prices by Decade, 1991-92 to 2021-22
Tuition and Feesand Room and Board
PublicFour-Year
Private NonprofitFour-Year
Tuition and Fees
PublicTwo-Year
PublicFour-Year
Private NonprofitFour-Year
2011-12 to 2021-222001-02 to 2011-121991-92 to 2001-02
29% 27%25%
50%
26%
36%
14%
38%
73%
9% 6%
45%
7%14% 11%
0%
20%
40%
60%
80%
10-Y
ear P
erce
ntag
e Ch
ange
NOTE: Each bar in Figure CP-4 shows the percentage change in published prices in inflation-adjusted dollars over a 10-year period. For example, from 2011-12 to 2021-22, average published tuition and fees at private nonprofit four-year colleges increased by 14% beyond increases in the Consumer Price Index. Average tuition and fee prices reflect in-district charges for public two-year institutions and in-state charges for public four-year institutions.
SOURCE: College Board, Annual Survey of Colleges; NCES, IPEDS Fall Enrollment data.
�■Between 2011-12 and 2021-22, published in-state tuition and fees at public four-year institutions increased by 9%, compared with 38% between 1991-92 and 2001-02 and 73% between 2001-02 and 2011-12.
�■Between 2011-12 and 2021-22, published in-state tuition and fees in the public four-year sector increased by $850 in 2021 dollars, compared with $1,560 between 1991-92 and 2001-02 and $4,170 between 2001-02 and 2011-12.
�■Between 2011-12 and 2021-22, total tuition, fees, room and board increased by 11% at public four-year and by 14% at private nonprofit four-year institutions.
ALSO IMPORTANT:
�■The price increases reported in Table CP-2 are adjusted for inflation and are smaller than the unadjusted numbers in Table CP-1.
TABLE CP-2 Average Tuition and Fees and Room and Board (Enrollment-Weighted) in 2021 Dollars, 1991-92 to 2021-22, Selected Years
Tuition and Fees in 2021 Dollars Tuition and Fees and Room and Board in 2021 Dollars
Academic Year
Private Nonprofit Four-Year
10-Year $ Change
Public Four-Year
10-Year $ Change
Public Two-Year
10-Year $ Change
Private Nonprofit Four-Year
10-Year $ Change
Public Four-Year
10-Year $ Change
1991-92 $19,360 $4,160 $2,310 $28,000 $10,760
2001-02 $26,380 $7,020 $5,720 $1,560 $2,440 $130 $36,210 $8,210 $13,710 $2,950
2011-12 $33,320 $6,940 $9,890 $4,170 $3,550 $1,110 $45,370 $9,160 $20,510 $6,800
2021-22 $38,070 $4,750 $10,740 $850 $3,800 $250 $51,690 $6,320 $22,690 $2,180
Academic Year
Private Nonprofit Four-Year
One-Year % Change
Public Four-Year
One-Year % Change
Public Two-Year
One-Year % Change
Private Nonprofit Four-Year
One-Year % Change
Public Four-Year
One-Year % Change
2011-12 $33,320 $9,890 $3,550 $45,370 $20,510
2012-13 $33,940 1.9% $10,130 2.4% $3,690 3.9% $46,190 1.8% $20,860 1.7%
2013-14 $34,770 2.4% $10,260 1.3% $3,740 1.4% $47,260 2.3% $21,210 1.7%
2014-15 $35,520 2.2% $10,390 1.3% $3,790 1.3% $48,200 2.0% $21,490 1.3%
2015-16 $36,680 3.3% $10,690 2.9% $3,860 1.8% $49,760 3.2% $22,190 3.3%
2016-17 $37,520 2.3% $10,830 1.3% $3,870 0.3% $50,790 2.1% $22,570 1.7%
2017-18 $38,060 1.4% $10,940 1.0% $3,880 0.3% $51,540 1.5% $22,800 1.0%
2018-19 $38,190 0.3% $10,930 -0.1% $3,890 0.3% $51,690 0.3% $22,910 0.5%
2019-20 $38,780 1.5% $10,980 0.5% $3,890 0.0% $52,430 1.4% $23,080 0.7%
2020-21 $38,710 -0.2% $10,980 0.0% $3,890 0.0% $52,530 0.2% $23,150 0.3%
2021-22 $38,070 -1.7% $10,740 -2.2% $3,800 -2.3% $51,690 -1.6% $22,690 -2.0%
NOTE: Average tuition and fee prices reflect in-district charges for public two-year institutions and in-state charges for public four-year institutions.
SOURCE: College Board, Annual Survey of Colleges; NCES, IPEDS Fall Enrollment data.

14For detailed data behind the graphs and additional information, please visit: research.collegeboard.org/trends.
Tuition and Fees by State: Public Two-YearIn 2021-22, average published tuition and fees for full-time in-district students at public two-year colleges range from $1,430 in California and $1,950 in New Mexico to $8,600 in Vermont.
FIGURE CP-5 Average 2021-22 In-District Tuition and Fees at Public Two-Year Institutions and 2016-17 to 2021-22 Five-Year Percentage Changes in Inflation-Adjusted In-District Tuition and Fees, by State
$0
$2,000
$4,000
$6,000
$8,000
0%
10%
20%
30%
40%
5-Ye
ar P
erce
ntag
e Ch
ange
inIn
-Dis
tric
t Tui
tion
and
Fees
2021
-22
In-D
istr
ict T
uitio
n an
d Fe
es
$1,4
30$1
,950
$3,8
00
$8,6
00$7
,240
-11% -10% -11%
-2%
37%
15% 17%
CA NM NC AZ TX FL KS NE MS
US NV ME AR MT HI GA UT MO M
I ID LA WV IL CT OK
WY TN WI
CO WA
MD AL DE RI IN VA OH ND NJ KY PA NY IA MN SC OR
MA NH SD VT
Calif
orni
aNe
w M
exic
oNo
rth C
arol
ina
Arizo
naTe
xas
Flor
ida
Kans
asNe
bras
kaM
issi
ssip
piUn
ited
Stat
esNe
vada
Mai
neAr
kans
asM
onta
naHa
wai
iGe
orgi
aUt
ahM
isso
uri
Mic
higa
nId
aho
Loui
sian
aW
est V
irgin
iaIlli
nois
Conn
ectic
utO
klah
oma
Wyo
min
gTe
nnes
see
Wis
cons
inCo
lora
doW
ashi
ngto
nM
aryl
and
Alab
ama
Dela
war
eRh
ode
Isla
ndIn
dian
aVi
rgin
iaO
hio
North
Dak
ota
New
Jer
sey
Kent
ucky
Penn
sylv
ania
New
Yor
kIo
wa
Min
neso
taSo
uth
Caro
lina
Ore
gon
Mas
sach
uset
tsNe
w H
amps
hire
Sout
h Da
kota
Verm
ont
NOTE: In Wisconsin, the five-year decline in average public two-year tuition is largely a result of public two-year campuses of the University of Wisconsin system (which had tuition prices that were higher than other public two-year colleges in the state) merging with public four-year campuses.
SOURCE: College Board, Annual Survey of Colleges. IPEDS, Fall Enrollment data.
�■Between 2016-17 and 2021-22, average in-district tuition and fees at public two-year colleges fell in 23 states after adjusting for inflation, including declines of 10% in Arizona and 11% in California and Florida.
�■Between 2016-17 and 2021-22, average in-district tuition and fees at public two-year colleges increased by more than 10% in seven states after adjusting for inflation.
ALSO IMPORTANT:
�■ In California and Florida, tuition at public two-year colleges has not increased since 2012-13 and 2015-16, respectively. (Table CP-5 online)
�■From 2020-21 to 2021-22, the average published two-year in-district tuition and fees did not increase in 15 states, before adjusting for inflation. (Table CP-5 online)

15For detailed data behind the graphs and additional information, please visit: research.collegeboard.org/trends.
Tuition and Fees by State: Public Four-YearIn 2021-22, average published tuition and fees for full-time in-state students at public four-year institutions range from $6,100 in Wyoming and $6,370 in Florida to $17,040 in New Hampshire and $17,750 in Vermont.
FIGURE CP-6 Average 2021-22 Tuition and Fees at Public Four-Year Institutions by State and 2016-17 to 2021-22 Five-Year Percentage Changes in Inflation-Adjusted In-State Tuition and Fees
$20,
650
$12,
840
$14,
260
$41,
930
$10,000
$20,000
$30,000
$40,000
-11%
-1%
13%
8%
12%
$0
0%
10%
20%
-10%
5-Ye
ar P
erce
ntag
e Ch
ange
inIn
-Sta
te T
uitio
n an
d Fe
es20
21-2
2 Tu
ition
and
Fee
s
In-State Tuition and FeesOut-of-State PremiumOut-of-State Tuition and Fees
$27,
560
$17,
750
$17,
040
$10,
740
$6,1
00$6
,370
WY FL MT UT NC NM ID NV NY WV AK MS
GA NE WI
OK AR SD KS IA MO CA IN LA ND MD TN US WA HI ME TX AL KY CO AZ OH OR
MN SC DE MA RI VA MI
CT IL NJ PA NH VT
Wyo
min
gFl
orid
aM
onta
na
Nort
h Ca
rolin
aUt
ah
New
Mex
ico
Idah
oNe
vada
New
York
Wes
t Virg
inia
Alas
kaM
issi
ssip
piGe
orgi
aNe
bras
kaW
isco
nsin
Okl
ahom
aAr
kans
asSo
uth
Dako
taKa
nsas
Iowa
Mis
sour
iCa
lifor
nia
Indi
ana
Loui
sian
aNo
rth
Dako
taM
aryl
and
Tenn
esse
eUn
ited
Stat
esW
ashi
ngto
nHa
waii
Mai
neTe
xas
Alab
ama
Kent
ucky
Colo
rado
Ariz
ona
Ohi
oO
rego
nM
inne
sota
Sout
h Ca
rolin
aDe
lawa
reM
assa
chus
etts
Rhod
e Is
land
Virg
inia
Mic
higa
nCo
nnec
ticut
Illino
isNe
w Je
rsey
Penn
sylva
nia
New
Ham
pshi
reVe
rmon
t
SOURCE: College Board, Annual Survey of Colleges; NCES, IPEDS Fall Enrollment data.
�■Between 2016-17 and 2021-22, average in-state tuition and fees at public four-year institutions fell in 18 states after adjusting for inflation.
�■Between 2016-17 and 2021-22, average in-state tuition and fees at public four-year institutions increased by more than 10% in six states after adjusting for inflation.
ALSO IMPORTANT:
�■A small number of public four-year institutions charge the same tuition to out-of-state students as to in-state students.
�■From 2020-21 to 2021-22, the average published four-year in-state tuition and fees did not increase in three states, before adjusting for inflation. (Table CP-5 online)

16For detailed data behind the graphs and additional information, please visit: research.collegeboard.org/trends.
Tuition and Fees by State: Flagship UniversitiesIn 2021-22, published tuition and fees for full-time in-state students at flagship universities range from $6,100 at the University of Wyoming and $6,380 at the University of Florida to $18,960 at the University of New Hampshire and $19,000 at the University of Vermont.
FIGURE CP-7 2021-22 Tuition and Fees at Flagship Universities and Five-Year Percentage Changes in Inflation-Adjusted In-State Tuition and Fees
0%
20%
5-Ye
ar P
erce
ntag
e Ch
ange
inIn
-Sta
te T
uitio
n an
d Fe
es
-11%
8%13%
16%
-4%-2%
-13%
18%20%
$6,1
00$6
,380
$18,
960
$19,
000
$0
$10,000
$20,000
$30,000
$40,000
$50,000
2021
-22
Tuiti
on a
nd F
ees
40%
In-State Tuition and FeesOut-of-State PremiumOut-of-State Tuition and Fees
$20,
650
$12,
940
$15,
040
$53,
230
$51,
940
$9,4
30
$10,
600
$16,
180
$17,
410
$28,
660
$37,
200 $4
3,89
0
WY FL MT ID NM NV MS
NC AK WV SD AR NE UT IA ND WI
AL NY TX MD
MO KS IN OH LA ME
OK
GA WA HI CO KY SC AZ TN CA OR DE RI MN NJ M
IM
A IL VA CT PA NH VT
Univ
. of W
YUn
iv. o
f FL
Univ
. of M
TUn
iv. o
f ID
Univ
. of N
MUn
iv. o
f NV:
Ren
oUn
iv. o
f MS
Univ
. of N
C-Ch
apel
Hill
Univ
. of A
K Fa
irban
ksW
est V
A Un
iv.
Univ
. of S
DUn
iv. o
f AR
Univ
. of N
E-Li
ncol
nUn
iv. o
f UT
Univ
. of I
AUn
iv. o
f ND
Univ
. of W
I-Mad
ison
Univ
. of A
LSt
ate
Univ
. of N
Y-Bu
ffalo
Univ
. of T
X-Au
stin
Univ
. of M
D-Co
llege
Par
kUn
iv. o
f MO
-Col
umbi
aUn
iv. o
f KS
IN U
niv.
Blo
omin
gton
OH
Stat
e Un
iv.-C
olum
bus
LA S
tate
Uni
v. &
A&M
Col
lege
Univ
. of M
EUn
iv. o
f OK
Univ
. of G
AUn
iv. o
f WA
Univ
. of H
I-Man
oaUn
iv. o
f CO
-Bou
lder
Univ
. of K
YUn
iv. o
f SC
Univ
. of A
ZUn
iv. o
f TN-
Knox
ville
Univ
. of C
A-Be
rkel
eyUn
iv. o
f OR
Univ
. of D
EUn
iv. o
f RI
Univ
. of M
N-Tw
in C
ities
Rutg
ers,
Sta
te U
niv.
of N
JUn
iv. o
f MI
Univ
. of M
A-Am
hers
tUn
iv. o
f IL-
Urba
na-C
ham
paig
nUn
iv. o
f VA
Univ
. of C
TPe
nn S
tate
Uni
v. P
ark
Univ
. of N
HUn
iv. o
f VT
SOURCE: College Board, Annual Survey of Colleges.
�■ In 2021-22, published tuition and fees for full-time out-of-state students at flagship universities range from $12,940 at the University of South Dakota and $15,040 at the University of North Dakota to $51,940 at the University of Virginia and $53,230 at the University of Michigan.
�■Public flagship universities in 28 states had lower in-state tuition and fees in 2021-22 than in 2016-17, after adjusting for inflation. These states include Florida, with the second lowest in-state tuition and fees, as well as Pennsylvania, New Hampshire, and Vermont, with the three highest tuition and fees.
ALSO IMPORTANT:
�■ In 2021-22, 14 flagship universities did not raise in-state tuition or mandatory fees over those charged for the 2020-21 academic year. (Table CP-6 online)

17For detailed data behind the graphs and additional information, please visit: research.collegeboard.org/trends.
Average Net Price: Public Two-YearSince 2009-10, first-time full-time students at public two-year colleges have been receiving enough grant aid on average to cover their tuition and fees.
FIGURE CP-8 Average Published and Net Prices in 2021 Dollars, First-Time Full-Time In-District Undergraduate Students at Public Two-Year Institutions, 2006-07 to 2021-22
$0
$5,000
$10,000
$15,000
$20,000
06-07 09-10 12-13 15-16 18-19 21-22
Published Tuition and Fees and Room and Board (TFRB)
Net TFRB
Published Costof Attendance (COA)
Net COA
Grant Aid
PublishedTuition and Fees (TF)
Net TF
Public Two-Year
Published TF
Published TFRB
Published COA
Grant Aid per Student Net TF Net TFRB Net COA
06-07 $3,030 $11,750 $16,720 $2,350 $680 $9,400 $14,370
07-08 $2,970 $11,930 $16,970 $2,410 $560 $9,520 $14,560
08-09 $2,970 $11,860 $17,240 $2,770 $200 $9,090 $14,470
09-10 $3,220 $12,170 $17,860 $3,640 -$420 $8,530 $14,220
10-11 $3,380 $12,480 $18,230 $3,980 -$600 $8,500 $14,250
11-12 $3,550 $12,310 $18,180 $3,890 -$340 $8,420 $14,290
12-13 $3,690 $12,280 $18,180 $3,820 -$130 $8,460 $14,360
13-14 $3,740 $12,450 $18,450 $3,900 -$160 $8,550 $14,550
14-15 $3,790 $12,710 $18,700 $3,940 -$150 $8,770 $14,760
15-16 $3,860 $12,850 $18,970 $3,850 $10 $9,000 $15,120
16-17 $3,870 $13,020 $19,090 $3,860 $10 $9,160 $15,230
17-18 $3,880 $13,180 $19,330 $4,130 -$250 $9,050 $15,200
18-19 $3,890 $13,220 $19,230 $4,160 -$270 $9,060 $15,070
19-20 $3,890 $13,340 $19,330 $4,460 -$570 $8,880 $14,870
20-21 $3,890 $13,400 $19,320 $4,460 -$570 $8,940 $14,860
21-22 $3,800 $13,130 $18,830 $4,460 -$660 $8,670 $14,370
�■ In 2021-22, first-time full-time students at public two-year college need to cover an estimated $8,670 in food and housing after grant aid, in addition to another $5,700 in allowances for books and supplies, transportation, and other personal expenses.
�■The average net tuition and fee price declined in this sector from 2006-07 through 2010-11, was stable between 2012-13 and 2016-17, and has been declining since 2016-17.
ALSO IMPORTANT:
�■Because of changes in the data sources used in calculating average grant aid per student, numbers in Figures CP-8, CP-9, and CP-10 are not strictly comparable with those in Trends in College Pricing 2019 and earlier editions.
�■The average net prices in Figure CP-8 are calculated among all first-time full-time undergraduate students in the public two-year sector, including those who did not receive grant aid. In 2019-20, 75% of first-time full-time undergraduate students in this sector received federal, state, or institutional grant aid.
�■The large increase in average grant aid shown in Figure CP-8 between 2008-09 and 2010-11 was primarily a result of increases in Pell Grant funding. Average Pell Grant per first-time full-time student in this sector almost doubled in this two-year period.
NOTE: Average net price is calculated as the difference between published price from College Board’s Annual Survey of Colleges and grant aid from IPEDS Student Financial Aid data. Because the latest year for which grant aid data are available is 2019-20, grant aid and net prices for 2020-21 and 2021-22 are projected by assuming per-student grant aid amounts are the same as in 2019-20 in constant dollars. Total grant aid in 2019-20 includes Higher Education Emergency Relief Fund distributed before June 30, 2020. Room and board expenses are estimated based on housing and food allowances for commuter students.
SOURCE: College Board, Annual Survey of Colleges; NCES, IPEDS Student Financial Aid data.

18For detailed data behind the graphs and additional information, please visit: research.collegeboard.org/trends.
Average Net Price: Public Four-YearBetween 2006-07 and 2021-22, the average net tuition and fee price paid by first-time full-time in-state students enrolled in public four-year institutions is lowest in 2021-22 at an estimated $2,640, after peaking in 2012-13 at $3,720 (in 2021 dollars).
FIGURE CP-9 Average Published and Net Prices in 2021 Dollars, First-Time Full-Time In-State Undergraduate Students at Public Four-Year Institutions, 2006-07 to 2021-22
$0
$5,000
$10,000
$15,000
$20,000
$25,000
$30,000
Published Tuition and Fees and Room and Board (TFRB)
PublishedTuition and Fees (TF)
Published Costof Attendance (COA)
Net COA
Grant Aid
Net TFRB
Net TF
Public Four-Year
06-07 09-10 12-13 15-16 18-19 21-22
Published TF
Published TFRB
Published COA
Grant Aid per Student Net TF Net TFRB Net COA
06-07 $7,730 $17,120 $21,870 $4,360 $3,370 $12,760 $17,510
07-08 $8,020 $17,580 $22,440 $4,730 $3,290 $12,850 $17,710
08-09 $8,240 $17,940 $22,910 $5,030 $3,210 $12,910 $17,880
09-10 $8,860 $19,090 $24,330 $5,920 $2,940 $13,170 $18,410
10-11 $9,410 $19,940 $25,120 $6,400 $3,010 $13,540 $18,720
11-12 $9,890 $20,510 $25,660 $6,260 $3,630 $14,250 $19,400
12-13 $10,130 $20,860 $26,010 $6,410 $3,720 $14,450 $19,600
13-14 $10,260 $21,210 $26,320 $6,640 $3,620 $14,570 $19,680
14-15 $10,390 $21,490 $26,570 $6,850 $3,540 $14,640 $19,720
15-16 $10,690 $22,190 $27,310 $7,020 $3,670 $15,170 $20,290
16-17 $10,830 $22,570 $27,630 $7,160 $3,670 $15,410 $20,470
17-18 $10,940 $22,800 $27,750 $7,540 $3,400 $15,260 $20,210
18-19 $10,930 $22,910 $27,750 $7,640 $3,290 $15,270 $20,110
19-20 $10,980 $23,080 $27,960 $8,100 $2,880 $14,980 $19,860
20-21 $10,980 $23,150 $27,970 $8,100 $2,880 $15,050 $19,870
21-22 $10,740 $22,690 $27,330 $8,100 $2,640 $14,590 $19,230
�■ In 2021-22, first-time full-time in-state students at public four-year colleges need to cover an estimated average of $14,590 in tuition and fees and room and board after grant aid, in addition to $4,640 in allowances for books and supplies, transportation, and other personal expenses.
�■Between 2006-07 and 2021-22, the average grant aid per first-time full-time in-state student at public four-year colleges increased by $3,740 in 2021 dollars, from $4,360 to an estimated $8,100; the average published tuition and fees in this sector increased by $3,010, from $7,730 to $10,740.
ALSO IMPORTANT:
�■Because of changes in the data sources used in calculating average grant aid per student, numbers in Figures CP-8, CP-9, and CP-10 are not strictly comparable with those in Trends in College Pricing 2019 and earlier editions.
�■ In 2019-20, the latest year for which detailed financial aid data are available from IPEDS, 49% of the total $8,100 (in 2021 dollars) in grant aid per first-time full-time in-state student in the public four-year sector came from institutional grant aid provided by colleges and universities in the form of discounts from their published prices.
�■The average net prices in Figure CP-9 are calculated among all first-time full-time undergraduate students in the public four-year sector, including those who did not receive grant aid. In 2019-20, 78% of first-time full-time undergraduate students in this sector received federal, state, or institutional grant aid.
NOTE: Average net price is calculated as the difference between published price from College Board’s Annual Survey of Colleges and grant aid from IPEDS Student Financial Aid data. Because the latest year for which grant aid data are available is 2019-20, grant aid and net prices for 2020-21 and 2021-22 are projected by assuming per-student grant aid amounts are the same as in 2019-20 in constant dollars. Total grant aid in 2019-20 includes Higher Education Emergency Relief Fund distributed before June 30, 2020.
SOURCE: College Board, Annual Survey of Colleges; NCES, IPEDS Student Financial Aid data.

19For detailed data behind the graphs and additional information, please visit: research.collegeboard.org/trends.
Average Net Price: Private Nonprofit Four-YearBetween 2006-07 and 2021-22, the average net tuition and fee price paid by first-time full-time students enrolled in private nonprofit four-year institutions is lowest in 2021-22 at an estimated $14,990.
FIGURE CP-10 Average Published and Net Prices in 2021 Dollars, First-Time Full-Time Undergraduate Students at Private Nonprofit Four-Year Institutions, 2006-07 to 2021-22
$0
$20,000
$10,000
$30,000
$40,000
$60,000
$50,000 Published Tuition and Fees and Room and Board (TFRB)
Net TFRB
Published Costof Attendance (COA)
Net COA
Grant Aid
PublishedTuition and Fees (TF)
Net TF
Private Nonprofit Four-Year
06-07 09-10 12-13 15-16 18-19 21-22
Published TF
Published TFRB
Published COA
Grant Aid per Student Net TF Net TFRB Net COA
06-07 $29,750 $40,670 $44,580 $13,210 $16,540 $27,460 $31,370
07-08 $30,360 $41,470 $45,450 $13,860 $16,500 $27,610 $31,590
08-09 $30,990 $42,200 $46,260 $15,060 $15,930 $27,140 $31,200
09-10 $32,250 $43,940 $48,190 $16,930 $15,320 $27,010 $31,260
10-11 $33,000 $44,960 $49,250 $17,610 $15,390 $27,350 $31,640
11-12 $33,320 $45,370 $49,720 $17,560 $15,760 $27,810 $32,160
12-13 $33,940 $46,190 $50,600 $18,140 $15,800 $28,050 $32,460
13-14 $34,770 $47,260 $51,680 $18,940 $15,830 $28,320 $32,740
14-15 $35,520 $48,200 $52,570 $19,540 $15,980 $28,660 $33,030
15-16 $36,680 $49,760 $54,200 $20,400 $16,280 $29,360 $33,800
16-17 $37,520 $50,790 $55,210 $21,070 $16,450 $29,720 $34,140
17-18 $38,060 $51,540 $55,870 $21,980 $16,080 $29,560 $33,890
18-19 $38,190 $51,690 $55,960 $22,550 $15,640 $29,140 $33,410
19-20 $38,780 $52,430 $56,750 $23,080 $15,700 $29,350 $33,670
20-21 $38,710 $52,530 $56,800 $23,080 $15,630 $29,450 $33,720
21-22 $38,070 $51,690 $55,800 $23,080 $14,990 $28,610 $32,720
�■ In 2021-22, first-time full-time students at private nonprofit four-year colleges need to cover an estimated average of $28,610 in tuition and fees and room and board after grant aid, in addition to $4,110 in allowances for books and supplies, transportation, and other personal expenses.
�■Between 2006-07 and 2021-22, the average grant aid per first-time full-time student at private nonprofit four-year colleges increased from $13,210 (in 2021 dollars) to an estimated $23,080; the average published tuition and fees in this sector increased from $29,750 to $38,070 during this time period.
ALSO IMPORTANT:
�■Because of changes in the data sources used in calculating average grant aid per student, numbers in Figures CP-8, CP-9, and CP-10 are not strictly comparable with those in Trends in College Pricing 2019 and earlier editions.
�■ In 2019-20, the latest year for which detailed financial aid data are available from IPEDS, 86% of the total $23,080 (in 2021 dollars) in grant aid per first-time full-time student in the private nonprofit four-year sector came from colleges and universities in the form of discounts from their published prices.
�■The average net prices in Figure CP-10 are calculated among all first-time full-time undergraduate students in the private nonprofit four-year sector, including those who did not receive grant aid. In 2019-20, 88% of first-time full-time undergraduate students in this sector received federal, state, or institutional grant aid.
NOTE: Average net price is calculated as the difference between published price from College Board’s Annual Survey of Colleges and grant aid from IPEDS Student Financial Aid data. Because the latest year for which grant aid data are available is 2019-20, grant aid and net prices for 2020-21 and 2021-22 are projected by assuming per-student grant aid amounts are the same as in 2019-20 in constant dollars. Total grant aid in 2019-20 includes Higher Education Emergency Relief Fund distributed before June 30, 2020.
SOURCE: College Board, Annual Survey of Colleges; NCES, IPEDS Student Financial Aid data.
20For detailed data behind the graphs and additional information, please visit: research.collegeboard.org/trends.
Institutional Revenues: State and Local FundingState and local funding for higher education tends to be cyclical. Historically, declines in state and local funding per student were followed by large percentage increases in tuition and fees in the public sector.
FIGURE CP-11A Annual Percentage Changes in Inflation-Adjusted Per-Student State and Local Funding for Higher Education and in Tuition and Fees at Public Institutions, 1989-90 to 2019-20
–15%
–10%
–5%
0%
5%
10%
15%
89-90 92-93 95-96 98-99 01-02 04-05 07-08 10-11 13-14 16-17 19-20
Perc
enta
ge C
hang
e
Tuition and Fees
Funding per FTE Student
FIGURE CP-11B Total and Per-Student State and Local Funding for Higher Education in 2019 Dollars and Public FTE Enrollment, 1989-90 to 2019-20
($)0
($)2
($)4
($)6
($)8
($)10
($)12
$0
$20
$40
$60
$80
$100
$120
89-90 92-93 95-96 98-99 01-02 04-05 07-08 10-11 13-14 16-17 19-20
Public FTE Enrollment (Millions)
Total Funding (Billions)
Public FTE Enrollment (in M
illions)and Funding per FTE Student
(in Thousands of 2019 Dollars)
Tota
l Fun
ding
(in
Billi
ons
of 2
019
Dol
lars
)
Funding per FTE (Thousands)
NOTE: Enrollment figures are fall FTE enrollments for public two-year and four-year institutions excluding medical students. Tuition and fees are the FTE enrollment-weighted average of the public two-year and four-year prices reported in Table CP-2. Funding is for both two-year and four-year institutions and includes tax revenues and other state and local funds for higher education, but not funding for capital expenditures.
SOURCE: College Board, Annual Survey of Colleges; NCES, Digest of Education Statistics, 2019, Table 307.10; State Higher Education Executive Offices Association (SHEEO), State Higher Education Finance (SHEF) reports; calculations by the authors.
�■Funding per student increased in 2019-20 (in inflation-adjusted dollars) for the eighth consecutive year, following four years of decline during and after the Great Recession of 2008.
�■After adjusting for inflation, total state and local funding was 2% higher in 2019-20 than it was in 2007-08, just before the Great Recession. However, funding per student was 4% lower in 2019-20 than it was in 2007-08 ($8,640 vs. $9,000).
ALSO IMPORTANT:
�■While the economic recession triggered by the pandemic caused some states to cut budgets (including funding for higher education) during fiscal year 2021, the outlook for fiscal year 2022 state funding for higher education was positive as the economy rebounded. (https://www.insidehighered .com/news/2021/08/10/after-year-cuts-state-funding-looks-positive-fiscal-2022)

21For detailed data behind the graphs and additional information, please visit: research.collegeboard.org/trends.
Institutional Revenues: State and Local FundingIn 2019-20, state and local funding for public higher education averaged $8,640 per full-time equivalent (FTE) student in the United States; it ranged from $3,800 in Vermont and $4,750 in New Hampshire to $19,580 in Alaska and $20,020 in Wyoming.
FIGURE CP-12 2019-20 State and Local Funding for Higher Education per Student and per $1,000 in Personal Income and 10-Year Percentage Changes in Inflation-Adjusted Funding per Student, by State
10-Y
ear P
erce
ntag
e C
hang
e in
Fun
ding
pe
r FTE
Stu
dent
2019-20 Funding per $1,000 in Personal Income
$0$0
$4
$8
$12
$4,000
$8,000
$12,000
$16$16,000
$20$20,000
2019
-20
Fund
ing
per F
TE S
tude
nt
4%
22%
–31%–36%
–28%
–20%–15%
–1%
44%
58%
32%
10%
44%
8%
–20%
0%
20%
40%
Funding per Public FTE Student
Funding per $1,000 in Personal Income
$18
,990
$
19,0
10
$8,
200
VT NH AZ PA OK
CO LA WV
OH
MS IN SC IA MT
VA KY MI
AL DE KS SD MO AR TX MN FL RI W
IO
RM
E UT NJ US ND WA ID NV NC TN GA NE MD
MA CA NY NM CT IL HI AK WY
$3,8
00
$4,7
50
$8,6
40
$19,
580
$20,
020
$5.0
9
Verm
ont
New
Ham
pshi
reAr
izona
Penn
sylv
ania
Okl
ahom
aCo
lora
doLo
uisi
ana
Wes
t Virg
inia
Ohi
oM
issi
ssip
piIn
dian
aSo
uth
Caro
lina
Iow
aM
onta
naVi
rgin
iaKe
ntuc
kyM
ichi
gan
Alab
ama
Dela
war
eKa
nsas
Sout
h Da
kota
Mis
sour
iAr
kans
asTe
xas
Min
neso
taFl
orid
aRh
ode
Isla
ndW
isco
nsin
Ore
gon
Mai
neUt
ahNe
w J
erse
yUn
ited
Stat
esNo
rth
Dako
taW
ashi
ngto
nId
aho
Neva
daNo
rth
Caro
lina
Tenn
esse
eGe
orgi
aNe
bras
kaM
aryl
and
Mas
sach
uset
tsCa
lifor
nia
New
Yor
kNe
w M
exic
oCo
n nec
ticut
Illino
isHa
wai
iAl
aska
Wyo
min
g
SOURCE: SHEEO, SHEF reports; Bureau of Economic Analysis, Annual State Personal Income 2019; calculations by the authors.
�■Between 2009-10 and 2019-20, total inflation-adjusted per-student state and local funding for higher education in the United States increased by 8%. Per-student state and local funding for higher education increased in 35 states, including 44% in Oregon and Wyoming and 58% in New Mexico.
�■Between 2009-10 and 2019-20, total inflation-adjusted per-student state and local funding for higher education declined in 15 states, including more than 30% in Arizona and Oklahoma.
ALSO IMPORTANT:
�■Percentage changes in per-student funding are affected by changes in both enrollment and total funding. For example, total state funding for higher education in Texas increased by 1% between 2009-10 and 2019-20. However, per-student funding in Texas declined by 15% because of a large increase in enrollment during this 10-year period.

22For detailed data behind the graphs and additional information, please visit: research.collegeboard.org/trends.
Institutional Revenues: Public InstitutionsNet tuition revenue per student accounted for 43% of total revenues at public doctoral universities in 2018-19—an increase from 33% in 2008-09 and 41% in 2013-14.
FIGURE CP-13 Institutional Revenues per Full-Time Equivalent (FTE) Student in 2018 Dollars at Public Institutions, 2008-09, 2013-14, and 2018-19
$0
$10,000
$20,000
$30,000
Reve
nue
in 2
018
Dol
lars
Federal Appropriations and Federal, State,and Local Grants and Contracts
State and Local Appropriations
Net Tuition Revenue
2008-09 2013-14 2018-19 2008-09 2013-14 2018-19 2008-09 2013-14 2018-19 2008-09 2013-14 2018-19
Public Doctoral Public Master’s Public Bachelor’s Public Associate
$9,350
$9,550
$9,180
$28,080
$11,610
$7,820
$8,630
$28,060
$12,330
$7,880
$8,800
$29,010
$6,640
$6,550
$2,030
$15,220
$8,010
$5,740
$1,900
$15,650
$8,060
$6,520
$2,270
$16,850
$5,020
$6,060
$2,030
$13,110
$5,770
$5,460
$1,940
$13,170
$5,760
$6,320
$2,190
$14,270
$2,940
$6,100
$1,620
$10,660
$3,620
$5,610
$1,490$10,720
$3,720
$7,030
$1,980
$12,730
Percentage of Institutional Revenues from Various Sources
Net Tuition Revenue
State and Local Appropriations
Federal Appropriations and Federal, State,
and Local Grants and Contracts
Public Doctoral
2008-09 33% 34% 33%
2013-14 41% 28% 31%
2018-19 43% 27% 30%
Public Master’s
2008-09 44% 43% 13%
2013-14 51% 37% 12%
2018-19 48% 39% 13%
Public Bachelor’s
2008-09 38% 46% 15%
2013-14 44% 41% 15%
2018-19 40% 44% 15%
Public Associate
2008-09 28% 57% 15%
2013-14 34% 52% 14%
2018-19 29% 55% 16%
NOTE: Net tuition revenue is the amount of revenue an institution takes in from tuition and fees, net of all institutional grant aid provided to students. Some of this revenue comes in the form of Pell Grants and other financial aid from federal and state governments and other sources. Institutional averages are weighted by 12-month FTE enrollments including both undergraduate and graduate students. Institution groupings are based on the 2018 Carnegie Classification. Percentages may not sum to 100 because of rounding.
SOURCE: NCES, IPEDS Finance and 12-Month Enrollment data, 2009, 2014 and 2019; calculations by the authors.
�■At other types of public institutions, net tuition as a share of total revenues declined between 2013-14 and 2018-19, after increasing during the previous five years.
�■ In 2018-19, per-student revenues from the combination of government sources and net tuition at public doctoral universities were more than double the amounts at public bachelor’s and two-year colleges. These per-student revenues were $29,010 at doctoral universities, $16,850 at master’s universities, $14,270 at bachelor’s colleges, and $12,730 at associate institutions in the public sector.
ALSO IMPORTANT:
�■Revenues from auxiliary enterprises such as residences, dining facilities, hospitals, and independent operations, not included in Figure CP-13, are usually dedicated to running those operations.

23For detailed data behind the graphs and additional information, please visit: research.collegeboard.org/trends.
Institutional Revenues and ExpendituresBetween 2013-14 and 2018-19, the average subsidy per full-time equivalent (FTE) student increased (after adjusting for inflation) at public associate and bachelor’s colleges as well as at all types of private nonprofit institutions.
FIGURE CP-14 Net Tuition Revenues, Subsidies, and Education and Related Expenditures per Full-Time Equivalent (FTE) Student in 2018 Dollars, 2008-09, 2013-14, and 2018-19
Educ
atio
n an
d Re
late
d Ex
pend
iture
s pe
r FTE
Stu
dent
(in
201
8 D
olla
rs)
$0
$10,000
$20,000
$40,000
$30,000
2008-09 2018-192013-14
Private NonprofitPublic
2008-09 2018-192013-14 2008-09 2018-192013-14 2008-09 2018-192013-14 2008-09 2018-192013-14
Doctoral Master’s2008-09 2018-192013-14
Bachelor’s2008-09 2018-192013-14
Associate Doctoral Master’s Bachelor’s
Net Tuition RevenueSubsidy
Education and Related Expenditures
$6,640 $8,010 $8,060$5,020 $5,770 $5,760
$2,940 $3,620 $3,720
$21,860 $23,320 $24,590
$15,100 $15,390 $14,960$17,300 $17,200 $16,790
$7,070$6,720 $6,560
$6,950 $6,820 $7,520
$6,350 $6,330 $7,440
$17,090$17,310
$19,650
$2,060 $2,490 $3,270
$10,410 $10,890 $13,130
$9,350$11,610 $12,330
$8,770$7,970 $7,940
$18,120$19,580 $20,270
$13,710$14,730 $14,620
$11,970 $12,590 $13,280
$9,290 $9,950$11,160
$38,950$40,630
$44,240
$17,160 $17,880 $18,230
$27,710 $28,090$29,920
Institutional Subsidy as a Percentage of Education and Related Expenditures
Public Private Nonprofit
Doctoral Master’s Bachelor’s Associate Doctoral Master’s Bachelor’s
2008-09 48% 52% 58% 68% 44% 12% 38%
2013-14 41% 46% 54% 64% 43% 14% 39%
2018-19 39% 45% 57% 67% 44% 18% 44%
NOTE: Institutional subsidy to students represents the portion of the cost of educating students not covered by net tuition revenue. Net tuition revenue is the amount of revenue an institution takes in from tuition and fees, net of all institutional grant aid provided to students. Some of this revenue comes in the form of Pell Grants and other financial aid from federal and state governments and other sources. Institutional averages are weighted by 12-month FTE enrollments including both undergraduate and graduate students. Institution groupings are based on the 2018 Carnegie Classification. The percentages in the table are not institutional discount rates, which represent institutional grant aid as a share of published tuition and fees.
SOURCE: NCES, IPEDS Finance and 12-Month Enrollment data, 2009, 2014, and 2019; calculations by the authors.
�■Education and related (E&R) expenditures include spending on instruction, student services, and the education share of spending on central academic and administrative support, as well as operations and maintenance. These expenditures can be considered institutional costs associated with providing education to students. A portion of these expenditures is covered by net tuition revenues from students and the remaining portion is a subsidy to students. In 2018-19, this subsidy as a share of the E&R expenditures ranged from 18% at private nonprofit master’s institutions to 67% at public associate colleges.
�■ In 2018-19, the E&R expenditures per FTE student ranged from $11,160 at public associate colleges to $44,240 at private nonprofit doctoral universities.
ALSO IMPORTANT:
�■Because of differences in enrollment of graduate students and level of research activity, per-student revenues and expenditures at different types of institutions are difficult to compare.
�■ In addition to the amounts included in E&R expenditures, institutional budgets include expenditures for other purposes such as research, public service, and auxiliary enterprises.

24For detailed data behind the graphs and additional information, please visit: research.collegeboard.org/trends.
Family IncomeBetween 1990 and 2020, the average income increased by 57% for the top quintile of families and by 12% for the lowest quintile of families.
FIGURE CP-15A Mean Family Income in 2020 Dollars by Quintile, 1990, 2000, 2010, and 2020
Mea
n Fa
mily
Inco
me
$0
$100,000
$200,000
$500,000
$400,000
$300,000
Lowest 20% Second 20% Third 20% Fourth 20% Highest 20% Top 5%
1990 2000 2010 2020
$18,940$44,180
$21,260$52,330 $68,040
$84,680$97,850
$130,150
$181,840
$286,390 $285,320
$497,660
Lowest
20% Second
20%Third 20%
Fourth 20%
Highest 20%
Top 5%
$ Change from 1990 to 2020 $2,320 $8,150 $16,640 $32,300 $104,550 $212,340
% Change from 1990 to 2020 12% 18% 24% 33% 57% 74%
2020 Income Bracket$38,050
or less$38,051 to
$67,500$67,501 to
$103,304$103,305 to
$164,007$164,008
or More$305,824
or More
2020 Mean Income $21,260 $52,330 $84,680 $130,150 $286,390 $497,660
FIGURE CP-15B Median Family Income by Selected Characteristics, 2020
$130,140$82,740
$73,290$60,580
$40,020
$68,070$99,280
$105,390$92,240
$71,790$48,440
$96,170$59,980
$57,480$109,450
$89,540$76,480
$96,390$85,830
$0 $20,000 $40,000 $60,000 $80,000 $100,000 $120,000
Bachelor’s Degree or HigherAssociate Degree
Some CollegeHigh School
Less Than High School
65 and over55 to 6445 to 5435 to 4425 to 3415 to 24
White Alone, Non-HispanicHispanic
Black Alone, Non-HispanicAsian Alone, Non-Hispanic
WestSouth
NortheastMidwest
Education
Age
Race/Ethnicity
Region
2020 Median Family Income (Median of All Families = $84,010)
SOURCE: U.S. Census Bureau, Current Population Survey, 2020 Annual Social and Economic Supplement, Table F-1, Table F-3, Table F-5, and FINC-01; calculations by the authors.
�■ In 2020, average incomes ranged from $21,260 for the lowest quintile to $286,390 for the highest quintile and $497,660 for the top 5% of families.
�■ In 2020, the median income of families headed by individuals ages 45 to 54—the age bracket of parents of most traditional-age college students—was 25% higher than the overall median ($105,390 compared with $84,010).
�■ In 2020, the $130,140 median family income of families with at least one four-year college graduate was more than twice the median for families headed by a high school graduate ($60,580).
ALSO IMPORTANT:
�■The share of all income going to the 20% of families with the lowest incomes declined from 4.6% in 1990 to 3.7% in 2020. The share of income going to the top 5% of families increased from 17.4% in 1990 to 21.6% in 2020. (U.S. Census Bureau, Table F-2)

25For detailed data behind the graphs and additional information, please visit: research.collegeboard.org/trends.
Enrollment Patterns over TimeBetween fall 2019 and 2020, total enrollment fell by 631,000 (3%). The public two-year sector saw the largest decline in enrollment—581,000 (9%). Total enrollment at the public four-year and private nonprofit four-year sectors declined by 0.7% while it increased by 33,000 (3%) at for-profit institutions.
FIGURE CP-16 Postsecondary Fall Enrollment by Attendance Status and Level of Enrollment, 2000 to 2020, Selected Years
AllGraduate
Part-Time Undergraduate
Full-Time Undergraduate
74%
16%
54%
57%
64%
66%
63%
35%
41%
35%
15%
23%25%
12%
13%
16%
15%
17%
65%
59%
65%
34%
29%
20%
20%
20%
1,024,000
450,000
3,986,000
3,051,000
7,665,000
7,194,000
6,055,000
6,202,000
7,945,000
5,697,000
0 1 2 3 4 5 6 7 8
Enrollment (Millions)
63% 2,023,000
52%
Publ
ic T
wo-
Year
2020 (5%)
23%25%
991,00051%2019 (5%)
2010 (10%)
2000 (3%)
2020 (21%)
55% 12% 33% 4,015,0002019 (21%)
2010 (18%)
2000 (20%)
2020 (41%)
2010 (35%)
2000 (40%)
2020 (33%)
35% 65% 6,783,0002019 (35%)
2010 (38%)
2000 (37%)
For-
Profi
tPr
ivat
e N
onpr
ofit
Four
-Yea
rPu
blic
Fou
r-Yea
r
23%
57% 10% 33% 3,686,000
65% 16% 19% 7,718,0002019 (40%)
NOTE: Includes degree-granting Title-IV institutions. Percentages on the vertical axis represent the enrollment in each sector as a percentage of total enrollment. Four-year institutions include only those where more than 50% of degrees/certificates awarded are bachelor’s degree or higher. Percentages may not sum to 100 because of rounding.
SOURCE: NCES, IPEDS Fall Enrollment data, 2000, 2010, 2019, and 2020; calculations by the authors.
�■Total undergraduate enrollment (including full-time and part-time students) fell by 698,000 (4%) between fall 2019 and fall 2020; total graduate student enrollment rose by 67,000.
�■The share of public two-year college students enrolled full time rose from 35% in fall 2000 to 41% in 2010 but then declined to 35% again in 2020.
�■Despite the sharp decline in enrollment in the for-profit sector between 2010 and 2019, there were more than twice as many students enrolled in 2020 (1,024,000) as in 2000 (450,000).
�■ In the for-profit sector, graduate students rose from 10% of all students in fall 2000 to 15% in 2010 and 23% in 2020.
ALSO IMPORTANT:
�■Students enrolled in non-degree-granting institutions, not included in Figure CP-16, may be eligible for federal student aid if they are working toward certificates at accredited institutions. Some students enrolled in degree-granting institutions are not eligible for federal student aid because they are enrolled in non-credit-bearing programs.
Total Postsecondary Enrollment (in Millions)
Year Enrollment (in millions)
2000 15.3
2010 20.8
2019 19.5
2020 18.9

26For detailed data behind the graphs and additional information, please visit: research.collegeboard.org/trends.
Public Undergraduate Enrollment by StateBetween fall 2019 and fall 2020, total full-time equivalent (FTE) undergraduate enrollment declined by 66,640 (1%) in the public four-year sector and by 323,440 (8%) in the public two-year sector.
FIGURE CP-17A One-Year Percentage Change in Full-Time Equivalent (FTE) Undergraduate Enrollment at Public Four-Year Institutions by State, Fall 2019 to Fall 2020
-9%-6% -1%
2%2%
17%
0%
10%
20%
Perc
enta
ge C
hang
e
Alas
kaW
yom
ing
Verm
ont
Idah
oM
onta
naKa
nsas
Iow
aM
isso
uri
Colo
rado
New
Mex
ico
Ore
gon
New
Ham
pshi
reM
issi
ssip
piM
ichi
gan
Arka
nsas
Mas
sach
uset
tsM
inne
sota
Wes
t Virg
inia
Sout
h Da
kota
Was
hing
ton
North
Dak
ota
Wis
cons
inPe
nnsy
lvan
iaM
aine
Ohi
oDe
law
are
Conn
ectic
utAl
abam
aO
klah
oma
Illino
isNe
w J
erse
yKe
ntuc
kyM
aryl
and
New
Yor
kUn
ited
Stat
esSo
uth
Caro
lina
Rhod
e Is
land
Indi
ana
Tenn
esse
eVi
rgin
iaNo
rth C
arol
ina
Calif
orni
aTe
xas
Nebr
aska
Neva
daLo
uisi
ana
Geor
gia
Utah
Haw
aii
Flor
ida
Arizo
na
FIGURE CP-17B One-Year Percentage Change in Full-Time Equivalent (FTE) Undergraduate Enrollment at Public Two-Year Institutions by State, Fall 2019 to Fall 2020
-16% -8%3%
0%
10%
Perc
enta
ge C
hang
e
-10%
New
Mex
ico
Arizo
naAl
abam
aW
est V
irgin
iaO
rego
nNe
w H
amps
hire
Illino
isCo
nnec
ticut
Indi
ana
New
Jer
sey
Mas
sach
uset
tsTe
nnes
see
Mic
higa
nM
aine
Penn
sylv
ania
New
Yor
kKa
nsas
Geor
gia
Loui
sian
aW
ashi
ngto
nW
isco
nsin
Calif
orni
aAr
kans
asKe
ntuc
kyCo
lora
doM
onta
naNe
vada
Flor
ida
Unite
d St
ates
Wyo
min
gM
issi
ssip
piSo
uth
Caro
lina
Mis
sour
iM
inne
sota
Iow
aHa
wai
iRh
ode
Isla
ndNo
rth C
arol
ina
Nebr
aska
Mar
ylan
dNo
rth D
akot
aVi
rgin
iaVe
rmon
tAl
aska
Okl
ahom
aSo
uth
Dako
taId
aho
Dela
war
eUt
ahTe
xas
Ohi
o
NOTE: Two-year institutions are defined as institutions where more than 50% of degrees/certificates awarded are associate degrees or certificates, even if they award some bachelor’s degrees.
SOURCE: NCES, IPEDS Fall Enrollment data, 2019 and 2020; calculations by the authors.
�■ In the public four-year sector, nine states saw increases in FTE undergraduate enrollment between fall 2019 and fall 2020. Alaska, Wyoming, and Vermont experienced the largest declines.
�■ In the public two-year sector, all states (except Ohio) saw declines in FTE undergraduate enrollment between fall 2019 and fall 2020. Twenty-two states had declines in enrollment of 10% or more.
ALSO IMPORTANT:
�■Between 2019 and 2020, twenty states saw declines in both full-time and part-time undergraduate enrollment at public four-year institutions, while 44 states experienced these declines at public two-year institutions.

27For detailed data behind the graphs and additional information, please visit: research.collegeboard.org/trends.
Enrollment by Race/EthnicityAmong undergraduates who are Black, Hispanic, or Native, larger shares attend public two-year than public four-year institutions. White and Asian students are more likely to be enrolled at public four-year than at public two-year institutions.
FIGURE CP-18A Distribution of Undergraduate Enrollment by Sector Within Race/Ethnicity, Fall 2020
All
American Indian/Alaska Native (1%)
Asian (7%)
Black (13%)
Hispanic (22%)
Native Hawaiian/Other Pacific Islander
(<1%)
Public Two-Year Public Four-Year Private Nonprofit Four-Year For-Profit
White (53%)
Two or More Races(4%)
3%
40%
52%
35%
40%
52%
44%
36%
39%
31%
47%
35%
34%
27%
41%
16%
10%
15%
15%
10%
18%
19%
5%
6%
10%
4%
12%
4%
38% 41% 16% 5%
NOTE: Includes degree-granting Title IV postsecondary institutions. Nonresident aliens and “unknown” categories are excluded. Four-year institutions include only those where more than 50% of degrees/certificates awarded are bachelor’s degree or higher. Percentages may not sum to 100 because of rounding.
SOURCE: NCES, IPEDS Fall Enrollment data, 2020; calculations by the authors.
FIGURE CP-18B Distribution of Undergraduate Enrollment by Race/Ethnicity Within Sectors, Fall 2020
All
Public Two-Year (42%)
Public Four-Year (37%)
Private NonprofitFour-Year (16%)
American Indian/Alaska Native Asian Black Hispanic
White Two or More RacesNative Hawaiian/Other Pacific Islander
For-Profit (5%)
7% 13% 22% 53% 4%
6% 13% 28% 47% 4%
9% 12% 19% 56% 5%
7% 12% 14% 62% 4%
4% 28% 21% 41% 4%
NOTE: Includes degree-granting Title IV postsecondary institutions. Nonresident aliens and “unknown” categories are excluded. Four-year institutions include only those where more than 50% of degrees/certificates awarded are bachelor’s degree or higher. Percentages may not sum to 100 because of rounding.
SOURCE: NCES, IPEDS Fall Enrollment data, 2020; calculations by the authors.
�■ In fall 2020, 52% of Hispanic and American Indian/Alaska Native undergraduate students were enrolled in public two-year colleges, between 35% and 44% of members of other racial/ethnic groups attended these institutions.
�■ In fall 2020, 12% of Native Hawaiian/Other Pacific Islander and 10% of Black undergraduates attended for-profit institutions—more than twice the share of Asian, White, or Hispanic undergraduates enrolled in this sector.
�■ In fall 2020, the share of undergraduates who are White ranged from 41% at for-profit institutions to 62% at private nonprofit four-year institutions.
ALSO IMPORTANT:
�■Racial differences in the sectors students are most likely to enroll in are partially a function of geography.

28For detailed data behind the graphs and additional information, please visit: research.collegeboard.org/trends.
International EnrollmentBetween 2019 and 2020, all types of institutions saw declines in the number of international students; international enrollment decreased from 402,680 to 352,040 (13%) at public doctoral institutions and from 234,520 to 207,290 (12%) at private nonprofit doctoral institutions.
FIGURE CP-19 Total Number of Undergraduate and Graduate Students Who Were Not U.S. Citizens or Permanent Residents by Institution Type, 2009, 2019, and 2020
32,750
0 100,000 200,000 300,000 400,000
Enrollment
Bach
elor
’s
Publ
ic
2020
Mas
ter’s
2020
Doc
tora
l
2020
Asso
ciat
e
2020
Doc
tora
l
Priv
ate
Nonp
rofit
2020
Mas
ter’s
2020
Bach
elor
’s
2020
173,600
51,250
79,48079,480
2019
2009 100,920
99,120
100,920
99,120
71,880
178,440
135,410
352,040
2019
2009 101,660
202,630
157,020
200,050
258,680
402,680
66,450
2019
2009 46,620
62,220
63,600
79,660
9,600
2019
2009 8,980
10,460
207,290
2019
2009 46,210
80,970
91,860
153,550
138,070
234,520
45,610
34,240
2019
2009
33,450
20,280
34,970
19,340
33,450
20,28019,340
22,6802019
2009 31,600
52,140
19,040
27,400
GraduateUndergraduate
NOTE: Institution groupings are based on the 2018 Carnegie Classification.
SOURCE: NCES, IPEDS Fall Enrollment data, 2009, 2019 and 2020; calculations by the authors.
�■At public doctoral institutions, the total number of undergraduate international students almost doubled between 2009 and 2019 (from 101,660 to 202,630), but fell to 173,600 (14%) in 2020. The total number of graduate international students increased by 27% between 2009 and 2019 (from 157,020 to 200,050), but declined to 178,440 (11%) in 2020.
�■At private nonprofit doctoral institutions, the total number of undergraduate international students increased by 75% between 2009 and 2019 (from 46,210 to 80,970), but fell to 71,880 (11%) in 2020. The total number of graduate international students increased by 67% between 2009 and 2019 (from 91,860 to 153,550), but declined to 135,410 (12%) in 2020.
Percentage of Undergraduate and Graduate Students Who Were Not U.S. Citizens or Permanent Residents, by Institution Type, 2009, 2019, and 2020
Undergraduate Graduate
2009 2019 2020 2009 2019 2020
Public
Doctoral 3% 5% 4% 15% 18% 16%
Master’s 3% 3% 3% 5% 6% 5%
Bachelor’s 2% 2% 2% 3% 2% 1%
Associate 1% 2% 1% ― ― ―
Private
Doctoral 5% 8% 7% 14% 20% 17%
Master’s 2% 3% 2% 4% 7% 7%
Bachelor’s 4% 6% 6% 4% 5% 5%

29For detailed data behind the graphs and additional information, please visit: research.collegeboard.org/trends.
Enrollment in Distance Education CoursesBecause of the COVID-19 pandemic, the majority of colleges and universities shifted classes online in 2020. As a result, the share of postsecondary students enrolled in distance education courses increased dramatically between fall 2019 and 2020.
FIGURE CP-20 Percentage of Postsecondary Students Enrolled in Distance Education Courses, Fall 2012, Fall 2019, and Fall 2020
0%
20%
40%
60%
100%
80%
All Courses At Least One, But Not All Courses
11% 15%
15%
22%26%
36%
5% 10%
16%
26%22%
36%
10% 15%
17%
22%27%
37%
10%17%
7%
11%16%
28%
46%55%
8%
12%54%
68%
22%33%
8%
10%30%
42%
15%27%
10%
10%24%
37%
17%30%
6%
10%
23%
40%77%
87%
5%
5%82%
91%
2012 2019 2020 2020 2020 2020 2020 2020 2020 2020 2020
All2012 2019
Public Four-Year
2012 2019
Public Two-Year
Undergraduate Graduate
2012 2019
PrivateNonprofitFour-Year
2012 2019
For-Profit2012 2019
All2012 2019
PublicFour-Year
2012 2019
PrivateNonprofitFour-Year
2012 2019
For-Profit
44%
30%
75%
44%
37%
81%
48%
23%
70%
34%
30%
64%
60%
14%
74%
52%
19%
71%
48%
22%
70%
49%
18%
67%
89%
4%94%
NOTE: Components may not sum to totals because of rounding.
SOURCE: NCES, Digest of Education Statistics, 2013 and 2020, Table 311.15; IPEDS Fall Enrollment data, 2020; calculations by the authors.
�■ In fall 2020, 75% of undergraduate students and 71% of graduate students enrolled in distance education courses, compared with 36% of undergraduate and 42% of graduate students in fall 2019.
�■ In 2020, 44% of undergraduate students and 52% of graduate students were enrolled in distance education courses exclusively.
�■ In 2020, the share of undergraduate students enrolled in distance education courses ranged from 64% in the private nonprofit four-year sector to 81% in the public four-year sector.
�■Across sectors, the for-profit sector has the highest percentages of students taking courses exclusively online. In 2020, 60% of undergraduate and 89% of graduate students in this sector took all of their courses online.
ALSO IMPORTANT:
�■ In fall 2020, 44% of colleges and universities were either fully or primarily online, 21% were hybrid, and 27% were either fully or primarily in person (https://www.chronicle.com/article/heres-a-list-of-colleges-plans-for-reopening-in-the-fall/).
�■Although research is scant on the long-term impact of online learning, there is some evidence that suggests earnings of students at for-profit colleges where most students are exclusively online are lower than earnings of students at other for-profit schools. (Cellini and Turner, 2018, Gainfully Employed? Assessing the Employment and Earnings of For-Profit College Students Using Administrative Data)

TRENDS IN HIGHER EDUCATION SERIES
Trends in Student Aid
2021

For detailed data behind the graphs and additional information, please visit: research.collegeboard.org/trends. 31
Total Student AidIn 2020-21, undergraduate and graduate students received a total of $234.9 billion in student aid in the form of grants, Federal Work-Study, federal loans, and federal tax credits.
TABLE SA-1 Total Student Aid and Nonfederal Loans in 2020 Dollars (in Millions), Undergraduate and Graduate Students Combined, 1990-91 to 2020-21, Selected Years
Academic Year
90-91 00-01 10-11 15-16 16-17 17-18 18-19 19-20Preliminary
20-2110-Year
% Change30-Year
% Change
Federal Aid
Grants
Pell Grants $9,773 $11,958 $42,345 $31,185 $29,001 $30,273 $29,277 $28,769 $25,967 -39% 166%FSEOG $907 $933 $899 $801 $791 $774 $866 $850 $865 -4% -5%LEAP $117 $60 $73 — — — — — — — —Academic Competitiveness Grants — — $657 — — — — — — — —SMART Grants — — $514 — — — — — — — —Veterans’ Benefits $1,347 $1,970 $11,667 $13,788 $12,988 $12,322 $12,302 $11,610 $11,262 -3% 736%Total Federal Grants $12,143 $14,921 $56,154 $45,774 $42,780 $43,369 $42,445 $41,230 $38,094 -32% 214%
LoansPerkins Loans $1,724 $1,720 $1,017 $1,141 $956 $666 — — — — —Subsidized $17,342 $24,623 $48,202 $25,066 $23,350 $22,075 $20,424 $19,075 $16,278 -66% -6%Unsubsidized — $19,700 $56,000 $55,387 $53,828 $51,495 $49,389 $48,210 $45,776 -18% —Parent PLUS $1,632 $5,548 $12,571 $13,062 $13,552 $13,459 $13,181 $12,506 $9,999 -20% 513%Grad PLUS — — $8,260 $9,656 $10,401 $10,870 $11,069 $11,353 $11,624 41% —Total Federal Loans $20,698 $51,591 $126,049 $104,312 $102,087 $98,564 $94,062 $91,143 $83,677 -34% 304%
Federal Work-Study $1,190 $1,398 $1,156 $1,072 $1,058 $1,036 $1,165 $1,144 $1,180 2% -1%Education Tax Benefits $0 $6,930 $25,490 $18,750 $17,250 $15,380 $13,850 $12,550 $11,440 -55% —
Total Federal Aid $34,031 $74,840 $208,850 $169,907 $163,175 $158,349 $151,522 $146,067 $134,390 -36% 295%State Grants $3,820 $7,035 $10,970 $11,726 $11,850 $12,603 $12,739 $13,117 $12,887 17% 237%Institutional Grants $12,139 $24,408 $45,488 $59,688 $62,441 $65,273 $67,518 $69,754 $71,097 56% 486%Private and Employer Grants $4,000 $8,790 $15,770 $16,890 $17,100 $17,460 $17,560 $17,450 $16,520 5% 313%Total Federal, State,
Institutional, and Other Aid $53,989 $115,074 $281,078 $258,211 $254,566 $253,685 $249,339 $246,388 $234,894 -16% 335%Nonfederal Loans — $7,700 $9,100 $11,700 $12,200 $12,600 $13,500 $14,600 $12,200 34% —Total Student Aid and Nonfederal Loans $53,989 $122,774 $290,178 $269,911 $266,766 $266,285 $262,839 $260,988 $247,094 -15% 358%
NOTE: Table SA-1 does not include the Higher Education Emergency Relief Fund, a variety of small federal grant and loan programs, as well as some small programs for veterans and members of the military. Federal Supplemental Educational Opportunity Grant (FSEOG) and Federal Work-Study funds reflect federal allocations and do not include the required matching funds from institutions. Tax benefits, private and employer grants, and nonfederal loans are estimated. 2020-21 institutional grant aid and state grant aid data are estimated. Components may not sum to totals because of rounding.
SOURCE: See page 51 for a list of sources for data included in Table SA-1.
�■ The federal government’s share of total student aid decreased from 74% in 2010-11 to 57% in 2020-21.
�■ Between 2010-11 and 2020-21, total grant aid for postsecondary students rose by 8% (in inflation-adjusted dollars) to $138.6 billion. Institutional grants grew most rapidly, increasing by 56% to an estimated $71.1 billion.
�■ Between 2010-11 and 2020-21, total federal loans declined by 34% (in inflation-adjusted dollars) to $83.7 billion.
ALSO IMPORTANT:
�■ In 2020-21, undergraduate students received 75% ($175.1 billion) of total student aid, including 96% of all federal grants and 53% of federal loans. They received 86% of total grant aid from all sources and 58% of all loans, including nonfederal loans. The remainder of the aid funded graduate students. (Table SA-1 online)
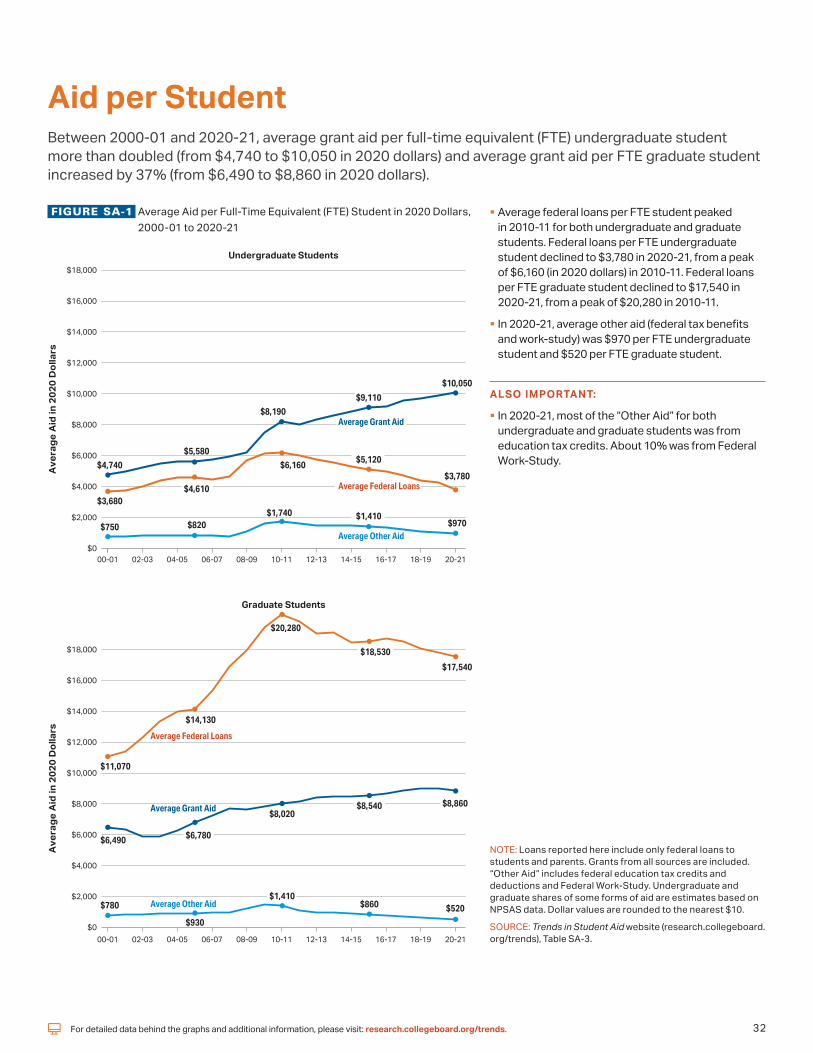
32For detailed data behind the graphs and additional information, please visit: research.collegeboard.org/trends.
Aid per StudentBetween 2000-01 and 2020-21, average grant aid per full-time equivalent (FTE) undergraduate student more than doubled (from $4,740 to $10,050 in 2020 dollars) and average grant aid per FTE graduate student increased by 37% (from $6,490 to $8,860 in 2020 dollars).
FIGURE SA-1 Average Aid per Full-Time Equivalent (FTE) Student in 2020 Dollars, 2000-01 to 2020-21
$0
$2,000
$4,000
$6,000
$8,000
$10,000
$12,000
$14,000
$16,000
$18,000
Ave
rage
Aid
in 2
020
Dol
lars
Undergraduate Students
Average Grant Aid
Average Other Aid
Average Federal Loans
00-01 02-03 04-05 06-07 08-09 10-11 12-13 14-15 16-17 18-19 20-21
$4,740$5,580
$8,190$9,110
$10,050
$3,680$4,610
$6,160 $5,120
$3,780
$750 $820$1,740 $1,410
$970
$0
$2,000
$4,000
$6,000
$8,000
$10,000
$12,000
$14,000
$16,000
$18,000
Average Grant Aid
Average Other Aid
Average Federal Loans
00-01 02-03 04-05 06-07 08-09 10-11 12-13 14-15 16-17 18-19 20-21
Graduate Students
$6,490 $6,780
$8,020$8,540 $8,860
$11,070
$14,130
$20,280
$18,530
$17,540
$780
$930
$1,410$860 $520
Ave
rage
Aid
in 2
020
Dol
lars
$0
$2,000
$4,000
$6,000
$8,000
$10,000
$12,000
$14,000
$16,000
$18,000
Ave
rage
Aid
in 2
020
Dol
lars
Undergraduate Students
Average Grant Aid
Average Other Aid
Average Federal Loans
00-01 02-03 04-05 06-07 08-09 10-11 12-13 14-15 16-17 18-19 20-21
$4,740$5,580
$8,190$9,110
$10,050
$3,680$4,610
$6,160 $5,120
$3,780
$750 $820$1,740 $1,410
$970
�■ Average federal loans per FTE student peaked in 2010-11 for both undergraduate and graduate students. Federal loans per FTE undergraduate student declined to $3,780 in 2020-21, from a peak of $6,160 (in 2020 dollars) in 2010-11. Federal loans per FTE graduate student declined to $17,540 in 2020-21, from a peak of $20,280 in 2010-11.
�■ In 2020-21, average other aid (federal tax benefits and work-study) was $970 per FTE undergraduate student and $520 per FTE graduate student.
ALSO IMPORTANT:
�■ In 2020-21, most of the “Other Aid” for both undergraduate and graduate students was from education tax credits. About 10% was from Federal Work-Study.
NOTE: Loans reported here include only federal loans to students and parents. Grants from all sources are included. “Other Aid” includes federal education tax credits and deductions and Federal Work-Study. Undergraduate and graduate shares of some forms of aid are estimates based on NPSAS data. Dollar values are rounded to the nearest $10.
SOURCE: Trends in Student Aid website (research.collegeboard.org/trends), Table SA-3.

For detailed data behind the graphs and additional information, please visit: research.collegeboard.org/trends. 33
Grants, Loans, and Other AidLoans (including both federal and nonfederal) fell from 40% of the funds undergraduate students used to supplement their own and their family resources in 2010-11 to 30% in 2020-21.
FIGURE SA-2 Composition of Total Aid and Nonfederal Loans, 2000-01 to 2020-21
4% 5%
33%
26%32%
2%
63%69%
66%
10%6%
30%
64%
40%
49%
Grants
Loans
Other Aid
Undergraduate Students
Graduate Students
Perc
enta
ge o
f Tot
al F
unds
0%
20%
40%
60%
80%
100%
Other Aid
Loans
Grants
Perc
enta
ge o
f Tot
al F
unds
0%
20%
40%
60%
80%
100%
20-2118-1916-1714-1512-1310-1108-0906-0704-0502-0300-01
20-2118-1916-1714-1512-1310-1108-0906-0704-0502-0300-01
49%
44%
8%
NOTE: Nonfederal loans are included to show the total education borrowing by students and parents. “Other Aid” includes Federal Work-Study and federal education tax credits and deductions. Percentages may not sum to 100 because of rounding.
SOURCE: Trends in Student Aid website (research.collegeboard.org/trends), Table SA-4.
�■ Grants rose from 49% of total funding in 2010-11 to 64% in 2020-21 for undergraduate students.
�■ Between 2000-01 and 2020-21, loans consistently made up 63% to 70% of the funds graduate students used to supplement their own resources to finance their studies.
�■ Grants have been the source of 26% to 33% of funding for graduate students over this 20-year period.
�■ In 2020-21, the combination of federal tax benefits and Federal Work-Study made up 6% of all student aid and nonfederal loans for undergraduate students and 2% for graduate students.
ALSO IMPORTANT:
�■ For undergraduate students, total grant aid increased by 6% and total loan volume fell by 40% between 2010-11 and 2020-21, after adjusting for inflation. (Table SA-1 online)
�■ For graduate students, total grant aid increased by 19% and total loan volume fell by 7% between 2010-11 and 2020-21. (Table SA-1 online)

34For detailed data behind the graphs and additional information, please visit: research.collegeboard.org/trends.
Total Undergraduate Student AidTotal financial aid for undergraduate students peaked in 2010-11 ($219.7 billion in 2020 dollars) and declined to $175.1 billion in 2020-21.
FIGURE SA-3 Total Undergraduate Student Aid in 2020 Dollars by Source and Type (in Billions), 2000-01 to 2020-21
$50
$100
$150
Billi
ons
of 2
020
Dol
lars
$200
Federal Veterans’Benefits
Institutional Grants
Private andEmployer Grants
Federal Loans
Federal EducationTax Benefits
FWS and FSEOG
$013% 15% 16% 15% 15% 14% 13% 14% 14%
18% 19% 18% 17% 17% 17% 16% 15% 16% 15% 15% 15%
4%5%
5% 6% 6% 6% 6% 6% 5% 6% 5% 5%
8% 8% 8% 7% 7% 7% 8% 7%6%
5%
5%5% 5% 5% 6% 6% 6% 6% 7% 7% 7%
21%19%
18% 19% 19% 20% 21% 21%18%
16%
16% 18% 20% 21% 23% 24% 26% 27% 29% 30% 33%
7%7%
7%7% 7% 7% 7%
7%6%
5%
5% 5% 5% 6% 6% 6% 7%7% 7% 7% 7%
40%39%
40%41%
42% 42% 41%41%
44%
40%
38% 38% 37% 36% 34% 33% 32% 30% 29% 28%26%
7%7%
7%
7%7% 7% 6%
6%
8%
10%
10%10%
9% 9% 9% 9%8% 7%
7% 6%
6%
$88.6$95.7
$105.8
$116.4$122.4 $124.2 $125.8
$133.3
$159.9
$202.3
$219.7$213.2
$207.3 $205.3$201.8 $199.5
$194.7 $193.6$189.4 $186.4
$175.1
00-01 01-02 02-03 03-04 04-05 05-06 06-07 07-08 08-09 09-10 10-11 11-12 12-13 13-14 14-15 15-16 16-17 17-18 18-19 19-20 20-21
Federal Pell Grants
State Grants
NOTE: Percentages may not sum to 100 because of rounding.
SOURCE: Trends in Student Aid website (research.collegeboard.org/trends), Table SA-1 online.
�■ Between 2010-11 and 2020-21, institutional grant aid increased by 62% ($22.0 billion in 2020 dollars).
�■ Between 2010-11 and 2020-21, federal loans declined by 47% ($39.4 billion in 2020 dollars) and federal Pell Grants declined by 39% ($16.4 billion in 2020 dollars).
ALSO IMPORTANT:
�■ Between 2010-11 and 2020-21, undergraduate enrollment decreased by 13% while total grant aid to undergraduate students increased by 6% and total aid (including grants, loans, and other aid) decreased by 20%. Over this decade, average grant aid per undergraduate student increased by 23% ($1,860) and average total aid per undergraduate student decreased by 8% ($1,290). (Table SA-3 online)
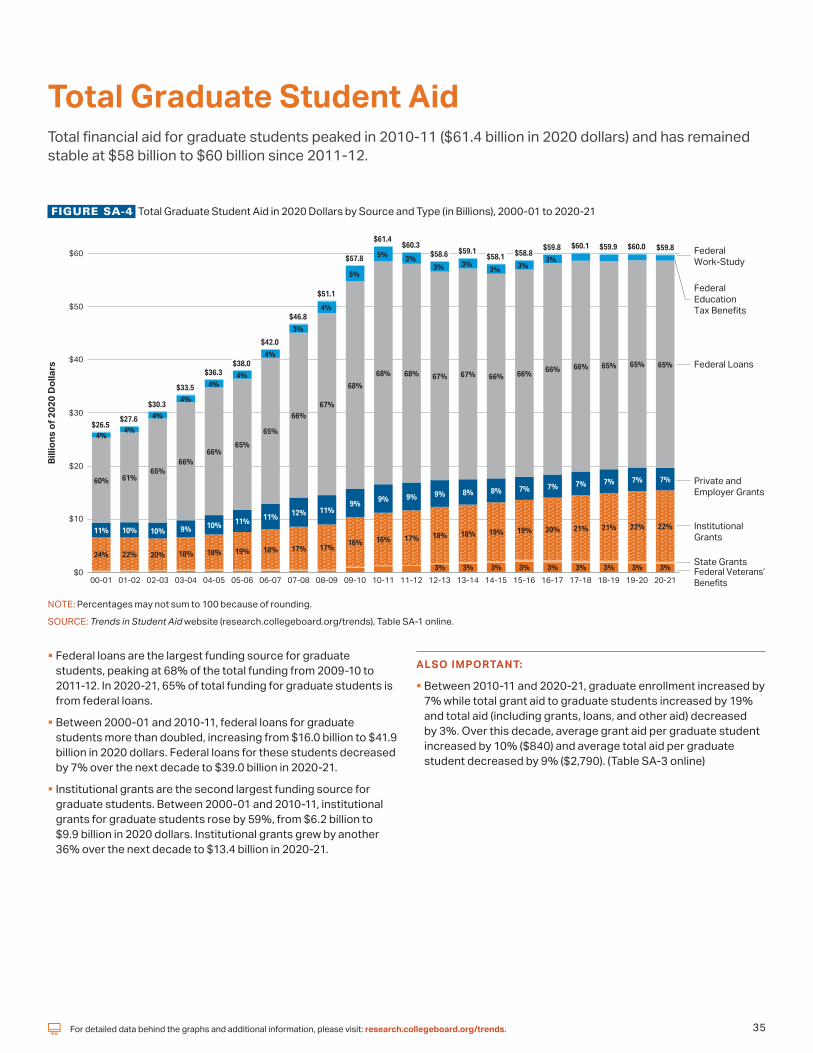
For detailed data behind the graphs and additional information, please visit: research.collegeboard.org/trends. 35
Total Graduate Student AidTotal financial aid for graduate students peaked in 2010-11 ($61.4 billion in 2020 dollars) and has remained stable at $58 billion to $60 billion since 2011-12.
FIGURE SA-4 Total Graduate Student Aid in 2020 Dollars by Source and Type (in Billions), 2000-01 to 2020-21
$0
$10
$20
$30
$40
$50
$60
Billi
ons
of 2
020
Dol
lars
Federal Work-Study
Federal Loans
Private andEmployer Grants
InstitutionalGrants
FederalEducationTax Benefits
Federal Veterans’Benefits
State Grants24%
11%
60%
4%$26.5
22%
10%
61%
4%$27.6
20%
10%
65%
4%$30.3
18%
9%
66%
4%$33.5
18%
10%
66%
4%$36.3
19%
11%
65%
4%$38.0
18%
11%
65%
4%
$42.0
17%
12%
66%
3%
$46.8
17%
11%
67%
4%
$51.1
16%
9%
68%
5%
$57.8
16%
9%
68%
5%
$61.4
17%
9%
68%
3%
$60.3
3%
18%
9%
67%
3%
$58.6
3%
18%
8%
67%
3%
$59.1
3%
19%
8%
66%
3%
$58.1
3%
19%
7%
66%
3%
$58.8
3%
20%
7%
66%
3%
$59.8
3%
21%
7%
66%
$60.1
3%
21%
7%
65%
$59.9
3%
22%
7%
65%
$60.0
3%
22%
7%
65%
$59.8
00-01 01-02 02-03 03-04 04-05 05-06 06-07 07-08 08-09 09-10 10-11 11-12 12-13 13-14 14-15 15-16 16-17 17-18 18-19 19-20 20-21
NOTE: Percentages may not sum to 100 because of rounding.
SOURCE: Trends in Student Aid website (research.collegeboard.org/trends), Table SA-1 online.
�■ Federal loans are the largest funding source for graduate students, peaking at 68% of the total funding from 2009-10 to 2011-12. In 2020-21, 65% of total funding for graduate students is from federal loans.
�■ Between 2000-01 and 2010-11, federal loans for graduate students more than doubled, increasing from $16.0 billion to $41.9 billion in 2020 dollars. Federal loans for these students decreased by 7% over the next decade to $39.0 billion in 2020-21.
�■ Institutional grants are the second largest funding source for graduate students. Between 2000-01 and 2010-11, institutional grants for graduate students rose by 59%, from $6.2 billion to $9.9 billion in 2020 dollars. Institutional grants grew by another 36% over the next decade to $13.4 billion in 2020-21.
ALSO IMPORTANT:
�■ Between 2010-11 and 2020-21, graduate enrollment increased by 7% while total grant aid to graduate students increased by 19% and total aid (including grants, loans, and other aid) decreased by 3%. Over this decade, average grant aid per graduate student increased by 10% ($840) and average total aid per graduate student decreased by 9% ($2,790). (Table SA-3 online)

36For detailed data behind the graphs and additional information, please visit: research.collegeboard.org/trends.
Sources of Grant AidThe total amount of grant aid supporting postsecondary students increased by 133% (after adjusting for inflation) between 2000-01 and 2010-11 and by another 8% between 2010-11 and 2020-21, reaching a total of $138.6 billion.
FIGURE SA-5 Total Grant Aid in 2020 Dollars by Source of Grant, 2000-01 to 2020-21
$0
$30
$60
$90
$120
Gra
nts
in B
illio
ns o
f 202
0 D
olla
rs
State Grants
Private andEmployerGrants
InstitutionalGrants
Federal Grants
27%
44%
16%
13%
$55.2
30%
42%
16%
13%
$59.6
32%
39%
16%
13%
$64.5
32%
40%
16%
12%
$69.7
31%
41%
16%
13%
$73.0
29%
42%
17%
12%
$74.8
28%
43%
17%
13%
$78.4
28%
43%
17%
12%
$83.6
30%
42%
16%
11%
$91.1
41%
37%
13%
9%
$115.5
44%
35%
12%
9%
$128.4
41%
38%
13%
9%
$126.0
39%
40%
13%
8%
$128.2
38%
41%
13%
8%
$130.2
36%
43%
12%
9%
$132.4
34%
45%
13%
9%
$134.1
32%
47%
13%
9%
$134.2
31%
47%
13%
9%
$138.7
30%
48%
13%
9%
$140.3
29%
49%
12%
9%
$141.6
27%
51%
12%
9%
$138.6
00-01 01-02 02-03 03-04 04-05 05-06 06-07 07-08 08-09 09-10 10-11 11-12 12-13 13-14 14-15 15-16 16-17 17-18 18-19 19-20 20-21
NOTE: Percentages may not sum to 100 because of rounding.
SOURCE: See page 51 for a list of sources for grants included in Figure SA-5.
�■ Between 2010-11 and 2020-21, institutional grant aid rose by $25.6 billion (in 2020 dollars) reaching a total of $71.1 billion in 2020-21. Institutional grants accounted for about half of all grant aid for undergraduate and graduate students in 2020-21.
�■ In 2000-01, federal grants constituted 27% of total grant aid for undergraduate and graduate students. This share peaked at 44% in 2010-11 and declined to 27% in 2020-21.
�■ Since 2009-10, state grant aid was between 8% and 9% of all grant aid. Total state grant aid grew by 56% (after adjusting for inflation) between 2000-01 and 2010-11 and by another 17% over the decade ending in 2020-21.
�■ Grants from employers and other private sources were between 12% and 17% of total grant aid to postsecondary students for the entire two decades from 2000-01 through 2020-21 and were 12% of the total in 2020-21.
ALSO IMPORTANT:
�■ Grant aid for veterans increased from 21% of federal grant aid in 2010-11 to 30% in 2020-21. At the same time, Pell Grants decreased from 75% to 68% of the total. (Table SA-1 online)
�■ Figure SA-5 shows the composition of grant aid for undergraduate and graduate students combined. In 2020-21, 8% of graduate student grant aid came from the federal government in the form of aid to veterans, 68% from institutions, 21% from employers and other private sources, and 2% from states. For undergraduate students, the percentages were 31% federal, 48% institutional, 10% private and employer, and 11% state. (Table SA-1 online)

For detailed data behind the graphs and additional information, please visit: research.collegeboard.org/trends. 37
Types of LoansTotal education borrowing declined for the tenth consecutive year in 2020-21. In 2020-21, total education borrowing declined by $9.8 billion (9%) after adjusting for inflation, the largest one-year decline after annual borrowing peaked in 2010-11.
FIGURE SA-6 Total Federal and Nonfederal Loans in 2020 Dollars by Type of Loan, 2000-01 to 2020-21
$0
$30
$60
$90
$120
20-2119-2018-1900-01 01-02 02-03 03-04 04-05 05-06 06-07 07-08 08-09 09-10 10-11 11-12 12-13 13-14 14-15 15-16 16-17 17-18
Loan
s in
Bill
ions
of 2
020
Dol
lars Nonfederal Loans
Perkins LoansGrad PLUS Loans
Parent PLUS Loans
FederalUnsubsidizedLoans
Federal SubsidizedLoans
42% 40% 38% 37% 35% 33% 31% 32% 34%35% 36% 35%
25% 24% 23% 22% 20% 20% 19% 18% 17%
33% 34%33%
32%32% 32% 30%
30%
41%
43%41%
41%
50%50%
49%48%
47%46%
46% 46%48%
9%9%
10%
10%11% 11% 10%
8%
8%
8%9%
10%
9%9%
10%11%
12%12%
12%12%
10%
4%
5%6%
6%
7%7%
8%8% 9%
10%10%
11%
12%
13%14%
16%
18%
20%23%
25%
25%
12%
8%7%
7%
8%9%
9% 10% 11%11%
13%14%
13%
$59.3$63.8
$73.5
$84.8
$94.1$99.2
$104.6
$113.6$117.8
$130.5$135.1
$132.8
$126.2$123.2
$117.7 $116.0 $114.3$111.2
$107.6 $105.7
$95.9
NOTE: Nonfederal loans include loans to students from states and institutions in addition to private loans issued by banks, credit unions, and other lenders. Values for nonfederal loans are best estimates and are less precise than federal loan amounts.
SOURCE: See page 51 for a list of sources for loans included in Figure SA-6.
�■ Total annual student and parent borrowing for postsecondary education reached its peak of $135.1 billion in 2010-11 and then declined by 29% ($39.3 billion in 2020 dollars) in the next ten years, to $95.9 billion in 2020-21.
�■ Between 2010-11 and 2020-21, federal Direct subsidized and unsubsidized student loans fell by $42.1 billion (40%) and borrowing through parent PLUS declined by $2.6 billion (20%). Total Grad PLUS borrowing increased by $3.4 billion (41%) over the decade.
�■ Students borrow nonfederal education loans from banks, credit unions, and other private lenders, including some states and postsecondary institutions. These loans, which are not part of the student aid system and typically do not involve subsidies, fell from about $28 billion (in 2020 dollars) in 2007-08 to $9 billion in 2010-11, before increasing to about $12 billion in 2020-21. Nonfederal loans accounted for about 13% of all education loans in 2020-21.
ALSO IMPORTANT:
�■ There are no credit requirements for subsidized and unsubsidized Direct Loans. To qualify for PLUS loans, borrowers cannot have an “adverse credit history,” defined as being 90 days or more delinquent on any debts greater than $2,085 or being the subject of default determination, bankruptcy discharge, foreclosure, repossession, tax lien, wage garnishment, or write-off of a federal education debt during the five years preceding the date of the credit report.

38For detailed data behind the graphs and additional information, please visit: research.collegeboard.org/trends.
Federal AidIn 2020-21, average benefits from the Post-9/11 GI Bill program were nearly $16,000, compared with just over $4,200 per Pell Grant recipient. There were 6.2 million Pell Grant recipients compared with 614,000 veterans’ benefits recipients.
FIGURE SA-7 Number of Recipients by Federal Aid Program (with Average Aid Received), 2020-21
Num
ber o
f Rec
ipie
nts
(in M
illio
ns) 9.4
million
6.2million
6.8million
4.3million
5.9million
1.6million
579,000 614,000
0
2
4
6
8
10
Post/9-11GI Bill
Veterans’Benefits
($15,780)
FederalWork-Study
($1,950)
FSEOG($530)
DirectUnsubsidized
Loans($7,730)
DirectSubsidized
Loans($3,780)
DirectSubsidized
andUnsubsidized
Loans($9,100)
FederalPell
Grant($4,220)
EstimatedFederal
Education TaxBenefits ($1,460)
Federal Aid Programs (with Average Aid per Recipient)
NOTE: Data on tax benefits are for 2018 and are estimated. FSEOG and FWS amounts are for 2019-20 and represent federal funds only. Institutions provide matching funds so the awards that students receive under these programs are larger than these federal aid amounts.
SOURCE: See page 51 for a list of sources of data on federal aid programs.
FIGURE SA-8 Percentage Distribution of Federal Aid Funds by Sector, 2019-20
24%
17%
11%
5%
34%
38%
45%
41%
51%
27%
33%
41%
28%
39%
42%
68%
33% 37% 17% 13%
9%
3%
15%
15%
6%
6%
Pell Grants
FSEOG
FederalWork-Study
DirectSubsidized Loans
DirectUnsubsidized Loans
ParentPLUS Loans
Grad PLUS Loans
Public Two-Year Public Four-Year Private Nonprofit For-Profit
NOTE: Excludes aid to students enrolled in public less-than-two-year colleges and to students enrolled in foreign institutions. Percentages may not sum to 100 because of rounding.
SOURCE: See page 51 for a list of sources of data on federal aid program.
�■ In 2020-21, the total number of borrowers in the subsidized and unsubsidized Direct Loan programs was 6.8 million—less than the sum of the number of recipients in each program because many borrowers participated in both programs.
�■ In 2019-20, public two-year college students, who made up 31% of full-time equivalent (FTE) undergraduate enrollment, received 33% of Pell Grant funds.
�■ In 2019-20, students in the private nonprofit sector accounted for 20% of undergraduate and 24% of total postsecondary FTE enrollment. They received 68% of Grad PLUS loans, 42% of Parent PLUS loans, and 41% of Federal Work-Study (FWS) funds.
ALSO IMPORTANT:
�■ Pell Grants, FSEOG, and Direct Subsidized loans are for undergraduates only. Grad PLUS loans are for graduate students only. Parent PLUS loans are for parents of undergraduate students. FWS, Direct Unsubsidized loans, and Post-9/11 GI Bill benefits are available to both undergraduate and graduate students.
�■ In 2012-13, 41% of Post-9/11 GI Bill veterans’ benefits went to students in the for-profit sector (U.S. Senate HELP Committee, 2014, “Is the New G.I. Bill Working?”). In 2017, Congress passed legislation known as the “Forever GI Bill,” increasing the generosity of education benefits for veterans.
Distribution of Fall 2019 Enrollment by Sector
FTE Undergraduate
StudentsAll FTE
Students
Public Two-Year 31% 26%
Public Four-Year 43% 44%
Private Nonprofit 20% 24%
For-Profit 6% 6%
SOURCE: NCES, IPEDS Enrollment data.

For detailed data behind the graphs and additional information, please visit: research.collegeboard.org/trends. 39
Federal Loans: Annual BorrowingAfter rapid growth in annual borrowing between 2005-06 and 2010-11, total federal loans to undergraduate students declined by 46% ($38.6 billion in 2020 dollars) and total federal loans to graduate students decreased by 7% ($2.7 billion) between 2010-11 and 2020-21.
FIGURE SA-9A Total Annual Amount Borrowed from Federal Subsidized, Unsubsidized, and PLUS Loans in Billions of 2020 Dollars, 2005-06 to 2020-21, Selected Years
$50.4
$83.4
$64.4
$44.7
$24.1
$41.7$38.7 $39.0
$0
$20
$40
$60
$80
2005-06 2010-11 2015-16 2020-21 2005-06 2010-11 2015-16 2020-21
Undergraduate Graduate
Tota
l Ann
ual A
mou
nt B
orro
wed
in B
illio
ns o
f 202
0 D
olla
rs
PLUSUnsubsidizedSubsidized
$21.9
$17.6
$10.8
$34.4
$36.4
$12.6
$25.1
$26.3
$13.1
$16.3
$18.4
$10.5
$13.7$29.1
$9.7
$27.3
$11.6
$13.9
$19.6
$8.3$10.0
FIGURE SA-9B Average Annual Amount Borrowed in Federal Subsidized, Unsubsidized, and PLUS Loans in 2020 Dollars, 2005-06 to 2020-21, Selected Years
$0 $5,000 $10,000 $15,000 $20,000 $30,000$25,000
Average Annual Amount Borrowed in 2020 Dollars per Borrower
2020-212015-162010-112005-06
$14,290
$23,790
$15,160
$25,450
$16,640
$26,880
$17,810
Undergraduate
GraduateSubs
idiz
ed a
ndUn
subs
idiz
ed
$6,580
$20,980$21,230
$7,500
$20,210
$7,200
$18,800
$6,470
Graduate
Undergraduate
PLUS
$0
Number of Borrowers (in Thousands), 2005-06 to 2020-21, Selected Years
2005-06 2010-11 2015-16 2020-21
Subsidized and Unsubsidized Undergraduate 6,017 9,438 7,131 5,367
Graduate 1,135 1,593 1,439 1,454
Total 7,152 11,031 8,570 6,821
PLUS Undergraduate 759 829 785 561
Graduate — 347 379 432
Total 759 1,177 1,165 994
�■ The share of annual federal education loans going to graduate students (who constitute about 16% of all postsecondary students) rose from 32% ($24.1 billion out of $74.5 billion in 2020 dollars) in 2005-06 to 47% ($39.0 billion out of $83.7 billion) in 2020-21.
�■ In 2020-21, undergraduates taking subsidized and/or unsubsidized loans borrowed an average of $6,470—$1,030 less (in 2020 dollars) than a decade earlier and $730 less than in 2015-16.
�■ In 2020-21, 432,000 graduate students borrowed through the grad PLUS program; 1.5 million borrowed unsubsidized loans. The average amount borrowed through the PLUS program was $8,080 higher than the average unsubsidized loan ($26,880 vs. $18,800).
ALSO IMPORTANT:
�■ The aggregate federal student loan limit for dependent undergraduate students is $31,000. No more than $23,000 can be subsidized loans. Independent students and dependent students whose parents are not eligible for parent PLUS loans can borrow an additional $26,500 in unsubsidized loans.
�■ Graduate and professional students can borrow up to a lifetime total of $138,500 from the subsidized and unsubsidized loan programs, including their undergraduate borrowing. Each year students are enrolled, they can borrow up to the full cost of attendance not covered by grant aid, including living expenses and books and supplies in addition to tuition and fees through the grad PLUS program.
�■ Like the grad PLUS program, the parent PLUS program allows borrowing to cover students’ entire budgets less grant aid received for an unlimited number of years of enrollment.
NOTE: Graduate students became eligible to borrow PLUS Loans in 2006-07. Components in Figure SA-9A may not sum to totals because of rounding.
SOURCE: Trends in Student Aid website (research.collegeboard.org/trends), Table SA-6.

40For detailed data behind the graphs and additional information, please visit: research.collegeboard.org/trends.
Federal Loans: Borrowing and BalancesAs of March 2021, 45% of the outstanding federal education loan debt was held by 10% of borrowers owing $80,000 or more.
FIGURE SA-10 Distribution of Borrowers and Debt by Outstanding Balance, Second Quarter of FY2021
Percentage of Borrowers
Percentage of Debt
Out
stan
ding
Bor
row
er D
ebt B
alan
ce
9%13%
$40,000 to $59,999
2%17%
$200,000 or More
5%20%
$100,000 to $199,999
3%8%
$80,000 to $99,999
6%11%
$60,000 to $79,999
21%17%
$20,000 to $39,999
21%9%
$10,000 to $19,999
17%3%
$5,000 to $9,999
16%1%
Less than $5,000
NOTE: Includes both loans made under the Federal Direct Loan Program (FDLP) and the Federal Family Education Loan (FFEL) Program, which ended in 2009-10. Data were as of March 31, 2021, the end of the second quarter of FY2021. Percentages may not sum to totals because of rounding.
SOURCE: U.S. Department of Education, Federal Student Aid Center, Federal Student Loan Portfolio.
FIGURE SA-11 Percentage of Undergraduate Students Borrowing Federal Subsidized and Unsubsidized Student Loans, 2010-11, 2015-16, and 2020-21
4%74% 5% 16%
6%69% 5% 21%
9%63% 7% 21%
Percentage of Undergraduate Students
Acad
emic
Yea
r
Both Subsidized andUnsubsidized Loans
UnsubsidizedOnly
SubsidizedOnly
No Loans
2010-11
2015-16
2020-21
NOTE: IPEDS headcount enrollments are adjusted for the difference between total headcount, which counts students more than once if they are enrolled in more than one institution at the same time, and unduplicated headcount reported by the National Student Clearinghouse (NSC). Twelve-month undergraduate headcount for 2020-21 is estimated from NSC data. Percentages may not sum to 100 because of rounding.SOURCE: NCES, IPEDS 12-month enrollment data; National Student Clearinghouse, Current Term Enrollment Estimates: Spring 2021; U.S. Department of Education, Federal Student Aid Data Center, Title IV Program Volume Reports and Aid Recipients Summary; calculations by the authors.
�■ As of March 2021, 54% of borrowers owed less than $20,000. These borrowers held 13% of the outstanding federal debt.
�■ In 2020-21, 26% of undergraduate students borrowed Federal Direct student loans, down from 31% in 2015-16 and 37% in 2010-11.
�■ In 2020-21, 4% of undergraduate students borrowed subsidized loans only, 5% borrowed unsubsidized loans only, and 16% borrowed from both programs.
ALSO IMPORTANT:
�■ Federal student loan default rates are highest for borrowers with low balances. For example, among borrowers entering repayment in 2010-11, the three-year default rate ranged from 24% for those owing $5,000 or less to 7% for those owing $40,000 or more. Two-thirds of those who defaulted owed $10,000 or less. (Trends in Student Aid 2016, Figure 12B)
�■ The share of undergraduate students borrowing federal student loans rose steadily from 23% in 2001-02 to 38% in 2011-12. Since 2011-12, the share borrowing has declined each year, to 26% in 2020-21.
Federal Loan Balance by Debt Size, Second Quarter of FY2021
Total Balance
(in Billions)
Number of Borrowers (in Millions)
Average Balance
$200,000 or More $271.3 0.9 $301,400
$100,000 to $199,999 $324.2 2.4 $135,100
$80,000 to $99,999 $125.3 1.4 $89,500
$60,000 to $79,999 $179.9 2.6 $69,200
$40,000 to $59,999 $208.7 4.3 $48,500
$20,000 to $39,999 $274.2 9.6 $28,600
$10,000 to $19,999 $136.4 9.4 $14,500
$5,000 to $9,999 $54.4 7.5 $7,300
Less than $5,000 $19.4 7.3 $2,700
Total $1,593.8 45.4 $35,100

For detailed data behind the graphs and additional information, please visit: research.collegeboard.org/trends. 41
Federal Loans: Outstanding Debt by AgeAs of March 2021, 23% of the $1.59 trillion outstanding federal loan balance was held by borrowers who were 50 and older, up from 18% in 2017.
FIGURE SA-12A Distribution of Outstanding Federal Loan Dollars and Borrowers by Borrower Age, Second Quarter of FY2017, FY2019, and FY2021
2021 (45.4 Million)
2017 (44.7 Million)
10%
7%
19%
17%
36%
31%
34%
33%
36%
38%
30%
31%
14%
17%
13%
14%
4%
6%
4%
2019 (45.2 Million) 18% 33% 31% 13% 4%
5%
Borr
ower
s
2021 ($1.59 Trillion)
2017 ($1.34 Trillion)
8% 34% 38% 16% 5%2019 ($1.48 Trillion)
Dol
lars
Fisc
al Y
ear
(Tot
al D
ebt/
Borr
ower
s in
Eac
h Ye
ar)
24 and Younger 25 to 34 35 to 49 62 and Older50 to 61
FIGURE SA-12B Distribution of Borrowers by Outstanding Balance and Age, Second Quarter of FY2021
24 or Younger 25 to 34 35 to 49 62 and Older50 to 61
19%
28%
22%
17%
4%
2%
2%
2%
32%
30%
34%
37%
36%
30%
24%
25%
33%
29%
25%
27%
30%
40%
45%
47%
44%
40%
14%
12%
12%
12%
16%
17%
20%
22%
20%
7%
5%
4%
4%
5%
5%
6%
7%
8%
Less than $5,000
$5,000 to $9,999
$10,000 to $19,999
$20,000 to $39,999
$40,000 to $59,999
$60,000 to $79,999
$80,000 to $99,999
$100,000 to $199,999
$200,000 or More
Out
stan
ding
Bor
row
er D
ebt B
alan
ce
NOTE: Includes both loans made under the Federal Direct Loan Program (FDLP) and the Federal Family Education Loan (FFEL) Program, which ended in 2009-10. Data were as of March 31, 2021, the end of the second quarter of FY2021. Percentages may not sum to totals because of rounding.
SOURCE: U.S. Department of Education, Federal Student Aid Center, Federal Student Loan Portfolio.
�■ As of March 2021, 19% of the 45.4 million borrowers were age 50 and older, holding 23% of all the outstanding federal loan debt. In 2017, 17% of borrowers were in this age group, holding 18% of all outstanding federal loan debt.
�■ Among the group of borrowers with outstanding debt balances of $200,000 or more, one-third are under age 35 and 28% are over age 50.
�■ Among the group of borrowers with outstanding debt balances of $5,000 or less, about half are over age 35 including 21% over age 50.
ALSO IMPORTANT:
�■ Data in Figures SA-12A and SA-12B include both debt held by student borrowers who borrowed for their own education and parent borrowers who borrowed for their children’s education through Parent PLUS loans.
Federal Loan Balance by Borrower Age, Second Quarter of FY2021
Total Balance
(in Billions)
Number of Borrowers (in Millions)
Average Balance
24 and Younger $113.7 7.5 $15,200
25 to 34 $500.6 14.9 $33,600
35 to 49 $613.0 14.3 $42,900
50 to 61 $273.7 6.3 $43,400
62 and Older $92.7 2.4 $38,600

42For detailed data behind the graphs and additional information, please visit: research.collegeboard.org/trends.
Outstanding Federal LoansMore than half of the debt owed by student loan borrowers in repayment is now in Income-Driven Repayment (IDR) plans that limit monthly payments to a share of income.
FIGURE SA-13A Distribution of Outstanding Federal Direct Loan Dollars and Borrowers by Repayment Plan, Second Quarter of FY2015, FY2018, and FY2021
0%
20%
40%
60%
Repayment Plan
Dollars BorrowersIncome Driven
Dollars BorrowersLevel Payments,10 Years or Less
Dollars BorrowersLevel Payments,
More Than 10 Years orAlternative
Dollars BorrowersGraduated Payments
54%
34%
49%
29%
18%
32%
26%
37%
21%
47%
58%
42%
13%
15%13%
10%
10%12%
12%
13%11%
14%
13% 14%
20182015 2021
NOTE: Data include Direct Loan borrowers in repayment, deferment, and forbearance and reflect the end of the second quarter (March 31) of each fiscal year. Because some borrowers have multiple loans, recipients may be counted multiple times across varying loan statuses. Income-driven plans include REPAYE, Pay As You Earn, Income-Contingent Repayment, and Income-Based Repayment. Level payment plans require monthly payments that are the same over a fixed period of time. Alternative repayment plans are customized to borrowers’ circumstances. Under the graduated payment plan, monthly payments increase over time. Percentages may not sum to 100 because of rounding.
SOURCE: U.S. Department of Education, Federal Student Aid Data Center, Federal Student Loan Portfolio.
FIGURE SA-13B Repayment Status of Federal Education Loan Portfolio, Second Quarter of FY2021
56%68%
17%11%
15%9%
8%9%
3%2%
1%1%
Percentage of BorrowersPercentage of Dollars
Repayment
Grace
Deferment
In-School
Repa
ymen
t Sta
tus
Default
Forbearance
NOTE: Includes both loans made under the Federal Direct and Federal Family Education Loan (FFEL) programs and held by the Department of Education. Excludes the $154 billion in outstanding FFEL loans not held by the federal government. The second quarter of FY2021 ended on March 31, 2021.
SOURCE: U.S. Department of Education, Federal Student Aid Data Center, Federal Student Loan Portfolio.
�■ In March 2021, 32% of borrowers in repayment on federal Direct loans were in IDR plans, up from 18% in 2015 and 29% in 2018.
�■ The CARES Act and subsequent Executive Orders suspended federal student loan payments, ended collections on defaulted federal student loans, and suspended interest accrual on all federal student loans through January 31, 2022. As a result, 56% of borrowers (and 68% of outstanding dollars) were in forbearance in March 2021. The average balance on these loans was $40,900.
�■ In March 2021, 17% of borrowers (and 11% of outstanding dollars) were in default. The average balance on defaulted loans was $21,700, compared with $33,500 for all outstanding loans.
Federal Loan Balance by Repayment Status, Second Quarter of FY2021
Total Balance
(in Billions)
Number of Borrowers (in Millions)
Average Balance
Forbearance $977.3 23.9 $40,900
Default $158.5 7.3 $21,700
In-School $125.9 6.4 $19,700
Deferment $122.6 3.3 $37,200
Grace $22.3 1.2 $18,600
Repayment $17.7 0.5 $35,400
Other $9.0 0.2 $45,000
Total $1,433.3 42.8 $33,500
NOTE: Forbearance: payment temporarily suspended or reduced because of financial hardships; Default: more than 360 days delinquent; In-School: borrower is still enrolled, loans are not in repayment; Deferment: payments postponed because of economic hardship, military service, or returning to school; Grace: six-month period after borrower is no longer enrolled at least half time; Repayment: in active repayment status. “Other” category includes loans that are in non-defaulted bankruptcy and in a disability status.

For detailed data behind the graphs and additional information, please visit: research.collegeboard.org/trends. 43
Cumulative Debt: Bachelor’s Degree RecipientsIn 2019-20, 55% of bachelor’s degree recipients from public and private nonprofit four-year colleges and universities graduated with debt and had an average debt level of $28,400.
FIGURE SA-14 Average Cumulative Debt Levels in 2020 Dollars: Bachelor’s Degree Recipients at Public and Private Nonprofit Four-Year Institutions, 2004-05 to 2019-20, Selected Years
$10,000
$20,000
$30,000
Aver
age
Cum
ulat
ive
Deb
t in
2020
Dol
lars
Academic Year (Percentage of Graduates Who Borrowed)
$0
$10,000
$20,000
$30,000
2019-20 (55%)2014-15 (60%)2009-10 (56%)2004-05 (55%)
2019-20 (57%)2014-15 (63%)2009-10 (66%)2004-05 (64%)
Academic Year (Percentage of Graduates Who Borrowed)
$12,
900
$23,
600
$14,
500
$25,
800
$17,
400
$29,
200
$14,
500
$26,
700
Public Four-Year
Private Nonprofit Four-Year
$19,
400
$30,
100
$21,
500
$32,
700
$21,
700
$34,
300
$19,
000
$33,
600
Per Borrower Per Degree Recipient
Aver
age
Cum
ulat
ive
Deb
t in
2020
Dol
lars
$0
NOTE: Includes federal and nonfederal loans taken by students who began their studies at the institution from which they graduated. Parent PLUS loans are not included. The orange bars represent the average cumulative debt levels of bachelor’s degree recipients who took student loans. The blue bars represent the average debt per bachelor’s degree recipient, including those who graduated without student debt. Calculations are based on the average debt and the number of bachelor’s degrees awarded at the college level. The available data are not adequate to allow comparable calculations for for-profit institutions.
SOURCE: College Board, Annual Survey of Colleges, 2005 to 2020; calculations by the authors.
Average Cumulative Debt in 2020 Dollars: Bachelor’s Degree Recipients at Public and Private Nonprofit Four-Year Institutions: 2004-05 to 2019-20, Selected Years
Percentage with Debt
Average Debt per Borrower
Average Debt per Graduate
2004-05 58% $25,900 $15,000
2009-10 59% $28,000 $16,400
2014-15 61% $30,700 $18,600
2019-20 55% $28,400 $15,600
�■ In 2019-20, 55% of bachelor’s degree recipients from public four-year institutions graduated with debt and had an average debt level of $26,700; 57% of bachelor’s degree recipients from private nonprofit four-year institutions graduated with debt and had an average debt level of $33,600.
�■ Between 2014-15 and 2019-20, the average cumulative student debt levels and the shares of bachelor’s degree recipients who borrowed declined in both sectors.
�■ In 2019-20, average debt per bachelor’s degree recipient, including both those who borrowed and those who did not, was $15,600 for the two sectors combined.
ALSO IMPORTANT:
�■ Students who earn their bachelor’s degrees at for-profit institutions, not included in Figure SA-14, are more likely to borrow and accumulate higher average levels of debt than those who graduate from public and private nonprofit four-year colleges. (Trends in Student Aid 2018, Figure 16)
�■ Figure SA-14 includes only students who earned their bachelor’s degrees at the institutions in which they first enrolled. Students who attend two or more institutions may have different borrowing patterns.
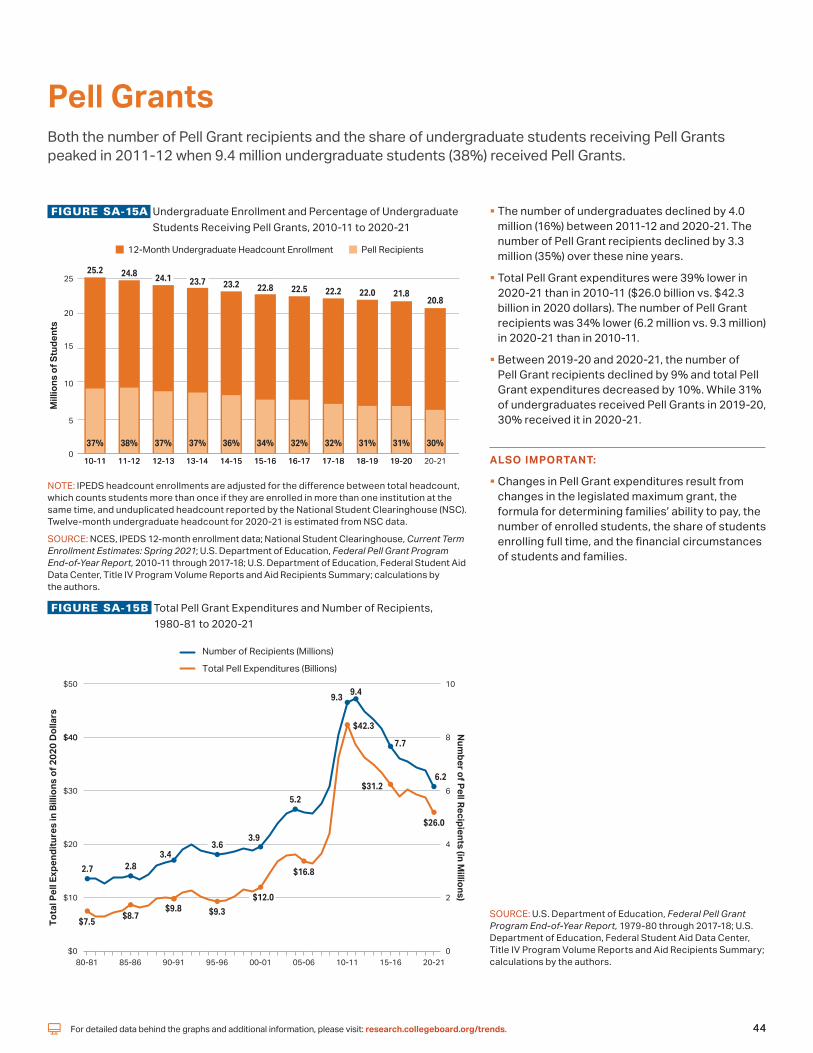
44For detailed data behind the graphs and additional information, please visit: research.collegeboard.org/trends. 44
Pell GrantsBoth the number of Pell Grant recipients and the share of undergraduate students receiving Pell Grants peaked in 2011-12 when 9.4 million undergraduate students (38%) received Pell Grants.
FIGURE SA-15A Undergraduate Enrollment and Percentage of Undergraduate Students Receiving Pell Grants, 2010-11 to 2020-21
20.8
Pell Recipients12-Month Undergraduate Headcount Enrollment
20-2119-2018-1917-1816-1715-1614-1513-1412-1311-1210-11 19-2018-1917-1816-1715-1614-1513-1412-1311-1210-11
10
5
15
20
25
Mill
ions
of S
tude
nts
030%
25.2 24.8 24.1 23.7 23.2 22.8 22.5 22.2 22.0 21.8
37% 38% 37% 37% 36% 34% 32% 32% 31% 31%
NOTE: IPEDS headcount enrollments are adjusted for the difference between total headcount, which counts students more than once if they are enrolled in more than one institution at the same time, and unduplicated headcount reported by the National Student Clearinghouse (NSC). Twelve-month undergraduate headcount for 2020-21 is estimated from NSC data.
SOURCE: NCES, IPEDS 12-month enrollment data; National Student Clearinghouse, Current Term Enrollment Estimates: Spring 2021; U.S. Department of Education, Federal Pell Grant Program End-of-Year Report, 2010-11 through 2017-18; U.S. Department of Education, Federal Student Aid Data Center, Title IV Program Volume Reports and Aid Recipients Summary; calculations by the authors.
FIGURE SA-15B Total Pell Grant Expenditures and Number of Recipients, 1980-81 to 2020-21
Tota
l Pel
l Exp
endi
ture
s in
Bill
ions
of 2
020
Dol
lars
Num
ber of Pell Recipients (in Millions)
$0
$10
$20
$30
$40
$50
$40
0
2
4
6
8
10
20-2110-11 15-1605-0600-0195-9690-9185-8680-81
Number of Recipients (Millions)
Total Pell Expenditures (Billions)
$7.5$8.7
$9.8 $9.3
$12.0
$16.8
$42.3
$31.2
$26.0
2.7 2.83.4
3.63.9
5.2
9.3 9.4
7.7
6.2
�■ The number of undergraduates declined by 4.0 million (16%) between 2011-12 and 2020-21. The number of Pell Grant recipients declined by 3.3 million (35%) over these nine years.
�■ Total Pell Grant expenditures were 39% lower in 2020-21 than in 2010-11 ($26.0 billion vs. $42.3 billion in 2020 dollars). The number of Pell Grant recipients was 34% lower (6.2 million vs. 9.3 million) in 2020-21 than in 2010-11.
�■ Between 2019-20 and 2020-21, the number of Pell Grant recipients declined by 9% and total Pell Grant expenditures decreased by 10%. While 31% of undergraduates received Pell Grants in 2019-20, 30% received it in 2020-21.
ALSO IMPORTANT:
�■ Changes in Pell Grant expenditures result from changes in the legislated maximum grant, the formula for determining families’ ability to pay, the number of enrolled students, the share of students enrolling full time, and the financial circumstances of students and families.
SOURCE: U.S. Department of Education, Federal Pell Grant Program End-of-Year Report, 1979-80 through 2017-18; U.S. Department of Education, Federal Student Aid Data Center, Title IV Program Volume Reports and Aid Recipients Summary; calculations by the authors.

For detailed data behind the graphs and additional information, please visit: research.collegeboard.org/trends. 45
Pell GrantsThe $6,495 maximum Pell Grant in 2021-22 is 14% higher in inflation-adjusted dollars than it was in 2001-02.
FIGURE SA-16 Inflation-Adjusted Maximum and Average Pell Grant and Published Prices at Public and Private Nonprofit Four-Year Institutions in 2021 Dollars, 2001-02 to 2021-22
01-02 06-07 11-12 16-17 21-22
$3,360
$5,690$4,220
$6,495
$10,740
$22,690
$38,070
$51,690
$5,720
$13,710
$26,380
$36,210
$4,090
$9,890
$6,630
$20,510
$33,320
$45,370
$0
$10,000
$20,000
$30,000
$40,000
$50,000
2021
Dol
lars
Private Nonprofit Four-YearTuition and Fees
Maximum Pell Grant
Average Pell Grantper Recipient
Private Nonprofit Four-Year Tuition and Fees and Room and
Board
Public Four-Year Tuition and Fees
Public Four-Year Tuition and Fees and Room and
Board
SOURCE: College Board, Trends in College Pricing 2021, Table CP-2 online. U.S. Department of Education, Federal Pell Grant Program End-of-Year Report, 2001-02 through 2017-18; U.S. Department of Education, Federal Student Aid Data Center, Title IV Program Volume Reports and Aid Recipients Summary; calculations by the author.
�■ The maximum Pell Grant is the most frequently cited measure of per-student subsidies provided by the program. However, most students receive smaller grants because they are enrolled part time or because their family incomes and assets reduce their aid eligibility.
�■ In 2021-22, the maximum Pell Grant covers 60% of average published in-state tuition and fees and 29% of average tuition, fees, room, and board at public four-year colleges and universities.
�■ In 2021-22, the maximum Pell Grant covers 17% of average published tuition and fees and 13% of average tuition, fees, room, and board at private nonprofit four-year colleges and universities.
ALSO IMPORTANT:
�■ Between 2011-12 and 2021-22, published tuition and fees increased by 9% at public four-year institutions and by 14% at private nonprofit institutions, while the maximum Pell Grant fell by 2% after adjusting for inflation.
Maximum Pell Grant as a Percentage of Published Prices in 2021 Dollars, 2001-02 to 2021-22, Selected Years
Public Four-Year Private Nonprofit Four-Year
In-State Tuition and
Fees
Tuition and Fees and
Room and Board
Tuition and Fees
Tuition and Fees and
Room and Board
2001-02 99% 42% 22% 16%
2006-07 70% 32% 18% 13%
2011-12 67% 32% 20% 15%
2016-17 60% 29% 17% 13%
2021-22 60% 29% 17% 13%

46For detailed data behind the graphs and additional information, please visit: research.collegeboard.org/trends.
State GrantsIn 2019-20, state grant aid per full-time equivalent (FTE) undergraduate student increased by 3%, from $950 to $980 in 2019 dollars. Average state grant aid per FTE undergraduate student has been increasing every year since 2012-13.
FIGURE SA-17A Need-Based and Non-Need-Based State Grant Aid per Full-Time Equivalent (FTE) Undergraduate Student in 2019 Dollars, 1979-80 to 2019-20
100%
100%
100%
91%
90%
91%
91%
91%
90%
90%
89%
88%
89%
90%
90%
87%
86%
85%
83%
82%
78%
76%
76%
77%
74%
73%
72%
72%
73%
72%
73%
71%
74%
75%
76%
76%
76%
76%
75%
74%
74%
$200
$0
$400
$600
$800
Aver
age
Stat
e G
rant
per
FTE
Unde
rgra
duat
e St
uden
t Need-Based
Non-Need-Based
79-80 84-85 89-90 94-95 99-00 04-05 09-10 14-15 19-20
$410 $420 $440
$550
$650
$780 $760$810
$980
NOTE: Percentages displayed represent shares of total undergraduate state grant aid that was based on students’ financial circumstances.
SOURCE: National Association of State Student Grant and Aid Programs (NASSGAP) Annual Survey, 1979-80 to 2019-20, Tables 1 and 12.
FIGURE SA-17B Need-Based State Grant Aid as a Percentage of Total Undergraduate State Grant Aid by State, 2019-20
0%
9%17%
51%
74%
95%100% 100%
0%
20%
40%
60%
80%
100%
Perc
enta
ge o
f Sta
te G
rant
sBa
sed
on F
inan
cial
Nee
d
Geo
rgia
Arka
nsas
Dis
tric
t of C
olum
bia
Sout
h D
akot
aLo
uisi
ana
Sout
h Ca
rolin
aNe
vada
New
Mex
ico
Tenn
esse
eFl
orid
aAl
aska
Kent
ucky
Wes
t Virg
inia
New
Ham
pshi
reM
isso
uri
Del
awar
eNo
rth
Dak
ota
Mis
siss
ippi
Unite
d St
ates
Iow
aO
hio
Virg
inia
Alab
ama
Utah
Okl
ahom
aNe
w Y
ork
Colo
rado
Indi
ana
Wis
cons
inNo
rth
Caro
lina
Was
hing
ton
Mas
sach
uset
tsNe
w J
erse
yM
aryl
and
Idah
oPe
nnsy
lvan
iaCo
nnec
ticut
Mic
higa
nNe
bras
kaO
rego
nVe
rmon
tIlli
nois
Calif
orni
aM
inne
sota
Arizo
naHa
wai
iKa
nsas
Mai
neM
onta
naRh
ode
Isla
ndTe
xas
NOTE: Need-based aid includes any grants for which financial circumstances contribute to eligibility. Non-need-based aid refers to grants for which financial circumstances have no influence on eligibility. Wyoming’s state grant aid is not disaggregated by need-based/non-need-based status.
SOURCE: NASSGAP Annual Survey, 2019-20, Table 1.
�■ The share of state grant aid that was need-based increased from a low of 71% in 2010-11 to 76% in 2016-17. It was 74% in 2019-20.
�■ In 2019-20, 26 states considered students’ financial circumstances in allocating at least 95% of their state grant aid. Twelve states and the District of Columbia considered students’ financial circumstances when awarding less than half of their state grant aid.

For detailed data behind the graphs and additional information, please visit: research.collegeboard.org/trends. 47
State GrantsIn 2019-20, state grant aid per full-time equivalent (FTE) undergraduate student ranged from under $200 in eight states to over $1,000 in 18 states.
FIGURE SA-18A State Grant Aid per Full-Time Equivalent (FTE) Undergraduate Student, 2019-20
$2,480
Mon
tana
Geo
rgia
$10$180
$980
$0
$500
$1,000
$1,500
$2,000
Stat
e G
rant
Aid
per
FTE
Stu
dent
$2,470
New
Ham
pshi
reUt
ahAr
izona
Kans
asHa
wai
iRh
ode
Isla
ndSo
uth
Dako
taNe
bras
kaCo
nnec
ticut
Idah
oO
hio
Mai
neM
assa
chus
etts
Alab
ama
Mis
siss
ippi
Mic
higa
nIo
wa
Mar
ylan
dW
isco
nsin
Nort
h Da
kota
Verm
ont
Dela
war
eM
isso
uri
Okl
ahom
aO
rego
nCo
lora
doNe
vada
Dist
rict o
f Col
umbi
aPe
nnsy
lvan
iaNo
rth
Caro
lina
Texa
sUn
ited
Stat
esM
inne
sota
Arka
nsas
Alas
kaIlli
nois
Wes
t Virg
inia
New
Yor
kNe
w M
exic
oIn
dian
aFl
orid
aCa
lifor
nia
Virg
inia
Was
hing
ton
Kent
ucky
New
Jer
sey
Tenn
esse
eLo
uisi
ana
Sout
h Ca
rolin
a
NOTE: Full-time equivalent students include both state residents and out-of-state students. States do not award grant aid to nonresidents. Most states do not award state grant aid to their residents who attend colleges outside the state.
SOURCE: NASSGAP Annual Survey, 2019-20, Tables 1 and 12.
FIGURE SA-18B State Grant Expenditures as a Percentage of Total State Support for Higher Education by State, 2019-20
13%
34%35%
<1%
Gra
nt A
id a
s a
Perc
enta
geof
Fis
cal S
uppo
rt
0%
10%
20%
30%
Mon
tana
Haw
aii
New
Ham
pshi
reUt
ahKa
nsas
Sout
h Da
kota
Nebr
aska
Conn
ectic
utId
aho
Alab
ama
Arizo
naAl
aska
Rhod
e Is
land
Mis
siss
ippi
Wyo
min
gM
aine
Mar
ylan
dNo
rth
Dako
taM
assa
chus
etts
Ohi
oNo
rth
Caro
lina
Mic
higa
nW
isco
nsin
Neva
daNe
w M
exic
oIo
wa
Illino
isO
rego
nO
klah
oma
Dela
war
eAr
kans
asM
isso
uri
Min
neso
taTe
xas
Unite
d St
ates
Calif
orni
aNe
w Yo
rkCo
lora
doFl
orid
aIn
dian
aW
est V
irgin
iaW
ashi
ngto
nPe
nnsy
lvan
iaTe
nnes
see
Verm
ont
New
Jer
sey
Geo
rgia
Kent
ucky
Virg
inia
Loui
sian
aSo
uth
Caro
lina
Dist
rict o
f Col
umbi
a
NOTE: State grant expenditures include funding for both undergraduate and graduate students.
SOURCE: NASSGAP Annual Survey, 2019-20, Table 14.
�■ Georgia, with the highest grant aid per FTE undergraduate student, allocates its grant funds without regard to students’ financial circumstances. South Carolina, the second most generous state, considered the financial circumstances of recipients for only 17% of state grant funds in 2019-20. (Figure SA-17B)
�■ Overall, state grant expenditures constituted 13% of total state support for higher education in 2019-20.
ALSO IMPORTANT:
�■ In 2019-20, five states (California, New York, Texas, Florida, and Georgia) accounted for 48% of all state grant aid dollars, with California accounting for 19% of the total.

48For detailed data behind the graphs and additional information, please visit: research.collegeboard.org/trends.
Average Institutional Grant Aid by SectorBetween 2006-07 and 2018-19, average institutional grant aid per first-time full-time undergraduate student at private nonprofit four-year institutions increased by 84% after adjusting for inflation, from $9,890 (in 2018 dollars) to $18,210.
FIGURE SA-19A Average Institutional Grant Aid in 2018 Dollars, First-Time Full-Time Undergraduate Students, 2006-07 to 2018-19
06-07 07-08 08-09 09-10 10-11 11-12 12-13 13-14 14-15 15-16 16-17 18-1917-18
$9,890
$14,170
$18,210
$1,650
$2,640$3,520
$200 $250 $360$0
$5,000
$10,000
$15,000
$20,000
Aver
age
Inst
itutio
nal G
rant
Aid
per
Stu
dent
Private Nonprofit Four-Year
Public Four-Year
Public Two-Year
SOURCE: NCES, IPEDS Student Financial Aid data, 2007 through 2019.
FIGURE SA-19B Percentage of First-Time Full-Time Undergraduate Students Receiving Institutional Grant Aid, 2006-07 to 2018-19
06-07 07-08 08-09 09-10 10-11 11-12 12-13 13-14 14-15 15-16 16-17 18-1917-180%
20%
40%
60%
80%
100%
Perc
enta
ge o
f Stu
dent
s Re
ceiv
ing
Inst
itutio
nal G
rant
Aid
Private Nonprofit Four-Year
Public Four-Year
Public Two-Year
73%
80%82%
35%
46%
55%
12% 12%17%
SOURCE: NCES, IPEDS Student Financial Aid data, 2007 through 2019.
�■ Between 2006-07 and 2018-19, average institutional grant aid per first-time full-time student at public four-year institutions more than doubled after adjusting for inflation, from $1,650 to $3,520.
�■ Between 2006-07 and 2018-19, average institutional grant aid per first-time full-time student at public two-year institutions increased by 80% after adjusting for inflation, from $200 to $360.
�■ In 2018-19, the shares of first-time full-time undergraduate students receiving institutional grant aid were 17% at public two-year, 55% at public four-year, and 82% at private nonprofit four-year institutions.
�■ Between 2006-07 and 2018-19, the share of first-time full-time undergraduate students receiving institutional grant aid increased in all three sectors, with the largest increase in the public four-year sector, from 35% in 2006-07 to 55% in 2018-19.

For detailed data behind the graphs and additional information, please visit: research.collegeboard.org/trends. 49
Higher Education Emergency Relief FundThe average Higher Education Emergency Relief Fund (HEERF I) funding (including funding dedicated to both students and institutions) per full-time equivalent (FTE) student was about $900 at public two-year and public four-year institutions, $670 at private nonprofit four-year institutions, and $730 at for-profit institutions.
FIGURE SA-20A Average HEERF I Funding Per FTE Student, by Share of Pell Enrollees and by Sector
Aver
age
HEE
RF I
Fund
ing
Per F
TE S
tude
nt
$0
$1,000
$2,000
$3,000
$910
$730$710
$210
$1,030
$590
$1,730
$920
$670$540
$690
$2,630
$680
$1,000
$2,750
$1,220
Public Two-Year Public Four-Year Private Nonprofit Four-Year
For-Profit
All < 30% 30%–59% >=60%
Share of Undergraduates with Pell:
NOTE: Funding per FTE student includes both the student and institution portions.
SOURCE: U.S. Department of Education, Education Stabilization Fund, HEER Collected Data for Mar 13, 2020 – Dec 31, 2020 Reporting Period (provisional); NCES, IPEDS Fall Enrollment and Student Financial Aid data, 2019.
FIGURE SA-20B Distribution of HEERF I Funding and Full-Time Equivalent Students By Sector
Public Four-Year
Private Nonprofit Four-Year
Public Two-Year
For-Profit
0%
20%
40%
60%
100%
80%
Funds FTE Students
4%
29%
18%
48%
5%
27%
23%
45%
SOURCE: U.S. Department of Education, Education Stabilization Fund, HEER Collected Data for Mar 13, 2020 – Dec 31, 2020 Reporting Period (provisional); NCES, IPEDS Fall Enrollment data, 2019.
�■ HEERF I, which totaled $14 billion, was authorized as part of the March 2020 Coronavirus Aid, Relief, and Economic Security Act.
�■Within each sector, the average HEERF I funding per FTE student was higher at those institutions with larger shares of Pell enrollments. Average HEERF I funding per FTE was $680 at public four-year institutions with Pell enrollments less than 30% of the undergraduate student body, while it was $2,750 at institutions where Pell enrollment was 60% or higher.
�■ The public two-year sector enrolled 27% of all FTE students and received 29% of HEERF I funding in 2020. Public four-year institutions accounted for 45% of all FTE enrollment and received 48% of funding.
ALSO IMPORTANT:
�■ The Coronavirus Response and Relief Supplemental Appropriations Act, signed into law on December 27, 2020, authorized $21.2 billion in HEERF II for higher education. (https://www2.ed.gov/about/offices/list/ope/crrsaa.html)
�■ The American Rescue Plan, signed into law on March 11, 2021, provided $39.6 billion in HEERF III for higher education. (https://www2.ed.gov/about/offices/list/ope/arp.html)

50For detailed data behind the graphs and additional information, please visit: research.collegeboard.org/trends.
Notes and Sources: Trends in College Pricing
THE ANNUAL SURVEY OF COLLEGESPrices for the public two-year, public four-year, and private nonprofit four-year sectors in this report are based on data collected by College Board in its Annual Survey of Colleges. Tuition and fee figures are based on charges to full-time first-year undergraduate students over the course of a nine-month academic year of 30 semester hours or 45 quarter hours.
ENROLLMENT-WEIGHTED AND UNWEIGHTED DATAThis report provides enrollment-weighted average tuition prices. Charges of institutions with larger full-time enrollments are weighted more heavily than those of institutions with smaller enrollments.
Enrollment-weighted and unweighted averages describe different phenomena. The weighted averages may be more helpful to students and families in anticipating future education expenses. Some researchers, policy analysts, and academic administrators find unweighted averages useful in studying longitudinal trends and evaluating a particular institution’s practices against a larger set. Thus, we compute both weighted and unweighted averages. Tables reporting unweighted tuition data can be found online at research.collegeboard.org/trends.
Weighted averages of tuition prices are based on relevant populations:
�■ In-state tuition and fees are weighted by full-time undergraduate enrollment.
�■Out-of-state tuition and fees are calculated by adding the nonresident premium, weighted by full-time out-of-state enrollment, to average in-state tuition and fees.
In Trends in College Pricing 2019 and earlier editions, room and board charges as well as other expenses were weighted by the number of undergraduate students residing on campus for four-year institutions and by the number of commuter students for public two-year institutions. Books and supplies were weighted by full-time undergraduate enrollment. For 2020 and 2021, these budget items are calculated by applying the median one-year percent change to the previous year’s average.
LONGITUDINAL DATAIn online Table CP-2, tuition averages for years prior to 1987-88 are from the Integrated Postsecondary Education Data System (IPEDS). The two data sets, IPEDS and College Board’s Annual Survey of Colleges, track very closely, but IPEDS averages are weighted by full-time equivalent enrollments, while the Annual Survey of Colleges prices are weighted by full-time enrollments. In addition, IPEDS tuition and fee data may be based on 24 semester hours while the Annual Survey of Colleges data are based on 30 semester hours.
NET PRICE CALCULATIONS Average net prices shown in Figures CP-8, CP-9, and CP-10 are calculated by subtracting from published prices average grant aid per first-time full-time undergraduate student in each sector. Prices are from College Board’s Annual Survey of Colleges. Average grant aid is calculated using IPEDS Student Financial Aid survey. Grant aid includes federal, state, and institutional grants.
This year’s net prices are not comparable with those reported in Trends in College Pricing 2019 and earlier editions because of changes in methodology.
INFLATION ADJUSTMENT We use the annual Consumer Price Index for all urban consumers (CPI-U) to adjust for inflation. Because the annual 2021 CPI is not yet available at the time of analysis, we estimate the 2021 CPI by assuming an annual inflation rate equal to the percent change in the average January to August 2021 CPI from the same months in 2020. In prior years, we used July CPI to adjust for inflation. See www.bls.gov/data/ for changes in the CPI-U over time. Online Table CP-A1 provides CPI data used to adjust for inflation.

51For detailed data behind the graphs and additional information, please visit: research.collegeboard.org/trends.
Notes and Sources: Trends in Student Aid
Campus-Based Aid (FWS, Perkins, and FSEOG) and ACG/SMART Grants: U.S. Department of Education, Annual Federal Program Data Books; Federal Student Aid Data Center, Title IV Program Volume Reports. Federal Work-Study and Federal Supplemental Educational Opportunity Grant (FSEOG) amounts include allocated federal funds only. Institutional matching funds required since 1989-90 for FSEOG are reported under institutional grants. No funds were appropriated for new federal capital contributions to the Perkins loan program after FY06 and the authority for schools to make new Perkins loans ended on September 30, 2017.
Federal Tax Credits and Deductions: Statistics of Income, Individual Income Tax Returns, Line Item Estimates 2018 (Publication 4801) and Complete Report (Publication 1304), Tables 1.3, 1.4, and 3.3. Data on education tax credits are authors’ estimates based on IRS data on the volume of Hope, Lifetime Learning, and American Opportunity credits for tax years 1998 and later. A portion of nonrefundable dollars claimed on nontaxable returns is excluded to account for credits that do not reduce tax liability. Tax deductions are based on IRS Statistics of Income Table 1.4. The savings from the tuition tax deduction are estimated by the authors based on the marginal tax rates applied to the taxable income of the taxpayers in each income bracket claiming the deduction on taxable returns. Calendar year amounts are split between the two associated academic years.
Federal Subsidized and Unsubsidized Student Loans: 2009-10 and prior: unpublished data provided by the U.S. Department of Education staff; 2010-11 and after: Federal Student Aid Data Center, Title IV Program Volume Reports. Because the Federal Student Aid Data Center will continue to update the loan volume after each academic year ends, we adjusted the 2020-21 data (released in late 2021) using the average of the percentage changes between: (1) July 2020 and July 2021 for the reported 2019-20 loan volume; (2) July 2019 and July 2020 for the reported 2018-19 loan volume; and (3) July 2018 and July 2019 for the reported 2017-18 loan volume.
Prior to 1993-94, federal Subsidized and Unsubsidized loans for students were made by banks and other private lenders and guaranteed by the federal government. From 1994-95 through 2009-10, the guaranteed loan program, known as the Federal Family Education Loan Program (FFELP), continued alongside the Federal Direct Loan Program (FDLP), which lends federal funds to students. Beginning in 2010-11, all of the loans are Federal Direct Subsidized or Unsubsidized loans.
Subsidized loans are need-based student loans for which the federal government pays the interest while the student is in school and during a six-month grace period thereafter. Prior to June 2012, these loans were available to both undergraduate and graduate students, but the Budget Control Act of 2011 eliminated the program for graduate students, whose federal loans are now all Unsubsidized or grad PLUS loans. Interest accrues on Unsubsidized loans from the time they are disbursed.
Institutional Grants: 2019-20 and prior: IPEDS Finance data. Estimated for 2020-21. Estimated figures represent best approximations and are updated each year as additional information becomes available.
Nonfederal Loans: Estimates of nonfederal borrowing rely on data from MeasureOne. Between 2011-12 and 2016-17, we supplemented these data with information from the Consumer Bankers Association and the Consumer Financial Protection Bureau. Earlier data are based on information provided by lenders supplemented by data from annual reports and from National Postsecondary Student Aid Study (NPSAS). Estimates of institutional lending for earlier years are based on NPSAS, as well as a survey of institutions conducted for College Board by the National Association of Student Financial Aid Administrators (NASFAA). We no longer report state and institutional loans separately from private loans because of changes in MeasureOne’s methodology and data availability issues.
Pell Grant Program: 2017-18 and prior: Federal Pell Grant Program End-of-Year Report; 2018-19 and after: Federal Student Aid Data Center, Title IV Program Volume Reports.
Private and Employer Grants: Estimates are based on data included in NPSAS and College Board’s Annual Survey of Colleges.
State Grant Programs: 20th through 51st Annual Survey Reports of the National Association of State Student Grant and Aid Programs (NASSGAP) for 1988-89 to 2019-20 and estimated for 2020-21.
Veterans’ Benefits: Benefits Program series (annual publication for each fiscal year), U.S. Department of Veterans Affairs, Office of Budget and Finance. Veterans’ benefits are payments for postsecondary education and training to veterans and their dependents, including the Post-9/11 GI Bill established in 2009-10 and all programs established earlier. The Iraq and Afghanistan Service Grants program, begun in 2010-11, provides non-need-based grants for students whose parent or guardian was a member of the Armed Forces who died in Iraq or Afghanistan as a result of performing military service after Sept. 11, 2001. Estimates include benefits for active duty military members.

About College BoardCollege Board is a mission-driven not-for-profit organization that connects
students to college success and opportunity. Founded in 1900, College Board
was created to expand access to higher education. Today, the membership
association is made up of over 6,000 of the world’s leading educational institutions
and is dedicated to promoting excellence and equity in education. Each year,
College Board helps more than seven million students prepare for a successful
transition to college through programs and services in college readiness and
college success—including the SAT® and the Advanced Placement Program®.
The organization also serves the education community through research and
advocacy on behalf of students, educators, and schools. For further information,
visit www.collegeboard.org.
Trends in Higher EducationThe Trends in Higher Education publications include Trends in College Pricing
and Trends in Student Aid, Education Pays, and other research briefs. These reports
are designed to provide a foundation of evidence to strengthen policy discussions
and decisions.
The tables supporting all of the graphs in this report, a PDF version of the report, and
a PowerPoint file containing individual slides for all of the graphs are available on
our website research.collegeboard.org/trends.
Please feel free to cite or reproduce the data in this report for noncommercial purposes with proper attribution.
For inquiries, please contact: [email protected].
© 2021 College Board. College Board, Advanced Placement Program, SAT, and the acorn logo are registered
trademarks of College Board. All other marks are the property of their respective owners.
Visit College Board on the web: collegeboard.org.
MAR-1311-2021October 2021

MAR-1311 October 2021
collegeboard.org research.collegeboard.org/trends