trends in higher education series college board advocacy & policy
TRANSCRIPT
College Board Advocacy & Policy Center July 2012
Analysis Brief
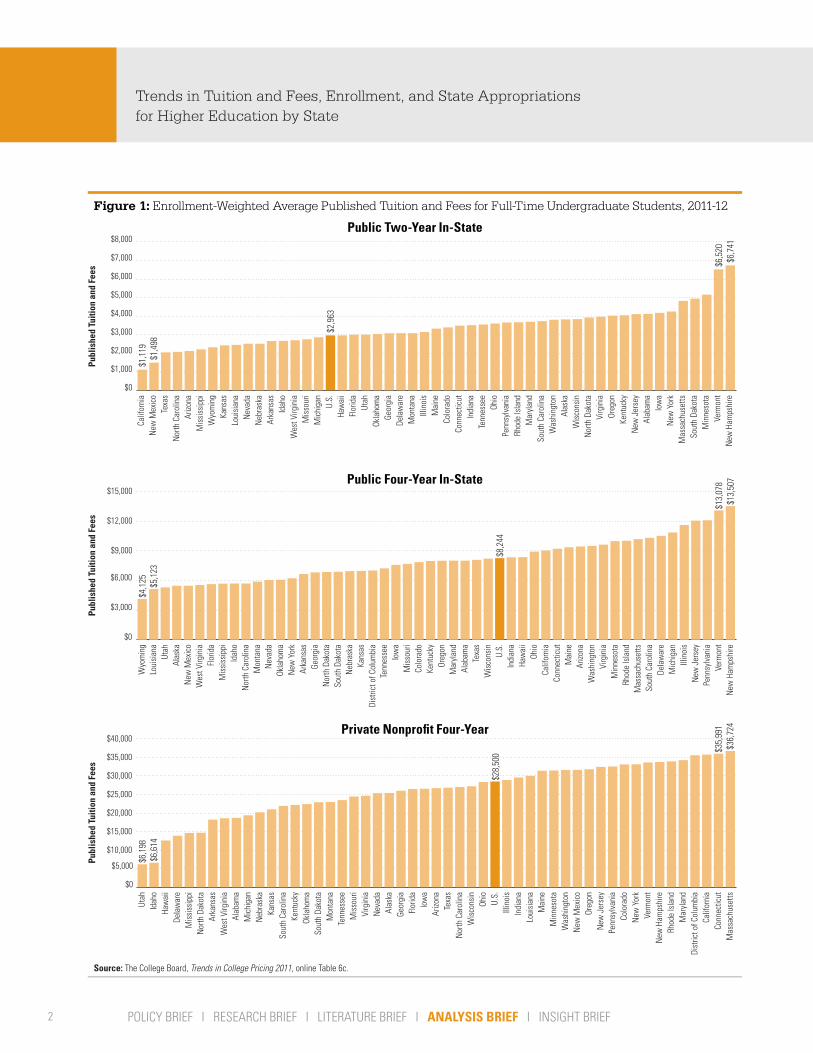
Published Tuition and Fees by State, 2011-12For the 2011-12 academic year, the average enrollment-weighted published price for in-state tuition and fees for full-time undergraduate students in the public two-year sector was $2,963 for the nation as a whole. Average published prices in the public two-year sector varied widely across states, ranging from $1,119 in California and $1,498 in New Mexico to $6,520 in Vermont and $6,741 in New Hampshire (Figure 1).
In 2011-12, the average published price for in-state tuition and fees for full-time public four-year undergraduate students in the nation was $8,244. Average published prices in this sector ranged from $4,125 in Wyoming and $5,123 in Louisiana to $13,078 in Vermont and $13,507 in New Hampshire (Figure 1).
Average published prices for tuition and fees in 2011-12 for the private nonprofit four-year sector ranged from $6,198 in Utah and $6,614 in Idaho to more than $35,000 in the District of Columbia, California, Connecticut, and Massachusetts (Figure 1). The national average was $28,500.
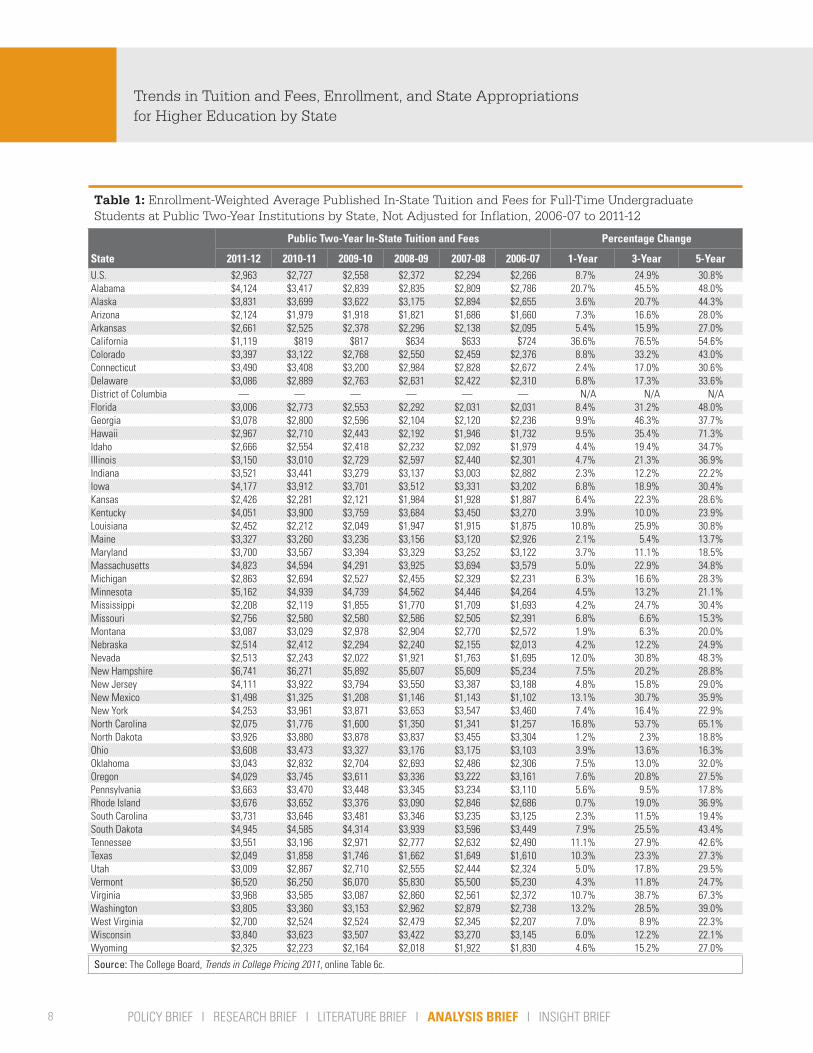
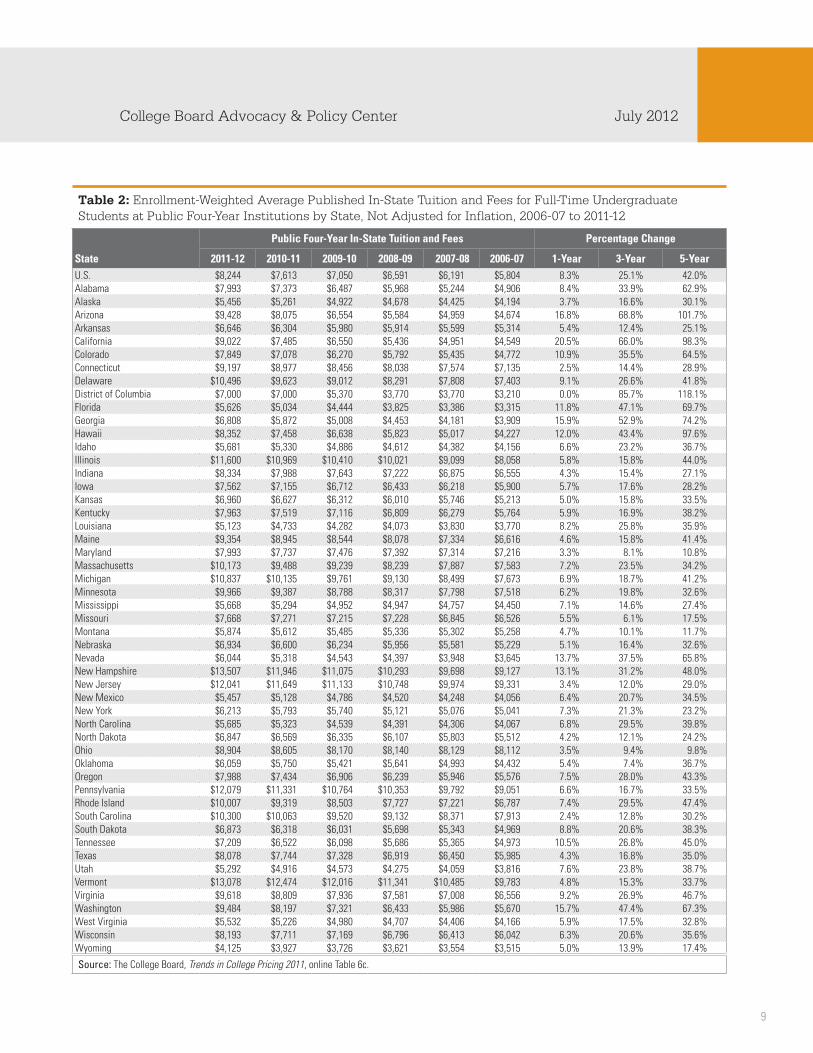
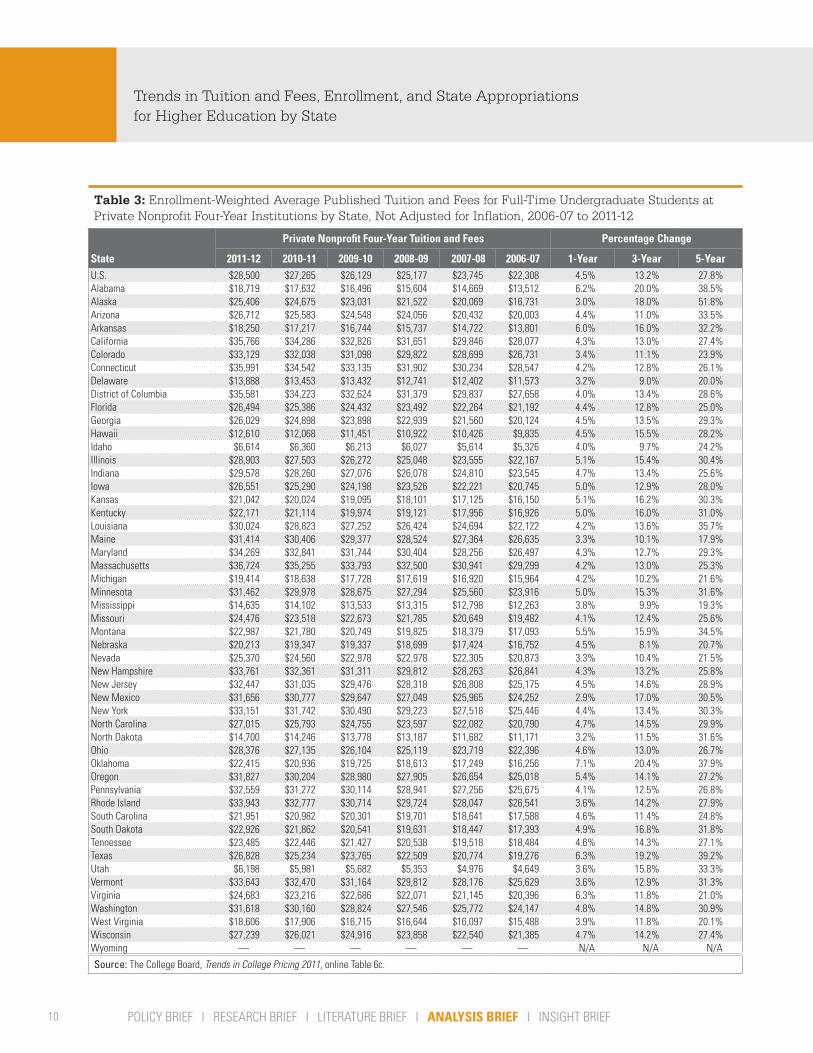
Published Tuition and Fees by State, 2006-07 to 2011-12Tables 1, 2, and 3 show the average published tuition and fees by state from 2006-07 through 2011-12, as well as the one-year, three-year, and five-year percentage changes in tuition and fees for the public two-year, public four-year, and private nonprofit four-year sectors, respectively.
Jennifer MaIndependent Policy AnalystThe College Board
Sandy BaumSenior Fellow, George Washington University Graduate School of Education and Human Development, and Consultant to the College Board
Trends in Tuition and Fees, Enrollment, and State Appropriations for Higher Education by State
Summary
In the past few years, a weak economy has put increasing pressure on state and institutional budgets. State appropriations for higher education have not been able to keep pace with increases in enrollment, and college prices continue to rise faster than average prices in the economy. In this analysis brief, we present information on recent trends in tuition and fees, enrollment, and state support for higher education by state, paying particular attention to the public two-year and four-year sectors.
Trends in Higher Education Series
Trends in Tuition and Fees, Enrollment, and State Appropriations for Higher Education by State
2 POLICY BRIEF I RESEARCH BRIEF I LITERATURE BRIEF I ANALYSIS BRIEF I INSIGHT BRIEF
Figure 1: Enrollment-Weighted Average Published Tuition and Fees for Full-Time Undergraduate Students, 2011-12
Source: The College Board, Trends in College Pricing 2011, online Table 6c.
Publ
ishe
d Tu
ition
and
Fee
sPu
blis
hed
Tuiti
on a
nd F
ees
Publ
ishe
d Tu
ition
and
Fee
s
Public Two-Year In-State
$0
$1,000
$2,000
$3,000
$4,000
$5,000
$6,000
$7,000
$8,000
New
Ham
pshi
reVe
rmon
tM
inne
sota
Sout
h Da
kota
Mas
sach
uset
tsN
ew Y
ork
Iow
aAl
abam
aN
ew J
erse
yKe
ntuc
kyOr
egon
Virg
inia
Nor
th D
akot
aW
isco
nsin
Alas
kaW
ashi
ngto
nSo
uth
Caro
lina
Mar
ylan
dRh
ode
Isla
ndPe
nnsy
lvan
iaOh
ioTe
nnes
see
Indi
ana
Conn
ectic
utCo
lora
doM
aine
Illin
ois
Mon
tana
Dela
war
eGe
orgi
aOk
laho
ma
Utah
Flor
ida
Haw
aii
U.S.
Mic
higa
nM
isso
uri
Wes
t Virg
inia
Idah
oAr
kans
asN
ebra
ska
Nev
ada
Loui
sian
aKa
nsas
Wyo
min
gM
issi
ssip
piAr
izona
Nor
th C
arol
ina
Texa
sN
ew M
exic
oCa
lifor
nia
Public Four-Year In-State
$0
$3,000
$6,000
$9,000
$12,000
$15,000
New
Ham
pshi
reVe
rmon
tPe
nnsy
lvan
iaN
ew J
erse
yIll
inoi
sM
ichi
gan
Dela
war
eSo
uth
Caro
lina
Mas
sach
uset
tsRh
ode
Isla
ndM
inne
sota
Virg
inia
Was
hing
ton
Arizo
naM
aine
Conn
ectic
utCa
lifor
nia
Ohio
Haw
aii
Indi
ana
U.S.
Wis
cons
inTe
xas
Alab
ama
Mar
ylan
dOr
egon
Kent
ucky
Colo
rado
Mis
sour
iIo
wa
Tenn
esse
eDi
stric
t of C
olum
bia
Kans
asN
ebra
ska
Sout
h Da
kota
Nor
th D
akot
aGe
orgi
aAr
kans
asN
ew Y
ork
Okla
hom
aN
evad
aM
onta
naN
orth
Car
olin
aId
aho
Mis
siss
ippi
Flor
ida
Wes
t Virg
inia
New
Mex
ico
Alas
kaUt
ahLo
uisi
ana
Wyo
min
g
Private Nonprofit Four-Year
$0
$5,000
$10,000
$15,000
$20,000
$25,000
$30,000
$35,000
$40,000M
assa
chus
etts
Conn
ectic
utCa
lifor
nia
Dist
rict o
f Col
umbi
aM
aryl
and
Rhod
e Is
land
New
Ham
pshi
reVe
rmon
tN
ew Y
ork
Colo
rado
Penn
sylv
ania
New
Jer
sey
Oreg
onN
ew M
exic
oW
ashi
ngto
nM
inne
sota
Mai
neLo
uisi
ana
Indi
ana
Illin
ois
U.S.
Ohio
Wis
cons
inN
orth
Car
olin
aTe
xas
Arizo
naIo
wa
Flor
ida
Geor
gia
Alas
kaN
evad
aVi
rgin
iaM
isso
uri
Tenn
esse
eM
onta
naSo
uth
Dako
taOk
laho
ma
Kent
ucky
Sout
h Ca
rolin
aKa
nsas
Neb
rask
aM
ichi
gan
Alab
ama
Wes
t Virg
inia
Arka
nsas
Nor
th D
akot
aM
issi
ssip
piDe
law
are
Haw
aii
Idah
oUt
ah$1
,498
$2,9
63
$6,5
20$6
,741
$1,1
19$5
,123
$8,2
44
$13,
078
$13,
507
$4,1
25$6
,614
$28,
500 $3
5,99
1$3
6,72
4
$6,1
98
College Board Advocacy & Policy Center July 2012
3
In 2011-12, the average published in-state tuition and fees in the public two-year sector in the nation increased by 8.7% from a year earlier. The state of California, which enrolls about 15% of the nation’s full-time students in this sector, had a 37% increase in tuition and fees at public two-year colleges. Alabama and North Carolina increased published tuition and fees at public two-year colleges by 21% and 17%, respectively. At the other end of the spectrum, increases were less than 2% in Rhode Island, Montana, and North Dakota (Table 1).
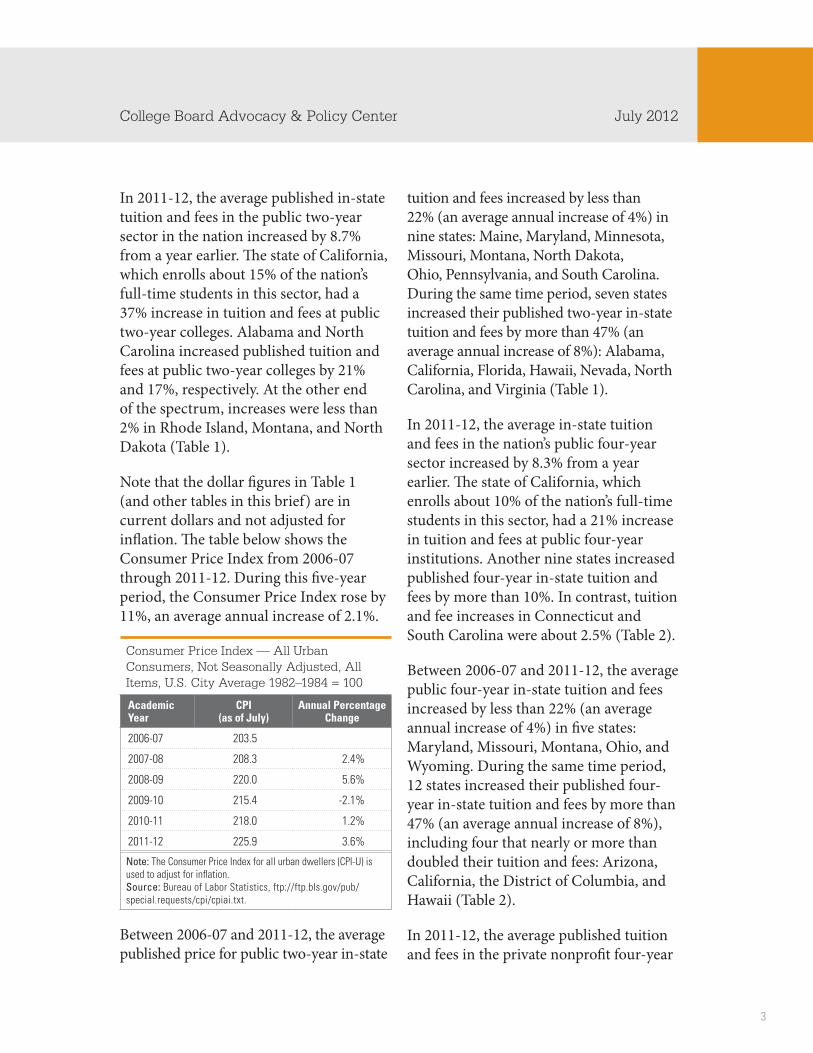
Note that the dollar figures in Table 1 (and other tables in this brief) are in current dollars and not adjusted for inflation. The table below shows the Consumer Price Index from 2006-07 through 2011-12. During this five-year period, the Consumer Price Index rose by 11%, an average annual increase of 2.1%.
Consumer Price Index — All Urban Consumers, Not Seasonally Adjusted, All Items, U.S. City Average 1982–1984 = 100
Academic Year
CPI (as of July)
Annual Percentage Change
2006-07 203.5
2007-08 208.3 2.4%
2008-09 220.0 5.6%
2009-10 215.4 -2.1%
2010-11 218.0 1.2%
2011-12 225.9 3.6%
Note: The Consumer Price Index for all urban dwellers (CPI-U) is used to adjust for inflation. Source: Bureau of Labor Statistics, ftp://ftp.bls.gov/pub/special.requests/cpi/cpiai.txt.
Between 2006-07 and 2011-12, the average published price for public two-year in-state
tuition and fees increased by less than 22% (an average annual increase of 4%) in nine states: Maine, Maryland, Minnesota, Missouri, Montana, North Dakota, Ohio, Pennsylvania, and South Carolina. During the same time period, seven states increased their published two-year in-state tuition and fees by more than 47% (an average annual increase of 8%): Alabama, California, Florida, Hawaii, Nevada, North Carolina, and Virginia (Table 1).
In 2011-12, the average in-state tuition and fees in the nation’s public four-year sector increased by 8.3% from a year earlier. The state of California, which enrolls about 10% of the nation’s full-time students in this sector, had a 21% increase in tuition and fees at public four-year institutions. Another nine states increased published four-year in-state tuition and fees by more than 10%. In contrast, tuition and fee increases in Connecticut and South Carolina were about 2.5% (Table 2).
Between 2006-07 and 2011-12, the average public four-year in-state tuition and fees increased by less than 22% (an average annual increase of 4%) in five states: Maryland, Missouri, Montana, Ohio, and Wyoming. During the same time period, 12 states increased their published four-year in-state tuition and fees by more than 47% (an average annual increase of 8%), including four that nearly or more than doubled their tuition and fees: Arizona, California, the District of Columbia, and Hawaii (Table 2).
In 2011-12, the average published tuition and fees in the private nonprofit four-year
Trends in Tuition and Fees, Enrollment, and State Appropriations for Higher Education by State
4 POLICY BRIEF I RESEARCH BRIEF I LITERATURE BRIEF I ANALYSIS BRIEF I INSIGHT BRIEF
sector increased by a smaller percentage than in the public sector. The increase in tuition and fees in the private nonprofit four-year sector was 4.5% for the nation as a whole and ranged from 2.9% in New Mexico to 7.1% in Oklahoma. Between 2006-07 and 2011-12, tuition and fees in this sector increased by less than 22% in eight states and by more than 47% in just one state, Alaska (Table 3; note there is only one private nonprofit four-year institution in Alaska).
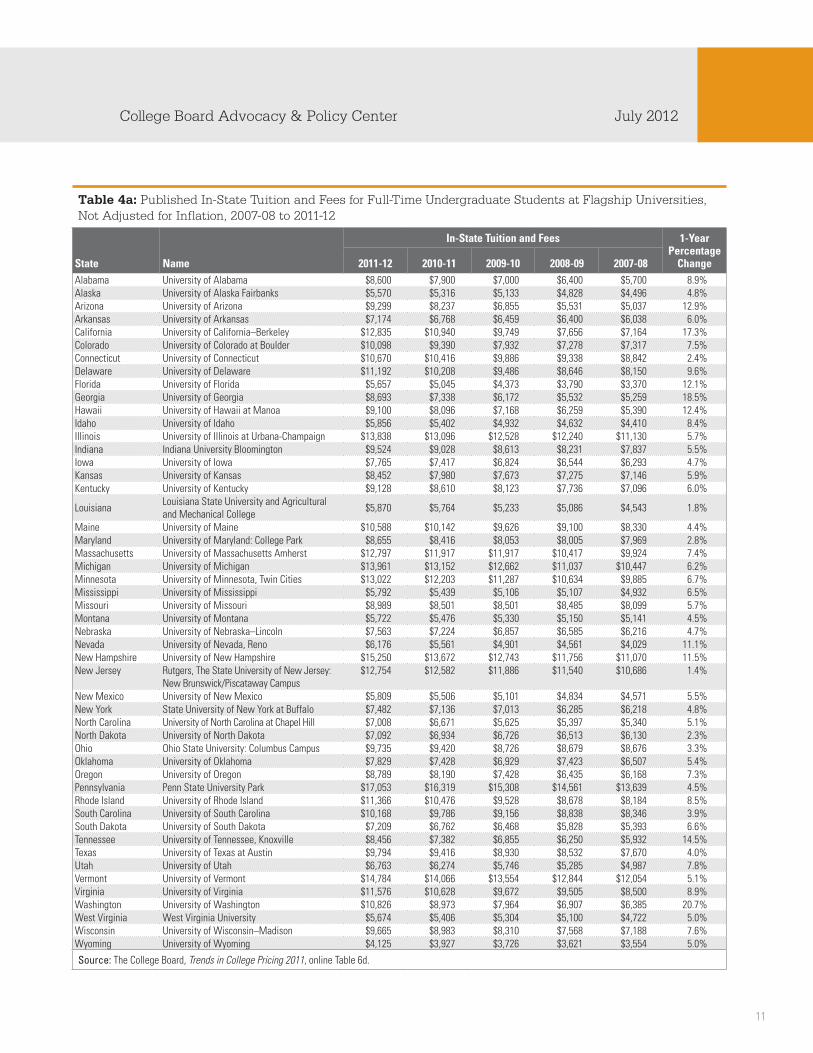
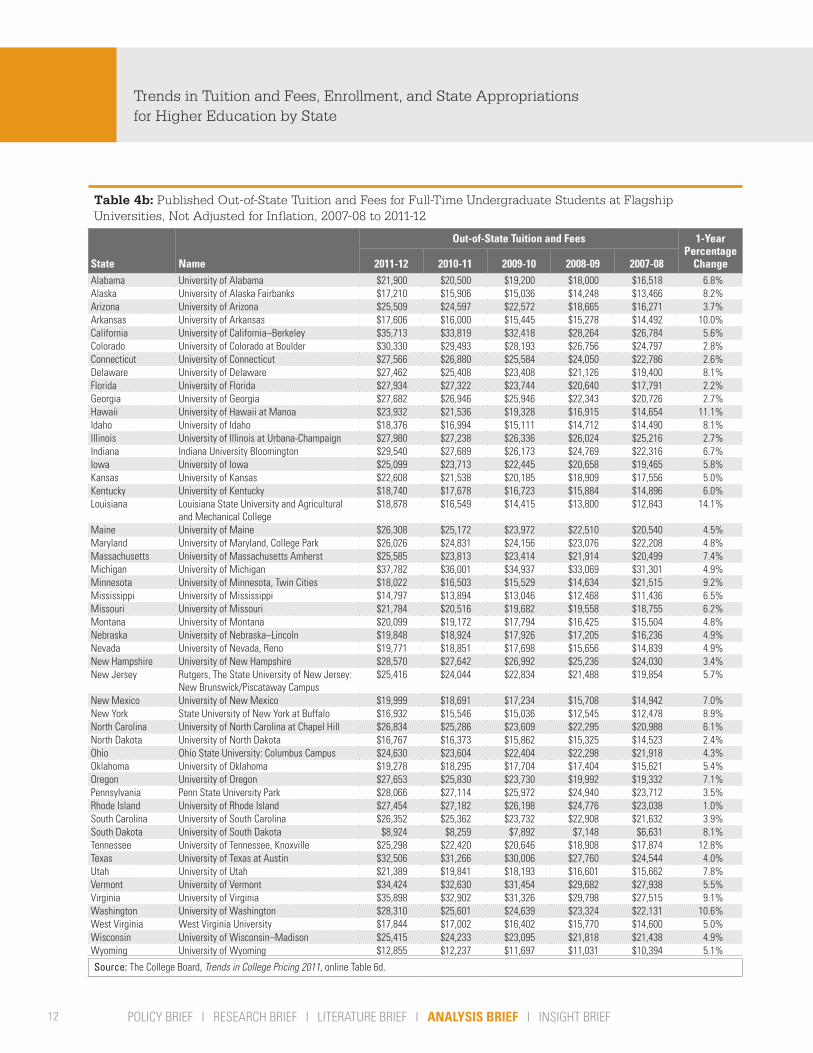
Published Tuition and Fees at State Flagship Universities, 2007-08 to 2011-12Tables 4a and 4b show the published tuition and fees at flagship universities for in-state and out-of-state students, respectively.
Typically, published tuition and fee prices at flagship universities are higher than those at other public four-year institutions in the state. In 2011-12, published in-state tuition and fees at flagship universities ranged from a low of $4,125 at the University of Wyoming (the only public four-year institution in the state) to a high of $17,053 at Penn State University Park (Table 4a). (As shown in Table 2, the average 2011-12 public four-year in-state tuition and fee price in Pennsylvania was $12,079.)
In 2011-12, published out-of-state prices for tuition and fees at flagship universities varied widely across states, ranging from $8,924 at the University of South Dakota to more than $35,000 at the University of California–Berkeley, the University of Virginia, and the University of Michigan (Table 4b).
Full-time enrollment at flagship universities ranged from less than 10,000 at six states’ flagship universities (Alaska, Idaho, Maine, North Dakota, South Dakota, and Wyoming) to more than 30,000 at six states’ flagship universities (Florida, Illinois, Indiana, Ohio, Pennsylvania, and Texas) in fall 2010 (not shown).
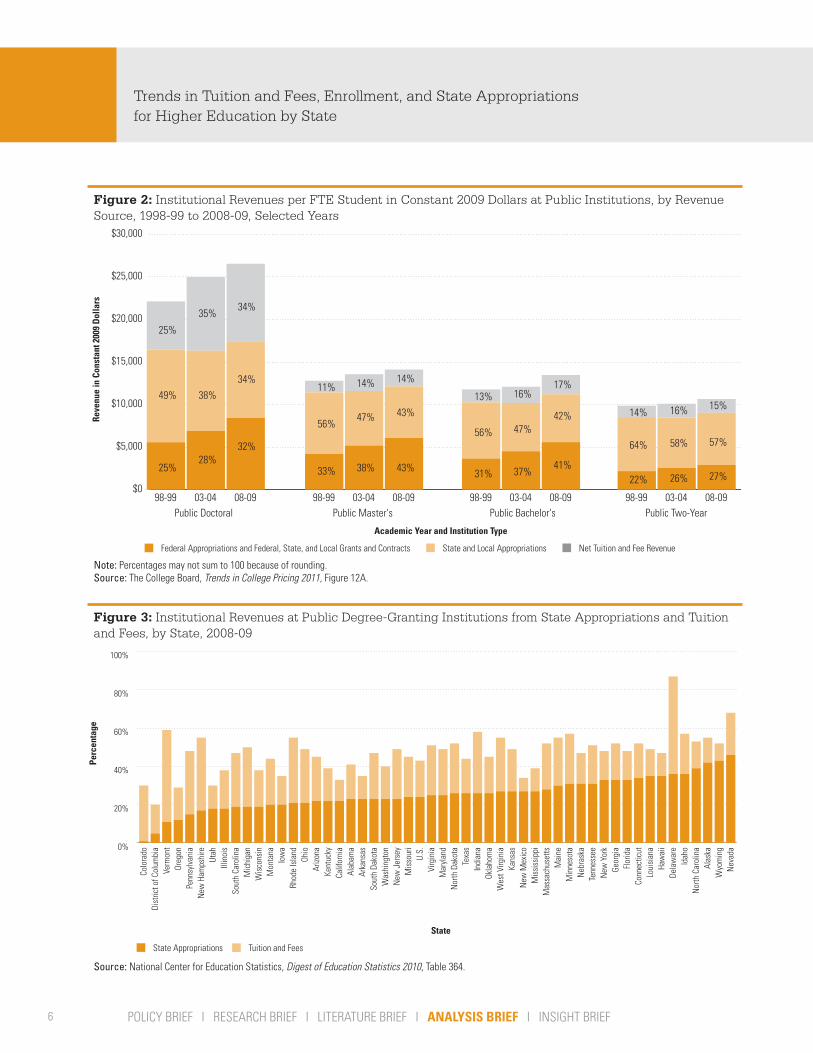
State Appropriations for Higher EducationState appropriations are a major source of revenue for public colleges and universities. Over the decade from 1998-99 to 2008-09, the average share of revenues coming from state and local appropriations decreased and the average share of revenues coming from net tuition increased for all types of public institutions (Figure 2).
In 2008-09, state appropriations contributed 24% of total revenues at public degree-granting institutions. However, there are vast differences in the level of state support for higher education among states. For example, while state appropriations in Colorado and the District of Columbia contributed less than 6% of total revenues, state appropriations in Alaska, Nevada, and Wyoming contributed more than 40% of total revenues at public degree-granting institutions (Figure 3).
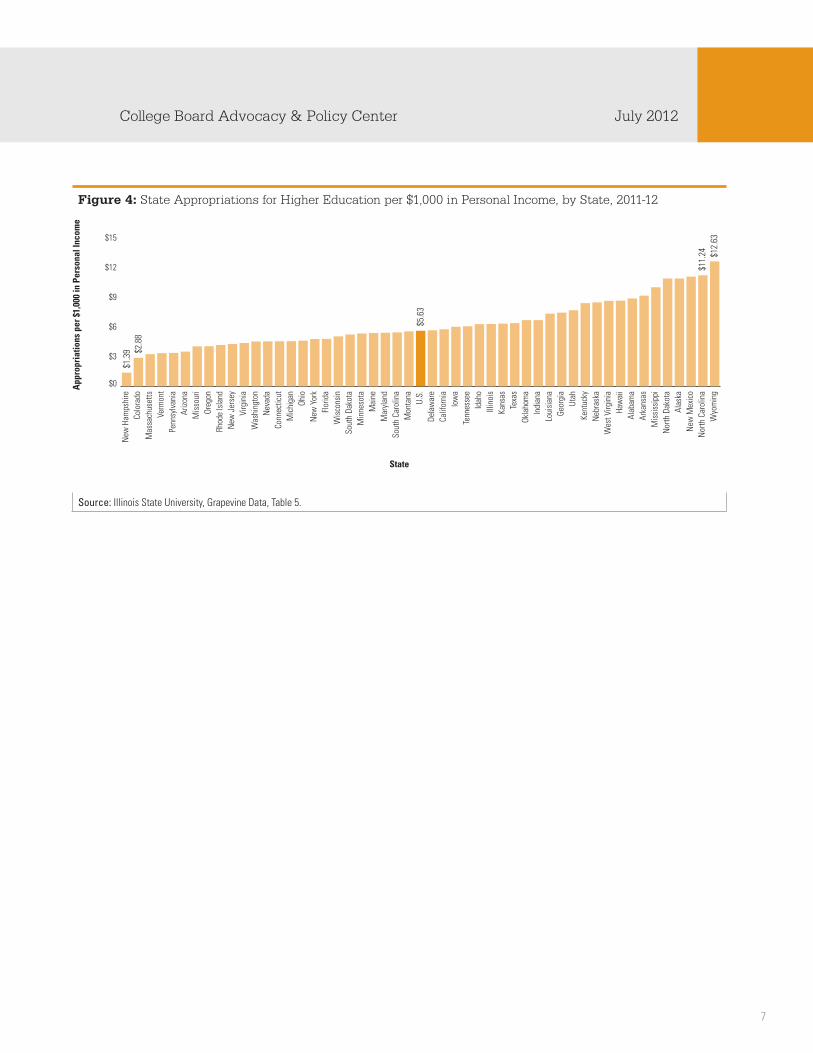
Differences in state support for higher education among states are also shown in Figure 4. In 2011-12, while average state appropriations per $1,000 of personal income were $5.63 for the nation, New Hampshire provided $1.39 and Colorado
College Board Advocacy & Policy Center July 2012
5
provided $2.88 per $1,000 of personal income for higher education operations. At the other end of the spectrum, appropriations per $1,000 of personal income were $11.09 in New Mexico, $11.24 in North Carolina, and $12.63 in Wyoming (Figure 4).
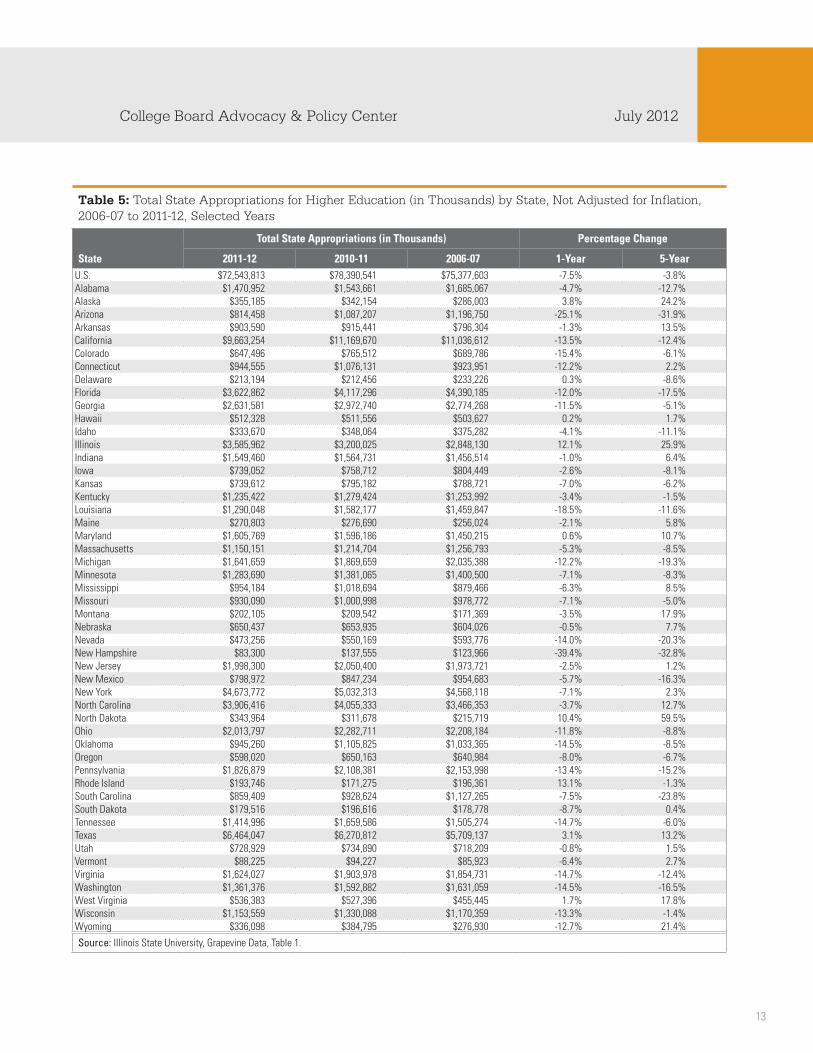
Table 5 shows state appropriations for 2006-07, 2010-11, and 2011-12. In 2011-12, total state appropriations in the U.S. declined by 7.5% from a year earlier. All but nine states saw a decline in state appropriations for higher education in 2011-12. The largest decline was 39% in New Hampshire, followed by 25% in Arizona. Another 16 states saw a decline of more than 10%. Three states (Illinois, North Dakota, and Rhode Island) increased their appropriations by more than 10%. Twenty states had higher appropriations and 30 had lower appropriations in 2011-12 than five years earlier. Note that these figures have not been adjusted for inflation.
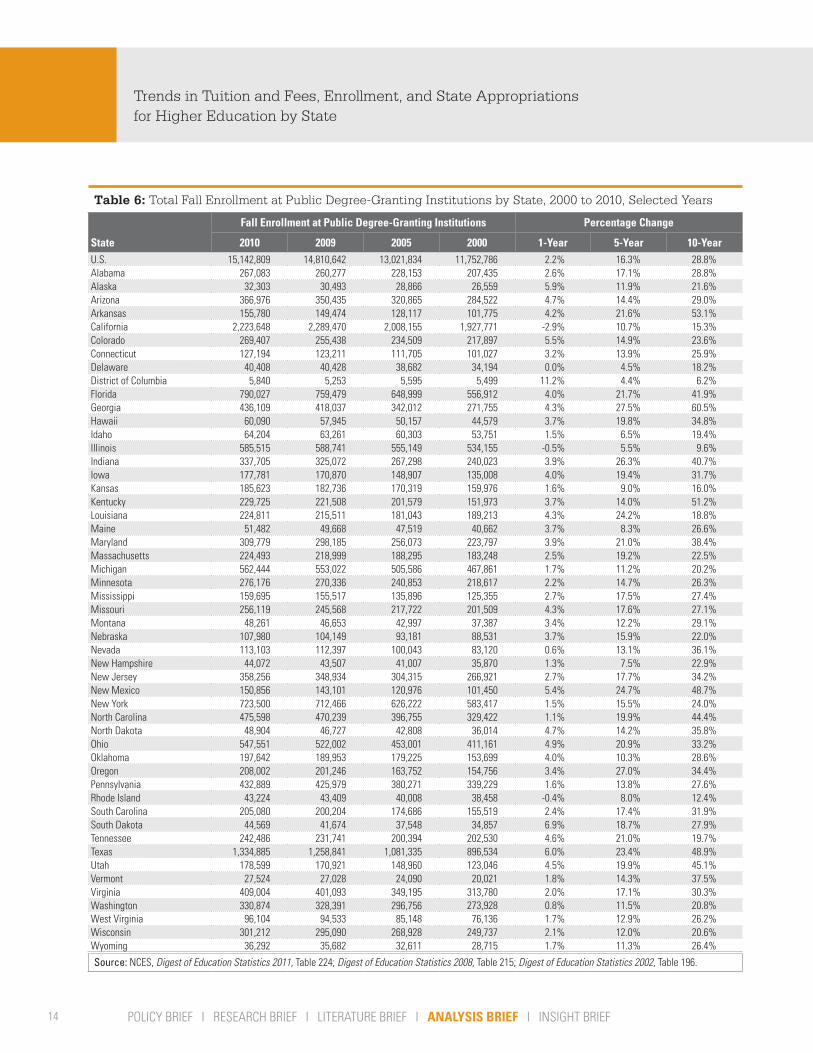
EnrollmentDeclines in state appropriations were accompanied by increases in the number of students enrolled in higher education. In fall 2010, 15.1 million students were enrolled in public degree-granting institutions, up 16% from five years before. California had the largest enrollment (2.2 million), followed by Texas (1.3 million). The District of Columbia enrolled 5,800 students and Vermont enrolled 27,500. All states saw an increase in total enrollment at public institutions from fall 2005 to fall 2010, with increases ranging from less than
10% in eight states to more than 20% in 11 states (Table 6).
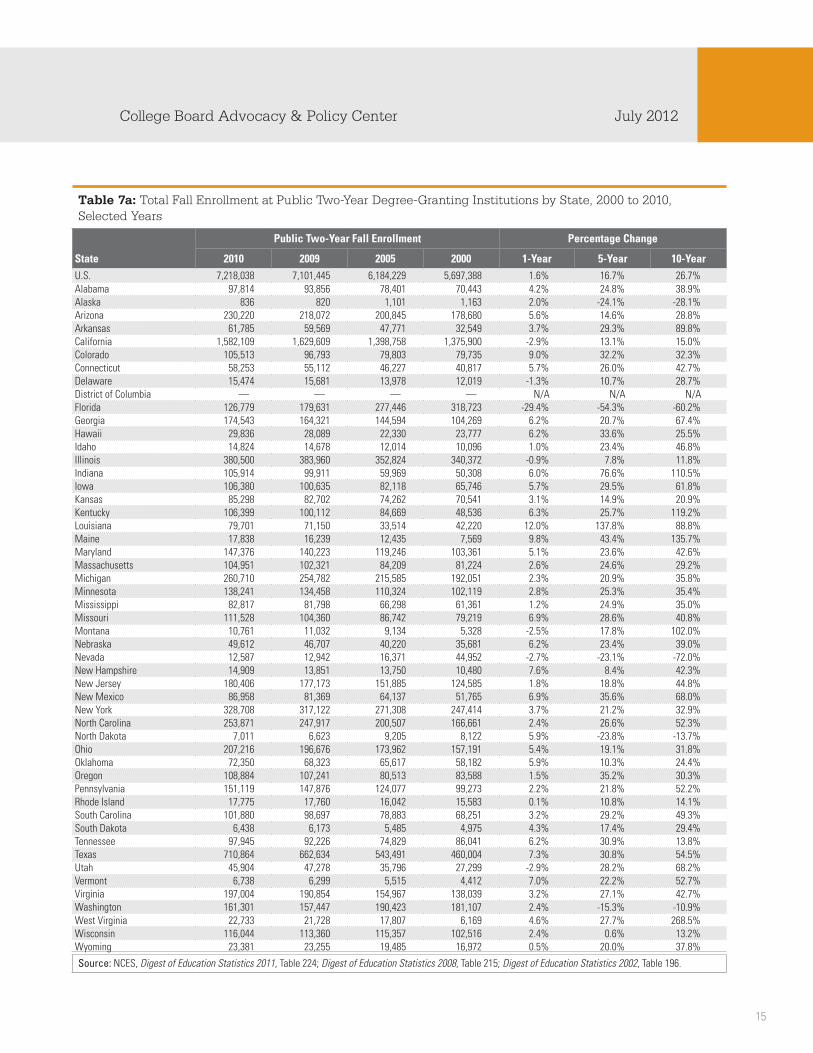
Tables 7a and 7b show total fall enrollment for the public two-year and public four-year sectors, respectively. Alaska is the only state that saw a decrease in total enrollment in the public two-year sector from 2005 to 2010. (Because of the reclassification of some two-year colleges as four-year institutions, the total enrollment numbers in 2005 and 2010 in Florida, Nevada, North Dakota, and Washington are based on different numbers of institutions and are not comparable.) Total fall enrollment in the public two-year sector in Indiana increased by 77% from 2005 to 2010. Total fall enrollment in the public two-year sector in Louisiana more than doubled from 2005 to 2010. This is because of the unusually low enrollment number in fall 2005 due to Hurricane Katrina (Table 7a).
Between fall 2005 and fall 2010, the total fall enrollment in the public four-year sector decreased slightly in Louisiana, Maine, and Wyoming. All other states saw an increase. In general, the increase in total fall enrollment in the public four-year sector was much smaller than that in the public two-year sector (Table 7b).
6 POLICY BRIEF I RESEARCH BRIEF I LITERATURE BRIEF I ANALYSIS BRIEF I INSIGHT BRIEF
Trends in Tuition and Fees, Enrollment, and State Appropriations for Higher Education by State
Figure 2: Institutional Revenues per FTE Student in Constant 2009 Dollars at Public Institutions, by Revenue Source, 1998-99 to 2008-09, Selected Years
Academic Year and Institution Type
Federal Appropriations and Federal, State, and Local Grants and Contracts State and Local Appropriations Net Tuition and Fee Revenue
Reve
nue
in C
onst
ant 2
009
Dol
lars
$0
$5,000
$10,000
$15,000
$20,000
$25,000
$30,000
98-99 03-04 08-09 98-99 03-04 08-09 98-99 03-04 08-09 98-99 03-04 08-09Public Doctoral Public Master's Public Bachelor's Public Two-Year
25%
25%
49%
28%
35%
38%
32%
34%
34%
33%
11%
56%
38%
14%
47%
43%
14%
43%
31%
13%
56%
37%
16%
47%
41%
17%
42%
22%
14%
64%
26%
16%
58%
27%
15%
57%
Note: Percentages may not sum to 100 because of rounding.Source: The College Board, Trends in College Pricing 2011, Figure 12A.
Figure 3: Institutional Revenues at Public Degree-Granting Institutions from State Appropriations and Tuition and Fees, by State, 2008-09
State
Tuition and FeesState Appropriations
Percentage
0%
20%
40%
60%
80%
100%
Nev
ada
Wyo
min
gAl
aska
Nor
th C
arol
ina
Idah
oDe
law
are
Haw
aii
Loui
sian
aCo
nnec
ticut
Flor
ida
Geor
gia
New
Yor
kTe
nnes
see
Neb
rask
aM
inne
sota
Mai
neM
assa
chus
etts
Mis
siss
ippi
New
Mex
ico
Kans
asW
est V
irgin
iaOk
laho
ma
Indi
ana
Texa
sN
orth
Dak
ota
Mar
ylan
dVi
rgin
iaU.
S.M
isso
uri
New
Jer
sey
Was
hing
ton
Sout
h Da
kota
Arka
nsas
Alab
ama
Calif
orni
aKe
ntuc
kyAr
izona
Ohio
Rhod
e Is
land
Iow
aM
onta
naW
isco
nsin
Mic
higa
nSo
uth
Caro
lina
Illin
ois
Utah
New
Ham
pshi
rePe
nnsy
lvan
iaOr
egon
Verm
ont
Dist
rict o
f Col
umbi
aCo
lora
do
Source: National Center for Education Statistics, Digest of Education Statistics 2010, Table 364.
7
College Board Advocacy & Policy Center July 2012
Figure 4: State Appropriations for Higher Education per $1,000 in Personal Income, by State, 2011-12
App
ropr
iatio
ns p
er $
1,00
0 in
Per
sona
l Inc
ome
$0
$3
$6
$9
$12
$15
Wyo
min
gN
orth
Car
olin
aN
ew M
exic
oAl
aska
Nor
th D
akot
aM
issi
ssip
piAr
kans
asAl
abam
aHa
wai
iW
est V
irgin
iaN
ebra
ska
Kent
ucky
Utah
Geor
gia
Loui
sian
aIn
dian
aOk
laho
ma
Texa
sKa
nsas
Illin
ois
Idah
oTe
nnes
see
Iow
aCa
lifor
nia
Dela
war
eU.
S.M
onta
naSo
uth
Caro
lina
Mar
ylan
dM
aine
Min
neso
taSo
uth
Dako
taW
isco
nsin
Flor
ida
New
Yor
kOh
ioM
ichi
gan
Conn
ectic
utN
evad
aW
ashi
ngto
nVi
rgin
iaN
ew J
erse
yRh
ode
Isla
ndOr
egon
Mis
sour
iAr
izona
Penn
sylv
ania
Verm
ont
Mas
sach
uset
tsCo
lora
doN
ew H
amps
hire
$2.8
8
$5.6
3
$11.
24 $12.
63
$1.3
9
State
Source: Illinois State University, Grapevine Data, Table 5.
8 POLICY BRIEF I RESEARCH BRIEF I LITERATURE BRIEF I ANALYSIS BRIEF I INSIGHT BRIEF
Trends in Tuition and Fees, Enrollment, and State Appropriations for Higher Education by State
Table 1: Enrollment-Weighted Average Published In-State Tuition and Fees for Full-Time Undergraduate Students at Public Two-Year Institutions by State, Not Adjusted for Inflation, 2006-07 to 2011-12
State
Public Two-Year In-State Tuition and Fees Percentage Change
2011-12 2010-11 2009-10 2008-09 2007-08 2006-07 1-Year 3-Year 5-YearU.S. $2,963 $2,727 $2,558 $2,372 $2,294 $2,266 8.7% 24.9% 30.8%Alabama $4,124 $3,417 $2,839 $2,835 $2,809 $2,786 20.7% 45.5% 48.0%Alaska $3,831 $3,699 $3,622 $3,175 $2,894 $2,655 3.6% 20.7% 44.3%Arizona $2,124 $1,979 $1,918 $1,821 $1,686 $1,660 7.3% 16.6% 28.0%Arkansas $2,661 $2,525 $2,378 $2,296 $2,138 $2,095 5.4% 15.9% 27.0%California $1,119 $819 $817 $634 $633 $724 36.6% 76.5% 54.6%Colorado $3,397 $3,122 $2,768 $2,550 $2,459 $2,376 8.8% 33.2% 43.0%Connecticut $3,490 $3,408 $3,200 $2,984 $2,828 $2,672 2.4% 17.0% 30.6%Delaware $3,086 $2,889 $2,763 $2,631 $2,422 $2,310 6.8% 17.3% 33.6%District of Columbia — — — — — — N/A N/A N/AFlorida $3,006 $2,773 $2,553 $2,292 $2,031 $2,031 8.4% 31.2% 48.0%Georgia $3,078 $2,800 $2,596 $2,104 $2,120 $2,236 9.9% 46.3% 37.7%Hawaii $2,967 $2,710 $2,443 $2,192 $1,946 $1,732 9.5% 35.4% 71.3%Idaho $2,666 $2,554 $2,418 $2,232 $2,092 $1,979 4.4% 19.4% 34.7%Illinois $3,150 $3,010 $2,729 $2,597 $2,440 $2,301 4.7% 21.3% 36.9%Indiana $3,521 $3,441 $3,279 $3,137 $3,003 $2,882 2.3% 12.2% 22.2%Iowa $4,177 $3,912 $3,701 $3,512 $3,331 $3,202 6.8% 18.9% 30.4%Kansas $2,426 $2,281 $2,121 $1,984 $1,928 $1,887 6.4% 22.3% 28.6%Kentucky $4,051 $3,900 $3,759 $3,684 $3,450 $3,270 3.9% 10.0% 23.9%Louisiana $2,452 $2,212 $2,049 $1,947 $1,915 $1,875 10.8% 25.9% 30.8%Maine $3,327 $3,260 $3,236 $3,156 $3,120 $2,926 2.1% 5.4% 13.7%Maryland $3,700 $3,567 $3,394 $3,329 $3,252 $3,122 3.7% 11.1% 18.5%Massachusetts $4,823 $4,594 $4,291 $3,925 $3,694 $3,579 5.0% 22.9% 34.8%Michigan $2,863 $2,694 $2,527 $2,455 $2,329 $2,231 6.3% 16.6% 28.3%Minnesota $5,162 $4,939 $4,739 $4,562 $4,446 $4,264 4.5% 13.2% 21.1%Mississippi $2,208 $2,119 $1,855 $1,770 $1,709 $1,693 4.2% 24.7% 30.4%Missouri $2,756 $2,580 $2,580 $2,586 $2,505 $2,391 6.8% 6.6% 15.3%Montana $3,087 $3,029 $2,978 $2,904 $2,770 $2,572 1.9% 6.3% 20.0%Nebraska $2,514 $2,412 $2,294 $2,240 $2,155 $2,013 4.2% 12.2% 24.9%Nevada $2,513 $2,243 $2,022 $1,921 $1,763 $1,695 12.0% 30.8% 48.3%New Hampshire $6,741 $6,271 $5,892 $5,607 $5,609 $5,234 7.5% 20.2% 28.8%New Jersey $4,111 $3,922 $3,794 $3,550 $3,387 $3,188 4.8% 15.8% 29.0%New Mexico $1,498 $1,325 $1,208 $1,146 $1,143 $1,102 13.1% 30.7% 35.9%New York $4,253 $3,961 $3,871 $3,653 $3,547 $3,460 7.4% 16.4% 22.9%North Carolina $2,075 $1,776 $1,600 $1,350 $1,341 $1,257 16.8% 53.7% 65.1%North Dakota $3,926 $3,880 $3,878 $3,837 $3,455 $3,304 1.2% 2.3% 18.8%Ohio $3,608 $3,473 $3,327 $3,176 $3,175 $3,103 3.9% 13.6% 16.3%Oklahoma $3,043 $2,832 $2,704 $2,693 $2,486 $2,306 7.5% 13.0% 32.0%Oregon $4,029 $3,745 $3,611 $3,336 $3,222 $3,161 7.6% 20.8% 27.5%Pennsylvania $3,663 $3,470 $3,448 $3,345 $3,234 $3,110 5.6% 9.5% 17.8%Rhode Island $3,676 $3,652 $3,376 $3,090 $2,846 $2,686 0.7% 19.0% 36.9%South Carolina $3,731 $3,646 $3,481 $3,346 $3,235 $3,125 2.3% 11.5% 19.4%South Dakota $4,945 $4,585 $4,314 $3,939 $3,596 $3,449 7.9% 25.5% 43.4%Tennessee $3,551 $3,196 $2,971 $2,777 $2,632 $2,490 11.1% 27.9% 42.6%Texas $2,049 $1,858 $1,746 $1,662 $1,649 $1,610 10.3% 23.3% 27.3%Utah $3,009 $2,867 $2,710 $2,555 $2,444 $2,324 5.0% 17.8% 29.5%Vermont $6,520 $6,250 $6,070 $5,830 $5,500 $5,230 4.3% 11.8% 24.7%Virginia $3,968 $3,585 $3,087 $2,860 $2,561 $2,372 10.7% 38.7% 67.3%Washington $3,805 $3,360 $3,153 $2,962 $2,879 $2,738 13.2% 28.5% 39.0%West Virginia $2,700 $2,524 $2,524 $2,479 $2,345 $2,207 7.0% 8.9% 22.3%Wisconsin $3,840 $3,623 $3,507 $3,422 $3,270 $3,145 6.0% 12.2% 22.1%Wyoming $2,325 $2,223 $2,164 $2,018 $1,922 $1,830 4.6% 15.2% 27.0%
Source: The College Board, Trends in College Pricing 2011, online Table 6c.
9
College Board Advocacy & Policy Center July 2012
Table 2: Enrollment-Weighted Average Published In-State Tuition and Fees for Full-Time Undergraduate Students at Public Four-Year Institutions by State, Not Adjusted for Inflation, 2006-07 to 2011-12
State
Public Four-Year In-State Tuition and Fees Percentage Change
2011-12 2010-11 2009-10 2008-09 2007-08 2006-07 1-Year 3-Year 5-YearU.S. $8,244 $7,613 $7,050 $6,591 $6,191 $5,804 8.3% 25.1% 42.0%Alabama $7,993 $7,373 $6,487 $5,968 $5,244 $4,906 8.4% 33.9% 62.9%Alaska $5,456 $5,261 $4,922 $4,678 $4,425 $4,194 3.7% 16.6% 30.1%Arizona $9,428 $8,075 $6,554 $5,584 $4,959 $4,674 16.8% 68.8% 101.7%Arkansas $6,646 $6,304 $5,980 $5,914 $5,599 $5,314 5.4% 12.4% 25.1%California $9,022 $7,485 $6,550 $5,436 $4,951 $4,549 20.5% 66.0% 98.3%Colorado $7,849 $7,078 $6,270 $5,792 $5,435 $4,772 10.9% 35.5% 64.5%Connecticut $9,197 $8,977 $8,456 $8,038 $7,574 $7,135 2.5% 14.4% 28.9%Delaware $10,496 $9,623 $9,012 $8,291 $7,808 $7,403 9.1% 26.6% 41.8%District of Columbia $7,000 $7,000 $5,370 $3,770 $3,770 $3,210 0.0% 85.7% 118.1%Florida $5,626 $5,034 $4,444 $3,825 $3,386 $3,315 11.8% 47.1% 69.7%Georgia $6,808 $5,872 $5,008 $4,453 $4,181 $3,909 15.9% 52.9% 74.2%Hawaii $8,352 $7,458 $6,638 $5,823 $5,017 $4,227 12.0% 43.4% 97.6%Idaho $5,681 $5,330 $4,886 $4,612 $4,382 $4,156 6.6% 23.2% 36.7%Illinois $11,600 $10,969 $10,410 $10,021 $9,099 $8,058 5.8% 15.8% 44.0%Indiana $8,334 $7,988 $7,643 $7,222 $6,875 $6,555 4.3% 15.4% 27.1%Iowa $7,562 $7,155 $6,712 $6,433 $6,218 $5,900 5.7% 17.6% 28.2%Kansas $6,960 $6,627 $6,312 $6,010 $5,746 $5,213 5.0% 15.8% 33.5%Kentucky $7,963 $7,519 $7,116 $6,809 $6,279 $5,764 5.9% 16.9% 38.2%Louisiana $5,123 $4,733 $4,282 $4,073 $3,830 $3,770 8.2% 25.8% 35.9%Maine $9,354 $8,945 $8,544 $8,078 $7,334 $6,616 4.6% 15.8% 41.4%Maryland $7,993 $7,737 $7,476 $7,392 $7,314 $7,216 3.3% 8.1% 10.8%Massachusetts $10,173 $9,488 $9,239 $8,239 $7,887 $7,583 7.2% 23.5% 34.2%Michigan $10,837 $10,135 $9,761 $9,130 $8,499 $7,673 6.9% 18.7% 41.2%Minnesota $9,966 $9,387 $8,788 $8,317 $7,798 $7,518 6.2% 19.8% 32.6%Mississippi $5,668 $5,294 $4,952 $4,947 $4,757 $4,450 7.1% 14.6% 27.4%Missouri $7,668 $7,271 $7,215 $7,228 $6,845 $6,526 5.5% 6.1% 17.5%Montana $5,874 $5,612 $5,485 $5,336 $5,302 $5,258 4.7% 10.1% 11.7%Nebraska $6,934 $6,600 $6,234 $5,956 $5,581 $5,229 5.1% 16.4% 32.6%Nevada $6,044 $5,318 $4,543 $4,397 $3,948 $3,645 13.7% 37.5% 65.8%New Hampshire $13,507 $11,946 $11,075 $10,293 $9,698 $9,127 13.1% 31.2% 48.0%New Jersey $12,041 $11,649 $11,133 $10,748 $9,974 $9,331 3.4% 12.0% 29.0%New Mexico $5,457 $5,128 $4,786 $4,520 $4,248 $4,056 6.4% 20.7% 34.5%New York $6,213 $5,793 $5,740 $5,121 $5,076 $5,041 7.3% 21.3% 23.2%North Carolina $5,685 $5,323 $4,539 $4,391 $4,306 $4,067 6.8% 29.5% 39.8%North Dakota $6,847 $6,569 $6,335 $6,107 $5,803 $5,512 4.2% 12.1% 24.2%Ohio $8,904 $8,605 $8,170 $8,140 $8,129 $8,112 3.5% 9.4% 9.8%Oklahoma $6,059 $5,750 $5,421 $5,641 $4,993 $4,432 5.4% 7.4% 36.7%Oregon $7,988 $7,434 $6,906 $6,239 $5,946 $5,576 7.5% 28.0% 43.3%Pennsylvania $12,079 $11,331 $10,764 $10,353 $9,792 $9,051 6.6% 16.7% 33.5%Rhode Island $10,007 $9,319 $8,503 $7,727 $7,221 $6,787 7.4% 29.5% 47.4%South Carolina $10,300 $10,063 $9,520 $9,132 $8,371 $7,913 2.4% 12.8% 30.2%South Dakota $6,873 $6,318 $6,031 $5,698 $5,343 $4,969 8.8% 20.6% 38.3%Tennessee $7,209 $6,522 $6,098 $5,686 $5,365 $4,973 10.5% 26.8% 45.0%Texas $8,078 $7,744 $7,328 $6,919 $6,450 $5,985 4.3% 16.8% 35.0%Utah $5,292 $4,916 $4,573 $4,275 $4,059 $3,816 7.6% 23.8% 38.7%Vermont $13,078 $12,474 $12,016 $11,341 $10,485 $9,783 4.8% 15.3% 33.7%Virginia $9,618 $8,809 $7,936 $7,581 $7,008 $6,556 9.2% 26.9% 46.7%Washington $9,484 $8,197 $7,321 $6,433 $5,986 $5,670 15.7% 47.4% 67.3%West Virginia $5,532 $5,226 $4,980 $4,707 $4,406 $4,166 5.9% 17.5% 32.8%Wisconsin $8,193 $7,711 $7,169 $6,796 $6,413 $6,042 6.3% 20.6% 35.6%Wyoming $4,125 $3,927 $3,726 $3,621 $3,554 $3,515 5.0% 13.9% 17.4%
Source: The College Board, Trends in College Pricing 2011, online Table 6c.
10 POLICY BRIEF I RESEARCH BRIEF I LITERATURE BRIEF I ANALYSIS BRIEF I INSIGHT BRIEF
Trends in Tuition and Fees, Enrollment, and State Appropriations for Higher Education by State
Table 3: Enrollment-Weighted Average Published Tuition and Fees for Full-Time Undergraduate Students at Private Nonprofit Four-Year Institutions by State, Not Adjusted for Inflation, 2006-07 to 2011-12
State
Private Nonprofit Four-Year Tuition and Fees Percentage Change
2011-12 2010-11 2009-10 2008-09 2007-08 2006-07 1-Year 3-Year 5-YearU.S. $28,500 $27,265 $26,129 $25,177 $23,745 $22,308 4.5% 13.2% 27.8%Alabama $18,719 $17,632 $16,496 $15,604 $14,669 $13,512 6.2% 20.0% 38.5%Alaska $25,406 $24,675 $23,031 $21,522 $20,069 $16,731 3.0% 18.0% 51.8%Arizona $26,712 $25,583 $24,548 $24,056 $20,432 $20,003 4.4% 11.0% 33.5%Arkansas $18,250 $17,217 $16,744 $15,737 $14,722 $13,801 6.0% 16.0% 32.2%California $35,766 $34,286 $32,826 $31,651 $29,846 $28,077 4.3% 13.0% 27.4%Colorado $33,129 $32,038 $31,098 $29,822 $28,699 $26,731 3.4% 11.1% 23.9%Connecticut $35,991 $34,542 $33,135 $31,902 $30,234 $28,547 4.2% 12.8% 26.1%Delaware $13,888 $13,453 $13,432 $12,741 $12,402 $11,573 3.2% 9.0% 20.0%District of Columbia $35,581 $34,223 $32,624 $31,379 $29,837 $27,658 4.0% 13.4% 28.6%Florida $26,494 $25,386 $24,432 $23,492 $22,264 $21,192 4.4% 12.8% 25.0%Georgia $26,029 $24,898 $23,898 $22,939 $21,560 $20,124 4.5% 13.5% 29.3%Hawaii $12,610 $12,068 $11,451 $10,922 $10,426 $9,835 4.5% 15.5% 28.2%Idaho $6,614 $6,360 $6,213 $6,027 $5,614 $5,326 4.0% 9.7% 24.2%Illinois $28,903 $27,503 $26,272 $25,048 $23,555 $22,167 5.1% 15.4% 30.4%Indiana $29,578 $28,260 $27,076 $26,078 $24,810 $23,545 4.7% 13.4% 25.6%Iowa $26,551 $25,290 $24,198 $23,526 $22,221 $20,745 5.0% 12.9% 28.0%Kansas $21,042 $20,024 $19,095 $18,101 $17,125 $16,150 5.1% 16.2% 30.3%Kentucky $22,171 $21,114 $19,974 $19,121 $17,956 $16,926 5.0% 16.0% 31.0%Louisiana $30,024 $28,823 $27,252 $26,424 $24,694 $22,122 4.2% 13.6% 35.7%Maine $31,414 $30,406 $29,377 $28,524 $27,364 $26,635 3.3% 10.1% 17.9%Maryland $34,269 $32,841 $31,744 $30,404 $28,256 $26,497 4.3% 12.7% 29.3%Massachusetts $36,724 $35,255 $33,793 $32,500 $30,941 $29,299 4.2% 13.0% 25.3%Michigan $19,414 $18,638 $17,728 $17,619 $16,920 $15,964 4.2% 10.2% 21.6%Minnesota $31,462 $29,978 $28,675 $27,294 $25,560 $23,916 5.0% 15.3% 31.6%Mississippi $14,635 $14,102 $13,533 $13,315 $12,798 $12,263 3.8% 9.9% 19.3%Missouri $24,476 $23,518 $22,673 $21,785 $20,649 $19,482 4.1% 12.4% 25.6%Montana $22,987 $21,780 $20,749 $19,825 $18,379 $17,093 5.5% 15.9% 34.5%Nebraska $20,213 $19,347 $19,337 $18,699 $17,424 $16,752 4.5% 8.1% 20.7%Nevada $25,370 $24,560 $22,978 $22,978 $22,305 $20,873 3.3% 10.4% 21.5%New Hampshire $33,761 $32,361 $31,311 $29,812 $28,263 $26,841 4.3% 13.2% 25.8%New Jersey $32,447 $31,035 $29,476 $28,318 $26,808 $25,175 4.5% 14.6% 28.9%New Mexico $31,656 $30,777 $29,647 $27,049 $25,965 $24,252 2.9% 17.0% 30.5%New York $33,151 $31,742 $30,490 $29,223 $27,518 $25,446 4.4% 13.4% 30.3%North Carolina $27,015 $25,793 $24,755 $23,597 $22,082 $20,790 4.7% 14.5% 29.9%North Dakota $14,700 $14,246 $13,778 $13,187 $11,682 $11,171 3.2% 11.5% 31.6%Ohio $28,376 $27,135 $26,104 $25,119 $23,719 $22,396 4.6% 13.0% 26.7%Oklahoma $22,415 $20,936 $19,725 $18,613 $17,249 $16,256 7.1% 20.4% 37.9%Oregon $31,827 $30,204 $28,980 $27,905 $26,654 $25,018 5.4% 14.1% 27.2%Pennsylvania $32,559 $31,272 $30,114 $28,941 $27,256 $25,675 4.1% 12.5% 26.8%Rhode Island $33,943 $32,777 $30,714 $29,724 $28,047 $26,541 3.6% 14.2% 27.9%South Carolina $21,951 $20,982 $20,301 $19,701 $18,641 $17,588 4.6% 11.4% 24.8%South Dakota $22,926 $21,862 $20,541 $19,631 $18,447 $17,393 4.9% 16.8% 31.8%Tennessee $23,485 $22,446 $21,427 $20,538 $19,518 $18,484 4.6% 14.3% 27.1%Texas $26,828 $25,234 $23,765 $22,509 $20,774 $19,276 6.3% 19.2% 39.2%Utah $6,198 $5,981 $5,682 $5,353 $4,976 $4,649 3.6% 15.8% 33.3%Vermont $33,643 $32,470 $31,164 $29,812 $28,176 $25,629 3.6% 12.9% 31.3%Virginia $24,683 $23,216 $22,686 $22,071 $21,145 $20,396 6.3% 11.8% 21.0%Washington $31,618 $30,160 $28,824 $27,546 $25,772 $24,147 4.8% 14.8% 30.9%West Virginia $18,606 $17,906 $16,715 $16,644 $16,097 $15,488 3.9% 11.8% 20.1%Wisconsin $27,239 $26,021 $24,916 $23,858 $22,540 $21,385 4.7% 14.2% 27.4%Wyoming — — — — — — N/A N/A N/A
Source: The College Board, Trends in College Pricing 2011, online Table 6c.
11
College Board Advocacy & Policy Center July 2012
Table 4a: Published In-State Tuition and Fees for Full-Time Undergraduate Students at Flagship Universities, Not Adjusted for Inflation, 2007-08 to 2011-12
State Name
In-State Tuition and Fees 1-Year Percentage
Change2011-12 2010-11 2009-10 2008-09 2007-08Alabama University of Alabama $8,600 $7,900 $7,000 $6,400 $5,700 8.9%Alaska University of Alaska Fairbanks $5,570 $5,316 $5,133 $4,828 $4,496 4.8%Arizona University of Arizona $9,299 $8,237 $6,855 $5,531 $5,037 12.9%Arkansas University of Arkansas $7,174 $6,768 $6,459 $6,400 $6,038 6.0%California University of California–Berkeley $12,835 $10,940 $9,749 $7,656 $7,164 17.3%Colorado University of Colorado at Boulder $10,098 $9,390 $7,932 $7,278 $7,317 7.5%Connecticut University of Connecticut $10,670 $10,416 $9,886 $9,338 $8,842 2.4%Delaware University of Delaware $11,192 $10,208 $9,486 $8,646 $8,150 9.6%Florida University of Florida $5,657 $5,045 $4,373 $3,790 $3,370 12.1%Georgia University of Georgia $8,693 $7,338 $6,172 $5,532 $5,259 18.5%Hawaii University of Hawaii at Manoa $9,100 $8,096 $7,168 $6,259 $5,390 12.4%Idaho University of Idaho $5,856 $5,402 $4,932 $4,632 $4,410 8.4%Illinois University of Illinois at Urbana-Champaign $13,838 $13,096 $12,528 $12,240 $11,130 5.7%Indiana Indiana University Bloomington $9,524 $9,028 $8,613 $8,231 $7,837 5.5%Iowa University of Iowa $7,765 $7,417 $6,824 $6,544 $6,293 4.7%Kansas University of Kansas $8,452 $7,980 $7,673 $7,275 $7,146 5.9%Kentucky University of Kentucky $9,128 $8,610 $8,123 $7,736 $7,096 6.0%
Louisiana Louisiana State University and Agricultural and Mechanical College $5,870 $5,764 $5,233 $5,086 $4,543 1.8%
Maine University of Maine $10,588 $10,142 $9,626 $9,100 $8,330 4.4%Maryland University of Maryland: College Park $8,655 $8,416 $8,053 $8,005 $7,969 2.8%Massachusetts University of Massachusetts Amherst $12,797 $11,917 $11,917 $10,417 $9,924 7.4%Michigan University of Michigan $13,961 $13,152 $12,662 $11,037 $10,447 6.2%Minnesota University of Minnesota, Twin Cities $13,022 $12,203 $11,287 $10,634 $9,885 6.7%Mississippi University of Mississippi $5,792 $5,439 $5,106 $5,107 $4,932 6.5%Missouri University of Missouri $8,989 $8,501 $8,501 $8,485 $8,099 5.7%Montana University of Montana $5,722 $5,476 $5,330 $5,150 $5,141 4.5%Nebraska University of Nebraska–Lincoln $7,563 $7,224 $6,857 $6,585 $6,216 4.7%Nevada University of Nevada, Reno $6,176 $5,561 $4,901 $4,561 $4,029 11.1%New Hampshire University of New Hampshire $15,250 $13,672 $12,743 $11,756 $11,070 11.5%New Jersey Rutgers, The State University of New Jersey:
New Brunswick/Piscataway Campus$12,754 $12,582 $11,886 $11,540 $10,686 1.4%
New Mexico University of New Mexico $5,809 $5,506 $5,101 $4,834 $4,571 5.5%New York State University of New York at Buffalo $7,482 $7,136 $7,013 $6,285 $6,218 4.8%North Carolina University of North Carolina at Chapel Hill $7,008 $6,671 $5,625 $5,397 $5,340 5.1%North Dakota University of North Dakota $7,092 $6,934 $6,726 $6,513 $6,130 2.3%Ohio Ohio State University: Columbus Campus $9,735 $9,420 $8,726 $8,679 $8,676 3.3%Oklahoma University of Oklahoma $7,829 $7,428 $6,929 $7,423 $6,507 5.4%Oregon University of Oregon $8,789 $8,190 $7,428 $6,435 $6,168 7.3%Pennsylvania Penn State University Park $17,053 $16,319 $15,308 $14,561 $13,639 4.5%Rhode Island University of Rhode Island $11,366 $10,476 $9,528 $8,678 $8,184 8.5%South Carolina University of South Carolina $10,168 $9,786 $9,156 $8,838 $8,346 3.9%South Dakota University of South Dakota $7,209 $6,762 $6,468 $5,828 $5,393 6.6%Tennessee University of Tennessee, Knoxville $8,456 $7,382 $6,855 $6,250 $5,932 14.5%Texas University of Texas at Austin $9,794 $9,416 $8,930 $8,532 $7,670 4.0%Utah University of Utah $6,763 $6,274 $5,746 $5,285 $4,987 7.8%Vermont University of Vermont $14,784 $14,066 $13,554 $12,844 $12,054 5.1%Virginia University of Virginia $11,576 $10,628 $9,672 $9,505 $8,500 8.9%Washington University of Washington $10,826 $8,973 $7,964 $6,907 $6,385 20.7%West Virginia West Virginia University $5,674 $5,406 $5,304 $5,100 $4,722 5.0%Wisconsin University of Wisconsin–Madison $9,665 $8,983 $8,310 $7,568 $7,188 7.6%Wyoming University of Wyoming $4,125 $3,927 $3,726 $3,621 $3,554 5.0%
Source: The College Board, Trends in College Pricing 2011, online Table 6d.
12 POLICY BRIEF I RESEARCH BRIEF I LITERATURE BRIEF I ANALYSIS BRIEF I INSIGHT BRIEF
Trends in Tuition and Fees, Enrollment, and State Appropriations for Higher Education by State
Table 4b: Published Out-of-State Tuition and Fees for Full-Time Undergraduate Students at Flagship Universities, Not Adjusted for Inflation, 2007-08 to 2011-12
State Name
Out-of-State Tuition and Fees 1-Year Percentage
Change2011-12 2010-11 2009-10 2008-09 2007-08Alabama University of Alabama $21,900 $20,500 $19,200 $18,000 $16,518 6.8%Alaska University of Alaska Fairbanks $17,210 $15,906 $15,036 $14,248 $13,466 8.2%Arizona University of Arizona $25,509 $24,597 $22,572 $18,665 $16,271 3.7%Arkansas University of Arkansas $17,606 $16,000 $15,445 $15,278 $14,492 10.0%California University of California–Berkeley $35,713 $33,819 $32,418 $28,264 $26,784 5.6%Colorado University of Colorado at Boulder $30,330 $29,493 $28,193 $26,756 $24,797 2.8%Connecticut University of Connecticut $27,566 $26,880 $25,584 $24,050 $22,786 2.6%Delaware University of Delaware $27,462 $25,408 $23,408 $21,126 $19,400 8.1%Florida University of Florida $27,934 $27,322 $23,744 $20,640 $17,791 2.2%Georgia University of Georgia $27,682 $26,946 $25,946 $22,343 $20,726 2.7%Hawaii University of Hawaii at Manoa $23,932 $21,536 $19,328 $16,915 $14,654 11.1%Idaho University of Idaho $18,376 $16,994 $15,111 $14,712 $14,490 8.1%Illinois University of Illinois at Urbana-Champaign $27,980 $27,238 $26,336 $26,024 $25,216 2.7%Indiana Indiana University Bloomington $29,540 $27,689 $26,173 $24,769 $22,316 6.7%Iowa University of Iowa $25,099 $23,713 $22,445 $20,658 $19,465 5.8%Kansas University of Kansas $22,608 $21,538 $20,185 $18,909 $17,556 5.0%Kentucky University of Kentucky $18,740 $17,678 $16,723 $15,884 $14,896 6.0%Louisiana Louisiana State University and Agricultural
and Mechanical College$18,878 $16,549 $14,415 $13,800 $12,843 14.1%
Maine University of Maine $26,308 $25,172 $23,972 $22,510 $20,540 4.5%Maryland University of Maryland, College Park $26,026 $24,831 $24,156 $23,076 $22,208 4.8%Massachusetts University of Massachusetts Amherst $25,585 $23,813 $23,414 $21,914 $20,499 7.4%Michigan University of Michigan $37,782 $36,001 $34,937 $33,069 $31,301 4.9%Minnesota University of Minnesota, Twin Cities $18,022 $16,503 $15,529 $14,634 $21,515 9.2%Mississippi University of Mississippi $14,797 $13,894 $13,046 $12,468 $11,436 6.5%Missouri University of Missouri $21,784 $20,516 $19,682 $19,558 $18,755 6.2%Montana University of Montana $20,099 $19,172 $17,794 $16,425 $15,504 4.8%Nebraska University of Nebraska–Lincoln $19,848 $18,924 $17,926 $17,205 $16,236 4.9%Nevada University of Nevada, Reno $19,771 $18,851 $17,698 $15,656 $14,839 4.9%New Hampshire University of New Hampshire $28,570 $27,642 $26,992 $25,236 $24,030 3.4%New Jersey Rutgers, The State University of New Jersey:
New Brunswick/Piscataway Campus$25,416 $24,044 $22,834 $21,488 $19,854 5.7%
New Mexico University of New Mexico $19,999 $18,691 $17,234 $15,708 $14,942 7.0%New York State University of New York at Buffalo $16,932 $15,546 $15,036 $12,545 $12,478 8.9%North Carolina University of North Carolina at Chapel Hill $26,834 $25,286 $23,609 $22,295 $20,988 6.1%North Dakota University of North Dakota $16,767 $16,373 $15,862 $15,325 $14,523 2.4%Ohio Ohio State University: Columbus Campus $24,630 $23,604 $22,404 $22,298 $21,918 4.3%Oklahoma University of Oklahoma $19,278 $18,295 $17,704 $17,404 $15,621 5.4%Oregon University of Oregon $27,653 $25,830 $23,730 $19,992 $19,332 7.1%Pennsylvania Penn State University Park $28,066 $27,114 $25,972 $24,940 $23,712 3.5%Rhode Island University of Rhode Island $27,454 $27,182 $26,198 $24,776 $23,038 1.0%South Carolina University of South Carolina $26,352 $25,362 $23,732 $22,908 $21,632 3.9%South Dakota University of South Dakota $8,924 $8,259 $7,892 $7,148 $6,631 8.1%Tennessee University of Tennessee, Knoxville $25,298 $22,420 $20,646 $18,908 $17,874 12.8%Texas University of Texas at Austin $32,506 $31,266 $30,006 $27,760 $24,544 4.0%Utah University of Utah $21,389 $19,841 $18,193 $16,601 $15,662 7.8%Vermont University of Vermont $34,424 $32,630 $31,454 $29,682 $27,938 5.5%Virginia University of Virginia $35,898 $32,902 $31,326 $29,798 $27,515 9.1%Washington University of Washington $28,310 $25,601 $24,639 $23,324 $22,131 10.6%West Virginia West Virginia University $17,844 $17,002 $16,402 $15,770 $14,600 5.0%Wisconsin University of Wisconsin–Madison $25,415 $24,233 $23,095 $21,818 $21,438 4.9%Wyoming University of Wyoming $12,855 $12,237 $11,697 $11,031 $10,394 5.1%
Source: The College Board, Trends in College Pricing 2011, online Table 6d.
13
College Board Advocacy & Policy Center July 2012
Table 5: Total State Appropriations for Higher Education (in Thousands) by State, Not Adjusted for Inflation, 2006-07 to 2011-12, Selected Years
State
Total State Appropriations (in Thousands) Percentage Change
2011-12 2010-11 2006-07 1-Year 5-YearU.S. $72,543,813 $78,390,541 $75,377,603 -7.5% -3.8%Alabama $1,470,952 $1,543,661 $1,685,067 -4.7% -12.7%Alaska $355,185 $342,154 $286,003 3.8% 24.2%Arizona $814,458 $1,087,207 $1,196,750 -25.1% -31.9%Arkansas $903,590 $915,441 $796,304 -1.3% 13.5%California $9,663,254 $11,169,670 $11,036,612 -13.5% -12.4%Colorado $647,496 $765,512 $689,786 -15.4% -6.1%Connecticut $944,555 $1,076,131 $923,951 -12.2% 2.2%Delaware $213,194 $212,456 $233,226 0.3% -8.6%Florida $3,622,862 $4,117,296 $4,390,185 -12.0% -17.5%Georgia $2,631,581 $2,972,740 $2,774,268 -11.5% -5.1%Hawaii $512,328 $511,556 $503,627 0.2% 1.7%Idaho $333,670 $348,064 $375,282 -4.1% -11.1%Illinois $3,585,962 $3,200,025 $2,848,130 12.1% 25.9%Indiana $1,549,460 $1,564,731 $1,456,514 -1.0% 6.4%Iowa $739,052 $758,712 $804,449 -2.6% -8.1%Kansas $739,612 $795,182 $788,721 -7.0% -6.2%Kentucky $1,235,422 $1,279,424 $1,253,992 -3.4% -1.5%Louisiana $1,290,048 $1,582,177 $1,459,847 -18.5% -11.6%Maine $270,803 $276,690 $256,024 -2.1% 5.8%Maryland $1,605,769 $1,596,186 $1,450,215 0.6% 10.7%Massachusetts $1,150,151 $1,214,704 $1,256,793 -5.3% -8.5%Michigan $1,641,659 $1,869,659 $2,035,388 -12.2% -19.3%Minnesota $1,283,690 $1,381,065 $1,400,500 -7.1% -8.3%Mississippi $954,184 $1,018,694 $879,466 -6.3% 8.5%Missouri $930,090 $1,000,998 $978,772 -7.1% -5.0%Montana $202,105 $209,542 $171,369 -3.5% 17.9%Nebraska $650,437 $653,935 $604,026 -0.5% 7.7%Nevada $473,256 $550,169 $593,776 -14.0% -20.3%New Hampshire $83,300 $137,555 $123,966 -39.4% -32.8%New Jersey $1,998,300 $2,050,400 $1,973,721 -2.5% 1.2%New Mexico $798,972 $847,234 $954,683 -5.7% -16.3%New York $4,673,772 $5,032,313 $4,568,118 -7.1% 2.3%North Carolina $3,906,416 $4,055,333 $3,466,353 -3.7% 12.7%North Dakota $343,964 $311,678 $215,719 10.4% 59.5%Ohio $2,013,797 $2,282,711 $2,208,184 -11.8% -8.8%Oklahoma $945,260 $1,105,825 $1,033,365 -14.5% -8.5%Oregon $598,020 $650,163 $640,984 -8.0% -6.7%Pennsylvania $1,826,879 $2,108,381 $2,153,998 -13.4% -15.2%Rhode Island $193,746 $171,275 $196,361 13.1% -1.3%South Carolina $859,409 $928,624 $1,127,265 -7.5% -23.8%South Dakota $179,516 $196,616 $178,778 -8.7% 0.4%Tennessee $1,414,996 $1,659,586 $1,505,274 -14.7% -6.0%Texas $6,464,047 $6,270,812 $5,709,137 3.1% 13.2%Utah $728,929 $734,890 $718,209 -0.8% 1.5%Vermont $88,225 $94,227 $85,923 -6.4% 2.7%Virginia $1,624,027 $1,903,978 $1,854,731 -14.7% -12.4%Washington $1,361,376 $1,592,882 $1,631,059 -14.5% -16.5%West Virginia $536,383 $527,396 $455,445 1.7% 17.8%Wisconsin $1,153,559 $1,330,088 $1,170,359 -13.3% -1.4%Wyoming $336,098 $384,795 $276,930 -12.7% 21.4%
Source: Illinois State University, Grapevine Data, Table 1.
14 POLICY BRIEF I RESEARCH BRIEF I LITERATURE BRIEF I ANALYSIS BRIEF I INSIGHT BRIEF
Trends in Tuition and Fees, Enrollment, and State Appropriations for Higher Education by State
Table 6: Total Fall Enrollment at Public Degree-Granting Institutions by State, 2000 to 2010, Selected Years
State
Fall Enrollment at Public Degree-Granting Institutions Percentage Change
2010 2009 2005 2000 1-Year 5-Year 10-YearU.S. 15,142,809 14,810,642 13,021,834 11,752,786 2.2% 16.3% 28.8%Alabama 267,083 260,277 228,153 207,435 2.6% 17.1% 28.8%Alaska 32,303 30,493 28,866 26,559 5.9% 11.9% 21.6%Arizona 366,976 350,435 320,865 284,522 4.7% 14.4% 29.0%Arkansas 155,780 149,474 128,117 101,775 4.2% 21.6% 53.1%California 2,223,648 2,289,470 2,008,155 1,927,771 -2.9% 10.7% 15.3%Colorado 269,407 255,438 234,509 217,897 5.5% 14.9% 23.6%Connecticut 127,194 123,211 111,705 101,027 3.2% 13.9% 25.9%Delaware 40,408 40,428 38,682 34,194 0.0% 4.5% 18.2%District of Columbia 5,840 5,253 5,595 5,499 11.2% 4.4% 6.2%Florida 790,027 759,479 648,999 556,912 4.0% 21.7% 41.9%Georgia 436,109 418,037 342,012 271,755 4.3% 27.5% 60.5%Hawaii 60,090 57,945 50,157 44,579 3.7% 19.8% 34.8%Idaho 64,204 63,261 60,303 53,751 1.5% 6.5% 19.4%Illinois 585,515 588,741 555,149 534,155 -0.5% 5.5% 9.6%Indiana 337,705 325,072 267,298 240,023 3.9% 26.3% 40.7%Iowa 177,781 170,870 148,907 135,008 4.0% 19.4% 31.7%Kansas 185,623 182,736 170,319 159,976 1.6% 9.0% 16.0%Kentucky 229,725 221,508 201,579 151,973 3.7% 14.0% 51.2%Louisiana 224,811 215,511 181,043 189,213 4.3% 24.2% 18.8%Maine 51,482 49,668 47,519 40,662 3.7% 8.3% 26.6%Maryland 309,779 298,185 256,073 223,797 3.9% 21.0% 38.4%Massachusetts 224,493 218,999 188,295 183,248 2.5% 19.2% 22.5%Michigan 562,444 553,022 505,586 467,861 1.7% 11.2% 20.2%Minnesota 276,176 270,336 240,853 218,617 2.2% 14.7% 26.3%Mississippi 159,695 155,517 135,896 125,355 2.7% 17.5% 27.4%Missouri 256,119 245,568 217,722 201,509 4.3% 17.6% 27.1%Montana 48,261 46,653 42,997 37,387 3.4% 12.2% 29.1%Nebraska 107,980 104,149 93,181 88,531 3.7% 15.9% 22.0%Nevada 113,103 112,397 100,043 83,120 0.6% 13.1% 36.1%New Hampshire 44,072 43,507 41,007 35,870 1.3% 7.5% 22.9%New Jersey 358,256 348,934 304,315 266,921 2.7% 17.7% 34.2%New Mexico 150,856 143,101 120,976 101,450 5.4% 24.7% 48.7%New York 723,500 712,466 626,222 583,417 1.5% 15.5% 24.0%North Carolina 475,598 470,239 396,755 329,422 1.1% 19.9% 44.4%North Dakota 48,904 46,727 42,808 36,014 4.7% 14.2% 35.8%Ohio 547,551 522,002 453,001 411,161 4.9% 20.9% 33.2%Oklahoma 197,642 189,953 179,225 153,699 4.0% 10.3% 28.6%Oregon 208,002 201,246 163,752 154,756 3.4% 27.0% 34.4%Pennsylvania 432,889 425,979 380,271 339,229 1.6% 13.8% 27.6%Rhode Island 43,224 43,409 40,008 38,458 -0.4% 8.0% 12.4%South Carolina 205,080 200,204 174,686 155,519 2.4% 17.4% 31.9%South Dakota 44,569 41,674 37,548 34,857 6.9% 18.7% 27.9%Tennessee 242,486 231,741 200,394 202,530 4.6% 21.0% 19.7%Texas 1,334,885 1,258,841 1,081,335 896,534 6.0% 23.4% 48.9%Utah 178,599 170,921 148,960 123,046 4.5% 19.9% 45.1%Vermont 27,524 27,028 24,090 20,021 1.8% 14.3% 37.5%Virginia 409,004 401,093 349,195 313,780 2.0% 17.1% 30.3%Washington 330,874 328,391 296,756 273,928 0.8% 11.5% 20.8%West Virginia 96,104 94,533 85,148 76,136 1.7% 12.9% 26.2%Wisconsin 301,212 295,090 268,928 249,737 2.1% 12.0% 20.6%Wyoming 36,292 35,682 32,611 28,715 1.7% 11.3% 26.4%
Source: NCES, Digest of Education Statistics 2011, Table 224; Digest of Education Statistics 2008, Table 215; Digest of Education Statistics 2002, Table 196.
15
College Board Advocacy & Policy Center July 2012
Table 7a: Total Fall Enrollment at Public Two-Year Degree-Granting Institutions by State, 2000 to 2010, Selected Years
State
Public Two-Year Fall Enrollment Percentage Change
2010 2009 2005 2000 1-Year 5-Year 10-YearU.S. 7,218,038 7,101,445 6,184,229 5,697,388 1.6% 16.7% 26.7%Alabama 97,814 93,856 78,401 70,443 4.2% 24.8% 38.9%Alaska 836 820 1,101 1,163 2.0% -24.1% -28.1%Arizona 230,220 218,072 200,845 178,680 5.6% 14.6% 28.8%Arkansas 61,785 59,569 47,771 32,549 3.7% 29.3% 89.8%California 1,582,109 1,629,609 1,398,758 1,375,900 -2.9% 13.1% 15.0%Colorado 105,513 96,793 79,803 79,735 9.0% 32.2% 32.3%Connecticut 58,253 55,112 46,227 40,817 5.7% 26.0% 42.7%Delaware 15,474 15,681 13,978 12,019 -1.3% 10.7% 28.7%District of Columbia — — — — N/A N/A N/AFlorida 126,779 179,631 277,446 318,723 -29.4% -54.3% -60.2%Georgia 174,543 164,321 144,594 104,269 6.2% 20.7% 67.4%Hawaii 29,836 28,089 22,330 23,777 6.2% 33.6% 25.5%Idaho 14,824 14,678 12,014 10,096 1.0% 23.4% 46.8%Illinois 380,500 383,960 352,824 340,372 -0.9% 7.8% 11.8%Indiana 105,914 99,911 59,969 50,308 6.0% 76.6% 110.5%Iowa 106,380 100,635 82,118 65,746 5.7% 29.5% 61.8%Kansas 85,298 82,702 74,262 70,541 3.1% 14.9% 20.9%Kentucky 106,399 100,112 84,669 48,536 6.3% 25.7% 119.2%Louisiana 79,701 71,150 33,514 42,220 12.0% 137.8% 88.8%Maine 17,838 16,239 12,435 7,569 9.8% 43.4% 135.7%Maryland 147,376 140,223 119,246 103,361 5.1% 23.6% 42.6%Massachusetts 104,951 102,321 84,209 81,224 2.6% 24.6% 29.2%Michigan 260,710 254,782 215,585 192,051 2.3% 20.9% 35.8%Minnesota 138,241 134,458 110,324 102,119 2.8% 25.3% 35.4%Mississippi 82,817 81,798 66,298 61,361 1.2% 24.9% 35.0%Missouri 111,528 104,360 86,742 79,219 6.9% 28.6% 40.8%Montana 10,761 11,032 9,134 5,328 -2.5% 17.8% 102.0%Nebraska 49,612 46,707 40,220 35,681 6.2% 23.4% 39.0%Nevada 12,587 12,942 16,371 44,952 -2.7% -23.1% -72.0%New Hampshire 14,909 13,851 13,750 10,480 7.6% 8.4% 42.3%New Jersey 180,406 177,173 151,885 124,585 1.8% 18.8% 44.8%New Mexico 86,958 81,369 64,137 51,765 6.9% 35.6% 68.0%New York 328,708 317,122 271,308 247,414 3.7% 21.2% 32.9%North Carolina 253,871 247,917 200,507 166,661 2.4% 26.6% 52.3%North Dakota 7,011 6,623 9,205 8,122 5.9% -23.8% -13.7%Ohio 207,216 196,676 173,962 157,191 5.4% 19.1% 31.8%Oklahoma 72,350 68,323 65,617 58,182 5.9% 10.3% 24.4%Oregon 108,884 107,241 80,513 83,588 1.5% 35.2% 30.3%Pennsylvania 151,119 147,876 124,077 99,273 2.2% 21.8% 52.2%Rhode Island 17,775 17,760 16,042 15,583 0.1% 10.8% 14.1%South Carolina 101,880 98,697 78,883 68,251 3.2% 29.2% 49.3%South Dakota 6,438 6,173 5,485 4,975 4.3% 17.4% 29.4%Tennessee 97,945 92,226 74,829 86,041 6.2% 30.9% 13.8%Texas 710,864 662,634 543,491 460,004 7.3% 30.8% 54.5%Utah 45,904 47,278 35,796 27,299 -2.9% 28.2% 68.2%Vermont 6,738 6,299 5,515 4,412 7.0% 22.2% 52.7%Virginia 197,004 190,854 154,967 138,039 3.2% 27.1% 42.7%Washington 161,301 157,447 190,423 181,107 2.4% -15.3% -10.9%West Virginia 22,733 21,728 17,807 6,169 4.6% 27.7% 268.5%Wisconsin 116,044 113,360 115,357 102,516 2.4% 0.6% 13.2%Wyoming 23,381 23,255 19,485 16,972 0.5% 20.0% 37.8%
Source: NCES, Digest of Education Statistics 2011, Table 224; Digest of Education Statistics 2008, Table 215; Digest of Education Statistics 2002, Table 196.

16 POLICY BRIEF I RESEARCH BRIEF I LITERATURE BRIEF I ANALYSIS BRIEF I INSIGHT BRIEF
Trends in Tuition and Fees, Enrollment, and State Appropriations for Higher Education by State
Table 7b: Total Fall Enrollment at Public Four-Year Degree-Granting Institutions by State, 2000 to 2010, Selected Years
State
Public Four-Year Fall Enrollment Percentage Change
2010 2009 2005 2000 1-Year 5-Year 10-YearU.S. 7,924,771 7,709,197 6,837,605 6,055,398 2.8% 15.9% 30.9%Alabama 169,269 166,421 149,752 136,992 1.7% 13.0% 23.6%Alaska 31,467 29,673 27,765 25,396 6.0% 13.3% 23.9%Arizona 136,756 132,363 120,020 105,842 3.3% 13.9% 29.2%Arkansas 93,995 89,905 80,346 69,226 4.5% 17.0% 35.8%California 641,539 659,861 609,397 551,871 -2.8% 5.3% 16.2%Colorado 163,894 158,645 154,706 138,162 3.3% 5.9% 18.6%Connecticut 68,941 68,099 65,478 60,210 1.2% 5.3% 14.5%Delaware 24,934 24,747 24,704 22,175 0.8% 0.9% 12.4%District of Columbia 5,840 5,253 5,595 5,499 11.2% 4.4% 6.2%Florida 663,248 579,848 371,553 238,189 14.4% 78.5% 178.5%Georgia 261,566 253,716 197,418 167,486 3.1% 32.5% 56.2%Hawaii 30,254 29,856 27,827 20,802 1.3% 8.7% 45.4%Idaho 49,380 48,583 48,289 43,655 1.6% 2.3% 13.1%Illinois 205,015 204,781 202,325 193,783 0.1% 1.3% 5.8%Indiana 231,791 225,161 207,329 189,715 2.9% 11.8% 22.2%Iowa 71,401 70,235 66,789 69,262 1.7% 6.9% 3.1%Kansas 100,325 100,034 96,057 89,435 0.3% 4.4% 12.2%Kentucky 123,326 121,396 116,910 103,437 1.6% 5.5% 19.2%Louisiana 145,110 144,361 147,529 146,993 0.5% -1.6% -1.3%Maine 33,644 33,429 35,084 33,093 0.6% -4.1% 1.7%Maryland 162,403 157,962 136,827 120,436 2.8% 18.7% 34.8%Massachusetts 119,542 116,678 104,086 102,024 2.5% 14.8% 17.2%Michigan 301,734 298,240 290,001 275,810 1.2% 4.0% 9.4%Minnesota 137,935 135,878 130,529 116,498 1.5% 5.7% 18.4%Mississippi 76,878 73,719 69,598 63,994 4.3% 10.5% 20.1%Missouri 144,591 141,208 130,980 122,290 2.4% 10.4% 18.2%Montana 37,500 35,621 33,863 32,059 5.3% 10.7% 17.0%Nebraska 58,368 57,442 52,961 52,850 1.6% 10.2% 10.4%Nevada 100,516 99,455 83,672 38,168 1.1% 20.1% 163.4%New Hampshire 29,163 29,656 27,257 25,390 -1.7% 7.0% 14.9%New Jersey 177,850 171,761 152,430 142,336 3.5% 16.7% 25.0%New Mexico 63,898 61,732 56,839 49,685 3.5% 12.4% 28.6%New York 394,792 395,344 354,914 336,003 -0.1% 11.2% 17.5%North Carolina 221,727 222,322 196,248 162,761 -0.3% 13.0% 36.2%North Dakota 41,893 40,104 33,603 27,892 4.5% 24.7% 50.2%Ohio 340,335 325,326 279,039 253,970 4.6% 22.0% 34.0%Oklahoma 125,292 121,630 113,608 95,517 3.0% 10.3% 31.2%Oregon 99,118 94,005 83,239 71,168 5.4% 19.1% 39.3%Pennsylvania 281,770 278,103 256,194 239,956 1.3% 10.0% 17.4%Rhode Island 25,449 25,649 23,966 22,875 -0.8% 6.2% 11.3%South Carolina 103,200 101,507 95,803 87,268 1.7% 7.7% 18.3%South Dakota 38,131 35,501 32,063 29,882 7.4% 18.9% 27.6%Tennessee 144,541 139,515 125,565 116,489 3.6% 15.1% 24.1%Texas 624,021 596,207 537,844 436,530 4.7% 16.0% 43.0%Utah 132,695 123,643 113,164 95,747 7.3% 17.3% 38.6%Vermont 20,786 20,729 18,575 15,609 0.3% 11.9% 33.2%Virginia 212,000 210,239 194,228 175,741 0.8% 9.2% 20.6%Washington 169,573 170,944 106,333 92,821 -0.8% 59.5% 82.7%West Virginia 73,371 72,805 67,341 69,967 0.8% 9.0% 4.9%Wisconsin 185,168 181,730 153,571 147,221 1.9% 20.6% 25.8%Wyoming 12,911 12,427 13,126 11,743 3.9% -1.6% 9.9%
Source: NCES, Digest of Education Statistics 2011, Table 224; Digest of Education Statistics 2008, Table 215; Digest of Education Statistics 2002, Table 196.
12b-5761
About Trends in Higher EducationThe Trends series helps answer critical questions on college affordability. Are college prices rising at an unprecedented rate? How much does student financial aid help students cover the costs of attending college? The data provided in Trends and the accompanying commentary can inform policymakers, researchers, student advocates, and others in their analyses of these issues.
http://trends.collegeboard.org
Contact Information for the AuthorsJennifer [email protected]
Sandy [email protected]
About the College BoardThe College Board is a mission-driven not-for-profit organization that connects students to college success and opportunity. Founded in 1900, the College Board was created to expand access to higher education. Today, the membership association is made up of over 6,000 of the world’s leading educational institutions and is dedicated to promoting excellence and equity in education. Each year, the College Board helps more than seven million students prepare for a successful transition to college through programs and services in college readiness and college success — including the SAT® and the Advanced Placement Program®. The organization also serves the education community through research and advocacy on behalf of students, educators and schools.
The College Board Advocacy & Policy Center was established to help transform education in America. Guided by the College Board’s principles of excellence and equity in education, we work to ensure that students from all backgrounds have the opportunity to succeed in college and beyond. We make critical connections between policy, research and real-world practice to develop innovative solutions to the most pressing challenges in education today.
advocacy.collegeboard.org
For further information, visit www.collegeboard.org.
© 2012 The College Board. College Board, Advanced Placement Program, SAT and the acorn logo are registered trademarks of the College Board. All other products and services may be trademarks of their respective owners. Visit the College Board on the Web: www.collegeboard.org.