trends in the transport sector 2010 - international transport forum
TRANSCRIPT
How have the passenger and freight transport sectors evolved in recent years? And what about road safety? This publication presents the most up-to-date statistics on transport markets in International Transport Forum countries for the period 1970-2008, including charts to highlight the major trends.
This brochure provides the reader with first-hand figures on key transport trends. Data are also provided on air and maritime transport as well as on investment and maintenance expenditures undertaken in the transport sector.
-:HSTCSC=VUW\V]:(74 2010 03 1 P1) ISBN 978-92-821-0271-8
www.oecd.org/publishing
www.internationaltransportforum.org
Trendsin theTransport
sector
Trendsin theTransport
sector
19702008


TRENDSin theTransport
Sector
19702008

Trends in the Transport Sector 1970-2008 - OECD/ITF 2010
3
ORGANISATION FOR ECONOMIC CO-OPERATION AND DEVELOPMENT
The OECD is a unique forum where the governments of 30 democracies work together to address the economic, social and environmental challenges of globalisation. The OECD is also at the forefront of efforts to understand and to help governments respond to new developments and concerns, such as corporate governance, the information economy and the challenges of an ageing population. The Organisation provides a setting where governments can compare policy experiences, seek answers to common problems, identify good practice and work to co-ordinate domestic and international policies.
The OECD member countries are: Australia, Austria, Belgium, Canada, the Czech Republic, Denmark, Finland, France, Germany, Greece, Hungary, Iceland, Ireland, Italy, Japan, Korea, Luxembourg, Mexico, the Netherlands, New Zealand, Norway, Poland, Portugal, the Slovak Republic, Spain, Sweden, Switzerland, Turkey, the United Kingdom and the United States. The Commission of the European Communities takes part in the work of the OECD.
OECD Publishing disseminates widely the results of the Organisation’s statistics gathering and research on economic, social and environmental issues, as well as the conventions, guidelines and standards agreed by its members.
Trends in the Transport Sector 1970-2008 - OECD/ITF 2010
4
Also available in French under the title: Évolution des transports 1970-2008
ISBN 978-92-821-0271-8 (print) ISBN 978-92-821-0272-5 (PDF)
Corrigenda to OECD publications may be found on line at: www.oecd.org/publishing/corrigenda.
© OECD/ITF 2010
You can copy, download or print OECD content for your own use, and you can include excerpts from OECD publications, databases and multimedia products in your own documents, presentations, blogs, websites and teaching materials, provided that suitable acknowledgment of OECD as source and copyright owner is given. All requests for public or commercial use and translation rights should be submitted to [email protected]. Requests for permission to photocopy portions of this material for public or commercial use shall be addressed directly to the Copyright Clearance Center (CCC) at [email protected] or the Centre français d’exploitation du droit de copie (CFC) at [email protected].
This work is published on the responsibility of the Secretary-General of the OECD. The opinions expressed and arguments employed herein do not necessarily reflect the official views of the Organisation or of the governments of its member countries.
Trends in the Transport Sector 1970-2008 - OECD/ITF 2010
5
INTERNATIONAL TRANSPORT FORUM
The International Transport Forum is an inter-governmental body within the OECD family. The Forum is a global platform for transport policy makers and stakeholders. Its objective is to serve political leaders and a larger public in developing a better understanding of the role of transport in economic growth and the role of transport policy in addressing the social and environmental dimensions of sustainable development. The Forum organises a Conference for Ministers and leading figures from civil society each May in Leipzig, Germany.
The International Transport Forum was created under a Declaration issued by the Council of Ministers of the ECMT (European Conference of Ministers of Transport) at its Ministerial Session in May 2006 under the legal authority of the Protocol of the ECMT, signed in Brussels on 17 October 1953, and legal instruments of the OECD. The Forum’s Secretariat is located in Paris.
The members of the Forum are: Albania, Armenia, Australia, Austria, Azerbaijan, Belarus, Belgium, Bosnia-Herzegovina, Bulgaria, Canada, Croatia, the Czech Republic, Denmark, Estonia, Finland, France, FYROM, Georgia, Germany, Greece, Hungary, Iceland, India, Ireland, Italy, Japan, Korea, Latvia, Liechtenstein, Lithuania, Luxembourg, Malta, Mexico, Moldova, Montenegro, Netherlands, New Zealand, Norway, Poland, Portugal, Romania, Russia, Serbia, Slovakia, Slovenia, Spain, Sweden, Switzerland, Turkey, Ukraine, the United Kingdom and the United States.

Trends in the Transport Sector 1970-2008 - OECD/ITF 2010
6
The OECD and the International Transport Forum established a Joint Transport Research Centre in 2004. The Centre conducts co-operative research programmes addressing all modes of transport to support policymaking in member countries and contribute to the Ministerial sessions of the International Transport Forum.
Further information about the International Transport Forum is available on Internet at the
following address: www.internationaltransportforum.org
Trends in the Transport Sector 1970-2008 - OECD/ITF 2010
7
TABLE OF CONTENTS
Introduction .......................................................... 9
1. The economic outlook ............................... 10 1.1. The world economy in the Aftermath of the crisis ........................... 10 1.2. Globally synchronised collapse of trade...................................................... 14
2. Global trends in transport ......................... 16 2.1. Goods transport .................................... 16 2.2. Passenger transport ............................. 27
3. The road safety record in ITF countries in 2008........................................ 31
4. Investment and maintenance in inland transport infrastructure 1995-2008 .......... 35 4.1. Introduction to data ............................... 35 4.2. Trends in relation to GDP ..................... 36 4.3. Volume of investment ........................... 39 4.4. Modal split of investment ...................... 40 4.5. Trends in inland transport infrastructure maintenance ................... 43 4.6. Conclusions .......................................... 45
5. Statistical information ............................... 47 5.1. Data sources, definitions and country notes ........................................ 47 5.2. Transport tables and graphs ................ 56
References .......................................................... 86

Trends in the Transport Sector 1970-2008 - OECD/ITF 2010
9
INTRODUCTION
This publication describes global trends in the transport sector. For the member countries of the International Transport Forum it illustrates changes that have taken place in the sector since 1970.
In order to provide context for the discussion of transport trends, Section 1 provides a brief analysis of the macroeconomic situation and of trends in international trade, and establishes some links to the transport sector. Naturally, the recent economic crisis is of core interest here. Section 2 introduces global transport trends for freight and passenger transport. Section 3 focuses on road safety performance in ITF countries in 2008, and section 4 summarises and discusses aggregate trends in investment in transport infrastructure in ITF countries. The last section presents detailed statistical data in the form of tables.
Maritime and air transport data are taken from a variety of sources. Road, rail and inland waterway transport data for the ITF area are provided to us by the 52 countries that were members of the ITF in 2009. The data in the detailed tables at the end of this publication relate to the last year for which comprehensive and uniform data provided by member countries were available at the time this brochure was compiled, namely 2008. Where possible, data for 2009 or 2010 are included in the text, but not in the detailed tables at the end. In some cases, indicators include estimates for certain countries for which recent data are not available.
Trends in the Transport Sector 1970-2008 - OECD/ITF 2010
10
1. THE ECONOMIC OUTLOOK
1.1. The world economy in the aftermath of the crisis
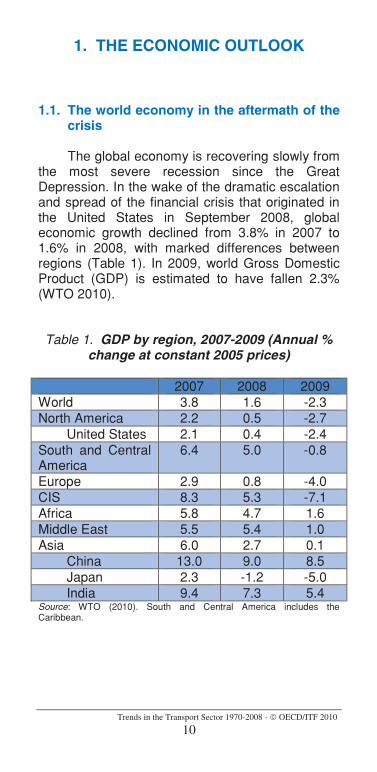
The global economy is recovering slowly from the most severe recession since the Great Depression. In the wake of the dramatic escalation and spread of the financial crisis that originated in the United States in September 2008, global economic growth declined from 3.8% in 2007 to 1.6% in 2008, with marked differences between regions (Table 1). In 2009, world Gross Domestic Product (GDP) is estimated to have fallen 2.3% (WTO 2010).
Table 1. GDP by region, 2007-2009 (Annual % change at constant 2005 prices)
2007 2008 2009 World 3.8 1.6 -2.3 North America 2.2 0.5 -2.7
United States 2.1 0.4 -2.4 South and Central America
6.4 5.0 -0.8
Europe 2.9 0.8 -4.0 CIS 8.3 5.3 -7.1 Africa 5.8 4.7 1.6 Middle East 5.5 5.4 1.0 Asia 6.0 2.7 0.1
China 13.0 9.0 8.5 Japan 2.3 -1.2 -5.0 India 9.4 7.3 5.4
Source: WTO (2010). South and Central America includes the Caribbean.
Trends in the Transport Sector 1970-2008 - OECD/ITF 2010
11
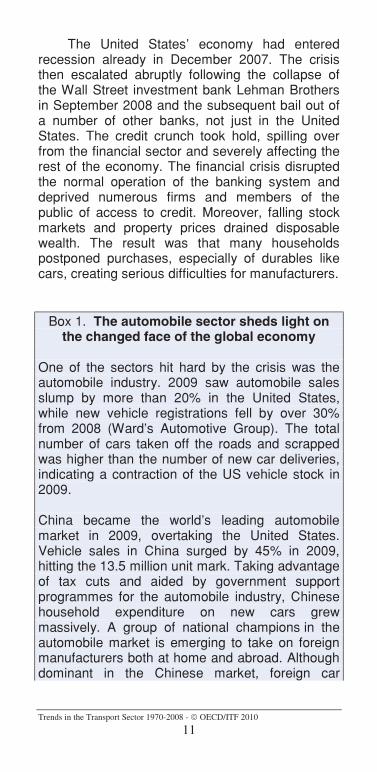
The United States’ economy had entered recession already in December 2007. The crisis then escalated abruptly following the collapse of the Wall Street investment bank Lehman Brothers in September 2008 and the subsequent bail out of a number of other banks, not just in the United States. The credit crunch took hold, spilling over from the financial sector and severely affecting the rest of the economy. The financial crisis disrupted the normal operation of the banking system and deprived numerous firms and members of the public of access to credit. Moreover, falling stock markets and property prices drained disposable wealth. The result was that many households postponed purchases, especially of durables like cars, creating serious difficulties for manufacturers.
Box 1. The automobile sector sheds light on the changed face of the global economy
One of the sectors hit hard by the crisis was the automobile industry. 2009 saw automobile sales slump by more than 20% in the United States, while new vehicle registrations fell by over 30% from 2008 (Ward’s Automotive Group). The total number of cars taken off the roads and scrapped was higher than the number of new car deliveries, indicating a contraction of the US vehicle stock in 2009.
China became the world’s leading automobile market in 2009, overtaking the United States. Vehicle sales in China surged by 45% in 2009, hitting the 13.5 million unit mark. Taking advantage of tax cuts and aided by government support programmes for the automobile industry, Chinese household expenditure on new cars grew massively. A group of national champions in the automobile market is emerging to take on foreign manufacturers both at home and abroad. Although dominant in the Chinese market, foreign car
Trends in the Transport Sector 1970-2008 - OECD/ITF 2010
12
companies are currently required to build vehicles in joint ventures with local firms. The Chinese Geely group recently bought Volvo from Ford. Some Indian car makers have also entered international markets, with Tata acquiring Jaguar from Ford in 2009 and REVA marketing electric cars in Europe.
A brief review of the automobile industry shows that in terms of added value and jobs, it represents a relatively small share of the economy in OECD Member countries. However, there are large differences between countries: the automobile industry accounts for almost 4% of total output in the Germany and the Czech Republic. The strategic nature of this sector for such countries prompted the governments of several major economies to include support for car purchase in measures to counter the economic crisis. Stimulus packages included scrapping bonuses, subsidised credit, loan guarantees and temporary financial assistance, sometimes in return for sales of low-emission cars to replace older vehicles. The scope and terms, particularly the duration, of these programmes varied a great deal from one country to another: in Germany and the United States, the credit allocated to these programmes was exhausted before the planned expire date. While the amount of aid generally varied between EUR 1 000 and EUR 2 000 per car, it was particularly generous in some countries.
Subsequent to these measures substantial rises in sales figures were recorded in Germany, Austria, Italy, France and the Slovak Republic and, at the macroeconomic level, purchase incentive measures appeared to have some success in slowing or cushioning the downturn in OECD economies at the end of 2008 and into the early months of 2009. The impact in terms of increased GDP growth ranged from 0.1 to 0.4% of the annual GDP of the countries concerned (OECD 2009a).
Trends in the Transport Sector 1970-2008 - OECD/ITF 2010
13
That said, a potential crowding-out effect cannot be ruled out: consumers were certainly able to buy new cars but to the detriment of other consumer spending, which makes it difficult to estimate the net effect. Furthermore, experience shows that sales decline as soon as the measures come to an end and that they may simply have brought sales forward (ECMT 1999).
Many countries were quick to respond to the crisis with fiscal stimulus programmes, including major public spending programs as well as bailouts for major banks and mortgage assistance in the United States. Central banks kept interest rates low, with real interest rates approaching zero. Most of the stimulus packages have significant transport components. In the United States alone, the Recovery Act provides USD 35 billion for highway infrastructure projects and public transportation.
At the time of publication, signs are that the global economy has returned to growth, although quite moderate in some places. Seasonally adjusted growth in GDP has remained positive for three consecutive quarters in the OECD as a whole.
Forecasts for global economic growth in 2010 are positive, varying between 2.1% (OECD 2010) and 3.6% (World Bank 2010), but the prospects differ greatly across countries. The OECD forecast for the G7 countries suggest that the growth in the United States will continue expand faster than in Japan and the largest euro-area countries (OECD 2010). The OECD countries benefit from their trade linkages with emerging-market economies, including China, India and Brazil, where growth is expected to be strong in 2010. GDP in the East Asia and Pacific region is expected to grow by more than 8% in 2010, while for Europe and
Trends in the Transport Sector 1970-2008 - OECD/ITF 2010
14
Central Asia growth projections suggest less than 3% growth for the year (World Bank 2010).
Precisely how strong the recovery is, is unclear as stimulus effects have temporarily provided relief. Uncertainties remain on what will happen once these packages come to an end and if private spending will be strong enough to carry forward the government stimulus for growth.
1.2. Globally synchronised collapse of trade
The recession has had a strong impact on world trade. Real growth in trade in goods was 2% in 2008, down from over 6% in 2007. In 2009, the volume of global trade is estimated to have contracted by 12%, the largest decline since the Second World War. Transport services recorded the largest drop among service categories (WTO 2010).
Tables 1 and 2 highlight the weak economic performance of some of the most important economic areas in 2008 and 2009. The European Union, the United States and Japan, all with economies badly hit by the economic downturn, showed a very significant decline in imports. Despite a good overall performance in this difficult economic context, China saw its exports falter at the end of 2008 and finally decline by over 10% in 2009. China’s exports to its six main partners (counting the EU as a single partner) accounted for more than 70% of its total exports in 2007.
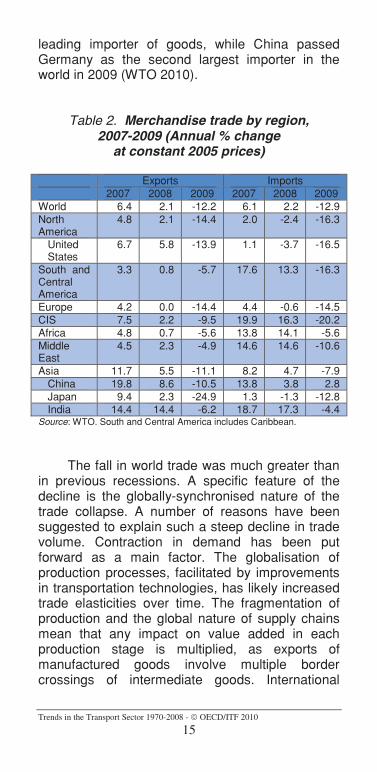
The share of developing economies in world trade reached a record high in 2008 when their exports accounted for 38% of total world exports in value terms. Germany, the world’s leading goods exporter in 2008, was overtaken by China in 2009, accounting for almost 10% of world exports. The United States kept its position as the world’s
Trends in the Transport Sector 1970-2008 - OECD/ITF 2010
15
leading importer of goods, while China passed Germany as the second largest importer in the world in 2009 (WTO 2010).
Table 2. Merchandise trade by region, 2007-2009 (Annual % change
at constant 2005 prices)
Exports Imports 2007 2008 2009 2007 2008 2009
World 6.4 2.1 -12.2 6.1 2.2 -12.9 North America
4.8 2.1 -14.4 2.0 -2.4 -16.3
United States
6.7 5.8 -13.9 1.1 -3.7 -16.5
South and Central America
3.3 0.8 -5.7 17.6 13.3 -16.3
Europe 4.2 0.0 -14.4 4.4 -0.6 -14.5 CIS 7.5 2.2 -9.5 19.9 16.3 -20.2 Africa 4.8 0.7 -5.6 13.8 14.1 -5.6 Middle East
4.5 2.3 -4.9 14.6 14.6 -10.6
Asia 11.7 5.5 -11.1 8.2 4.7 -7.9 China 19.8 8.6 -10.5 13.8 3.8 2.8 Japan 9.4 2.3 -24.9 1.3 -1.3 -12.8 India 14.4 14.4 -6.2 18.7 17.3 -4.4
Source: WTO. South and Central America includes Caribbean.
The fall in world trade was much greater than in previous recessions. A specific feature of the decline is the globally-synchronised nature of the trade collapse. A number of reasons have been suggested to explain such a steep decline in trade volume. Contraction in demand has been put forward as a main factor. The globalisation of production processes, facilitated by improvements in transportation technologies, has likely increased trade elasticities over time. The fragmentation of production and the global nature of supply chains mean that any impact on value added in each production stage is multiplied, as exports of manufactured goods involve multiple border crossings of intermediate goods. International

Trends in the Transport Sector 1970-2008 - OECD/ITF 2010
16
supply chains and advanced information technologies allow for producers in different regions also to react to market conditions in another market rapidly (OECD 2009b; WTO 2010).
Due to the interconnected nature of the global economy, it is not surprising that the crisis has had an extremely strong impact on the transport sector, right around the world. We now turn our focus to global transport trends in 2008, at the onset of the crisis, with preliminary data for 2009, reflecting the full impact of the crisis.
2. GLOBAL TRENDS IN TRANSPORT
2.1. Goods transport
The economic crisis at the end of 2008 and the collapse of world trade in 2009 have had a major impact on the transport sector. Growth in global transport of goods was recorded for 2008 as a whole but with the economic downturn, at slower rate than previously, especially during the last quarter of 2008.
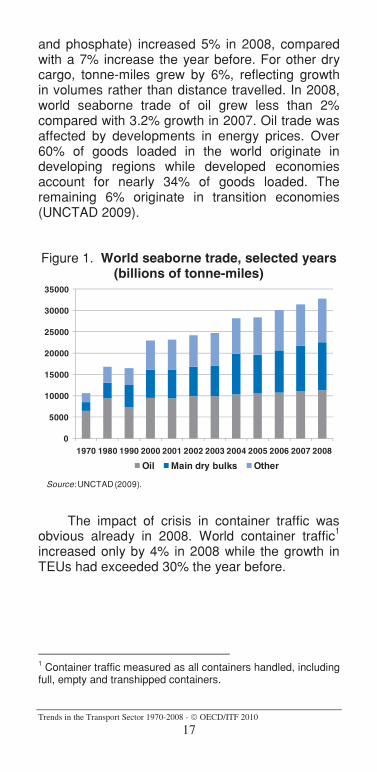
Maritime transport remains the backbone of international trade, with over 80% of world merchandise trade by volume being carried by sea. In 2008, the volume of international seaborne trade was estimated by UNCTAD at 32 746 tonne-miles, representing an increase of 4.8%. In terms of tonnes loaded, world seaborne trade also continued to grow and was estimated at 8.17 billion tonnes, though the growth rate, at 3.6%, slowed in comparison to 2007 (4.5%). Tonne-miles for major dry bulks (iron ore, coal, grain, alumina
Trends in the Transport Sector 1970-2008 - OECD/ITF 2010
17
and phosphate) increased 5% in 2008, compared with a 7% increase the year before. For other dry cargo, tonne-miles grew by 6%, reflecting growth in volumes rather than distance travelled. In 2008, world seaborne trade of oil grew less than 2% compared with 3.2% growth in 2007. Oil trade was affected by developments in energy prices. Over 60% of goods loaded in the world originate in developing regions while developed economies account for nearly 34% of goods loaded. The remaining 6% originate in transition economies (UNCTAD 2009).
Figure 1. World seaborne trade, selected years (billions of tonne-miles)
0
5000
10000
15000
20000
25000
30000
35000
1970 1980 1990 2000 2001 2002 2003 2004 2005 2006 2007 2008
Oil Main dry bulks Other
Source: UNCTAD (2009).
The impact of crisis in container traffic was obvious already in 2008. World container traffic1
increased only by 4% in 2008 while the growth in TEUs had exceeded 30% the year before.
1 Container traffic measured as all containers handled, including full, empty and transhipped containers.
Trends in the Transport Sector 1970-2008 - OECD/ITF 2010
18
Table 3. World container traffic (TEU)
Year TEU (000) %2007 481 980 30.4 2008 501 479 4.0 2009 370 656 -26.1
Source: Containerization International.
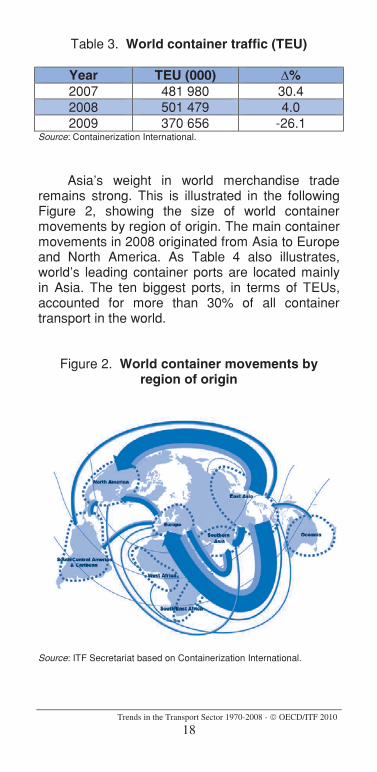
Asia’s weight in world merchandise trade remains strong. This is illustrated in the following Figure 2, showing the size of world container movements by region of origin. The main container movements in 2008 originated from Asia to Europe and North America. As Table 4 also illustrates, world’s leading container ports are located mainly in Asia. The ten biggest ports, in terms of TEUs, accounted for more than 30% of all container transport in the world.
Figure 2. World container movements by region of origin
Source: ITF Secretariat based on Containerization International.
Trends in the Transport Sector 1970-2008 - OECD/ITF 2010
19
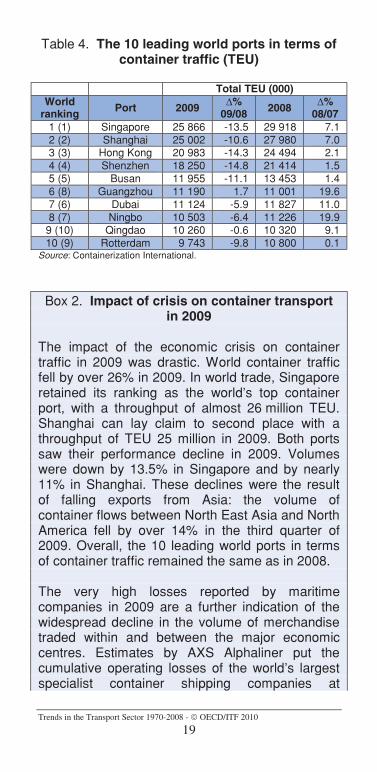
Table 4. The 10 leading world ports in terms of container traffic (TEU)
Total TEU (000)World
ranking Port 2009 %09/08 2008 %
08/07 1 (1) Singapore 25 866 -13.5 29 918 7.1 2 (2) Shanghai 25 002 -10.6 27 980 7.0 3 (3) Hong Kong 20 983 -14.3 24 494 2.1 4 (4) Shenzhen 18 250 -14.8 21 414 1.5 5 (5) Busan 11 955 -11.1 13 453 1.4 6 (8) Guangzhou 11 190 1.7 11 001 19.6 7 (6) Dubai 11 124 -5.9 11 827 11.0 8 (7) Ningbo 10 503 -6.4 11 226 19.9
9 (10) Qingdao 10 260 -0.6 10 320 9.1 10 (9) Rotterdam 9 743 -9.8 10 800 0.1
Source: Containerization International.
Box 2. Impact of crisis on container transport in 2009
The impact of the economic crisis on container traffic in 2009 was drastic. World container traffic fell by over 26% in 2009. In world trade, Singapore retained its ranking as the world’s top container port, with a throughput of almost 26 million TEU. Shanghai can lay claim to second place with a throughput of TEU 25 million in 2009. Both ports saw their performance decline in 2009. Volumes were down by 13.5% in Singapore and by nearly 11% in Shanghai. These declines were the result of falling exports from Asia: the volume of container flows between North East Asia and North America fell by over 14% in the third quarter of 2009. Overall, the 10 leading world ports in terms of container traffic remained the same as in 2008.
The very high losses reported by maritime companies in 2009 are a further indication of the widespread decline in the volume of merchandise traded within and between the major economic centres. Estimates by AXS Alphaliner put the cumulative operating losses of the world’s largest specialist container shipping companies at
Trends in the Transport Sector 1970-2008 - OECD/ITF 2010
20
USD 11 billion over the first 9 months of 2009. This is comparable to air transport deficits and illustrates the extent of the crisis that hit the transport sector. The figures for 16 of the leading maritime companies to publish their results on 30 September 2009 show an operating loss of USD 9 billion compared with a profit of USD 5.3 billion from January to September 2008 -- with cumulative turnover to 30 September 2009 plummeting by 40% to USD 56 billion. The collapse in the volume of merchandise carried and the hefty reduction in prices on offer to clients cost these 16 firms USD 38 billion in lost revenue in 2009 (AXS Alphaliner).
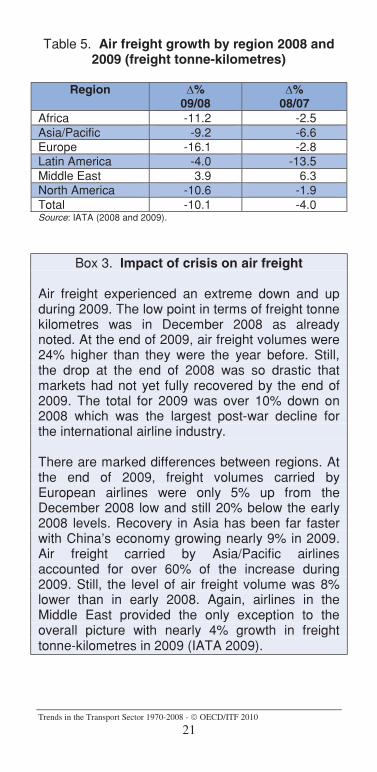
Air freight volumes collapsed in 2008. While the year began with a rate of growth around 4% in international freight tonne-kilometres, the decline from the middle of year resulted in a total for 2008 4% lower than 2007. An unprecedented 22.6% fall on the same month of the previous year was recorded in December 2008. Until then the largest monthly fall recorded in the past 30 years (-14%) was in September 2001, when terrorist attacks grounded capacity. Latin America suffered the largest drop in annual freight volumes, with 13.5% decline in 2008. Airlines in the Asia/Pacific region also suffered, declining 6.6%. Only airlines in the Middle East continued to generate freight growth through 2008, providing an exception to the general industry experience (IATA 2008).
Trends in the Transport Sector 1970-2008 - OECD/ITF 2010
21
Table 5. Air freight growth by region 2008 and 2009 (freight tonne-kilometres)
Region %09/08
%08/07
Africa -11.2 -2.5 Asia/Pacific -9.2 -6.6 Europe -16.1 -2.8 Latin America -4.0 -13.5 Middle East 3.9 6.3 North America -10.6 -1.9 Total -10.1 -4.0 Source: IATA (2008 and 2009).
Box 3. Impact of crisis on air freight
Air freight experienced an extreme down and up during 2009. The low point in terms of freight tonne kilometres was in December 2008 as already noted. At the end of 2009, air freight volumes were 24% higher than they were the year before. Still, the drop at the end of 2008 was so drastic that markets had not yet fully recovered by the end of 2009. The total for 2009 was over 10% down on 2008 which was the largest post-war decline for the international airline industry.
There are marked differences between regions. At the end of 2009, freight volumes carried by European airlines were only 5% up from the December 2008 low and still 20% below the early 2008 levels. Recovery in Asia has been far faster with China’s economy growing nearly 9% in 2009. Air freight carried by Asia/Pacific airlines accounted for over 60% of the increase during 2009. Still, the level of air freight volume was 8% lower than in early 2008. Again, airlines in the Middle East provided the only exception to the overall picture with nearly 4% growth in freight tonne-kilometres in 2009 (IATA 2009).
Trends in the Transport Sector 1970-2008 - OECD/ITF 2010
22
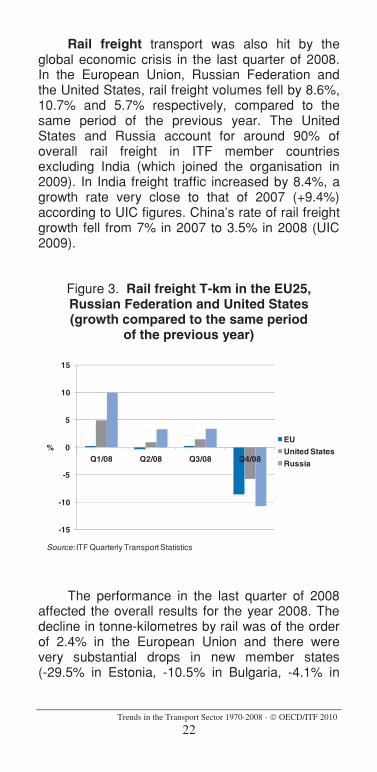
Rail freight transport was also hit by the global economic crisis in the last quarter of 2008. In the European Union, Russian Federation and the United States, rail freight volumes fell by 8.6%, 10.7% and 5.7% respectively, compared to the same period of the previous year. The United States and Russia account for around 90% of overall rail freight in ITF member countries excluding India (which joined the organisation in 2009). In India freight traffic increased by 8.4%, a growth rate very close to that of 2007 (+9.4%) according to UIC figures. China’s rate of rail freight growth fell from 7% in 2007 to 3.5% in 2008 (UIC 2009).
Figure 3. Rail freight T-km in the EU25, Russian Federation and United States (growth compared to the same period
of the previous year)
-15
-10
-5
0
5
10
15
Q1/08 Q2/08 Q3/08 Q4/08%
EU
United States
Russia
Source: ITF Quarterly Transport Statistics
The performance in the last quarter of 2008 affected the overall results for the year 2008. The decline in tonne-kilometres by rail was of the order of 2.4% in the European Union and there were very substantial drops in new member states (-29.5% in Estonia, -10.5% in Bulgaria, -4.1% in

Trends in the Transport Sector 1970-2008 - OECD/ITF 2010
23
Poland). Equally clear is the decline of over 11% recorded in France and of just less than 6% in Italy. Although Russia and Germany did see a slight increase in rail freight transport (+1.2% and +0.9%, respectively), in the United States the increase was a mere 0.3% (see Table A1 in section 5.2.).
Figure 4. Rail freight traffic (billion tonne-kilometres)
0
500
1000
1500
2000
2500
3000
USA China Russia India Europe without
CIS
20072008
Source: ITF and UIC.
Box 4. Impact of crisis on rail freight in 2009
In the second quarter of 2009, ITF data from its quarterly transport statistics showed that, compared with the second quarter of 2008, performance in tonne-kilometres was down by 18% in the United States, 17% in Russia, 18% in Korea, 24% in Germany, 35% in Poland and 40% in Bulgaria. These figures give an idea of the full force of the economic crisis that struck in the early months of 2009.
Analysis of seasonally adjusted data suggests the decline was already slowing down during the second quarter of 2009 and the latest data from the third quarter 2009 confirms that the decline has come to an end in a number of countries around
Trends in the Transport Sector 1970-2008 - OECD/ITF 2010
24
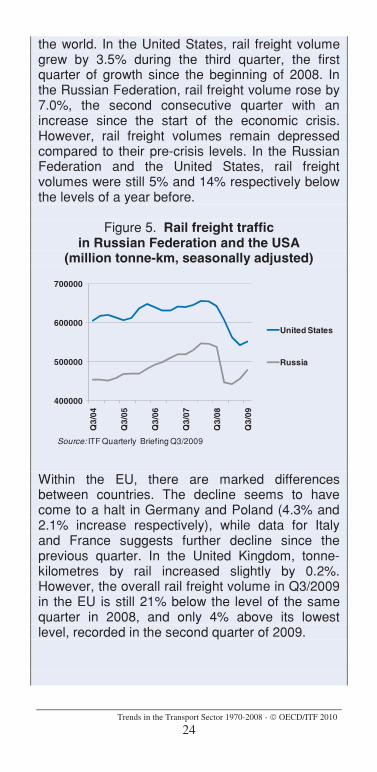
the world. In the United States, rail freight volume grew by 3.5% during the third quarter, the first quarter of growth since the beginning of 2008. In the Russian Federation, rail freight volume rose by 7.0%, the second consecutive quarter with an increase since the start of the economic crisis. However, rail freight volumes remain depressed compared to their pre-crisis levels. In the Russian Federation and the United States, rail freight volumes were still 5% and 14% respectively below the levels of a year before.
Figure 5. Rail freight traffic in Russian Federation and the USA
(million tonne-km, seasonally adjusted)
400000
500000
600000
700000
Q3/
04
Q3/
05
Q3/
06
Q3/
07
Q3/
08
Q3/
09
United States
Russia
Source: ITF Quarterly Briefing Q3/2009
Within the EU, there are marked differences between countries. The decline seems to have come to a halt in Germany and Poland (4.3% and 2.1% increase respectively), while data for Italy and France suggests further decline since the previous quarter. In the United Kingdom, tonne-kilometres by rail increased slightly by 0.2%. However, the overall rail freight volume in Q3/2009 in the EU is still 21% below the level of the same quarter in 2008, and only 4% above its lowest level, recorded in the second quarter of 2009.

Trends in the Transport Sector 1970-2008 - OECD/ITF 2010
25
Figure 6. Rail freight traffic in the EU (million tonne-km, seasonally adjusted)
60000
70000
80000
90000
100000
110000Q
3/97
Q3/
98
Q3/
99
Q3/
00
Q3/
01
Q3/
02
Q3/
03
Q3/
04
Q3/
05
Q3/
06
Q3/
07
Q3/
08
Q3/
09
Source: ITF Quarterly Briefing Q3/2009
Road freight transport suffered in 2008 but data show marked differences between regions. The decline in activity, expressed in tonne-kilometres, was of the order of 1.2% in the EU in 2008 with declines of the order of 6% in freight moved in France and Spain and over 8% in Belgium and Portugal (see Table A2 in section 5.2). Nevertheless, Russia and Moldova, like Poland and Bulgaria, all recorded increases (+5.1%, +8.1%, +9.2%, +21%, respectively).
Box 5. Impact of economic crisis on road freight
The ITF figures for early 2009 reveal a decline in road haulage within the European area. The quarterly statistics for the second quarter of 2009 showed a year-on-year decline of over 12% in the tonne-kilometre figures for Spain and 16% for France, while for Russia the figure was down 23%, Hungary 7% and Finland 22%. There is accordingly evidence of a widespread and substantial decline in road haulage in early 2009,
Trends in the Transport Sector 1970-2008 - OECD/ITF 2010
26
which is likely to have undermined the financial situation of hauliers.
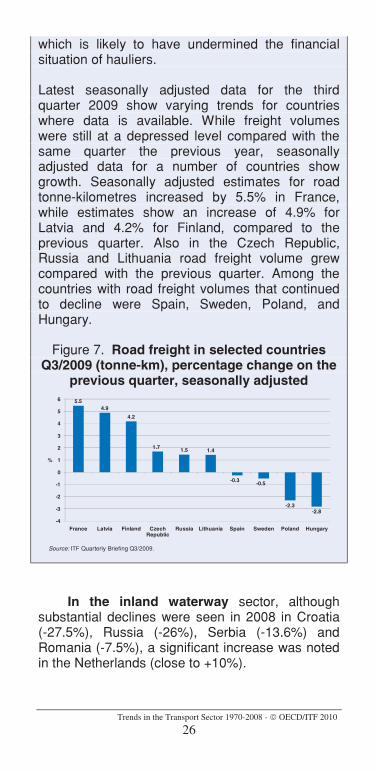
Latest seasonally adjusted data for the third quarter 2009 show varying trends for countries where data is available. While freight volumes were still at a depressed level compared with the same quarter the previous year, seasonally adjusted data for a number of countries show growth. Seasonally adjusted estimates for road tonne-kilometres increased by 5.5% in France, while estimates show an increase of 4.9% for Latvia and 4.2% for Finland, compared to the previous quarter. Also in the Czech Republic, Russia and Lithuania road freight volume grew compared with the previous quarter. Among the countries with road freight volumes that continued to decline were Spain, Sweden, Poland, and Hungary.
Figure 7. Road freight in selected countries Q3/2009 (tonne-km), percentage change on the
previous quarter, seasonally adjusted5.5
4.9
4.2
1.7 1.5 1.4
-0.3-0.5
-2.3-2.8
-4
-3
-2
-1
0
1
2
3
4
5
6
France Latvia Finland Czech Republic
Russia Lithuania Spain Sweden Poland Hungary
%
Source: ITF Quarterly Briefing Q3/2009.
In the inland waterway sector, although substantial declines were seen in 2008 in Croatia (-27.5%), Russia (-26%), Serbia (-13.6%) and Romania (-7.5%), a significant increase was noted in the Netherlands (close to +10%).

Trends in the Transport Sector 1970-2008 - OECD/ITF 2010
27
2.2. Passenger transport
Passenger transport was not affected by the global crisis as significantly as the freight sector in 2008. However, we still observe a decline in growth for the year as a whole.
Air passenger traffic carried by IATA members in 2008 grew 1.6% compared with 7.4% growth in 2007. Although air travel did not fall as dramatically as air freight at the end of 2008, international passenger volumes measured as revenue passenger kilometres fell 4.6% in December compared to the same month in the previous year. A similar decline had already taken place in November, affecting the overall numbers for the year. Revenue passenger kilometres for the year 2008 as a whole, recorded net falls for airlines in Africa and the Asia/Pacific region (-4.0% and -1.5% respectively) while other regions experienced weak growth in 2008.
Airlines around the world started cutting capacity as the crisis hit the industry but they were still not able to respond sufficiently to the crisis in 2008 and, as a result, load factors fell sharply in December (IATA 2008).
Table 6. Air travel growth by region in 2008 and 2009 (Revenue pass-km)
Region %09/08
%08/07
Africa -6.8 -4.0 Asia/Pacific -5.6 -1.5 Europe -5.0 1.8 Latin America 0.3 10.2 Middle East 11.2 7.0 North America -5.6 2.9 Total -3.5 1.6 Source: IATA (2008 and 2009).
Trends in the Transport Sector 1970-2008 - OECD/ITF 2010
28
Box 6. Impact of crisis on air travel
The world air passenger transport sector has been showing signs of improvement since mid 2009. However, despite the second half upturn international passenger transport by air fell 3.5% in 2009.
Throughout 2009, month-by-month trends were volatile but IATA data show an upturn from February 2009. Airlines in all three of the largest regions (Asia/Pacific, Europe and North America) experienced a 5-6 % decline in 2009 overall. Air passenger volumes grew 8.4% from the February low point to the end of 2009, with Asia/Pacific airlines contributing 35% of this growth. The Asia/Pacific region seems to have recovered better towards the end of the year with growth boosted by the economic recovery in the region, while European and North American airlines showed a much weaker recovery. Traffic in Europe and North America and between these two markets remained the core of the world air passenger transport business despite a decline of over 3% between November 2009 and November 2008 (IATA 2009).
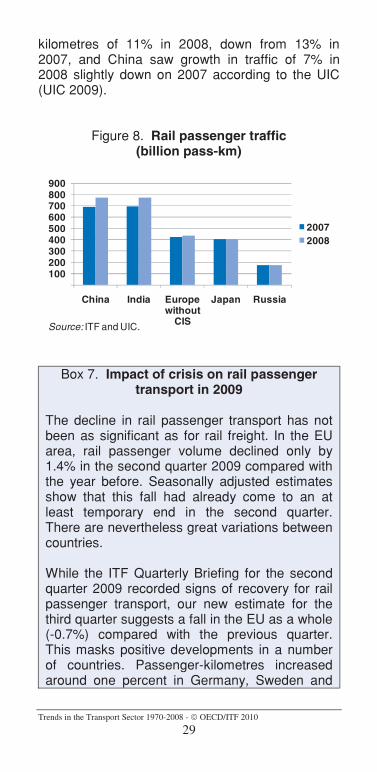
With the global crisis affecting most transport sectors, 2008 seems to have been a good year for rail passenger transport overall. In the EU, passenger-kilometres increased by more than 3.5% and rose by 13% in Austria, 9.7% in Spain, 7.3% in Finland and close to 6% in France. While provisional data showed that passenger-kilometres levelled off in Japan (-0.6%), they nevertheless increased by 8.7% in Canada, 6.8% in the United States and 6% in Australia. In both the OECD and the ITF overall, despite the economic climate of recession, rail passenger transport turned in a positive performance in 2008 (see Table B1 in section 5.2). India recorded growth in passenger-
Trends in the Transport Sector 1970-2008 - OECD/ITF 2010
29
kilometres of 11% in 2008, down from 13% in 2007, and China saw growth in traffic of 7% in 2008 slightly down on 2007 according to the UIC (UIC 2009).
Figure 8. Rail passenger traffic (billion pass-km)
100200300400500600700800900
China India Europe without
CIS
Japan Russia
20072008
Source: ITF and UIC.
Box 7. Impact of crisis on rail passenger transport in 2009
The decline in rail passenger transport has not been as significant as for rail freight. In the EU area, rail passenger volume declined only by 1.4% in the second quarter 2009 compared with the year before. Seasonally adjusted estimates show that this fall had already come to an at least temporary end in the second quarter. There are nevertheless great variations between countries.
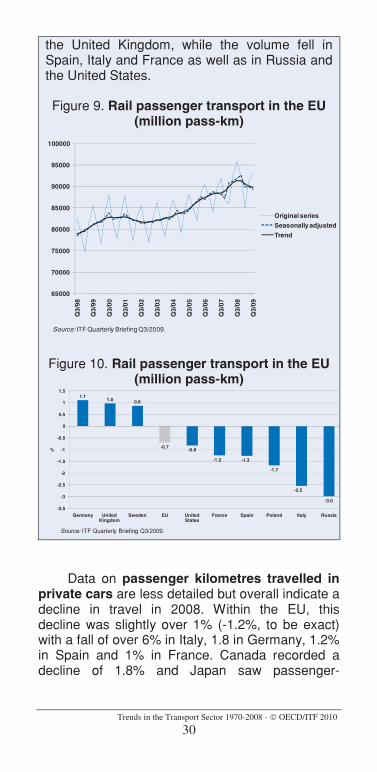
While the ITF Quarterly Briefing for the second quarter 2009 recorded signs of recovery for rail passenger transport, our new estimate for the third quarter suggests a fall in the EU as a whole (-0.7%) compared with the previous quarter. This masks positive developments in a number of countries. Passenger-kilometres increased around one percent in Germany, Sweden and
Trends in the Transport Sector 1970-2008 - OECD/ITF 2010
30
the United Kingdom, while the volume fell in Spain, Italy and France as well as in Russia and the United States.
Figure 9. Rail passenger transport in the EU (million pass-km)
65000
70000
75000
80000
85000
90000
95000
100000
Q3/
98
Q3/
99
Q3/
00
Q3/
01
Q3/
02
Q3/
03
Q3/
04
Q3/
05
Q3/
06
Q3/
07
Q3/
08
Q3/
09
Original series
Seasonally adjusted
Trend
Source: ITF Quarterly Briefing Q3/2009.
Figure 10. Rail passenger transport in the EU (million pass-km)
1.11.0 0.9
-0.7-0.8
-1.2 -1.3
-1.7
-2.5
-3.0
-3.5
-3
-2.5
-2
-1.5
-1
-0.5
0
0.5
1
1.5
Germany United Kingdom
Sweden EU United States
France Spain Poland Italy Russia
%
Source: ITF Quarterly Briefing Q3/2009.
Data on passenger kilometres travelled in private cars are less detailed but overall indicate a decline in travel in 2008. Within the EU, this decline was slightly over 1% (-1.2%, to be exact) with a fall of over 6% in Italy, 1.8 in Germany, 1.2% in Spain and 1% in France. Canada recorded a decline of 1.8% and Japan saw passenger-
Trends in the Transport Sector 1970-2008 - OECD/ITF 2010
31
kilometres fall by 0.7% (see Table B2 in section 5.2).
Passenger transport by bus and coachsaw a mix of trends: an appreciable decline in some of the new member states of the EU (-15.1% in the Slovak Republic, -2.8% in Slovenia and -2.1% in Poland) but increases in France (+3.2%) and Spain (+2.9%) as well as Italy (+0.9%). The overall figures for the EU are positive, showing a small increase in bus and coach transport of around 0.5%. It would seem that one of the outcomes of the economic crisis felt from the start of the third quarter of 2008 was that public passenger transport was less affected than transport by private car (see Table B3 in section 5.2).
3. THE ROAD SAFETY RECORD IN ITF COUNTRIES IN 2008
For the first time ever the number of people killed in road accidents fell below 150 000 in the ITF member countries in 2008 (excluding India)2.Road fatalities recorded the biggest decrease since 1990 with a drop of 8.9% in 2008 compared to 2007. During the same period, despite a drop of 5.7%, the number of injured in road accidents remains above 6 million. While 2008 figures represent a significant decline of the number of casualties from the previous year, they still show that road travel is taking a terrible toll. Within ITF countries, it compares to wiping out the entire
2 ITF data does not yet cover India which joined the organisation in 2009.
Trends in the Transport Sector 1970-2008 - OECD/ITF 2010
32
population of the city of Luxembourg, and sending all the residents of Lisbon to hospital.
Box 8. First indications on road safety in 2009
First indications concerning road fatality figures for 2009, from the ITF and IRTAD databases, reveal a continuing significant reduction in the number of road deaths for most countries. For example, improvement in Poland of 16%, Sweden 10% and Russia 9%. Lithuania recorded almost a 25% reduction and Greece a drop of 7%. Australia is one of the very few countries showing an increase (+4%) in road fatalities in 2009 when compared to the previous year.
Despite the degree of precaution required when dealing with provisional figures, the trend for 2009 seems to present results as favourable as 2008, at least where mortality figures are concerned. This would appear to be due in part to the moderating effects on road traffic growth of the economic crisis in all developed countries that started at the end of 2008 and continued until mid 2009 although the generally 1-3% declines in traffic in no way account for all of the 10% improvement in fatalities recorded on average for 2009 in the countries that have submitted data so far.
The overall picture for road safety for 2008 shows the largest improvement since 1990. In the European Union, the number of crashes fell by 5% in 2008. The total number of casualties (injured + killed) fell 5.5% and fatalities were 8% lower, the best results for all three indicators since 1974. These positive results can be credited to countries including Germany, Spain, the United Kingdom, Italy and France which recorded significant drops in their number of fatalities of 10, 19, 14, 8 and 7% respectively in 2008 compared to 2007. Romania
Trends in the Transport Sector 1970-2008 - OECD/ITF 2010
33
is one of the few countries that saw an increase in the number of road fatalities in 2008 with a 10% increase over 2007.
In the CIS, the three indicators also show large improvements in 2008, -8% for crashes, -9% for casualties and -11% for killed. These results mainly reflect the road safety trend in Russia which recorded drops of 7, 8 and 10% respectively during the same period. The weight of Russia affects strongly the overall trends for the region and hides divergences at the country level. In Moldova and Georgia, for example, the number of road fatalities increased by 8 and 18% respectively in 2008.
Many of the non-European ITF member countries also recorded significant improvements in road safety in 2008. The United States saw a strong improvement in all 3 indicators, -5% in injury accidents, -6% in casualties and -9% in fatalities, compared to 2007. Japan also recorded significant declines for those indicators with -8, -9 and -9% respectively. Although not as significant, New Zealand also reported an improvement of the 3 road safety indicators in 2008 compared to the previous year.
The figures given above describe trends in a few key indicators. However, the degree of risk on the roads in any given country cannot be assessed simply by looking at road fatality trends. The number of killed has to be related to both population and the number of motor vehicles in order to gain a clearer picture of the status of road safety. These indicators vary greatly from one country to another.
In Western European countries, deaths per million population ranged from 83 for Portugal to 36 for Malta with Greece and Belgium outliers with 138 and 100 road fatalities per million inhabitants respectively. In Central European countries deaths
Trends in the Transport Sector 1970-2008 - OECD/ITF 2010
34
per million population reach higher levels ranking from 150 for Croatia to 96 for Albania. Only FYROM with a ratio of 79 lies outside this range. In CIS countries deaths per million population remains relatively high, ranging from 211 for Russia to 121 for Azerbaijan. For non European countries the indicator varies across a wide range, from 123 for the United States to 47 for Japan.
Expressed in terms of the stock of motor vehicles, the number of fatalities per million motor vehicles must be used with caution as a result of uncertainties surrounding the estimation of the number of vehicles in service. Nevertheless, analysis reveals fairly divergent levels of road safety between Central and Western Europe. In Western Europe this indicator varied from 201 in Greece to 74 in Sweden in 2008, whereas in Central Europe, it ranged from 921 deaths per million motor vehicles in Albania to 169 in Slovenia. By way of comparison, in countries presenting sharply differing characteristics from Europe, the number of fatalities per million motor vehicles in 2008 was 293 in Korea but only 73 in Japan.
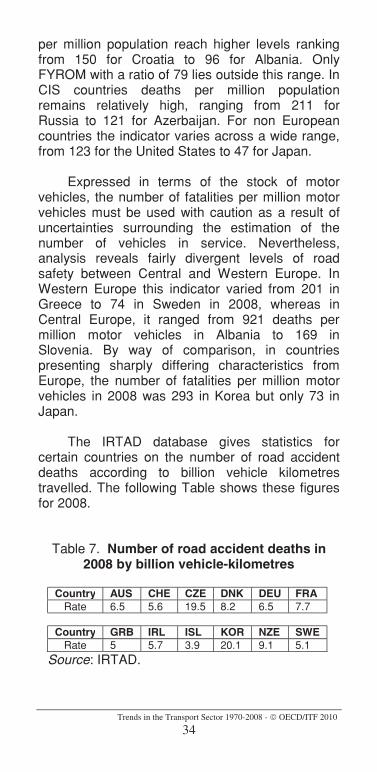
The IRTAD database gives statistics for certain countries on the number of road accident deaths according to billion vehicle kilometres travelled. The following Table shows these figures for 2008.
Table 7. Number of road accident deaths in 2008 by billion vehicle-kilometres
Country AUS CHE CZE DNK DEU FRARate 6.5 5.6 19.5 8.2 6.5 7.7
Country GRB IRL ISL KOR NZE SWERate 5 5.7 3.9 20.1 9.1 5.1
Source: IRTAD.
Trends in the Transport Sector 1970-2008 - OECD/ITF 2010
35
4. INVESTMENT AND MAINTENANCE IN INLAND TRANSPORT
INFRASTRUCTURE 1995-2008
4.1. Introduction to data
The International Transport Forum statistics on investment and maintenance expenditure on transport infrastructure for 1995-2008 are based on a survey sent to 51 member countries. The survey covers total gross investment (defined as new construction, extensions, reconstruction, renewal and major repair) in road, rail, inland waterways, maritime ports and airports, including all sources of financing, as well as maintenance expenditures financed by public administrations. Based on the responses received before 17th March 2010, data for 39 countries is analysed here.
The ITF has collected and published data on this topic since the late 1970s. Member countries supply data in current prices. In order to draw up a summary of aggregate trends data has been calculated in Euro values at both constant (2005) and current prices. In order to ensure comparability, relevant price indices are required. The Secretariat has devoted a significant amount of effort collecting relevant price indices in order to make calculations at constant prices. Where available, a cost index for land and water construction is used. Where these indices are not available, a manufacturing cost index or a GDP deflator is used.
Trends in the Transport Sector 1970-2008 - OECD/ITF 2010
36
Despite the relatively long time series, these data are often dogged by problems of definition and coverage, which make international comparisons difficult. Also there exists no purchasing power parity corrected general index for transport infrastructure investment. We therefore call for caution when comparing investment data between countries.
This summary covers only aggregate trends in inland transport infrastructure (road, rail, inland waterways). Detailed country data on other items (maritime ports and airports) together with more detailed data descriptions and a note on the methodology are available at http://www.internationaltransportforum.org/statistics/investment/invindex.html.
4.2. Trends in relation to GDP
The International Transport Forum data show that investment in inland transport infrastructures as a percentage of Gross Domestic Product (GDP) has declined steadily in Western Europe since the 1970s. Our first reports from the 1980s noted that the average share fell from 1.5% in 1975 to 1.2% in 1980 and further to 1.0% in 1982 after which it levelled off.
This investment level of 1% per GDP remained a norm for many years such that it became de facto political benchmark and recommendation for infrastructure investment, though with no theoretical or research basis behind it (ECMT Resolution no. 97/1). Obviously, the investment share of GDP dedicated to transport infrastructure depends on a number of factors, such as the quality and age of the existing infrastructure, geography of the country and transport-intensity of the country’s productive sector, etc.

Trends in the Transport Sector 1970-2008 - OECD/ITF 2010
37
Our most recent data show that investment in inland transport infrastructure as a percentage of GDP in the Western European countries (WECs)3,has continued to decline, 1.0% in 1995 and less than 0.8% per cent in 2007 and 2008, the lowest recorded level since our records began (Figure 11). The GDP share of inland transport investment in the WECs is apparently approaching that of the United States, where the share has remained relatively constant over time, at around 0.6–0.7% of GDP.
Data for Japan indicates some interesting differences to the analysis above. Historically, transport infrastructure investment has been relatively high in relation to GDP but has been in decline since the 1990s. The major source of funding for road investment in Japan has been earmarked gasoline and registration tax revenues for highway development and maintenance. It seems that the direct funding mechanism via earmarked tax revenues was partly responsible for the relatively high level of transport investment. However, since the end of the 1990s expenditure has been affected by general budget cuts, explaining the strong decline in investment relative to GDP. A decision has recently been made to modify the gasoline tax such that revenues go to the general budget, likely further affecting the level of investment in roads.
In the Central and Eastern European countries (CEECs)4 the share of investment in inland transport infrastructure, which until 2002 had remained stagnant at around 1% of GDP, has grown sharply, jumping to 1.9% in 2008 -- the highest figure ever reported by these countries. In
3 Belgium, Denmark, Finland, France, Germany, Iceland, Ireland, Luxembourg, Spain, Sweden, United Kingdom 4 Croatia, Czech Republic, Estonia, FYROM, Hungary, Latvia, Poland, Romania, Serbia, Slovakia and Slovenia.

Trends in the Transport Sector 1970-2008 - OECD/ITF 2010
38
the Russian Federation investment was 1.9% of GDP in 2000. Despite growth in investment volume, the share of inland transport infrastructure investment declined to 1.4% of GDP by 2003 because of the even stronger real growth in GDP. Data for 2008 shows renewed growth in investment, reaching 1.7% of GDP.
The rising levels of investment in the Central and Eastern European countries certainly reflect efforts to compensate for the earlier underinvestment in the road network capital stock, reinforced by the demands of growing economies. It is also clear that aid from the European Union as part of the accession process for most of these countries played a major part in this development.
Figure 11. Investment in inland transport infrastructure as a percentage of GDP
at current prices
0.0
0.5
1.0
1.5
2.0
2.5
3.0
3.5
Russian Federation
United States WECs CEECs Japan
%
1992 2000 2003 2008
Source: ITF Investment in Transport Infrastructure. Note: CEECs and WECs in Euros, current prices and exchange rates. Japan 2008 refers to 2007.
Trends in the Transport Sector 1970-2008 - OECD/ITF 2010
39
4.3. Volume of investment
In the Western European countries, the volume of investment grew by only around a half per cent from 1995 to 2000. This period of slow growth appeared to come to a halt in 2001 when investment in inland transport infrastructure increased by 18% in real terms through 2003. However, new data show that the level of investment has since declined. Investment in inland transport infrastructure fell by over 4% from 2003 to 2007 in real terms. The latest data show 2.5% growth from 2007 to 2008 but the volume of investment is still nearly 2% lower than in 2003.
The volume of inland infrastructure investment in the United States grew by 36 per cent from 1995 to 2001. However, data show a falling trend since 2001. Lack of comparable data from 2003 onwards has limited further analysis, but available data on investment in highways and local roads suggest a continuation of this trend until 2007. The latest data for highways and local roads shows 5% growth in 2008 in real terms, driven by the federal economic stimulus spending.
The volume of infrastructure investment has accelerated strongly in Central and Eastern European countries since 2003. This growth, reported also in our previous survey, has shown no signs of slowing down. Investment in inland transport infrastructure increased over 17% in real terms from 2007 to 2008 and the level is currently over 100% higher than the point at which growth began, in 2003.
Our data on the Russian Federation also show that the growth in the volume of inland infrastructure investment continued strongly in 2008, rising to a new peak in real terms. The volume of investment grew 33% from 2007 to 2008.
Trends in the Transport Sector 1970-2008 - OECD/ITF 2010
40
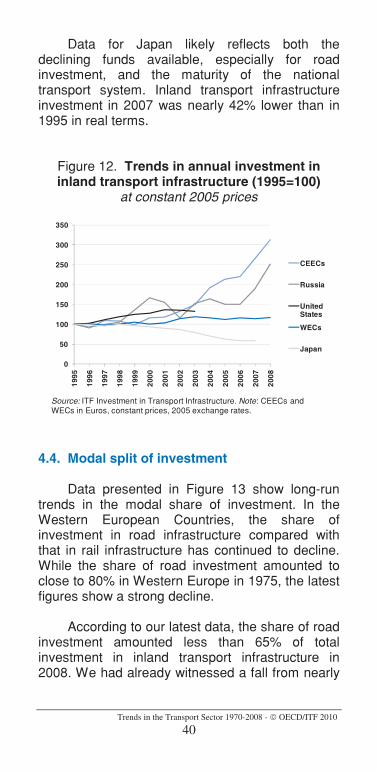
Data for Japan likely reflects both the declining funds available, especially for road investment, and the maturity of the national transport system. Inland transport infrastructure investment in 2007 was nearly 42% lower than in 1995 in real terms.
Figure 12. Trends in annual investment in inland transport infrastructure (1995=100)
at constant 2005 prices
0
50
100
150
200
250
300
350
1995
1996
1997
1998
1999
2000
2001
2002
2003
2004
2005
2006
2007
2008
CEECs
Russia
United States
WECs
Japan
Source: ITF Investment in Transport Infrastructure. Note: CEECs and WECs in Euros, constant prices, 2005 exchange rates.
4.4. Modal split of investment
Data presented in Figure 13 show long-run trends in the modal share of investment. In the Western European Countries, the share of investment in road infrastructure compared with that in rail infrastructure has continued to decline. While the share of road investment amounted to close to 80% in Western Europe in 1975, the latest figures show a strong decline.
According to our latest data, the share of road investment amounted less than 65% of total investment in inland transport infrastructure in 2008. We had already witnessed a fall from nearly

Trends in the Transport Sector 1970-2008 - OECD/ITF 2010
41
69% in 1995, to slightly below 67% in 2005. The last two years in particular show a sharp increase in rail share. For inland waterways there has been a slight decrease in recent years.
The trend observed in our data for the Western European Countries is certainly a reflection of the political commitment to the railways, and the recent data does not seem to indicate any change in this commitment, especially in the European Union.
Whereas Western European countries have increasingly directed their investment toward rail, Central and Eastern European countries are investing heavily in roads. While this trend was noted in our previous surveys, the last two years (2007 and 2008) seem to indicate a turn in the trend, with an increase in the modal share of rail investment in 2008. This is the second consecutive year with a significant increase. Rail investment, as a share of total investment in inland transport infrastructure, reached 17% in 2007 and 18% in 2008. The share had constantly fallen from over 35% at the end of the 1990s to only 13% in 2006 (Figure 14). While the volume of road investment has continued to grow strongly, the change in trend can be traced to the even stronger growth, in real terms, in the volume of rail investment in 2007 and 2008 – especially in Hungary, Poland and Romania.

Trends in the Transport Sector 1970-2008 - OECD/ITF 2010
42
Figure 13. Distribution of infrastructure investment between modes
Selected years, Western European countries Euros, current prices and exchange rates
68.5 68.1 66.9 64.8
29.5 29.9 31.5 33.4
2.0 2.0 1.7 1.8
0%
10%
20%
30%
40%
50%
60%
70%
80%
90%
100%
1995 2000 2005 2008
Source: ITF Investment in Transport Infrastructure.
Figure 14. Distribution of infrastructure investment between modes
Selected years, CEEC countries Euros, current prices and exchange rates
66.074.4
84.479.7
23.3
22.7
14.517.9
10.72.9 1.8 2.3
0%
10%
20%
30%
40%
50%
60%
70%
80%
90%
100%
1995 2000 2005 2008
IWW
Rail
Road
Source: ITF Investment in Transport Infrastructure.
Trends in the Transport Sector 1970-2008 - OECD/ITF 2010
43
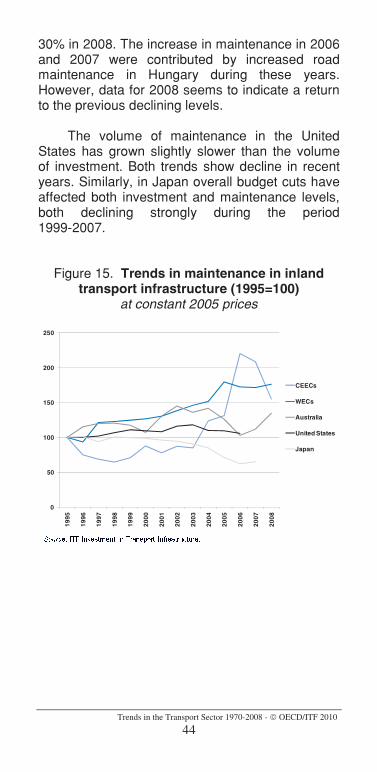
4.5. Trends in inland transport infrastructure maintenance
We observe marked differences in the level of investment between Western European Countries (roughly described as mature economies) and Central and Eastern European Countries (growing economies). In this section we examine differences in expenditure on infrastructure maintenance. If we assume that the decline in the share of investment in GDP reflects the fact that the main transport infrastructure is in place, we might expect that the volume of maintenance spending is increasing faster than investment in more mature economies.
We examine these differences mainly between WECs and CEECs. Lack of data on maintenance has resulted in a slightly different composition of countries included in the following analysis to that shown above.5
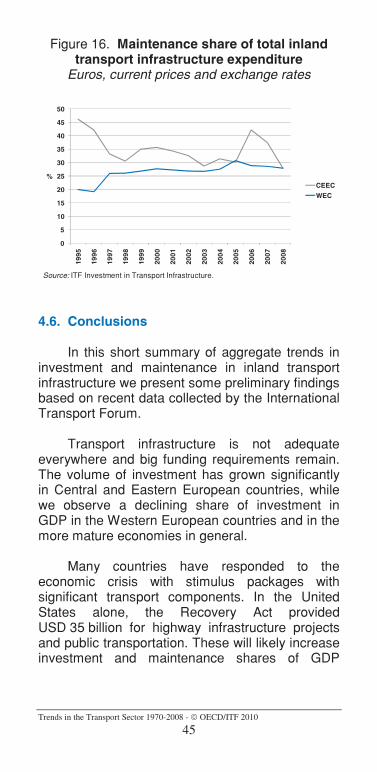
Despite data limitations, and notably uncertainty over the allocation of spending between maintenance and new build in some cases, our hypothesis seems to hold true for the WECs where the volume of maintenance on inland transport infrastructure has increased more rapidly than the volume of investment; the former grew by 76%, while the latter by around 35% from 1995 to 2008 (Figure 15). This has also resulted in an increased share of maintenance in total inland infrastructure expenditure (Figure 16).
In CEECs, the volume of maintenance has not increased quite as rapidly as investment and hence the share of maintenance on total expenditure fell from over 45% in 1995 to less than
5 For the comparison of investment and maintenance, WECs include Denmark, Finland, France, Iceland, Luxembourg, Sweden, and the United Kingdom. CEECs include Croatia, Czech Republic, FYROM, Hungary, Latvia, Poland, Serbia, Slovakia, and Slovenia.
Trends in the Transport Sector 1970-2008 - OECD/ITF 2010
44
30% in 2008. The increase in maintenance in 2006 and 2007 were contributed by increased road maintenance in Hungary during these years. However, data for 2008 seems to indicate a return to the previous declining levels.
The volume of maintenance in the United States has grown slightly slower than the volume of investment. Both trends show decline in recent years. Similarly, in Japan overall budget cuts have affected both investment and maintenance levels, both declining strongly during the period 1999-2007.
Figure 15. Trends in maintenance in inland transport infrastructure (1995=100)
at constant 2005 prices
0
50
100
150
200
250
1995
1996
1997
1998
1999
2000
2001
2002
2003
2004
2005
2006
2007
2008
CEECs
WECs
Australia
United States
Japan
Trends in the Transport Sector 1970-2008 - OECD/ITF 2010
45
Figure 16. Maintenance share of total inland transport infrastructure expenditure
Euros, current prices and exchange rates
0
5
10
15
20
25
30
35
40
45
50
1995
1996
1997
1998
1999
2000
2001
2002
2003
2004
2005
2006
2007
2008
%CEEC
WEC
Source: ITF Investment in Transport Infrastructure.
4.6. Conclusions
In this short summary of aggregate trends in investment and maintenance in inland transport infrastructure we present some preliminary findings based on recent data collected by the International Transport Forum.
Transport infrastructure is not adequate everywhere and big funding requirements remain. The volume of investment has grown significantly in Central and Eastern European countries, while we observe a declining share of investment in GDP in the Western European countries and in the more mature economies in general.
Many countries have responded to the economic crisis with stimulus packages with significant transport components. In the United States alone, the Recovery Act provided USD 35 billion for highway infrastructure projects and public transportation. These will likely increase investment and maintenance shares of GDP

Trends in the Transport Sector 1970-2008 - OECD/ITF 2010
46
temporarily and our future surveys will shed more light on this.
In the longer term, the economic crisis will likely result in scarcer funding. Hence, the declining long term trends we observe are likely to continue if no major change is introduced to the existing funding mechanisms. The case of Japan, for example, shows that earmarked revenues can have a major impact on the level of investment.
We also noted that, at least for Western European countries, 1% of GDP became an established norm and de facto policy recommendation for transport infrastructure investment. Whether this is a sufficient level of investment is still unclear. To answer this question, one would need data on capital stock, the quality of the existing stock and some idea of the related depreciation rates.
In the absence of that information, data on traffic volume and network length by service level can serve as a proxy to analyse case studies. On this basis it seems likely that expenditure across member countries, especially on road infrastructure (both new investment and maintenance) has not kept up with the growth in demand in recent years. In addition, where investments have been made they have tended to favour new construction over maintenance of existing infrastructure, resulting in chronic maintenance backlogs in many countries. Overall, road traffic has grown much faster than road capacity in many countries, resulting in congestion and increased costs in terms of travel time and delays. Capacity enhancements are also generally costly, time consuming and often politically difficult. Increasingly, countries are looking for alternative strategies, among them congestion pricing and innovative incident management.
Trends in the Transport Sector 1970-2008 - OECD/ITF 2010
47
5. STATISTICAL INFORMATION
5.1. Data sources, definitions and country notes
5.1.1. Data source
Unless otherwise specified the statistical information contained in this publication is provided to the International Transport Forum by national administrations (Transport Ministries, National Statistic Offices or official Transport Research Institutes) through a regular reporting procedure based on standard questionnaires. The data represent official national transport statistics.
5.1.2. Estimating missing data
To complete gaps or missing information in data series, the International Transport Forum applies estimating procedures whenever this is possible. Although these procedures are designed to ensure consistency they cannot provide entirely homogenous results between countries. They are primarily intended to fill in data gaps for the production of graphics to include as many countries as possible when calculating aggregates. All estimated data are marked with an “e”.
The method used for estimating missing information employs average growth rates calculated for groups of countries and applies this rate to extrapolate missing national data. Two groups of countries are identified:
Western Europe (21 countries): Austria, Belgium, Denmark, Finland, France, Germany, Greece, Iceland, Ireland, Italy, Liechtenstein, Luxembourg, Malta, Netherlands, Norway, Portugal, Spain,
Trends in the Transport Sector 1970-2008 - OECD/ITF 2010
48
Sweden, Switzerland, Turkey and the United Kingdom. Eastern Europe (15 countries): Albania, Bosnia-Herzegovina, Bulgaria, Croatia, Czech Republic, Estonia, FYROM, Hungary, Latvia, Lithuania, Poland, Romania, Serbia, Slovakia and Slovenia.
5.1.3. Definitions used
Unless otherwise specified all definitions and terms used in this publication are listed in the third edition of “Glossary for Transport Statistics” published jointly by Eurostat, the UNECE and the ITF. This Glossary can be consulted and download from our Web site at the following address: http://www.internationaltransportforum.org/Pub/pdf/09GloStat.pdf
As far as investment in transport infrastructure are concerned, data correspond to total gross investment (new construction, extension, reconstruction, renewal and major repair) including all sources of financing (private and public).
Maintenance expenditures refer to expenditures on routine maintenance undertaken to maintain the infrastructure in good condition. Data refers to spending financed by Public Administrations (State, regional and local authorities) and does not include expenditures financed by the private sector.
5.1.4. Quality control
Series are checked for their consistency and compared with national sources if need be. When discrepancies occur countries are requested to provide explanatory footnotes.
Trends in the Transport Sector 1970-2008 - OECD/ITF 2010
49
5.1.5. Country notes
Albania: Road infrastructure expenses do not include urban roads.
Australia: Since 1998 road injury accidents are not available. Since 2007 road casualties are not available. Investment expenditures for the construction of transport buildings are not available by mode of transport. Expenditures in airports (tarmac) are included in road investment data. Maintenance expenditure for railways, ports and airports are not currently available.
Austria: Since 2006 rail data include also foreign railway undertakings using the Austrian rail network. Since 1993 road P-km are no longer available. Road investment includes Federal Roads only and since 2002 they only include motorways.
Azerbaijan: Since 1995 goods transported by road include own account.
Belgium: Pipeline data are not available since 2001. Road infrastructure expenses do not include urban roads.
Bosnia: No data available on transport infrastructure expenses.
Bulgaria: Since 1995 data on passengers transported by private cars are not available. Since 2004 there is a new reporting system for inland waterways activities which creates a break in series. Road infrastructure expenses do not include urban roads.
Trends in the Transport Sector 1970-2008 - OECD/ITF 2010
50
Canada: Rail, road, inland waterways and pipelines freight data are not available prior to 1995, and refer to national activities only.
Croatia: Until 2002, inland transport data refers only to goods transported on national vessels performing inside and outside the national territory. Since 2003 data include all vessels performing on the national territory only. Since 1997, privately owned wagons are not included in rail transport of goods. Oil pipelines include gas pipelines. Buses and coaches data do not include urban transport. Private cars data is not available. Road infrastructure expenses do not include private spending and urban roads.
Czech Republic: Prior to 1993 data are included in Tchekoslovaquia (CSK). Road infrastructure expenses do not include urban roads.
Denmark: Private cars data include vans and taxis. Investments in the Great Belt Bridge and the Øresunds Bridge are not included. Road infrastructure expenses include urban roads, and rail investment includes the metro of Copenhagen.
Estonia: Inland waterways data is not available since 2000. Private cars data is not available.
Finland: Road infrastructure expenses do not include urban roads. Rail infrastructure expenses refer to states expenses only and includes urban and suburban rail. Airports infrastructure expenses refer to state only. Sea ports investment includes waterways to ports since 2001, and icebreaking since 2006
France: Goods transport by rail and road include transit. Goods transport by inland waterways includes transit since 1982 and sea vessels
Trends in the Transport Sector 1970-2008 - OECD/ITF 2010
51
until 1996. Road investment includes urban roads. Road maintenance refers to national roads only until 2004. Rail investment includes urban transport in the Ile-de-France region.
FYROM: Private cars data is not available. Road investment excludes urban roads.
Germany: Break in series in 1991 due to the reunification of Germany. Since 2005 rail investment includes Deutche Bahn AG only. Road investment includes urban road. No data available on infrastructure maintenance.
Greece: Data source: NSSG. Road freight and passenger transport are not available since 2000.
Hungary: Starting in 2001, Inland waterways transport includes foreign vessels. Oil pipelines include gas pipelines. Investment data refer to State investments only. Road investment includes urban roads since 1993.
Iceland: Road freight transport is not available.
Ireland: No data are available for road passenger transport. Road infrastructure expenses do not include urban roads.
Japan: Data refers to fiscal year (April 1st to March 31st). Bus and coaches data include taxis. Road infrastructure expenses include urban road and exclude private funding.
Latvia: Since 2006 oil pipeline transport does not include crude oil anymore only oil product. Private cars data is not available. Road infrastructure expenses do include urban roads since 2003.
Trends in the Transport Sector 1970-2008 - OECD/ITF 2010
52
Lithuania: Road investment includes urban roads since 1998.
Luxembourg: No data are available for road passenger transport.
Malta: Passenger road transport data are not available.
Mexico: T-km and P-km are derived from the vehicle park. In 1998 the highly subsidised rail passenger transport has been restructured resulting in a shift of passenger transport to the road sector. Until 2001 the number of road injury accidents includes property damage accidents. Private cars data is not available. Maintenance expenditures are available only for road and include private spending.
Moldova: Since 1992 data do not include enterprises from the left side of the river Nistru and Bender city.
New Zealand: Passenger road transport data are not available. Infrastructure expenditures are available only for road, they do not include local authorities but include urban roads.
Netherlands: Buses and coaches data are not available since 2000.
Norway: Road infrastructure expenses include urban roads. Road maintenance data include local authorities since 2002.
Poland: Since 2004 road goods transport includes national and international transport. Road infrastructure expenses include urban roads except for years 1996 to 1999.
Portugal: Private cars data are not available since 2000, and buses and coaches since 2004.
Trends in the Transport Sector 1970-2008 - OECD/ITF 2010
53
Road investment does not include urban roads.
Romania: The increase in road safety data in 1990 shows the end of traffic limitations due to petrol restrictions. Since 2008 passenger transport by bus and coaches counting methods has been changed. Private cars data is not available. Road infrastructure expenses do not include urban roads.
Russia: Private cars data are not available. Road fatalities include death within 7 days after the accident. Transport infrastructure maintenance costs are not available.
Serbia: Since 1997, road goods transport does not include own account and road passenger transport does not include private cars. Road infrastructure expenses include urban roads.
Slovakia: Prior to 1993 data are included in Tchekoslovaquia (CSK). Road infrastructure expenses partly include urban roads.
Slovenia: Road goods transport includes national transport only. Road infrastructure expenses include urban roads.
Spain: Transport infrastructure maintenance data are not available.
Sweden: Road infrastructure expenses include urban roads. Rail infrastructure expenses include trams and metro.
Turkey: No breakdown available for road passenger transport data. Road infrastructure expenses do not include urban roads.
United Kingdom: Investment data refer to fiscal years (April to March) and cover Great Britain
Trends in the Transport Sector 1970-2008 - OECD/ITF 2010
54
only. Road and rail investments include urban roads and railways. Since 2005 investment data in sea ports and airports are not collected anymore. Only maintenance data for road is available.
United States: Rail passenger transport includes only Amtrak (intercity passenger rail). Road infrastructure expenses include urban roads. Waterways infrastructure expenses include both inland and maritime water facilities.

Trends in the Transport Sector 1970-2008 - OECD/ITF 2010
55
List of country codes
ALB Albania AlbanieARM Armenia ArménieAUS Australia AustralieAUT Austria AutricheAZE Azerbaijan AzerbaïdjanBEL Belgium BelgiqueBGR Bulgaria BulgarieBIH Bosnia-Herzegovina Bosnie-HerzégovieBLR Belarus BélarusCND Canada CanadaCHE Switzerland SuisseCSK Tchekoslovaquia TchékoslovaquieCZE Czech Republic République tchèqueDEU Germany AllemagneDNK Denmark DanemarkESP Spain EspagneEST Estonia EstonieFIN Finland FinlandeFRA France FranceGBR United Kingdom Royaume-UniGEO Georgia GéorgieGRC Greece GrèceHRV Croatia CroatieHUN Hungary HongrieIRL Ireland IrlandeISL Iceland IslandeITA Italy ItalieJAP Japan JaponKOR Korea CoréeLIE Liechtenstein LiechtensteinLTU Lithuania LituanieLUX Luxembourg LuxembourgLVA Latvia LettonieMDA Moldova MoldavieMEX Mexico MexiqueMKD FYROM ERYMMLT Malta MalteMNE Montenegro MonténégroNLD Netherlands Pays-BasNOR Norway NorvègeNZL New Zealand Nouvelle-ZélandePOL Poland PolognePRT Portugal PortugalROM Romania RoumanieRUS Russia RussieSRB Serbia SerbieSVK Slovakia SlovaquieSVN Slovenia SlovénieSWE Sweden SuèdeTUR Turkey TurquieUKR Ukraine UkraineUSA United States États-Unis
Trends in the Transport Sector 1970-2008 - OECD/ITF 2010
56
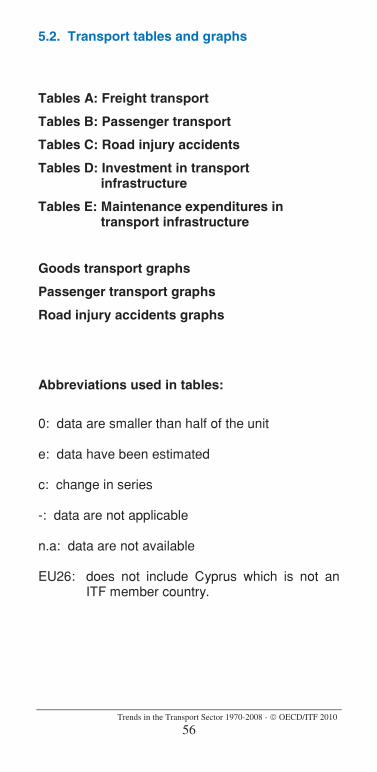
5.2. Transport tables and graphs
Tables A: Freight transport
Tables B: Passenger transport
Tables C: Road injury accidents
Tables D: Investment in transport infrastructure
Tables E: Maintenance expenditures in transport infrastructure
Goods transport graphs
Passenger transport graphs
Road injury accidents graphs
Abbreviations used in tables:
0: data are smaller than half of the unit
e: data have been estimated
c: change in series
-: data are not applicable
n.a: data are not available
EU26: does not include Cyprus which is not an ITF member country.

Trends in the Transport Sector 1970-2008 - OECD/ITF 2010
57
ALB 0.2 0.6 0.0 0.1 0.1 -1.9
ARM n.a. n.a. 0.4 0.8 n.a.
AUS 36.0 87.9 133.6 198.7 201.6 e 1.5
AUT 9.9 12.7 16.6 21.4 21.9 2.5
AZE 24.6 37.1 5.7 10.4 10.0 -3.4
BEL 7.8 8.4 7.7 8.1 8.5 3.9
BGR 13.9 14.1 5.5 5.2 4.7 -10.5
BIH 3.4 4.0 0.1 0.4 0.3 e -7.7
BLR 50.1 75.4 31.4 47.9 49.0 2.2
CAN n.a. n.a. 267.2 311.1 290.7 e -6.6
CHE 6.6 8.3 10.8 13.4 12.5 -6.4
CSK 55.9 59.5 - - -
CZE - - 17.5 16.3 15.4 -5.3
DEU 70.5 103.1 c 77.5 114.6 115.7 0.9
DNK 1.9 1.8 2.0 1.8 1.9 4.9
ESP 10.3 11.6 12.2 11.1 10.3 -7.5
EST 5.0 7.0 8.2 8.4 5.9 -29.5
FIN 6.3 8.4 10.1 10.4 10.8 3.3
FRA 67.6 49.7 55.4 40.5 35.7 -11.9
GBR 24.6 16.0 18.1 21.3 21.1 -0.9
GEO 9.8 10.8 3.9 6.9 6.5 -5.9
GRC 0.7 0.6 0.4 0.8 0.8 -5.9
HRV 5.7 6.5 1.8 3.6 3.3 -7.3
HUN 19.8 16.8 8.1 10.1 9.9 -2.6
IRL 0.5 0.6 0.5 0.1 0.1 -20.2
ISL - - - - -
ITA 18.1 21.2 25.8 25.3 23.8 -5.8
JPN 63.0 27.2 22.1 23.3 22.3 -4.6
KOR 0.0 13.7 10.8 10.9 11.6 5.8
LIE - - - - -
LTU 13.6 19.3 8.9 14.4 14.7 2.6
LUX 0.8 0.7 0.6 0.3 0.3 -2.4
LVA 15.5 18.5 13.3 18.3 19.6 6.9
MDA 10.4 14.8 1.5 3.1 2.9 -7.1
MEX 22.6 36.4 48.3 77.2 74.6 -3.4
MKD 0.6 0.8 0.5 0.8 0.7 -4.5
MLT - - - - -
MNE n.a. n.a. n.a. 0.2 e 0.2 e 1.6
NLD 3.7 3.1 4.5 7.2 7.0 e -2.4
NOR 1.4 1.6 1.8 2.5 2.7 8.6
NZL n.a. n.a. 4.1 n.a. n.a.
POL 99.3 83.5 54.0 54.3 52.0 -4.1
PRT 0.8 1.6 2.2 2.6 2.5 -1.4
ROM 48.0 57.3 18.0 15.8 15.2 -3.3
RUS 1 672.0 2 522.9 1 373.2 2 090.3 2 116.2 1.2
SRB 6.1 7.2 1.9 4.6 4.3 -4.6
SVK - - 11.2 9.6 9.3 -3.6
SVN 3.3 4.2 2.9 3.6 3.5 -2.3
SWE 10.0 10.4 12.4 15.7 16.0 1.9
TUR 6.1 8.0 9.9 9.9 10.7 8.2
UKR n.a. 474.0 172.8 262.5 257.0 -2.1
USA n.a. 1 509.6 2 140.3 2 584.9 2 593.1 e 0.3
EU (26) 507.6 529.9 393.7 437.3 426.7 -2.4
OECD 2 102.3 a 2 985.7 3 603.5 a 3 582.6 a -0.6
Total ITF 5 376.7 a 4 635.8 6 100.7 a 6 097.0 a -0.1 a: Non available data affects consistency of totals across years.
2008 08/07% change
FREIGHT TRANSPORTThousand million tonne-kilometers
Table A1 : Rail
1970 1990 2000 2007

Trends in the Transport Sector 1970-2008 - OECD/ITF 2010
58
ALB 0.8 1.2 2.2 3.6 4.1 14.3
ARM n.a. n.a. n.a. 0.7 e 1.0 e 45.7
AUS 24.4 81.6 132.3 177.5 e n.a.
AUT 2.9 9.0 17.2 18.6 18.2 -2.6
AZE 3.7 3.3 3.8 9.5 10.3 8.7
BEL 13.1 32.0 51.0 42.1 38.4 -8.9
BGR 7.0 13.8 3.1 c 5.9 7.1 20.9
BIH 0.8 3.1 0.3 e 0.5 e n.a.
BLR 8.1 22.4 9.7 19.2 22.8 18.6
CAN n.a. n.a. 84.7 133.0 n.a.
CHE 4.8 11.5 21.9 26.7 e 26.8 e 0.5
CSK 10.1 23.3 - - -
CZE - - 39.0 48.1 50.9 5.7
DEU 78.0 169.9 280.7 343.4 341.6 -0.6
DNK 7.8 9.4 11.0 11.8 10.7 -9.2
ESP 51.7 90.5 148.7 253.8 238.7 -6.0
EST 2.3 4.5 3.9 10.7 8.3 -22.3
FIN 12.4 25.4 27.7 26.0 27.6 6.4
FRA 66.3 114.8 184.2 207.0 195.5 -5.6
GBR 85.0 132.9 153.7 175.9 174.1 e -1.0
GEO n.a. 2.6 0.5 0.6 0.6 1.0
GRC 7.0 12.5 14.3 e 17.4 e 17.0 e -2.3
HRV 1.3 2.9 2.8 10.5 11.0 5.1
HUN 5.8 15.2 12.1 13.2 13.0 -1.2
IRL n.a. 5.1 12.3 19.1 19.0 e -1.0
ISL n.a. n.a. n.a. n.a. n.a.
ITA n.a. 177.9 158.6 192.2 e 189.8 e -1.3
JPN 135.9 274.2 313.1 354.8 352.0 -0.8
KOR n.a. n.a. n.a. 105.2 n.a.
LIE n.a. n.a. n.a. 0.3 0.3 -2.9
LTU 3.4 e 7.3 7.8 20.3 20.4 0.7
LUX 0.1 0.4 e 0.4 0.6 0.6 6.3
LVA 2.8 e 5.9 4.8 13.1 12.3 -6.1
MDA 3.2 6.3 1.0 2.7 3.0 8.1
MEX 42.9 108.9 194.1 222.4 227.3 2.2
MKD 0.8 2.2 0.8 5.9 4.0 -33.0
MLT n.a. n.a. n.a. n.a. n.a.
MNE n.a. n.a. n.a. n.a. n.a.
NLD 12.4 22.9 31.6 32.9 32.6 e -1.0
NOR 3.2 8.2 13.0 16.3 16.7 2.5
NZL n.a. n.a. 14.3 19.2 19.5 1.6
POL 15.8 40.3 75.0 159.5 174.2 9.2
PRT n.a. 10.9 15.0 18.4 16.8 -8.7
ROM 5.2 1 5.2 1 9.9 23.9 23.2 -3.1
RUS 116.4 299.4 152.7 205.8 216.3 5.1
SRB 3.5 8.6 0.6 1 1.2 1 1.1 1 -4.2
SVK - - 14.3 27.1 29.1 7.6
SVN 2.1 4.9 1.9 2.6 2.6 2.4
SWE 5.1 25.6 31.4 36.4 37.9 4.3
TUR 17.4 65.7 161.6 181.3 181.9 0.3
UKR n.a. 14.8 2.5 14.3 18.2 e 27.2
USA n.a. 1 239.2 1 741.5 1 922.9 n.a.
EU (26) 396.2 a 959.7 a 1 309.7 a 1 719.9 a 1 699.5 a -1.2
OECD 2 707.6 a 3 954.8 a 4 802.7 a
Total ITF 3 115.7 a 4 163.0 a 5 154.1 a
a: Non available data affects consistency of totals across years.1: Transport for ow n account not included
2008 08/07% change
FREIGHT TRANSPORTThousand million tonne-kilometers
Table A2 : Roads
1970 1990 2000 2007

Trends in the Transport Sector 1970-2008 - OECD/ITF 2010
59
ALB - - - - -
ARM - - - - -
AUS - - - - -
AUT 1.3 1.7 2.4 2.6 2.4 -9.2
AZE n.a. n.a. n.a. 6.0 6.1 1.1
BEL 6.7 5.4 7.3 9.0 8.7 -2.9
BGR 1.8 1.6 0.4 1.7 1.9 13.2
BIH - - - - -
BLR 1.2 1.8 0.0 0.1 0.1 41.9
CAN n.a. n.a. 25.4 29.4 n.a.
CHE 0.1 0.2 0.1 e 0.1 e n.a.
CSK 2.4 4.4 - - -
CZE - - 0.8 0.9 0.9 -3.9
DEU 48.8 54.8 66.5 64.7 64.1 -1.0
DNK - - - - -
ESP - - - - -
EST 0.0 0.0 0.0 0.0 0.0
FIN n.a. 0.1 0.1 0.1 0.1 0.0
FRA 12.7 7.6 9.1 8.8 8.6 -3.1
GBR 0.3 e 0.2 0.2 0.1 0.2 14.3
GEO - - - - -
GRC - - - - -
HRV 0.3 0.5 0.1 0.1 0.1 -27.5
HUN 1.8 2.0 0.9 2.2 2.3 1.7
IRL - - - - -
ISL - - - - -
ITA 0.4 0.1 0.2 0.1 n.a.
JPN - - - - -
KOR - - - - -
LIE - - - - -
LTU 0.1 0.2 0.0 0.0 0.0 18.2
LUX 0.3 0.3 0.4 0.3 0.4 6.1
LVA 0.1 0.3 n.a. n.a. n.a.
MDA 0.1 0.3 n.a. 0.0 0.0 0.0
MEX - - - - -
MKD - - - - -
MLT - - - - -
MNE - - - - -
NLD 30.7 35.7 41.3 41.9 46.0 9.9
NOR - - - - -
NZL - - - - -
POL 2.3 1.0 1.2 1.3 1.3 -4.8
PRT - - - - -
ROM 1.3 2.1 2.6 5.3 4.9 -7.5
RUS 163.9 213.9 71.0 86.0 63.7 -25.9
SRB 3.5 3.2 1.0 1.6 1.4 -13.6
SVK - - 1.4 1.0 1.1 9.7
SVN - - - - -
SWE - - - - -
TUR - - - - -
UKR n.a. 11.9 5.9 5.7 n.a.
USA 227.5 426.9 441.7 396.6 n.a.
EU (26) 111.1 117.5 134.7 140.2 142.7 1.8
OECD 335.4 a 540.4 a 598.9 559.2
Total ITF 507.7 a 776.3 a 679.9 665.8a: Non available data affects consistency of totals across years.
FREIGHT TRANSPORTThousand million tonne-kilometers
Table A3 : Inland waterways
1970 1990 2000 2007 2008 08/07% change
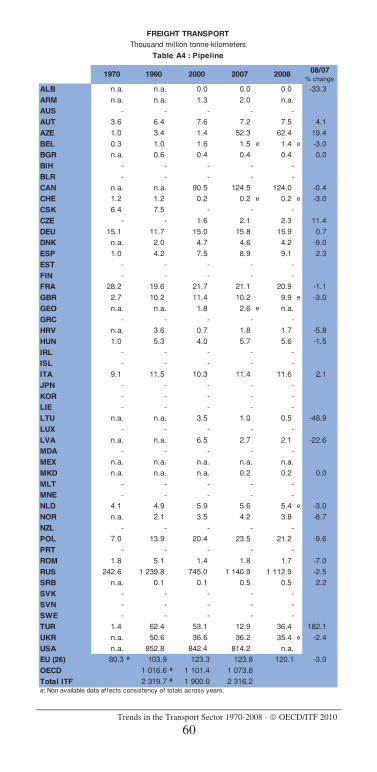
Trends in the Transport Sector 1970-2008 - OECD/ITF 2010
60
ALB n.a. n.a. 0.0 0.0 0.0 -33.3
ARM n.a. n.a. 1.3 2.0 n.a.
AUS - - - - -
AUT 3.6 6.4 7.6 7.2 7.5 4.1
AZE 1.0 3.4 1.4 52.3 62.4 19.4
BEL 0.3 1.0 1.6 1.5 e 1.4 e -3.0
BGR n.a. 0.6 0.4 0.4 0.4 0.0
BIH - - - - -
BLR - - - - -
CAN n.a. n.a. 90.5 124.5 124.0 -0.4
CHE 1.2 1.2 0.2 0.2 e 0.2 e -3.0
CSK 6.4 7.5 - - -
CZE - - 1.6 2.1 2.3 11.4
DEU 15.1 11.7 15.0 15.8 15.9 0.7
DNK n.a. 2.0 4.7 4.6 4.2 -9.0
ESP 1.0 4.2 7.5 8.9 9.1 2.3
EST - - - - -
FIN - - - - -
FRA 28.2 19.6 21.7 21.1 20.9 -1.1
GBR 2.7 10.2 11.4 10.2 9.9 e -3.0
GEO n.a. n.a. 1.8 2.6 e n.a.
GRC - - - - -
HRV n.a. 3.6 0.7 1.8 1.7 -5.8
HUN 1.0 5.3 4.0 5.7 5.6 -1.5
IRL - - - - -
ISL - - - - -
ITA 9.1 11.5 10.3 11.4 11.6 2.1
JPN - - - - -
KOR - - - - -
LIE - - - - -
LTU n.a. n.a. 3.5 1.0 0.5 -48.9
LUX - - - - -
LVA n.a. n.a. 6.5 2.7 2.1 -22.6
MDA - - - - -
MEX n.a. n.a. n.a. n.a. n.a.
MKD n.a. n.a. n.a. 0.2 0.2 0.0
MLT - - - - -
MNE - - - - -
NLD 4.1 4.9 5.9 5.6 5.4 e -3.0
NOR n.a. 2.1 3.5 4.2 3.8 -8.7
NZL - - - - -
POL 7.0 13.9 20.4 23.5 21.2 -9.6
PRT - - - - -
ROM 1.8 5.1 1.4 1.8 1.7 -7.0
RUS 242.6 1 239.8 745.0 1 140.9 1 112.9 -2.5
SRB n.a. 0.1 0.1 0.5 0.5 2.2
SVK - - - - -
SVN - - - - -
SWE - - - - -
TUR 1.4 62.4 53.1 12.9 36.4 182.1
UKR n.a. 50.6 36.6 36.2 35.4 e -2.4
USA n.a. 852.8 842.4 814.2 n.a.
EU (26) 80.3 a 103.9 123.3 123.8 120.1 -3.0
OECD 1 016.6 a 1 101.4 1 073.8
Total ITF 2 319.7 a 1 900.0 2 316.2a: Non available data affects consistency of totals across years.
2008 08/07% change
FREIGHT TRANSPORTThousand million tonne-kilometers
Table A4 : Pipeline
1970 1990 2000 2007

Trends in the Transport Sector 1970-2008 - OECD/ITF 2010
61
ALB 0.9 4 1.8 4 2.2 3.6 4.2 14.0
ARM n.a. n.a. 1.7 2 3.4 e 3.8 e 9.4
AUS 60.4 169.5 265.8 376.1 2 379.1 e 0.8
AUT 17.6 29.7 43.8 49.8 50.0 0.2
AZE 29.3 3 43.7 3 10.8 3 78.2 e 88.9 e 13.6
BEL 27.9 46.9 67.6 60.7 e 57.0 e -6.1
BGR 22.7 4 30.1 9.4 c 13.3 14.2 6.9
BIH 4.2 7.1 0.5 0.9 e 0.9 e -3.2
BLR 59.4 99.6 41.2 e 67.2 e 71.9 e 6.9
CAN n.a. n.a. 467.8 598.0 577.1 -3.5
CHE 12.8 21.2 33.1 e 40.4 e 39.7 e -1.8
CSK 74.8 94.7 - - -
CZE - - 58.9 67.4 69.5 3.1
DEU 212.4 339.5 c 439.7 538.6 537.2 -0.3
DNK 9.7 4 13.2 17.7 18.2 16.8 -7.8
ESP 63.1 106.4 168.4 273.8 258.1 -5.7
EST 7.4 11.5 12.1 19.1 14.2 -25.5
FIN 18.7 3 33.8 37.9 36.5 38.5 5.5
FRA 174.8 191.7 270.4 277.5 260.7 -6.1
GBR 112.5 e 159.3 183.4 207.5 205.3 e -1.1
GEO 9.8 4, 13.4 4 6.2 10.1 e 9.7 e -4.0
GRC 7.6 13.1 14.7 e 18.2 e 17.7 e -2.5
HRV 7.3 4 13.5 5.3 16.0 16.1 0.9
HUN 28.4 39.3 25.2 c 31.2 30.8 -1.5
IRL 0.5 2 5.7 12.8 19.3 19.1 e -1.1
ISL n.a. n.a. n.a. n.a. n.a.
ITA 27.5 2 210.7 194.9 229.0 e 225.3 e -1.6
JPN 198.9 301.4 335.3 378.1 374.2 -1.0
KOR n.a. 13.7 2 10.8 2 116.1 116.8 2 0.6
LIE n.a. n.a. n.a. 0.3 0.3 -2.9
LTU 17.1 4 26.8 4 20.1 35.7 35.7 0.0
LUX 1.2 1.4 e 1.5 1.2 1.3 4.2
LVA 18.3 4 24.7 4 24.6 3 34.2 3 34.0 3 -0.4
MDA 13.7 21.4 2.5 3 5.8 5.8 0.1
MEX 65.5 145.3 242.4 299.6 301.9 0.8
MKD 1.4 4 3.0 4 1.3 4 6.9 4.9 -29.0
MLT n.a. n.a. n.a. n.a. n.a.
MNE n.a. n.a. n.a. 0.2 e 0.2 e 1.6
NLD 50.9 66.5 83.2 e 87.5 e 91.0 e 4.0
NOR 4.6 4 11.9 18.3 23.0 23.2 e 1.1
NZL n.a. n.a. 18.4 23.1 1 23.4 1 1.3
POL 124.3 138.7 150.6 238.6 248.8 4.3
PRT 0.8 2 12.5 17.1 21.0 19.3 -7.8
ROM 56.4 69.6 31.9 46.9 45.1 -3.8
RUS 2 194.9 4 276.0 2 341.9 3 523.1 3 509.1 -0.4
SRB 13.1 4 19.1 3.6 7.7 7.3 -6.0
SVK - - 27.0 37.7 39.5 4.8
SVN 5.4 9.1 4.8 6.2 6.2 -0.3
SWE 15.1 36.1 43.8 52.1 53.9 3.6
TUR 25.0 136.2 224.6 204.2 229.1 12.2
UKR n.a. 551.3 217.8 318.7 316.2 3 -0.8
USA n.a. 4 028.4 5 165.9 5 718.6 n.a.
EU (26) 1 095.2 a 1 711.0 a 1 961.4 a 2 421.2 a 2 389.1 a -1.3
OECD 6 366.9 a 8 640.8 a 10 043.1 a
Total ITF 11 588.5 a 11 378.8 a 14 240.6 a
a: Non available data affects consistency of totals across years.1:Rail data not included 2:Road data not included 3:IWW data not included 4:pipeline data not included
2008 08/07% change
FREIGHT TRANSPORTThousand million tonne-kilometers
Table A5 : Total freight (A1+A2+A3+A4)
1970 1990 2000 2007
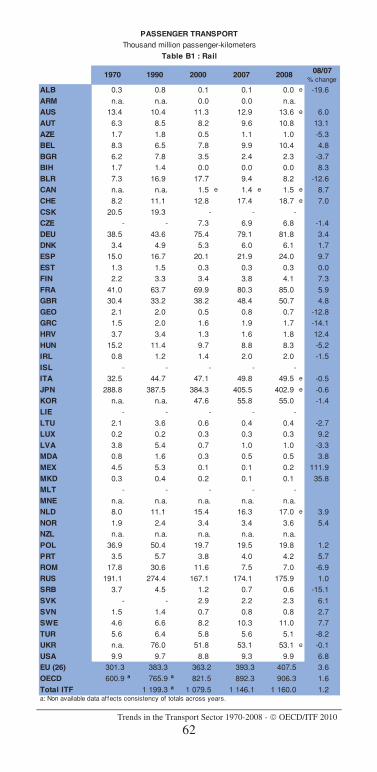
Trends in the Transport Sector 1970-2008 - OECD/ITF 2010
62
ALB 0.3 0.8 0.1 0.1 0.0 e -19.6
ARM n.a. n.a. 0.0 0.0 n.a.
AUS 13.4 10.4 11.3 12.9 13.6 e 6.0
AUT 6.3 8.5 8.2 9.6 10.8 13.1
AZE 1.7 1.8 0.5 1.1 1.0 -5.3
BEL 8.3 6.5 7.8 9.9 10.4 4.8
BGR 6.2 7.8 3.5 2.4 2.3 -3.7
BIH 1.7 1.4 0.0 0.0 0.0 8.3
BLR 7.3 16.9 17.7 9.4 8.2 -12.6
CAN n.a. n.a. 1.5 e 1.4 e 1.5 e 8.7
CHE 8.2 11.1 12.8 17.4 18.7 e 7.0
CSK 20.5 19.3 - - -
CZE - - 7.3 6.9 6.8 -1.4
DEU 38.5 43.6 75.4 79.1 81.8 3.4
DNK 3.4 4.9 5.3 6.0 6.1 1.7
ESP 15.0 16.7 20.1 21.9 24.0 9.7
EST 1.3 1.5 0.3 0.3 0.3 0.0
FIN 2.2 3.3 3.4 3.8 4.1 7.3
FRA 41.0 63.7 69.9 80.3 85.0 5.9
GBR 30.4 33.2 38.2 48.4 50.7 4.8
GEO 2.1 2.0 0.5 0.8 0.7 -12.8
GRC 1.5 2.0 1.6 1.9 1.7 -14.1
HRV 3.7 3.4 1.3 1.6 1.8 12.4
HUN 15.2 11.4 9.7 8.8 8.3 -5.2
IRL 0.8 1.2 1.4 2.0 2.0 -1.5
ISL - - - - -
ITA 32.5 44.7 47.1 49.8 49.5 e -0.5
JPN 288.8 387.5 384.3 405.5 402.9 e -0.6
KOR n.a. n.a. 47.6 55.8 55.0 -1.4
LIE - - - - -
LTU 2.1 3.6 0.6 0.4 0.4 -2.7
LUX 0.2 0.2 0.3 0.3 0.3 9.2
LVA 3.8 5.4 0.7 1.0 1.0 -3.3
MDA 0.8 1.6 0.3 0.5 0.5 3.8
MEX 4.5 5.3 0.1 0.1 0.2 111.9
MKD 0.3 0.4 0.2 0.1 0.1 35.8
MLT - - - - -
MNE n.a. n.a. n.a. n.a. n.a.
NLD 8.0 11.1 15.4 16.3 17.0 e 3.9
NOR 1.9 2.4 3.4 3.4 3.6 5.4
NZL n.a. n.a. n.a. n.a. n.a.
POL 36.9 50.4 19.7 19.5 19.8 1.2
PRT 3.5 5.7 3.8 4.0 4.2 5.7
ROM 17.8 30.6 11.6 7.5 7.0 -6.9
RUS 191.1 274.4 167.1 174.1 175.9 1.0
SRB 3.7 4.5 1.2 0.7 0.6 -15.1
SVK - - 2.9 2.2 2.3 6.1
SVN 1.5 1.4 0.7 0.8 0.8 2.7
SWE 4.6 6.6 8.2 10.3 11.0 7.7
TUR 5.6 6.4 5.8 5.6 5.1 -8.2
UKR n.a. 76.0 51.8 53.1 53.1 e -0.1
USA 9.9 9.7 8.8 9.3 9.9 6.8
EU (26) 301.3 383.3 363.2 393.3 407.5 3.6
OECD 600.9 a 765.9 a 821.5 892.3 906.3 1.6
Total ITF 1 199.3 a 1 079.5 1 146.1 1 160.0 1.2a: Non available data affects consistency of totals across years.
2008 08/07% change
PASSENGER TRANSPORTThousand million passenger-kilometers
Table B1 : Rail
1970 1990 2000 2007

Trends in the Transport Sector 1970-2008 - OECD/ITF 2010
63
ALB n.a. n.a. 5.1 6.4 5.6 -11.4
ARM n.a. n.a. 1.3 2.4 n.a.
AUS 100.2 200.7 240.5 263.2 n.a.
AUT 26.9 e 54.1 n.a. n.a. n.a.
AZE n.a. n.a. n.a. n.a. n.a.
BEL 49.3 80.7 106.1 112.1 110.9 -1.1
BGR n.a. 4.5 n.a. n.a. n.a.
BIH n.a. n.a. n.a. n.a. n.a.
BLR n.a. n.a. n.a. n.a. n.a.
CAN n.a. n.a. 472.0 488.0 479.0 -1.8
CHE 41.8 73.3 80.6 90.7 e 91.8 e 1.2
CSK n.a. n.a. - - -
CZE - - 63.9 71.5 72.4 1.2
DEU 350.6 593.2 831.3 868.0 852.3 -1.8
DNK n.a. 53.0 57.8 63.9 63.9 e 0.1
ESP 64.3 174.4 280.0 343.3 339.1 -1.2
EST n.a. n.a. n.a. n.a. n.a.
FIN 23.7 51.2 55.7 63.8 63.4 -0.6
FRA 305.0 586.0 699.6 727.8 720.2 -1.0
GBR 283.0 588.0 639.7 685.0 679.0 -0.9
GEO n.a. n.a. n.a. n.a. n.a.
GRC n.a. 19.1 34.5 36.3 35.9 e -1.2
HRV n.a. n.a. n.a. n.a. n.a.
HUN 7.3 47.0 46.2 41.4 42.0 1.4
IRL n.a. n.a. n.a. n.a. n.a.
ISL n.a. 2.7 3.8 5.1 4.9 -2.6
ITA 211.9 522.6 726.5 768.3 719.6 -6.3
JPN 182.7 760.1 869.7 836.0 829.7 -0.7
KOR n.a. n.a. n.a. n.a. n.a.
LIE n.a. n.a. n.a. n.a. n.a.
LTU n.a. n.a. n.a. 39.1 38.0 -2.9
LUX n.a. n.a. n.a. n.a. n.a.
LVA n.a. n.a. n.a. n.a. n.a.
MDA n.a. n.a. n.a. n.a. n.a.
MEX n.a. n.a. n.a. n.a. n.a.
MKD n.a. n.a. n.a. n.a. n.a.
MLT n.a. n.a. n.a. n.a. n.a.
MNE n.a. n.a. n.a. n.a. n.a.
NLD 66.3 137.3 141.1 148.8 147.0 e -1.2
NOR 17.8 42.7 46.8 53.1 52.5 e -1.2
NZL n.a. n.a. n.a. n.a. n.a.
POL n.a. 68.1 149.7 239.3 273.5 14.3
PRT 13.8 40.5 82.4 e 86.8 e 85.8 e -1.2
ROM n.a. n.a. n.a. n.a. n.a.
RUS n.a. n.a. n.a. n.a. n.a.
SRB 3.8 16.0 n.a. n.a. n.a.
SVK - - 23.9 26.0 26.4 1.5
SVN n.a. 13.3 20.3 24.4 24.9 2.1
SWE 56.1 85.9 91.9 99.3 98.4 -0.9
TUR n.a. n.a. n.a. n.a. n.a.
UKR n.a. n.a. n.a. n.a. n.a.
USA 2 817.8 3 671.5 4 094.9 4 248.9 n.a.
EU (26) 1 458.2 a 3 119.1 a 4 050.7 a 4 445.2 a 4 392.8 a -1.2
OECD 4 618.5 a 7 852.2 a 9 838.6 a 10 366.7 a
Total ITF 4 622.3 a 7 886.0 a 9 865.3 a 10 439.0 a
a: Non available data affects consistency of totals across years.
2008 08/07% change
PASSENGER TRANSPORTThousand million passenger-kilometers
Table B2 : Private cars
1970 1990 2000 2007
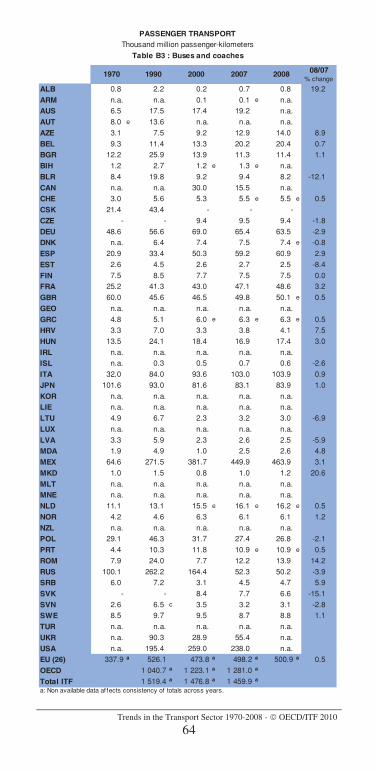
Trends in the Transport Sector 1970-2008 - OECD/ITF 2010
64
ALB 0.8 2.2 0.2 0.7 0.8 19.2
ARM n.a. n.a. 0.1 0.1 e n.a.
AUS 6.5 17.5 17.4 19.2 n.a.
AUT 8.0 e 13.6 n.a. n.a. n.a.
AZE 3.1 7.5 9.2 12.9 14.0 8.9
BEL 9.3 11.4 13.3 20.2 20.4 0.7
BGR 12.2 25.9 13.9 11.3 11.4 1.1
BIH 1.2 2.7 1.2 e 1.3 e n.a.
BLR 8.4 19.8 9.2 9.4 8.2 -12.1
CAN n.a. n.a. 30.0 15.5 n.a.
CHE 3.0 5.6 5.3 5.5 e 5.5 e 0.5
CSK 21.4 43.4 - - -
CZE - - 9.4 9.5 9.4 -1.8
DEU 48.6 56.6 69.0 65.4 63.5 -2.9
DNK n.a. 6.4 7.4 7.5 7.4 e -0.8
ESP 20.9 33.4 50.3 59.2 60.9 2.9
EST 2.6 4.5 2.6 2.7 2.5 -8.4
FIN 7.5 8.5 7.7 7.5 7.5 0.0
FRA 25.2 41.3 43.0 47.1 48.6 3.2
GBR 60.0 45.6 46.5 49.8 50.1 e 0.5
GEO n.a. n.a. n.a. n.a. n.a.
GRC 4.8 5.1 6.0 e 6.3 e 6.3 e 0.5
HRV 3.3 7.0 3.3 3.8 4.1 7.5
HUN 13.5 24.1 18.4 16.9 17.4 3.0
IRL n.a. n.a. n.a. n.a. n.a.
ISL n.a. 0.3 0.5 0.7 0.6 -2.6
ITA 32.0 84.0 93.6 103.0 103.9 0.9
JPN 101.6 93.0 81.6 83.1 83.9 1.0
KOR n.a. n.a. n.a. n.a. n.a.
LIE n.a. n.a. n.a. n.a. n.a.
LTU 4.9 6.7 2.3 3.2 3.0 -6.9
LUX n.a. n.a. n.a. n.a. n.a.
LVA 3.3 5.9 2.3 2.6 2.5 -5.9
MDA 1.9 4.9 1.0 2.5 2.6 4.8
MEX 64.6 271.5 381.7 449.9 463.9 3.1
MKD 1.0 1.5 0.8 1.0 1.2 20.6
MLT n.a. n.a. n.a. n.a. n.a.
MNE n.a. n.a. n.a. n.a. n.a.
NLD 11.1 13.1 15.5 e 16.1 e 16.2 e 0.5
NOR 4.2 4.6 6.3 6.1 6.1 1.2
NZL n.a. n.a. n.a. n.a. n.a.
POL 29.1 46.3 31.7 27.4 26.8 -2.1
PRT 4.4 10.3 11.8 10.9 e 10.9 e 0.5
ROM 7.9 24.0 7.7 12.2 13.9 14.2
RUS 100.1 262.2 164.4 52.3 50.2 -3.9
SRB 6.0 7.2 3.1 4.5 4.7 5.9
SVK - - 8.4 7.7 6.6 -15.1
SVN 2.6 6.5 c 3.5 3.2 3.1 -2.8
SWE 8.5 9.7 9.5 8.7 8.8 1.1
TUR n.a. n.a. n.a. n.a. n.a.
UKR n.a. 90.3 28.9 55.4 n.a.
USA n.a. 195.4 259.0 238.0 n.a.
EU (26) 337.9 a 526.1 473.8 a 498.2 a 500.9 a 0.5
OECD 1 040.7 a 1 223.1 a 1 281.0 a
Total ITF 1 519.4 a 1 476.8 a 1 459.9 a
a: Non available data affects consistency of totals across years.
2008 08/07% change
PASSENGER TRANSPORTThousand million passenger-kilometers
Table B3 : Buses and coaches
1970 1990 2000 2007
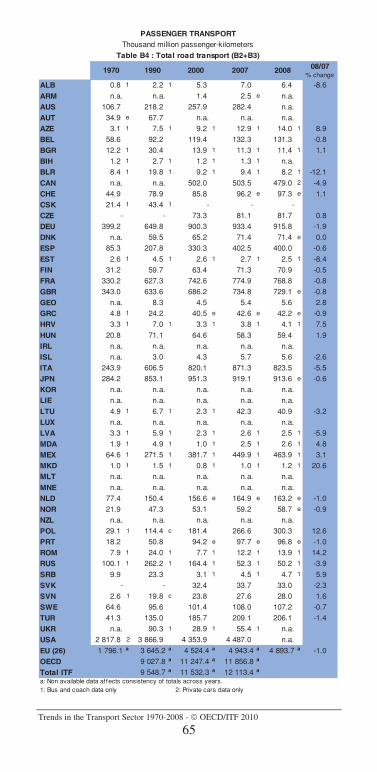
Trends in the Transport Sector 1970-2008 - OECD/ITF 2010
65
ALB 0.8 1 2.2 1 5.3 7.0 6.4 -8.6
ARM n.a. n.a. 1.4 2.5 e n.a.
AUS 106.7 218.2 257.9 282.4 n.a.
AUT 34.9 e 67.7 n.a. n.a. n.a.
AZE 3.1 1 7.5 1 9.2 1 12.9 1 14.0 1 8.9
BEL 58.6 92.2 119.4 132.3 131.3 -0.8
BGR 12.2 1 30.4 13.9 1 11.3 1 11.4 1 1.1
BIH 1.2 1 2.7 1 1.2 1 1.3 1 n.a.
BLR 8.4 1 19.8 1 9.2 1 9.4 1 8.2 1 -12.1
CAN n.a. n.a. 502.0 503.5 479.0 2 -4.9
CHE 44.9 78.9 85.8 96.2 e 97.3 e 1.1
CSK 21.4 1 43.4 1 - - -
CZE - - 73.3 81.1 81.7 0.8
DEU 399.2 649.8 900.3 933.4 915.8 -1.9
DNK n.a. 59.5 65.2 71.4 71.4 e 0.0
ESP 85.3 207.8 330.3 402.5 400.0 -0.6
EST 2.6 1 4.5 1 2.6 1 2.7 1 2.5 1 -8.4
FIN 31.2 59.7 63.4 71.3 70.9 -0.5
FRA 330.2 627.3 742.6 774.9 768.8 -0.8
GBR 343.0 633.6 686.2 734.8 729.1 e -0.8
GEO n.a. 8.3 4.5 5.4 5.6 2.8
GRC 4.8 1 24.2 40.5 e 42.6 e 42.2 e -0.9
HRV 3.3 1 7.0 1 3.3 1 3.8 1 4.1 1 7.5
HUN 20.8 71.1 64.6 58.3 59.4 1.9
IRL n.a. n.a. n.a. n.a. n.a.
ISL n.a. 3.0 4.3 5.7 5.6 -2.6
ITA 243.9 606.5 820.1 871.3 823.5 -5.5
JPN 284.2 853.1 951.3 919.1 913.6 e -0.6
KOR n.a. n.a. n.a. n.a. n.a.
LIE n.a. n.a. n.a. n.a. n.a.
LTU 4.9 1 6.7 1 2.3 1 42.3 40.9 -3.2
LUX n.a. n.a. n.a. n.a. n.a.
LVA 3.3 1 5.9 1 2.3 1 2.6 1 2.5 1 -5.9
MDA 1.9 1 4.9 1 1.0 1 2.5 1 2.6 1 4.8
MEX 64.6 1 271.5 1 381.7 1 449.9 1 463.9 1 3.1
MKD 1.0 1 1.5 1 0.8 1 1.0 1 1.2 1 20.6
MLT n.a. n.a. n.a. n.a. n.a.
MNE n.a. n.a. n.a. n.a. n.a.
NLD 77.4 150.4 156.6 e 164.9 e 163.2 e -1.0
NOR 21.9 47.3 53.1 59.2 58.7 e -0.9
NZL n.a. n.a. n.a. n.a. n.a.
POL 29.1 1 114.4 c 181.4 266.6 300.3 12.6
PRT 18.2 50.8 94.2 e 97.7 e 96.8 e -1.0
ROM 7.9 1 24.0 1 7.7 1 12.2 1 13.9 1 14.2
RUS 100.1 1 262.2 1 164.4 1 52.3 1 50.2 1 -3.9
SRB 9.9 23.3 3.1 1 4.5 1 4.7 1 5.9
SVK - - 32.4 33.7 33.0 -2.3
SVN 2.6 1 19.8 c 23.8 27.6 28.0 1.6
SWE 64.6 95.6 101.4 108.0 107.2 -0.7
TUR 41.3 135.0 185.7 209.1 206.1 -1.4
UKR n.a. 90.3 1 28.9 1 55.4 1 n.a.
USA 2 817.8 2 3 866.9 4 353.9 4 487.0 n.a.
EU (26) 1 796.1 a 3 645.2 a 4 524.4 a 4 943.4 a 4 893.7 a -1.0
OECD 9 027.8 a 11 247.4 a 11 856.8 a
Total ITF 9 548.7 a 11 532.3 a 12 113.4 a
a: Non available data affects consistency of totals across years.1: Bus and coach data only 2: Private cars data only
2008 08/07% change
PASSENGER TRANSPORTThousand million passenger-kilometers
Table B4 : Total road transport (B2+B3)
1970 1990 2000 2007
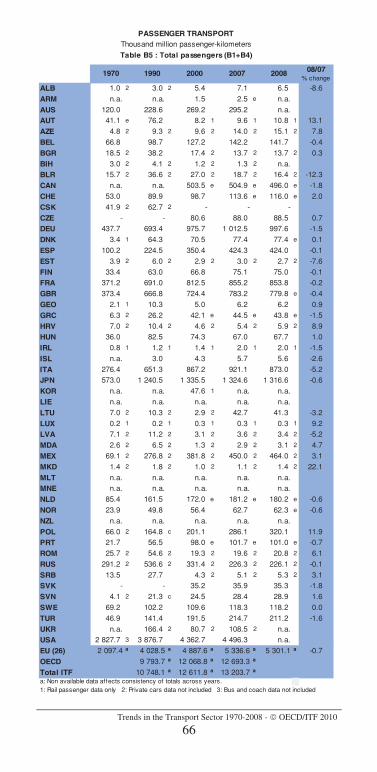
Trends in the Transport Sector 1970-2008 - OECD/ITF 2010
66
ALB 1.0 2 3.0 2 5.4 7.1 6.5 -8.6
ARM n.a. n.a. 1.5 2.5 e n.a.
AUS 120.0 228.6 269.2 295.2 n.a.
AUT 41.1 e 76.2 8.2 1 9.6 1 10.8 1 13.1
AZE 4.8 2 9.3 2 9.6 2 14.0 2 15.1 2 7.8
BEL 66.8 98.7 127.2 142.2 141.7 -0.4
BGR 18.5 2 38.2 17.4 2 13.7 2 13.7 2 0.3
BIH 3.0 2 4.1 2 1.2 2 1.3 2 n.a.
BLR 15.7 2 36.6 2 27.0 2 18.7 2 16.4 2 -12.3
CAN n.a. n.a. 503.5 e 504.9 e 496.0 e -1.8
CHE 53.0 89.9 98.7 113.6 e 116.0 e 2.0
CSK 41.9 2 62.7 2 - - -
CZE - - 80.6 88.0 88.5 0.7
DEU 437.7 693.4 975.7 1 012.5 997.6 -1.5
DNK 3.4 1 64.3 70.5 77.4 77.4 e 0.1
ESP 100.2 224.5 350.4 424.3 424.0 -0.1
EST 3.9 2 6.0 2 2.9 2 3.0 2 2.7 2 -7.6
FIN 33.4 63.0 66.8 75.1 75.0 -0.1
FRA 371.2 691.0 812.5 855.2 853.8 -0.2
GBR 373.4 666.8 724.4 783.2 779.8 e -0.4
GEO 2.1 1 10.3 5.0 6.2 6.2 0.9
GRC 6.3 2 26.2 42.1 e 44.5 e 43.8 e -1.5
HRV 7.0 2 10.4 2 4.6 2 5.4 2 5.9 2 8.9
HUN 36.0 82.5 74.3 67.0 67.7 1.0
IRL 0.8 1 1.2 1 1.4 1 2.0 1 2.0 1 -1.5
ISL n.a. 3.0 4.3 5.7 5.6 -2.6
ITA 276.4 651.3 867.2 921.1 873.0 -5.2
JPN 573.0 1 240.5 1 335.5 1 324.6 1 316.6 -0.6
KOR n.a. n.a. 47.6 1 n.a. n.a.
LIE n.a. n.a. n.a. n.a. n.a.
LTU 7.0 2 10.3 2 2.9 2 42.7 41.3 -3.2
LUX 0.2 1 0.2 1 0.3 1 0.3 1 0.3 1 9.2
LVA 7.1 2 11.2 2 3.1 2 3.6 2 3.4 2 -5.2
MDA 2.6 2 6.5 2 1.3 2 2.9 2 3.1 2 4.7
MEX 69.1 2 276.8 2 381.8 2 450.0 2 464.0 2 3.1
MKD 1.4 2 1.8 2 1.0 2 1.1 2 1.4 2 22.1
MLT n.a. n.a. n.a. n.a. n.a.
MNE n.a. n.a. n.a. n.a. n.a.
NLD 85.4 161.5 172.0 e 181.2 e 180.2 e -0.6
NOR 23.9 49.8 56.4 62.7 62.3 e -0.6
NZL n.a. n.a. n.a. n.a. n.a.
POL 66.0 2 164.8 c 201.1 286.1 320.1 11.9
PRT 21.7 56.5 98.0 e 101.7 e 101.0 e -0.7
ROM 25.7 2 54.6 2 19.3 2 19.6 2 20.8 2 6.1
RUS 291.2 2 536.6 2 331.4 2 226.3 2 226.1 2 -0.1
SRB 13.5 27.7 4.3 2 5.1 2 5.3 2 3.1
SVK - - 35.2 35.9 35.3 -1.8
SVN 4.1 2 21.3 c 24.5 28.4 28.9 1.6
SWE 69.2 102.2 109.6 118.3 118.2 0.0
TUR 46.9 141.4 191.5 214.7 211.2 -1.6
UKR n.a. 166.4 2 80.7 2 108.5 2 n.a.
USA 2 827.7 3 3 876.7 4 362.7 4 496.3 n.a.
EU (26) 2 097.4 a 4 028.5 a 4 887.6 a 5 336.6 a 5 301.1 a -0.7
OECD 9 793.7 a 12 068.8 a 12 693.3 a
Total ITF 10 748.1 a 12 611.8 a 13 203.7 a
a: Non available data affects consistency of totals across years.1: Rail passenger data only 2: Private cars data not included 3: Bus and coach data not included
2008 08/07% change
PASSENGER TRANSPORTThousand million passenger-kilometers
Table B5 : Total passengers (B1+B4)
1970 1990 2000 2007
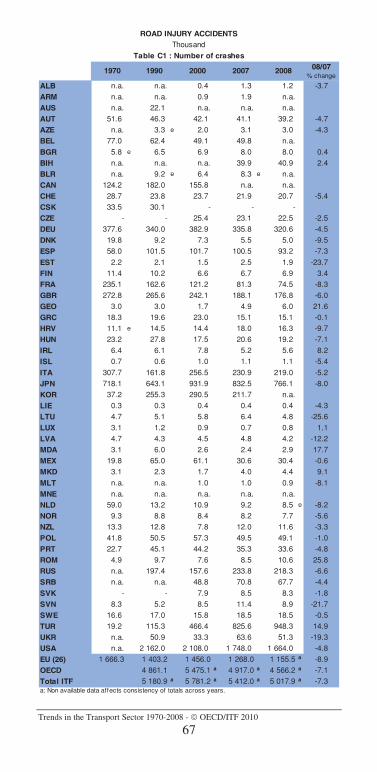
Trends in the Transport Sector 1970-2008 - OECD/ITF 2010
67
ALB n.a. n.a. 0.4 1.3 1.2 -3.7
ARM n.a. n.a. 0.9 1.9 n.a.
AUS n.a. 22.1 n.a. n.a. n.a.
AUT 51.6 46.3 42.1 41.1 39.2 -4.7
AZE n.a. 3.3 e 2.0 3.1 3.0 -4.3
BEL 77.0 62.4 49.1 49.8 n.a.
BGR 5.8 e 6.5 6.9 8.0 8.0 0.4
BIH n.a. n.a. n.a. 39.9 40.9 2.4
BLR n.a. 9.2 e 6.4 8.3 e n.a.
CAN 124.2 182.0 155.8 n.a. n.a.
CHE 28.7 23.8 23.7 21.9 20.7 -5.4
CSK 33.5 30.1 - - -
CZE - - 25.4 23.1 22.5 -2.5
DEU 377.6 340.0 382.9 335.8 320.6 -4.5
DNK 19.8 9.2 7.3 5.5 5.0 -9.5
ESP 58.0 101.5 101.7 100.5 93.2 -7.3
EST 2.2 2.1 1.5 2.5 1.9 -23.7
FIN 11.4 10.2 6.6 6.7 6.9 3.4
FRA 235.1 162.6 121.2 81.3 74.5 -8.3
GBR 272.8 265.6 242.1 188.1 176.8 -6.0
GEO 3.0 3.0 1.7 4.9 6.0 21.6
GRC 18.3 19.6 23.0 15.1 15.1 -0.1
HRV 11.1 e 14.5 14.4 18.0 16.3 -9.7
HUN 23.2 27.8 17.5 20.6 19.2 -7.1
IRL 6.4 6.1 7.8 5.2 5.6 8.2
ISL 0.7 0.6 1.0 1.1 1.1 -5.4
ITA 307.7 161.8 256.5 230.9 219.0 -5.2
JPN 718.1 643.1 931.9 832.5 766.1 -8.0
KOR 37.2 255.3 290.5 211.7 n.a.
LIE 0.3 0.3 0.4 0.4 0.4 -4.3
LTU 4.7 5.1 5.8 6.4 4.8 -25.6
LUX 3.1 1.2 0.9 0.7 0.8 1.1
LVA 4.7 4.3 4.5 4.8 4.2 -12.2
MDA 3.1 6.0 2.6 2.4 2.9 17.7
MEX 19.8 65.0 61.1 30.6 30.4 -0.6
MKD 3.1 2.3 1.7 4.0 4.4 9.1
MLT n.a. n.a. 1.0 1.0 0.9 -8.1
MNE n.a. n.a. n.a. n.a. n.a.
NLD 59.0 13.2 10.9 9.2 8.5 e -8.2
NOR 9.3 8.8 8.4 8.2 7.7 -5.6
NZL 13.3 12.8 7.8 12.0 11.6 -3.3
POL 41.8 50.5 57.3 49.5 49.1 -1.0
PRT 22.7 45.1 44.2 35.3 33.6 -4.8
ROM 4.9 9.7 7.6 8.5 10.6 25.8
RUS n.a. 197.4 157.6 233.8 218.3 -6.6
SRB n.a. n.a. 48.8 70.8 67.7 -4.4
SVK - - 7.9 8.5 8.3 -1.8
SVN 8.3 5.2 8.5 11.4 8.9 -21.7
SWE 16.6 17.0 15.8 18.5 18.5 -0.5
TUR 19.2 115.3 466.4 825.6 948.3 14.9
UKR n.a. 50.9 33.3 63.6 51.3 -19.3
USA n.a. 2 162.0 2 108.0 1 748.0 1 664.0 -4.8
EU (26) 1 666.3 1 403.2 1 456.0 1 268.0 1 155.5 a -8.9
OECD 4 861.1 5 475.1 a 4 917.0 a 4 566.2 a -7.1
Total ITF 5 180.9 a 5 781.2 a 5 412.0 a 5 017.9 a -7.3 a: Non available data affects consistency of totals across years.
2008 08/07% change
ROAD INJURY ACCIDENTSThousand
Table C1 : Number of crashes
1970 1990 2000 2007
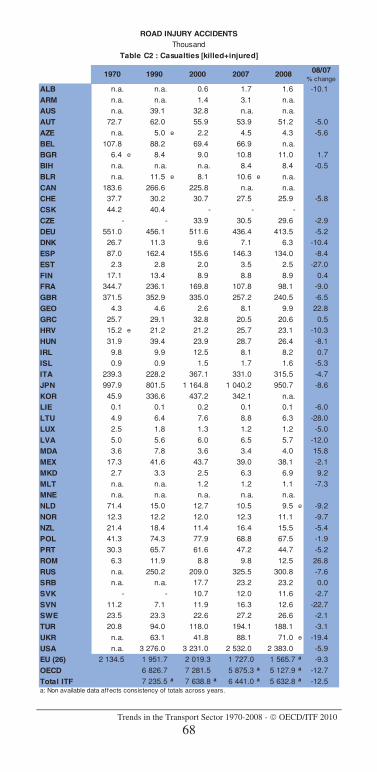
Trends in the Transport Sector 1970-2008 - OECD/ITF 2010
68
ALB n.a. n.a. 0.6 1.7 1.6 -10.1
ARM n.a. n.a. 1.4 3.1 n.a.
AUS n.a. 39.1 32.8 n.a. n.a.
AUT 72.7 62.0 55.9 53.9 51.2 -5.0
AZE n.a. 5.0 e 2.2 4.5 4.3 -5.6
BEL 107.8 88.2 69.4 66.9 n.a.
BGR 6.4 e 8.4 9.0 10.8 11.0 1.7
BIH n.a. n.a. n.a. 8.4 8.4 -0.5
BLR n.a. 11.5 e 8.1 10.6 e n.a.
CAN 183.6 266.6 225.8 n.a. n.a.
CHE 37.7 30.2 30.7 27.5 25.9 -5.8
CSK 44.2 40.4 - - -
CZE - - 33.9 30.5 29.6 -2.9
DEU 551.0 456.1 511.6 436.4 413.5 -5.2
DNK 26.7 11.3 9.6 7.1 6.3 -10.4
ESP 87.0 162.4 155.6 146.3 134.0 -8.4
EST 2.3 2.8 2.0 3.5 2.5 -27.0
FIN 17.1 13.4 8.9 8.8 8.9 0.4
FRA 344.7 236.1 169.8 107.8 98.1 -9.0
GBR 371.5 352.9 335.0 257.2 240.5 -6.5
GEO 4.3 4.6 2.6 8.1 9.9 22.8
GRC 25.7 29.1 32.8 20.5 20.6 0.5
HRV 15.2 e 21.2 21.2 25.7 23.1 -10.3
HUN 31.9 39.4 23.9 28.7 26.4 -8.1
IRL 9.8 9.9 12.5 8.1 8.2 0.7
ISL 0.9 0.9 1.5 1.7 1.6 -5.3
ITA 239.3 228.2 367.1 331.0 315.5 -4.7
JPN 997.9 801.5 1 164.8 1 040.2 950.7 -8.6
KOR 45.9 336.6 437.2 342.1 n.a.
LIE 0.1 0.1 0.2 0.1 0.1 -6.0
LTU 4.9 6.4 7.6 8.8 6.3 -28.0
LUX 2.5 1.8 1.3 1.2 1.2 -5.0
LVA 5.0 5.6 6.0 6.5 5.7 -12.0
MDA 3.6 7.8 3.6 3.4 4.0 15.8
MEX 17.3 41.6 43.7 39.0 38.1 -2.1
MKD 2.7 3.3 2.5 6.3 6.9 9.2
MLT n.a. n.a. 1.2 1.2 1.1 -7.3
MNE n.a. n.a. n.a. n.a. n.a.
NLD 71.4 15.0 12.7 10.5 9.5 e -9.2
NOR 12.3 12.2 12.0 12.3 11.1 -9.7
NZL 21.4 18.4 11.4 16.4 15.5 -5.4
POL 41.3 74.3 77.9 68.8 67.5 -1.9
PRT 30.3 65.7 61.6 47.2 44.7 -5.2
ROM 6.3 11.9 8.8 9.8 12.5 26.8
RUS n.a. 250.2 209.0 325.5 300.8 -7.6
SRB n.a. n.a. 17.7 23.2 23.2 0.0
SVK - - 10.7 12.0 11.6 -2.7
SVN 11.2 7.1 11.9 16.3 12.6 -22.7
SWE 23.5 23.3 22.6 27.2 26.6 -2.1
TUR 20.8 94.0 118.0 194.1 188.1 -3.1
UKR n.a. 63.1 41.8 88.1 71.0 e -19.4
USA n.a. 3 276.0 3 231.0 2 532.0 2 383.0 -5.9
EU (26) 2 134.5 1 951.7 2 019.3 1 727.0 1 565.7 a -9.3
OECD 6 826.7 7 281.5 5 875.3 a 5 127.9 a -12.7
Total ITF 7 235.5 a 7 638.8 a 6 441.0 a 5 632.8 a -12.5 a: Non available data affects consistency of totals across years.
2008 08/07% change
ROAD INJURY ACCIDENTSThousand
Table C2 : Casualties [killed+injured]
1970 1990 2000 2007
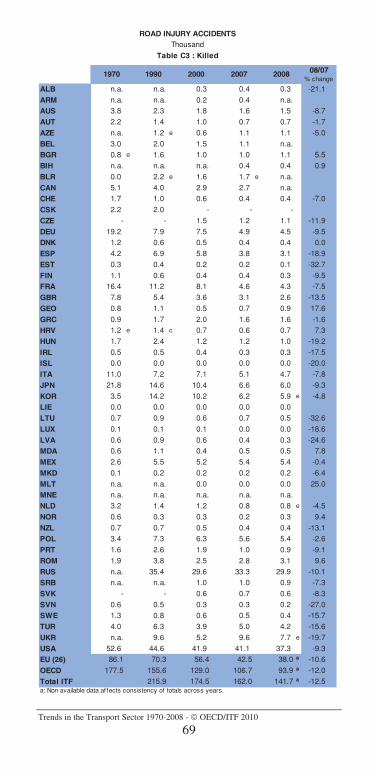
Trends in the Transport Sector 1970-2008 - OECD/ITF 2010
69
ALB n.a. n.a. 0.3 0.4 0.3 -21.1
ARM n.a. n.a. 0.2 0.4 n.a.
AUS 3.8 2.3 1.8 1.6 1.5 -8.7
AUT 2.2 1.4 1.0 0.7 0.7 -1.7
AZE n.a. 1.2 e 0.6 1.1 1.1 -5.0
BEL 3.0 2.0 1.5 1.1 n.a.
BGR 0.8 e 1.6 1.0 1.0 1.1 5.5
BIH n.a. n.a. n.a. 0.4 0.4 0.9
BLR 0.0 2.2 e 1.6 1.7 e n.a.
CAN 5.1 4.0 2.9 2.7 n.a.
CHE 1.7 1.0 0.6 0.4 0.4 -7.0
CSK 2.2 2.0 - - -
CZE - - 1.5 1.2 1.1 -11.9
DEU 19.2 7.9 7.5 4.9 4.5 -9.5
DNK 1.2 0.6 0.5 0.4 0.4 0.0
ESP 4.2 6.9 5.8 3.8 3.1 -18.9
EST 0.3 0.4 0.2 0.2 0.1 -32.7
FIN 1.1 0.6 0.4 0.4 0.3 -9.5
FRA 16.4 11.2 8.1 4.6 4.3 -7.5
GBR 7.8 5.4 3.6 3.1 2.6 -13.5
GEO 0.8 1.1 0.5 0.7 0.9 17.6
GRC 0.9 1.7 2.0 1.6 1.6 -1.6
HRV 1.2 e 1.4 c 0.7 0.6 0.7 7.3
HUN 1.7 2.4 1.2 1.2 1.0 -19.2
IRL 0.5 0.5 0.4 0.3 0.3 -17.5
ISL 0.0 0.0 0.0 0.0 0.0 -20.0
ITA 11.0 7.2 7.1 5.1 4.7 -7.8
JPN 21.8 14.6 10.4 6.6 6.0 -9.3
KOR 3.5 14.2 10.2 6.2 5.9 e -4.8
LIE 0.0 0.0 0.0 0.0 0.0
LTU 0.7 0.9 0.6 0.7 0.5 -32.6
LUX 0.1 0.1 0.1 0.0 0.0 -18.6
LVA 0.6 0.9 0.6 0.4 0.3 -24.6
MDA 0.6 1.1 0.4 0.5 0.5 7.8
MEX 2.6 5.5 5.2 5.4 5.4 -0.4
MKD 0.1 0.2 0.2 0.2 0.2 -6.4
MLT n.a. n.a. 0.0 0.0 0.0 25.0
MNE n.a. n.a. n.a. n.a. n.a.
NLD 3.2 1.4 1.2 0.8 0.8 e -4.5
NOR 0.6 0.3 0.3 0.2 0.3 9.4
NZL 0.7 0.7 0.5 0.4 0.4 -13.1
POL 3.4 7.3 6.3 5.6 5.4 -2.6
PRT 1.6 2.6 1.9 1.0 0.9 -9.1
ROM 1.9 3.8 2.5 2.8 3.1 9.6
RUS n.a. 35.4 29.6 33.3 29.9 -10.1
SRB n.a. n.a. 1.0 1.0 0.9 -7.3
SVK - - 0.6 0.7 0.6 -8.3
SVN 0.6 0.5 0.3 0.3 0.2 -27.0
SWE 1.3 0.8 0.6 0.5 0.4 -15.7
TUR 4.0 6.3 3.9 5.0 4.2 -15.6
UKR n.a. 9.6 5.2 9.6 7.7 e -19.7
USA 52.6 44.6 41.9 41.1 37.3 -9.3
EU (26) 86.1 70.3 56.4 42.5 38.0 a -10.6
OECD 177.5 155.6 129.0 106.7 93.9 a -12.0
Total ITF 215.9 174.5 162.0 141.7 a -12.5 a: Non available data affects consistency of totals across years.
2008 08/07% change
ROAD INJURY ACCIDENTSThousand
Table C3 : Killed
1970 1990 2000 2007
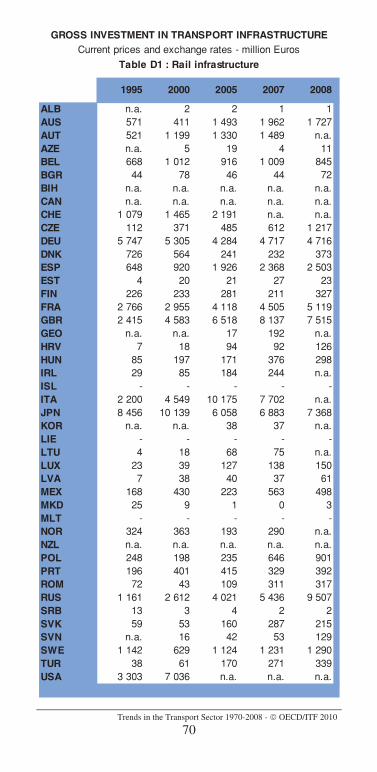
Trends in the Transport Sector 1970-2008 - OECD/ITF 2010
70
1995 2000 2005 2007 2008
ALB n.a. 2 2 1 1AUS 571 411 1 493 1 962 1 727AUT 521 1 199 1 330 1 489 n.a.AZE n.a. 5 19 4 11BEL 668 1 012 916 1 009 845BGR 44 78 46 44 72BIH n.a. n.a. n.a. n.a. n.a.CAN n.a. n.a. n.a. n.a. n.a.CHE 1 079 1 465 2 191 n.a. n.a.CZE 112 371 485 612 1 217DEU 5 747 5 305 4 284 4 717 4 716DNK 726 564 241 232 373ESP 648 920 1 926 2 368 2 503EST 4 20 21 27 23FIN 226 233 281 211 327FRA 2 766 2 955 4 118 4 505 5 119GBR 2 415 4 583 6 518 8 137 7 515GEO n.a. n.a. 17 192 n.a.HRV 7 18 94 92 126HUN 85 197 171 376 298IRL 29 85 184 244 n.a.ISL - - - - -ITA 2 200 4 549 10 175 7 702 n.a.JPN 8 456 10 139 6 058 6 883 7 368KOR n.a. n.a. 38 37 n.a.LIE - - - - -LTU 4 18 68 75 n.a.LUX 23 39 127 138 150LVA 7 38 40 37 61MEX 168 430 223 563 498MKD 25 9 1 0 3MLT - - - - -NOR 324 363 193 290 n.a.NZL n.a. n.a. n.a. n.a. n.a.POL 248 198 235 646 901PRT 196 401 415 329 392ROM 72 43 109 311 317RUS 1 161 2 612 4 021 5 436 9 507SRB 13 3 4 2 2SVK 59 53 160 287 215SVN n.a. 16 42 53 129SWE 1 142 629 1 124 1 231 1 290TUR 38 61 170 271 339USA 3 303 7 036 n.a. n.a. n.a.
GROSS INVESTMENT IN TRANSPORT INFRASTRUCTURECurrent prices and exchange rates - million Euros
Table D1 : Rail infrastructure
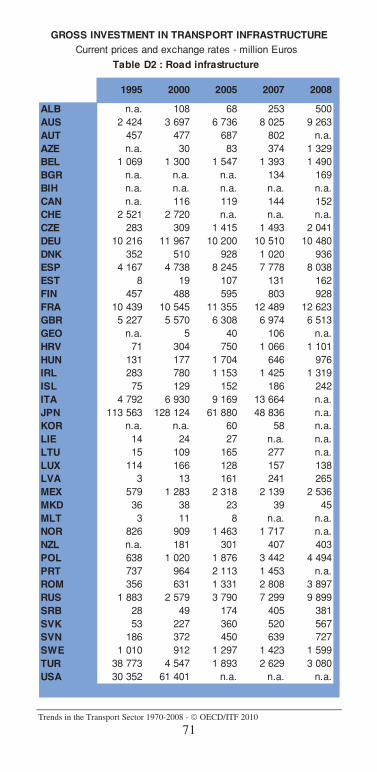
Trends in the Transport Sector 1970-2008 - OECD/ITF 2010
71
1995 2000 2005 2007 2008
ALB n.a. 108 68 253 500AUS 2 424 3 697 6 736 8 025 9 263AUT 457 477 687 802 n.a.AZE n.a. 30 83 374 1 329BEL 1 069 1 300 1 547 1 393 1 490BGR n.a. n.a. n.a. 134 169BIH n.a. n.a. n.a. n.a. n.a.CAN n.a. 116 119 144 152CHE 2 521 2 720 n.a. n.a. n.a.CZE 283 309 1 415 1 493 2 041DEU 10 216 11 967 10 200 10 510 10 480DNK 352 510 928 1 020 936ESP 4 167 4 738 8 245 7 778 8 038EST 8 19 107 131 162FIN 457 488 595 803 928FRA 10 439 10 545 11 355 12 489 12 623GBR 5 227 5 570 6 308 6 974 6 513GEO n.a. 5 40 106 n.a.HRV 71 304 750 1 066 1 101HUN 131 177 1 704 646 976IRL 283 780 1 153 1 425 1 319ISL 75 129 152 186 242ITA 4 792 6 930 9 169 13 664 n.a.JPN 113 563 128 124 61 880 48 836 n.a.KOR n.a. n.a. 60 58 n.a.LIE 14 24 27 n.a. n.a.LTU 15 109 165 277 n.a.LUX 114 166 128 157 138LVA 3 13 161 241 265MEX 579 1 283 2 318 2 139 2 536MKD 36 38 23 39 45MLT 3 11 8 n.a. n.a.NOR 826 909 1 463 1 717 n.a.NZL n.a. 181 301 407 403POL 638 1 020 1 876 3 442 4 494PRT 737 964 2 113 1 453 n.a.ROM 356 631 1 331 2 808 3 897RUS 1 883 2 579 3 790 7 299 9 899SRB 28 49 174 405 381SVK 53 227 360 520 567SVN 186 372 450 639 727SWE 1 010 912 1 297 1 423 1 599TUR 38 773 4 547 1 893 2 629 3 080USA 30 352 61 401 n.a. n.a. n.a.
Current prices and exchange rates - million Euros
Table D2 : Road infrastructure
GROSS INVESTMENT IN TRANSPORT INFRASTRUCTURE

Trends in the Transport Sector 1970-2008 - OECD/ITF 2010
72
1995 2000 2005 2007 2008
ALB n.a. 0 0 0 0AUS - - - - -AUT 3 0 6 6 n.a.AZE n.a. n.a. n.a. n.a. n.a.BEL 151 152 156 178 188BGR n.a. n.a. 85 405 n.a.BIH n.a. n.a. n.a. n.a. n.a.CAN n.a. n.a. n.a. n.a. n.a.CHE 8 17 0 n.a. n.a.CZE 1 11 10 14 22DEU 711 828 790 820 925DNK - - - - -ESP - - - - -EST - - - - -FIN 2 0 1 5 2FRA 107 114 108 168 141GBR n.a. n.a. n.a. n.a. n.a.GEO - - - - -HRV n.a. 2 2 2 2HUN 1 0 2 4 n.a.IRL - - - - -ISL - - - - -ITA 10 30 53 29 n.a.JPN - - - - -KOR - - - - -LIE - - - - -LTU 1 0 0 3 n.a.LUX 0 1 0 0 0LVA - - - - -MEX - - - - -MKD - - - - -MLT - - - - -NOR - - - - -NZL - - - - -POL 10 0 7 13 21PRT 1 1 20 12 7ROM 244 105 140 359 348RUS 73 48 73 58 102SRB 12 4 15 24 38SVK 21 1 1 0 1SVN - - - - -SWE - - - - -TUR - - - - -USA 1 177 4 436 n.a. n.a. n.a.
GROSS INVESTMENT IN TRANSPORT INFRASTRUCTURECurrent prices and exchange rates - million Euros
Table D3 : Inland warterways infrastructure

Trends in the Transport Sector 1970-2008 - OECD/ITF 2010
73
1995 2000 2005 2007 2008
ALB n.a. 6 11 1 3AUS 60 96 577 702 1 057AUT - - - - -AZE - - - - -BEL 152 186 189 171 171BGR n.a. n.a. 5 46 7BIH n.a. n.a. n.a. n.a. n.a.CAN n.a. 68 65 75 71CHE - - - - -CZE - - - - -DEU 506 562 570 640 630DNK 61 57 67 67 n.a.ESP 383 498 1 012 1 257 1 524EST 19 18 22 54 36FIN 41 59 136 223 238FRA 235 197 283 226 410GBR 199 337 336 n.a. n.a.GEO n.a. n.a. 0 1 n.a.HRV 1 7 17 17 52HUN - - - - -IRL 30 n.a. n.a. n.a. n.a.ISL 18 20 23 37 23ITA 208 231 2 062 1 179 n.a.JPN n.a. n.a. 3 208 2 506 2 851KOR n.a. n.a. 21 23 n.a.LIE - - - - -LTU 6 13 30 26 n.a.LUX - - - - -LVA n.a. n.a. 62 149 262MEX 133 315 565 438 579MKD - - - - -MLT n.a. n.a. n.a. n.a. n.a.NOR 68 123 116 141 n.a.NZL n.a. n.a. n.a. n.a. n.a.POL 30 11 9 17 30PRT 62 93 44 157 128ROM 6 n.a. n.a. n.a. n.a.RUS 146 243 279 197 413SRB n.a. n.a. n.a. n.a. n.a.SVK - - - - -SVN 0 2 2 7 10SWE n.a. n.a. 37 81 n.a.TUR 19 37 53 67 7USA n.a. n.a. n.a. n.a. n.a.
GROSS INVESTMENT IN TRANSPORT INFRASTRUCTURECurrent prices and exchange rates - million Euros
Table D4 : Sea ports infrastructure
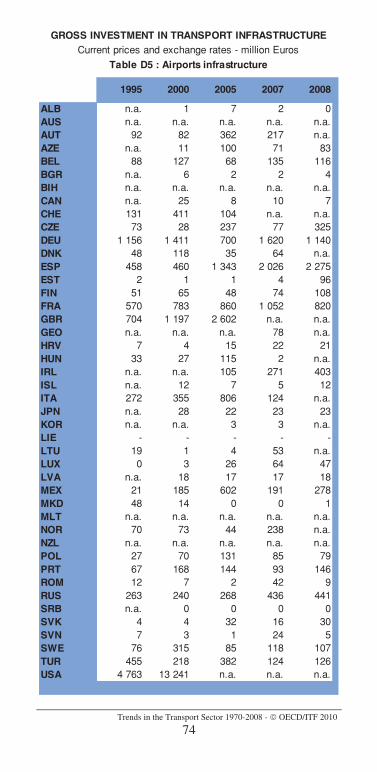
Trends in the Transport Sector 1970-2008 - OECD/ITF 2010
74
1995 2000 2005 2007 2008
ALB n.a. 1 7 2 0AUS n.a. n.a. n.a. n.a. n.a.AUT 92 82 362 217 n.a.AZE n.a. 11 100 71 83BEL 88 127 68 135 116BGR n.a. 6 2 2 4BIH n.a. n.a. n.a. n.a. n.a.CAN n.a. 25 8 10 7CHE 131 411 104 n.a. n.a.CZE 73 28 237 77 325DEU 1 156 1 411 700 1 620 1 140DNK 48 118 35 64 n.a.ESP 458 460 1 343 2 026 2 275EST 2 1 1 4 96FIN 51 65 48 74 108FRA 570 783 860 1 052 820GBR 704 1 197 2 602 n.a. n.a.GEO n.a. n.a. n.a. 78 n.a.HRV 7 4 15 22 21HUN 33 27 115 2 n.a.IRL n.a. n.a. 105 271 403ISL n.a. 12 7 5 12ITA 272 355 806 124 n.a.JPN n.a. 28 22 23 23KOR n.a. n.a. 3 3 n.a.LIE - - - - -LTU 19 1 4 53 n.a.LUX 0 3 26 64 47LVA n.a. 18 17 17 18MEX 21 185 602 191 278MKD 48 14 0 0 1MLT n.a. n.a. n.a. n.a. n.a.NOR 70 73 44 238 n.a.NZL n.a. n.a. n.a. n.a. n.a.POL 27 70 131 85 79PRT 67 168 144 93 146ROM 12 7 2 42 9RUS 263 240 268 436 441SRB n.a. 0 0 0 0SVK 4 4 32 16 30SVN 7 3 1 24 5SWE 76 315 85 118 107TUR 455 218 382 124 126USA 4 763 13 241 n.a. n.a. n.a.
GROSS INVESTMENT IN TRANSPORT INFRASTRUCTURECurrent prices and exchange rates - million Euros
Table D5 : Airports infrastructure

Trends in the Transport Sector 1970-2008 - OECD/ITF 2010
75
1995 2000 2005 2007 2008
ALB n.a. n.a. n.a. n.a. n.a.AUS n.a. n.a. n.a. n.a. n.a.AUT n.a. 347 302 325 n.a.AZE n.a. 2 8 12 21BEL 292 n.a. n.a. n.a. n.a.BGR 0 14 31 30 58BIH n.a. n.a. n.a. n.a. n.a.CAN n.a. n.a. n.a. n.a. n.a.CHE 350 469 683 n.a. n.a.CZE 207 257 236 253 353DEU n.a. n.a. n.a. n.a. n.a.DNK n.a. n.a. n.a. n.a. n.a.ESP n.a. n.a. n.a. n.a. n.a.EST 1 22 13 17 n.a.FIN 119 115 156 167 180FRA n.a. 2 617 3 568 3 377 3 672GBR n.a. n.a. n.a. n.a. n.a.GEO n.a. n.a. 23 14 n.a.HRV 43 96 160 154 171HUN 138 79 234 1 288 457IRL 10 115 127 144 n.a.ISL - - - - -ITA 1 007 5 363 8 919 8 282 n.a.JPN n.a. n.a. n.a. n.a. n.a.KOR n.a. n.a. 8 15 n.a.LIE - - - - -LTU 28 48 105 115 n.a.LUX 81 88 112 108 115LVA 25 48 60 89 125MEX n.a. n.a. n.a. n.a. n.a.MKD 1 13 10 0 5MLT - - - - -NOR 220 336 360 417 455NZL n.a. n.a. n.a. n.a. n.a.POL 585 59 82 100 35PRT 49 52 100 122 122ROM 203 n.a. 58 96 n.a.RUS n.a. n.a. n.a. n.a. n.a.SRB 4 8 22 20 21SVK 6 8 10 15 14SVN n.a. 7 7 8 9SWE 258 353 490 541 591TUR 80 150 165 192 207USA n.a. n.a. n.a. n.a. n.a.
MAINTENANCE EXPENDITURES IN TRANSPORT INFRASTRUCTURE
Current prices and exchange rates - million Euros
Table E1 : Rail maintenance
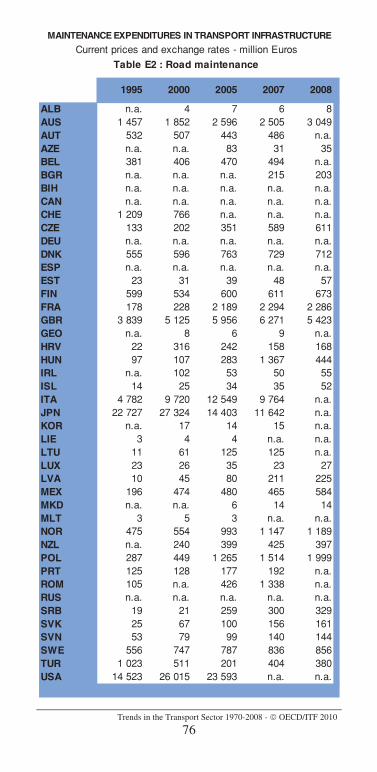
Trends in the Transport Sector 1970-2008 - OECD/ITF 2010
76
1995 2000 2005 2007 2008
ALB n.a. 4 7 6 8AUS 1 457 1 852 2 596 2 505 3 049AUT 532 507 443 486 n.a.AZE n.a. n.a. 83 31 35BEL 381 406 470 494 n.a.BGR n.a. n.a. n.a. 215 203BIH n.a. n.a. n.a. n.a. n.a.CAN n.a. n.a. n.a. n.a. n.a.CHE 1 209 766 n.a. n.a. n.a.CZE 133 202 351 589 611DEU n.a. n.a. n.a. n.a. n.a.DNK 555 596 763 729 712ESP n.a. n.a. n.a. n.a. n.a.EST 23 31 39 48 57FIN 599 534 600 611 673FRA 178 228 2 189 2 294 2 286GBR 3 839 5 125 5 956 6 271 5 423GEO n.a. 8 6 9 n.a.HRV 22 316 242 158 168HUN 97 107 283 1 367 444IRL n.a. 102 53 50 55ISL 14 25 34 35 52ITA 4 782 9 720 12 549 9 764 n.a.JPN 22 727 27 324 14 403 11 642 n.a.KOR n.a. 17 14 15 n.a.LIE 3 4 4 n.a. n.a.LTU 11 61 125 125 n.a.LUX 23 26 35 23 27LVA 10 45 80 211 225MEX 196 474 480 465 584MKD n.a. n.a. 6 14 14MLT 3 5 3 n.a. n.a.NOR 475 554 993 1 147 1 189NZL n.a. 240 399 425 397POL 287 449 1 265 1 514 1 999PRT 125 128 177 192 n.a.ROM 105 n.a. 426 1 338 n.a.RUS n.a. n.a. n.a. n.a. n.a.SRB 19 21 259 300 329SVK 25 67 100 156 161SVN 53 79 99 140 144SWE 556 747 787 836 856TUR 1 023 511 201 404 380USA 14 523 26 015 23 593 n.a. n.a.
Current prices and exchange rates - million Euros
Table E2 : Road maintenance
MAINTENANCE EXPENDITURES IN TRANSPORT INFRASTRUCTURE

Trends in the Transport Sector 1970-2008 - OECD/ITF 2010
77
1995 2000 2005 2007 2008
ALB n.a. n.a. n.a. n.a. n.a.AUS - - - - -AUT n.a. n.a. n.a. n.a. n.a.AZE n.a. n.a. n.a. n.a. n.a.BEL 25 48 66 76 87BGR n.a. n.a. 507 788 n.a.BIH n.a. n.a. n.a. n.a. n.a.CAN n.a. n.a. n.a. n.a. n.a.CHE n.a. n.a. n.a. n.a. n.a.CZE 4 4 2 3 2DEU n.a. n.a. n.a. n.a. n.a.DNK - - - - -ESP - - - - -EST - - - - -FIN 14 27 15 16 17FRA 24 46 55 58 60GBR n.a. n.a. n.a. n.a. n.a.GEO - - - - -HRV n.a. 2 4 2 3HUN 48 n.a. 1 33 2IRL - - - - -ISL - - - - -ITA 12 38 481 98 n.a.JPN - - - - -KOR - - - - -LIE - - - - -LTU 1 1 2 2 n.a.LUX 0 0 0 0 0LVA - - - - -MEX - - - - -MKD - - - - -MLT - - - - -NOR - - - - -NZL - - - - -POL 15 n.a. 14 2 2PRT n.a. n.a. n.a. n.a. n.a.ROM 13 n.a. 6 29 n.a.RUS n.a. n.a. n.a. n.a. n.a.SRB 1 1 6 11 13SVK 4 7 2 1 4SVN - - - - -SWE - - - - -TUR n.a. n.a. n.a. n.a. n.a.USA n.a. n.a. n.a. n.a. n.a.
MAINTENANCE EXPENDITURES IN TRANSPORT INFRASTRUCTURE
Current prices and exchange rates - million Euros
Table E3 : Inland warterways maintenance
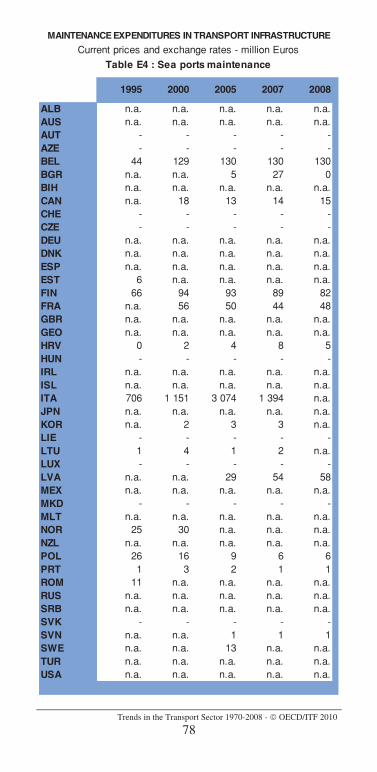
Trends in the Transport Sector 1970-2008 - OECD/ITF 2010
78
1995 2000 2005 2007 2008
ALB n.a. n.a. n.a. n.a. n.a.AUS n.a. n.a. n.a. n.a. n.a.AUT - - - - -AZE - - - - -BEL 44 129 130 130 130BGR n.a. n.a. 5 27 0BIH n.a. n.a. n.a. n.a. n.a.CAN n.a. 18 13 14 15CHE - - - - -CZE - - - - -DEU n.a. n.a. n.a. n.a. n.a.DNK n.a. n.a. n.a. n.a. n.a.ESP n.a. n.a. n.a. n.a. n.a.EST 6 n.a. n.a. n.a. n.a.FIN 66 94 93 89 82FRA n.a. 56 50 44 48GBR n.a. n.a. n.a. n.a. n.a.GEO n.a. n.a. n.a. n.a. n.a.HRV 0 2 4 8 5HUN - - - - -IRL n.a. n.a. n.a. n.a. n.a.ISL n.a. n.a. n.a. n.a. n.a.ITA 706 1 151 3 074 1 394 n.a.JPN n.a. n.a. n.a. n.a. n.a.KOR n.a. 2 3 3 n.a.LIE - - - - -LTU 1 4 1 2 n.a.LUX - - - - -LVA n.a. n.a. 29 54 58MEX n.a. n.a. n.a. n.a. n.a.MKD - - - - -MLT n.a. n.a. n.a. n.a. n.a.NOR 25 30 n.a. n.a. n.a.NZL n.a. n.a. n.a. n.a. n.a.POL 26 16 9 6 6PRT 1 3 2 1 1ROM 11 n.a. n.a. n.a. n.a.RUS n.a. n.a. n.a. n.a. n.a.SRB n.a. n.a. n.a. n.a. n.a.SVK - - - - -SVN n.a. n.a. 1 1 1SWE n.a. n.a. 13 n.a. n.a.TUR n.a. n.a. n.a. n.a. n.a.USA n.a. n.a. n.a. n.a. n.a.
MAINTENANCE EXPENDITURES IN TRANSPORT INFRASTRUCTURE
Current prices and exchange rates - million Euros
Table E4 : Sea ports maintenance

Trends in the Transport Sector 1970-2008 - OECD/ITF 2010
79
1995 2000 2005 2007 2008
ALB n.a. n.a. n.a. n.a. n.a.AUS n.a. n.a. n.a. n.a. n.a.AUT n.a. n.a. n.a. n.a. n.a.AZE n.a. 6 8 10 7BEL 26 n.a. n.a. n.a. n.a.BGR n.a. 6 2 2 0BIH n.a. n.a. n.a. n.a. n.a.CAN n.a. 42 22 23 23CHE 16 46 70 n.a. n.a.CZE 7 13 14 13 12DEU n.a. n.a. n.a. n.a. n.a.DNK n.a. n.a. n.a. n.a. n.a.ESP n.a. n.a. n.a. n.a. n.a.EST 2 3 n.a. n.a. n.a.FIN 86 143 181 218 232FRA n.a. n.a. n.a. n.a. n.a.GBR n.a. n.a. n.a. n.a. n.a.GEO n.a. n.a. n.a. n.a. n.a.HRV 1 1 1 2 2HUN 28 n.a. n.a. 659 n.a.IRL n.a. n.a. 14 17 17ISL n.a. n.a. n.a. n.a. n.a.ITA 274 221 178 113 n.a.JPN n.a. n.a. n.a. n.a. n.a.KOR n.a. n.a. 0 0 0LIE - - - - -LTU 5 1 3 4 n.a.LUX 2 4 4 6 8LVA n.a. n.a. n.a. n.a. n.a.MEX n.a. n.a. n.a. n.a. n.a.MKD n.a. n.a. n.a. n.a. n.a.MLT n.a. n.a. n.a. n.a. n.a.NOR 26 34 n.a. n.a. n.a.NZL n.a. n.a. n.a. n.a. n.a.POL 149 1 2 6 20PRT n.a. 6 4 5 18ROM 23 n.a. n.a. 2 n.a.RUS n.a. n.a. n.a. n.a. n.a.SRB n.a. n.a. n.a. n.a. n.a.SVK 1 1 2 2 2SVN n.a. 0 0 n.a. n.a.SWE n.a. n.a. 34 32 33TUR 540 291 4 2 6USA n.a. n.a. n.a. n.a. n.a.
MAINTENANCE EXPENDITURES IN TRANSPORT INFRASTRUCTURE
Current prices and exchange rates - million Euros
Table E5 : Airports maintenance
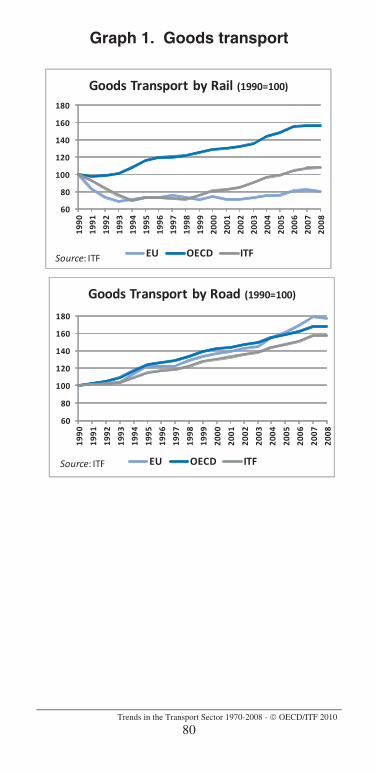
Trends in the Transport Sector 1970-2008 - OECD/ITF 2010
80
Graph 1. Goods transport
60
80
100
120
140
160
180
1990
1991
1992
1993
1994
1995
1996
1997
1998
1999
2000
2001
2002
2003
2004
2005
2006
2007
2008
Goods Transport by Rail (1990=100)
EU OECD ITFSource: ITF
60
80
100
120
140
160
180
1990
1991
1992
1993
1994
1995
1996
1997
1998
1999
2000
2001
2002
2003
2004
2005
2006
2007
2008
Goods Transport by Road (1990=100)
EU OECD ITFSource: ITF
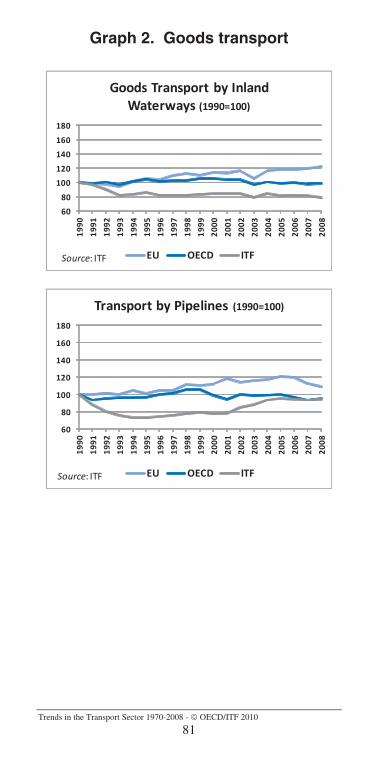
Trends in the Transport Sector 1970-2008 - OECD/ITF 2010
81
Graph 2. Goods transport
60
80
100
120
140
160
180
1990
1991
1992
1993
1994
1995
1996
1997
1998
1999
2000
2001
2002
2003
2004
2005
2006
2007
2008
Goods Transport by Inland Waterways (1990=100)
EU OECD ITFSource: ITF
60
80
100
120
140
160
180
1990
1991
1992
1993
1994
1995
1996
1997
1998
1999
2000
2001
2002
2003
2004
2005
2006
2007
2008
Transport by Pipelines (1990=100)
EU OECD ITFSource: ITF
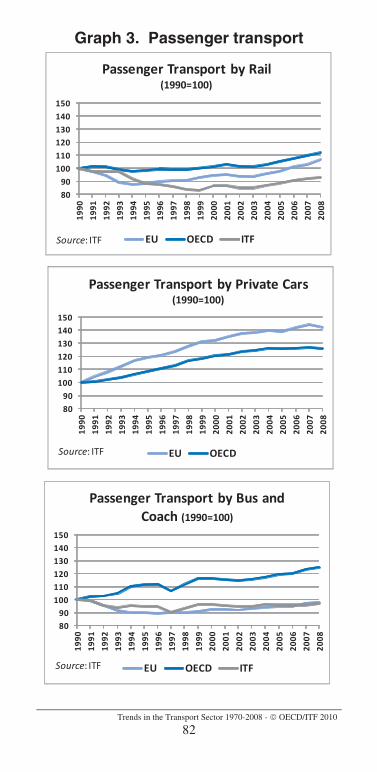
Trends in the Transport Sector 1970-2008 - OECD/ITF 2010
82
Graph 3. Passenger transport
80
90
100
110
120130
140
150
1990
1991
1992
1993
1994
1995
1996
1997
1998
1999
2000
2001
2002
2003
2004
2005
2006
2007
2008
Passenger Transport by Rail (1990=100)
EU OECD ITFSource: ITF
80
90
100
110
120
130
140150
1990
1991
1992
1993
1994
1995
1996
1997
1998
1999
2000
2001
2002
2003
2004
2005
2006
2007
2008
Passenger Transport by Private Cars (1990=100)
EU OECDSource: ITF
8090
100
110120
130140150
1990
1991
1992
1993
1994
1995
1996
1997
1998
1999
2000
2001
2002
2003
2004
2005
2006
2007
2008
Passenger Transport by Bus and Coach (1990=100)
EU OECD ITFSource: ITF
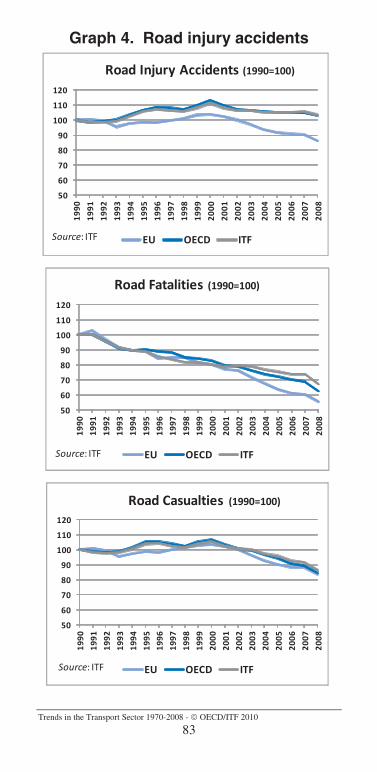
Trends in the Transport Sector 1970-2008 - OECD/ITF 2010
83
Graph 4. Road injury accidents
50
60
70
80
90
100
110
120
1990
1991
1992
1993
1994
1995
1996
1997
1998
1999
2000
2001
2002
2003
2004
2005
2006
2007
2008
Road Injury Accidents (1990=100)
EU OECD ITFSource: ITF
50
60
70
80
90
100
110
120
1990
1991
1992
1993
1994
1995
1996
1997
1998
1999
2000
2001
2002
2003
2004
2005
2006
2007
2008
Road Casualties (1990=100)
EU OECD ITFSource: ITF
50
60
70
80
90
100
110
120
1990
1991
1992
1993
1994
1995
1996
1997
1998
1999
2000
2001
2002
2003
2004
2005
2006
2007
2008
Road Fatalities (1990=100)
EU OECD ITFSource: ITF

Trends in the Transport Sector 1970-2008 - OECD/ITF 2010
84
Graph 5. Total number of deaths per million population, 2008
0 50 100 150 200 250
Russia
Georgia
Belarus
Ukraine
Croatia
Lithuania
Poland
Romania
Latvia
Bulgaria
Greece
Moldova
United states
Serbia
Azerbaijan
Korea
Armenia
Bosnia-Herz.
Slovakia
Slovenia
Czech Republic
Belgium
Hungary
Estonia
Albania
New zealand
Portugal
Canada
Austria
FYROM
Italy
Denmark
Luxembourg
France
Australia
Spain
Finland
Ireland
Turkey
Germany
Norway
Mexico
Japan
Switzerland
UK
Sweden
Netherlands
Iceland
Malta
Liechtenstein
Source : ITF

Trends in the Transport Sector 1970-2008 - OECD/ITF 2010
85
Graph 6. Total number of deaths per million road motor vehicles, 2008
0 250 500 750 1000 1250 1500 1750 2000 2250 2500 2750
Georgia
Azerbaijan
Ukraine
Moldova
Albania
Belarus
Russia
Romania
FYROM
Turkey
Serbia
Croatia
Slovakia
Bulgaria
Latvia
Korea
Lithuania
Poland
Hungary
Mexico
Estonia
Greece
Czech Republic
Slovenia
Belgium
Portugal
United states
Denmark
Canada
Austria
France
Italy
Ireland
New zealand
Finland
Spain
Australia
Netherlands
Luxembourg
Germany
Norway
UK
Sweden
Japan
Switzerland
Malta
Iceland
Liechtenstein
Source : ITF

Trends in the Transport Sector 1970-2008 - OECD/ITF 2010
86
REFERENCES
ECMT (1999), Cleaner Cars, Fleet Renewal and Scrappage Schemes.
IATA (2008), Monthly Traffic Analysis, December 2008.
IATA (2009), Air Transport market Analysis, December 2009.
OECD (2010), What is the economic outlook for OECD countries? An intermi assessment, April 2010.
OECD (2009a), OECD Economic Outlook, Volume 2009/2, No. 86, November, OECD.
OECD (2009b), Understanding the World Trade Collapse, Economics Department Working Papers No. 279.
UNTAC (2009), Review of Maritime Transport, 2009.
Ward’s Automotive Group (2010), WARDS U.S. Light Vehicle Sales by Company.
World Bank (2010), Global Economic Prospects 2010: Crisis, Finance, and Growth, http://www.worldbank.org/globaloutlook.
WTO (2010), WTO Secretariat, http://www.wto.org/english/news_e/pres10_e/pr598_e.htm.
OECD PUBLISHING, 2, rue André-Pascal, 75775 PARIS CEDEX 16 PRINTED IN FRANCE
(74 2010 03 1 P) ISBN 978-92 821-0271-8 – No. 57395 2010

How have the passenger and freight transport sectors evolved in recent years? And what about road safety? This publication presents the most up-to-date statistics on transport markets in International Transport Forum countries for the period 1970-2008, including charts to highlight the major trends.
This brochure provides the reader with first-hand figures on key transport trends. Data are also provided on air and maritime transport as well as on investment and maintenance expenditures undertaken in the transport sector.
-:HSTCSC=VUW\V]:(74 2010 03 1 P1) ISBN 978-92-821-0271-8
www.oecd.org/publishing
www.internationaltransportforum.org
Trendsin theTransport
sector
Trendsin theTransport
sector
19702008