trends of health indicators in zimbabwe:
TRANSCRIPT

Working Paper
Trends of health indicators
in Zimbabwe, a CE-DAT
technical brief
Madelene Jönsson
Debarati Guha Sapir
247
December 2009
Complex Emergency Database

CRED Working paper no 247
Brussels, 2009
www.cedat.org
*Research Intern, Centre for Research on the Epidemiology of Disasters (CRED),
Catholic University of Louvain, Belgium, Uppsala University, Sweden
**Professor, Department of Public Health and Epidemiology,
Centre for Research on the Epidemiology of Disasters (CRED),
Catholic University of Louvain, Belgium
Trends of health indicators in Zimbabwe:
CE-DAT Technical Brief
Madelene Jönsson*
Debarati Guha Sapir**
Page 2 of 30
Table of contents
1 Introduction ............................................................................................................................... 3
2 The context in Zimbabwe from a humanitarian perspective ..................................................... 3
2.1 Political violence ...................................................................................................................... 4
2.2 The land and food security ...................................................................................................... 5
2.3 Food aid ..................................................................................................................................... 7
3 Humanitarian or development crisis in Zimbabwe? .................................................................. 8
3.1 Does Zimbabwe have the characteristics of humanitarian emergency? ............................... 9
4 Health data from Zimbabwe: scattered evidence ..................................................................... 11
4.1 Child mortality ....................................................................................................................... 11
4.2 Disease ..................................................................................................................................... 13
4.2.1 Overall disease profile .................................................................................................... 13
4.2.2 HIV/AIDS ....................................................................................................................... 14
4.2.3 Cholera ............................................................................................................................ 15
4.3 Nutrition ................................................................................................................................. 17
4.3.1 Anthropometric indicators ....................................................................................................... 17
4.3.2 Micronutrient situation in Zimbabwe ................................................................................. 21
5 Conclusion ............................................................................................................................... 26
References ....................................................................................................................................... 27

Page 3 of 30
1 Introduction
This summary aims to provide a brief overview and background to the current humanitarian crisis
in Zimbabwe. The overall humanitarian situation is complex, including economic and food crisis,
and can be attributed, in varying degrees, to droughts, the HIV/AIDS epidemic and to inappropriate
economic and political policies. The former breadbasket of the southern Africa has become a food
aid recipient. The collapse of Zimbabwe's health system has contributed to the severity of the
recent cholera outbreak. The harsh political climate has hampered the work of NGOs and limited
the availability of health data.
2 The context in Zimbabwe from a humanitarian perspective
Figure 1. Map of regions and districts in Zimbabwe
Source: UN (modified) (1)

Page 4 of 30
Most population estimates for 2008 range between 11 to 12 million. The last census was conducted
in 2002 and the HIV epidemic and the migration have made the projections more difficult (2). The
life expectancy increased from 45 years in the 1960s to almost 60 years in the late 1980s (3). Then
the HIV/AIDS epidemic hit the country, which resulted in a sharp reduction in life expectancy, 36
years in 2004 (males 37, females 34) (4).
Until the end of the 1990s the human development in Zimbabwe has been good compared to the
majority of the Sub-Saharan countries. Still the adult literacy rate is one of the highest in Africa
(90%) (5). The rapid decline is shown by the Human Development Index compiled by the UNDP,
where Zimbabwe has fallen about 30 places on the ranking list since 1990, just before Togo and
Yemen (6).
Zimbabwe has had a negative growth since the 1960s, with the GDP falling with about 1%
annually in the 1970s and 1980s (3). Despite this the social investments was fairly high (3). In the
beginning of this decade the economic situation worsened, the GDP dropped with over 6 %
annually and in 2006 the GDP/capita was 169 US$ (2). The total expenditure on health decreased
by one third from 1999 to 2003 and the government expenditure on health in 2003 was almost half
of the amount spent in 1999 (4). The health system has also suffered greatly from the lack of human
resources, mainly caused by the HIV epidemic and the exodus of trained health staff. The number
of physicians went from 6.7 per 1000 persons in 1984 to 0.16 in 2004 (3, 4).
In 2004, over 80% of the Zimbabweans were living below the international poverty line of $2 a day
(7). Since then the situation has further deteriorated with an extreme inflation and an
unemployment rate above 80%.
2.1 Political violence
Robert Mugabe and his Zimbabwe African National Union – Patriotic Front (ZANU-PF) have ruled
the country since they won the first elections in 1980. Since 1992 the elections have been
associated with an increasing violence, which escalated in 1999 when the opposition party, the
Movement for Democratic Change (MDC) became a real threat to ZANU-PF. Operations were
supported by ZANU-PF as a way to intimidate the growing support for the opposition. This
includes the systematic occupations of farms (belonging to the white minority) and the operations
Page 5 of 30
Murambatvina1 and Makavhotarapapi2. The public agencies in Zimbabwe have generally not been
accountable to the public and food aid has been distributed on political grounds (8).
2.2 The land and food security
Zimbabwe is frequently exposed to extreme weather events like droughts, floods and cyclones.
According to the EM-DAT database droughts have taken place five times since 1982 and floods
have occurred six times during the ten year period 1998-2008 (9). (Table 1)
Due to this weather, with sometimes heavy rainfall and dry spells, variations in the agricultural
production are normal. Overall, the southern part of the country relies more on livestock income
while the north eastern part is more dependent on crop income. The usually surplus producing
districts in the central and northern part, but even in a district with a surplus production there can
be pockets of food deficit. The fertile Mashonaland regions have been seen as the “bread basket” of
the country and the bulk of the large-scale commercial farms are located here. Most of the
Communal lands3 (land without ownership) are located in the less fertile agricultural zones. In
general areas with lower soil quality are more food insecure, like the arid Masvingo and the
Matabeleland regions (10, 11).
1 In connection to the elections in 2005, an operation called Murambatvina (“drive out the trash”) was launched by the government to
get rid of the informal settlements in the urban areas by displacing people from the city to the rural areas. An estimated 700,000 people
lost their homes and/or livelihoods (56).
2 Makavhotarapapi (“where did you vote”) started after the election in Mars 2008, when the Zanu-PF lost the majority in parliament and
Mugabe lost the Presidential vote, as an attempt to “educate” the people to vote “right” in the re-elections held in June. There were over
2000 reported cases of violence and 161 murders (57).
3 A legal framework for the allocation of land from 1930, divided the land of the colony into three areas: areas where only whites could
own property; areas which were for indigenous people on a collective basis (since 1981 called "communal areas/lands"); and areas where
only indigenous people could own property.

Page 6 of 30
Table 1. Natural disasters in Zimbabwe, 1982-2008
Type of disaster
Time No of people affected
Affected areas of the country
Drought 1982-1984 700 000 Central, Southern, Eastern and Western parts
1991-1995 5 000 000
1998 55 000 Matabeleland South
2001-2003 6 000 000 Midlands, Matabeleland North and South, Masvingo, Manicaland, Mashonaland Central and West
2007-2008 2 100 000 Masvingo, Matabeleland North and South, Midlands, Manicaland, Mashonaland Central, East and West
Flood 1998
Southern part
2000 266 000 Manicaland, Masvingo, Matabeleland South, Midlands
2001 30 000 Mashonaland Central, Matabeleland North
2003 18 000 Mashonaland Central and West
2007 15 000 Mashonaland Central
2007-2008 2000 Masvingo
Tropical cyclone
2003
Southern and Eastern parts
2007
Manicaland
Source: EM-DAT (9)
Since the 1990s the government has tried to gain control of the agriculture sector through different
reforms and policies. The regulations of the grain market have hindered the trade of grain from
surplus to deficit areas. When maize and wheat became controlled commodities the commercial
farmers began to switch from staples to crops not controlled by the government (11). During the
land reform4, when the large-scale farms were converted into smaller farms, the farming activities
were disrupted. A newly settled farmer only cultivates about half of the arable land (10). The small-
scale production is also more sensitive to droughts than the often irrigated large-scale commercial
farms. The underutilization the fertile land together with the regulations has contributed to the
decline in agricultural production (2).
4 The land reform programme was initiated after the independence to end the racial imbalance in the ownership of land. In 2000, the
“Fast Track” phase was launched to speed up the resettlement with compulsory acquisition.

Page 7 of 30
2.3 Food aid
The severe drought in 2002 led to a 70% deficit in the agriculture production, the largest deficit
since 1980. Almost half of the population needed food aid. Before 1999, Zimbabwe had produced a
surplus and maintained a grain reserve that had helped the country to handle the droughts. In 2002,
the grain reserve was exhausted and Zimbabwe could not cope like during previous droughts (10).
Figure 2. Commercial and food aid imports of maize
*Estimated gap recommended to be covered by international assistance which includes maize, other cereals and/or financial resources.
Source: FAO/WFP (2)
Figure 3. Food aid deliveries to Zimbabwe 1998-2007*
* Cereals in grain equivalent
Source: WFP (12)
318
764
340
530686
251380
62314
343
361115
53
62
158
380
0
200
400
600
800
1000
1200
Me
ga t
on
ne
s
Year
Food aid import
Commercial import
0
50
100
150
200
250
300
350
400
19
98
19
99
20
00
20
01
20
02
20
03
20
04
20
05
20
06
20
07
Me
ga t
on

Page 8 of 30
In 2008, FAO/WFP estimated that the harvest only would cover 40% of the needs for 2008/2009
and that 5.1 million people would require food assistance at the peak of the hunger season (January
to March 2009). This figure was later revised to 7 million to avoid a total depletion of assets due to
the high food prices. The food insecurity has affected the whole country. Households in Communal
lands were considered the most vulnerable. According to FAO/WFP the most food insecure
districts were Beitbridge district in Matabeleland South and Zaka and Chivi districts in Masvingo
(over 60% of the population is food insecure) (2).
A population of 5.1 million were assisted by WFP and another 1.8 million by the Consortium for
Southern Africa Food Security Emergency5 (C-SAFE). WFP received US$ 240 million for the
operations but still faced a shortfall of 65 million and was forced to reduce rations to ensure that
food reached all beneficiaries. The government’s three-month long suspension (June to Aug 2008)
on NGO field activities delayed the first distributions of the WFP relief operation until the
beginning of October 2008 (13).
As of March 2009, there are indications of that the situation is getting better. The availability of
food has improved since the government lifted the trade control and the crop production is likely
to be better than last year, but still below the national requirements. As the availability has
improved the food prices have decreased but still remain high compared to the other countries in
the Southern Africa region (14).
3 Humanitarian or development crisis in Zimbabwe?
The human development in Zimbabwe has been good compared to the majority of the sub Saharan
countries. Some of the improvements can be attributed to the investments done in the social sector
despite a poor growth of the economy since the 1960s (3). The country was able to cope with a
weak economy and the extreme weather events (droughts, floods etc) but the impact of the HIV
epidemic and the political policies of the government in the 1990s further aggravated the situation.
The development crisis was deepening over the years and finally turned into a humanitarian crisis.
Today, Zimbabwe is the country in the world with the highest proportion of the population
needing food aid – 70% which makes Zimbabwe to the world's third largest food aid operation,
5 C-SAFE, an umbrella organisation for US-sponsored NGOs.

Page 9 of 30
after Afghanistan and Ethiopia. Due to the cholera outbreak the government of Zimbabwe declared
a national emergency in December 2008 and requested international assistance.
3.1 Does Zimbabwe have the characteristics of humanitarian emergency?
The displacement crisis in Zimbabwe is huge, but has still to a large extent been invisible. The
matter of internally displaced persons (IDPs) is sensitive for the Zimbabwean government, mainly
because the situation is created by the government itself. There are no official statistics, no IDP
camps and IDPs are called MVPs (Mobile vulnerable populations). UN agencies and NGOs have
been forced to adapt this term to be able to address the displaced in Zimbabwe, but the term MVP
also has come to refer to people who are vulnerable for reasons other than displacement (HIV-
positive, orphans etc.). Due to the political sensitivity no agency has been able to conduct a
comprehensive survey to determine the total number of IDPs (15). However an indirect estimation
is 880,000-960,000 people (16); according to a survey by Zimbabwe Vulnerability Assessment
Committee in 2007, 8% of the surveyed population had moved involuntarily since 2000. The
displacement occurring this decade is mainly due to a number of governmental reforms/ operations.
The Fast-track Land Reform in 2000 led to the displacement of an estimated 200,000 farm workers
and their families. Most of them remained in the same area or went to the towns. Around 570,000
people are estimated to have been displaced due to Operation Murambatsvina (removal of informal
settlements in 2005). In addition, 36,000 people were displaced due to the March to June 2008 post-
election violence (Operation Makavhotarapapi) (15).
How many Zimbabweans who have left the country is not known, estimates varies from 1 to 3
million under the period 2000 to 2007 (17). Around 250,000 migrants are annually deported back to
Zimbabwe (5% children and 20% women) (18). They are mainly arriving to Matabeleland South,
from South Africa through the Beitbridge border post and from Botswana through Plumtree (4000
persons per month) (19).
The adult mortality data available shows an overall upward trend for the period 1985-2005 (Figure
4). The impact of AIDS/HIV contributed to the rapid increase seen in the 1990s. The mortality rate
has continued to rise during this decade – a comparison of the Zimbabwe Demographic and Health
Surveys, DHS 99 and DHS 05-06, indicates an increase of 40% for women and 20% for men.

Page 10 of 30
Figure 4. Mortality rates, females age 15-49
Sources: DHS 1994, 1999, 2005-06.
The trend over time proposes that the under five mortality rate (U5MR)6 declined until the mid
1980s, remained relatively stable for ten years and then increased again in the mid 1990s (20). (See
section 4.1)
Figure 5. Trend for U5MR in southern Africa
Source: Childinfo/CME
In 2000, after a cyclone and major floods, an emergency relief appeal was done by UN for
Zimbabwe. A Consolidated Appeal Process (CAP) was done for 2003-2004, recognizing the overall
decline during the previous five years, droughts, the HIV epidemic, an unemployment rate of over
60% at that time and a severe economic decline. Since 2006 a CAP has been prepared for each year.
In 2009, the requested sum was twice as high as the sum in 2006, US$ 550 including US$ 316
million for WFP (21).
6 Under five mortality rate (U5MR), the probability of dying before the age of five expressed per 1,000 live births.
0
2
4
6
8
10
12
141
98
5
19
87
19
89
19
91
19
93
19
95
19
97
19
99
20
01
20
03
20
05
De
ath
s/1
00
0 p
ers
on
s/ye
ar
DHS 94
DHS 99
DHS2005-06
0
50
100
150
200
250
300
19
60
19
70
19
80
19
90
19
95
20
00
20
05
20
07
U5
MR Botswana
Mozambique
South Africa
Zambia
Zimbabwe

Page 11 of 30
Zimbabwe has been receiving aid from ECHO since 2002. In 2008 ECHO allocated €10 million in
humanitarian aid and €15 million in food aid. In addition EuropeAid allocated €16 million to
address “food security in exceptional situations of transition and fragile situations” through the
programme - Linking relief to rehabilitation and development in fragile/failed situations (22).
4 Health data from Zimbabwe: scattered evidence
4.1 Child mortality
The mortality data presented here is based on the following two sources; the Child Mortality
Estimates database7 (CME) from Childinfo and the Zimbabwe Demographic and Health Survey
(DHS). The changes in HIV/AIDS prevalence and treatment have made the projections of child
mortality more difficult (23).
The CME bases their estimates on several census and surveys, including the DHS, and makes
adjustments to the HIV/AIDS epidemic in their projections.
The DHS is measuring U5MR by the asking the mother of the survival of her children. In countries
with a high prevalence of HIV/AIDS this can lead to a survivor selection bias8 (24). In Zimbabwe
this could explain some of the differences between the estimates from DHS 99 and DHS 05-06, e.g.
the increased mortality among women may have resulted in an underestimate of the child
mortality. The same pattern is also seen in DHS from South Africa. Therefore the DHS is mainly
used here to show regional differences in U5MR and not trends over time.
The overall trend suggests that mortality among children and infants continued to decline during
the 1980s and then began to rise at some point in the 1990s. For the beginning of this century the
pattern is harder to interpret; DHS 05-06 shows a sharp increase while CME indicates a decrease in
U5MR. The DHS 05-06 estimated the U5MR for the first half of this decade to 82 deaths per 1000
live births; the estimates done by CME are above 100 for the same time period (Figure 6).
7 The CME database are produced by the Inter-agency Group for Child Mortality Estimation (IGME) for MDG monitoring (with
members from UNICEF, WHO, The World Bank and United Nations Population Division).
8 An excess mortality among the mothers and a high correlation between the mortality risks for the mothers and their children can lead
to an underestimation of the U5MR.
Page 12 of 30
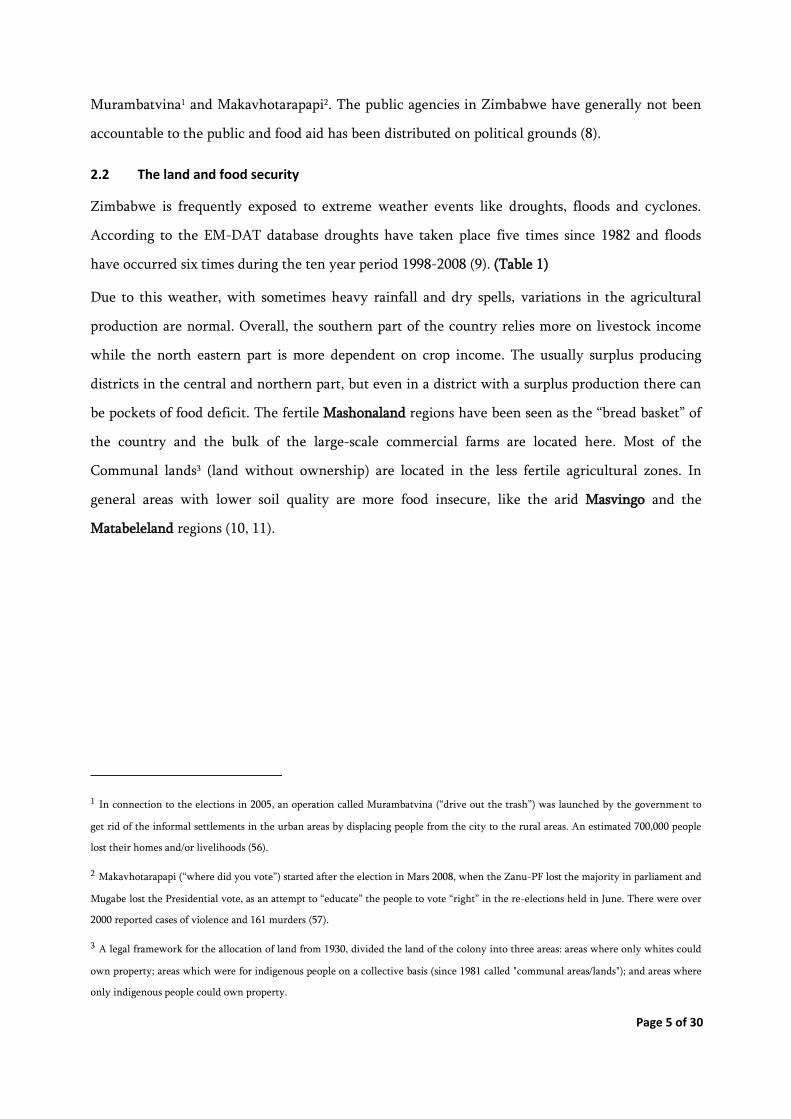
Figure 6. Trend in U5MR
While the recent levels of mortality might be underestimated, the data still reflects the differentials
between the regions and the urban and rural areas. A comparison of the U5MR from DHS 99 and
DHS 05-06 imply that mortality has fallen in all regions except Matabeleland North (Figure 7). As
discussed above, it is uncertain if these decreases shown are due to methodological issues, however
despite this, the upward trend for Matabeleland North persists. Both DHS 05-06 and DHS 99 point
out that the highest U5MR is found in Manicaland.
Figure 7. U5MR for the 10-year periods preceding the surveys by region
Sources: DHS 99, DHS 05-06
The comparison of the data also indicates that the mortality is still higher in the rural areas,
although the difference in U5MR between urban and rural areas has decreased.
0
20
40
60
80
100
120
140
19
73
19
76
19
79
19
82
19
85
19
88
19
91
19
94
19
97
20
00
20
03
20
06
U5
MR DHS 1988
DHS 1994
DHS 1999
DHS 2005-06
Childinfo/CME
0
20
40
60
80
100
120
140
U5
MR
Midpoint 1994 (DHS 1999)
Midpoint 2000 (DHS 2005-06)

Page 13 of 30
The mortality among children declined during the 1980s and then started to rise in the 1990s. For
the beginning of this century the trends suggested by the different sources are more ambiguous and
the pattern is harder to interpret. The changes in HIV/AIDS prevalence and treatments have made
the projections more difficult. The CME data suggest that the child mortality has decreased during
this century.
4.2 Disease
4.2.1 Overall disease profile
HIV/AIDS was estimated to be behind 67% of all deaths, lower respiratory infections accounted for
4% and tuberculosis for 3% of the deaths in 2002 (25). Also among children under five, HIV/AIDS
accounted for the bulk of deaths (41%). Other common causes of deaths among children were;
neonatal causes (28%), diarrhoeal diseases (12%), measles (2.9%), injuries (1%) and malaria (0.2%)
(26).
Figure 8. Estimated deaths for children under age five
Source: Childinfo (27)
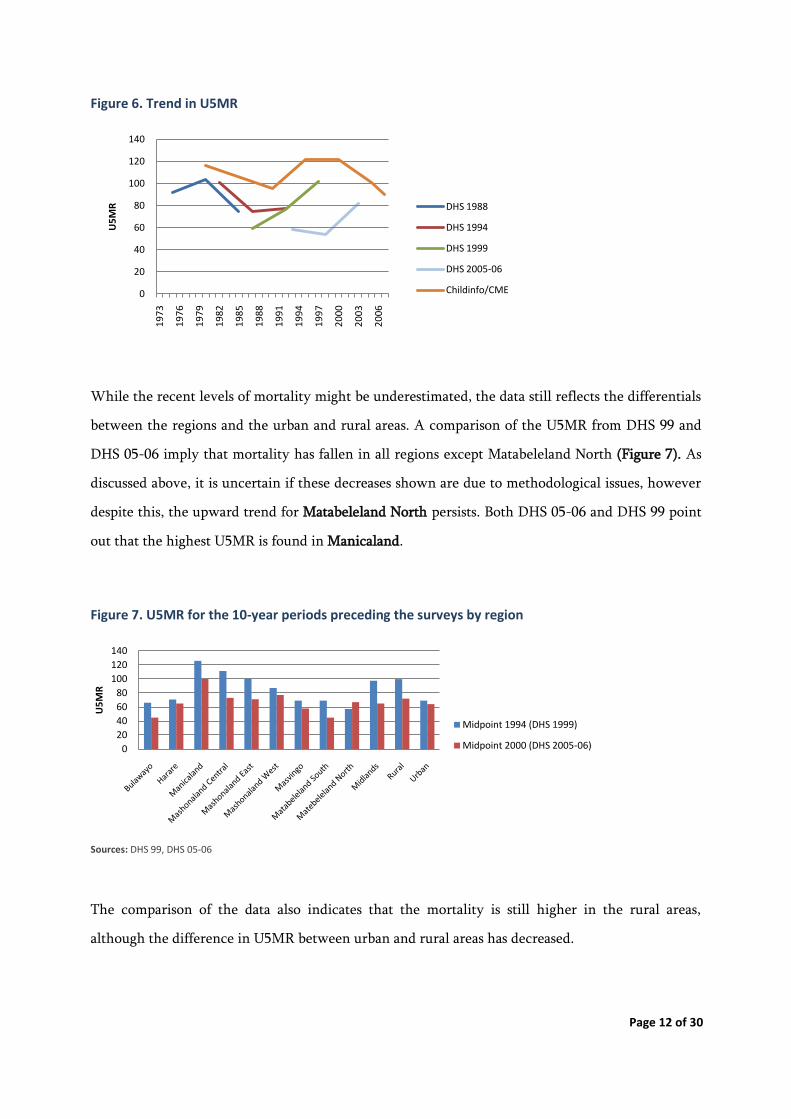
Around half of the Zimbabweans live in malarial areas. The number of malaria cases has doubled
since the early 1990s. In 2006 there were more than 1.5 million cases reported (28) (Figure 9).
0
10,000
20,000
30,000
40,000
50,000
60,000
19
84
19
86
19
88
19
90
19
92
19
94
19
96
19
98
20
00
20
02
20
04
20
06
Nu
mb
er
of
de
ath
s
All deaths under five
Deaths non AIDS
Deaths under five due to AIDS
Page 14 of 30
Figure 9. Reported malaria cases and deaths, 1990-2006
Source: WHO (28)
The increased number of malaria cases seen in the 1990s could be a result of improvements in the
reporting system since the malaria control in Zimbabwe was strengthen at that time. The
population movements can have contributed to the raise seen in this century when people from
non-endemic areas (no immunity) resettled in malaria endemic areas. It is likely that the
breakdown of the Zimbabwean health system also have had impact on the malaria control.
4.2.2 HIV/AIDS
The prevalence of HIV increased steadily in the early 1990s, stabilized in the late 1990s, peaked in
2000 and then decreased (29). The decline is understood to be due to the high levels of AIDS
mortality in combination with a reduction in incidence (30). The WHO/UNAIDS estimated that
the HIV prevalence for adults (15-49) had decreased from 26% in 2001 to 15.3% in 2007 (31). This
is in line with the results from DHS 05-06, which shows a HIV prevalence of 18.1% for the total
population aged 15-49 with the highest prevalence found in Matabeleland South (20.8%) and
Manicaland (19.7%) and the lowest in Masvingo (15.1%) (20). Border towns like Beitbridge and
Chiredzi show a higher HIV prevalence than the national average with 25.6% and 20.4%
respectively (18). The coverage of antiretroviral treatment (ARVs) was estimated to less than 5%
before 2005, in 2007 the estimated coverage almost reached 20% (31).
The HIV/AIDS is by far the main killer both among children and adults. The HIV prevalence has
decreased by 40% in this century. This reduction is due to a lower incidence and a high mortality in
0
500
1000
1500
2000
2500
0
200
400
600
800
1000
1200
1400
1600
1800
2000
19
90
19
91
19
92
19
93
19
94
19
95
19
96
19
97
19
98
19
99
20
00
20
01
20
02
20
03
20
04
20
05
20
06
Nu
mb
er
of
de
ath
s
Nu
mb
er
of
case
s (t
ho
usa
nd
s)
Year
Reported cases
Reported deaths

Page 15 of 30
AIDS. The recently increased coverage of ARVs may contribute to lower the mortality levels. A
question is to which extent the already stressed health system will be able to provide ARVs.
4.2.3 Cholera
Since the beginning of this century cholera has become endemic in southern Africa. Normally the
outbreaks in Zimbabwe have occurred in the rural areas during the rainy season from November to
March. The first reported outbreak was in 1992, and Manicaland was the most affected region
(Figure 10).
Figure 10. Cholera cases and CFR 1992-2008/09*
* 18 th August 2008- 15th July 2009
Sources: Ministry of Health and Child Welfare Rapid Disease Notification System (32), WHO (33)
Since 1998 cholera outbreaks have occurred every year. The disease has rarely been seen during the
dry season and in urban settings until the last years when the lack of maintenance of the water
supply and sanitation have caused both outbreaks of diarrheal diseases and cholera in the cities (33).
The 2008 cholera outbreak started before the rainy season in August in an urban area of the Harare
region. During the first outbreak in Chitungwiza, cases were reported until mid October. For a
month there were no new cases, but then the disease spread and during the period 16-22 November
cases were reported from eight regions. The highest peak was seen in Harare city with almost 2500
cases reported the first week. In the first half of January all ten provinces were affected; however
the western part to a somewhat lesser extent (Matabeleland North) (34). The highest caseloads were
2048
5835
995
56371675
650
31251009 119
516 78965
98592
0
1
2
3
4
5
6
7
8
9
0
20000
40000
60000
80000
100000
19
92
19
93
19
94
19
95
19
96
19
97
19
98
19
99
20
00
20
01
20
02
20
03
20
04
20
05
20
06
20
07
20
08
*
CFR
(%
)
Nu
mb
er
of
case
s
Year
Cases
CFR

Page 16 of 30
found in the following regions; Mashonaland West, Harare and Manicaland with respectively
22.313, 18.877 and 13.374 cases as of April 2009 (35). The Case Fatality Rate (CFR) was overall
highest in Mashonaland East (7%), Matabeleland North (6,4%) and Masvingo (5.9%) (April 2009)
(35) (Figure 11).
By mid July the outbreak is likely to have reached its tail end, the cumulative number of cases
reported since August 2008 was 98.592, the number of deaths 4288 and the CFR for the entire
outbreak 4,3% (32).
Figure 11. Reported cases and CFR by region, 2008-2009*
* 18th August 2008- 18th April 2009
Source: Ministry of Health and Child Welfare Rapid Disease Notification System (35)
The CFR have slightly declined during the outbreak, as of end of February CFR was 4.6% for the
entire country (36). In general, the case fatality rates seen in Zimbabwe have been high, also when
compared to other African countries, ranging from 2.2-7.7% with an average of 5.2%, over the
period 1992 to 2007 (Figure 10). Correct treatment of cholera cases can significantly decrease the
mortality; as a benchmark case fatality rate should be below 1%. Without any treatment the case
fatality rate may reach 30-50%. Malnourished and HIV infected people have an increased the risk
of mortality, this may have contributed to the elevated CFRs seen in Zimbabwe during the last
decade (37). The disease strain in Zimbabwe is Vibrio cholerae O1, biotype El Tor (38, 39).
0
1
2
3
4
5
6
7
8
0
5000
10000
15000
20000
25000
CFR
(%)
Nu
mb
er
of
case
s
Cumulative Cases
CFR

Page 17 of 30
The 3rd of December 2008, the Government of Zimbabwe declared an emergency and requested
international assistance to respond to the cholera outbreak (40). The difficulties to gain control over
the cholera situation in Zimbabwe can be attributed to the lack of trained health staff, lack of
infrastructure, the contaminated water supply and poor sanitation (41). Médecins Sans Frontières
(MSF) also describes restrictions and problems to get permissions to work and set up treatment
centres resulting in delayed response (42).
The lack of maintenance of the water supply and sanitation has led to outbreaks of cholera and
diarrheal diseases. As long as the causes of the current outbreak are not fully addressed the risk of
new outbreaks are apparent, especially when the rainy season is approaching. The difficulties to
gain control over the cholera outbreak in Zimbabwe can be attributed to the weak health delivery
system, which needs to be further strengthen, although it has improved since the start of the
outbreak.
4.3 Nutrition
4.3.1 Anthropometric indicators
Data from DHS suggests that chronic malnutrition/stunting9 has increased in Zimbabwe, from
26.5% to 29.4% during the period 1999 to 2005 (20, 43). However, this is still far lower than the
levels of stunting in the neighbouring countries, Mozambique and Zambia with a prevalence of
41% and 50% respectively (44). According to DHS 05-06, stunting was most common in
Manicaland, Mashonaland East and Mashonaland Central (above 30% in age group 0-59 months)
(20). In 1988 the highest prevalence (above 30% in age group 3-59 months) was found in
Matabeleland North and South, Mashonaland East, Manicaland and Masvingo (45). Stunting was
about twice as common in the rural areas compared to the urban in 1988, since then the difference
has declined (20, 45).
Twenty years ago the prevalence of wasting10 was low in Zimbabwe. In 1988, wasting was most
common in Mashonaland East and West with 1.7% for children aged 3-59 months according to
DHS (45). Data from the more recent DHS suggest that the level of wasting has increased since
9 height-for-age below -2 SD
10 weight-for-height below -2 SD

Page 18 of 30
then. Both DHS 05-06 and DHS 99 showed a national level of wasting of 6.4% for children 0-59
months old and that wasting was most prevalent in Mashonaland East (11.1%), Mashonaland West
(9.4%) and Masvingo (7.1%) (20) (43). There were no major differences between the urban and
rural areas during the 1990s. However, since then wasting has become more common in the rural
areas, 7% compared to 4.5% according to DHS 05-06 (20).
Table 2. National levels of wasting and chronic malnutrition
Survey Age group (months) Wasting (%) Chronic malnut. (%)
DHS 88 3-60 1,3 29
DHS 94 0-35 5,5 21,4
DHS 99 0-59 6 26,5
Vulnerability Assessment Committee, Aug 2002
6-59 7,3 41,3
DHS 2005-06 0-59 6,4 29,4
Zimbabwe Food and Nutrition Council, Nov 2006
6-59 3,2 31,7
Zimbabwe Food and Nutrition Council, Oct 2007
6-59 4,1
Wasting can be subject to seasonal variations and surveillance data indicates that these variations
are greater for the more crop depending districts.
Figure 12. Wasting by district (age 6-59 months)
Source: Pilot Food and Nutrition Sentinel Site Surveillance Report, 2005 (46)
0123456789
10
Was
tin
g (%
)
nov-04
mars-05

Page 19 of 30
Comparisons between the prevalence of wasting at the beginning and at the end of the hunger
season (Nov-04 and Mars-05) showed an overall increase in prevalence during the period for the
traditionally more crop depending districts located in the north eastern parts.
Households in these districts seem to be more sensitive to the actual hunger period than districts
located in the southern and western regions. Of the surveyed districts, the highest increase was
seen in Mudzi district, Mashonaland East, where the prevalence went from 2.7% to 9% (46).
11 Global Acute Malnutrition, weight-for-height below -2 SD and/or bilateral oedema
Figure 13. Map of districts with GAM above 7%*
* For Mudzi district- wasting (edema not included)
Surveillance data; Mudzi- Mars 2005, Lupane, Umguza, Gwanda, Chipinge- October 2007, Guruve- July 2008. Survey data; Binga- Dec 2008
Sources: CE-DAT (47), Pilot Food and Nutrition Sentinel Site Surveillance Report 2005 (46), Nutrition Sentinel Site Surveillance Summary
2008 (48)
There is a scarcity of available anthropometric data from Zimbabwe; in particular there is a lack of
surveys from the last years. In the Complex Emergency database (CE-DAT) there are currently 14
surveys from 10 districts carried out by NGOs from 2001-2008 (47). Save the Children (SC-UK) has
conducted five surveys in Binga district which shows an increase of Global Acute Malnutrition
(GAM)11 from 2.6% in 2001 to 7.6% in 2008 (age group 6-59 months). The two most recent surveys

Page 20 of 30
Figure 14. GAM* vs. time by district (6-59 months)
*Data from Aug-04 and Feb-05 weight-for-height
Sources: CE-DAT (47), Pilot Food and Nutrition Sentinel Site Surveillance Report 2005 (46), Nutrition Sentinel Site Surveillance Summary 2008
(48)
Considering the high levels of food insecurity, the levels of GAM could be expected to be high.
Coping strategies like consuming roots, tubers and vegetables instead of cereals might explain the
lower levels of GAM shown despite high food insecurity. Data from FAO shows a decrease in the
0
1
2
3
4
5
6
7
8
9
10
Ap
r/01
No
v/01
May/0
2
Dec/0
2
Jun
/03
Jan/0
4
Au
g/04
Feb/0
5
Sep/0
5
Mar/0
6
Oct/0
6
Ap
r/07
No
v/07
Jun
/08
Dec/0
8
Jul/0
9
GA
M (
%)
Binga
Bulawayo
Bulilimamangwe
Centenary
Chimanimani
Chipinge
Chitungwiza
Gokwe South
Guruve/Mbire
Gutu
Gwanda
Harare
Kwekwe
Lupane
Makoni
Mudzi
Murewa
Mutare
Mutasa
Nyaminyami/Kariba
Nyanga
Tsholotsho
UMP
Umguza
indicate an elevation from 4.5% in October 2007 to 7.6% in December 2008. As these surveys were
carried out at the beginning of the hunger season the situation risks to further deteriorate.

Page 21 of 30
consumption of cereals while the consumption of cassava has almost doubled during the period
1990 to 2003 (49). In the western and southern provinces, livestock is used as a buffer.
Due to the scarcity of nutrition surveys it is hard to make conclusions over the actual situation in
Zimbabwe. The unwillingness of the government to allow NGOs to conduct independent surveys
and the governmental ban on NGOs to work in the country, leaves the impression that the
government needs to be “in control” of the health and nutrition data. As a result a large amount of
the nutrition data presented here is either from DHS or governmental surveillance data. Since food
security is a political sensitive matter in Zimbabwe, there is a concern that this could have
influenced the governmental surveillance data.
The scarcity of anthropometric data is noticeable and should be addressed. At national level (Table
2), the data suggests that there has been an increase of wasting since the DHS conducted in 1988
however comparisons should be done by caution e.g. seasonal variations, different age groups etc.
The two most recent nutrition surveys from Binga district (SC-UK) show an increase of GAM by
41% in a little more than a year.
4.3.2 Micronutrient situation
4.3.2.1 Iodine Deficiency Disorder (IDD)
The national goitre survey of 1988 highlighted iodine deficiency to be of public health significance
in Zimbabwe. The survey showed that the prevalence of Total Goitre Prevalence Rate (TGR)12
ranged from 10.8% in Harare to 78.7% in Murehwa district (Mashonaland East). Twenty of the 50
districts surveyed had goitre prevalence rates of more than 50%. The TGR for the regions varied
from 17% in Matebeleland South to 52% in Mashonaland Central. According to these results, all
regions in the country could be classified as suffering from at least a mild level of endemic goitre
(50).
12 TGR (Grade 1+ Grade2) = Grade 1: A goitre that is palpable but not visible when the neck is in the normal position, even when the
thyroid is not visibly enlarged. Thyroid nodules in a thyroid, which is otherwise not enlarged, fall into this category. Grade 2: A swelling
in the neck that is clearly visible when the neck is in a normal position and is consistent with an enlarged thyroid when the neck is
palpated.

Page 22 of 30
Trends in eliminating IDD
Since the introduction of Universal Salt Iodisation (USI) in 1991, there have been significant
changes in the iodine status of the population as there has been decrease in prevalence of visible
and palpable goitre. For example, in 1996, the TGR in Chinamora (Goromonzi district,
Mashonaland East), determined by palpation in primary school children aged 6–14 years, was found
to be 9%, down from 44% in 1991 (50).
Table 3. Changes in median urinary iodine concentration after introduction of universal salt
iodisation in Zimbabwe
Year of surveys Median urinary iodine concentration (ug/L)
1991-92 20 – 80
1993-94 200 – 500
1995 290 – 600
2005 220 Source: (50)
Urinary iodine levels also confirm that there has been a reduction in IDD prevalence in Zimbabwe
(Table 1). The urinary iodine levels showed a major reduction from the 1995 highest levels of 600
µg/L to 220 µg/L in 2005, indicating a stabilization of the iodine intake in the population. However,
in Nkayi district (Matabeleland North) and Shurugwi district (Midlands) the median urinary iodine
levels were still above 600μg/L in 2005 (50).
Several cases of hyperthyroidism were reported that indicated excess iodine in areas where salt was
supplemented. This led to the establishment of a tighter monitoring of the salt manufacturing
system. Several nationwide surveys indicate that more than 90% of households are using iodised
salt (National Micronutrient Survey report, 1999 (51); Food and Nutrition surveillance reports,
2004; Zimbabwe Vulnerability assessment committee 2005). Mashonaland East, Masvingo,
Mashonaland West and Midlands had 25%, 24%, 16% and 11% of the households, respectively,
using un-iodised salt, indicating that the IDD monitoring programme needed strengthening (50).
Who are more vulnerable and what are the consequences of IDD?
Although iodine deficiencies are not commonly considered as central issue for health intervention
in unstable situations. It has pervasive and long term health consequences on the population.
Women and their offspring are the worst hit by the iodine deficiency. Elevated serum TSH
(Thyroid Stimulating Hormone), enlargement of the thyroid (by 10–50%), and goiter are the most

Page 23 of 30
obvious consequences for the pregnant woman. Hypothyroidism causes infertility, pregnancy
related high blood pressure, increased first trimester abortions, and stillbirths; all are common in
iodine deficiency. Iodine is critical to the brain development and for later performance of children
in school. Iodine deficiency may impair the immune response which can lead to increased
childhood death due to infectious diseases. The most extreme health consequence is cretinism,
defined by severe mental retardation, associated defects (e.g. deaf mutism, spasticity, and stunted
growth) (52).
What can be done to forestall IDD?
The strategy to combat iodine deficiency costs very little with very high health impact. Available
data show that correction of iodine deficiency per se substantially decreases neonatal and infant
mortality. Correction of iodine deficiency during the second trimester has shown to improve brain
development. Correction at a later period did not improve brain development compared to
untreated individuals (50, 52). Despite the good results and efforts to eliminate IDD through USI,
there are still several points of concern:
The FNS should strengthen their surveillance system and monitor their IDD on regular
basis.
A more representative sampling frame should be used so that a better estimate of the
micronutrient status of the country is readily available.
The National Micronutrient Surveys should also be held timely to allow for effective
intervention.
4.3.2.2 Vitamin A Deficiency (VAD)
A 1999 survey indicates the prevalence of night blindness in pre-school age children (0.3%) and a
serum retinol concentration below 70µmol/l (35.8%). The prevalence of serum retinol
concentration below 70µmol/l among school age children and women are 18% and 7% respectively
(51). This shows the risk of inadequate Vitamin A status. The same survey reported the prevalence
of night blindness among school children (2.4%) and women of reproductive age (1.9%) indicating
VAD as they are above the WHO cut offs (>= 1%) (51). Zimbabwe has a Vitamin A capsule
distribution initiated through UNICEF funding in 2002 and was integrated to the Expanded
program on Immunisation (EPI).

Page 24 of 30
Who are more vulnerable and what are the consequences of VAD?
Vitamin A is a critical micronutrient for the health of children and pregnant women. For children,
lack of vitamin A causes severe visual impairment and blindness, and significantly increases the risk
of severe illness and death. Infant and child mortality occur from common childhood infections
(diarrheal disease and measles). For pregnant women in high-risk areas, vitamin A deficiency
occurs especially during the last trimester when demand by both the unborn child and the mother
is highest. The mother’s deficiency is demonstrated by the high prevalence of night blindness
during this period. Maternal VAD may contribute to mother to child transmission of HIV and
infant mortality.
What can be done to forestall VAD?
The World Bank has estimated that vitamin A supplementation was among the most cost-effective
health interventions available, at less than US$1 per disability-adjusted life year (53). According to
UNICEF, eradicating VAD could cut down child deaths due to measles by 50%. Crucial for
maternal and child survival, supplying adequate vitamin A in high-risk areas can significantly
reduce mortality.
There are several initiatives that exist in relation to Vitamin A but there are some concerns that
will need immediate action:
There is an urgent need to carry out a nationwide survey to assess the Vitamin A status in
preschool children and pregnant women in order to target interventions.
The vitamin A capsule supplementation could be continuously and regularly monitored by
the Food and Nutrition surveillance (FNS). FNS should consider taking a more
representative sampling frame to better estimate Vitamin A status of the country.
4.3.2.3 Iron Deficiency Anaemia (IDA)
The prevalence of anaemia in Zimbabwe has increased. The prevalence of anaemia with
haemoglobin levels <11g/dl and <12g/dl has increased both in pregnant and lactating women. The
haemoglobin levels <11g/dl shows a 3 fold increase among pre-school children in 10 years (Table 4).
About 9 % of the population showed depleted iron stores (<10µg/l). Iron deficiency anaemia is
therefore considered a public health problem.

Page 25 of 30
Table 4. Prevalence of anaemia among Pregnant, Lactating and Pre-school children
1997 2005-2006
11g/dl 12g/dl 11g/dl 12g/dl
Pregnant women 33 47
Pre-school children 17.6 58.3
Lactating women 29.6 36.3 Sources: Ministry of Health and Child Welfare (54), DHS 2005-06 (20)
Who are more vulnerable and what are the consequences of IDA?
The 1999 National Micronutrient Survey (51) shows that 31% of women of reproductive age were
anaemic and has increased to 37.3% (DHS 2005-06) (20). The women in Zimbabwe are
supplemented with iron during pregnancy. The iron supplementation is integrated with antenatal
and postnatal health programme. However DHS (1999) recorded less than 6% of pregnant women
had taken more than 90 iron tablets during their pregnancy.
The health consequences on children and women are tremendous. Anaemia (Hb<50 g/l) in children
is associated with an increased risk of death. Iron deficiency and anaemia are associated with poor
cognition and motor development, and anaemic infants may continue to have poorer school
achievement and behavioural problems in later childhood. Concerning women, there is clear
evidence that severe anaemia (Hb <47 g/l) increase maternal mortality related to pregnancy.
Chronic anaemia, on the other hand, is considered to be a frequent contributory factor in death as a
consequence of haemorrhage and infection. Iron-deficiency anaemia may contribute to increased
morbidity and mortality by increasing maternal susceptibility to infection.
What can be done to forestall IDA?
There is clear evidence that show that the iron deficiency anaemia could be prevented in women of
reproductive age by the supplementation of Weekly iron folate supplementation. This will
contribute positively to the iron stores of these women when they are pregnant and reducing the
impact of maternal and child mortality. Strategies to combat both iron deficiency and anaemia, and
to improve iron reserves and folate status in women of reproductive age should be integrated (52)
(55). Deworming, measures to prevent hookworm infections, the promotion of improved
bioavailable iron intake, as well as interventions to control other prevalent causes of anemia,
particularly malaria and other infections, and vitamin A deficiency need to be considered. The
Page 26 of 30
above important measures could improve the iron-folate status and will help reduce maternal and
neonatal mortality.
The iodine status of the population has improved since the introduction of iodised salt in 1991.
The Vitamin A status of the population need to be assessed.
The prevalence of anaemia has increased. Almost 60% of the pre-school children were considered
anaemic in 2005. It is important to determine the causes behind this increase - infectious (malaria)
or nutrition related to be able to address the problem.
5 Conclusion
The factors that have contributed to the negative health trend in Zimbabwe are interrelated and
the combination of them over time has led to the humanitarian crisis;
-The HIV/AIDS epidemic.
-The restructuring of the agricultural sector have had a negative impact on the food security.
-The severe economic decline has further strained the social and health service sectors which were
already stressed by the impact of the HIV/AIDS epidemic.
-The harmful resettlement policies/ “operations” of the government resulting in around 900.000
IDPs.
Recommendations;
-The situation of the around IDPs and newly resettled population must be recognized as a
vulnerable group as they are likely to have harder to recover from the crisis than the population as
whole.
-Follow the health situation closely as the full extent of the impact of the economic regressions on
the health infrastructure and the program might not been seen yet.
-There is a need of reliable health data. The scarcity of health data makes it harder to determine
both the current situation and the trends over time.
Page 27 of 30
References
1.OCHA online . [Online] [Cited: 15 01 2009.]
ochaonline.un.org/OchaLinkClick.aspx?link=ocha&docid=34948.
2. Food and Agricultural Organization (FAO) and World Food Programme (WFP) crop and food
supply assessment (CFSAM) 18 June 2008 .
3. Human development report 1990. United Nations Development Programme. New York : Oxford
University Press, 1990.
4. World Health Report 2006: Working together for health. World Health Organization. Geneva :
s.n., 2006.
5. Country Health System Fact Sheet 2006. WHO. [Online] [Cited: 01 04 2009.]
http://www.afro.who.int/home/countries/fact_sheets/zimbabwe.pdf.
6. Human Development Report 2007/2008 Country Fact Sheets Zimbabwe. United Nations
Development Programme. [Online] [Cited: 01 04 2009.]
http://hdrstats.undp.org/countries/country_fact_sheets/cty_fs_ZWE.html.
7. World Development Report 2007. World Bank. Washington DC : s.n., 2007.
8. Crane, MD. Seeking justice for Zimbabwe, A case for accountability against Robert Mugabe and
others 1981-2008. s.l. : Enough- the project to end genocide and crimes against humanity, 2008.
9. Emergency Events Database (EM-DAT). Centre for Research on the Epidemiology of Disasters.
[Online] http://www.emdat.be.
10. Zimbabwe Food Security issues paper. Forum for Food Security in Southern Africa. 2003.
11. Crop and food supply assessment mission to Zimbabwe. s.l. : FAO/WFP, 2007.
12. Interfais, The Food Aid Monitor, June 2008. WFP. [Online]
http://one.wfp.org/interfais/index2.htm#.
13. WFP. [Online] [Cited: 11 01 2009.] http://beta.wfp.org/stories/massive-relief-operation-starts-
zimbabwe.
14. RIACSO Regional Food security situation report: Zimbabwe -12 March 2009. s.l. : FAO,
FEWSNET, OCHA, Unicef, WFP Regional Inter-Agency Coordination Support Office, 2009.
15. The Many Faces of Displacement: IDPs in Zimbabwe . Geneva : Internal Displacement
Monitoring Centre, 2008.

Page 28 of 30
16. Zimbabwe. Internal Displacement Monitoring Centre. [Online] [Cited: 12 03 2009.]
http://www.internal-displacement.org/idmc/website/countries.nsf/(httpEnvelopes)/
E4565BEC1F871F9EC125748E004CA905?OpenDocument.
17. Responding to Zimbabwean Migration in South Africa– Evaluating Options. s.l. : Chalsty
Centre, University of the Witwatersrand, 2007.
18. Consolidated Appeal Process (CAP) 2009. 2008.
19. Reliefweb. [Online] [Cited: 16 02 2009.] http://www.reliefweb.int/rw/rwb.nsf/db900sid/LSGZ-
7F5CUS?OpenDocument.
20. Zimbabwe Demographic and Health Survey 2005-06. Calverton, Maryland : Central Statistical
Office and Macro International Inc., 2007.
21. United Nations Appeals. ReliefWeb . [Online] [Cited: 5 03 2009.]
http://www.reliefweb.int/appeals/index.html.
22. ECHO. [Online] [Cited: 01 02 2009.]
http://ec.europa.eu/echo/files/funding/decisions/2008/zimbabwe_01000_en.pdf.
23. Meeting of the Inter-Agency Group for Child Mortality Estimation (IGME). Childinfo. [Online]
2008. [Cited: 22 01 2008.] http://www.childinfo.org/files/IGME_Minutes_July2008.pdf.
24. Levels and Trends of Child Mortality in 2006: Estimates developed by the Inter-agency Group
for Child Mortality Estimation. UNICEF, WHO, The World Bank and UN Population Division.
New York : s.n., 2007.
25. Mortality Country Fact Sheet 2006. WHO. [Online] [Cited: 9 03 2009.]
http://www.who.int/whosis/mort/profiles/mort_afro_zwe_zimbabwe.pdf.
26. WHO Statistical Information System. World Health Organization. [Online] [Cited: 09 03 2009.]
http://www.who.int/whosis/en/.
27. Inter-agency Group for Child Mortality Estimation (IGME), Adjusting U5MR for AIDS.
Childinfo. [Online] 30 July 2008. http://www.childinfo.org/mortality_igme.html.
28. World malaria report 2008. s.l. : World Health Organization, 2008.
29. Evidence for HIV decline in Zimbabwe:a comprehensive review of the epidemiological data.
UNAIDS. Geneva : s.n., 2005.
30. When Did HIV Incidence Peak in Harare, Zimbabwe? Back-Calculation from Mortality
Statistics. Ben Lopman, Simon Gregson. s.l. : PLoS ONE, 2008, Vol. 3(3): e1711.

Page 29 of 30
31. Epidemiological Fact Sheet on HIV and AIDS, Core data on epidemiology and response. s.l. :
UNAIDS/WHO, 2008.
32. Zimbabwe Health Cluster bulletin No 16. s.l. : World Health Organization, 2009.
33. CHOLERA COUNTRY PROFILE: ZIMBABWE. World Health Organization. 2008.
34. Cholera in Zimbabwe: Epidemiological Bulletin Number 8 Week: 25 Jan 2009- 31 Jan 2009.
World Health Organization. 2009.
35. Cholera in Zimbabwe: Epidemiological Bulletin Number 19, Week 16 (11th-18th April 2009).
s.l. : World Health Organization, 2009.
36. Cholera in Zimbabwe: Epidemiological Bulletin Number 12, Week 9 (22-28 February 2009).
World Health Organization. 2009.
37. Cholera: prevention and control. WHO. [Online] [Cited: 20 January 2009.]
http://www.who.int/topics/cholera/control/en/index.html.
38. South African National Institute for Communicable Diseases (NICD) . [Online]
http://www.irinnews.org/report.aspx?ReportID=82570.
39. Cholera in Zimbabwe: Epidemiological Bulletin number 1, December 15 2008. World Health
Organization. 2008.
40. Zimbabwe - Disaster at a Glance. USAID Disaster Assistance. [Online] [Cited: 09 03 2009.]
http://www.usaid.gov/our_work/humanitarian_assistance/disaster_assistance/countries/zimbabwe/t
emplate/index.htm.
41. ICDDR,B's team reports from Zimbabwe. ICDDR,B. [Online] 28 January 2009.
http://www.icddrb.org/news/index.jsp?idDetails=168.
42. Beyond Cholera: Zimbabwe's worsening crisis. Médecins Sans Frontières. 2006.
43. Zimbabwe Demographic and Health Survey 1999. Calverton, Maryland : Central Statistical
Office and Macro International Inc, 2000.
44. Costumized statistical tables. Unicef. [Online] [Cited: 09 03 2009.]
http://www.unicef.org/statistics/index_step1.php.
45. Zimbabwe Demographic and Health Survey 1988 . Calverton, Maryland : Central Statistical
Office and Macro International Inc, 1989.
Page 30 of 30
46. Pilot Food and Nutrition Sentinel Site Surveillance Report. s.l. : Food and Nutrition Council,
2005.
47. Complex Emergency Database (CE-DAT). Centre for Research on Epidemiology of Disasters.
[Online] http://www.cedat.org.
48. Nutrition Sentinel Site Surveillance Summary July 2008. s.l. : Food and Nutrition Council, 2008.
49. FAOSTAT. [Online] FAO Statistics Division. [Cited: 30 01 2009.] http://faostat.fao.org/.
50. Status of Micronutrient nutrition in Zimbabwe: A review. Gadaga TH, Madzima R, Nembaware
N. s.l. : African Journal of Food Agriculture Nutrition and Development, 2009.
51. Ministry of Health and Child Welfare. National Micronutrient Survey report. 1999.
52. A new concept in the control of iron deficiency: community-based preventive supplementation
of at-risk groups by the weekly intake of iron supplements. Viteri, FE. s.l. : Biomedical and
Environmental Sciences, 1998, Vols. 11:46-60.
53. Sommer, A. Vitamin A Deficiency Disorders: Origins of the Problem and Approaches to Its
Control. Golden Rice. [Online] The Johns Hopkins University Bloomberg School of Public Health,
2001. http://www.biotech-info.net/disorders.html.
54. Survey on the prevalence of IDA in Zimbabwe. s.l. : Ministry of Health and Child Welfare,
1997.
55. Weekly iron–folic acid supplementation (WIFS) in women of reproductive age: its role in
promoting optimal maternal and child health. Position statement. Geneva : World Health
Organization, 2009.
56. Un Unicef emergency updates. Unicef. [Online]
http://www.unicef.org/Zimbabwe_DU_24Nov2005.pdf.
57. Sokwanele . [Online] [Cited: 15 01 2009.] http://www.sokwanele.com/map/electionviolence.