trends, opportunities and market factors
TRANSCRIPT

E. D. Hovee & Company, LLC
Economic & Development Services
CCIITTYY OOFF PPOORRTTLLAANNDD EECCOONNOOMMIICC OOPPPPOORRTTUUNNIITTIIEESS AANNAALLYYSSIISS::
SSeeccttiioonn 11.. TTrreennddss,, OOppppoorrttuunniittiieess && MMaarrkkeett FFaaccttoorrss
PPrreeppaarreedd ffoorr::
City of Portland Bureau of Planning & Sustainability
AAss aaddoopptteedd bbyy OOrrddiinnaannccee NNoo.. 118855665577 oonn OOccttoobbeerr 33,, 22001122

Adopted – October 2012
E.D. Hovee & Company, LLC for City of Portland:
Economic Opportunities Analysis Section1. Trends, Opportunities & Market Factors ii
EEXXEECCUUTTIIVVEE SSUUMMMMAARRYY
The EOA is an analysis of the 20-year supply and demand for employment development and land in the city. It is prepared according to State Administrative Rule OAR 660-09-0015 and consists of four sections:
1. Trends, Opportunities & Market Factors
2. Long Range Employment Forecast (Demand)
3. Buildable Land Inventory (Supply)
4. Policy Alternatives
This report is Section 1 and provides a review of national, regional, and local employment trends, opportunities and market factors. This report documents existing conditions and current trends in employment that will serve as a basis for the future employment forecast.
KEY FINDINGS
• National employment trends indicate a shift from manufacturing to service sectors and leading growth in health, education and professional and business services.
• This past decade has been a period of relatively slow job growth not only for Portland but for the metro region and nationally, but Portland’s job growth over the last business cycle has even lagged the region’s slow pace.
• A pivotal question is whether the city continues to capture a relatively small share of the job growth as has been the case since 2000 (5%), or reverts to a more robust pattern of job capture as was experienced in the previous two decades (25%). The answer to this question has significant ramifications not only for Portland’s economic vitality but for regional urban growth management.
• It is apparent that the “hot spot” locations where job growth is occurring within the City have shifted in recent years. The focus of added Central City job gains has shifted from the traditional downtown core toward adjacent areas in the River and Lloyd districts and the emerging incubators of the Central Eastside and Lower Albina.
• Industrial employment has been dropping at the same time the city is experiencing increases in industrial land development, cargo volumes and added value of manufacturing products.
• The EOA identifies nine categories of employment areas (locations, sites and types of space) referred to in the report as “employment geographies”. Among these, the institutional geography is experiencing the strongest job growth, followed by urban centers (primarily due to institutional growth) and then the Central City, neighborhood commercial and industrial geographies.

Adopted – October 2012
E.D. Hovee & Company, LLC for City of Portland:
Economic Opportunities Analysis Section1. Trends, Opportunities & Market Factors iii
NATIONAL TRENDS & FORECAST REVIEW
Following a period of relatively rapid growth in the 1980s, the rate of job growth slowed in the 1990s and further slowed in the early part of this decade. Job growth may pick up post 2010-2015 during a period of economic recovery, but is then projected to further slow to about 0.9% annual growth between 2025 and 2035.
Manufacturing is projected to decline from about 16% of all non-farm jobs in 1990 to between 6 and 7% by 2035. Service sector jobs have increased from about 67% of the nation’s non-farm job base in 1990 to 73% as of 2005. While all service sectors (except retail) are expected to add jobs, only professional services, education and health are projected to increase their share of the employment base over the next 25 years.
REGIONAL EMPLOYMENT TRENDS
The pattern of the 7-county Portland metro area (PMSA) employment has followed that of the nation, slowing considerably post-2000 to a rate of approximately 0.8% per year (to 2008). Metro has prepared an updated forecast of job growth to 2040 (with 2035 established as the pertinent growth target for the City of Portland). Metro’s regional forecast indicates a more robust job growth rate averaging 1.7% per year from 2010-2035, consistent with long-term trends. PMSA employment grew at an average annual rate of 2.1% from 1980 to 2008, spanning the last three business-cycle periods. Job growth rates are expected to range from 0.5% for manufacturing to 2.4% for professional services as well as education and health services in the 2010-2035 period.
PORTLAND EMPLOYMENT TRENDS
As of 2008, there were about 392,640 covered jobs in Portland, equivalent to 38% of the 1.02 million employment base of the 7-county PMSA. To understand long term growth trends, the EOA examined the periods 1980-2008 the 2000-2008 since they reflect the peak-to-peak periods of the recent business cycles – a timeframe that reduces the short-term business cycle distortions of the growth trend. From 1980 to 2008, Multnomah County added approximately 114,800 new jobs, resulting in a 1.1% average annual growth rate and a 25% capture rate of PMSA job growth. The city’s share of Multnomah County employment increased slightly in this period. After 2000, both region and city job growth slowed substantially.
From 2000-2008, Portland employment increased by approximately 3,120 jobs. This reflects a 5% capture rate of PMSA job growth in that period and an overall job growth rate averaging only about 0.1% per year. In comparison, statewide and PMSA job growth rates averaged 0.8% per year.
The 2000-2008 period also provides an insight into shifts between different employment sectors within the region. Manufacturing jobs declined by about 3.3% per year, with all industrial employment dropping at an annual rate of 2.6%. At the same time, the city experienced increases in industrial land development, freight volumes and added value of manufacturing products. Retail jobs also declined. Employment in education and health care sectors increased at

Adopted – October 2012
E.D. Hovee & Company, LLC for City of Portland:
Economic Opportunities Analysis Section1. Trends, Opportunities & Market Factors iv
a rate averaging 2.3% per year. The loss of the share of employment in the industrial sectors may be exaggerated due to 2001 changes in the way employment data is classified.
When looking at geographic subareas, Portland’s Central City commercial areas accounted for 27% of the city’s employment base as of 2008; regional and town centers (or urban centers) accounted for 5%; neighborhood commercial areas comprised another 18%; industrial districts represented 30%; and with institutional and residential areas each contributing 9-10%.
As noted, institutional areas experienced the city’s strongest job growth. This is followed, in order, by urban centers, the Central City and industrial areas (including close-in incubator districts). Overall, the number of jobs has declined in neighborhood commercial and residential areas of the city.
However, employment varies greatly within these broad geographic groupings. For example, in the Central City, employment declined somewhat in the downtown and South Waterfront subareas, while increasing for the River and Lloyd Districts. Within industrial areas, employment has declined within the Columbia Harbor while increasing for Columbia East of 82nd, the Dispersed Industrial areas, and for the Central City Industrial (or incubator) districts of Central Eastside and Lower Albina.
For urban centers, strong gains have been experienced for Hollywood, Gateway and Lents while St. Johns, Hillsdale and West Portland have experienced stable or declining employment. Of the neighborhood commercial areas, employment within dispersed commercial areas has increased while the job count has declined for commercial corridors and nodes.
DEMAND ANALYSIS ISSUES – FOCUS GROUP INPUT
In 2009, the City organized six focus groups involving 58 participants to provide input on the demand for different types of employment - central city office, close-in incubator, manufacturing and distribution, neighborhood commercial, transit oriented development/mixed use corridors, and campus institutional. The findings included the following:
• Recent trends- Despite relatively slow employment growth over the last several years, the mid-decade was relatively good for Portland’s major employment generators – at least up to the point of the economic downturn starting in 2007-08.
• Emerging trends - the overarching theme is “change”. There is a promising long-term outlook provided that the pending economic recovery proves sustainable with the view that the City and region respond to shape this change in ways that keep Portland competitive for added investment and employment. Specific types of change include:
� The Central City office market becoming more diverse with strong growth in lower cost incubator space.
� Industry concerns that skilled workforce development and the freight transportation system will not be able to keep pace with their changing needs.
� Neighborhood commercial corridors seeing more mixed-use development and high densities along major transit streets.
� Health care providers expect “tremendous” growth.

Adopted – October 2012
E.D. Hovee & Company, LLC for City of Portland:
Economic Opportunities Analysis Section1. Trends, Opportunities & Market Factors v
• Business space and location needs – Expected space needs are relatively diverse, and there seem to be growing opportunities for more mixed-use and denser commercial space versus more traditional manufacturing and distribution activity.
• Density and redevelopment – Opinions on the potential for greater density uses and redevelopment of existing uses ranged from extreme caution expressed by manufacturing and distribution focus group participants to bullish support from /mixed-use corridor participants. All the focus groups discussed the practical implications and means by which employment uses could grow up rather than out.
• Economic prosperity and creative vitality – There are different strategies for creating and maintaining prosperity. A key challenge is to harness these diverse interests into a coherent whole. For example:
� Emphasizing the Central City as a critical component to a healthy regional economy.
� Balancing goals of sustainability and job growth.
� Small neighborhood businesses as the primary economic engine.
• Public role in economic development – Participants argued that public strategies should emphasize a more business-friendly environment in general with more flexible regulations, more reliance on public-private partnerships, new business incentives, and less “picking winners” with targeted efforts.
DEMAND ANALYSIS ISSUES – DATA ASSESSMENT
Key findings:
• High rise office development – There is solid potential for additional mid to high-rise development primarily in the Central City but also elsewhere. Mid-high rise development outside the Central City has been limited to adaptive reuse in close-in areas and medical/health care facilities in urban centers such as Gateway and Hollywood. Proximity to retail and housing is increasingly important for future office development. The Central City reports a relatively slow overall job growth rate (0.3%) from 2000-08 – with strongest growth in the River and Lloyd Districts and some employment loss in the CBD.
• Incubator and manufacturing districts – These two types of space can contribute to future export-oriented job growth in Portland. The Columbia Harbor area remains strongly oriented to manufacturing, transportation and distribution but service employment has been the dominant source of job growth in recent years. The Central City incubator districts of Central Eastside and Lower Albina have a more diverse job base and have been experiencing job growth above the citywide rate – albeit concentrated in service sector activities together with information/design and construction. Overall, employment within industrial areas declined slightly.
• Neighborhood commercial districts – These dispersed concentrations of employment space have been a significant contributor to the city’s job base, but with somewhat surprising job loss indicated over the 2000-08 time period, primarily within residential zones and along commercial corridors. Commercial corridors (including those with

Adopted – October 2012
E.D. Hovee & Company, LLC for City of Portland:
Economic Opportunities Analysis Section1. Trends, Opportunities & Market Factors vi
TOD/mixed use potential) still account for 27% of jobs outside of the city’s urban centers and industrial areas, despite a net loss of nearly 5,200 jobs from 2000-08. Neighborhood-serving services and retail generally appear well distributed throughout the city; with just a few gaps.
• Institutional development –These sites include 7 colleges and 10 hospitals (each on 10+ acre sites) but excluding Portland State University and Adventist Medical Center which are included with in the Central City and Gateway employment geographies respectively. These 17 institutions together accounted for about 35,200 in-city jobs as of 2008 and represent the city’s fastest growing employment geography.
LOCAL SECTOR SPECIALIZATION
Two related analyses were conducted that are relevant to this EOA. Metro evaluated the region’s comparative advantage in employment relative to the nation, finding that this region has a comparative advantage in manufacturing despite net job losses. Overall, non-manufacturing sectors show little to any substantial comparative advantage relative to the rest of the nation. However, Metro is projecting increased regional capture of national employment for finance activities, education and health care, and some management and personal services.
ECONorthwest also evaluated the City of Portland comparative advantage based on industry value added rather than employment. This analysis corroborates the results of the regional employment-base analysis. Both analyses indicate that Portland’s comparative advantages are higher in the manufacturing sectors. Although, these sectors make up smaller shares of total economic activity, they generate larger overall economic impacts in value added and export value added, particularly professional services, wholesale trade, and management of companies. Consequently the ECONorthwest analysis indicates that the manufacturing sector’s output may be insufficient as an exclusive engine for continued economic growth into the future.
EOA IMPLICATIONS
Key implications for subsequent EOA work tasks include:
• A recognition that this past decade has been a period of relatively slow job growth not only for Portland but for the metro region and nationally. Despite an economic downturn experienced just after 2000 followed by a major recession at end of the decade, Metro is projecting that the nation and region should expect to return to a more normalized pattern of job recovery and stronger growth over the long-term horizon of next 25 years.
• For Portland, a pivotal question is whether the city continues to experience a relatively small share of the job growth that has occurred as has been the case since 2000, or reverts to a more robust pattern of greater in-city and county job capture as was experienced in the previous two decades. The answer to this question has significant ramifications not only for Portland’s economic vitality but for regional urban growth management.
• Finally, it is apparent that the “hot spot” locations where job growth is occurring within the City have shifted in recent years. The focus of added Central City job gains has shifted from the traditional downtown core toward adjacent areas in the River and Lloyd commercial / mixed use districts and the emerging incubators of the Central Eastside and

Adopted – October 2012
E.D. Hovee & Company, LLC for City of Portland:
Economic Opportunities Analysis Section1. Trends, Opportunities & Market Factors vii
Lower Albina. Similar shifts are occurring within and between the City’s industrial, urban center and neighborhood commercial areas. In numerical terms, by far the strongest growth has been in Portland’s institutions.

Adopted – October 2012
E.D. Hovee & Company, LLC for City of Portland:
Economic Opportunities Analysis Section1. Trends, Opportunities & Market Factors viii
Table of Contents
EEXXEECCUUTTIIVVEE SSUUMMMMAARRYY ii
II.. IINNTTRROODDUUCCTTIIOONN 11
IIII.. NNAATTIIOONNAALL TTRREENNDDSS && FFOORREECCAASSTT RREEVVIIEEWW 12
IIIIII.. PPOORRTTLLAANNDD EEMMPPLLOOYYMMEENNTT TTRREENNDDSS 19
IIVV.. DDEEMMAANNDD AANNAALLYYSSIISS IISSSSUUEESS –– FFOOCCUUSS GGRROOUUPP IINNPPUUTT 31
VV.. DDEEMMAANNDD AANNAALLYYSSIISS IISSSSUUEESS –– DDAATTAA AASSSSEESSSSMMEENNTT 42
VVII.. LLOOCCAALL SSEECCTTOORR SSPPEECCIIAALLIIZZAATTIIOONNSS 72
VVIIII.. IINNDDUUSSTTRRIIAALL LLAANNDD DDEEMMAANNDD AANNAALLYYSSIISS 76
VVIIIIII.. EECCOONNOOMMIICC MMUULLTTIIPPLLIIEERR AANNAALLYYSSIISS 79
IIXX.. LLAANNDD EEFFFFIICCIIEENNCCYY AANNAALLYYSSIISS 81
XX.. MMAARRIINNEE CCAARRGGOO FFOORREECCAASSTT 83
XXII.. EEOOAA IIMMPPLLIICCAATTIIOONNSS 86
AAPPPPEENNDDIIXX AA.. FFOOCCUUSS GGRROOUUPP PPAARRTTIICCIIPPAANNTTSS 87
AAPPPPEENNDDIIXX BB.. SSUUPPPPLLEEMMEENNTTAALL DDAATTAA TTAABBLLEESS 89
AAPPPPEENNDDIIXX CC.. PPoorrttllaanndd HHaarrbboorr IInndduussttrriiaall LLaanndd SSuuppppllyy AAnnaallyyssiiss 92

Adopted – October 2012
E.D. Hovee & Company, LLC for City of Portland:
Economic Opportunities Analysis Section1. Trends, Opportunities & Market Factors ix
Table of Figures
Figure 1. U.S. Non-Farm Employment Growth Rates (1980-2035) 12
Figure 2. Forecasted U.S. Job Growth Rates (1990-2035) 14
Figure 3. Employment Growth Rates – U.S., Oregon & Portland PMSA (1980-2005) 15
Figure 4. Portland PMSA Manufacturing Job Trend (2000-2007) 16
Figure 5. Portland PMSA Manufacturing Job Surge (2003-2007) 17
Figure 6. Portland PMSA Employment Forecast Range (to 2035) 18
Figure 7. Multnomah County Capture Rate of Regional Job Growth (1980-2008) 19
Figure 8. Employment Geographies 25
Figure 9. Portland Geographic Subareas 26
Figure 10. Urban Centers & Institutions Employment (2000-2008) 29
Figure 11. Industrial Areas & Neighborhood Employment (2000-2008) 30
Figure 12. Focus Group Themes by Demand Topics 32
Figure 13. Non-Central City Office Development 4+ Stories (post 1990) 43
Figure 14. Centers Office Development 4+ Stories 44
Figure 15. Citywide Office Development Since 2000 45
Figure 16. Existing Development as a Percent of Zoned Capacity 47
Figure 17. Sectoral Trends within Urban Geographies 50
Figure 18. Industrial Areas Sector Changes (2000-2008) 53
Figure 19. Recent Industrial Development Trends (2003-2008) 54
Figure 20. Portland-Vancouver MSA Gross Domestic Product Trends (2001-2006) 56
Figure 21. City of Portland Leakage by Store Type (2008) 60
Figure 22. Neighborhood Serving Retail Locations 62
Figure 23. Non-Industrial Business District Capture Rates & Sales Volumes (2008) 63
Figure 24. Business Association Supply & Demand (2008) 64
Figure 25. Recent Retail Development Trends (2003-2008) 66
Figure 26. Institutional Employment Trends (2000-2008) 69
Figure 27. Changing Portland Competitive Advantage – All Industries (1990-2035) 73
Figure 28. Value Added Portland Clusters (2007) 75
Figure 29. Industrial Land Demand Comparison with Past Trends 76
Figure 30. Portland-Vancouver PMSA Gross Domestic Product Trends (01-06) 78

Adopted – October 2012
E.D. Hovee & Company, LLC for City of Portland:
Economic Opportunities Analysis Section1. Trends, Opportunities & Market Factors x
Figure 31. Economic Multipliers By Building Type 79
Figure 32. Land Efficiency Analysis (Net Added Building Space 1999-2011) 82
Figure 33. 2040 Portland Harbor Cargo Volume Forecast 84
Figure 34. 2040 Portland Harbor Land Need by Cargo Forecast Scenarios (acres) 85
Figure 35. Focus Group Participants 87
Figure 36. U.S. Non-Farm Employment Trend & Projection (1980-2035) 90
Figure 37. Portland Metro Location Quotients Relative to U.S. (1990-2035) 91

Adopted – October 2012
E.D. Hovee & Company, LLC for City of Portland:
Economic Opportunities Analysis Section 1 Trends, Opportunities & Market Factors 11
II.. IINNTTRROODDUUCCTTIIOONN
The City of Portland is required to complete an Economic Opportunities Analysis (EOA) to comply with Oregon Statewide Planning Goal 9 and supporting administrative rules. State statutes also require the City’s Comprehensive Plan to be coordinated with Metro’s regional population and employment forecasts and allocations. The EOA rules also allow Portland the opportunity to shape its plan in a way that fits not only state and regional goals but also locally determined priorities and choices.
The intent of this EOA is to address both current and emerging market trends while at the same time addressing distinctive state, regional and City-defined policy objectives for employment and associated land development requirements. The economic analysis also addresses short-term employment demand and resulting land supply needs consistent with Goal 9 and reconciles buildable land supply with demand over a longer term time horizon to 2035.
APPROACH
This report covers economic trends, opportunities and market factors, including an assessment of local sector specializations, and submarket/real estate analysis.
The analysis has drawn from a review of quantitative economic data for the U.S., state of Oregon, and Portland metro region as well as data specific to the City of Portland. The analysis also considers qualitative information affecting future opportunities and market factors, including results of six focus groups organized around demand analysis issue topics.1
Subsequent EOA reports are informed by the results of this initial trends analysis.
ORGANIZATION OF TRENDS, OPPORTUNITIES, AND MARKET FACTORS ANALYSIS
The remainder of this Task 1 report is organized to cover the following topics:
• National Trends & Forecast Review
• Portland Employment Trends
• Demand Analysis Issue – Focus Group Input
• Demand Analysis Issues – Data Assessment
• Local Sector Specializations
• Intensification Analysis
• Multiplier Analysis
• EOA Implications
1 Information in this report has been drawn from sources generally deemed to be reliable. However, the accuracy
of information from third party sources is not guaranteed, and is subject to change.
The observations and findings contained in this report are those of the authors. They should not be construed as representing the opinion of any other party prior to their express approval, whether in whole or part.

Adopted – October 2012
E.D. Hovee & Company, LLC for City of Portland:
Economic Opportunities Analysis Section 1 Trends, Opportunities & Market Factors 12
IIII.. NNAATTIIOONNAALL TTRREENNDDSS && FFOORREECCAASSTT RREEVVIIEEWW
Consistent with Oregon Administrative Rules (OAR 660), Portland’s EOA is set within the context of nationwide trends and projected future employment. Recent and forecast conditions are considered first for total employment, then with more detailed discussion of employment by sector.
NATIONAL EMPLOYMENT TREND & FORECAST
As of 2005, the U.S. had an estimated 133.7 million non-farm jobs – an increase of 48% over the 1980 nationwide job count of 90.5 million:
• Over the 25 year period of 1980-2005, employment across the U.S. increased at an average annual rate of 1.6% per year, reflecting a particularly rapid 1.9% rate of job growth during the 1980s. The 1980-90 time period also coincided with entry of a large baby boom cohort into the job market.
• Since 1990, job growth nationally has slowed to a more modest 1.3% annual rate from 1990-2005. During the first half of this decade (2000-2005), job growth was even more modest averaging 0.3% per year, reflecting a post-2001 period of economic contraction followed by a slow recovery.
• Looking forward, Metro’s regional forecast projects national job growth to remain at a similarly anemic pace through 2010 (reflecting rapid run-up to 2007 followed by the current recession). The national forecast predicts an economic recovery period for 2010-2015 with relatively strong anticipated job growth (1.5-1.6% per year) that declines over time to a rate of about 0.9% by 2025-2035. At these rates of projected employment growth, the U.S. would have about 173.5 million non-farm jobs by 2035, an increase of just under 40 million jobs (or 30% gain) compared to 2005 conditions.
Figure 1. U.S. Non-Farm Employment Growth Rates (1980-2035)
0.0%
0.5%
1.0%
1.5%
2.0%
2.5%
1980-85 1985-90 1990-95 1995-00 2000-05 2005-10 2010-15 2015-20 2020-25 2025-30 2030-35
% C
ha
ng
e (
av
g a
nn
ua
l)
Source: Global Insight, 2008 QR US Long-Term Outlook, as compiled by Metro.

Adopted – October 2012
E.D. Hovee & Company, LLC for City of Portland:
Economic Opportunities Analysis Section 1 Trends, Opportunities & Market Factors 13
Employment Sector Growth
When viewed by major employment sector, the most noteworthy change has been the continued shift of the nation’s economy from an industrial to service-related employment. This trend is expected to continue through 2035. However, several caveats are noted related to this shift.
Past employment sector shifts are difficult to quantify due to a 2001 change in how industries are classified in (from the Standard Industrial Classification system to the North American Industrial Classification System). The new NAICS system created two new sectors, management of companies and information, which are considered services but which encompass firms (or portions of firms) previously classified as industrial. While employment data from the year 2000 has been converted to NAICS (by the Oregon Employment Department), this conversion was not perfect. Some portion of the reported employment shift away from manufacturing is attributable to this change in job classification, although the exact portion is unknown.
Also of note is that while the focus of this trends assessment is employment, manufacturing has in many regions held a steadily increasing share of GDP. At least since 2000, there appears to be a contradictory relationship between industry output and industry employment. Consequently, job growth represents only one lens through which to assess an industry’s economic contribution. Other measures of economic activity are addressed later in this report.
That said, the following changes are reported for job trends within the manufacturing sector nationwide:
Manufacturing:
• Nationally, manufacturing has declined from just over 16% of all non-farm jobs in 1990 to 10-11% of non-farm jobs in 2005 and is projected to decline to between 6-7% of employment by 2035.
• Manufacturing has been declining not just as a share of the total but also in terms of numbers of jobs – from close to 18 million jobs in 1990 to just over 14 million in 2005 and to a projected 11 million by 2035.
• Every major manufacturing category except lumber experienced job losses between 1990 and 2005, and all sectors are forecast for job loss through 2035. Durable goods manufacturing, which tends to be more capital intensive, has experienced less rapid job loss than non-durables.
Other Industrial-Related Employment:
• With the exception of natural resources, all other industrial-related sectors experienced job growth from 1990-2005 and are projected for continued job growth through 2035. These other sectors include natural resources, construction, wholesale trade, transportation/warehousing/utilities (TWV), and information.2
2 Information is a new sector defined by NAICS that includes some previous industrially related SICs such as
printing combined with more service sector related functions such as internet and software.

Adopted – October 2012
E.D. Hovee & Company, LLC for City of Portland:
Economic Opportunities Analysis Section 1 Trends, Opportunities & Market Factors 14
• Between 1990 and 2005 the other industrial-related sectors declined slightly in total employment share, from 16.6% to 16.2%, as growth was below rates experienced in non-industrial (service) sectors. However, through 2035 the non-manufacturing industrial sectors are projected to increase their share of the nation’s employment to 17.4% by 2035.
• From 1990-2005, the fastest growing industrial sector was construction, with jobs increasing an average of 2.5% per year. From 2005-2035, the biggest gainer is forecast for jobs in transportation/warehousing/utilities (at 1.3% annually), followed closely by the construction and information sectors.
Service Sector Employment:
• Service sector jobs have increased rapidly since 1990. The most rapid growth rates are reported for education and health (up by 3.1% per year) and professional services (3%). The slowest growing service job sectors have been retail (up by just 1.0% per year) and government (1.1%). Finance, leisure and hospitality, and other services have increased at rates of 1.4%, 2.2% and 1.6% respectively.
• Overall, these service sectors have increased from about two-thirds (67%) of the nation’s non-farm employment in 1990 to 73% as of 2005. The largest single service-related sector is government at 16.3% as of 2005.
Figure 2. Forecasted U.S. Job Growth Rates (1990-2035)
1990-2005
-2.0%
-1.0%
0.0%
1.0%
2.0%
3.0%
4.0%
Tota
l No
n-F
arm
Jo
bs
Ma
nu
fac
turin
g
D
ura
ble
Go
od
s
N
on
-Du
rab
les
Na
tura
l Re
sou
rce
s
C
on
stru
ctio
n
Wh
ole
sale
Tra
de
R
eta
il Tr
ad
e
TWU
Info
rma
tion
Fi
na
nc
ial A
cti
vitie
s
Pro
fess
ion
al B
usi
ne
ss
Ed
u. &
He
alt
h
Le
isu
re &
Ho
spita
lity
O
the
r Se
rvic
es
G
ov
t., C
ivili
an
, to
tal
2005-2035
-2.0%
-1.0%
0.0%
1.0%
2.0%
3.0%
4.0%
Tota
l No
n-F
arm
Jo
bs
Ma
nufa
ctu
ring
Du
rab
le G
oo
ds
No
n-D
ura
ble
s
N
atu
ral R
eso
urc
es
Co
nst
ruc
tion
W
ho
lesa
le T
rad
e
Re
tail
Tra
de
TWU
Info
rma
tion
Fi
na
nc
ial A
cti
vitie
s
Pro
fess
ion
al B
usi
ne
ss
Ed
u. &
He
alt
h
Le
isu
re &
Ho
spita
lity
O
the
r Se
rvic
es
G
ov
t., C
ivili
an
, to
tal
Source: Global Insight, 2008 QR US Long-Term Outlook, as compiled
by Metro.

Adopted – October 2012
E.D. Hovee & Company, LLC for City of Portland:
Economic Opportunities Analysis Section 1 Trends, Opportunities & Market Factors 15
• While all service sectors (except retail) are expected to add jobs, only professional services, education and health are projected to increase their share of the employment base over the next 25 years. Declining shares (slower growth) are projected for retail trade, financial activities, leisure and hospitality, and government.
STATEWIDE & REGIONAL EMPLOYMENT CONTEXT
Statewide & Metro Area Employment Growth Trends
Over a 25-year period extending from 1980-2005, patterns of employment growth for the nation, Oregon, and the Portland metro area have been similar. Exceptions include:
• In the first half of the 1980s, Oregon and the Portland metro area were harder hit than the nation during a period of overall economic slowdown. In the latter half of the decade, this pattern was reversed as employment growth rates accelerated, exceeding 4% per year both statewide and for the metro region.
Figure 3. Employment Growth Rates – U.S., Oregon & Portland PMSA (1980-2005)
-1.0%
0.0%
1.0%
2.0%
3.0%
4.0%
5.0%
1980-85 1985-90 1990-95 1995-00 2000-05
US Oregon PMSA
Source: Metro, Oregon Employment Department, and E. D. Hovee & Company, LLC.
• This pattern of strong employment growth statewide and regionally continued (though at somewhat slower rates) through the 1990s, with the nation nearly catching up to the state and region in the latter half of that decade.
• In the 2000s, employment stagnated – nationally, statewide and regionally – through a recession with a slow job recovery. While at fairly modest levels, employment growth statewide exceeded that of the PMSA, the only such 5-year period since 1980.

Adopted – October 2012
E.D. Hovee & Company, LLC for City of Portland:
Economic Opportunities Analysis Section 1 Trends, Opportunities & Market Factors 16
Manufacturing Focus?
Manufacturing often receives particular attention because of its historic role as a pivotal traded sector and as source of relatively high wage jobs, both nationally and in this region. As a share of PMSA employment, manufacturing has not reversed its declining share of the region’s job base – at best holding its own from 2003-2005 at 12.6% of total non-farm jobs (Figure 4). The experience of the last several years offers the hint of a possible opportunity for slowing the now decades long slide in U.S. manufacturing. This is illustrated by a year-to-year review of manufacturing employment in the Portland metro area from 2000-07. This period is chosen as it essentially extends from the recession just after 2000 back to a subsequent peak in 2006.
As indicated by the following graph, the metro region experienced a sharp drop in manufacturing jobs during the economic recession of 2001-2003. This was then followed by a post-recovery increase of about 7% back to a peak year of 2006. This recovery nationally was aided by a weak dollar encouraging added exports, especially for durable goods manufacturing.
Figure 4. Portland PMSA Manufacturing Job Trend (2000-2007)
0.0%
2.0%
4.0%
6.0%
8.0%
10.0%
12.0%
14.0%
16.0%
2000 2001 2002 2003 2004 2005 2006 2007
% o
f PM
SA E
mp
loy
me
nt
0
20
40
60
80
100
120
140
160
# o
f Jo
bs
(x 1
,00
0)
% of Jobs # of Jobs
Source: Metro.
A more detailed look at the 2003-2007 period shows the differences in this manufacturing employment resurgence by sector. While there was considerable employment contraction in the 2000-2003 time period, the strongest post-2003 gains were indicated for transportation equipment and primary/fabricated metals, followed by more modest gains for electronics and food processing.

Adopted – October 2012
E.D. Hovee & Company, LLC for City of Portland:
Economic Opportunities Analysis Section 1 Trends, Opportunities & Market Factors 17
Figure 5. Portland PMSA Manufacturing Job Surge (2003-2007)
-15.0%
-10.0%
-5.0%
0.0%
5.0%
10.0%
15.0%
20.0%
25.0%
Wood
Products
Primary
Metals
Fab. Metals Machinery Electronics Transp.
Equip.
Other
Durables
Food
Processing
Paper Other Non-
Dur.
Source: Metro.
A key question with economic recovery in the years ahead is whether this resurgence proves to be temporary. Alternatively the question is whether there are opportunities for continued longer lasting competitive gains for durable goods as with metals, transportation equipment and/or electronics.
With non-durables, a question is whether the recent observed growth in regional food processing can be sustained. Opportunities may be linked to greater emphasis on consuming products grown and manufactured closer to home.
Metro projects that manufacturing’s share of the region’s total job base will be 8.3% of total employment by 2035. The total number of manufacturing jobs is projected to stabilize at between 120,000 and 125,000 between over the 2020-35 time period.
Metro Area Employment Growth Forecast
Looking to the future, Metro developed a range of low, moderate and high growth employment forecast alternatives to the year 2040 and has selected an official forecast slightly less than the moderate forecast. The following chart displays trends from 1980 to 2005, and then resulting revised forecast to 2035 (the forecast period for this EOA).

Adopted – October 2012
E.D. Hovee & Company, LLC for City of Portland:
Economic Opportunities Analysis Section 1 Trends, Opportunities & Market Factors 18
Figure 6. Portland PMSA Employment Forecast Range (to 2035)
0
200
400
600
800
1,000
1,200
1,400
1,600
1980 1985 1990 1995 2000 2005 2010 2015 2020 2025 2030 2035
(x 1
,00
0)
Source: Metro. Data for 2010 reflect BLS actual employment, with subsequent years as Metro forecast results.
With the baseline forecast, Portland PMSA non-farm employment would increase from recession dampened figure of less than 1 million jobs in 2010 to nearly 1.5 million in 2035, a gain of over 520,000 (for 54% job growth) with an average annual growth rate in the range of 1.7% per year over the 2010-2035 time period.

Adopted – October 2012
E.D. Hovee & Company, LLC for City of Portland:
Economic Opportunities Analysis Section 1 Trends, Opportunities & Market Factors 19
IIIIII.. PPOORRTTLLAANNDD EEMMPPLLOOYYMMEENNTT TTRREENNDDSS
This section analyzes recent (2000-2008) City of Portland employment trends within the national and regional context. While some citywide changes parallel those of the nation and/or region, it is clear that Portland’s position as the largest city in the region and state has created distinctive market niches as well as future opportunities and limitations.
Topics covered by this initial data review are:
• Citywide Employment Trends
• Detailed Development & Employment Trends:
� Employment by City Subarea
� Employment & Development by Expansion Type
� Development by Valuation, Density & Site Type
Geographic and sector employment trends will be used to inform the distribution of projected employment in later tasks for this EOA.
CITY AND COUNTY EMPLOYMENT TRENDS
The long-term employment trends analysis is based on county data because reliable, comparable city data is not available before 2000, due to changes in data reporting and major city annexations in the 1980s and 1990s. Figure 7 shows that the short-term (2000-08) job losses are inconsistent with long-term trends.
Figure 7. Multnomah County Capture Rate of Regional Job Growth (1980-2008)
Multnomah County Capture Rate of MSA Job Growth
28%31%
-6%
25%
-10%
-5%
0%
5%
10%
15%
20%
25%
30%
35%
1980s 1990s 2000-08 1980-2008
Source: Bureau of Planning and Sustainability from Oregon Employment Department QCEW data.

Adopted – October 2012
E.D. Hovee & Company, LLC for City of Portland:
Economic Opportunities Analysis Section 1 Trends, Opportunities & Market Factors 20
Despite slower job growth after 2000, long-term employment trends in Multnomah County reveal a general linear growth pattern, as shown in Figure 8. Given this linear pattern, a commonly used forecasting method is a linear trendline, which is a best-fit straight line through a series of historical data points (regression analysis). The trendline shown in Figure 8 is based on 1979-2008 annual employment data, representing county peak-to-peak data periods of the last three business cycles. A trendline is most reliable when its R-squared value is at or near 1, and this trendline results in a generally close-fit R-squared value of .85. The years when actual employment levels varied most from the trendline resulted particularly from the employment fluctuations of short-term business cycles.
Figure 8. Multnomah County Employment Trendline, 1979-2035
Multnomah County Employment, 1979-2008
Peak-to-Peak Trend and Linear Trendline,
2010-2035 Growth Estimate = 184,000 New Jobs
y = 5379.3x + 304041
R2 = 0.8522
0
100,000
200,000
300,000
400,000
500,000
600,000
700,000
1979
1983
1987
1991
1995
1999
2003
2007
2011
2015
2019
2023
2027
2031
2035
Covered Employment Linear (Covered Employment)
Source: Bureau of Planning and Sustainability from Oregon Employment Department QCEW data.
If Multnomah County’s long-term linear job growth pattern continues along this trendline, 184,000 new countywide jobs will be added between 2010 and 2035, which reflects a 34% county capture rate of new PMSA Covered Employment in this forecast period. In 2008, the City of Portland accounted for 87% of Multnomah County employment, up from 86% in 2000. Assuming a slightly declining city share of county jobs over time, estimated at 82% of new Multnomah County jobs from 2010 to 2035, the trendline in Figure 8 indicates that 151,000 new Portland jobs will be added in the forecast period. This growth level would represent a 28% city capture rate of PMSA job growth to 2035.
Employment trends are also linked to population trends at the regional level, but Multnomah County has long been a job center in the region and has substantially more jobs than resident workers, such as shown on the following graph.

Adopted – October 2012
E.D. Hovee & Company, LLC for City of Portland:
Economic Opportunities Analysis Section 1 Trends, Opportunities & Market Factors 21
Figure 9. Employment-to-Population Job Ratios
Source: Oregon Regional Economic Analysis Project from U.S. Bureau of Labor Statistics data.
Geocoded (mapped) employment data is available for 2000 and 2008, allowing a review both of citywide and sub-city employment trends. This employment dataset is based on jobs covered by unemployment insurance, which generally equates to an estimated 85% of the total workforce.
2000-08 Employment by Sectors
Figure 10 reports employment at the detailed sector level with the 2008 distribution and net change both in terms of numerical change and annual average growth rate (AAGR).
Throughout the remainder of the report, employment sectors are aggregated to broader categories to provide a more manageable amount of information.

Adopted – October 2012
E.D. Hovee & Company, LLC for City of Portland:
Economic Opportunities Analysis Section 1 Trends, Opportunities & Market Factors 22
Figure 10. Portland Citywide Employment (2000-2008)
2008
2000 2008 Distrib. Net AAGR11 Agriculture 180 210 0% 30 1.9%
22 Utilities 3,960 2,580 1% (1,380) -5.2%
23 Construction 19,840 18,380 5% (1,460) -1.0%
31 Man: food, textile, apparel 5,990 5,800 1% (190) -0.4%
32 Man: wood, petrol, chemicals 9,120 6,740 2% (2,380) -3.7%
33 Man: metal, machine, computer 24,670 17,800 5% (6,870) -4.0%
Manufacturing subtotal 39,780 30,340 8% (9,440) -3.3%
42 Wholesale Trade 25,510 20,380 5% (5,130) -2.8%
48 Transportation 19,770 15,650 4% (4,120) -2.9%
49 Transport & Warehousing 9,160 8,010 2% (1,150) -1.7%
Industrial subtotal (21-42, 48,49) 118,200 95,550 24% (22,650) -2.6%
44 Retail 22,130 22,200 6% 70 0.0%
45 Retail: Dept, misc. 14,940 10,830 3% (4,110) -3.9%
Retail subtotal (44,45) 37,070 33,030 8% (4,040) -1.4%
51 Information 12,350 11,570 3% (780) -0.8%
52 Finance & Insurance 21,390 18,810 5% (2,580) -1.6%
53 Real Estate 9,870 8,580 2% (1,290) -1.7%
54 Prof., Scientific, Tech Services 25,530 27,200 7% 1,670 0.8%
55 Management 6,820 14,590 4% 7,770 10.0%
56 Admin Support, Waste 14,020 21,770 6% 7,750 5.7%
61 Education 29,640 35,510 9% 5,870 2.3%
62 Health & Social Asst. 40,960 49,150 13% 8,190 2.3%
71 Arts, Enter., Recreation 6,200 6,280 2% 80 0.2%
72 Accommodation & Food 30,410 35,770 9% 5,360 2.0%
81 Other Services 17,190 17,210 4% 20 0.0%
Service subtotal (51-81) 214,380 246,440 63% 32,060 1.8%
Public 92 Public Administration 17,110 17,500 4% 390 0.3%
Other 99 Unclassified? 2,760 120 0% (2,640) -32.4%
Total 389,520 392,640 100% 3,120 0.1%
Se
rvic
es
Change
NAICS
Re
tail
Ind
ust
ria
l
Source: Oregon Employment Department, E. D. Hovee & Company, LLC. Employment in all categories has been rounded to the nearest 10 employees.
Observations
The 2000-2008 time period corresponds to the most recent economic cycle of the region and nation, representing a peak-to-peak period in Multnomah County employment. This has been a period of economic downturn early in the decade, followed by rebounding job growth through mid-decade and then substantial job losses with the recession after 2008.
Consequently, for the entire 2000-08 time period, job growth was experienced at relatively low rates for the city as well as for the state and nation, certainly in comparison with the prior decade of the 1990s:
Adopted – October 2012
E.D. Hovee & Company, LLC for City of Portland:
Economic Opportunities Analysis Section 1 Trends, Opportunities & Market Factors 23
• Within the City of Portland, post-2000 job growth has occurred at a rate of just 0.1% annually. Oregon’s statewide growth rate post-2000 was at 0.8% per year, comparable to a similar growth rate in both non-farm and covered employment for the 7-county metro area (PMSA) over the same time period.
• Over this time period, Portland captured only about 5% of the net job growth in the region, a pattern of performance better than that of Multnomah County but well below city and county rates of job growth capture in prior decades.
• As of 2008, the City of Portland reported about 392,640 covered jobs, representing 38% of the 1.02 million employment base of the 7-county PMSA. This represents a relatively nominal increase of about 3,120 jobs over a six year period in Portland. Job declines are reported across multiple sectors, including every industrial sector for which data is provided.
• Taken together, the industrial sectors report job declines averaging 2.6% per year over the eight year period (for a combined loss of 22,650 jobs), despite a brief resurgence experienced mid-decade. There was a somewhat more rapid shift away from manufacturing employment – a subset of the overall industrial sector – of 3.3% annually, equating to a total loss of 9,440 manufacturing jobs over the 2000-2008 period. It is notable, however, that the Portland region lost a smaller share of its manufacturing jobs that the nation as a whole did. In addition, the value of manufacturing output rose by more than $9 billion for the 7-county region (Figure 23). The region's manufacturing sector is growing, but is becoming less labor intensive.
• Over this eight year period, retail employment in Portland changed little – with a nominal gain of about 70 jobs.
• The growth sectors – strong enough to more than offset industrial job losses – occurred across service sectors. The sector showing the strongest growth was health and social assistance (up by 8,190 jobs), followed by management, administrative support and waste management, education, accommodation and food, and professional/scientific/technical services – with minor gains noted for arts, entertainment and recreation.
• A major portion of the growth occurring within the administrative support sector has been for temporary employment agencies. While reported with this NAICS job classification, temporary employees actually may be placed in any sector and also likely serve to offset at least some portion of the reported industrial employment decline. Also noted is that much of the growth in the management sector is likely related to business sector reclassifications with new NAICS coding coming into place between 2000 and 2008.
• Not all service sectors experienced employment growth over the past decade. Loss of 2,580 jobs is indicated through 2008 for finance and insurance, with job losses also noted for the real estate and information sectors. 3
3 The Information sector was established with the transition from the Standard Industrial Classification (SIC) to
North American Industry Classification System (NAICS) from what were a mix of industrial and service components.

Adopted – October 2012
E.D. Hovee & Company, LLC for City of Portland:
Economic Opportunities Analysis Section 1 Trends, Opportunities & Market Factors 24
Data Limitations
While the Quarterly Census of Employment and Wages or QCEW (formerly known as ES 202) data is the most comprehensive and timely source available, there are at least two important data limitations, as they may affect the portrayal of job change over time: 4
1) Employment has been parceled out to sites for employers with multiple sites, and this process may be more or less accurate in one of the two years for which data is drawn (with a tendency towards greater accuracy in more recent years).
2) Inconsistent NAICS classification by individual firms within the two comparison years, as industry classification largely represents self-reporting by firms to the Oregon Employment Department (OED).
A second set of issues related to changing employment classification is perhaps of greater concern:
• National changeover from the Standard Industrial Classification (SIC) to North American Industry Classification System (NAICS) occurred between 2000 and 2008, leading to new classifications and an inexact bridge between the two systems.
• The net result of this change in classification systems has been to accentuate a reported shift away from the industrial sectors, as the newly added service sectors of management of companies and information both encompass firms that often were previously classified as industrial. It is unknown exactly what portion of the shift away from what is reported manufacturing is attributable to the new NAICS system.
• There is also a trend toward companies reporting more than one NAICS, with a separate NAICS assigned to groups of employees. It is likely that this greater detail has led to the reported jump in employment within the NAICS category “management of companies”. This trend results in a shift away from the industrial sectors, as employment appears to be increasingly split between a company’s “primary” industry (e.g. warehousing, manufacturing) and other classifications (such as management or headquarters operations), which falls within the service sectors.
• Companies self-report NAICS, and sometimes are inconsistent over time.
Because of these issues, sector-level changes (for instance, the reported decline in manufacturing jobs and increase in service jobs) are best understood as shifts in the nature of the region’s employment rather than necessarily as job growth or decline within individual firms. Employment data should also be viewed as most reliable when summed within a geographic subarea or to broad sector groupings, rather than when detailed sector-level data is compared over time.5
4 Alternative data sources include the Covered Employment Statistics, a sample survey-based time series that is
adjusted to match ES 202 data, and the Economic Census, completed once every five years (with a several year lag before data release and not available at a sub-regional level).
5 The reliability of sector comparisons over time should also improve in the future, as more years of data and experience with the NAICS classification system take place. This will especially be the case when it is not as

Adopted – October 2012
E.D. Hovee & Company, LLC for City of Portland:
Economic Opportunities Analysis Section 1 Trends, Opportunities & Market Factors 25
PORTLAND EMPLOYMENT GEOGRAPHIES
This section includes an analysis of Portland employment areas at a finer level of detail –geographic subareas that group together similar employment uses with common site characteristics and development patterns (Figures 8 and 9). Subareas are broadly grouped into categories of Central City, industrial, neighborhood commercial, institutional, and residential categories.
Figure 8. Employment Geographies
Subarea Boundary Methodology Central City Commercial
CBD + South Waterfront Central City Plan District subareas
University District Central City Plan District subarea
River District Central City Plan District subarea
Goose Hollow Central City Plan District subarea
Lloyd District Central City Plan District subarea
Central City Incubator
Central Eastside (incubator) Central City Plan District subarea
Lower Albina (incubator) Central City Plan District subarea
Urban Centers
Hillsdale Town Center Plan District
Hollywood Town Center Plan District
St. Johns Town Center Plan District
Gateway Regional Center Plan District
Lents Town Center
West Portland Town Center
Industrial Areas Columbia Harbor Industrial Sanctuary + adjacent ME comp plan designation
Columbia East of 82nd Industrial Sanctuary + adjacent ME comp plan designation east of 82nd
Dispersed Industrial Dispersed IS + ME comp plan designations
Neighborhood Commercial
Commercial Corridors Commercial corridors designated by BPS
Commercial Nodes Tax lots surrounding key commercial intersections identified by BPS
Dispersed Commercial Other tax lots in commercial zoning (auto-oriented, storefront or mixed employment)
Institutions 7 colleges and 10 hospitals with campus areas larger than 10 acres with more than 100 employees, except for Portland State University, which is included in the Central City’s University District; and the Adventist Medical Center, which is included in Gateway Regional Center
important to provide time series comparison with the 2000-2002 time period when much of the SIC to NAICS changeover occurred.

Adopted – October 2012
E.D. Hovee & Company, LLC for City of Portland:
Economic Opportunities Analysis Section 1 Trends, Opportunities & Market Factors 26
Figure 9. Portland Geographic Subareas
Adopted – October 2012
E.D. Hovee & Company, LLC for City of Portland:
Economic Opportunities Analysis Section 1 Trends, Opportunities & Market Factors 27
Trend Observations by Employment Geography
Major observations from each employment geography are summarized below. As noted, submarkets are defined for each of the major employment geographies of Central City, urban centers, institutions, industrial, neighborhood commercial, and residential/open space employment activity. Added discussion of employment sector changes within geographies and accompanying graphs are located within the Demand Analysis – Data Assessment Topics section of this report.
• With 107,600 jobs, the Central City Commercial geography encompassed 27% of the city’s job base in 2008. With a 0.1% average annual growth rate between 2000-2008, employment increased at about the same rate as employment increased citywide over the same time period.
With nearly 66,400 jobs, the CBD + South Waterfront not surprisingly comprises the largest Central City subarea, although this core submarket experienced a loss of an estimated 3,100 jobs from 2000-08. The most rapid job growth occurred within the River District submarket (up by 2.1% per year), followed by the Lloyd District.
Two Central City subdistricts – Central Eastside and Lower Albina – are included within the Central City Incubator geography (and included in the industrial area rather than Central City totals). These are often referred to as “incubator” rather than heavy industrial districts and have out-performed the overall Central City area with annual job gains of nearly 3% and 2% per year respectively.
• Urban centers comprised just 5% of citywide employment in 2008 and experienced job growth averaging 1.4% per year. Of the six urban center submarkets profiled, Gateway has the largest employment base with about 9,500, followed by Hollywood at 6,500 and West Portland at 2,600.
The highest levels of employment growth since 2000 are indicated for Hollywood and Lents Town Center, both averaging employment gains of better than 5% per year. Gateway also experienced employment growth, but at a much lower growth rate. The other urban centers experienced relatively flat to declining employment.
• Institutions, excluding PSU and Adventist Hospital, accounted for over 35,200 jobs in 2008 (nearly 9% of citywide employment), with job growth averaging 3.6% from 2000-08.
• Industrial areas comprise a total of 119,500 jobs (or better than 30% of employment citywide). Overall job growth has occurred at about the citywide average of 0.1% per year but with wide variation between districts.
With more than 61,600 employees, the Columbia Harbor geography accounts for more than one-half (52%) of the industrial total (or 16% of all employment citywide). The Columbia Corridor east of NE 82nd Avenue accounts for more than 19,400 jobs with Dispersed Industrial at 17,200. The two Central City Industrial (or incubator) districts account for 18,000 and 3,300 jobs respectively.
Columbia Harbor reports some job loss averaging close to 1% per year, with even more rapid attrition for Dispersed Industrial. Job gains of close to 3% per year are noted for Columbia East of 82nd. Employment has increased 0.1% per year in all the industrial

Adopted – October 2012
E.D. Hovee & Company, LLC for City of Portland:
Economic Opportunities Analysis Section 1 Trends, Opportunities & Market Factors 28
areas combined. As noted, both the Central City incubator districts have experienced employment gains.
Harbor Access Lands are shown as a subarea to the Columbia Harbor employment area. Harbor Access Lands are riverfront industrial lands in the Portland Harbor and along the Columbia River. As of 2008, Harbor Access Lands accounted for an estimated 9,300 jobs, approximately 15% of Columbia Harbor employment. From 2000-08, Harbor Access Lands experienced declining employment at a rate averaging 2.4% per year – a substantially more rapid rate of job loss than for the entire Columbia Harbor geography. Reported employment losses were most substantial in manufacturing, followed by transportation, warehousing and wholesale trade. It is notable that a separate analysis indicates that the economic activity in the Portland Harbor grew at 1.6% per year during approximately the same timeframe - 2002 to 2008. During that same time period, cargo volumes increased by 4.8% per year.6 As discussed later in this report, employment may not be the best indicator of land needs in the harbor
• With 70,400 jobs or 18% of citywide employment, the neighborhood commercial geography has experienced net job loss since 2000. Of the neighborhood-related employment activity, nearly 56% of jobs are indicated as located in Commercial Corridors, followed by Dispersed Commercial. Commercial Corridors account for the largest base of neighborhood activity with just over 39,000 jobs but lost jobs at a rate averaging 1.5% per year. Commercial Nodes (about 20 key intersections) supported 9,600 jobs in 2008 or 14% of the neighborhood-related jobs total. Taken together, neighborhood commercial areas experienced a net loss of 1,900 employees from 2000 to 2008 – coming primarily from reduced employment in Commercial Corridors. Job losses are noted for 6 out of 10 employment sectors, led by construction which decreased by more than 1,700 jobs. A countertrend is indicated for Dispersed Commercial, with close to 3,900 more jobs reported in 2008 than 2000.
• More than 38,900 jobs are reported for residential areas plus open space. The majority of these jobs are in residential areas which account for just under 10% of citywide employment. Job losses are exhibited in every employment sector, except public sector employment.
More detailed data for these submarkets is provided by the tables on the next two pages.
6 EcoNorthwest, Portland Harbor Industrial Land Supply Analysis, February 2012)

Adopted – October 2012
E.D. Hovee & Company, LLC for City of Portland:
Economic Opportunities Analysis Section 1 Trends, Opportunities & Market Factors 29
Figure 10. Urban Centers & Institutions Employment (2000-2008)
CBD + S Waterfront
University District
River District
Goose Hollow
Lloyd District Gateway Hollywood St Johns Hillsdale Lents
West Portland Institutions
Utilities 26 - * - * * - - - - - -
Construction 682 - 900 268 61 118 36 89 * 34 194 *
Manufacturing 275 * 481 * * 150 * * * * * -
Trans, Wareh. & Whlsle 800 * 2,478 24 341 242 46 95 5 * 36 *
Retail, Arts, Accommod. 11,033 353 4,337 1,935 5,616 2,705 950 388 286 89 292 353
Services 30,496 341 3,319 1,079 6,000 1,403 589 335 135 102 1,584 132
Information & Design 11,937 * 2,569 645 1,020 * 140 36 33 - 189 153
Education + Health 3,241 * 1,066 272 819 4,187 4,733 142 254 56 291 34,575
Public 7,740 182 95 - 1,684 487 * * - * * -
Other/No NAICS 11 - 2 - 4 1 - - - - - 1
Total 66,365 3,925 16,162 4,444 16,704 9,514 6,513 1,313 742 324 2,605 35,234
2008 Distribution 16.9% 1.0% 4.1% 1.1% 4.3% 2.4% 1.7% 0.3% 0.2% 0.1% 0.7% 9.0%
Utilities (474) - * - (799) - - - - - * -
Construction (1,230) (9) 787 10 (87) (29) (66) 23 4 12 140 1
Manufacturing (576) (26) (672) (186) (39) (13) (25) (3) 14 * 2 -
Trans, Wareh. & Whlsle (1,039) (8) (2,495) (139) (435) (628) (22) (64) (27) * (98) *
Retail, Arts, Accommod. (592) 132 1,986 382 465 51 395 (50) (133) (11) 30 155
Services 1,732 (184) 1,538 (158) 2,672 (42) (232) 120 24 45 (509) 36
Information & Design (20) * 825 (71) 13 (124) 75 6 (29) - (70) (264)
Education + Health 635 222 590 (144) (44) 995 2,147 116 (0) 56 108 8,792
Public (1,243) * * (797) 346 * (5) (133) * * - -
Other/No NAICS (372) (6) (45) (15) (33) (41) (30) (3) (6) - (27) (23)
Total (3,098) 255 2,527 (1,119) 2,059 380 2,237 12 (168) 105 (429) 8,710
2000 Distribution 17.8% 0.9% 3.5% 1.4% 3.8% 2.3% 1.1% 0.3% 0.2% 0.1% 0.8% 6.8%
00-08 Annual Growth -0.6% 0.8% 2.1% -2.8% 1.7% 0.5% 5.4% 0.1% -2.5% 5.1% -1.9% 3.6%
Utilities 0% 0% 6% 0% 7% 1% 0% 0% 0% 0% 0% 0%
Construction 1% 0% 6% 6% 0% 1% 1% 7% 1% 11% 7% 0%
Manufacturing 0% 0% 3% 5% 0% 2% 0% 2% 3% 2% 0% 0%
Trans, Wareh. & Whlsle 1% 1% 15% 1% 2% 3% 1% 7% 1% 0% 1% 0%
Retail, Arts, Accommod. 17% 9% 27% 44% 34% 28% 15% 30% 39% 27% 11% 1%
Services 46% 9% 21% 24% 36% 15% 9% 26% 18% 32% 61% 0%
Information & Design 18% 0% 16% 15% 6% 1% 2% 3% 4% 0% 7% 0%
Education + Health 5% 77% 7% 6% 5% 44% 73% 11% 34% 17% 11% 98%
Public 12% 5% 1% 0% 10% 5% 0% 16% 0% 11% 1% 0%
Other/No NAICS 0% 0% 0% 0% 0% 0% 0% 0% 0% 0% 0% 0%
Total 100% 100% 100% 100% 100% 100% 100% 100% 100% 100% 100% 100%
Total Employment 2008
Employment Change 2000-2008
Employment Distribution 2008
Central City - Non Industrial Urban Centers
Source: Oregon Employment Department (OED), Portland Bureau of Planning & Sustainability, E. D. Hovee & Company, LLC. Agricultural jobs are not detailed. Asterisks (*) denote data not disclosed to meet OED confidentiality provisions.

Adopted – October 2012
E.D. Hovee & Company, LLC for City of Portland:
Economic Opportunities Analysis Section 1 Trends, Opportunities & Market Factors 30
Figure 11. Industrial Areas & Neighborhood Employment (2000-2008)
Columbia Harbor
Harbor Access
Lands
Columbia East of 82nd
Dispersed Industrial
Central Eastside
Lower Ablina
Commercial Corridor
Commercial Nodes
Dispersed Commercial Residential
Utilities * - - * - - - * - *
Construction 4,144 571 1,830 1,527 2,227 418 1,020 64 1,959 2,800
Manufacturing 16,580 4,828 3,743 3,186 2,056 343 1,342 * 1,110 740
Trans, Wareh. & Whlsle 24,939 2,605 4,686 2,260 3,577 314 1,589 80 828 1,651
Retail, Arts, Accommod. 4,455 67 2,786 1,552 3,126 189 18,756 6,863 5,601 3,407
Services 8,443 1,186 3,606 6,017 3,118 191 8,966 1,511 5,052 7,494
Information & Design 1,136 9 888 1,484 1,406 101 2,383 154 3,160 2,277
Education + Health 903 54 559 696 1,659 * 4,881 621 3,690 17,501
Public 945 - 1,327 * 821 * 62 284 * 2,981
Other/No NAICS 3 1 4 - 2 2 25 - 13 49
Total 61,642 9,321 19,429 17,183 17,992 3,254 39,050 9,589 21,718 38,928
2008 Distribution 15.7% 2.4% 4.9% 4.4% 4.6% 0.8% 9.9% 2.4% 5.5% 9.9%
Utilities (15) - - 7 - - - (15) - *
Construction 770 250 714 186 772 (160) (1,347) (60) (323) (1,586)
Manufacturing (6,498) (939) (6) 14 (90) (176) (1,035) (25) 665 (773)
Trans, Wareh. & Whlsle (2,218) (1,124) 1,045 (3,267) (217) (25) (297) (341) (5) (133)
Retail, Arts, Accommod. (25) (450) 12 (1,691) 608 23 (1,216) (21) 1,825 (944)
Services 2,771 399 1,261 2,287 957 163 (148) 133 455 (2,073)
Information & Design (104) (102) 318 313 930 69 (72) (113) 660 (601)
Education + Health 78 42 236 (173) 5 429 (434) 14 966 (537)
Public 706 * 473 (437) 821 * (140) * (218) 492
Other/No NAICS (208) (23) (75) (88) (82) (7) (432) (46) (180) (918)
Total (4,755) (1,977) 3,944 (2,849) 3,703 502 (5,132) (576) 3,853 (7,078)
2000 Distribution 17.0% 2.9% 4.0% 5.1% 3.7% 0.7% 11.3% 2.6% 4.6% 11.8%
00-08 Annual Growth -0.9% -2.4% 2.9% -1.9% 2.9% 2.1% -1.5% -0.7% 2.5% -2.1%
Utilities 0% 0% 0% 2% 0% 0% 0% 0% 0% 0%
Construction 7% 6% 9% 9% 12% 13% 3% 1% 9% 7%
Manufacturing 27% 52% 19% 19% 11% 11% 3% 0% 5% 2%
Trans, Wareh. & Whlsle 40% 28% 24% 13% 20% 10% 4% 1% 4% 4%
Retail, Arts, Accommod. 7% 1% 14% 9% 17% 6% 48% 72% 26% 9%
Services 14% 13% 19% 35% 17% 6% 23% 16% 23% 19%
Information & Design 2% 0% 5% 9% 8% 3% 6% 2% 15% 6%
Education + Health 1% 1% 3% 4% 9% 46% 12% 6% 17% 45%
Public 2% 0% 7% 1% 5% 6% 0% 3% 1% 8%
Other/No NAICS 0% 0% 0% 0% 0% 0% 0% 0% 0% 0%
Total 100% 100% 100% 100% 100% 100% 100% 100% 100% 100%
Employment Change 2000-2008
Employment Distribution 2008
Non Central City Industrial Central City Industrial Neighborhoods
Total Employment 2008
Source: Oregon Employment Department (OED), Portland Bureau of Planning & Sustainability, E. D. Hovee & Company, LLC. Agricultural jobs are not detailed. Asterisks (*) denote data not disclosed to meet OED confidentiality provisions.

Adopted – October 2012
E.D. Hovee & Company, LLC for City of Portland:
Economic Opportunities Analysis Section 1 Trends, Opportunities & Market Factors 31
IIVV.. DDEEMMAANNDD AANNAALLYYSSIISS IISSSSUUEESS –– FFOOCCUUSS GGRROOUUPP IINNPPUUTT
A key component of this economic opportunities analysis has centered on six demand analysis
topics of particular interest to the City of Portland with this EOA and Comprehensive Plan update. To assist with this assessment, focus groups were organized and conducted in 2009 to cover each topic area, with each group hosted by a business or community organization:
• Central City Office – hosted by the Portland Business Alliance
• Close-In Incubator – hosted by the Central Eastside Industrial Council
• Manufacturing & Distribution – hosted by the Columbia Corridor Association
• Neighborhood Commercial – hosted by the Alliance of Portland Neighborhood Business Associations
• Commercial Corridor/Mixed Use/Transit Oriented Development (TOD) – hosted by the Portland Streetcar, Inc.
• Campus Institutional – hosted by the Institutional Facilities Coalition
A total of 58 business and non-profit organization representatives participated in these six focus groups (including two who participated in two sessions). Participants are identified in Appendix A.
Focus group discussions covered recent and emerging trends, business space and location needs, questions regarding density and development, opportunities for economic prosperity and creative vitality, and economic development focus. This summary of focus group results has been organized around major themes that emerged across multiple groups in response to specific topic areas. The comments are reported without attribution of comments to specific individuals or organizations.
A separate report provides more detailed discussion of items of more particular interest within each of these six areas of demand analysis groupings (Appendix B).
SUMMARY THEMES BY DEMAND TOPIC
To summarize, Figure 15 provides an overview of major observations for each of the six demand analysis groupings covered. This chart is followed by a more detailed narrative describing focus group responses for each of the demand topics in more detail.

Adopted – October 2012
E. D. Hovee & Company, LLC for City of Portland:
Economic Opportunities Analysis Section 1 Trends, Opportunities & Market Factors 32
Figure 12. Focus Group Themes by Demand Topics
Discussion Question
Central City Office
Close In Incubator
Manufacturing & Distribution
Neighborhood Commercial
TOD/Mixed Use Corridors
Campus Institutional
Recent Trends
• Resurgent Central City office leasing has been realized (until the recession)
• Tenants are drawn back in from the suburbs
• Live-work options create added urban synergy
• Districts like Central Eastside are on a roll for diverse industry plus creative and tech oriented business
• Close-in incubator space offers grittier appeal to young creatives
• Finding qualified labor and distance from U.S. markets are major industry issues
• De-consolidation of distribution nationally with higher fuel prices works to Portland business advantage
• Neighborhood districts are finding their niche
• Growth is organic and entrepreneurial
• Business success depends on serving a mix of local and destination clientele
• Retail opportunity is driven by more residents moving back to the city
• Diverse mixed use settings are available – Central City, mid-rise transit corridors, distinctive urban neighborhoods
• Regional institutions are investing in facility renewal to remain competitive
• Locally oriented education and health care are moving closer to where clientele live or work
Emerging Trends
• Office market is becoming more diverse with entrepreneurial and sustainable business emphases
• Central City has greater potential to increase its capture of the regional office market
• Businesses are hyper-local,
serving each other and the downtown
• A mix of business, from industrial to arts and dining, is supported
• Desire is expressed for incubator needs to evolve naturally and organically
• Businesses draw needed labor both locally and nationally
• There is a broad trend to sustainable design and business practices
• A major concern is that freight transport capacity is not keeping up
• Increased area residential density is anticipated, but more infrastructure is needed
• Increased orientation to the concept of a 20-minute
neighborhood is strongly endorsed
• Further intensification of development is expected with economic recovery
• Successful TOD is all about reducing vehicle miles traveled (VMT) and location efficient development
• Locally-oriented education providers are decentralizing
• Strong health care growth is expected to continue
• Increased transit orientation of institutions is more critical with facility investment
Business Space & Location Needs
• New and alternate office locations are desired, especially close to the core
• The life cycle of each business means changing choices over time for type and cost of space, for a more diverse office mix
• Options are desired for business condo arrangements and inexpensive space
• Permitting & SDCs are cited as recurring issues with rehab of existing building space
• Increased cost of doing business is cited as a growing competitive concern for the Portland area
• Maintaining the industrial sanctuary is critical for manufacturing and distribution
• Participants are bullish on options for increasing business vitality
• More business tools/incentives together with robust planning for employment concentration are recommended
• More focus on job-related as well as residential mixed use development is encouraged
• A new City of Portland job density paradigm
• Current impact mitigation process and mixed use limitations frustrate reinvestment
• Affordable housing options are needed for students, faculty, workers

Adopted – October 2012
E. D. Hovee & Company, LLC for City of Portland:
Economic Opportunities Analysis Section 1 Trends, Opportunities & Market Factors 33
Discussion Question
Central City Office
Close In Incubator
Manufacturing & Distribution
Neighborhood Commercial
TOD/Mixed Use Corridors
Campus Institutional
Density & Redevelopment
• Desired are options for added density (FAR) and multi-block campus developments
• A need is expressed to think
big enough for greatly expanded jobs potential
• Improving the city’s business climate is cited as a priority initiative
• Streetcar extension will be the impetus for added development density
• Multi-level manufacturing still exists, but widespread applicability is questionable
• Code flexibility is key to maintaining close-in industrial
• Industrial site and transport needs make it difficult to exceed 35% site coverage (or FAR)
• Distributors build high-cube space to get more product in the same building footprint
• Requiring too much density may result in business leaving Portland
• Support for more housing density is viewed as generating positive business impacts
• Rather than mandating commercial density, the suggestion is to let
density float to what the market supports
• Density will come with transit service extension
• More emphasis is recommended for mixed use development with a strong jobs mix
• Live/work incubator opportunity is cited for as yet untapped resources (such as Gateway)
• More multi-story buildings are expected with medical; cautious interest is also expressed for higher education (out of downtown)
• Increased density of development is predicated on better transit accessibility and service
Economic Prosperity & Creative Vitality
• Portland’s Central City is viewed as vital to defining the PDX brand
• PSU and housing are more important as future economic engines to Central City office vitality
• Incubator districts are integral for the centrality of a regional service supplier role
• Close in business offers local networking and technology transfer capability
• Recommended is emphasis on balancing goals of sustainability and job growth
• For Portland, sustainability can mean being both green and efficient
• Small business is described as the engine of the Portland economy
• For increased economic contribution, offer more training for small and ethnic firms
• Portland offers the appeal of a village environment
• Economic recovery depends on sustainability and greater emphasis to build creative, tenacious
minds
• Expect institutions to remain critical as a major future job source
• Higher ed and health care play a more important role in cultivating Portland area health & vitality
Economic Development Focus
• Marketing Portland as a competitive place to do business
• Prioritize public investment in infrastructure and zoning flexibility
• Foster private investment in businesses, not just buildings
• Restore the linkage between the City and private sector
• Prioritize multi-modal freight and worker transport infrastructure
• Provide balanced support for industry with traded sector focus
• Offer improved access to resources for small business
• Plan for change with less emphasis on mandates
• Foster creativity and job density on transit corridors
• Re-tool the planning and zoning process
• Build the urban university
• Recognized and support institutional contributions
• Transition from regulatory emphasis to partnership roles
Source: Economic Opportunity Analysis focus groups conducted February-March, 2009.

Adopted – October 2012
E.D. Hovee & Company, LLC for City of Portland:
Economic Opportunities Analysis Section 1 Trends, Opportunities & Market Factors 34
RECENT TRENDS
Each focus group session began with the question: What are the most important trends that have
affected business, investment and development for your firm or organization over the past 3-5
years?
Portland had been a dynamic place to be conducting business up to the point of the economic downturn starting in 2007-08. Major themes emerging from the six focus group conversations include the following:
• Central City office has, in recent years, experienced a resurgence of leasing activity (with the economic downturn only recently beginning to be felt). Some tenants have been drawn back in from the suburbs by the vitality and transit accessibility of the urban core, Portland is attracting and growing the sustainability industry, and the core area has benefited from the synergy of providing options for housing and work in close proximity.
• Close-in incubator areas (notably Central Eastside) have also been on a roll – but in a “grittier, more Portland” setting that is now home to businesses ranging from open source tech to distributors/brokers to destination retail. How to accommodate parking and diverse freight versus people transit is cited as the #1 issue. Bus and bike access is ever more important.
• Manufacturing and distribution firms of Portland’s harbor and Columbia Corridor have found that obtaining qualified workers is a growing challenge, even in a time of economic downturn. The Pacific Northwest is still a small market; getting to market is a competitive challenge and competitors are primarily out of state. Distribution may be deconsolidating to more and smaller centers across the U.S., offering added market activity for Portland.
• Neighborhood business districts are finding their niche and for some (like the Pearl and Mississippi) the niche has rapidly matured. Portland is still “under-retailed, national chains want in.” Much of the city’s neighborhood business development has taken off on its own. The “coolest stuff is organic,” responding to local entrepreneurial initiative and often “happened in spite of government.” While businesses often start by serving a primarily local neighborhood clientele, success means that customers increasingly are “not from the neighborhood itself” but also drawn from the rest of the city and region.
• Mixed use/TOD discussion paralleled much of what was heard with neighborhood business districts. From empty nesters to young professionals, people are coming “back to the city.” Portland’s resurgence is based on residents “coming for character and texture” with diverse options ranging from high-rise Central City districts to mid-rise transit corridors to distinctive urban neighborhoods. “More rooftops” with greater discretionary income has served to drive much of the growth with in-city retail and dining – at least up to the time of the recession.
• Campus institutional activities are identified as primarily including education and medical institutions (outside Portland’s Central City). Some nationally recognized education institutions in Portland face substantial reinvestment aimed at “renewal of facilities” to better meet science and technology needs and house more students (or faculty) on or near campus.
Adopted – October 2012
E.D. Hovee & Company, LLC for City of Portland:
Economic Opportunities Analysis Section 1 Trends, Opportunities & Market Factors 35
Locally oriented higher education institutions are increasingly focused on training for specific workforce needs – from nursing to welding – and look for locations and partnerships to get closer to the neighborhoods where the students are or will be. Similarly, medical institutions are looking to medium and smaller size facilities closer to where people live or work (including preparation for an aging demographic).
EMERGING TRENDS
The next question asked participants to look toward the future: What do you see on the horizon
as potentially important emerging trends for employment growth or change? Participants were asked to comment on the next 3-5 years through a period of recovery from the current economic downturn and then beyond over the next 10-25 years (to 2035).
From virtually every group, the overarching theme is one of change. Portland’s economic opportunities can be expected to be different in 2035 than they are today. Even as of 2009, the outlook appeared promising, provided that economic recovery proves sustainable and that the City and region respond to shape this change in ways that keep Portland competitive for added investment and employment:
• Central City office specialists see the market becoming “more diverse” with increased emphasis on serving and stimulating business entrepreneurs, including those in the still expanding sustainability sector. Much of this need for lower cost and more flexible space is expected to be met on the fringes of or outside of the Central City, in places such as the Central Eastside and Gateway. Assuming that metro urban growth boundary expansions continue to be limited, the Central City and other Portland locations can be expected to compete for increasing shares of regional office employment. Resurgent commuter interest in transit dovetails with and buttresses this trend. As one focus group participant said: “Now we’re going to have to perform.”
• Central Eastside/close-in incubator interests express a wide range of thoughts. Some see more restaurants, craft businesses, theaters, and smaller 2-story infill. OMSI and some private owners have large multi-block holdings that could redevelop once land prices go high enough to support redevelopment. Some strongly suggested that the district should be supported as zoned.
The assumption that manufacturing will go away to be replaced with the creative class “is flawed.” Because of proximity to the rest of the Central City, vendors are “hyperlocal.” Doing business with neighbors next door or across the river downtown is part of the business culture. A common theme expressed is to not pick business winners; rather let this incubator environment “evolve naturally and organically.”
• Manufacturing and distribution focus group participants see continuing impetus to draw from both within and outside the Portland labor market for needed workforce skills and experience. More sustainable building design and business practices also are a priority – affecting stormwater management, air quality, transportation efficiency and internal heating, ventilation and air conditioning (HVAC) systems. A major concern is that freight transport capacity is not keeping up – due to rail networks operating at capacity and increased local freeway and street congestion.

Adopted – October 2012
E.D. Hovee & Company, LLC for City of Portland:
Economic Opportunities Analysis Section 1 Trends, Opportunities & Market Factors 36
• Neighborhood business districts see their communities generally becoming more densely developed with added planning to “identify necessary infrastructure” as an increasingly important focus. The concept of a “20-minute neighborhood” radius for walking to achieve a broad range of day-to-day needs is strongly endorsed. Much of what happens within these business districts depends on neighborhood demographics and housing development including anticipated trends for smaller houses.
• Mixed use corridors and transit oriented development can expect to intensify with economic recovery. As with neighborhood business districts, much of the development potentially can be expected to be residentially driven – at somewhat higher levels of density. For the next half century, TOD is about reducing vehicle miles traveled (VMT) – creating location efficient mixed use real estate opportunities.
• Campus institutional users see the need to think “more broadband” with more evening and weekend classes closer to where students live and/or work for work force oriented educators. Health care providers expect “tremendous growth” over the next five years and new partnerships with educational institutions.
Access to public transportation is a shared objective, with many of the institutions not currently well served by transit. Students at local colleges want to be able to commute into downtown; others (such as nursing students) go all over the city for work experience and rely on auto travel. To the extent that transit mode share can increase, needs for expensive (and increasingly structured) parking can be reduced.
BUSINESS SPACE & LOCATION NEEDS
This question and resulting discussion was aimed to better understand: What are the most
important requirements for business success at this type of location in Portland?
Not surprisingly, space and location needs expressed through these focus group sessions were relatively diverse. However, common themes that emerged include opportunities for more mixed use and density with commercial-related uses versus strong desire for protection of more traditional manufacturing and distribution activity. More detailed notes follow:
• Central city office interests would like to seem more blocs of developable land – including at new or alternate locations close to the downtown core. For example, if the Vestas office project happens, it can be expected to draw added interest for office development to South Waterfront. Other opportunities may include sites at the edge of the River (Pearl) District and Central Eastside. EX employment or similar zoning is viewed as pivotal –offering a greater range of mid-rise development options. The Central Eastside (MLK to the waterfront) is cited as perhaps the “hottest market,” Portland’s new location for digital jobs.
Incentives were discussed but not widely embraced for office development. Suggested instead: “Don’t give me money, give me infrastructure.”
The life cycle of a business can involve several phases of space use – starting with funky, low cost creative space, transitioning (for some) to more traditional Class A office as the business matures. An emerging trend (not yet captured) in Portland is for business owned buildings, whether condo or stand-alone.

Adopted – October 2012
E.D. Hovee & Company, LLC for City of Portland:
Economic Opportunities Analysis Section 1 Trends, Opportunities & Market Factors 37
Proximity to work-force housing and residential amenities including schools is also seen as key to which office locations offer the best bets to prosper. One focus group participant put it this way: “if there were a decent elementary school, I’d be living (as well as working) in downtown Portland now.”
• Close-in incubator focus group participants also cite the as-yet unmet opportunity for business condos. The ability to rehab a former warehouse as inexpensive shell space fits a definite tenant need; the Central Eastside can expect more success “if downtown fills up.” Permitting and SDCs with reuse of existing space are cited as definite issues, to the point of keeping “Portland at a competitive disadvantage.” Particularly problematic code issues cited include seismic retrofits, sidewalk standards, and needs for greater consistency and predictability in the permitting process.
• Manufacturing and distribution firms cite costs of doing business as a competitive concern with doing business in Portland. Costs include water/sewer rates and absence of performance based tax incentives for employers rather than for development. In the words of one participant: “Oregon doesn’t even get the short look.” Maintenance of the industrial sanctuary and limiting residential encroachment is viewed a pivotal – for reasons including maintenance of plant safety and security. Firms want a more solid and proactive message linked to work force opportunity in traditional industry: “We don’t tell our story very well.”
• Neighborhood business district participants are generally “bullish” on opportunities for increasing business vitality. Small business needs tools for storefront improvements and commercial development, tools to “really make our place special.” PDC storefront loans and access to incentives/tax breaks are identified as desired. Interest is also expressed in a more “robust” planning process. A plan that is “set in stone doesn’t work.”
• Mixed use and transit oriented development should begin to focus more on employment as well as residential development potential. One focus group participant commented that employment policy is as crude today as housing policy in Portland once was – with not much changing since the 1980s. With this focus group, continuation of the current industrial sanctuary policy has been called into question. Recommended is that the City adapt to a paradigm for more concentrated employment.
Noted as an example is computer chip manufacture in a multi-story setting in Hong Kong. Codes. Live/work development should be adapted to allow occupants to live “and/or” work on site as long as fire/life/safety requirements are met.
• Campus institutional users express frustration with the Impact Mitigation Plan (IMP) provisions of conditional use and/or institutional/residential zone requirements for project approval. Specifically cited as a concern limiting mixed use opportunity is the prohibition on commercial use in excess of 30% – a constraint on medical offices and/or on-site retail. Colleges are not an allowed in a commercial zone. Stated as a desire would be the creation of a higher education zone or perhaps a form-based code placing emphasis on characteristics and performance of development rather than use.
Also noted is a desire for an affordable/workforce housing policy in conjunction with institutional uses. Suggested is City initiative for a more streamlined permitting process, perhaps offering a central point of contact for larger projects.
Adopted – October 2012
E.D. Hovee & Company, LLC for City of Portland:
Economic Opportunities Analysis Section 1 Trends, Opportunities & Market Factors 38
Portland’s land use and permitting process received considerable discussion throughout all of the focus groups. Two themes of importance emerged: a) the desire for more flexibility to better respond to specific business or needs; and b) the desire for a more predictable and faster approval process. Recognizing that these two objectives can be in conflict with each other, one suggestion was to offer a two track approach: assurance of rapid-fire review and approvals for the standard project with the option for a very flexible but admittedly longer review process for the non-standard or pioneering application.
DENSITY & REDEVELOPMENT
The City and metro area have placed increased emphasis on building up rather than out as a means to better realize objectives for community livability and containment of urban sprawl. The question posed is: In terms of market and financial feasibility, how viable are (varied) options as
possible priorities with the next update of Portland’s Comprehensive Plan?
Some group discussions were asked and/or addressed this question more directly than others. While opinions are varied, this topic received thoughtful discussion with regard to the practical implications and mechanisms for growing up rather than out:
• Central City office developers, brokers and businesses reported increased pressure to go up again – not just in the downtown core but elsewhere in the Central City and beyond. Old Town should be prepared for higher buildings, but getting transfers of development rights (TDRs) is a “hassle.” Another stated need is for sites that could accommodate large employer campuses. In the words of one participant, “we don’t think big enough.” While incentives do not appear to generate broad support, there is interest in marketing and related initiatives to “make the business climate more appealing.”
For nearby districts like Central Eastside, something like a 4-5 story cap might make sense to assure that each office product serves a distinct market niche. Also identified as having longer term office development opportunity is Gateway, based on proximity to affordable workforce housing.
• Close-in incubator opportunities also exist for higher density, even possibly for some manufacturing uses. The Pratt and Larson tile company is cited as an example of a manufacturer operating on more than one floor. Firms may be more willing to do multi-level industrial if they can set up cost-effective systems to get the product in and out. Greater flexibility on city code requirements – as for seismic and sidewalk standards – would also be required. Streetcar extension is expected to provide further impetus for greater density of employment. More supportive infrastructure will be needed – perhaps with MOUs for City investment much as happened in the Pearl and South Waterfront areas.
• Manufacturing and distribution areas of the Portland Harbor and Columbia Corridor see it challenging to exceed 35% site coverage if functional on-site parking and transportation (freight handling) capacities are to be adequately provided. The concept of industrial density is termed an “oxymoron” by one participant. There is concern with industries getting land-locked if site use is pushed too far. However, some distribution firms are going to higher cube space with up to 40 foot ceilings and high-rack distribution systems.

Adopted – October 2012
E.D. Hovee & Company, LLC for City of Portland:
Economic Opportunities Analysis Section 1 Trends, Opportunities & Market Factors 39
As one participant said, if density “economically makes sense, industry will do it.” However, pushing density and industrial prices too rapidly could cause some firms to relocate from the Portland area.
• Neighborhood business district representatives indicate support more nearby residential density to support continuing commercial revitalization. Rather than mandating commercial density of development, the suggestion is to “let density float” to what the market will support. Another suggestion: “Give corridors the highest degree of flexibility.”
• Mixed use and transit oriented development interests express strong support for increased density of development along and near transit. Specifically emphasized was greater attention to increased employment as well as housing and retail with mixed use development. Areas of Portland like Macadam that were developed with low-rise suburban densities could go from FARs of 2:1 to 3-4:1. Gateway was seen as an as-yet untapped resource with similar density potential – described by one participant as perhaps the “nation’s largest live/work” opportunity.
• Campus institutional participants also expressed interest in greater density of development, a phenomenon already occurring with medical facilities. Colleges have approached this topic more cautiously due to concerns over student, alumni and neighborhood appeal. However, interest was expressed in considering more height if it is not overly visible and accompanied by better transit service. As was indicated for one institution, the question is: how does one “build a six-story building in a neighborhood?”
ECONOMIC PROSPERITY & CREATIVE VITALITY
As part of the Portland Plan process now underway, a critical issue and question is: How can we
position Portland in the world economy to remain a prosperous city, building on our competitive
strengths and core values of equity and sustainability?
This question was read verbatim in all of the 2009 focus group sessions. It is probably not surprising that each demand group can lay claim to its sector’s importance to the future economic and creative vitality of the city and region. A key challenge for the plan updates may be how to harness these diverse activities into a coherent whole capable of enhancing Portland’s economic prosperity and sustainability:
• Central city office participants noted that every healthy regional economy is accompanied by a strong Central City. What’s more, the downtown, Pearl and SoWa are integral to the “Portland brand” – a city known for being comfortable, walkable and emphasizing quality of life. Enhancing the brand appeal requires strengthening the reputation of Portland State University as an “engine” of economic development.
Also emphasized: “Get more mixed use downtown.” Mixing in more residential with added building height and FAR capability is seen as pivotal to further strengthening of both retail and office competitiveness in Portland’s Central City.
• Close-in incubator functions at the edge of the Central City are viewed as serving an integral economic role by facilitating the flow of goods and services citywide and regionally. Because it is increasingly challenging to pick the economic winners of the

Adopted – October 2012
E.D. Hovee & Company, LLC for City of Portland:
Economic Opportunities Analysis Section 1 Trends, Opportunities & Market Factors 40
next economic cycle, keep the district “malleable.” In the words of another participant, because Portland does not have internationally tech education, “we are the sponge” providing the tech know-how and knowledge transfer capacity both in times of prosperity and even during the current downturn.
• Manufacturing and distribution firms of the Portland Harbor and Columbia Corridor place primary emphasis on balancing the twin goals of sustainability and added employment. Maintain the integrity of the industrial sanctuary; invest in the function of this area as the region’s transportation and freight hub. A reminder: “Sustainability means more than green, it also means efficient.”
• Neighborhood business districts see small business as the “engine” of the Portland economy – especially in a community that values quality of life as well as job growth. The public sector should be “more opportunity seeking.” Rather than competing for large employees in a globally incentivized market, focus on a different strategy emphasizing training for small business. To contribute more, small business needs strengthened advocacy – both mainstream and especially ethnic firms.
• Mixed use and transit oriented development is pointing the way in Portland to a greener and more prosperous economic future. One focus group participant said that this is “one of the few places in the U.S. to be sustainable.” Another observed that: “People want back into the village environment.” And this: “Portland – we’re more of a brand than we think we are.”
In the absence of major economic drivers, the region has no clear idea how people employ themselves today – the “market is always ahead of us.” The composition of the economy is likely to be totally different again in 20 years – in ways that are as yet not readily determined. While a lower level of economic activity might be expected for much of the next decade, the region will be healthy again in 10 years if it emphasizes “creative, tenacious minds.” Encourage industry to be more sustainable – looking for green opportunities not only in design but also business operations.
• Institutional uses are expected to be “critical” as an increasingly important source of employment in the future. Higher education and health care together play an increasingly important role in cultivating community health and vitality – both with an aging population and as a source of drawing new talent into Portland. Institutions are also proving to be leaders with green design – increasingly committed to achieving LEED standards with new buildings.
ECONOMIC DEVELOPMENT FOCUS
The final question asked was intended as a means to recap and summarize the focus group sessions: What do you see as the single most important action that the City of Portland can take
for improved business and employment opportunity with this Comprehensive Plan update?
Unlike the other questions that involved open discussion, participants in each group were asked to identify their top suggestion on an individual basis – going around the table one-by-one. Not surprisingly, a wide range of suggestions were received. However, these responses appear to have fallen into a few major categories. Some were mentioned in virtually every group, while

Adopted – October 2012
E.D. Hovee & Company, LLC for City of Portland:
Economic Opportunities Analysis Section 1 Trends, Opportunities & Market Factors 41
others were identified less frequently albeit were of significant importance in a certain specific demand issues.
Mentioned Most Frequently:
• Need for greater regulatory flexibility better tailored to unique needs of individual businesses and/or business demand groupings (important across all six focus groups).
• More clearly demonstrated recognition of the contribution of business to Portland’s vitality – a change from regulators to partners – asking “what can we do to help” (a theme expressed across all but the TOD/Mixed Use Corridors group).
• Greater City emphasis on cultivating business opportunity in Portland – with active marketing but without “picking winners” (a theme across all but the institutional group).
• Need for better business access to resources, incentives and/or tax structure reform – ranging from desired reform of the business income tax, to loan/incentive programs for small business to a point person/advocate for business in City Hall (identified by in some fashion by all but the manufacturing and distribution group).
Mentioned Less Frequently (but important with some focus groups):
• Investment in multi-modal transportation, utility and livability infrastructure for business competitiveness and density (of importance for Central City office, manufacturing and distribution, neighborhood commercial and campus institutional).
• Setting aspirational goals that are City-driven but with regional cooperation – getting Portland “back to a visionary place” (important for Central City office, neighborhood commercial and TOD/mixed use corridors).

Adopted – October 2012
E.D. Hovee & Company, LLC for City of Portland:
Economic Opportunities Analysis Section 1 Trends, Opportunities & Market Factors 42
VV.. DDEEMMAANNDD AANNAALLYYSSIISS IISSSSUUEESS –– DDAATTAA AASSSSEESSSSMMEENNTT
Focus groups were intended to provide a qualitative assessment of recent and emerging trends as well as opportunities for future job development in Portland. The qualitative review is now supplemented with a more quantitative, data driven assessment of recent trends and current conditions. Taken together, the quantitative and qualitative assessments are intended to better inform the determination of future opportunities and employment forecasting for subsequent phases of the Portland Plan process.
Demand topics considered with this more in-depth data analysis are similar to those of the focus groups, organized to cover:
• High rise office development
• Incubator & manufacturing districts
• Neighborhood commercial districts
• Institutional development
Incubator and industrial/manufacturing activity are reviewed together. Transit-oriented and mixed use development is considered in conjunction with both high-rise and neighborhood commercial. As employment data has now been updated from 2006 (with the 2009 draft EOA) to 2008 (with this report), all data as well as related focus group perspectives provided with this demand analysis discussion is now as of the 2008-09 time period.
A. HIGH RISE OFFICE DEVELOPMENT
This topic is concerned with the extent to which high density central city product can be expected to grow over the forecast period, and the extent to which similar product will be realized outside of the Central City. The guiding question of this analysis is: What is the demand
for high density office product? Questions that inform this central theme include:
• Where has high rise development occurred in the recent past?
• What has been the historic pace of new development and absorption of higher density office products?
• What areas of the region outside of the city are competing for dense products/top rents?
• How has employment changed within districts zoned for high rise development?
Location Trends: Mid-High Rise Office Development
The City of Portland’s mid-high rise product (focused on development of 4+ stories) is still very much clustered within the Central City: the downtown, River District and Lloyd District. The Central City has supported 28 newly constructed 4+ story buildings over the past 20 years, and the renovation of an additional 43 buildings. Outside of these districts, recently constructed buildings of this size are more limited: eight mid-high rise buildings have been newly constructed and 11 renovated.

Adopted – October 2012
E.D. Hovee & Company, LLC for City of Portland:
Economic Opportunities Analysis Section 1 Trends, Opportunities & Market Factors 43
Non-Central City Office
Recent office development or renovation of more than four stories outside Portland’s Central City area are dispersed (Figure 16). However, all but two buildings fall within neighborhoods adjacent to the downtown and Lloyd District: Northwest, the Central Eastside (which has primarily seen renovations rather than new construction), North Macadam and the Adidas headquarters buildings near Swan Island. Outlying buildings consist of one four-story southeast medical building (at the Clackamas County border) and one four story mixed tenant office product at Airport Way.
Of the newly constructed (versus renovated) buildings, half are classified as Class A and half as Class B office product. The only buildings served by structured parking, however, are medical and corporate headquarter campus (Adidas).
Both multi-story development and either structured parking or reduced parking ratios are necessary to increase the employment capacity of Portland’s land base. Without structured parking, even high-rise buildings will not achieve greater land efficiency as typical office parking provisions allow for roughly an equivalent square footage in parking as is provided in building space. Reduced parking ratios represent another approach to increasing efficiency of site utilization, but this is only achievable in areas that are well served by transit.
Figure 13. Non-Central City Office Development 4+ Stories (post 1990)
Year Built Building Name Use StoriesBuilding
Class Parking Building Address
Avg Weighted
Rent
Rentable Building
Area
Outer Southeast2008 Mt. Scott Professional Center medical 4 A surface 9300 SE 91st Ave $30.00 52,500
Inner Southeast2003 Central Eastside Office Blding mixed 4 B surface 3611 SE 20th Ave $20.00 20,000
1952/2007 RiverEast Center mixed 4 B surface 49 SE Clay St NA 100,800
1928/2003 The Weatherly mixed 12 B surface 516-540 SE Morrison St $21.00 69,900
1925/2004 Eastbank Commerce Center mixed 4 B surface 1001 SE Water Ave $15.99 60,000
1920/2007 Olympic Mills Commerce Center mixed 8 B surface 107 SE Washington St $18.15 108,300
Inner NW2005 NW Cntr for Orthopedics & Rehab. medical 4 B mixed 1515 NW 18th Ave $24.00 33,300
2000 CNF Campus: Ad Tech 2 corporate HQ 5 A surface 2055 NW Savier St $25.50 248,200
1900/1998 Bridgetown Bldg mixed 4 C surface 1631 NW Thurman $24.00 67,300
Inner North/Northeast2002 Adidas Village: Rome Blding corporate HQ 4 A structured 5055 N Greeley Ave NA 67,300
2002 Adidas Village: Chamonix Blding corporate HQ 4 B structured 5055 N Greeley Ave NA 54,000
1960/2002 Adidas Village: Athens Blding corporate HQ 6 A structured 5055 N Greeley Ave NA 147,000
1960/2002 Adidas Village: Mexico City Blding corporate HQ 4 B structured 5055 N Greeley Ave NA 22,200
Outer North/Northeast1996/2006 One Airport Center mixed 4 A surface 7700 NE Ambassador Pl NA 73,300
Inner Southwest1989/2008 River Forum II mixed 4 B surface 4386 SW Macadam Ave $24.50 38,600
1985/2004 River Forum I mixed 5 A surface 4380 SW Macadam Ave $24.49 145,700
1996 PCG Corporate Center corporate HQ 4 B surface 4650 SW Macadam Ave NA 41,400
1982/1991 ADP Plaza mixed medical 4 B surface 2525 SW First Ave $24.60 180,800
1979/1991 Raleigh West Executive Bldg mixed 4 B surface 6443 SW Beav Hillsdale Hwy $17.00 56,900
Source: CoStar March 2009, E. D. Hovee & Company, LLC.

Adopted – October 2012
E.D. Hovee & Company, LLC for City of Portland:
Economic Opportunities Analysis Section 1 Trends, Opportunities & Market Factors 44
Urban Centers Office
Portland’s eastside urban centers (Hollywood Town Center and Gateway Regional Center) have supported a cluster of mostly three story buildings but very little new office construction and no Class A office product. Only two new office buildings have been constructed in Hollywood since 1981: the Providence Healthcare building and a small amount of leasable space associated with a new multi-story 24 Hour fitness club. Older multi-story office product is largely leased to medical users.
Medical/health care activity also appears to be the driver for Gateway office development. Two new medical buildings have been constructed since 1990 and one small (18,000 square feet) mixed-tenant building. Medical users – like educational institutions – are now a pivotal driver in many non Central locations, as they can support higher rents, are often concerned with conserving land for future expansions, and are interested in dispersing to serve both population growth areas and areas currently underserved.
Figure 14. Centers Office Development 4+ Stories
Center Building NameBuilding Use Stories
Building Class Building Address
Average Weighted
Rent
Rentable Building
AreaHollywood Town Center1927/2007 K-2 Building mixed 4 C 4152 NE Sandy Blvd NA 26,000
2006 Phase I 3 B 4218 NE Halsey St NA 76,400
1981 Hollywood Professional Bldg 3 B 3939 NE Hancock St NA 19,200
1970 Building B medical 3 C 5228 NE Hoyt St NA 19,700
1966 3 C 3835 NE Hancock St NA 10,200
1965 Providence Medical Office Buildingmedical 3 C 545 NE 47th Ave $34.00 32,200
1947 Hollywood Square 3 B 1827 NE 44th Ave $14.50 26,800
1941 medical 3 B 1235 NE 47th Ave NA 178,200
1923 medical 3 C 2106 NE 47th Ave NA 2,800
Gateway Regional Center -
2008 3 B 11006 SE Division St $21.00 18,000
2007 Oregon Clinic medical 4 B 1111 NE 99th Ave NA 101,600
1994 Gateway Medical Plaza medical 3 B 10535 NE Glisan St $29.57 23,100
1988 Multnomah Plaza 3 B 305 NE 102nd Ave $18.18 46,600
1987 Columbia East Bldg 3 B 10011 SE Division St $15.00 32,200
1979 Lincoln Bldg 3 B 9955 SE Washington NA 25,300
1967 Parkway Plaza Professional Bldg medical 3 C 10105 SE Division St NA 8,900
Source: CoStar March 2009, E. D. Hovee & Company, LLC.
Office Drivers
Focus group participants suggested that proximity to both housing and retail is increasingly pivotal to attracting new office investment. The success of the Pearl and the River District is widely attributed to the mixed use environments of these districts – first for residential and more recently as a premier office address. These areas realized over one million square feet of office development from 1990-2009 as well as the bulk of newly development residential units.

Adopted – October 2012
E.D. Hovee & Company, LLC for City of Portland:
Economic Opportunities Analysis Section 1 Trends, Opportunities & Market Factors 45
The downtown, however – which supports less market rate housing – realized over 2.8 million square feet of office development over this time period, a greater volume although a significantly smaller rate of growth compared to the existing building stock. Lloyd District realized just under one million square feet of new development. One-quarter of the square footage developed within these areas was driven by institutional users (public and education).
Beyond housing, recent themes in office development activity include the Central City streetcar alignment, availability of low-cost historic building stock and institutional end-users. Only 13 office buildings of four or more stories have been developed in the city since 2000. Three of these were multi-tenant towers built in 2000 – 2002 (in the CBD, Lloyd and River District). Four additional buildings were developed by end-users (three for corporate headquarters). Of the six remaining buildings, four are 50,000 square feet or fewer. Other than updates that regularly occur within the office building stock, investment in renovated office product has focused on lower cost buildings in transitional districts such as Old Town and the Central Eastside.
Figure 15. Citywide Office Development Since 2000
Development Post 2000
Geography New
Construction Renovation Description River District 3 6 New: 1 smaller flex, 1 mid-sized office property in 2008-2009 along
streetcar; 1 new Brewery Block tower in 2002. Rehabs include the Brewery Blocks, Old Town's Creative Services Center (public), U of Oregon’s White Stag renovation and an update to an Old Town tower.
Gateway 1 0 Mid-sized medical
Downtown 3 18 New: 1 smaller office condo along streetcar, 1 built for non-profit end-user, 1 tower in 2000. Renovation: largely upgrading of historic properties already in office use.
Lloyd 1 0 1 tower in 2001
Close-in 4 0 1 smaller medical, 3 corporate headquarters buildings
Central Eastside
1 4 Renovation of three mid-sized former industrial buildings into office/flex use and update of 1 mid-sized office tower. New: 1 smaller multi-tenant space in industrial area
Hollywood 0 1 Small historic office rehab
Airport Way 0 1 Update of mid-sized office
John's Landing
0 2 Small and mid-sized office updates
Total 13 32
Source: CoStar, E. D. Hovee & Company, LLC.
In general, office development has not been significant over the past decade. Larger towers were only recently (as of 2009) being initiated again and exclusively within the CBD: the ZGF tower, the Morrison Bridgehead project and Tom Moyer’s Park Avenue West (currently on hold).
Density Realized vs. Zoned
The following map illustrates building square footage, per site, as a percentage of total square footage allowable by zone (base zone, without bonuses). This is displayed to inform conversations on whether zoned capacity should be increased in any areas.

Adopted – October 2012
E.D. Hovee & Company, LLC for City of Portland:
Economic Opportunities Analysis Section 1 Trends, Opportunities & Market Factors 46
Only Central City subareas, key commercial corridors and the Northwest neighborhood are identified as being developed at more than 10% of zoned capacity. The largest density of taxlots in which development approaches zoned capacity appears to be within the Northwest neighborhood, west of I-405 and north of Burnside.
Comparative Development Feasibility
High rise development typically is associated with a rent or price premium. The caveat to this would be renovation of historic buildings which may have originally been designed for office, warehouse or some other use. Available data indicates that the top tier of office rents is above $26 per square foot (as of 2009), down from a peak above $30 in 2006 and paradoxically below what is required to support market rate high rise construction despite office towers recently constructed or planned.
Other areas that have succeeded in attracting top of the market rents beyond Portland and include:
• St Vincent’s Providence Medical Center (Hwy 26/Beaverton)
• Kruse Way (Lake Oswego)
• Cascade Park (east Clark County)
• Dispersed product in outlying southwest (Tigard, Tualatin, Wilsonville)
As of 2008, however, Portland’s Central City still encompassed more than half of the region’s total office product and close to 60% of its Class A office product. Continued investment in new buildings and reinvestment in Portland’s historic building stock is expected to continue over the 25 year forecast period.
To date, Portland has successfully retained a critical mass of employment activity within its historic core and thus far at least limited the development of major competing fringe centers. Kruse Way would be the primary exception, but remaining land within that office cluster is now relatively limited.
However, future high rise construction within the City of Portland will increasingly compete with office clusters located elsewhere throughout the region. There is recent evidence of an emerging trend for a more dispersed pattern of office center development, Class A office development since 2000 has been fairly equally dispersed throughout the region, with Portland’s Central City capturing about one-third of new construction.
Midrise construction and renovation of office space appears to be the primary Central City opportunity to compete for a larger share of the regional office space market, according to a 2011 study by ZGF and ECONorthwest (Cost Competitiveness of the Central City). Comparing office tenant types by their location preferences, the types that were found most likely to shift to or away from the Central City are “cost conscious” tenants motivated primarily by rent levels and “urban character” tenants especially in creative services attracted by urban amenities. The study compared the cost competitiveness of Central City and suburban locations for five development prototypes, finding higher Central City development costs for each prototype. Cost gaps could

Adopted – October 2012
E.D. Hovee & Company, LLC for City of Portland:
Economic Opportunities Analysis Section 1 Trends, Opportunities & Market Factors 47
Figure 16. Existing Development as a Percent of Zoned Capacity
Source: Portland Bureau of Planning & Sustainability, E. D. Hovee & Company, LLC.

Adopted – October 2012
E.D. Hovee & Company, LLC for City of Portland:
Economic Opportunities Analysis Section 1 Trends, Opportunities & Market Factors 48
be overcome by a range of location incentives or amenities for developers, office tenants and office employees. The study distinguishes the high-density core and mid-density edge areas of the Central City, and the latter appears best suited to compete in these expanding office markets.
EMPLOYMENT TRENDS WITHIN PORTLAND’S URBAN GEOGRAPHIES
Job change is the final lens used to gauge current and potential demand within Portland’s mid and high-rise districts. These urban geographies include the Central City districts (both non-industrial and industrial/incubator) plus urban centers outside the Central City area.
2008 Employment
In 2008 there were nearly 108,000 jobs within the primarily commercial areas of the Central City, with another 21,000 jobs in the Central City incubator/industrial districts of the Central Eastside and Lower Albina. The majority of Central City jobs – over 66,000 – have been situated within the Central Business District (including South Waterfront). In terms of job numbers, the Lloyd District is the second largest subdistrict which is approaching 17,000 jobs followed closely by the River District at just over 16,000.
2000-08 Employment Change
Both in and outside the Central City, the service sector has dominated Portland’s job gains from 2000-08. This pattern has held for traditional commercial areas as well as the city’s industrial districts.
Since 2000, industrial areas have accounted for 9,000 (or 28%) of the net citywide gain of over 32,000 service sector jobs. Much of the demand for service sector employment within industrial districts is being accommodated by 1-2 story rise business park and flex space, rather than by traditional multi-level office buildings.
As noted, at least some portion of the service sector job growth reported with employment data for industrial areas likely represents reclassification of industrial employment to service sector activities. For example, within the management sector (newly created with NAICS) which included holding company and corporate activities, reported employment more than doubled from 6,800 to 14,600 jobs; a portion of this increase is undoubtedly due to industry reclassification.
The major drivers of office demand in mid and high-rise office districts for Portland’s urban geographies vary somewhat by district. Significant changes occurring between 2000 and 2008 are noted as follows:
• Within Portland’s CBD (including South Waterfront), service sector employment increased by more than 1,700 jobs over this period, with another 635 jobs added in education and health services. These gains were not adequate to offset a net CBD job loss of nearly 3,100 jobs.

Adopted – October 2012
E.D. Hovee & Company, LLC for City of Portland:
Economic Opportunities Analysis Section 1 Trends, Opportunities & Market Factors 49
• The River District experienced a net gain of more than 2,500 jobs from 2000-08, with office-related job gains concentrated in services (+1,500), information and design (+825), and education and health (+590) – offset in part by net loss of industrial employment with legacy manufacturing and transportation, warehousing and wholesale firms. Strong growth of non-office employment (+2,000) is also noted for Pearl District activity in retail, arts and accommodations (including dining).
• Portland’s Lloyd District also realized a substantial reported net job gain (up by more than 2,000). This was led by gains of office-related service sector jobs (+2,700), partially offset by some loss of industrial job base.
• Goose Hollow reported nominal employment growth in construction with job losses in nearly ever other industry sector, for a total employment decrease of 1,100.
• Of the non-Central City Commercial geographies, Hollywood is noted for the largest employment gain (over 2,200), indicated as being primarily related to education and health (+2,150).
• While overall employment increased only nominally in the Gateway area, strong growth was indicated for education and health (up by almost 1,000 jobs), offset by losses in a number of other job categories.
• Other urban geographies – including the University District in the Central City and other Urban Centers of St. Johns, Hillsdale, Lents, and West Portland – appear to have experienced very little job change over the 2000-08 period.
Figure 19 depicts the components of employment change across each of Portland’s urban geographies from 2000 to 2008.
Employment Mix
Portland’s urban geographies differ not only in terms of recent employment gain or loss, but also with regard to the 2008 mix (or distribution) of employment:
• Approximately 46% of CBD employment is comprised of service businesses (ranging from professional to financial services), with 17-18% each in sectors of information and design and retail, arts and accommodations activity and 12% in the public sector. Together, these functions account for 92% of CBD employment.
• River District employment is relatively diverse, with retail, arts and accommodations accounting for 27% of employment, followed by services (at 21%), then information and design (16%), and with a still significant (15%) portion in transportation, warehousing and wholesaling activity.
• Services and retail (including arts and entertainment) account for about 70% of the Lloyd District employment.
• Central City incubator districts have an increasingly diverse mix of employment activity. Industrial accounts for 44% of Central Eastside employment, with strong added components of retail and service activities (at 17% each). In Lower Albina, industrial use accounts for a lesser 33% of district employment; education and health accounts for nearly half (at 46%).
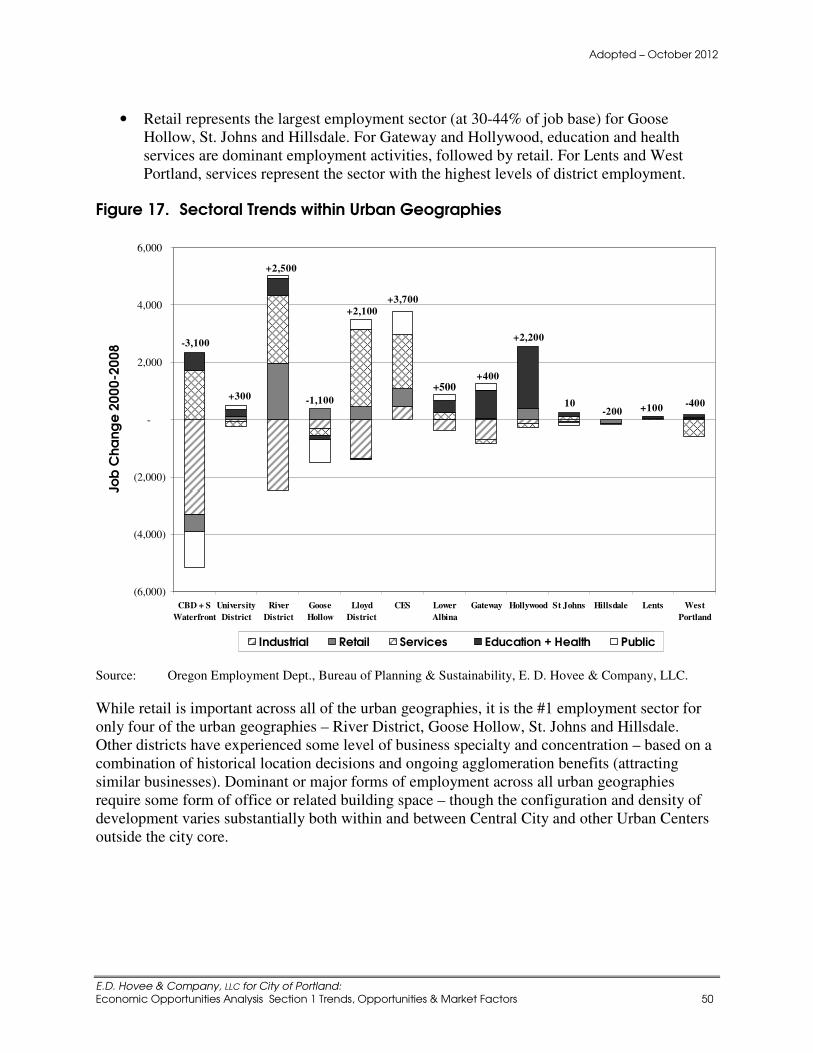
Adopted – October 2012
E.D. Hovee & Company, LLC for City of Portland:
Economic Opportunities Analysis Section 1 Trends, Opportunities & Market Factors 50
• Retail represents the largest employment sector (at 30-44% of job base) for Goose Hollow, St. Johns and Hillsdale. For Gateway and Hollywood, education and health services are dominant employment activities, followed by retail. For Lents and West Portland, services represent the sector with the highest levels of district employment.
Figure 17. Sectoral Trends within Urban Geographies
(6,000)
(4,000)
(2,000)
-
2,000
4,000
6,000
CBD + S
Waterfront
University
District
River
District
Goose
Hollow
Lloyd
District
CES Lower
Albina
Gateway Hollywood St Johns Hillsdale Lents West
Portland
Job
Ch
an
ge
20
00
-20
08
Industrial Retail Services Education + Health Public
+3,700
-200
+2,200
-400+10010
+400+500
+2,100
-1,100
+2,500
+300
-3,100
Source: Oregon Employment Dept., Bureau of Planning & Sustainability, E. D. Hovee & Company, LLC.
While retail is important across all of the urban geographies, it is the #1 employment sector for only four of the urban geographies – River District, Goose Hollow, St. Johns and Hillsdale. Other districts have experienced some level of business specialty and concentration – based on a combination of historical location decisions and ongoing agglomeration benefits (attracting similar businesses). Dominant or major forms of employment across all urban geographies require some form of office or related building space – though the configuration and density of development varies substantially both within and between Central City and other Urban Centers outside the city core.

Adopted – October 2012
E.D. Hovee & Company, LLC for City of Portland:
Economic Opportunities Analysis Section 1 Trends, Opportunities & Market Factors 51
INDUSTRIAL AREAS
Portland has several different kinds of industrial areas: manufacturing/distribution, incubator and mixed. For this EOA analysis, Columbia Harbor alone has been classified as a manufacturing/distribution industrial district. The Central City industrial districts of Central Eastside and Lower Albina are considered incubator, meaning they include a broader mix of industries. This mix is reflected in recent zoning amendments allowing greater amounts of office product – normally restricted within industrial sanctuaries – for information and design services. The Columbia Corridor (east of NE 82nd Ave) and the Dispersed Industrial areas are considered mixed industrial areas.
The guiding question for this discussion is: What competitive advantages are offered by the
City’s manufacturing/distribution and incubator districts – both currently and prospectively? More specific aspects of this guiding question are:
• What job trends are observed within these districts?
• In what ways are job patterns similar or different between the manufacturing/distribution and incubator districts?
• What niches are forming within the incubator districts? Are they distinct from Columbia Harbor or other employment districts?
• How do incubator districts complement the Central City business district activity?
• What have absorption trends (demand) been in these districts?
Industrial/Incubator Employment Trends
Employment within Portland’s five industrial areas totaled close to 119,500 in 2008, representing 30% of employment citywide. In total, industrial areas report a net increase of approximately 500 jobs 2000-08, a gain averaging 0.1% annually. Employment losses were greatest in manufacturing (-6,800 jobs), followed by a net loss of nearly 4,700 transportation, warehouse and wholesale jobs. It should be noted that the employment trends in industrial geographies are contradicted by trends showing increased manufacturing output and cargo volumes over roughly the same time period. This is discussed later in this section.
Off-setting job losses in the industrial areas were an increase of approximately 9,100 service sectors jobs excluding retail and public administration (but including education and health). Again, some portion of these jobs likely reflects re-classification of jobs classified as industrial in 2000. An increase in utilizing temporary employment agencies has also likely caused some industrial areas jobs to be reported in other geographies (where temp agency offices are located).
District Specific Trends
One of the most important distinguishing factors between these districts – and the driver behind the “incubator” classification applied to the Central City districts – lies with their employment composition. Despite recent shifts towards service sector employment, Columbia Harbor retains close to 75% of its job base within the industrial sectors. Manufacturing represents 27% of total employment with transportation, warehousing and wholesale activities at 40%; construction accounts for another 7% of Columbia Harbor employment.
Adopted – October 2012
E.D. Hovee & Company, LLC for City of Portland:
Economic Opportunities Analysis Section 1 Trends, Opportunities & Market Factors 52
As noted, this district is particularly distinguished by its high share of employment within the transportation and warehousing sectors. Columbia Harbor is also by far the largest industrial area, comprising 52% of total industrial area employment citywide. However, employment has declined in recent years, especially for the Harbor Access Lands portion of the Columbia Harbor geography.
Within the city’s other industrial areas, industrial jobs represent a range of 33% of district employment in Lower Albina to 53% in Columbia East of 82nd. Retail accounts for 17% of employment in Central Eastside and 14% in Columbia East of 82nd. In the other industrial districts, retail accounts for less than 10% of the job total.
In Dispersed Industrial areas, just 42% of jobs are associated with industrial sectors. At 35%, services are almost double their share as in any other industrial district, indicating that land use may have diverged from the zoning designation of these areas.
Service businesses (including information/design and education/health but excluding public administration employment) range from 17% of the job base in the Columbia Harbor to 55% in Lower Albina (for which Portland Public Schools is a major educational anchor employer). Service employment also exceeds industrial employment for the city’s Dispersed Industrial areas.
Net Job Gains vs. Losses
As illustrated by the following graph, the Columbia Harbor and Dispersed Industrial areas experienced net job loss from 2000-08. While not directly depicted by the graph, job losses (in percentage terms) where most substantial for Harbor Access Lands, a subset of the Columbia Harbor geography.
Conversely, the Columbia East of 82nd area as well as Central Eastside and Lower Albina incubator districts realized employment gains. Despite declining industrial employment, the Columbia Harbor and Dispersed Industrial areas experienced some partial offsets with service sector job gains. Employment growth in the East of 82nd Avenue area was fairly balanced between service and industrial sector activity; a lesser proportion of industrial job growth is noted for Central Eastside.
Overall, Portland lost an estimated 22,700 industrial jobs between 2000 and 2008 (albeit with some portion likely reflecting a classification shift into the service sectors). Of this total, about 11,450 of the industrial job loss (or 50%) occurred within the city’s five identified industrial districts; the remaining 50% is associated with declining industrial employment or shifts away from industrial employment classifications experienced elsewhere in the city.

Adopted – October 2012
E.D. Hovee & Company, LLC for City of Portland:
Economic Opportunities Analysis Section 1 Trends, Opportunities & Market Factors 53
Figure 18. Industrial Areas Sector Changes (2000-2008)
(10,000)
(8,000)
(6,000)
(4,000)
(2,000)
-
2,000
4,000
6,000
Col Harbor East of 82nd Dispersed CES Albina
Job
Ch
an
ge
20
00
-20
08
Industrial Retail Services Education + Health Public
-4,800
+3,900
-2,800
+500
+3,700
Note: As “hybrid” or incubator districts, information for Central Eastside (CES) and Lower Albina is also shown with the Central City Commercial geographies.
Source: Oregon Employment Dept., Bureau of Planning & Sustainability, E. D. Hovee & Company, LLC.
Information & Design Services Trends
This sector has been identified as being of particular relevance in the industrial districts, especially the City’s emerging incubator districts. The Employment Opportunity Subarea within the Central Eastside Industrial Sanctuary allows out-right greater amounts of office space if occupied by information and design business types. The change sought to recognize the compatibility of business-serving businesses within the Central Eastside, the desire of these businesses to locate within the district, and the difficulty of reusing the district’s historic multi-level industrial building stock for traditional industrial uses.
Information and Design Services (NAICS 51 and 54) consist of the information sector (except movie theaters), and the professional and technical services sector (except lawyers and accountants). The Central Eastside increased employment within this sector by about 930 jobs. However, it added an equivalent number of “traditional” service business jobs, and another 600 retail jobs, suggesting district attraction that extends beyond information and design. It should also be noted that the Central Eastside includes commercial as well as industrial sanctuary zoning; sector growth has not been cross-tabulated with zoning within the district.

Adopted – October 2012
E.D. Hovee & Company, LLC for City of Portland:
Economic Opportunities Analysis Section 1 Trends, Opportunities & Market Factors 54
Also of interest is how this sector changed in other city geographies. With a net gain of 825 jobs, the River District attracted almost as much of the employment growth in this sector as the Central Eastside. Another net gainer with this sector was Dispersed Commercial – up by 660 jobs from 2000-08. In contrast, information and design employment declined slightly (by about 20 jobs) in the CBD.
Participants in the focus groups conducted in 2009 described both the importance of keeping residential uses out of the Central Eastside and increasing zoning flexibility, recognizing its role as a complement to the CBD. The growth rates within the CES indicate that it is successfully attracting new jobs, with somewhat greater net job gains through 2008 than for the River District (the closest contender as a CBD business alternative).
Building Development Trends
Despite job losses across the industrial sectors, Portland has realized development of new industrial building construction at an average rate of 1.5 million square feet per year (resulting in an end of 2008 in-city industrial building inventory of 81 million square feet). The amount of new industrial construction realized is significantly greater than the amount of development that occurred within either the retail or office building sectors (which realized 170,000 and 400,000 square feet annually citywide).
Figure 19. Recent Industrial Development Trends (2003-2008)
Total
SubareaNew
ConstructionAnnual
Absorption
Rentable Building Area
Central CityCBD - (7,000) 1,176,000
Lloyd District - 53,000 2,671,000
NW Close In - 3,000 1,044,000
Johns Landing - 6,000 386,000
Inner NeighborhoodsSW Close In - - 217,000
NE Close In 1,400 45,000 3,813,000
SE Close In - 253,000 7,171,000
Industrial AreasHayden Island/Swan Island - 226,000 9,570,000
Rivergate 540,000 513,000 11,810,000
Guild's Lake 1,200 77,200 12,137,000
East PortlandAirport Way 54,000 246,000 11,550,000
Mall 205 - (300) 231,000
Gateway - 16,000 1,615,000
East Columbia 832,000 730,600 17,641,000
Total 1,428,600 2,161,500 81,032,000
Annual Average
Source: CoStar, E. D. Hovee & Company, LLC.

Adopted – October 2012
E.D. Hovee & Company, LLC for City of Portland:
Economic Opportunities Analysis Section 1 Trends, Opportunities & Market Factors 55
Observations of note from this data have included the following:
• Industrial development activity has located almost exclusively within the Columbia Harbor region: East Columbia (which includes some properties outside of the city), Rivergate and Airport Way. East Columbia and Rivergate report significant annual average new construction at 830,000 and 540,000 square feet per year (through 2008) respectively.
• Business park activity has dominated East Columbia development, whereas Airport Way was more equally split between stand-alone buildings (averaging around 25,000 square feet annually) and business park development.
• Recent development within both East Columbia and Rivergate also has had a significantly larger format, averaging 70,000 and 160,000 square feet respectively (reflecting Rivergate’s distribution emphasis).
• The apparent disconnect between industrial jobs and industrial development may be related to high rates of industrial vintage relocation (existing businesses moving to new buildings, potentially leaving empty buildings unfilled – although vacancy rates have steadily fallen over the past five years to under 8% today) or changes in building use (with increased square feet per employee).
Thus far, Portland’s manufacturing and distribution space does not appear to have realized the change in form and density that has been occurring with office and retail product, which are moving towards denser urban forms both within the Central City and along commercial corridors. While focus group participants cited a Central Eastside manufacturer that functions in a multi-story environment, this appears to be an anomaly. 7 A more common trend observed within the region’s industrial parks is high cube space, in which building footprints are reduced by developing very high ceiling, single story warehouses (which can store more product in a given amount of building floor area).
Beyond Employment Trends
The recent disconnect between employment and real estate trends is especially pronounced within the industrial sectors. While this Trends, Opportunities and Market Factors report is primarily concerned with employment trends and employment as a driver of land needs, it is important to note that jobs are not the only land driver or measure of an industry’s economic contribution.
For instance, during this most recent period of industrial job loss, the Bureau of Economic Analysis reports that the value of manufacturing output increased by more than $9 billion for the 7-county region (Figure 23). More specifically, the economic activity in the Portland Harbor grew at 1.6% per year during approximately the same timeframe - 2002 to 2008. During that same time period, cargo volumes increased by 4.8% per year. Within the manufacturing sector at least, business growth (or profit) appears to contradict job growth, due in part to high commodity 7 The firm involved cited with multi-story Central Eastside manufacturing activity is an example of a long-time
business located in historic building stock. New industrial or warehouse development has yet to replicate the multi-story patterns of the first half of the last century.

Adopted – October 2012
E.D. Hovee & Company, LLC for City of Portland:
Economic Opportunities Analysis Section 1 Trends, Opportunities & Market Factors 56
pricing and strong export markets. Equivalent data for other industrial sectors such as transportation and warehousing is suppressed due to confidentiality.
Figure 20. Portland-Vancouver MSA Gross Domestic Product Trends (2001-2006)
Industry 2001 2006 Net AAGRAll industry total 77,200 103,400 26,200 6.0%
Private industries 69,600 94,000 24,400 6.2%
Manufacturing 12,000 21,000 9,000 11.8%
Transportation and utilities 3,600 4,300 700 3.6%
Retail trade 4,300 4,900 600 2.6%
Professional and business services 8,700 11,000 2,300 4.8%
Education and health services 5,400 7,600 2,200 7.1%
Leisure and hospitality 2,300 3,000 700 5.5%
Information, Communication, and Technology (ICT)8,200 15,800 7,600 14.0%
Government 7,500 9,400 1,900 4.6%
Private goods-producing industries 16,600 26,700 10,100 10.0%
Private services-providing industries 53,100 67,300 14,200 4.9%
Change($ millions)
Source: Portland Bureau of Planning and Sustainability, Bureau of Economic Analysis, April 2009.
Focus Group participants – both for this study and for the 2006 Working Harbor Reinvestment Strategy – offer some suggestions into how industrial employment trends, complicated by data inconsistencies, can be interpreted:
• For at least some industries, productivity improvements have led to growing output while employment has declined. For industrial uses, this activity was especially pronounced during a period when the value of the U.S. dollar was relatively low, stimulating export demand.
• Both industrial real estate brokers and City permit data report that the bulk of recent demand has been for warehouse and distribution uses; these typically are associated with lower employment densities than manufacturing.
• Distribution and wholesale activity in Portland may have benefitted from some “deconsolidation” of the national and global distribution industry, especially as higher fuel prices re-emerge with economic recovery. Having more but smaller distribution centers across the nation in smaller metro markets (such as Portland) can result in reduced transport costs.
• In older industrial areas and waterfront industrial areas, site reuse (and associated employment growth) is limited by a number of issues. These include:
� Contamination: owners aren’t yet lowering prices sufficiently to reflect the full cost of clean up, and in many cases the full extent of liability has yet to be resolved (as with Willamette River superfund sites).
� Retrofitting: Building retrofitting is expensive, and the industrial sector typically seeks the lowest cost land and space of any sector.
� Zoning: requiring a business to utilize either rail or water access limits the pool of qualifying businesses and will slow land absorption.

Adopted – October 2012
E.D. Hovee & Company, LLC for City of Portland:
Economic Opportunities Analysis Section 1 Trends, Opportunities & Market Factors 57
� Flood plain: particularly smaller sites become more expensive on a per square foot basis when floodplain or other environmental regulations are in play.
Regional data indicates that recent industrial sector growth has concentrated on the outskirts of the region, where greenfield development is more prevalent. Portland could capture this growth in the future if site re-use could be facilitated, stabilizing its industrial job base.
• Participants in the 2009 focus groups conducted for this EOA also added weight to the idea that employment in the harbor area has shifted towards the service sector: modern industry is described as “service-oriented” rather than needing heavy industrial space (e.g., retailers needing auxiliary warehouse space). In many cases, future demand was described as more likely to reflect industrial design and sales and marketing, with less space devoted to on-site manufacturing. Flex space – with a larger office component, higher parking ratios, and a broad range of space sizes – was described as a building product more in demand (especially in the Columbia Corridor east of I-205).
NEIGHBORHOOD COMMERCIAL DISTRICTS
Neighborhood subareas incorporate the majority of areas outside of the Central City, Urban Centers, Institutions, and Industrial districts. Three different types of neighborhood subareas are covered: Commercial Corridors, Commercial Nodes, and Dispersed Commercial.
These Neighborhood districts account for close to half (42%) of the city’s retail jobs and also a broad mix of employment across almost all sectors. The key guiding question for this sector is: What is the current and future role of neighborhood commercial in Portland’s changing
economy? Related questions for this demand analysis issue topic are:
• What trends have neighborhoods realized in employment?
• What broad demand trends can be predicted for additional neighborhood retail, either from a market or planning perspective?
• What trends have neighborhoods realized in building development?
• What are the implications of neighborhood employment and building development for realizing greater amounts of Transit Oriented Development?
Neighborhood Commercial Growth Trends
In total, Neighborhood subareas accounted for an estimated 70,400 jobs as of 2008, 18% of the citywide job total. The sectors in which neighborhoods capture the greatest share of citywide covered employment are:
• Retail, arts, accommodation & food service: 42%
• Information & design: 19%
• Construction: 17%
• Services: 17%

Adopted – October 2012
E.D. Hovee & Company, LLC for City of Portland:
Economic Opportunities Analysis Section 1 Trends, Opportunities & Market Factors 58
While a significant contributor to the city’s jobs base, employment data indicates that neighborhood commercial subareas lost an estimated 1,900 jobs between 2000 and 2008. Neighborhood district job losses appear to be pulling down the city’s overall employment performance; this loss dwarfs that of any other geography except residential and open space.
Neighborhood district employment losses occurred in the majority of sectors except retail, arts, accommodation & food service (up by nearly 590), services (+440), information and design (+475), education and health services (+550). Net job losses were greatest with Commercial Corridors (-5,100 jobs) and Commercial Nodes (-580). Only Dispersed Commercial is indicated as experiencing net job growth (+3,900).
Commercial Corridors
The city’s Commercial Corridors encompass the largest share of Neighborhood jobs, accounting for 56% of Neighborhood district jobs.
The corridor designation indicates areas in which the City seeks to concentrate commercial activity. Commercial Corridors encompass both general commercial (auto-oriented) and storefront commercial zones, as well as much denser central employment and central housing zones. For this analysis, the corridors geography includes only corridors outside of plan areas and industrial areas, although many of those areas contain designated commercial corridors as well.
However, employment within the city’s Commercial Corridors declined by more than 5,100 net jobs from 2000-08, reflecting a rate of job loss averaging 1.5% per year. Job losses were experienced across all sectors and particularly pronounced for construction, retail, and manufacturing activities.
Job losses indicated by employment data are somewhat surprising given that the focus groups have been bullish on neighborhood commercial growth potential and continued consumer support for these districts. The discrepancy could be due to perception or varying definitions of neighborhood business districts (as this definition of Commercial Corridors excludes nodes as well as town and regional centers).
Commercial Nodes
These areas have covered about 12 intersections and, at 9,600 jobs, represent the least overall employment of the neighborhood geographies considered. Employment declined by nearly 600 jobs from 2000-08, for job loss averaging 0.7% per year. Similar to corridors, these Commercial Nodes experienced reduced employment across most sectors (except education and health).
Dispersed Commercial
This geography is zone-based and includes both auto-oriented and storefront commercial zones that are not in designated commercial corridors. Dispersed commercial areas tend to cluster as “second tier” corridor space and also constitute small areas of discrete zoning (commercial corners).

Adopted – October 2012
E.D. Hovee & Company, LLC for City of Portland:
Economic Opportunities Analysis Section 1 Trends, Opportunities & Market Factors 59
Dispersed Commercial areas accounted for about 21,700 jobs in 2008 (or 31% of neighborhood employment). A net gain of 3,900 jobs is noted for 2000-08 (up by 2.5% per year) – the only one of the neighborhood geographies for which an employment increase is reported.
Nearly one-half of the employment increase occurred with retail, arts and accommodations (including dining) uses. Job gains are also noted for education and health, manufacturing, information and design, and service sector businesses
Dispersed Commercial areas appear to function somewhat differently with a broader mix of job types compared to the other neighborhood geographies. Both industrial sectors and services are more prevalent within this geography. Retail is less important as a share of the total as compared with Commercial Corridors and Nodes.
Corridors, Nodes and Dispersed Commercial include both auto-oriented and storefront commercial zones.
RESIDENTIAL & OPEN SPACE ZONES
As of 2008, these non-employment geographies make up a surprising 10% of covered employment citywide, a total of over 38,900 jobs. Employment within residential zones includes schools, some institutions, home-based businesses and non-conforming uses. Not counted with employment data are individuals not covered by unemployment insurance (likely including many home occupations as sole proprietors, a factor that is likely of greater significance within residential zones).
Covered employment within residential zones is dominated by education and health care (at 45% of total covered employment). This likely reflects those institutional users to which special institutional or employment designations have not been applied (particularly as with neighborhood schools). Services account for another 19% of residential jobs, and retail comprises only 9%.Retail Growth Potential
As previously noted, close to half (42%) of the city’s retail jobs are located within the City’s neighborhoods-based employment geographies. Retail growth is a driver for neighborhood business districts and commercial corridors, but not the primary driver. Jobs data indicates that retail comprises just under one-third of neighborhood jobs across all subareas.
Generally, Portland is adequately retailed. Focus group participants tied retail growth potential to household growth and leakage data supports this assessment. As of 2008, the national demographics firm ERSI Business Analyst estimates that the city supports about $6.5 billion annually in resident-generated demand for retail, food and drink, but generates $7.6 billion in yearly sales volume. This indicates that, in addition to serving local resident needs the city serves as a regional destination market, attracting and supported by residents of surrounding communities throughout the metro region and beyond.
The following graph illustrates citywide retail leakage by store type. Negative numbers indicate store types in which supply exceeds demand: there is no sales leakage, or dollars spent by Portland residents outside of the city (in reality of course, residents shop in a variety of

Adopted – October 2012
E.D. Hovee & Company, LLC for City of Portland:
Economic Opportunities Analysis Section 1 Trends, Opportunities & Market Factors 60
jurisdictions, but the net result indicates that Portland retail supply is adequate to meet the shopping needs of Portland residents).
Retail sales leakage is reported within four retail categories, indicating there may be room for growth to meet residents’ needs for building materials and garden supply (an estimated $87 million in sales leakage); grocery ($7.8 million); health and personal care ($18.5 million), and gas stations (over $100 million).
Retail types estimated to have captured the greatest share of non-resident as well as resident spending potential are restaurants and bars, general merchandise (department stores), and sporting good stores.
Figure 21. City of Portland Leakage by Store Type (2008)
-$600
-$500
-$400
-$300
-$200
-$100
$0
$100
$200
Genera
l Merc
handise S
tore
s
Furn
iture
& H
ome F
urnish
ings S
tore
s
Electro
nics &
Applia
nce Sto
res
Bldg M
ateria
ls, G
arden E
quip. &
Supply
Gro
cery
Health &
Perso
nal Care
Gaso
line S
tatio
ns
Clo
thin
g and C
loth
ing A
ccessorie
s
Sporti
ng Goods,
Hobby, B
ook, a
nd Music
Genera
l Merc
handise
Misc
ellaneous R
etaile
rs
Food S
ervic
es & D
rinki
ng Pla
ces
Source: ESRI, E. D. Hovee & Company, LLC.
These numbers may in also reflect shopping patterns for Portland residents or store classifications that diverge from the national average (for instance, Portland residents may spend less on gas). On the 4-county metro level (including Clark County), retail demand appears to be more in line with supply. In 2008 there was an estimated $24 billion in retail demand and $23 billion in retail sales.
Given that greater retail supply is not needed to meet the needs of residents (of either the city or the 4-county region), retail development over the longer term is dependent primarily on some

Adopted – October 2012
E.D. Hovee & Company, LLC for City of Portland:
Economic Opportunities Analysis Section 1 Trends, Opportunities & Market Factors 61
combination of population and/or income growth coupled with destination tourism activity. Portland can also increase its capture of the regional retail market available by strengthening its destination districts and out-competing surrounding communities.
Complete Neighborhoods
Portland’s retail districts and corridors are a mix of neighborhood-serving and destination businesses, a distinction deriving as much from a business’s product or service mix as from its NAICS classification. Some businesses function as destinations purely because of their status within a business cluster (e.g., as with retailers along NW 23rd or within Lloyd Center Mall); other businesses – such as dry cleaners or convenience markets – are located within a destination business cluster but may primarily serve adjacent households. Many of Portland’s commercial corridors function as destination shopping districts, or as a mix of local and destination shopping.
One of the City’s planning objectives is to encourage complete or “20 minute” neighborhoods, meaning that daily goods and services are available to households within a walkable distance (equating to roughly one mile). Figure 24 shows these neighborhood serving businesses, which comprise about ¼ of total employment, and identifies areas of gaps in retail coverage.
Based on this visual overview, retail opportunities appear to be reasonably well distributed throughout the city except for a few areas that have more than one mile gap between businesses. Neighborhood-serving businesses blanket the city’s commercial corridors and virtually duplicate the arterial street grid. Retail densities decrease east of I-205 (outside of Gateway and SE 122nd), within the Cully neighborhood (west of I-205) and along the narrow but limited residentially populated Northwest corridor between the Willamette River and Forest Park.

Adopted – October 2012
E.D. Hovee & Company, LLC for City of Portland:
Economic Opportunities Analysis Section 1 Trends, Opportunities & Market Factors 62
Figure 22. Neighborhood Serving Retail Locations
Source: Oregon Employment Department, E. D. Hovee & Company, LLC.
Business Associations
Portland’s Business Associations provide another way to analyze retail distribution. Out of the 34 associations, five are predominantly industrial and sales do not represent retail. Of the remaining 29 business associations, 17 reported sales in excess of estimated household demand – these districts function as destinations.
Central City districts top the list for sales capture, given the destination status of downtown retail in general. Neighborhoods with the highest capture rates include Montavilla, Mississippi, St. Johns and Nob Hill. In terms of sales volume, Gateway, 82nd Avenue, North/Northeast and the North Portland Business Association top the list.

Adopted – October 2012
E.D. Hovee & Company, LLC for City of Portland:
Economic Opportunities Analysis Section 1 Trends, Opportunities & Market Factors 63
Figure 23. Non-Industrial Business District Capture Rates & Sales Volumes (2008)
Note: Data is only displayed for non-industrial business associations.
Source: ESRI, Portland Bureau of Planning & Sustainability, E. D. Hovee & Company, LLC.

Adopted – October 2012
E.D. Hovee & Company, LLC for City of Portland:
Economic Opportunities Analysis Section 1 Trends, Opportunities & Market Factors 64
Figure 24. Business Association Supply & Demand (2008)
SupplyType Business Association Demand Supply RankIndustrial Swan Island Business Association $1.5 $157.6 12 10630%
Central City Lloyd District Business Association $11.4 $264.7 8 2328%
Industrial Central Eastside Industrial Council $14.6 $260.2 10 1785%
Industrial Columbia Corridor Business Association $136.7 $1,212.9 1 887%
Neighborhood 42nd Avenue Business Association $2.0 $16.4 31 819%
Central City Downtown Retail Council $131.4 $822.8 2 626%
Central City Old Town Chinatown $32.9 $85.4 24 259%
Central City Pearl District Business Association $60.7 $151.7 13 250%
Neighborhood Foster Area Business Association $49.9 $120.4 18 241%
Neighborhood Montevilla Business Association $45.8 $101.1 20 221%
Neighborhood Historic Mississippi $6.4 $12.4 32 192%
Town Center St Johns $62.8 $102.5 19 163%
Neighborhood Nob Hill Business Association $168.9 $261.8 9 155%
Regional Center Gateway Area Business Association $495.3 $744.8 3 150%
Industrial Columbia Corridor Association and Parkrose Business District$236.4 $349.7 5 148%
Central City Goose Hollow Business Association $71.1 $86.1 23 121%
Neighborhood Hawthorne Business Association $106.8 $124.9 16 117%
Town Center Hollywood Boosters $106.5 $121.9 17 114%
Neighborhood Greater Brooklyn Business Association $141.0 $146.9 14 104%
Neighborhood East Burnside Business Association $51.6 $53.7 27 104%
Neighborhood Multnomah Village Business Association $25.9 $26.4 29 102%
Neighborhood Westmoreland Business Association $6.4 $5.8 33 90%
Neighborhood 82nd Avenue Business Association $627.9 $550.2 4 88%
Neighborhood Belmont Business Association $114.9 $99.3 21 86%
Neighborhood Beaumont Business Association $42.7 $36.1 28 84%
Neighborhood Division-Clinton Business Association $165.4 $128.7 15 78%
Neighborhood Kenton Business Association $34.2 $25.6 30 75%
Neighborhood North Portland Business Association $399.3 $273.5 7 68%
Neighborhood International Business District $151.5 $90.6 22 60%
Neighborhood North-Northeast Business Association $571.2 $317.7 6 56%
Neighborhood Midway Business Association $296.9 $165.0 11 56%
Neighborhood Woodstock Business Association $135.5 $74.4 25 55%
Town Center Hillsdale Business Association $14.1 $1.7 34 12%
Industrial NW Industrial $0.0 $72.5 26 NA
(in $ millions) Sales Capture(Supply/Demand)
Incre
asin
g s
ale
s r
ela
tive t
o d
em
and
Source: ESRI, Portland Bureau of Planning & Sustainability, E. D. Hovee & Company, LLC.
Neighborhoods with relatively lower retail capture include Hillsdale, Woodstock, Midway, North-Northeast, North and Kenton. North-Northeast and North appear to be large districts with lower capture rates despite relatively larger sales volumes. The caveat is that some business associations have been narrowly defined to include a commercial corridor only and not the surrounding households (such as NE 42nd Avenue and Foster Area); sales capture rates for these business districts are therefore not a good estimate for whether surrounding neighborhoods are adequately served. High capture rates can also describe areas with relatively little housing, such as Old Town or Lloyd District (which has a relatively low residential mix and supports a regional mall).
To encourage added retail in areas where existing stores or related customer services are more limited, identifying market drivers to each specific neighborhood district represents a key opportunity and challenge:

Adopted – October 2012
E.D. Hovee & Company, LLC for City of Portland:
Economic Opportunities Analysis Section 1 Trends, Opportunities & Market Factors 65
• Retail is drawn to areas with high household density or high household income and offering good traffic/pedestrian counts plus street visibility. Existing retail locations reflect these market preferences.
• As referenced by focus group participants, neighborhood commercial growth will require greater household density. Encouraging household density – through zoning and project subsidies – may have a greater impact on retail site selection than either introducing commercial zoning or supporting commercial development in areas in which these are now missing.
• Since most (though not all) of the city currently has 20-minute coverage, a priority opportunity may be more to encourage locating critical urban retail services (e.g. grocery) and supportive infill rather than to create new or expanded retail districts.
Neighborhood Commercial Growth Trends: Building Development
Retail space has dominated the inventory of newly developed commercial space within Portland’s neighborhoods, averaging about 300,000 new square feet annually over a five year period (from 2003-08) outside of the Central City. However, retail employment fell by about 4,000 jobs with 2/3 of that loss coming from the neighborhoods despite significant new building development.
The disconnect between these two trends may in part be due to service jobs locating within retail spaces. Also noted is that a significant contributor to neighborhood retail has been dining, which is no longer defined with retail (for employment classification purposes) but with arts, accommodations and food services. This sector is as large within the neighborhood geographies as the retail sector; however, it too declined over the study time frame.
Rather than corresponding necessarily to retail users (as defined by NAICS), retail space is increasingly becoming defined as either a) ground floor space within densely developed districts, with office or residential above, or b) a lower density or smaller footprint product (in comparison with office) within more suburban or main street settings.
Citywide, retail building development over the 2003-08 time period was dominated by Cascade Station, within the Airport Way subarea. That subarea has seen over 620,000 square feet of new large format/power center retail development over this five year period. This is close to twice the square footage added to the CBD (356,000 square feet) over the same time period, about 2/3 of which was ground floor space in residential buildings.

Adopted – October 2012
E.D. Hovee & Company, LLC for City of Portland:
Economic Opportunities Analysis Section 1 Trends, Opportunities & Market Factors 66
Figure 25. Recent Retail Development Trends (2003-2008)
Total
SubareaNew
Construction AbsorptionRentable
Building AreaCentral City
CBD 71,200 39,400 9,195,000
Lloyd District 6,900 17,100 4,689,000
Johns Landing 6,000 2,400 335,000
NW Close In 8,400 15,700 1,803,000
Inner NeighborhoodsSW Close In 8,600 6,600 902,000
NE Close In 24,700 26,200 2,810,000
SE Close In 20,500 40,000 4,085,000
Industrial AreasNorth Portland 47,700 39,600 2,506,000
Rivergate - (1,300) 349,000
East PortlandAirport Way 124,100 139,000 2,710,000
Mall 205 30,500 53,700 3,760,000
Gateway 14,900 32,500 3,720,000
East Columbia 39,500 55,600 3,060,000
Total 403,000 466,500 39,924,000
Annual Average
Source: E. D. Hovee & Company, LLC.
The other top subareas for attracting new (and inventoried) retail development were neighborhoods, with almost all growth locating along commercial corridors such as Killingsworth, Alberta, Lombard, MLK, Belmont, Division and Hawthorne. In-fill development along commercial corridors may also be classified as commercial retail/service by default due to the typical smaller building size.
• North Portland: 140,000 square feet
• Mall 205: 153,000 square feet (a submarket extending beyond the Mall property only)8
• Inner Northeast: 125,000
• Inner Southeast: 100,000
Office development has been both more limited and more concentrated than retail over the study time frame, with only 800,000 square feet developed citywide compared with 1.7 million square feet of new retail space. In contrast with retail trends, about 60% of newly developed office space was located within the CBD + Lloyd District, another 24% in Gateway and the remainder consisted largely of Class B buildings of less than 35,000 square feet each dispersed throughout the city.
8 Mall 205 is a submarket defined by CoStar and encompasses an area larger than the mall property.

Adopted – October 2012
E.D. Hovee & Company, LLC for City of Portland:
Economic Opportunities Analysis Section 1 Trends, Opportunities & Market Factors 67
Implications for Transit Oriented Development
Transit Oriented Development (TOD) describes dense development (a relative descriptor), either commercial or residential, with lower than average parking ratios and in close proximity to transit routes, either bus or fixed rail. TOD is also often viewed as occurring within a mixed use setting – as with residential (or in some cases office) above ground floor retail and related active use commercial space.
From a business owner’s perspective, TOD offers commercial space that is probably on the leading edge of the density to which the private market is willing to develop. “Denser” development may command a cost premium associated with steel vs. wood frame construction, although buildings up to five stories can be achieved via wood framing, and this quality of development may be acceptable for certain users outside of the Central City.
Businesses will desire space within an area or corridor suitable for TOD if:
• The space is well-located and visible to target customers
• The space is affordable
• The business’ customers can and will access the building in the absence of expansive parking options
The answer to these questions is not dictated by a building’s status as a TOD, although TODs are likely to be well-located (on commercial corridors) and well-served by transit. Rather than business demand, the extent to which this region sees additional TODs along its commercial corridors will be influenced by:
• Continued density increases within Portland’s neighborhoods;
• Continued resident and visitor preference for mixed use neighborhood retail districts (a vision to which participants in focus groups generally adhere, despite the indicated job losses);
• Flexibility with building uses allowed within commercial zones; and
• Over-all economic vitality and growth of the Portland metro region.
Continued growth in commercial rents to support more expensive construction techniques is also a consideration. In recent years Portland has seen significant market-driven in-fill commercial development occurring along relatively low-rent commercial corridors such as NE Alberta. The bulk of this development to date has been single story, indicating that the market will likely bring TOD projects – as opposed to infill – to those corridors now capable of achieving the highest rental rates.
Corridors reporting rents above $20 per square foot as of March 2009 include SE Bybee, NE Broadway/Weidler, N Williams, John’s Landing, SE Belmont, N Mississippi and SE Division. While not a threshold that indicates certain development feasibility (which will vary according to construction technique, building configuration and building use mix), these reported rents have been on a par with the range reported for many Central City properties in the Pearl District, the West End and the CBD.

Adopted – October 2012
E.D. Hovee & Company, LLC for City of Portland:
Economic Opportunities Analysis Section 1 Trends, Opportunities & Market Factors 68
INSTITUTIONAL DEVELOPMENT
For this analysis, the focus is education and health institutions (but with secondary consideration of other public agency jobs). The key question for this topic is: How will rapid growth of
institutional employment and building needs be both accommodated within and potentially
reshape development in Portland? Related questions around this topic are:
• What job growth has occurred within Portland’s major institutional campuses?
• What job growth has occurred for institutional users that may not be located on institutional campuses?
• What are the unique land requirements of institutional users, and how are those changing?
Institutional Definitions & Associated Employment
This report tracks institutional-related employment in two distinct ways:
• Campuses for 7 colleges and 10 hospitals on sites of more than 10 acres, which account for an estimated 35,200 jobs as of 2008, excluding Portland State University (Central City) and Adventist Medical Center(Gateway Regional Center). This campus institutional
category is a primary frame of reference for the EOA analysis.
• All institutional uses throughout the City including schools and hospitals in all Comprehensive Plan zones and all businesses in the IR zone – accounting for 2008 employment estimated at 54,400.
Employment Associated with Institutional Uses
As depicted by the chart on the following page, the discussion in this section begins more broadly on the 54,400 jobs represented by schools and hospitals throughout all zones of the City plus other businesses within the City’s IR zone.
• From 2000-08, employment associated with these institutional uses within this zone increased at a rate averaging about 2.5% per year – well above the citywide job growth rate of just 0.1% per year.
• In 2008, 24% of employment situated within the IR zone was outside of hospitals and schools. The bulk of this was health-related (doctors offices, HMOs) and the remainder a mix of supportive uses such as retail and un-related businesses.
• Institutional employment growth from 2000-08 has been stronger outside of institutional zoning than within this zone. These sectors averaged 2.5% annual growth citywide, compared with a growth rate of close to 2% within the IR zone. This appears to be primarily due to relatively flat employment with schools, while hospital and related IR zone employment increased more substantially.

Adopted – October 2012
E.D. Hovee & Company, LLC for City of Portland:
Economic Opportunities Analysis Section 1 Trends, Opportunities & Market Factors 69
Figure 26. Institutional Employment Trends (2000-2008)
General Commercial
Central Commercial
Central Employment Institution
Industrial Sanctuary
Mixed Employment
Commercial Storefront
Open Space SFR MFR Total
CG CX EX IR IS ME NC,OC,UC OS
R2.5,R5,
R7,R10
R1,R2,R3,
RH,RX
Institutions (defined by NAICS)
Schools 448 3,257 12,821 4,968 1,402 140 358 583 5,513 4,383 33,873
Primary 103 228 114 1,110 1,380 1 251 583 5,214 1,760 10,744
College 345 3,029 12,707 3,858 22 139 107 - 299 2,623 23,129
Hospitals - 3,330 3,181 5,430 1 - 99 - - 5,232 17,273
Other businesses within IR Zone
Health related 2,771 2,771
Other 531 531
448 6,587 16,002 13,700 1,403 140 457 583 5,513 9,615 54,448
2008 Share 1% 12% 29% 25% 3% 0% 1% 1% 10% 18% 100%
AAGR 00-08 5% 4% 4% 2% 3% -1% 22% 26% -2% 3% 2.5%
Institutions (defined by NAICS)
Schools 297 3,009 9,313 4,586 1,080 154 92 91 6,691 2,313 27,626
Hospitals - 1,866 2,441 4,378 - - - - 35 5,395 14,115
Other businesses within IR Zone
Health related - - - 1,666 - - - - - - 1,666
Other - - - 1,174 - - - - - - 1,174
297 4,875 11,754 11,804 1,080 154 92 91 6,726 7,708 44,581
2000 Share 1% 11% 26% 26% 2% 0% 0% 0% 15% 17% 100%
2008
2000
Source: Oregon Employment Department, Portland Bureau of Planning, E. D. Hovee & Company, LLC.

Adopted – October 2012
E.D. Hovee & Company, LLC for City of Portland:
Economic Opportunities Analysis Section 1 Trends, Opportunities & Market Factors 70
Trends within Key Institutions
Rather than reflect zoning designation, the institutional geography reported in Figure 14 (earlier in the report) reflects land owned by 17 hospitals and colleges on sites of at least 10 acres and 100 employees each. Total employment of 35,200 is more than double the 13,700 jobs located within IR-designated zoning. For these 17 large site institutions, employment grew at about 3.6% per year , above the average of 2.5% for citywide institutional employment.
Hospitals Colleges
• Oregon Health & Science University
• Shriners Hospital
• Portland Veteran’s Hospital
• Providence Portland Medical Center
• Legacy Emanuel Hospital & Health Center
• Legacy Good Samaritan Hospital
• Kaiser Medical Centers
• Portland Community College (Sylvania)
• Portland Community College (Cascade)
• Portland Community College (Southeast)
• Reed College
• Lewis & Clark College
• University of Portland
• Multnomah Bible College
• Concordia University
• Western States Chiropractic College
• Warner Pacific University
Note: Adventist Medical Center and Portland State University (PSU) are not included in the Institutional employment geography – Adventist is part of the Gateway Regional Center and PSU is included with the Central City University District.
Many of these institutional uses are located on what could be considered as legacy sites that are in or near residential neighborhoods. Site decisions made decades ago for what typically began as relatively modest uses may have been for reasons unrelated to factors that would be considered today if these institutions were to start anew.
Implications for Future Development
Taken together, the city’s 54,400 institutional jobs account for about 14% of its jobs base. The bulk of these are associated with the city’s colleges and hospitals. Institutions are key employment drivers and now among the fastest growing economic sectors in Portland.
With its moderate growth (mid-case) scenario, Metro forecasts that education and health care employment will increase by a combined average rate of 2.8% per year. This is well above the average projected growth rate of 1.7% for all regional employment and more than double anticipated public agency job growth.
To the degree that Portland continues to capture a relatively high share of medical and educational employment (particularly for higher education), growth needs for this sector can be

Adopted – October 2012
E.D. Hovee & Company, LLC for City of Portland:
Economic Opportunities Analysis Section 1 Trends, Opportunities & Market Factors 71
expected to account for an increasing share of the city’s total job base and associated building space requirements.
Based on the combination of this quantitative review and qualitative assessment from the institutional focus group, key challenges for the city’s institutions (both larger and smaller) will include:
• Opportunities for maintaining a strong in-city presence as a key economic development driver – offset by growing impetus for decentralization to get closer to residential populations.
• Improved transit access or other transportation options to better serve patrons and employees – especially for institutions currently not conveniently located near transit.
• Potential for increased density of development – as an alternative to expanded site area.
• Consistency of land use approach and approval process for institutional users – especially those situated within or near residential neighborhoods.
Adopted – October 2012
E.D. Hovee & Company, LLC for City of Portland:
Economic Opportunities Analysis Section 1 Trends, Opportunities & Market Factors 72
VVII.. LLOOCCAALL SSEECCTTOORR SSPPEECCIIAALLIIZZAATTIIOONNSS
This analysis considers local sector specializations both for the Portland metro area and the City of Portland. A common approach to defining comparative advantage is via location quotient (or LQ), which compares a geography’s concentration of employment with the national average.
Portland can be defined as having a comparative advantage for sectors in which employment concentration is above the national average: a LQ of one or above.9 For example, if 20% of the region’s employment is in a particular sector versus just 10% of the nation’s job base, the location would be 2.0 – meaning that this region has twice the concentration of employment in that sector as the nation.
PORTLAND METRO SPECIALIZATIONS
The following chart illustrates changes in LQ by major job sector for the historic period 1990-2005 and as projected by Metro to 2035. The greatest detail is provided for manufacturing sub-sectors.
9 While comparative advantage analysis offers a snapshot of the relative concentration of employment in a region
compared to the U.S. at a point in time, that advantage may be a reflection of both historic and current competitive advantage of the region relative to the nation. This changing competitive position can be indicated by the shift portion of shift-share analysis – with the shift indicated as the change in location quotient (LQ) between two or more different points in time.

Adopted – October 2012
E.D. Hovee & Company, LLC for City of Portland:
Economic Opportunities Analysis Section 1 Trends, Opportunities & Market Factors 73
Figure 27. Changing Portland Competitive Advantage – All Industries (1990-2035)
0.00
0.50
1.00
1.50
2.00
2.50
3.00
3.50
4.00
4.50
5.00
Man
ufactu
ring, t
otal
Dur
able
Good
s, to
tal
Wood
Pro
ducts
Prim
ary M
etal
Fabric
ate
d Meta
l
Machi
nery
Ele
ctrical M
achiner
y
Tra
nsporta
tion
Equi
pment
Non-
durable
Goo
ds,
tota
l
Foo
d Pro
cessin
g
Paper
Non-
manuf
acturin
g, tota
l
Natu
ral R
esourc
es
Constr
uctio
n
Reta
il Tra
de
TW
U
Info
rmatio
n, to
tal
Fin
ance
Activ
ities
Pro
. Bus
iness
Serv
ices
Edu. &
Health
Care
Leisu
re &
Hosp
itality
Govt
., C
ivilia
n, to
tal
1990
2005
2035
Source: Global Insight, 2008 QR US Long-Term Outlook and Metro.
Manufacturing LQ
The Portland metro area has gone from a slight comparative advantage relative to the nation in manufacturing in 1990 (LQ – 1.06) to a more substantial position as of 2005 (LQ – 1.18). This indicates that the region better maintained its manufacturing job count while net job loss was experienced across the nation as a whole. Metro has forecast that this comparative advantage may increase by 2035 to an LQ of as much as 1.30. If realized, this forecast would allow for a net manufacturing job gain of about 7% between 2005 and 2035.
LQs have increased since 1990 for manufacturing sectors of electrical machinery and transportation equipment, while declining for wood products, food processing and paper. Metals and machinery have about held their own relative to the nation. Looking forward to 2035, Metro has forecast continued LQ gains for electrical machinery and transportation equipment; the other manufacturing sectors are projected to hold steady or decline.
Non-Manufacturing LQ
Overall, non-manufacturing industrial sectors show relatively little comparative advantage relative to the rest of the nation. These sectors have experienced relatively minor changes in LQ since 1990, with slight gains noted for construction and information and losses for natural resources, transportation and warehousing, and utilities. These trends are largely expected to

Adopted – October 2012
E.D. Hovee & Company, LLC for City of Portland:
Economic Opportunities Analysis Section 1 Trends, Opportunities & Market Factors 74
continue forward except for construction where declining LQ is forecast (albeit after a continued surge that was projected to about 2010). Also noted is that Metro projects a growing LQ potential for publishing (a subsector of the information sector).
For most service sectors, Portland does not show any substantial comparative advantage relative to the rest of the U.S. – with the modest exceptions of finance activities (especially real estate) and professional business services (notably management of companies). Looking forward, Metro is projecting increased comparative advantage for finance activities, education and health care and other services (including personal services), but reduced LQ for professional business services (except management of companies).
CITYWIDE VALUE ADDED CLUSTERS
In a 2009 study for the Portland Development Commission, ECONorthwest has investigated LQ on the basis of an industry’s valued added (output) rather than employment, identifying city specializations relative to the nation rather than regional specializations. Value added describes the market value of a business’ production of goods and services, including payroll and the contributions of capital, land and property. This approach elevates the importance of industry output, in addition to considering employment levels.
ECONorthwest’s conclusions are that Portland supports two kinds of clusters:
• Specialized firms with high location quotients – such as truck manufacturing, iron and steel mills, insurance and software publishing – but that are relatively small contributors to the overall Portland economy in terms of value added and export amounts; and
• Firms with above-average but lower location quotients (1.5 – 2.5) that generate much larger amounts of industry output, as well as export output from sales outside the region. These are dominated by professional services and wholesale trade, many of which tend to serve the regional and statewide markets (although professional firms with national scope can also serve as local economic engines). These moderate city specializations also include management of companies, insurance, transportation, and energy utilities.
ECONorthwest’s results tend to corroborate the employment-base results released by Metro in 2008: both LQ analyses indicate that Portland’s location quotients are higher in the manufacturing sectors. However, these are smaller shares of total economic activity than in the past. Consequently, the ECONorthwest analysis indicates that manufacturing’s output may be insufficient as an exclusive engine for continued economic growth into the future.

Adopted – October 2012
E.D. Hovee & Company, LLC for City of Portland:
Economic Opportunities Analysis Section 1 Trends, Opportunities & Market Factors 75
Figure 28. Value Added Portland Clusters (2007)
Source: ECONorthwest, 2009.

Adopted – October 2012
E.D. Hovee & Company, LLC for City of Portland:
Economic Opportunities Analysis Section 1 Trends, Opportunities & Market Factors 76
VVIIII.. IINNDDUUSSTTRRIIAALL LLAANNDD DDEEMMAANNDD AANNAALLYYSSIISS
The primary method for determining land demand is employment growth. However, in the industrial areas there are indications that employment may not be the best measure of economic performance and the future demand for industrial land. Additional research has been compiled to supplement the industrial land demand forecast based on employment growth to analyze additional land demand drivers.
Absorption Trend Comparison
Reviewing long-term industrial land absorption trends is one method to estimate future industrial land needs, although this approach does not account for possible future shifts between industrial sectors.
Historic absorption is available only for properties along the Willamette and Columbia (west of the rail bridge) between the river and the nearest parallel street or railroad right-of-way. This area represents about one-third of the City’s industrial areas, but likely a greater portion of land absorption. The other primary area that has realized industrial development during this time frame (post 1960) is the Columbia Corridor east of 82nd Avenue and north of Sandy Boulevard. A land absorption trend estimate is currently being completed for this second geography so that a citywide industrial absorption trend can be approximated.
Figure 29. Industrial Land Demand Comparison with Past Trends
Absorption Trends
Acres per year
Portland Harbor 1960-1997 absorption trends, all industrial uses (source: PHILS) 45
Portland Harbor 1960-1990, marine uses (Portland only. Source: Port of Portland) 24
Portland Harbor 1960-1990, all uses (including parks and residential. Source: Port of Portland) 39
Portland Harbor 2002-2008, developed industrial land 18
Absorption Forecast
All Industrial Areas Columbia Harbor
driven terminals driven terminals
Low (9) (9) (5) (5)
Mid 45 45 30 30
High 104 104 69 69
Source: Portland Harbor Industrial Lands Study Feb 2003, Bureau of Planning; E.D. Hovee & Company, LLC. Portland Harbor Industrial Land Supply Analysis, Feb 2012, EcoNorthwest
The historic absorption figures available indicate an increase in annual absorption between 1990 and 1997. The bulk of this absorption occurred within the Port’s Rivergate development and on Swan Island.
Adopted – October 2012
E.D. Hovee & Company, LLC for City of Portland:
Economic Opportunities Analysis Section 1 Trends, Opportunities & Market Factors 77
Commodity Flows
Commodity flows provide another indicator of economic activity and terminal and distribution facility needs. There are two studies that analyze the cargo moving through the Portland Harbor. The 2003 Portland Harbor Industrial Land Study (PHILS) reports that cargo volumes increased at an average annual rate of 2.3% between 1960 and 2000. Marine terminal investments of note that accompanied this increase include the 85 acre Portland Bulk Terminal facility at Port of Portland and a 20-acre expansion of the container terminal at T-6. The 2012 Portland Harbor Industrial
Land Supply Analysis found cargo volume growth continues to be robust in recent years. From 2002-2008, cargo volumes increased by 4.8% per year. This study of marine terminal cargo volumes and land absorption needs plus the 2010 West Hayden Island Economic Foundation Study take a cargo-specific approach, factoring in the known size and capacity of existing terminals, existing cargo volumes, cargo forecasts, and the size requirements of modern terminal facilities. With the goal of understanding these factors in more depth, the City also commissioned a study of the operational characteristics of different marine terminal types, which includes case studies of best-in-class facilities with land area and cargo throughput information.10 More information about marine cargo forecasts, and associated land needs can be found later in this section.
The Port of Portland notes that land needs associated with commodity flows an inherently difficult to forecast. Over the past 10 years, the Port has twice been the fastest growing on the West Coast, and also the fastest declining. This short-term fluctuation results from decisions within the handful of steamship line companies on whether or not to utilize Port of Portland facilities, and is independent of shipping growth associated with business activity. For this reason, longer term trend data is more reliable. There is also some level of opportunistic growth that can be driven by a specific opportunity, driven by the competitive market. For example, other ports in the lower Columbia River have recently announced new projects to ship coal. Local ports are able to respond to these opportunities not because growth of that commodity had been forecast, but because they had an inventory available development-ready land. If the Port of Portland waits for a specific business opportunity to arise before land can made available, as long as other Ports have more readily developable land supply, Portland will probably not be competitive.
Gross Domestic Product Output
Industry output provides a third measure of the health and growth of an industry. Data on industry output is available (via the Bureau of Economic Analysis) on a metro area level.
Between 2001 and 2006 there was a substantial increase in output among many industries, including manufacturing and information and technology. Manufacturing output (across the seven county PMSA, the smallest geography for which data is available) increased at an annual rate of close to 12%, compared to an annual average increase of 6% for the PMSA economy as a whole.
GDP data portrays manufacturing as a growth industry, rather than the declining industry that employment trends suggest. Industry stakeholders describe several factors that influenced this sector’s recent profitability gains, including:
10 Worley Parsons, Operational Efficiencies of Ports/Terminals World--Wide, February 2012
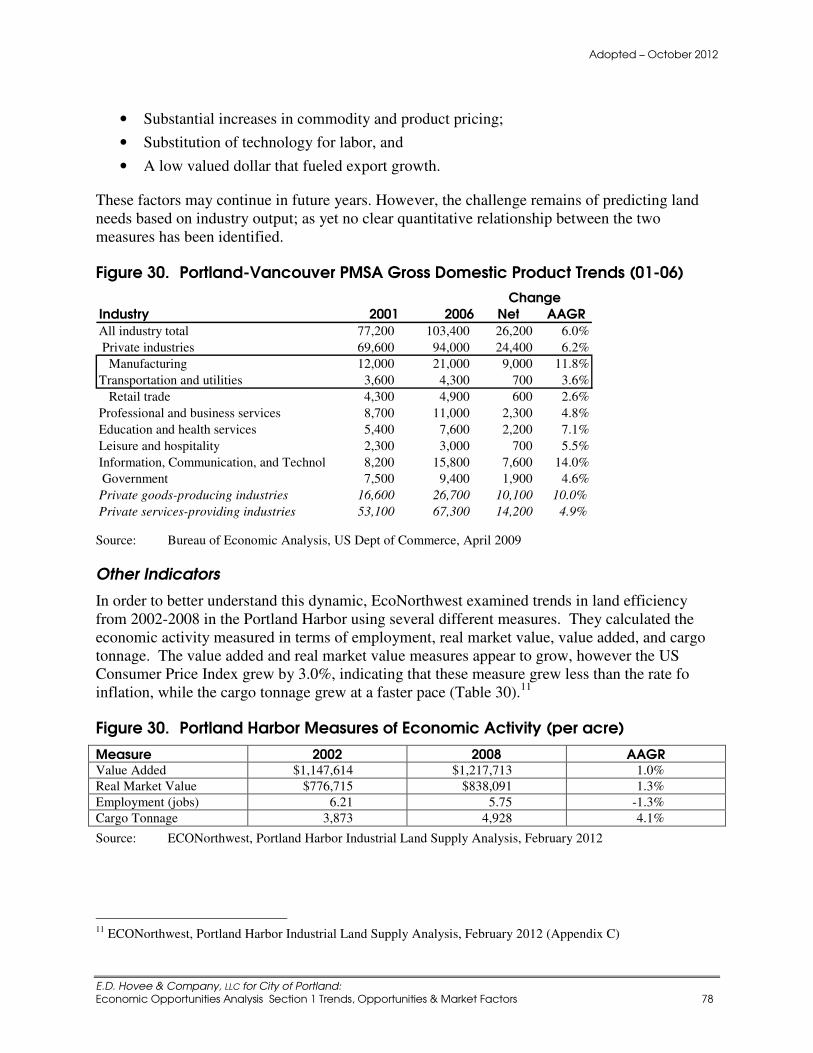
Adopted – October 2012
E.D. Hovee & Company, LLC for City of Portland:
Economic Opportunities Analysis Section 1 Trends, Opportunities & Market Factors 78
• Substantial increases in commodity and product pricing;
• Substitution of technology for labor, and
• A low valued dollar that fueled export growth.
These factors may continue in future years. However, the challenge remains of predicting land needs based on industry output; as yet no clear quantitative relationship between the two measures has been identified.
Figure 30. Portland-Vancouver PMSA Gross Domestic Product Trends (01-06)
Industry 2001 2006 Net AAGRAll industry total 77,200 103,400 26,200 6.0%
Private industries 69,600 94,000 24,400 6.2%
Manufacturing 12,000 21,000 9,000 11.8%
Transportation and utilities 3,600 4,300 700 3.6%
Retail trade 4,300 4,900 600 2.6%
Professional and business services 8,700 11,000 2,300 4.8%
Education and health services 5,400 7,600 2,200 7.1%
Leisure and hospitality 2,300 3,000 700 5.5%
Information, Communication, and Technology (ICT)8,200 15,800 7,600 14.0%
Government 7,500 9,400 1,900 4.6%
Private goods-producing industries 16,600 26,700 10,100 10.0%
Private services-providing industries 53,100 67,300 14,200 4.9%
Change
Source: Bureau of Economic Analysis, US Dept of Commerce, April 2009
Other Indicators
In order to better understand this dynamic, EcoNorthwest examined trends in land efficiency from 2002-2008 in the Portland Harbor using several different measures. They calculated the economic activity measured in terms of employment, real market value, value added, and cargo tonnage. The value added and real market value measures appear to grow, however the US Consumer Price Index grew by 3.0%, indicating that these measure grew less than the rate fo inflation, while the cargo tonnage grew at a faster pace (Table 30).11
Figure 30. Portland Harbor Measures of Economic Activity (per acre)
Measure 2002 2008 AAGR Value Added $1,147,614 $1,217,713 1.0%
Real Market Value $776,715 $838,091 1.3%
Employment (jobs) 6.21 5.75 -1.3%
Cargo Tonnage 3,873 4,928 4.1%
Source: ECONorthwest, Portland Harbor Industrial Land Supply Analysis, February 2012
11 ECONorthwest, Portland Harbor Industrial Land Supply Analysis, February 2012 (Appendix C)

Adopted – October 2012
E.D. Hovee & Company, LLC for City of Portland:
Economic Opportunities Analysis Section 1 Trends, Opportunities & Market Factors 79
VVIIIIII.. EECCOONNOOMMIICC MMUULLTTIIPPLLIIEERR AANNAALLYYSSIISS
As discussed above, there can be a disconnect between employment growth and the demand for new building space and development sites, especially within the industrial sectors. Another way to look at the situation is economic multipliers, which represents the relationship between direct investment in economic activity at a particular site and the resulting multiplier (or ripple effect) throughout Portland and the metro region. The three most common types of economic multipliers are provided within this EOA report are measures of:
• Employment
• Personal income (to residents of the region)
• Output (or added gross receipts)
For example, an employment multiplier of 2.00 indicates that for every job directly associated with a place-specific investment, another job is created off-site through indirect and induced economic effects elsewhere in the region. Indirect effects occur as the new economic activity makes purchases from other businesses in the region. Induced effects occur as the direct employees of the new economic activity are able to make added purchases from increased disposable income from local retail and services.
Multipliers are based on the nationally recognized IMPLAN input-output model. IMPLAN data is available for every county in the U.S. Multipliers used with this analysis are those for the seven-county metro region (PMSA) as of 2009. Economic multipliers are typically reported by NAICS employment sector. For the Portland EOA, NAICS specific multipliers have been aggregate to six industrial/commercial building types based on the City of Portland’s projected 2035 mix of sector employment and anticipated allocation of employment sectors to building types.
This essentially reflects weighted averaging of specific building types. For example, the General Industrial building type is associated with a relatively high 3.15 overall jobs multiplier. The key components of the General Industrial multiplier are manufacturing (with a 3.69 multiplier) and construction (2.04). Other building types involve different employment sectors but with a similar weighting methodology applied.
Figure 31. Economic Multipliers By Building Type
Economic Multiplier
Building Type Jobs Income Output
Office 1.95 1.87 1.98
Institution 1.62 1.69 2.13
Flex / BP 2.19 2.12 1.91
General Industrial 3.15 2.50 2.15
Warehouse 2.36 1.95 1.95
Retail 1.64 1.76 1.97
Source: E. D. Hovee & Company, LLC based on IMPLAN

Adopted – October 2012
E.D. Hovee & Company, LLC for City of Portland:
Economic Opportunities Analysis Section 1 Trends, Opportunities & Market Factors 80
Multipliers are relevant to district-specific land supply decisions because they suggest the importance of looking beyond direct site-specific employment opportunities. For example, although job density is low on industrial land, the General Industrial and Warehouse multipliers are high. That is, industrial acres have the potential to generate a greater number of secondary and tertiary off-site jobs that an acre of retail. All other things being equal, this could be a factor if one must allocate a limited supply of land to different industry types. Or, put another way, some of our retail and office job growth is dependant on having an adequate industrial land supply.
Adopted – October 2012
E.D. Hovee & Company, LLC for City of Portland:
Economic Opportunities Analysis Section 1 Trends, Opportunities & Market Factors 81
IIXX.. LLAANNDD EEFFFFIICCIIEENNCCYY AANNAALLYYSSIISS
The purpose of this analysis is to estimate the portion of future employment-related development that will take place on parcels with a significant amount of existing building square footage – sites that are not included in the Buildable Land Inventory.
METHODOLOGY
The analysis is based on development activity from 1999-2011 to assign it to the type of site in 1999 – vacant, LoFAR, or HiFAR.12 The LoFAR category corresponds to the underutilized or redevelopable sites in the BLI and is defined as sites with less than 20% of the building square footage allowed by zoning (based on applicable zoned FARs) based on existing building square footage in 1999. For industrial properties, only vacant parcels are considered buildable.
RLIS assessor data is used to create a side-by-side comparison of tax lots with a “new year built” or for which there was more than 50% building square footage added (as opposed to a minor addition). A review of the assessor data revealed a number of parcels for which there was no building square footage indicated in 1999 but had a 1999 building value of over $25,000, which indicated some kind of improvement. Tax parcels greater than 10,000 square feet in size with missing data have been cross-checked with development permit data to better determine which parcels were: a) previously developed in 1999 with no added building space developed through 2011, or b) previously developed but added some amount of net new building space since 1999. This analysis was limited to parcels for which there was comparable data regarding building square footage, land and improvements valuation with matching tax records in 1999 and 2011. Excluded are parcels for which there is not a matching tax parcel identifier or for which other data is missing in either year. Also excluded are parcels for which building square footage was increased by less than 50%, but with no new built data between 1999-2011 indicated. For these reasons, the analysis should be viewed as representing a conservative representation of development activity on employment lands over this time period.
Using the revised parcel dataset, development activity is assigned to the type of site in 1999 – vacant, LoFAR, or HiFAR (Figure 32). The proportion of development activity that occurs on vacant or LoFAR is development that would occur on sites in the BLI (industrial geographies are limited to vacant sites). Development that takes place on HiFAR parcels is on parcels that are not included in the BLI.
The data analysis shows that the campus institutions present a unique case. These campuses consist of large parcels with existing development that places them in the HiFAR category. So as to not skew the overall results, the campus institutions were eliminated from this analysis because these areas are treated differently in the BLI (development capacity based on master plans, not vacant/underutilized parcels).
12 The initial method was to analyze employment data (ES202) data to identify job growth that took place on sites
with existing development and no new development from 2000-2008. This analysis proved to be too difficult to manage because of employers with multiple tax parcels and dispersed employment that was reported to different tax parcels over the analysis period.

Adopted – October 2012
E.D. Hovee & Company, LLC for City of Portland:
Economic Opportunities Analysis Section 1 Trends, Opportunities & Market Factors 82
Figure 32. Land Efficiency Analysis (Net Added Building Space 1999-2011)
On Sites that Were Previously % on
Forecast Geographies Vacant LoFAR HiFAR Total Vac/Lo
Central City Commercial 4,753,957 286,431 3,605,539 8,645,927 58%
Central City Incubator 589,616 230,191 41,871 861,678 95%
Columbia Harbor 4,259,890 2,262,671 91,150 6,613,711 64% Vacant
Columbia East 3,932,091 502,344 75,646 4,510,081 87% Vacant
Dispersed Industrial 543,702 241,891 491,278 1,276,871 43% Vacant
Neighborhood Commercial 3,111,419 12,073 2,236,145 5,359,637 58%
Town Centers 135,913 0 341,128 477,041 28%
Regional Center 694,329 0 160,986 855,315 81%
Institutions 407,270 4,800 2,164,726 2,576,796 16%
Total 18,428,187 3,540,401 9,208,469 31,177,057 70%
Total (w/o Institutions) 18,020,917 3,535,601 7,043,743 28,600,261 75%
% of Change 59% 11% 30% 100% 70%
% of Change w/o Institutions 63% 12% 25% 100% 75%
Aggregate Geographies
Central City 5,343,573 516,622 3,647,410 9,507,605 62%
Industrial 8,735,683 3,006,906 658,074 12,400,663 70% Vacant
Commercial 3,941,661 12,073 2,738,259 6,691,993 59%
Institutions 407,270 4,800 2,164,726 2,576,796 16%
Total 18,428,187 3,540,401 9,208,469 31,177,057 70%
Total w/o Institutions 18,020,917 3,535,601 7,043,743 28,600,261 75%
Source: E.D Hovee & Company
OBSERVATIONS
This supplemental analysis provides added insight into development patterns for different employment geographies. From a market perspective, the data indicates that newly built sites tend to occur on vacant or low value property. However, considerable acreage has experienced building expansion on properties with existing high value improvements. The overall results show that roughly 60% of Central City and Commercial development took place on vacant or LoFAR land and approximately 70% of industrial development took place on vacant land. A significant portion of new development (30-40%) is occurring on parcels with a significant amount of existing development (HiFAR) that is not included in the BLI.
Both for newly built sites and expansions, the market evidences continued preference for unconstrained sites. The market can shift to support development of environmentally constrained and/or potential brownfield sites where fewer unconstrained property opportunities are available. This analysis is useful as a means to better refine realistic land needs in employment land supply and demand analysis.

Adopted – October 2012
E.D. Hovee & Company, LLC for City of Portland:
Economic Opportunities Analysis Section 1 Trends, Opportunities & Market Factors 83
XX.. MMAARRIINNEE CCAARRGGOO FFOORREECCAASSTT
PORTLAND HARBOR MARINE TERMINALS
The Columbia Harbor benefits from its superior connectivity: the confluence of two rivers, access to domestic markets via two major rail lines (UP and BNSF), and interstate freeway access to I-5 (north-south) and I-84 (east-west), and access to global markets via the Pacific Ocean. Having all of this connectivity in the heart of the City of Portland, with strong local and regional policies in place to preserve harbor land for industrial use, creates a special place for water-dependent industrial firms. However, the industrial harbor land supply in the Portland region is fixed, and vacant developable land is rare and usually constrained. (See Appendix C. ECONorthwest, Portland Harbor Industrial Land Supply Analysis, May 2012)
A primary source of past economic growth in Portland has been marine-related economic activity, including marine industrial and marine cargo uses. These uses are projected to continue to grow over the next 30-years, with particular growth forecasted in the marine cargo and related transportation, warehousing, utility, and wholesale trade sectors. The Portland Harbor serves as a major economic engine for the regional economy. Past studies indicate that cargo and manufacturing activities dependent on waterborne transportation contribute significantly to the metro region’s economy. These studies indicate that marine-related economic activity generates from 20,000 to 100,000 jobs and from $1.4 to 3.4 billion annually in regional income.13
The Port of Portland has four marine terminals located along the Willamette and Columbia Rivers. These terminals accommodated 575 ocean-going vessels in 2010, though over the past two decades it was not uncommon for the Port to accommodate 800 to 1,000 ocean-going vessels in a year. Not counting cargos received or shipped via inland barges, the Port of Portland shipped over 13 million short tons of cargo in 2010.
Harbor industrial development tends to have low floor-to-area ratios (FAR) and a relatively low number of jobs per acre. But despite declining employment in recent years, the Portland Harbor experienced an increase in cargo tonnage at a faster pace than the rate of industrial land development in the area. 14 Therefore, given the disconnected relationship between employment growth and cargo activity in the harbor, there is a need to base the need for additional marine terminals on cargo forecasts as a supplement to any land needed to support future industrial employment growth in the Columbia Harbor geography.
MARINE CARGO FORECAST
While employment forecasts traditionally form the basis of employment land supply analysis, as noted earlier, employment is not a very good indicator of the long-term land needs of the freight and distribution sectors of the economy. Despite a general decline in industrial employment between 2002 and 2008 (-1.3% AAGR), cargo tonnage handled in the Portland Harbor went up
13 Entrix, West Hayden Island Economic Foundation Study, July 2010
14 ECONorthwest, Portland Harbor Industrial Land Supply Analysis, May 2012.

Adopted – October 2012
E.D. Hovee & Company, LLC for City of Portland:
Economic Opportunities Analysis Section 1 Trends, Opportunities & Market Factors 84
4.1% per year during that same period. An average of 18 acres of land was developed each year during that period.15
There have been several attempts to understand how cargo tonnage trends may impact future land needs in the Portland Harbor. Extrix studied this in 2010, based on cargo forecasts completed in 2009. The most recent cargo forecasts are based on a 2010 study by BST, refined to specifically call out cargo demand for Portland and Vancouver, updated with the most recent economic data.16 Cargo forecasts generally assume an adequate land supply will be made available (that is, they do not attempt to predict how any land supply constraint might impact growth). The most recent BST forecast demand for the region in 2040 (including both Portland and Vancouver) ranges from 39 million to 66 million metric tons. For the Portland Harbor, the forecast range is 28 million to 43 million metric tons. For context, in 2010 the Port of Portland moved 13 million metric tons of cargo, and approximately 27 million tons moved through the region as a whole (including private terminals and both public Ports).
Figure 33. 2040 Portland Harbor Cargo Volume Forecast
Cargo Type Low Medium High Automobiles (units) 811,000 912,500 1,014,000 Containers (TEUs) (metric tones) 379,000 452,500 526,000 Automobiles 1,076,000 1,206,000 1,336,000 Containers 2,162,000 2,583,500 3,005,000 Breakbulk 1,132,000 1,242,000 1,352,000 Grain 6,686,000 9,078,000 11,470,000 Dry Bulk 10,278,000 14,093,500 17,909,000 Liquid Bulk 6,912,000 7,461,500 8,011,000
Total 28,246,000 35,664,500 43,083,000
Source: EcoNorthwest and BST Associates Note: Low and High forecasts were made by BST Associates for the Portland and Vancouver Harbor Forecast Update, 2012. Medium scenario is calculated by EcoNorthwest.
Factoring in the capacity of existing marine terminals, EcoNorthwest estimated the regional need for additional marine terminal facilities by 2040, by cargo type17. With the low scenario forecast, they concluded that existing terminals could handle all commodity types, except automobiles. With the high scenario forecast, additional new terminals would be needed for automobiles, containers, grains, and dry bulk commodity types. With the “most likely” mid-range scenario forecast, additional terminals would be needed for automobiles, grain, and dry bulk commodities.
Based on the size trends of new terminals being constructed on the west coast, most of the land need for marine cargo is expected to be for parcels larger than 100 acres to accommodate rail
15 EcoNorthwest, Portland Harbor Industrial Land Supply Analysis, May 2012
16 BST Associates, Portland and Vancouver Harbor Forecast Update, February 2012
17 EcoNorthwest, Portland Harbor Industrial Land Supply Analysis, May 2012

Adopted – October 2012
E.D. Hovee & Company, LLC for City of Portland:
Economic Opportunities Analysis Section 1 Trends, Opportunities & Market Factors 85
access and ensure competitiveness.18 The actual acres needed to accommodate the projected marine terminal need varies, depending on the commodity type, and depending on how important it is to have an optimal terminal design. For example, it is possible to operate a grain terminal on less than 10 acres, but a modern rail-served terminal would likely require 100+ acres. A modern automobile terminal may require 270 acres or more, though it is possible to develop such a facility with structured multi-deck parking.
At the City’s request, Worley Parsons completed a detailed analysis of the operational and land consumption characteristics of modern ports.19 The report included case studies of innovative international facilities. Provision of efficient rail operations is one of the primary ways that modern terminals maximize cargo throughput for a given terminal. The report also includes discussion of auto terminals with multi-deck parking structures, but concludes that they would be very difficult to make cost-competitive in the context of the current Lower Columbia River market.
Using information collected from Worley Parsons, and the forecast information described above, EcoNorthwest estimated the land need through 2040 for the Port of Portland ranges from 270 acres to 1,277 acres, with a most likely land need of approximately 470 acres (Figure 34). In the low scenario forecast, the land need could be reduced to as little as 53 acres if a terminal were developed with less-than-optimal rail access.
Figure 34. 2040 Portland Harbor Land Need by Cargo Forecast Scenarios (acres)
Cargo Type Low Scenario Most Likely Scenario High Scenario Automobiles 120 270 577 Containers 0 0 100 Breakbulk 0 0 0 Grain 30 100 200 Drybulk 20 100 400 Liquid Bulk 0 0 0
TOTAL 170 470 1,277
Source: EcoNorthwest Note: Land need estimate assumes optimal modern rail-served terminal design.
18 Entrix, West Hayden Island Economic Foundation Study, July 2010
19 Worley Parsons, Operational Efficiencies of Ports/Terminals Worldwide, 2012

Adopted – October 2012
E.D. Hovee & Company, LLC for City of Portland:
Economic Opportunities Analysis Section 1 Trends, Opportunities & Market Factors 86
XXII.. EEOOAA IIMMPPLLIICCAATTIIOONNSS
This section is intended to set the stage for the next steps of this economic opportunities analysis. Key implications of this trends and opportunities analysis for remaining portions of the economic opportunities analysis are summarized as follows:
• A recognition that this past decade has been a period of relatively slow job growth not only for Portland but for the metro region and nationally. Despite an economic downturn experienced just after 2000 followed by a major recession at end of the decade, Metro is projecting that the nation and region should expect to return to a more normalized pattern of job recovery and stronger growth over the long-term horizon of next 25 years.
• For Portland, a pivotal question is whether the city continues to experience a relatively small share of the job growth that has occurred as has been the case since 2000, or reverts to a more robust pattern of greater in-city and county job capture as was experienced in the previous two decades. The answer to this question has significant ramifications not only for Portland’s economic vitality but for regional urban growth management.
• Finally, it is apparent that the “hot spot” locations where job growth is occurring within the City have shifted in recent years. The focus of added Central City job gains has shifted from the traditional downtown core toward adjacent areas in the River and Lloyd commercial / mixed use districts and the emerging incubators of the Central Eastside and Lower Albina. Similar shifts are occurring within and between the City’s industrial, urban center and neighborhood commercial areas. In numerical terms, by far the strongest growth has been within Portland’s institutional geography.
As a final note, this Task 1 report has focused on employment in terms of Goal 9 requirements for an Economic Opportunities Analysis. The resulting employment analysis addresses trends with respect to the number and types of jobs including categorization by land use designation. However, it is important to note employment is one of many approaches to measuring economic activity.
Because the focus of this report is how business uses land, employment and building development are emphasized. Other factors – such as wage levels, technology and capital intensiveness, monetary output and comparative regional advantage (or location quotients) – are not directly considered. This report also does not evaluate which industries and jobs the region should endeavor to encourage, but rather reports past trends as illustrated via employment data.

Adopted – October 2012
E.D. Hovee & Company, LLC for City of Portland:
Economic Opportunities Analysis Section 1 Trends, Opportunities & Market Factors 87
AAPPPPEENNDDIIXX AA.. FFOOCCUUSS GGRROOUUPP PPAARRTTIICCIIPPAANNTTSS
As identified by the following listing, a total of 58 individuals participated in six focus groups conducted in 2009 for this Economic Opportunities Analysis. The interest and time given by all participants is gratefully acknowledged.
Figure 35. Focus Group Participants
Participant Name Firm/Organization
Central City Office:
Gregory Goodman City Center Parking
Ted Gilbert Gilbert Brothers
David Lake Liberty NW
Scott Andrews Melvin Mark Companies
Jeff Bourlag NBS Realtors
Brian Owendoff Opus NW
Steve Pfeiffer Perkins Coie
Bernie Bottomly Portland Business Alliance
Carly Riter Portland Business Alliance
Josh Schlesinger Schlesinger Companies
Matt Cole Shorenstein
Close In Incubator:
Pete Eggspuehler Beam Development
Eva Schweber Cube Space
Debbie Kitchin Inter Works
Mickael Zokoych Michael’s Italian Beef & Sausage
Peter F. Fry Planning Consultant
Daniel Yates Portland Spirit
Bob Rogers Robert R. Rogers Co.
David Lorati School Specialty Co.
Manufacturing & Distribution:
Corky Collier Columbia Corridor Alliance
D. A. Albrecht Concordia University
Jay Griffith Evraz Inc NA
Wayne Matulich ITT Technical
Linda Craig Norris & Stevens
Gary Hunt Oregon Transfer
Ann Gardner Schnitzer Steel
Mike Williams Silver Eagle Manufacturing
Deon Kampfer WM

Adopted – October 2012
E.D. Hovee & Company, LLC for City of Portland:
Economic Opportunities Analysis Section 1 Trends, Opportunities & Market Factors 88
Participant Name Firm/Organization
Neighborhood Commercial:
Michael Zokoych Central Eastside Industrial Council
Cindy Sturm Cindy Sturm Real Estate
Bob LeFeber Commercial Realty Advisors
Jean Baker Division Clinton
Tony Fuentes NW Childrens Business/Fox Chase Alliance
Michelle Marx SERA Architects
Gerry Boeher St. Johns Booseters
TOD/Mixed Use Corridors:
Pete Eggspuehler Beam Development
John Carroll Carroll Investments
Kevin Cavenaugh Cavenaugh Development
Jeana Woolley JM Woolley & Associates
Tom Kemper Kemper Company, LLC
Vern Rifer Rifer Development
Kim Knox Shiels Obletz Johnsen
Rick Gustafson Shiels Obletz Johnsen
Campus Institutional:
Theresa Paulson Concordia University
Michael Sestric Institutional Facilities Coalition
Scott Davis Kaiser Permanente
Richard Bettega Lewis & Clark College
David Groff Linfield College
Glenn Ford Linfield College
Gary Andeen Oregon Independent Colleges Association
Wing-Kit Chung Portland Community College
Ty Wyman Providence Medical Center
Edwin McFarlane Reed College
Jennifer Baters Reed College
Townsend Angel Reed College
Andrea Cook Warner Pacific College
Steve Stenberg Warner Pacific College

Adopted – October 2012
E.D. Hovee & Company, LLC for City of Portland:
Economic Opportunities Analysis Section 1 Trends, Opportunities & Market Factors 89
AAPPPPEENNDDIIXX BB.. SSUUPPPPLLEEMMEENNTTAALL DDAATTAA TTAABBLLEESS
On the following pages are provided supplemental detailed U.S. employment trend and projection data covering:
• U. S. Non-Farm Employment Trend and Projection (by employment sector and covering the 1980 – 2035 time period
• Portland Metro Location Quotients Relative to the U.S. (by employment sector and covering the 1990 – 2035 time period)

Adopted – October 2012
E.D. Hovee & Company, LLC for City of Portland:
Economic Opportunities Analysis Section 1 Trends, Opportunities & Market Factors 90
Figure 36. U.S. Non-Farm Employment Trend & Projection (1980-2035)
1980 1985 1990 1995 2000 2005 2010 2015 2020 2025 2030 2035 1990-05 2005-35 1990 2005 2035
Total Non-Farm Jobs 90.53 97.51 109.49 117.31 131.79 133.69 135.62 146.5 153.33 159.9 166.49 173.54 1.3% 0.9% 100.0% 100.0% 100.0%
Private Employment 74.15 80.98 91.08 97.87 111 111.89 113.24 123.29 129.36 135.4 141.28 147.88 1.4% 0.9% 83.2% 83.7% 85.2%
Manufacturing 18.73 17.82 17.70 17.24 17.27 14.23 11.99 12.78 12.63 12.00 11.52 11.14 -1.4% -0.8% 16.2% 10.6% 6.4%
Durable Goods 11.68 11.03 10.74 10.37 10.88 8.96 7.46 8.20 8.04 7.57 7.28 7.10 -1.2% -0.8% 9.8% 6.7% 4.1%
Lumber N/A N/A 0.54 0.57 0.61 0.56 0.43 0.55 0.53 0.49 0.46 0.47 0.2% -0.6% 0.5% 0.4% 0.3%
Primary Metals N/A N/A 0.69 0.64 0.62 0.47 0.37 0.38 0.37 0.37 0.33 0.29 -2.5% -1.6% 0.6% 0.4% 0.2%
Fabricated Metals N/A N/A 1.61 1.62 1.75 1.52 1.29 1.47 1.50 1.45 1.39 1.30 -0.4% -0.5% 1.5% 1.1% 0.7%
Machinery N/A N/A 1.41 1.44 1.46 1.17 1.05 1.20 1.18 1.11 1.05 1.00 -1.2% -0.5% 1.3% 0.9% 0.6%
Electronics N/A N/A 1.90 1.69 1.82 1.32 1.15 1.01 0.94 0.90 0.94 1.01 -2.4% -0.9% 1.7% 1.0% 0.6%
Transport. Equipment N/A N/A 2.13 1.98 2.06 1.77 1.39 1.61 1.47 1.24 1.11 1.10 -1.2% -1.6% 1.9% 1.3% 0.6%
Oth. Durables N/A N/A 2.45 2.43 2.56 2.15 1.79 1.99 2.05 2.01 1.99 1.92 -0.9% -0.4% 2.2% 1.6% 1.1%
Non-Durables 7.05 6.78 6.96 6.87 6.39 5.27 4.53 4.58 4.59 4.43 4.25 4.04 -1.8% -0.9% 6.4% 3.9% 2.3%
Food Proc. N/A N/A 1.51 1.56 1.55 1.48 1.45 1.55 1.62 1.62 1.62 1.61 -0.1% 0.3% 1.4% 1.1% 0.9%
Paper N/A N/A 0.65 0.64 0.60 0.48 0.41 0.42 0.43 0.42 0.40 0.38 -2.0% -0.8% 0.6% 0.4% 0.2%
Other Non-Dur. N/A N/A 4.80 4.67 4.23 3.31 2.67 2.61 2.55 2.39 2.22 2.05 -2.4% -1.6% 4.4% 2.5% 1.2%
Non-Manufacturing 71.79 79.69 91.79 100.07 114.53 119.45 123.63 133.71 140.71 147.90 154.95 162.39 1.8% 1.0% 83.8% 89.3% 93.6%
Natural Resources 1.08 0.97 0.76 0.64 0.60 0.63 0.72 0.66 0.56 0.55 0.53 0.53 -1.2% -0.6% 0.7% 0.5% 0.3%
Construction 4.45 4.79 5.27 5.28 6.79 7.33 6.52 7.61 8.11 8.74 9.57 10.47 2.2% 1.2% 4.8% 5.5% 6.0%
Wholesale Trade 4.56 4.91 5.27 5.43 5.93 5.76 5.76 6.35 6.98 7.66 7.87 7.69 0.6% 1.0% 4.8% 4.3% 4.4%
Retail Trade 10.24 11.73 13.18 13.90 15.28 15.28 15.40 15.59 15.38 15.38 15.32 15.44 1.0% 0.0% 12.0% 11.4% 8.9%
Auto parts N/A N/A 1.49 1.63 1.85 1.92 1.95 1.91 1.81 1.79 1.78 1.80 1.7% -0.2% 1.4% 1.4% 1.0%
Food & Bev. N/A N/A 2.78 2.88 2.99 2.82 2.94 2.78 2.61 2.60 2.55 2.52 0.1% -0.4% 2.5% 2.1% 1.5%
Other Retail N/A N/A 8.91 9.39 10.44 10.54 10.51 10.89 10.96 11.00 10.99 11.12 1.1% 0.2% 8.1% 7.9% 6.4%
TWU 3.61 3.73 4.22 4.51 5.01 4.92 4.95 5.76 6.38 6.88 7.19 7.23 1.0% 1.3% 3.9% 3.7% 4.2%
Information 2.36 2.44 2.69 2.84 3.63 3.06 2.78 2.96 3.15 3.44 3.80 4.32 0.9% 1.2% 2.5% 2.3% 2.5%
Printing N/A N/A 0.87 0.91 1.03 0.90 0.80 0.82 0.84 0.86 0.89 0.95 0.2% 0.2% 0.8% 0.7% 0.5%
Internet, etc. N/A N/A 1.82 1.93 2.59 2.16 1.98 2.14 2.32 2.58 2.91 3.37 1.1% 1.5% 1.7% 1.6% 1.9%
Financial Activities 5.02 5.81 6.61 6.83 7.69 8.15 8.24 8.57 8.42 8.44 8.44 8.61 1.4% 0.2% 6.0% 6.1% 5.0%
Finance & Ins. N/A N/A 4.98 5.07 5.68 6.02 6.11 6.33 6.22 6.21 6.22 6.39 1.3% 0.2% 4.5% 4.5% 3.7%
Real Estate N/A N/A 1.64 1.76 2.01 2.13 2.13 2.24 2.20 2.23 2.22 2.22 1.8% 0.1% 1.5% 1.6% 1.3%
Professional Business N/A N/A 10.85 12.85 16.67 16.94 17.73 21.96 25.16 28.42 32.30 36.37 3.0% 2.6% 9.9% 12.7% 21.0%
Pro., Sci., Tech. N/A N/A 4.54 5.08 6.70 7.02 7.88 8.98 10.20 12.29 14.79 17.96 2.9% 3.2% 4.1% 5.3% 10.3%
Mgmt. of Companies N/A N/A 1.67 1.69 1.80 1.76 1.80 1.72 1.60 1.53 1.45 1.39 0.4% -0.8% 1.5% 1.3% 0.8%
Admin & Waste N/A N/A 4.64 6.08 8.17 8.16 8.05 11.26 13.36 14.60 16.06 17.02 3.8% 2.5% 4.2% 6.1% 9.8%
Edu. & Health 7.07 8.66 10.98 13.29 15.11 17.37 19.90 21.61 22.87 23.64 24.09 24.81 3.1% 1.2% 10.0% 13.0% 14.3%
Education N/A N/A 1.69 2.01 2.39 2.83 3.24 3.06 3.01 3.05 3.06 3.09 3.5% 0.3% 1.5% 2.1% 1.8%
Health Care N/A N/A 9.30 11.28 12.72 14.54 16.66 18.55 19.86 20.60 21.03 21.73 3.0% 1.3% 8.5% 10.9% 12.5%
Leisure & Hospitality 6.72 7.87 9.29 10.50 11.86 12.81 13.53 14.12 14.39 14.73 14.95 15.33 2.2% 0.6% 8.5% 9.6% 8.8%
Arts & Entertain. N/A N/A 1.13 1.46 1.79 1.89 1.97 1.95 2.09 2.29 2.42 2.54 3.5% 1.0% 1.0% 1.4% 1.5%
Accomm. & Food Ser. N/A N/A 8.15 9.04 10.07 10.92 11.56 12.17 12.30 12.44 12.53 12.79 2.0% 0.5% 7.4% 8.2% 7.4%
Other Services 2.75 3.37 4.26 4.57 5.17 5.39 5.72 5.31 5.34 5.52 5.69 5.93 1.6% 0.3% 3.9% 4.0% 3.4%
Govt., Civilian, total 16.38 16.53 18.41 19.43 20.79 21.81 22.38 23.21 23.97 24.50 25.20 25.66 1.1% 0.5% 16.8% 16.3% 14.8%
Annual % Change % of TotalU. S. Employment (in millions)
Source: Global Insight, 2008 QR US Long-Term Outlook, as compiled by Metro.

Adopted – October 2012
E.D. Hovee & Company, LLC for City of Portland:
Economic Opportunities Analysis Section 1 Trends, Opportunities & Market Factors 91
Figure 37. Portland Metro Location Quotients Relative to U.S. (1990-2035)
1990 1995 2000 2005 2008 2010 2015 2020 2025 2030 2035
Manufacturing, total 1.06 1.09 1.12 1.18 1.22 1.27 1.23 1.22 1.26 1.28 1.30
Durable Goods, total 1.25 1.29 1.34 1.43 1.45 1.53 1.45 1.45 1.51 1.54 1.56
Wood Products 2.21 1.54 1.31 1.45 1.34 1.22 1.15 1.12 1.14 1.12 1.05
Primary Metal 1.86 1.47 1.68 1.77 2.09 2.22 2.03 1.82 1.67 1.66 1.72
Fabricated Metal 1.01 1.13 1.06 1.12 1.11 1.16 1.07 1.01 1.00 1.00 1.02
Machinery 0.98 1.01 0.97 0.96 0.95 0.96 0.85 0.80 0.80 0.80 0.81
Electrical Machinery 2.23 2.70 3.07 3.77 3.75 3.63 4.38 4.79 5.01 4.86 4.56
Transportation Equipment 0.67 0.67 0.73 0.69 0.71 0.83 0.74 0.82 0.97 1.07 1.06
Non-durable Goods, total 0.78 0.79 0.76 0.77 0.80 0.85 0.84 0.82 0.82 0.83 0.84
Food Processing 0.95 0.86 0.77 0.79 0.83 0.85 0.79 0.72 0.68 0.65 0.64
Paper 1.75 1.55 1.46 1.40 1.32 1.45 1.47 1.39 1.36 1.35 1.37
Non-manufacturing, total 1.03 1.03 1.01 1.01 1.00 1.00 1.01 1.01 1.01 1.01 1.01
Natural Resources 0.40 0.44 0.42 0.39 0.28 0.31 0.31 0.32 0.30 0.29 0.27
Construction 1.05 1.20 1.06 1.08 1.17 1.22 1.09 1.03 0.99 0.93 0.89
Retail Trade 0.94 0.93 0.95 0.93 0.95 0.94 0.98 0.96 0.96 0.97 0.98
Motor Vehicle & Parts 1.09 1.04 1.04 1.00 0.97 0.92 1.01 1.07 1.08 1.09 1.08
Food & Beverage Stores 0.82 0.80 0.85 0.89 0.93 0.89 0.97 1.01 1.01 1.03 1.05
Other Retail 0.96 0.95 0.96 0.93 0.95 0.96 0.97 0.93 0.93 0.94 0.94
Transp., Warehouse, & Utilities 1.13 1.08 1.04 1.02 0.98 1.01 1.00 0.95 0.91 0.90 0.93
Information, total 0.90 0.93 0.97 1.02 1.09 1.08 1.11 1.14 1.14 1.12 1.05
Publishing 0.78 0.99 1.27 1.37 1.56 1.66 1.86 2.14 2.36 2.51 2.48
Internet & Other 0.97 0.90 0.85 0.87 0.90 0.85 0.83 0.78 0.74 0.69 0.64
Finance Activities 1.14 1.13 1.14 1.14 1.13 1.12 1.20 1.28 1.34 1.39 1.42
Finance & Insurance 0.91 0.91 0.99 0.99 0.95 0.96 1.04 1.11 1.17 1.21 1.24
Real Estate 1.84 1.77 1.57 1.55 1.62 1.61 1.63 1.74 1.80 1.89 1.96
Pro. Business Services 1.08 1.14 1.06 1.03 1.01 1.01 0.93 0.88 0.83 0.78 0.73
Pro., Sci., & Tech. 1.21 1.20 0.98 0.95 0.91 0.90 0.89 0.85 0.76 0.67 0.59
Mgmt. of Companies 0.92 1.23 1.52 1.56 1.62 1.61 1.95 2.32 2.66 3.10 3.56
Admin. Support 1.01 1.05 1.02 0.99 0.96 0.99 0.81 0.73 0.70 0.67 0.65
Edu. & Health Care 1.01 0.92 0.92 0.94 0.92 0.90 0.95 1.01 1.07 1.14 1.19
Educational 1.04 0.98 1.02 1.00 0.96 0.96 1.09 1.21 1.29 1.38 1.45
Health Care 1.00 0.91 0.90 0.92 0.91 0.89 0.92 0.98 1.03 1.10 1.15
Leisure & Hospitality 1.03 1.01 0.98 0.96 0.96 0.95 0.99 1.03 1.05 1.08 1.09
Arts, Entertainment & Rec. 1.32 1.13 0.99 0.95 0.92 0.91 0.98 0.99 0.96 0.96 0.95
Accommodation & Food 0.99 0.99 0.98 0.96 0.97 0.96 0.99 1.03 1.07 1.10 1.12
Other Services 0.91 0.89 0.88 0.87 0.88 0.83 1.04 1.15 1.21 1.27 1.28
Government, Civilian total 0.89 0.85 0.90 0.90 0.91 0.91 0.86 0.85 0.85 0.83 0.85
Federal, Civilian 0.89 0.85 0.89 0.91 0.87 0.87 0.85 0.81 0.78 0.75 0.73
State & Local 0.81 0.79 0.84 0.85 0.86 0.86 0.82 0.81 0.82 0.81 0.83
Source: Global Insight, 2008 QR US Long-Term Outlook and Metro.

Adopted – October 2012
E.D. Hovee & Company, LLC for City of Portland:
Economic Opportunities Analysis Section 1 Trends, Opportunities & Market Factors 92
AAPPPPEENNDDIIXX CC.. PPOORRTTLLAANNDD HHAARRBBOORR IINNDDUUSSTTRRIIAALL LLAANNDD SSUUPPPPLLYY AANNAALLYYSSIISS