tribal nonpoint source assessment report - red cliff...
TRANSCRIPT

1
Tribal Nonpoint Source
Assessment Report ____________________________________________________________________
Red Cliff Band of Lake Superior Chippewa
Environmental Department
Water Resources Program
DRAFT September 2017
Prepared By:
Gabrielle VanBergen
Water Resources Program Manager
Linda Nguyen
Environmental Director
Red Cliff Band of Lake Superior Chippewa
1
Table of Contents Introduction and Background ..........................................................................................................2
Social and Economic Conditions .................................................................................... 3 Water Resources Summary ............................................................................................. 4
Water Quality Assessment ...............................................................................................................6 Purpose ........................................................................................................................... 6 Method for Conducting Nonpoint Source Assessment .................................................... 7 Land Base and Land Uses Summary .............................................................................. 7 Jurisdiction and Land Use Authority .............................................................................. 9 Nonpoint Source Pollution Categories ........................................................................... 9 Effects of Nonpoint Source Pollution ............................................................................ 10 Water Quality Goals ..................................................................................................... 12 Existing Water Quality Monitoring Program ............................................................... 13 Other Water Resource Monitoring Projects ................................................................. 14
Discussion of Results .....................................................................................................................15 Chicago Creek (CC02, CC03, CCM01) ....................................................................... 16 Frog Creek (FC01, FCM01) ......................................................................................... 16 Lake Superior at the Legendary Waters Casino Marina & Beach (LS01) ................... 17 Legendary Waters Casino Pond & Outfall #1 (CPU01, LS02) .................................... 18 Legendary Waters Casino Pond & Outfall #2 (CPU02, LS03) .................................... 18 Raspberry River (RR01, RR03, RRM01)....................................................................... 19 Red Cliff Creek (RCC01, RRC03, RCCM01)................................................................ 20 Sand River (SR02, SRM01) ........................................................................................... 21 Sucker Creek (SC01, SCM02) ....................................................................................... 22
Selection of Best Management Practices (BMPs) .........................................................................26 Summary of Water Quality Assessment ........................................................................ 26 Process for Selecting BMPs .......................................................................................... 26 Existing Nonpoint Source Control Programs (BMPs) .................................................. 27 Nonpoint Source Control Core Participants ................................................................ 28 Public Participation ...................................................................................................... 28
Conclusions ....................................................................................................................................29 Acronym List .................................................................................................................................31 References ......................................................................................................................................32 Appendix A Maps and Figures ......................................................................................................35 Appendix B Tables ........................................................................................................................41 Appendix C Water Quality Data ....................................................................................................49 Appendix D Water Quality Data Graphs .......................................................................................50

2
This Nonpoint Source (NPS) Assessment Report has been developed to fulfill the United States
Environmental Protection Agency’s (US EPA) requirements for a Clean Water Act (CWA)
section 319 program. This report will assess nonpoint source water quality on lands within the
boundaries of the Red Cliff Band of Lake Superior Chippewa Reservation, which consists of
approximately 14,541 acres. It shall serve as guidance for the development of a NPS
Management Plan and assist in determining the long term assessment needs for the Red Cliff
Reservation. The Red Cliff NPS Assessment Report utilizes the Tribe’s Water Resources
Program’s CWA 106 data and other available information about the Bayfield Peninsula to
determine priorities for nonpoint source pollution prevention. Future nonpoint source
assessment of Reservation waters will be included in the Tribe’s annual Water Quality
Assessment Report under its CWA 106 Program.
Though the water resources appear to be mostly healthy, several waterbodies are shown to be
threatened by NPS pollution. Historical land cover and stream habitat changes have also
negatively impacted the water resources. Available information and data show that the soils on
the Reservation (and the Lake Superior Basin in general) are highly erodible and historic land
cover and land uses have been greatly altered, therefore nonpoint source pollution is one of the
greatest impacts to water resources in the region. The goal of this assessment is to bring attention
to water quality parameters and issues that indicate significant nonpoint sources of pollution and
provide guidance on how to effectively monitor and reduce such sources.
Introduction and Background The Red Cliff Band of Lake Superior Chippewa is one of many bands of Ojibwe that reside
around the Lake Superior region of the United States and Canada. The Red Cliff Reservation
(Gaa-miskwaabikaang) is located along 22 miles of Lake Superior’s southern shore (Gichigami)
on Wisconsin’s Bayfield Peninsula (Gegaawekamigaang). This area is commonly known as the
“Hub of the Ojibwe.”
The Red Cliff Reservation was established for the Red Cliff Band under the terms of the 1854 La
Point Treaty and an amendment to the Treaty in 1863. Final allotments were published in 1896,
listing the members of the Red Cliff Band. The Red Cliff Band adopted a constitution and by-
laws in 1936, meeting the United States Government’s requirements for becoming a federally
recognized Tribe under the Indian Reorganization Act of 1934 (IRMP, 2006).
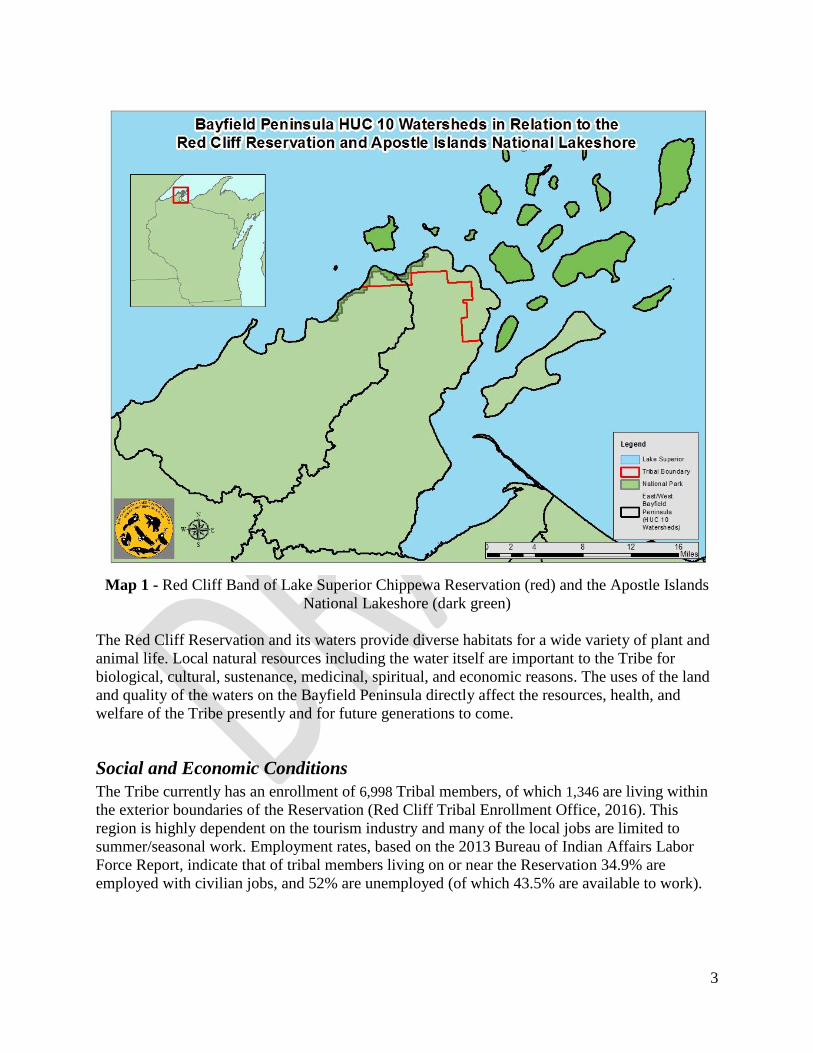
The exterior boundary of the Red Cliff Reservation (see Map 1) spans approximately 14,541
acres and contains approximately 804 acres of wetlands (WI Wetlands Inventory), 12 acres of
inland lakes/reservoirs/ponds, and 47 miles of streams that are connected to many additional
stream miles outside the boundaries. The Reservation is adjacent to the Apostle Islands
archipelago, which consists of 22 islands that extend from the Bayfield Peninsula, and 10% of
the Apostle Islands National Lakeshore lies within Red Cliff’s borders- held by the U.S.
Department of the Interior National Park Service. Table 1 details the watershed HUCs associated
with the Reservation.
3
Map 1 - Red Cliff Band of Lake Superior Chippewa Reservation (red) and the Apostle Islands
National Lakeshore (dark green)
The Red Cliff Reservation and its waters provide diverse habitats for a wide variety of plant and
animal life. Local natural resources including the water itself are important to the Tribe for
biological, cultural, sustenance, medicinal, spiritual, and economic reasons. The uses of the land
and quality of the waters on the Bayfield Peninsula directly affect the resources, health, and
welfare of the Tribe presently and for future generations to come.
Social and Economic Conditions
The Tribe currently has an enrollment of 6,998 Tribal members, of which 1,346 are living within
the exterior boundaries of the Reservation (Red Cliff Tribal Enrollment Office, 2016). This
region is highly dependent on the tourism industry and many of the local jobs are limited to
summer/seasonal work. Employment rates, based on the 2013 Bureau of Indian Affairs Labor
Force Report, indicate that of tribal members living on or near the Reservation 34.9% are
employed with civilian jobs, and 52% are unemployed (of which 43.5% are available to work).
4
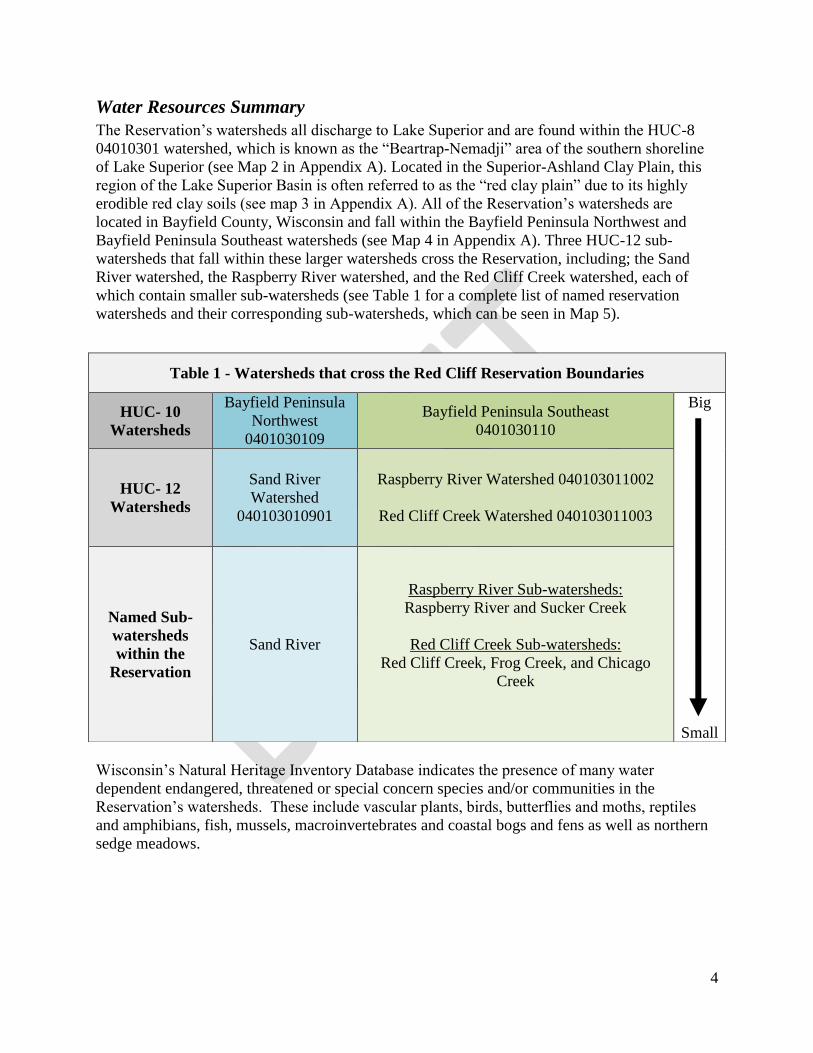
Water Resources Summary
The Reservation’s watersheds all discharge to Lake Superior and are found within the HUC-8
04010301 watershed, which is known as the “Beartrap-Nemadji” area of the southern shoreline
of Lake Superior (see Map 2 in Appendix A). Located in the Superior-Ashland Clay Plain, this
region of the Lake Superior Basin is often referred to as the “red clay plain” due to its highly
erodible red clay soils (see map 3 in Appendix A). All of the Reservation’s watersheds are
located in Bayfield County, Wisconsin and fall within the Bayfield Peninsula Northwest and
Bayfield Peninsula Southeast watersheds (see Map 4 in Appendix A). Three HUC-12 sub-
watersheds that fall within these larger watersheds cross the Reservation, including; the Sand
River watershed, the Raspberry River watershed, and the Red Cliff Creek watershed, each of
which contain smaller sub-watersheds (see Table 1 for a complete list of named reservation
watersheds and their corresponding sub-watersheds, which can be seen in Map 5).
Wisconsin’s Natural Heritage Inventory Database indicates the presence of many water
dependent endangered, threatened or special concern species and/or communities in the
Reservation’s watersheds. These include vascular plants, birds, butterflies and moths, reptiles
and amphibians, fish, mussels, macroinvertebrates and coastal bogs and fens as well as northern
sedge meadows.
Table 1 - Watersheds that cross the Red Cliff Reservation Boundaries
HUC- 10
Watersheds
Bayfield Peninsula
Northwest
0401030109
Bayfield Peninsula Southeast
0401030110
Big
Small
HUC- 12
Watersheds
Sand River
Watershed
040103010901
Raspberry River Watershed 040103011002
Red Cliff Creek Watershed 040103011003
Named Sub-
watersheds
within the
Reservation
Sand River
Raspberry River Sub-watersheds:
Raspberry River and Sucker Creek
Red Cliff Creek Sub-watersheds:
Red Cliff Creek, Frog Creek, and Chicago
Creek
5
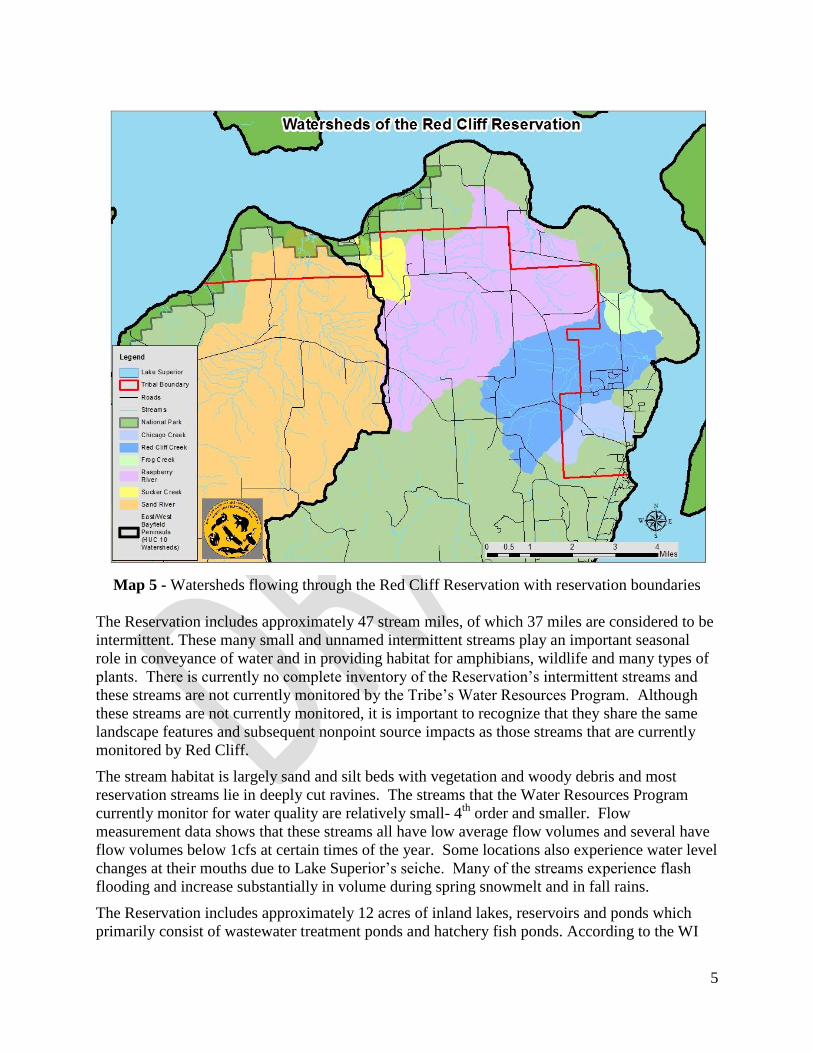
Map 5 - Watersheds flowing through the Red Cliff Reservation with reservation boundaries
The Reservation includes approximately 47 stream miles, of which 37 miles are considered to be
intermittent. These many small and unnamed intermittent streams play an important seasonal
role in conveyance of water and in providing habitat for amphibians, wildlife and many types of
plants. There is currently no complete inventory of the Reservation’s intermittent streams and
these streams are not currently monitored by the Tribe’s Water Resources Program. Although
these streams are not currently monitored, it is important to recognize that they share the same
landscape features and subsequent nonpoint source impacts as those streams that are currently
monitored by Red Cliff.
The stream habitat is largely sand and silt beds with vegetation and woody debris and most
reservation streams lie in deeply cut ravines. The streams that the Water Resources Program
currently monitor for water quality are relatively small- 4th
order and smaller. Flow
measurement data shows that these streams all have low average flow volumes and several have
flow volumes below 1cfs at certain times of the year. Some locations also experience water level
changes at their mouths due to Lake Superior’s seiche. Many of the streams experience flash
flooding and increase substantially in volume during spring snowmelt and in fall rains.
The Reservation includes approximately 12 acres of inland lakes, reservoirs and ponds which
primarily consist of wastewater treatment ponds and hatchery fish ponds. According to the WI

6
Wetlands Inventory, there are 804 acres of wetlands, which are composed of upland wetland
areas, beaver meadows and coastal estuaries. These wetlands provide habitat to many reptiles,
amphibians, fish, birds and mammals.
Groundwater is the source of drinking water for the Reservation either through Tribal utilities,
private wells or artesian wells. The United States Geological Survey (USGS) was contracted in
2011 to develop a groundwater flow model to improve understanding of the Tribe’s groundwater
resource. A draft report of their findings indicates that 80% of the peninsula’s groundwater is
supplied by recharge, precipitation infiltrating into the ground, and 20% flows underground from
the Wisconsin mainland. As the peninsula’s groundwater flows toward Lake Superior, 89%
discharges into streams, 9% reaches the lake and only about 1% is pumped out by municipal,
private, and aquaculture/hatchery wells. Based on groundwater flow directions, the USGS draft
study report estimates that the water pumped by the Red Cliff Water and Sewer Department
encompasses a capture zone that extends approximately six miles west of Red Cliff’s four
community wells. This study did not provide any information regarding the quality of
groundwater; however the Water and Sewer Department ensures Safe Drinking Water Act
(SDWA) compliance through routine monitoring. A Wellhead Protection Plan was completed for
the Reservation in 1995, but was updated as a Source Water Protection Plan in 2005 through
Wisconsin Community Action Program (WISCAP), and again in 2009. The Source Water
Protection Plan will be updated again in winter of 2017.
Water Quality Assessment
Purpose
The purpose of this assessment is to identify waterbodies for which uses have been or are likely
to be impaired (threatened) by nonpoint sources (NPS) of pollution unless alternate management
practices are implemented. Currently, nonpoint source pollution is the leading source of the
nation’s water quality problems (US EPA).
NPS pollution occurs when rainfall, snowmelt, or irrigation runs over land or through the
ground, transports pollutants, and deposits them into rivers, lakes and coastal waters or
introduces them into ground water through infiltration. NPS pollution also causes adverse
changes to the vegetation, shape, and flow of streams and other aquatic systems. This type of
pollution is referred to as “nonpoint source” because it cannot be traced back to a specific
location or source, such as a pipe discharging effluent directly into a waterbody.
NPS pollution is widespread because it can occur any time activities disturb the land or water.
Forestry, agriculture, grazing, septic systems, recreational boating, urban runoff, construction,
natural or anthropogenic physical changes to stream channels, and habitat degradation are
potential sources of NPS pollution. Careless or uninformed household management also
contributes to NPS pollution problems.
7
Method for Conducting Nonpoint Source Assessment
Data utilized in the assessment of nonpoint sources of pollution on the Red Cliff Reservation
include: land use data, soil data, and original vegetation data from the Red Cliff Integrated
Resource Management Plan and Bayfield County Website; results from the septic system
inventory carried out under WISCAP; water quality data collected by the Tribe’s Water
Resources Program under CWA 106 and other programs; the USGS Bayfield Peninsula
Groundwater study draft report; the Lake Superior Basin Regional Assessment & Report
Compendium by the WDNR; the Biodiversity Conservation Strategy for Lake Superior and its
Nemadji to Fish Creek Regional Unit Plan; and information from the State of the Basin Plan by
the Wisconsin Department of Natural Resources (WDNR) for the Lake Superior Basin.
The Red Cliff Water Resources Program has been collecting data on the basic water quality on
the Reservation since the early 1990’s. Previous sampling efforts focused on chemicals.
Macroinvertebrate monitoring (biological monitoring) was initiated in 2009 to augment basic
water quality monitoring. Additionally, best professional judgment and knowledge of the history
of the Reservation plays an important role in assessing the possible impacts to water quality as
well as planning for the management of nonpoint pollution sources. Input from Red Cliff tribal
members or other community members is welcomed and specifically sought out annually at Red
Cliff’s Annual Watershed Symposium, which is hosted by the Water Resources Program or on a
case by case basis.
Land Base and Land Uses Summary
The topography in the area is mostly rolling hills, with steep slopes along drainage areas.
Predominant soils in the area consist of the Odanah silt loam complex and Sanborg-Bad River
complex. They are formed in clayey till and heavy red clay from depositional beds of ancient
lakes and till deposited by glacial action, this region is commonly referred to as the Lake
Superior clay plain. The combination of clay and sand at the soil zones interface leads to high
susceptibility to erosion as rain and snowmelt run off the clay quickly due to its impermeability.
The Lake Superior Biodiversity Conservation Strategy Nemadji to Fish Creek Regional Plan
states that this region of Lake Superior “is prone to erosion and sedimentation issues and is one
of the largest sources of sediment to Lake Superior (NRCS no date). Accelerated runoff and non-
point source pollution affecting both in-channel and nearshore habitats are major threats to
biodiversity.”
Before European settlement occurred in the region, the land cover consisted of old growth
northern and boreal forests (hemlock, maple, birch, white and red pines) and wetlands. The
vegetation cover of the entire region was drastically changed by the early 1900’s as timber
harvesting removed most of the old growth conifer forest. The resulting clear cut areas were very
susceptible to fire and erosion. The forest cover has returned, however, its components have
drastically changed. Most of the Reservation today is forested, predominantly consisting of aspen
and also including balsam fir, maple, birch, basswood, oak, some red and white pines, and
hemlocks.
Tribally owned forest covers about 8,000 acres of the Reservation, of which 6,200 forested acres
are under Tribal Trust ownership and the rest is allotted to individuals through trust allotments.
The rest of the Reservation is non-forest and is a mixture of developed lands with commercial
buildings and residential homes, and non-forested wetlands (IRMP, 2006). Current land cover
8
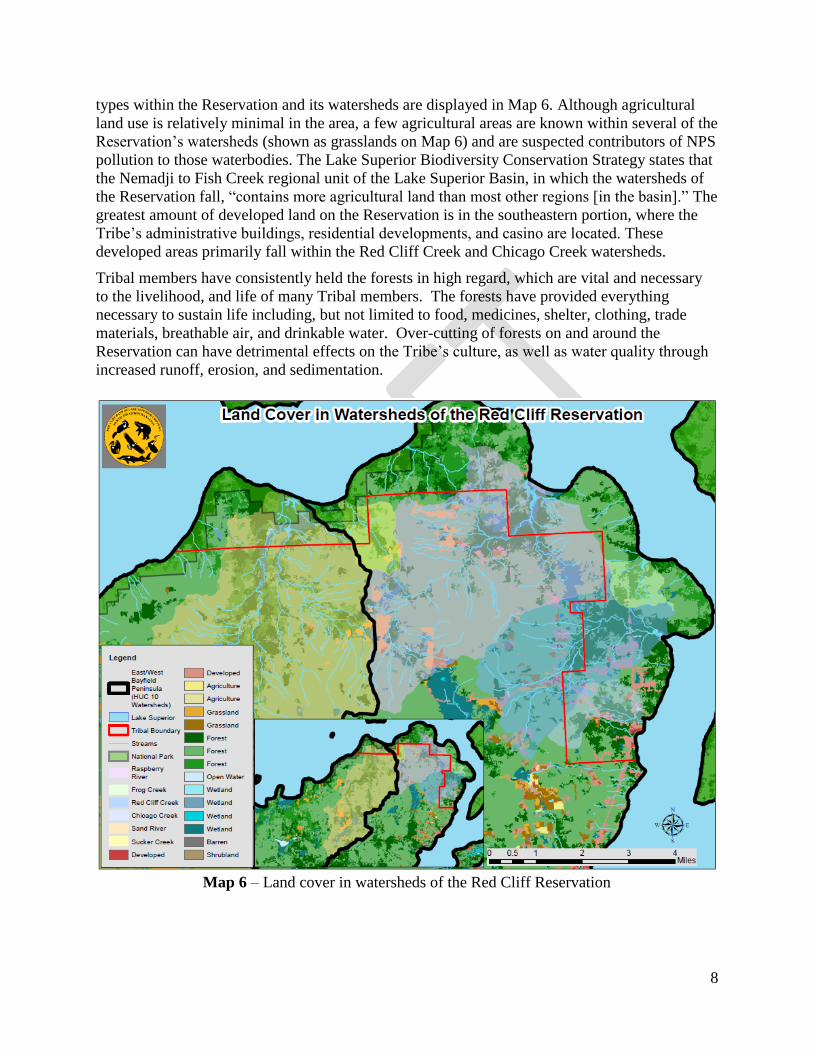
types within the Reservation and its watersheds are displayed in Map 6. Although agricultural
land use is relatively minimal in the area, a few agricultural areas are known within several of the
Reservation’s watersheds (shown as grasslands on Map 6) and are suspected contributors of NPS
pollution to those waterbodies. The Lake Superior Biodiversity Conservation Strategy states that
the Nemadji to Fish Creek regional unit of the Lake Superior Basin, in which the watersheds of
the Reservation fall, “contains more agricultural land than most other regions [in the basin].” The
greatest amount of developed land on the Reservation is in the southeastern portion, where the
Tribe’s administrative buildings, residential developments, and casino are located. These
developed areas primarily fall within the Red Cliff Creek and Chicago Creek watersheds.
Tribal members have consistently held the forests in high regard, which are vital and necessary
to the livelihood, and life of many Tribal members. The forests have provided everything
necessary to sustain life including, but not limited to food, medicines, shelter, clothing, trade
materials, breathable air, and drinkable water. Over-cutting of forests on and around the
Reservation can have detrimental effects on the Tribe’s culture, as well as water quality through
increased runoff, erosion, and sedimentation.
Map 6 – Land cover in watersheds of the Red Cliff Reservation
9
Jurisdiction and Land Use Authority
The exterior boundary of the Red Cliff Reservation spans approximately 14,541 acres. The Red
Cliff Band retains property rights in approximately 56% of these acres. The remaining acres are
alienated lands in fee simple or taxable status. Therefore, within the exterior boundary is a
mixture of tribal and non-tribal ownership, including lands held by the National Park Service for
the Apostle Islands National Lakeshore. Adjacent to the Reservation, the US Forest Service
manages a significant central core of the Bayfield Peninsula as part of the Chequamegon
National Forest. Other significant land holders in the watersheds include Bayfield County forest
lands.
Nonpoint Source Pollution Categories
The Red Cliff Reservation is a rural area in Northern Wisconsin. Based on local land uses and
soil types, general nonpoint source pollution categories that apply to this area are forestry, roads,
development, agriculture, hydromodification, and marinas.
Forestry Sources of NPS pollution associated with forestry activities include removal of riparian
(streamside) vegetation, logging road construction and use, timber harvesting, soil compaction,
and mechanical preparation for the planting of trees. Logging road construction and use are the
primary sources of NPS pollution on forested lands because the soil is left entirely exposed.
Harvesting trees in the area beside a stream can affect water quality in several ways. Streambank
shading is reduced, causing greater water temperatures. Removal of riparian vegetation also
increases runoff rates and de-stabilizes stream banks, leading to increased erosion. These
changes can harm aquatic life by limiting habitat, sources of food, temperature-limiting shade
and shelter, and cause greater sedimentation in streams.
Roads
Roads, highways, and bridges contribute pollutants to water resources. Contaminants from
vehicles and activities associated with road and highway construction and maintenance are
washed from roads and roadsides when it rains or snow melts. A large amount of this runoff
pollution is carried directly to waterbodies. When land is cleared to build a road or bridge, soil
erosion is increased. The natural flow of the stream may be altered by a culvert- or culvert
failure or bridge, which can alter instream habitat and create barriers to fish and wildlife if proper
best management practices (BMPs) are not utilized.
Development
Impervious (nonporous) surfaces like roads, parking lots, and rooftops prevent rain and
snowmelt from infiltrating, or soaking into the ground. Most of the rainfall and snowmelt
remains above the ground surface, where it runs off rapidly in large amounts. The runoff carries
pollutants and sediment from roads, parking lots, roofs, construction sites and other denuded
surfaces. Storm sewers and ditches concentrate runoff into smooth, straight conduits. The
increased speed of the water flow can erode streambanks, carry pollutants more directly into
waterways and damage streamside vegetation and alter habitat.
10
Agriculture
Agricultural lands, including active croplands, pasture, hay fields, etc. are lands that have limited
canopy cover and root structures, thus increasing runoff volumes and rates. Greater amounts of
runoff may then lead to heightened erosion and sedimentation and may carry agricultural related
contaminants into streams (nutrients, pathogens, etc.). Groundwater contamination may also
occur through infiltration.
Hydromodification
Historic hydromodification includes channelization, channel modification, dams, and stream
bank and shoreline erosion. Many land uses can contribute to the negative impacts to streams
known as hydromodification. Channel modification activities can alter instream water
temperatures and sediment characteristics, as well as the rates and paths of sediment erosion,
transport, and deposition. A frequent result of hydromodification is a diminished suitability of
instream and riparian habitat for fish and wildlife.
Marinas
Although there is no direct influence on the Reservation’s streams, marinas on the Reservation
can affect the water quality of Lake Superior. Water pollution from boating and marinas is linked
to several sources. These sources include poorly flushed waterways, boat maintenance,
discharge of sewage from boats, fuel/oil leaks, stormwater runoff from marina parking lots, and
the physical alteration of shoreline, wetlands, and aquatic habitat during the construction and
operation of marinas, boat ramps and docks.
Effects of Nonpoint Source Pollution
The most common NPS pollutants on the Reservation are sediments and nutrients. Other
common NPS pollutants include pathogens (bacteria and viruses), salts, oil, grease, pesticides,
toxic chemicals and heavy metals. NPS pollution can result in unsafe swimming and wading
areas, disturbed habitat, unsafe drinking water, fish kills, and many other environmental and
human health problems. These pollutants can also disturb the functioning of healthy, clean water
habitats.
Sediments
Human land use activities, including tilling, maintaining grazing lands for livestock, building
stream crossings for roads and building roads, construction, urbanization, and forestry practices,
accelerates natural sediment erosion. In addition, the Reservation has noted sediment impacts
from beaver activity as beaver dam degradation causes sediment loading. Excess sediment can
smother aquatic habitat, reduce water clarity, deplete oxygen, and deposit nutrients and toxins.
Nutrients and metals may adhere onto sediment particles and be transported along with
sediments into and through aquatic systems.

11
Nutrients
Nutrients originate from fertilizers, animal waste, failing septic systems (human waste), natural
background levels, soil erosion, urban runoff, and atmospheric emissions. Nutrient overloading
may stimulate excessive growth of algae and nuisance aquatic plants in streams, lakes and
reservoirs- eutrophication. Eutrophication renders water aesthetically unattractive or unsuitable
for recreation by reducing water clarity, and impacts aquatic life by lowering dissolved oxygen
when larger amounts of plants die and decompose. Excess nitrate (>10 ppm) in drinking water
may cause methemoglobinemia- “blue baby syndrome” in infants (World Health Organization).
Pathogens
Pathogens are disease-causing organisms often associated with fecal matter. Fecal coliform
bacteria are found in the intestines of warm-blooded animals. Their presence in waters indicates
that pathogenic organisms may also be present. They are most commonly associated with failing
septic tanks and drain fields from individual sewage treatment systems, pet wastes, high numbers
of waterfowl (particularly geese), and grazing animals. Pathogens can make humans sick with
both short term side effects as well as more life threatening illnesses.
Toxicants
Toxic substances include heavy metals, petroleum byproducts, and pesticides. They can be
harmful to both aquatic and human life. These toxicants are generally resistant to degradation
and bioaccumulate in food webs. Sources of toxic contaminants include industrial, commercial,
household, and auto emissions. Mercury pollution is extensive in the Lake Superior basin,
causing strict “recommended” fish consumption advisories; however mercury originates almost
exclusively from outside sources-atmospheric deposition (IRMP, 2006).
Thermal Stress
Thermal stress results from elevated water temperatures that can harm native species while
helping non-native species to spread. Thermal stress is caused by runoff from heat-absorbing
impervious surfaces, removal of riparian vegetation, shallow water impoundments, and
decreased base flow.
Trash
Trash includes plastics, metal, tires, paper, etc. It threatens aquatic life by entangling, cutting, or
even killing animals such as birds and fish that mistake trash for food. Litter also detracts from
recreational and aesthetic values. Improperly disposed trash- littering, is a result of illegal
dumping, street litter, beach litter, and boating waste.

12
Water Quality Goals
Tribal Water Quality Standards under CWA Sections 518 and 303 have not been established for
the Red Cliff Band. The Water Resources Program is anticipated to establish water quality
standards within the next two years. The Red Cliff IRMP states that the long-term goal of the
Tribe is “to protect and improve all Tribal waters to the extent that water quality and associated
habitat fully support all aquatic life at levels that allow for continued reproduction and
biological functions, safe commercial and subsistence utilization, and protection of aquatic
cultural resources and public health.”
Until Red Cliff’s establishes water quality standards, analytical results for the basic water
chemistry parameters analyzed are compared to available criteria from the Bad River Band of
Lake Superior Chippewa and the USEPA. This comparison will assist in the determination of
impacts to each water body sampled. The following table lists available criteria for comparisons
(see Table 2). Several of these parameters are basic water characteristic parameters based on
local geology and stream type. Abrupt changes in the value of these parameters will be noted
and the cause will be investigated through upstream observations at a minimum.
Table 2 – Applicable water quality criteria used for water quality comparison
Parameter Criteria Source Comment
Dissolved Oxygen Values should fall
between 5-12 mg/L
EPA Criteria
Recommendations
EPA Technical
Contact, Katherine
Marko
pH Values should fall
between 6-9 State of WI -
Turbidity Values should not exceed
30.78 NTU
EPA Criteria
Recommendations
Ecoregion VIII
Subecoregion 50
Total phosphorus Should not exceed .012
mg/L
EPA Criteria
Recommendations
Ecoregion VIII
Subecoregion 50
E. coli
Should not exceed
235 CFU (STV)
126 CFU (GM)
EPA Criteria
Recommendations
Full body contact
recreation
Total Nitrogen Should not exceed
.44 mg/L
EPA Criteria
Recommendations
Ecoregion VIII
Subecoregion 50
Nitrite/nitrate Should not exceed
0.03 mg/L
EPA Criteria
Recommendations
Ecoregion VIII
Subecoregion 50
Total Kjeldahl
Nitrogen
Should not exceed
.33 mg/L
EPA Criteria
Recommendations
Ecoregion VIII
Subecoregion 50
Ammonia Should not exceed
1.9 mg/L
EPA Criteria
Recommendations
Aquatic Life
Ambient Water
Quality Criteria for
Ammonia-
Freshwater 2013
13
The Red Cliff Band of Lake Superior Chippewa, retains cultural and historical connections to the
waters of the region. The Tribe has retained Treaty Rights to natural resources within ceded
lands of Wisconsin, Michigan, Minnesota, and Lake Superior. Commercial and subsistence
fishing, cultural migration routes, wild rice beds, fishery restoration, tribal ceremonies, habitat
for critical wildlife and tribal medicines, and clean water for consumption are some of the
significant uses of tribal waters. Water quality protection is, therefore, a paramount concern for
Tribal members and the Tribal Council. The Red Cliff Treaty Natural Resource (TNR) Division
is responsible for this protection, and as the responsible agency, the TNR Division’s Water
Resource Program has undertaken collection and analysis of the Reservation’s water quality
data. The overall objective of the program is protection and restoration of water resources within
the Reservation. Data is collected to provide a base of knowledge from which management
decisions may be made.
Existing Water Quality Monitoring Program
The Red Cliff Water Resources Program operates according to approved Quality Assurance
Project Plans (QAPPs) under the CWA 106 program. The Water Resources Program conducts
monthly surface water testing at 16 locations throughout the Reservation for basic water quality
parameters during the open water season (GPS coordinates listed in Table 3 in Appendix B).
Measurements of flow are taken once a month at the same sites during the open water season.
Visual habitat observations will be taken periodically to document changes, and specific
attention will be paid to occurrences of rain events and flooding. Biological (aquatic
macroinvertebrate) monitoring is also conducted on a rotational, annual basis (see Table 6) at
each site and biotic index values are given to rate the quality of the waterbody. Site locations are
shown in Map 7 in Appendix A and the corresponding measured parameters taken are listed in
Table 4. The Legendary Waters Casino Retention Pond Project sites (4 additional sites) listed in
Table 3 were only monitored during 2014 and 2015 sampling seasons to assess the success of the
Water Resource Program’s 2014 casino pond remediation efforts. Wetlands are not currently
being monitored; however, 13 wetland sites were inventoried and assessed and a report was
completed in February 2016 by Wetlands & Waterways LLC.
Surface water quality parameters (chemical/physical) monitored at all sites include:
Field Measured Parameters
pH, temperature, dissolved oxygen, conductivity, turbidity, flow, and visual habitat assessment.
Laboratory Measured Parameters
Total Phosphorus, Total Nitrogen, Nitrates+Nitrites, Total Kjeldahl Nitrogen, Ammonia, Total
Suspended Solids, and E. coli.
Data collection of hydrological and chemical parameters through the Water Resources Program
has enabled the Tribe to create a baseline of data to aid in creating an assessment of its water
quality. Data collection has indicated nonpoint sources may negatively impact water resources.
No indications of toxic pollution were found in water sampling conducted initially under the
CWA 106 program. Continued baseline monitoring is needed to assist the Tribe in future
management decisions and to assess water quality trends as NPS BMPs are implemented.
14
Other Water Resource Monitoring Projects
Stream Crossing Inventory
Most culverts on tribal roads are not adequately sized or engineered to withstand the increasing
intensities of flood events due to climate change. Culvert “blowouts” are common and
replacements are often of similar specifications to their pre-damaged state as a result of
insufficient BIA transportation funding. The result of these frequent blowouts is mass erosion
events of the roadway and ditches that flush downstream. This project was conducted during the
field season of 2016 to evaluate the physical and ecological status of perennial stream road
crossings occurring within Reservation to develop a Red Cliff road stream crossing inventory
necessary for effective remediation planning and prioritization. Results of this effort are
displayed in Figure 1. Funding for this project was made available by the EPA Great Lakes
National Program Office (GLNPO).
Water Data Loggers
The Water Resources Program deployed water data loggers in Reservation streams during the
2016 and 2017 field season. Sixteen temperature loggers were placed at the current water quality
sampling sites as part of ongoing data collection. An additional six data loggers, which read
water level as well as temperature, were strategically placed throughout the Reservation for a
two year study to assess water quantity issues. This effort will assist the Tribe’s resource
managers in short term and long term reservation stream trends. Funding for this project will be
provided by both US EPA and Bureau of Indian Affairs (BIA) grants.
Wetland Inventory and Assessment Report
Wetland assessments were conducted at several sites throughout the Reservation by Wetlands
and Waterways, LLC in the fall of 2015 and summer of 2016. Assessments consisted of random
meanders throughout each selected wetland and assessing the area utilizing the WDNR Wetland
Rapid Assessment Methodology (WisRAM). The following categories were considered for the
functional value assessment for each wetland area; human use values, wildlife habitat, fish and
aquatic life habitat, shoreline protection, storm and floodwater storage, water quality protection,
groundwater processes, and floristic integrity. Summary tables from the report are included in
Appendix B.
Source Water Protection Plan
The Source Water Protection Plan replaced the Tribe’s previous Wellhead Protection Plan. The
aquifer that supplies drinking water to the Red Cliff Housing Wells 1 and 2, and Red Cliff Wells
3 and 4 are part of the Precambrian Lake Superior Sandstone and has a depth to water of 143 feet
below the ground surface. The Red Cliff Water and Sewer Department monitors these wells to
ensure SDWA compliance. The Water Resources Program, in conjunction with the
Environmental Health Specialist, is currently updating the Source Water Protection Plan, which
will be implemented in winter 2017.
15
Legendary Waters Casino Retention Pond Project
Construction for the Legendary Waters Casino began on the Lake Superior shoreline in 2011 and
two stormwater retention/settling ponds were installed. These ponds were meant to retain
parking lot/roadway stormwater, reducing runoff and nutrient loading into the lake. Without
adequate buffer zones however, excessive amounts of nutrients were reaching the lake through
the pond outfalls. In 2014, the Tribe’s Water Resources Program utilized CWA 319 competitive
funds to plant a 10 foot buffer zone of native wetland plants around each of the retention ponds.
These plants are anticipated to uptake water and nutrients, decreasing the rate of water flow and
reducing the nutrient levels in the ponds’ discharge water. To assess the success of this
remediation project, the Water Resource’s Program monitored the water quality in both ponds
and at their Lake Superior outfalls during the 2014 and 2015 sampling seasons.
Septic System Inventory
The Red Cliff Tribe performed an inventory of septic systems on the Reservation in 2008 and
2009. The systems on the Reservation are of mixed age categories, many of which were in need
of repair or replacement. Several septic systems were replaced by the expansion of the water
main and sewer service, and the inventory led to the replacement and/or major repair of 18
residential septic systems on the Reservation. A contained outhouse system at the Raspberry
Campground was also installed. A major component of this project was outreach and education
efforts with homeowners to encourage routine maintenance on systems. The inventory project
was funded by an EPA Great Lakes Restoration Initiative grant and coordinated through
WISCAP, with the Bad River Tribe assisting.
Discussion of Results Review of field and laboratory data indicates that every monitored stream flowing through the
Reservation is impacted by NPS pollution. The primary pollutants in reservation streams are
sediment, nitrogen and phosphorus. Many streams are also affected by E.coli as well. In this
rural setting, comprised of highly erodible clay and sandy soils, sources of nutrients are most
likely linked to runoff and erosion from cleared lands that are used for agricultural and logging
purposes. Nitrogen sources are also potentially linked to failing septic systems and/or outhouses,
which are also the most likely source of E.coli.
Review of the Water Resource Program’s water quality data from 2014-2015 for the Legendary
Waters Resort and Casino ponds and Lake Superior outfalls indicates that the program’s 2014
retention pond remediation efforts were relatively successful. While nitrogen and phosphorus
levels are lower at the outfall sites, these parameters continue to exceed criteria in both ponds
and at both outfalls. Nitrogen and phosphorus are likely contributed from runoff flowing over the
casino’s large mown grass lawn. High chloride levels were noted at the LS02 outfall site, which
can be attributed to additional culverts originating from State Highway 13.
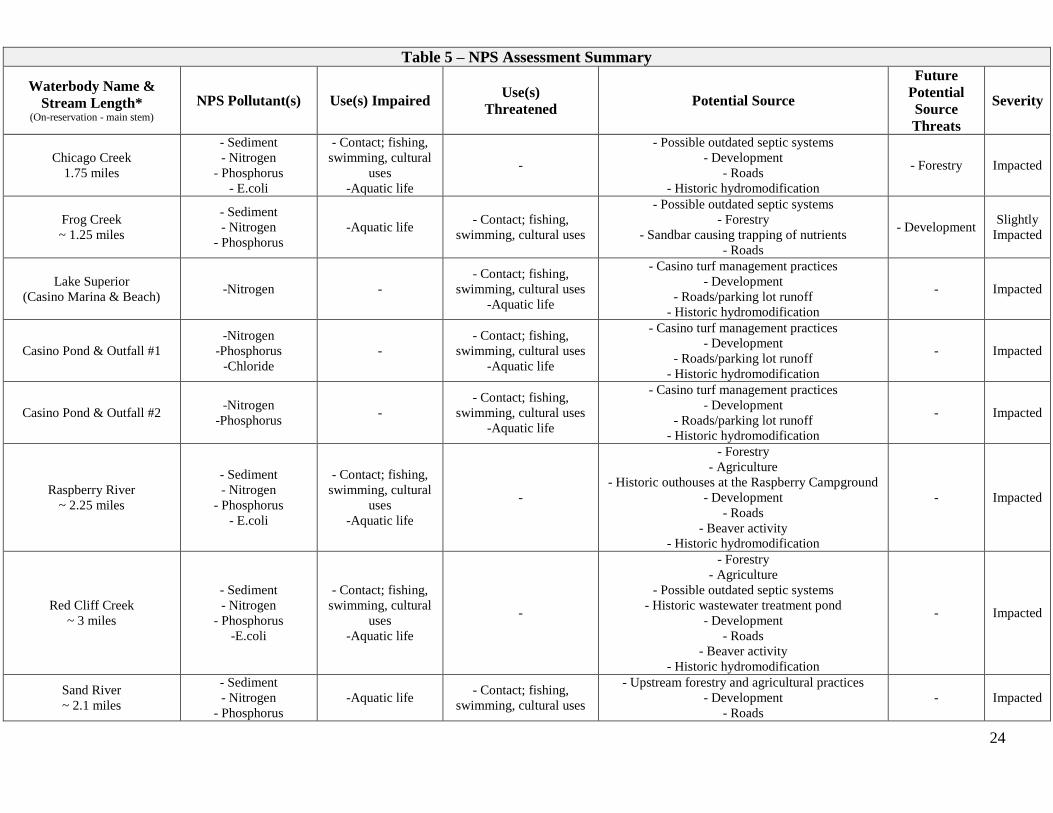
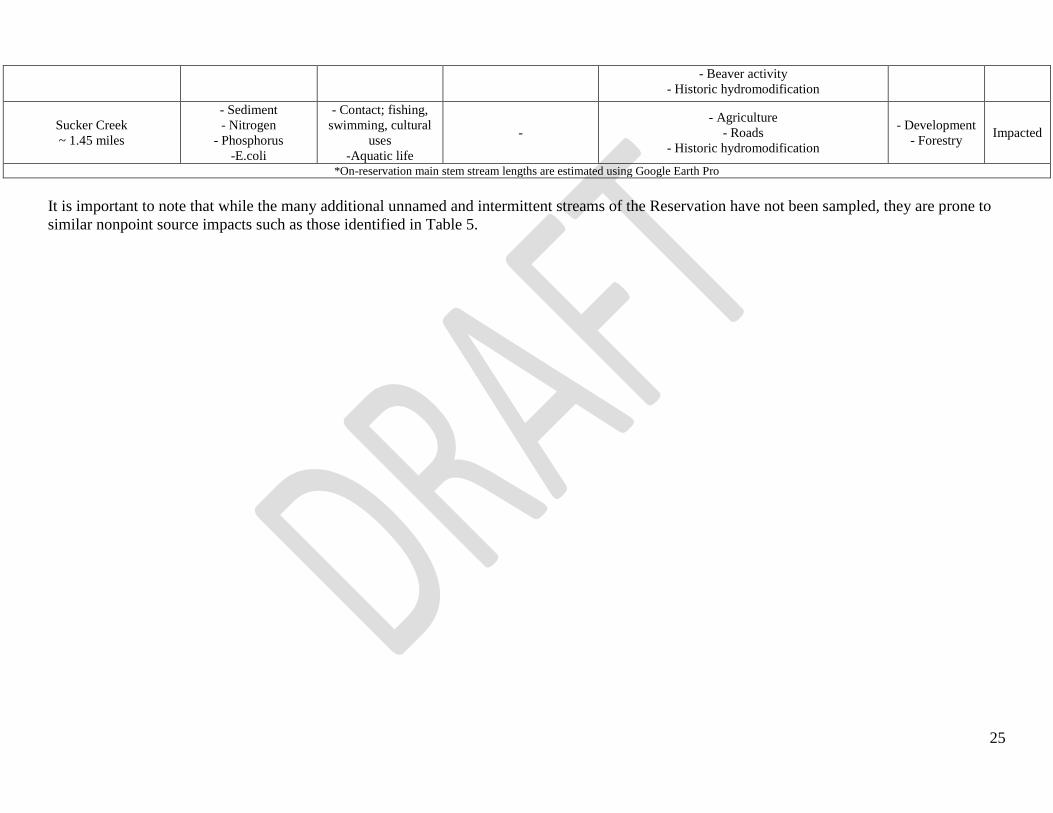
Red Cliff’s water quality impairments and potential sources are summarized in Table 5.
16
Chicago Creek (CC02, CC03, CCM01)
Chicago Creek is a small to mid-size stream that originates from springs and seeps near State
Highway 13. This stream’s watershed is comprised of privately owned lands, as well as trust and
tribal allotments. While the watershed does contain forested areas, the creek is at risk of higher
runoff rates due to road crossings at Highway 13 and Blueberry Road, and an ATV/snowmobile
trail crossing which was closed to traffic in 2013. The 2016 stream crossing inventory found that
the culvert located at Blueberry Road has some erosion around it that needs to be addressed.
Also located in the watershed are the Buffalo Bay Gas Station, powwow grounds, a private
storage facility, and the Tribe’s wastewater treatment facility. This stream has also been
influenced by timber harvest within its riparian zone, which causes greater amounts of runoff,
erosion, streambank instability, and habitat loss for both terrestrial wildlife and fish within the
stream. In the past, effluent from Red Cliff’s old community sewage treatment facility was
discharged directly into Chicago Creek (IRMP 2006).
Two wetlands within the Chicago Creek watershed were assessed as part of the Wetlands and
Waterways inventory and assessment in 2014 and 2015. Sites were located at the CCM01 water
quality monitoring site at the mouth and near the Red Cliff Powwow Grounds. The wetland near
the CCM01 monitoring site was found to have high human use and wildlife habitat values,
exceptional fish and aquatic life habitat value, and medium value for floristic integrity, shoreline
protection, flood protection, and water quality protection. The report noted a small population of
reed canary grass that should be removed. The site assessed upstream, near the Red Cliff
Powwow Grounds, was found to have high value for wildlife and fish and aquatic life habitat.
The site was ranked medium for floristic integrity, human use, and water quality protection, and
was found to have low flood and shoreline protection.
Review of the Water Resource Program’s water quality data from 2013-2016 (see Appendix D)
indicates that Chicago Creek is impacted by NPS pollution, and the creek’s water quality has
slightly declined over the past three years. The stream’s temperature appears to be generally
increasing, and as expected the dissolved oxygen levels are slowly declining. Phosphorus and
turbidity levels appear to be improving, while nitrogen levels have experienced a slight increase
at the Highway 13 (CC02) and stream mouth (CCM01) sample sites. Nitrogen sources may be
linked to historic land use in the headwaters area and septic systems located near the stream
south of Highway 13. E.coli levels in the stream are persistent and regularly exceed the threshold
(235 CFU) at the mouth (CCM01) sample site. Land uses in the area indicate that the source of
E.coli may also be linked to older septic systems and outhouses.
Biotic index scores, shown in Appendix B and Appendix E, indicate that the stream’s ecological
status has slightly worsened. The Highway 13 (CC02) sample site went from “good” in 2009 to
“very poor” in 2012, to “poor” in 2015, and the mouth (CCM01) sample site went from “fair” in
2012 to “fairly poor” in 2014 and back to “fair” in 2016.. Samples were taken at the Blueberry
Road (CC03) site for the first time in 2015 and it received a biotic index score of “very good.”
Frog Creek (FC01, FCM01)
Frog Creek is a small spring fed stream, is mostly unaltered and is considered to be remote. The
stream has no road crossings and there are only a few nearby homes. The majority of the
watershed consists of Bayfield County forest and tribal trust land. The lands surrounding the
mouth of Frog Creek are tribally owned, preserved by the Frog Creek Conservation Management

17
Area (CMA). The Frog Creek CMA was designated in 2017 and includes; the 89 acre Frog Bay
Tribal National Park, which became the first ever Tribal National Park in the United States in
2012, an additional 82 acre private parcel acquired in 2017, 80 acres of Bayfield County land
also acquired in 2017, and 40 acres of land already in tribal ownership. The old growth boreal
forest in the Tribal National Park was never fully cleared by the logging era and was identified
by the WDNR to be of global significance. The stream’s mouth forms a coastal wetland estuary
complex where it enters Frog Bay, which has been identified by the Lake Superior Binational
Forum as important to the integrity of the Lake Superior ecosystem for coastal wetlands. This
estuary area contains wild rice.
One wetland site within the Frog Creek watershed was assessed as part of the Wetlands and
Waterways inventory and assessment in 2014 and 2015. The assessment was conducted near the
FC01 water quality monitoring site. The site was ranked exceptional for floristic integrity,
human use, wildlife habitat, fish and aquatic life habitat, shoreline protection, flood protection,
and water quality protection. A small amount of non-native dill was noted during the assessment
and should be removed.
Review of the Water Resource Program’s water quality data from 2013-2016 (see Appendix D)
indicates that Frog Creek is impacted by NPS pollution, and the creek’s water quality has slightly
declined over the past three years. The mouth of Frog Creek is regularly closed off by a sand bar.
This common blockage of flow appears to be influencing the stream’s water quality near the
mouth (FCM01) by trapping nutrients such as nitrogen and phosphorus. This elevated level of
nutrients has in turn led to increased plant growth, which can cause eutrophication. This
increased plant growth also causes anaerobic decay when the plants die, which has led to
decreases in the stream’s dissolved oxygen. Higher temperatures and lower flow rates due to the
stream blockage have also likely influenced the stream’s dissolved oxygen. Although no
exceedances have been detected, E.coli levels also appear to be slightly increasing at both sample
sites. Land uses in the area indicate that the source of E.coli and nitrogen may be older septic
systems and outhouses, as well as trapped animal fecal matter. Phosphorus as well as nitrogen
inputs are likely due to logging activity in the extreme headwaters area.
Biotic index scores can be found in Appendix B and Appendix E. The FC01 site was sampled for
aquatic macroinvertebrates in 2015 and was assigned a biotic index score of “fairly poor” due to
their only being 106 versus the required 125 samples. The mouth sample site (FCM01) was first
sampled in 2014 and was designated “fairly poor” and when sampled again in 2016 was given a
score of “fair.”
Lake Superior at the Legendary Waters Casino Marina & Beach (LS01)
Located on the Lake Superior shoreline in front of the Legendary Waters Resort and Casino is a
boat launch and small marina capable of holding approximately 30 boats. Adjacent to the boat
launch is a swimming beach. Previously, the land near the current casino property was mostly
forested, with an art center, church and cemetery, and forested campground. Currently, the land
surrounding the casino is mostly open cut lawn with fragmented areas of trees, large parking lot,
and open campground area. Runoff can also affect the marina and beach area from the nearby
outfalls from Casino Pond #1 and Highway 13.
18
Review of the Water Resource Program’s water quality data from 2013-2016 (see Appendix D)
indicates that boat ramp/beach site is impacted by NPS pollution. Turbidity and phosphorus
levels continue to decline at the site, with temperatures remaining consistent. Nitrogen levels are
persistent at the site, likely due to the manicured lawn just uphill. Dissolved oxygen remains
consistently low, which can be attributed to the marina break wall that reduces water flow and
aeration through the marina. Although Canada Geese can generally be found on the casino
grounds and beach area, E.coli levels have not exceeded criteria at this site since 2013.
Aquatic macroinvertebrates are not sampled at this site because the Water Resources Program
conducts biological sampling under a stream sampling QAPP and sampling procedures are
different for lakes.
Legendary Waters Casino Pond & Outfall #1 (CPU01, LS02)
This retention pond and its outfall are located west of the Legendary Waters Casino. Major land
cover changes occurred in 2010 when this area was cleared for the development of the casino
and resort. Large amounts of stormwater runoff from the parking lot and roof are channeled into
the retention pond for settling before entering Lake Superior. Remediation efforts to reduce
nutrient loadings to Lake Superior from the west-end casino pond (CPU01) occurred in 2014. To
assess the success of the casino pond remediation project, the Water Resource’s Program
monitored the water quality in both the pond and at the Lake Superior outfall during the 2014
and 2015 sampling seasons. The Lake Superior outfall site (LS02) also receives inputs from two
additional culverts originating from State Highway 13. In the fall of 2015, a large amount of
riprap was installed below the three culverts to reduce erosion and sedimentation into the lake.
Review of the Water Resource Program’s water quality data from 2014-2015 (see Appendix D)
indicates that the program’s remediation efforts have been relatively successful in reducing
pollutant loading from the west-end casino pond (CPU01) to Lake Superior (LS02). These sites
are however, are still impacted by NPS pollution. Data shows that nitrogen and phosphorus
levels are generally lower at the LS02 site than those in the retention pond, however both sites
continually exceed criteria. Chloride levels at both sites are also persistent and appear to have
been greatly elevated in the fall of 2015 at the LS02 site. This elevation in chloride at the LS02
site is likely due to the riprap installation that occurred in October 2015 which left the casino
pond and Highway 13 outfall drainage area void of plants. Total suspended solids appear to be
declining at both sites.
Aquatic macroinvertebrates are not sampled at this site because the Water Resources Program
conducts biological sampling under a stream sampling QAPP and sampling procedures are
different for lakes/ponds. In addition, sampling is not conducted in man-made waterbodies.
Legendary Waters Casino Pond & Outfall #2 (CPU02, LS03)
This retention pond and its outfall are located east of the Legendary Waters Casino. Major land
cover changes occurred in 2010 when this area was cleared for the development of the casino
and resort. Large amounts of stormwater runoff from the parking lot and roof are channeled into
the retention pond for settling before entering Lake Superior. The water quality in this pond may
also be influenced by the nearby campground. Remediation efforts to reduce nutrient loadings to
Lake Superior from the east-end casino pond (CPU02) occurred in 2014. To assess the success of
19
the casino pond remediation project, the Water Resource’s Program monitored the water quality
in both the pond and at the Lake Superior outfall during the 2014 and 2015 sampling seasons.
Review of the Water Resource Program’s water quality data from 2014-2015 (see Appendix D)
indicates that the program’s remediation efforts have been relatively successful in reducing
pollutant loading from the east-end casino pond (CPU02) to Lake Superior (LS03). Data show
that total nitrogen, phosphorus, suspended solids, and chloride levels are continually lower at the
LS03 sample site than the upland CPU02 casino pond site. However, total nitrogen and
phosphorus levels continue to exceed or remain just below criteria at both sample sites, which is
likely due to the casino’s turf management practices.
Aquatic macroinvertebrates are not sampled at this site because the Water Resources Program
conducts biological sampling under a stream sampling QAPP and sampling procedures are
different for lakes/ponds. In addition, sampling is not conducted in man-made waterbodies.
Raspberry River (RR01, RR03, RRM01)
The Raspberry River is the second largest river system that passes through the Reservation. Over
a hundred small seasonal drainages channel water into the seven mile main stem of the
Raspberry; this wide drainage area on the heavy clay plain soils, along with forestry practices,
contributes to regular occurrences of flash flooding which results in much of the upper stream
channel filling in and becoming cluttered with debris.
The majority of the off-Reservation land ownership within the watershed consists of Bayfield
County forest lands, privately managed forest cropland, and private ownership. The watershed
land ownership within the Reservation boundaries consists mostly of trust land and tribal
allotments, with a small amount of privately managed forest lands. Land cover within the
watershed is primarily forested, although much of the forest is subject to logging activity.
Wetlands are also a prominent land cover type within the watershed, and there are areas of
agriculture and residential development in the headwaters region. The mouth of the Raspberry
River is surrounded by trust lands and tribal allotments, while the area west of the mouth consists
of private lands. There are many road crossings throughout the watershed, including; Blueberry
Road, Little Sand Bay Road, several crossings on Old County K, and Highway 13. Raspberry
River has been treated periodically with lampricides to kill juvenile lampreys by the United
States Fish and Wildlife Service (USFWS).
The last mile of the Raspberry River is considered Class II trout waters by the WDNR and the
mouth of the river forms an extensive coastal wetland complex that the Lake Superior Binational
Program has identified as important to the integrity of the Lake Superior Ecosystem for coastal
wetlands and fish and wildlife spawning and nursery grounds. The Wisconsin Wetlands
Association (WWA) also designated this area as a “wetland gem.” These communities support
diverse populations of flora and fauna, including wild rice, and the area is of great cultural
significance to Red Cliff’s Tribal members. IRMP survey results identified the area as one of the
most culturally significant areas on the Reservation.
Four wetlands within the Raspberry River watershed were assessed as part of the Wetlands and
Waterways inventory and assessment in 2014 and 2015. Sites were located; downstream of the
Blueberry Road bridge, downstream of the Rowley Road bridge, at the river mouth and near
Emil Road. All four sites ranked exceptional for wildlife habitat, and the sites assessed near the
20
Blueberry Road bridge and Emil Road were also ranked exceptional for fish and aquatic life
habitat, shoreline protection, and flood protection. The mouth assessment site ranked exceptional
for all metrics. The site near Blueberry Road also ranked exceptional for human use, and water
quality protection. The site assessed near the Rowley Road bridge (RR03 water quality
monitoring site) received high ratings for floristic integrity, human use, fish and aquatic life
habitat, shoreline protection, flood protection, and water quality protection. A small population
of reed canary grass was noted at the Blueberry Road site, and a small population of purple
loosestrife was noted at the Emil Road site, both populations should be removed.
Review of the Water Resource Program’s water quality data from 2013-2016 (see Appendix D)
indicates that Raspberry River’s water quality has slightly worsened over the past three years.
While it appears that nitrogen and phosphorus levels are improving, this is probably due to
outliers in the 2013 sampling season, which likely resulted from a storm event. Without
considering these outliers, nitrogen and phosphorus levels have remained relatively the same.
E.coli levels have also remained seemingly constant, with two exceedances of criteria in the
2015 sampling season occurring at the Raspberry Campground boat ramp site (RR01).
Temperatures are on the incline, while corresponding dissolved oxygen levels are declining. This
is most likely due to beaver dam impoundments that have decreased stream velocity. Turbidity
results are decreasing, which may also be due to beaver dam impoundments that are trapping
sediment upstream.
Biotic index scores, shown in Appendix B and Appendix E, indicate that the stream’s ecological
status has varied. The Raspberry Campground boat ramp (RR01) sample site went from “good”
in 2009 to “fair” in 2013 and up to “very good” in 2014 as well as 2016.The Rowley Road
(RR03) sample site went from “very good” in 2013 to “poor” in 2014 and back to “good” in
2016. Aquatic macroinvertebrate samples were taken for the first time at the mouth (RRM01)
site in 2015 and it was assigned a biotic index score of “fair.”
Red Cliff Creek (RCC01, RRC03, RCCM01)
The upper portions of Red Cliff Creek have very little flow due to beaver dam impoundments.
The Red Cliff Tribal Fish Hatchery and the Northern Aquaculture Demonstration Facility pour
outflow into the creek upstream of Highway 13, potentially increasing the creek’s nutrient levels,
temperature and volume downstream. The upper portion of the Red Cliff Creek watershed
consists primarily of private lands, with some privately managed forests and Bayfield County
forest areas. Within the Reservation boundaries, the watershed is comprised primarily of trust
lands. Land cover in the watershed is mostly forested, although logging is an active concern.
There are several residential developments and home sites throughout the watershed, and
agricultural/grassland areas near the headwaters.
There are road crossings at Highway 13, Old County K, and Blueberry Road that can lead to
higher rates off runoff and pollution. The 2016 stream crossing inventory identified the culvert at
Blueberry Road as a major erosion site in need of repair. This culvert is scheduled for
replacement by the Roads Department during the field season 2017. There is also an auto salvage
yard, an old closed dump, and historic wastewater pond near the creek, of which the effects are
currently unknown. Schooner Bay Marina is located at the stream’s mouth at Red Cliff Bay,
which could be a nonpoint source of pollutants in the stream’s estuary. Another threat to the
stream’s integrity is invasive species. Red Cliff Creek has been treated periodically with
21
lampricides to kill juvenile lampreys by the USFWS, and the Tribe occasionally uses nets to
catch and behead adult lampreys during their spawning runs. In the coastal estuary, there is an
established population of Eurasian ruffe that appears to be limited to this estuary area (IRMP,
2006).
Two wetlands within the Red Cliff Creek watershed were assessed as part of the Wetlands and
Waterways inventory and assessment in 2014 and 2015. Sites were located near the Red Cliff
Fish Hatchery and downstream of the RCC03 water quality monitoring site near Blueberry Road.
The only exceptional rating in this assessment was for wildlife habitat near the Red Cliff Fish
Hatchery, the Blueberry Road site ranked high for this parameter. Both the Hatchery site and the
Blueberry Road sites ranked high for fish and aquatic life habitat. The Hatchery site also ranked
high for flood protection. Both sites were given a medium value for floristic integrity, human
use, shoreline protection, and water quality protection. Substantial amounts of hybrid cattail and
reed canary grass were identified at the Hatchery site and should be addressed.
Review of the Water Resource Program’s water quality data from 2013-2016 (see Appendix D
for graphs) indicates that Red Cliff Creek’s water quality has remained relatively the same over
the last three years. E.coli, temperature, turbidity, and phosphorus levels all appear to be constant
in the stream. Dissolved oxygen remains stable at the mouth site (RCCM01) and is increasing at
the Highway 13 site (RCC01), while it is slightly declining at the Blueberry Road site (RCC03).
The apparent decline in dissolved oxygen at the Blueberry Road site is likely due to upstream
beaver dams and stream blockage that slows the stream’s velocity and causes a slight increase in
temperature. Nitrogen levels appear to show a slight downward trend at the Blueberry Road and
Highway 13 sites, however nitrogen appears to be increasing at the mouth, which is potentially
related to septic systems and possibly the Tribe’s old wastewater retention pond.
Biotic index scores, shown in Appendix B and Appendix E, indicate that the stream’s ecological
status has slightly improved. The Highway 13 (RCC01) sample site went from “fair” in 2012 to
“good” in 2014 and the Blueberry Road (RCC03) sample site went from “good” in 2012 to “very
good” in 2014. Aquatic macroinvertebrate samples were taken at the mouth (RCCM01) site for
the first time in 2015 and it received a biotic index rating of “fair.”
Sand River (SR02, SRM01)
The Sand River watershed is the largest watershed associated with the Reservation, although
only a small portion of the watershed is located on Tribal lands. As with the neighboring
Raspberry River, Sand River is prone to extensive and extreme flash floods. Much of the in-
stream cover, woody debris, and habitat has been severely altered because of fluctuating water
levels during large precipitation events. Beavers are also common in the stream and also
influence hydrologic alterations by removing trees and creating dams. The lower portions of the
river are surrounded by northern sedge meadow and alder thicket, and the mouth of the Sand
River creates a complex of wetlands, which have been identified by the Lake Superior Binational
Program as important habitat area for coastal wetlands and rare communities. Sand Bay is also
listed as a WDNR priority wetland site of Wisconsin’s Lake Superior Basin.
One wetland within the Sand River watershed was assessed as part of the Wetlands and
Waterways inventory and assessment in 2014 and 2015. The Sand River mouth ranked
22
exceptional for; floristic integrity, human use, wildlife habitat, fish and aquatic life habitat,
shoreline protection, flood protection, and water quality protection.
The majority of the land ownership within the watershed, lying outside reservation boundaries,
consists of Bayfield County forest lands, with some privately managed forest lands and private
ownership. The watershed land ownership within the Reservation boundaries consists mostly of
trust land and tribal allotments, with some privately managed forest lands, Bayfield County
forest lands, and National Park Service lands. The forests in this watershed are highly subjected
to logging activities, and there are several large agricultural/grassland areas near the headwaters.
Development in this watershed is limited to a handful of residential homes. Sand River has
several road crossings that contribute to increased run off at Highway 13, Happy Hollow Road,
Star Route Road, and Sand Pit Road. These road crossings were not assessed during the 2016
stream crossing inventory since they are located outside of reservation boundaries.
The invasive fish Eurasian ruffe is present in the estuary area of the river but does not occur
upstream. Sand River has been treated periodically with lampricides to kill juvenile lampreys by
the USFWS.
Review of data from 2013-2016 indicates that Sand River is somewhat impacted by NPS
pollution, but the stream’s water quality remains relatively stable. While E.coli is continually
present in the stream, only one exceedance of criteria occurred in the past three years. Turbidity
levels remain approximately the same at the mouth site (SRM01) and appear to be declining at
the Highway 13 site (SR02), which is potentially due to upstream blockages in the channel.
Phosphorus and nitrogen levels are also declining at the Highway 13 site, which is also likely
due to upstream blockages. Nitrogen and phosphorus levels appear to be remaining relatively
constant at the mouth site; these inputs are likely due to logging activities occurring in the
watershed. Temperatures at both sites have remained stable and dissolved oxygen appears to be
improving at the Highway 13 site. Dissolved oxygen is continuously low at the mouth site,
which can be correlated to the estuary complex that holds a high amount of aquatic plants that
are cycling through growth and anaerobic decay.
Biotic index scores, shown in Appendix B and Appendix E, indicate that the stream’s ecological
status has varied over the past three years, but remains relatively good. Scores at the Highway 13
site (SR02) have ranged from “excellent” in 2009, to “fair” in 2013, back to “good” in 2014, and
up to “very good” in 2016. The mouth sample site (SRM01) was sampled for macroinvertebrates
for the first time in 2015 and it received a biotic index score of “fair.”
Sucker Creek (SC01, SCM02)
Sucker Creek is a small spring fed stream that originates near Old County K and flows for just
over a mile before emptying into Sand Bay, east of the Sand River estuary. Sucker Creek has a
road crossing at Old County Highway K, and there are several crossings at the end of Ridge
Road that are washed out- this section of Ridge Road is inactive. Fish spawning in the stream is
limited and at risk due to heavy sedimentation at the mouth and very low amounts of flow. The
extreme headwaters of the stream (off reservation) are surrounded by clear-cut agricultural areas
that are primarily used for animal grazing. A man-made pond has also been constructed in the
stream at this location and is surrounded by mown lawn, disturbing the stream’s natural flow
patterns and allowing greater amounts of runoff into the waterbody. The only development
within this watershed includes a few homes near the agricultural areas of the headwaters.
23
One wetland within the Sucker Creek watershed was assessed as part of the Wetlands and
Waterways inventory and assessment in 2014 and 2015. The site received a medium value for;
floristic integrity, human use, wildlife habitat, fish and aquatic life habitat, shoreline protection,
flood protection, and water quality protection. A small population of reed canary grass was noted
and should be removed.
Review of data from 2013-2016 indicates that Sucker Creek is impacted by NPS pollution and
the stream’s water quality is continuing to degrade. This is an intermittent stream and the channel
is often dry at the Old County K sample site (SC01), thus samples are not able to be taken as
regularly as they are on other streams. Although turbidity appears to be stable or declining at
both sample sites, nitrogen and phosphorus levels are persistent at the mouth site (SCM01) and
are increasing at the Old County K sample site. E. coli levels did not breach criteria in the 2015
sample season, but also appear to be persistent in the stream. Temperatures are increasing at both
sites, with dissolved oxygen remaining consistently low at both sites and often breaching criteria-
although dissolved oxygen was not measured at the Old County K site during the 2015 sampling
season.
Biotic index scores, shown in Appendix B and Appendix E, indicate that the stream’s ecological
status is very poor. The Old County K site (SC01) has never been sampled for aquatic
macroinvertebrates due to its intermittency. The first sample ever taken at the mouth site
(SCM01) occurred in 2014 and there weren’t enough macroinvertebrates present to assign a
score, thus yielding a score of “NA,” and the site received a score of “poor” in 2016.
24
Table 5 – NPS Assessment Summary
Waterbody Name &
Stream Length* (On-reservation - main stem)
NPS Pollutant(s) Use(s) Impaired Use(s)
Threatened Potential Source
Future
Potential
Source
Threats
Severity
Chicago Creek
1.75 miles
- Sediment
- Nitrogen
- Phosphorus
- E.coli
- Contact; fishing,
swimming, cultural
uses
-Aquatic life
-
- Possible outdated septic systems
- Development
- Roads
- Historic hydromodification
- Forestry Impacted
Frog Creek
~ 1.25 miles
- Sediment
- Nitrogen
- Phosphorus
-Aquatic life - Contact; fishing,
swimming, cultural uses
- Possible outdated septic systems
- Forestry
- Sandbar causing trapping of nutrients
- Roads
- Development Slightly
Impacted
Lake Superior
(Casino Marina & Beach) -Nitrogen -
- Contact; fishing,
swimming, cultural uses
-Aquatic life
- Casino turf management practices
- Development
- Roads/parking lot runoff
- Historic hydromodification
- Impacted
Casino Pond & Outfall #1
-Nitrogen
-Phosphorus
-Chloride
-
- Contact; fishing,
swimming, cultural uses
-Aquatic life
- Casino turf management practices
- Development
- Roads/parking lot runoff
- Historic hydromodification
- Impacted
Casino Pond & Outfall #2 -Nitrogen
-Phosphorus -
- Contact; fishing,
swimming, cultural uses
-Aquatic life
- Casino turf management practices
- Development
- Roads/parking lot runoff
- Historic hydromodification
- Impacted
Raspberry River
~ 2.25 miles
- Sediment
- Nitrogen
- Phosphorus
- E.coli
- Contact; fishing,
swimming, cultural
uses
-Aquatic life
-
- Forestry
- Agriculture
- Historic outhouses at the Raspberry Campground
- Development
- Roads
- Beaver activity
- Historic hydromodification
- Impacted
Red Cliff Creek
~ 3 miles
- Sediment
- Nitrogen
- Phosphorus
-E.coli
- Contact; fishing,
swimming, cultural
uses
-Aquatic life
-
- Forestry
- Agriculture
- Possible outdated septic systems
- Historic wastewater treatment pond
- Development
- Roads
- Beaver activity
- Historic hydromodification
- Impacted
Sand River
~ 2.1 miles
- Sediment
- Nitrogen
- Phosphorus
-Aquatic life - Contact; fishing,
swimming, cultural uses
- Upstream forestry and agricultural practices
- Development
- Roads
- Impacted
25
- Beaver activity
- Historic hydromodification
Sucker Creek
~ 1.45 miles
- Sediment
- Nitrogen
- Phosphorus
-E.coli
- Contact; fishing,
swimming, cultural
uses
-Aquatic life
-
- Agriculture
- Roads
- Historic hydromodification
- Development
- Forestry Impacted
*On-reservation main stem stream lengths are estimated using Google Earth Pro
It is important to note that while the many additional unnamed and intermittent streams of the Reservation have not been sampled, they are prone to
similar nonpoint source impacts such as those identified in Table 5.

26
Selection of Best Management Practices (BMPs) Best management practices will be selected for identified areas of the Reservation and watershed
based on the determined cause and nonpoint source pollutants, land owners involved, and known
recommendations for the Lake Superior clay plain region. These BMPs can be found in the Red
Cliff Tribal Nonpoint Source Pollution Management Plan. Implementation of BMPs will be
accomplished through a variety of NPS programs, funding sources, and education and outreach
efforts by the Tribe. To implement BMPs, the Tribe may work in collaboration with a variety of
agencies, which may include but is not limited to;
Bureau of Indian Affairs
US Environmental Protection Agency
Indian Health Services
Natural Resources Conservation Service
Bayfield Regional Conservancy
Wisconsin Department of Natural Resources
ABDI-LCD (Ashland, Bayfield, Douglas and Iron County Land and Water Conservation
Department)
Apostle Islands National Park Service
US Fish and Wildlife Service
The Tribe’s Water Resources Program will also collaborate with all of Red Cliff’s
intergovernmental divisions when appropriate to ensure that BMPs are being utilized where
possible within the Tribal government’s projects. Collaboration will be most important amongst
the Treaty Natural Resources Division, Roads Department, Water and Sewer Department, and
the Red Cliff Housing Authority.
Summary of Water Quality Assessment
Overall the water quality of the Red Cliff Reservation is high. Some areas of the Reservation are
negatively impacted by excess sediment and nutrients and human or animal waste as indicated by
E.coli concentrations. The sources of these impacts are considered to be land uses such as
outdated septic systems, outhouses, small amounts of agriculture, logging practices and possibly
aquaculture discharges. This rural area is largely forested and the soils are highly susceptible to
erosion. Due to the highly erodible soils, sedimentation is a major concern across the region.
Some NPS inputs are likely the result of upstream land use management in forestry and roads.
Process for Selecting BMPs
The process for BMP selection will include cooperation with other stakeholders in the watershed,
as well as coordination with the Tribe’s Treaty Natural Resources Division. Landowners will be
contacted as necessary to implement BMPs. Selection of BMPs will depend on the nonpoint
source issue being targeted at any particular site, and those that correlate with existing programs
by other stakeholders will be considered.
27
Existing Nonpoint Source Control Programs (BMPs)
The Water Resources Program aims to coordinate BMPs within the Reservation and Tribal
Divisions/Departments, and continually collaborate with other agencies within the Bayfield
Peninsula. The NPS Assessment Report and Management Plan shall serve as the guide to
implementing BMPs and remediation projects.
Water Resources Program
In addition to implementing the septic system inventory in 2009 and the Legendary Waters
Casino retention pond remediation project in 2014, the Water Resources Program also installed
native buffer strip plantings, a rain garden, and a dune at the Legendary Waters Casino in 2016.
The Water Resources Program also installed and regularly monitors dog waste stations at several
recreational areas within the Reservation in 2014. Currently, there are dog waste disposal
stations (informational stands with trash bags and a closed top trash can) at the Casino’s Buffalo
Bay and Point Detour Campgrounds, as well as the Raspberry Bay Campground. Additional
recreational areas such as the Frog Bay National Park will be considered for dog waste stations
as needed. The Water Resources Program also conducts regular outreach and education efforts
within the community to encourage local stakeholders to take care of their watersheds.
Reservation Forestry
The Red Cliff Tribe has a Forestry Department that is housed within the Treaty Natural
Resources Division. A Forestry Management Plan was previously drafted by the BIA and
Environmental Department, but was never approved by the Tribal Council. Therefore, the
Tribe’s IRMP section on Forest Resources currently serves as the Tribe’s Forestry Management
Plan. The Bureau of Indian Affairs handles sales of timber while working closely with the
Tribe’s Forestry Department to select areas for timber harvest or other potential management
activities such as prescribed burning and/or forest inventories. When issuing a logging permit,
the Forestry & Wildlife Program sets permit conditions that include forestry BMPs.
Tribal Roads
The Roads Department does not currently have an adopted list of nonpoint source BMPs but is
currently working to incorporate them into a long term transportation plan. The Tribe currently
relies on engineers to include stormwater management in road designs. As the Roads Department
proceeds with the drafting of a transportation plan, the Water Resources Program will assist in
ensuring that appropriate BMPs are included.
Septic Inventory
The Tribe’s septic system inventory was completed in 2009. Many septic systems were found to
be in poor condition and several were replaced by the expansion of the water main and sewer
service, with another 18 residential septic systems being repaired or replaced. A contained
outhouse system at the Raspberry Campground was also installed.
This project assisted in the Tribe in protecting its groundwater and surface water resources.
Red Cliff Housing Authority
The Housing Authority currently does not have best management practices in place for
construction. The director has been approached and is interested in learning more about
nonpoint source pollution and BMPs.

28
Bayfield County Land and Water Conservation Department
The Bayfield Land and Water Conservation Department provides technical and financial
assistance to landowners for installation of conservation practices that reduce sediments and
nutrients in waterways while improving habitat.
Bayfield Regional Conservancy
The Bayfield Regional Conservancy is a non-profit land trust operating in Bayfield, Ashland,
Douglas and Sawyer Counties in Wisconsin. The Conservancy works with private landowners,
agencies and local governments to protect natural areas and landscapes in northwestern
Wisconsin. The Bayfield Regional conservancy was a significant partner in securing and
protecting the lands of Frog Bay Tribal National Park.
National Park Service
The Apostle Islands National Park Service does not currently have specific nonpoint source
management plans in place.
Wisconsin Department of Natural Resources
The WDNR developed Water Quality Management Plans (Basin Plans) for each of the major
watersheds in the state in 2000 -2001, including the Lake Superior watershed. The Basin Plans
identify and prioritize issues and identify goals and objectives for ecosystem management in
each Basin. In 2003, the WNDR, in conjunction with the LCD, also developed “Best
Management Practice Guidelines for the Wisconsin Portion of the Lake Superior Basin.” This
document includes guidelines and BMPs for project planning, roads, forestry, agriculture, critical
areas, habitat, and development.
Nonpoint Source Control Core Participants
Before submittal to the EPA, there will be an internal tribal governmental review of the NPS
Assessment Report and Management Plan amongst the Treaty Natural Resources Division (Fish
Hatchery Department, Fishery Department, Environmental Department, Natural Resources
Department, and Conservation Wardens). Before implementation, the Red Cliff Legal
Department will also be asked to review these documents.
During the initial development of Red Cliff’s NPS program, the Tribal Planner, Tribal Zoning
Administrator, Roads Department and the Housing Authority were key participants in building
Red Cliff’s capacity for nonpoint source pollution prevention. These Tribal Departments remain
involved in protecting Tribal waters from nonpoint sources of pollution on an as needed basis
through an open path of communication, through the PAC (project and compliance) process, and
collaborative community planning efforts.
Public Participation
The Nonpoint Source Assessment Report and Management Plan will be made available to the
community for review and comments during a 30-day comment period from September 25th
through October 25th
2017. Paper copies will be available at the Tribal Administrative Offices
29
and Library, electronic copies will be made available on the Tribal website, information will be
given on the Tribal television channel, in the Tribal government-wide weekly email newsletter,
and on the Tribe’s Facebook page. A log of all comments will be maintained at the Red Cliff
Environmental Dept. office along with responses to comments.
To solicit feedback on the original Nonpoint Source Pollution Assessment Report, contact was
made with the Bayfield Regional Conservancy, Bayfield County and municipalities, as well as
the National Park Service and Wisconsin Department of Natural Resources. These stakeholders
were asked for input during the development of the Nonpoint Source Management Plan. These
same stakeholders will also be contacted during the public comment period and asked to provide
feedback as the Nonpoint Source Assessment Report and Management Plan are updated to
reflect current conditions.
Modifications to the Assessment Report and Management Plan will be made to accommodate
concerns raised during the comment period. The documents will then be presented to Tribal
Council for their review and approval in November or December 2017.
Conclusions Data show that streams on the Reservation are negatively impacted by land use activities that
increase erosion in the highly erodible sand/clay soils. These activities may include forestry,
agriculture, beaver activity, roads, development, and use of old septic systems and campground
outhouses. The Tribe is continually working to prevent and correct nonpoint source problems on
the Reservation. The Water Resource Program’s long-term goal for its NPS Pollution (CWA
319) Program is to develop and implement a watershed management plan. Improved interagency
cooperation and outreach to other entities, as well as additional funding and technical assistance
will be necessary to significantly address these issues.
This assessment shows that nonpoint source pollution categories are responsible for a significant
portion of the impacted and threatened waters of the Reservation; failing septic systems and
outhouses, hydromodification (historic cut-over, stream crossings, beaver dams, and stream
blockages) and logging all add to the problem. Best management practices (BMPs) will be
elaborated in the Nonpoint Source Management Plan. Some possible BMPs to be implemented
through tribal management plans and/or tribal codes include:
1. BMPs for proper installation and maintenance of roads and stream crossings (culverts and
bridges).
2. BMPs for forestry practices, especially pertaining to logging roads and stream buffers.
3. Stormwater plans for future development that include both construction and long term
BMPs.
There are many available resources that outline BMPs for nonpoint source pollution prevention
and remediation, some may include but are not limited to:
1. Controlling Nonpoint Source Runoff Pollution from Roads, Highways, and Bridges,
EPA-841-F-95-008a
2. EPA Tribal Green Building Toolkit, EPA-909-R-15-003
3. Managing Nonpoint Source Pollution from Agriculture, EPA-841-F-96-004F

30
4. Managing Nonpoint Source Pollution from Forestry EPA841-F-96-004H
5. Management Measure for Physical and Chemical Characteristics of Surface Waters – II.
Channelization and Channel Modification Management Measures, EPA
6. NRCS CAP 106- Forest Management Plans, and technical service providers
7. NRCS Conservation Practice Standard Codes
8. Protecting Water Quality from Urban Runoff, EPA-841-F-03-003
9. Protecting Natural Wetlands, EPA-843-B-96-001
10. Red Cliff Code of Law Chapters 11, 12, and 37.
11. Streambank and Shoreline Protection Management for Hydromodification EPA 840-B-
92-002
12. Temporary Stream and Wetland Crossing Options for Forest Management, USDA Forest
Service General Technical Report NC-202 1998
13. Wisconsin’s Forestry Best Management Practices for Water Quality Field Manual,
WDNR
31
Acronym List ABDI-LCD – Ashland, Bayfield, Douglas and Iron County Land and Water Conservation Department
APIS NPS- Apostle Islands National Park Service
BIA- Bureau of Indian Affairs
BMPs – Best Management Practices
BRC- Bayfield Regional Conservancy
CBAP- Chequamegon Bay Area Partnership
CC02 – Chicago Creek sample site #2
CC03 – Chicago Creek sample site #3
CCM01 – Chicago Creek Mouth sample site #1
CFS – Cubic Foot per Second
CFU – Colony Forming Units
CPU01 – LW Casino Pond sample site #1
CPU02 – LW Casino Pond sample site #2
CREP – Conservation Reserve Enhancement Program
CWA – Clean Water Act
EPA – United States Environmental Protection Agency
FC01 – Frog Creek sample site #1
FCM01 – Frog Creek Mouth sample site #1
FWS- Fish and Wildlife Service
GLIFWC – Great Lakes Indian Fish and Wildlife Commission
GLNPO – Great Lakes National Program Office
HUC- Hydrologic Unit Code
IHS- Indian Health Services
IRMP – Integrated Resource Management Plan
LCD – Land Conservation Department
LS01 – Lake Superior sample site #1 (LW Casino Marina & Boat Ramp)
LS02 – Lake Superior sample site #2 (LW Casino Pond Outfall)
LS03 – Lake Superior sample site #3 (LW Casino Pond Outfall)
LW- Legendary Waters
NPS – Nonpoint Source
NRCS- Natural Resources Conservation Service
QAPP- Quality Assurance Project Plan
RCC01 - Red Cliff Creek sample site #1
RCC03 - Red Cliff Creek sample site #3
RCCM01 - Red Cliff Creek Mouth sample site #1
RR01 – Raspberry River sample site #1
RR03 - Raspberry River sample site #3
RRM01 - Raspberry River Mouth sample site #1
SC01 – Sucker Creek sample site #1
SC02 – Sucker Creek sample site #2
SR01 – Sand River sample site #1
SRM01 – Sand River Mouth sample site #1
TSS- Total Suspended Solids
USDA- United States Department of Agriculture
USGS- United States Geological Survey
WDNR – Wisconsin Department of Natural Resources
WISCAP – Wisconsin Community Action Program
WQ – Water Quality
32
References Ashland, Bayfield, Douglas & Iron County Land Conservation Committees and Wisconsin
Department of Natural Resources. Best Management Practice Guidelines for the
Wisconsin Portion of the Lake Superior Basin. 2003.
Bayfield County MapViewer, http://www.bayfieldcounty.org
Bayfield Regional Conservancy, Strategic Conservation Plan for Lake Superior’s Bayfield
Peninsula. 2009.
Epstein E., W. Smith, and E. Judziewicz. Wisconsin Lake Superior Coastal Wetlands
Evaluation. Wisconsin Department of Natural Resources – Bureau of Endangered
Resources, Madison, WI. 1997.
Great Lakes Commission, Keeping it on the Land! Improving Great Lakes Water Quality by
Controlling Soil Erosion and Sedimentation.
Great Lakes Indian Fish and Wildlife Commission, Map to Help You Find Safe Walleye in
Lakes Harvested by Red Cliff.
http://www.glifwc.org/Biology/inlandfish/mercury/mercury.htm.
Hudson, Matt, Great Lakes Indian Fish and Wildlife Commission. Tribal Assessment of PBT
Contaminant Concentrations Across Size Ranges of Four Commonly Harvested Lake
Superior Fish, as presented at the Making a Great Lake Superior Conference, Duluth,
Minnesota. November 2007.
Institute of Water Research. High Impact Targeting (HIT), A tool for optimizing sedimentation
reduction efforts in the Great Lakes Basin. http://www.iwr.msu.edu/hit2/huc_search.asp
Lake Superior Binational Program, A Biodiversity Conservation Strategy for Lake Superior - A
Guide to Conserving and Restoring the Health of the World’s Largest Freshwater Lake
and the Nemadji to Fish Creek Regional Unit Plan. 2015.
http://www.natureconservancy.ca/assets/documents/on/lake-superior/A-Biodiversity-
Conservation-Strategy-for-Lake-Superior.pdf
Liu, Jia et al. Water. Review and Research Needs of Bioretention Used for the Treatment of
Urban Stormwater. January 2014.
Natural Resource Conservation Service website for Technical Guidances,
http://efotg.nrcs.usda.gov.
Nonpoint Source Management and the Watershed Approach Participants Manual, Grand
Portage, Minnesota. 2007.
Red Cliff Band of Lake Superior Chippewa, Codes and Ordinances.
Red Cliff Band of Lake Superior Chippewa, Integrated Resource Management Plan 2006-2016,
2006.
33
Red Cliff Band of Lake Superior Chippewa, Storm Water Protection Plan. 2008.
Red Cliff Band of Lake Superior Chippewa, Source Water Protection Plan. 2009.
Red Cliff Band of Lake Superior Chippewa, Tribal Nonpoint Source Assessment Report. 2008.
Red Cliff Band of Lake Superior Chippewa, 2013-2015 Water Quality Assessment Report,
2017.
Red Cliff Band of Lake Superior Chippewa, 2016 Water Quality Assessment Report, 2017.
Superior Watershed Partnership, UW Extension, Lake Superior Watershed Rural Property
Guide, Ashland, Bayfield, Douglas, Iron Counties, Wisconsin.
United States Environmental Protection Agency, Controlling Nonpoint Source Runoff Pollution
from Roads, Highways and Bridges. EPA841-F-95-008a
United States Environmental Protection Agency, EPA Tribal Green Building Toolkit. EPA-909-
R-15-003. 2015. http://www3.epa.gov/region9/tribal/pdf/tribal-green-building-toolkit-
mobile-2015.pdf
United States Environmental Protection Agency, Guidance Specifying Management Measures
for Sources of Nonpoint Pollution in Coastal Waters. EPA840-B-92-002
United States Environmental Protection Agency, Handbook for Developing and Managing Tribal
Nonpoint Source Pollution Programs Under Section 319 of the Clean Water Act.
http://www.epa.gov/owow/nps/tribes/index.htm
United States Environmental Protection Agency, Management Measure for Physical and
Chemical Characteristics of Surface Waters- II. Channelization and Channel
Modification Management Measures.
http://www.epa.gov/owow/nps/MMGI/Chapter6/ch6-2a.html
United States Environmental Protection Agency, Managing Nonpoint Source Pollution from
Boating and Marinas. EPA841-F-96-004I
United States Environmental Protection Agency, Managing Nonpoint Source Pollution from
Agriculture. EPA841-F-96-004F
United States Environmental Protection Agency, Managing Nonpoint Source Pollution from
Forestry. EPA841-F-96-004H
United States Environmental Protection Agency, Protecting Water Quality from Urban Runoff.
EPA841-F-03-003
United States Environmental Protection Agency, Soil Constraints and Low Impact Development,
Careful Planning Helps LID Work in Clay Soils. EPA841-R-14-004A

34
United States Forest Service, Temporary Stream and Wetland Crossing Options for Forest
Management. General Technical Report NC-202. 1998.
United States Geological Survey, National Hydrography Dataset (NHD).
https://viewer.nationalmap.gov/basic/
United States Geological Survey, Simulation of the groundwater-flow system of the
Bayfield Peninsula focusing on the Red Cliff Reservation, Bayfield County,
Wisconsin – DRAFT, 2015.
ftp://ftpext.usgs.gov/pub/er/wi/middleton/dunning/Red_Cliff_SIR_Draft4.pdf
Wetlands and Waterways, LLC, Wetland Inventory and Assessment Report, Red Cliff Band of
Lake Superior Chippewa. February 8, 2016.
Wisconsin Department of Natural Resources, 24K Hydro Geodatabase. July 2015.
ftp://dnrftp01.wi.gov/geodata/hydro_24k/
Wisconsin Department of Natural Resources, Ecological Landscapes of Wisconsin, Chapter 21 -
Superior Coastal Plain Ecological Landscape. Last updated 2012.
http://dnr.wi.gov/topic/landscapes/index.asp?mode=detail&Landscape=15
Wisconsin Department of Natural Resources, Lake Superior Basin Plan, Bayfield Peninsula
Southeast Watershed (LS07).
http://www.dnr.state.wi.us/org/gmu/superior/BasinPlan/ws07.html.
Wisconsin Department of Natural Resources, Lake Superior Basin Regional Assessment and
Report Compendium. 2010.
http://blogs.ces.uwex.edu/oppedahl/files/2012/07/Lake_Superior_Regional_Asses
sment_and_Report_Compendium.pdf
Wisconsin Department of Natural Resources, Managing Woodlands on Lake Superior’s Red
Clay Plain, Slowing the Flow of Runoff. PUB-FR-385 2007.
Wisconsin Department of Natural Resources, Surface Water Data Viewer.
http://dnrmaps.wi.gov/SL/Viewer.html?Viewer=SWDV&runWorkflow=Wetland
Wisconsin Department of Natural Resources, Wiscland 2.0. August 2016.
http://dnr.wi.gov/maps/gis/datalandcover.html
Wisconsin Department of Natural Resources. Wisconsin’s Forestry Best Management
Practices for Water Quality. Publication number FR-093. 2010.
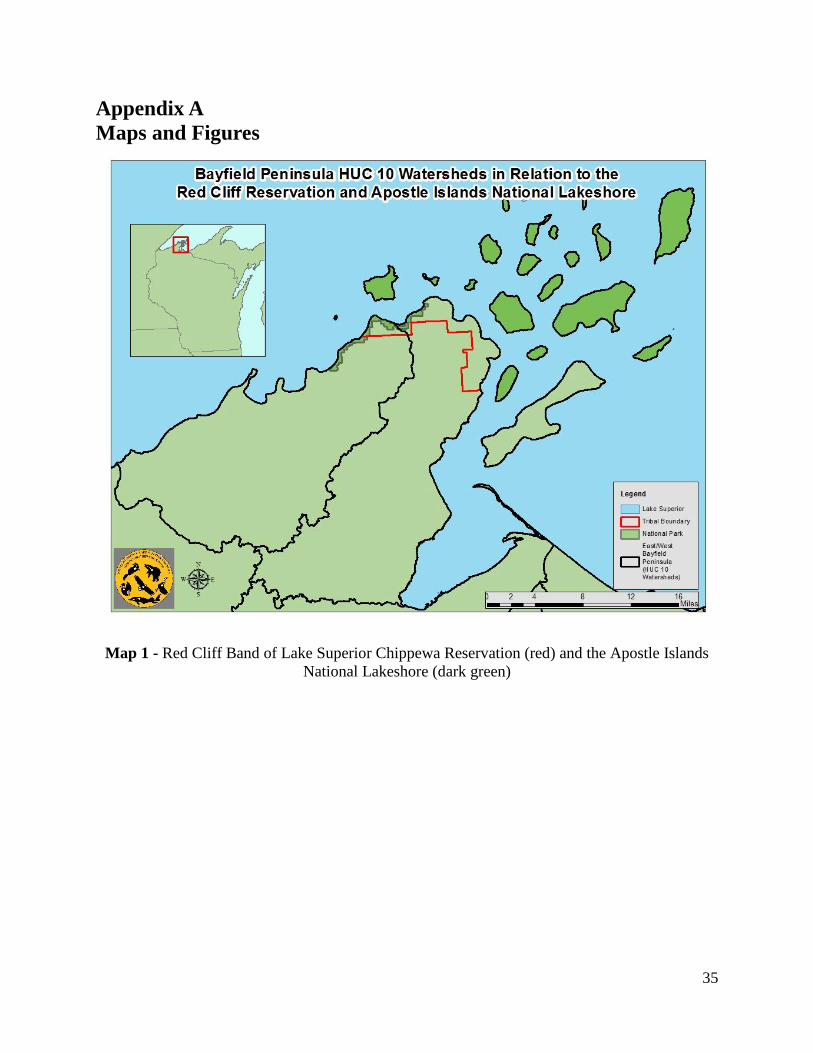
35
Appendix A
Maps and Figures
Map 1 - Red Cliff Band of Lake Superior Chippewa Reservation (red) and the Apostle Islands
National Lakeshore (dark green)

36
Map 2 - The Beartrap-Nemadji Lake Superior regional unit Source: A Biodiversity Conservation
Strategy for Lake Superior- A Guide to Conserving and Restoring the Health of
the World’s Largest Freshwater Lake and the Nemadji to Fish Creek Regional Unit Plan. Lake Superior Binational
Program. 2015.
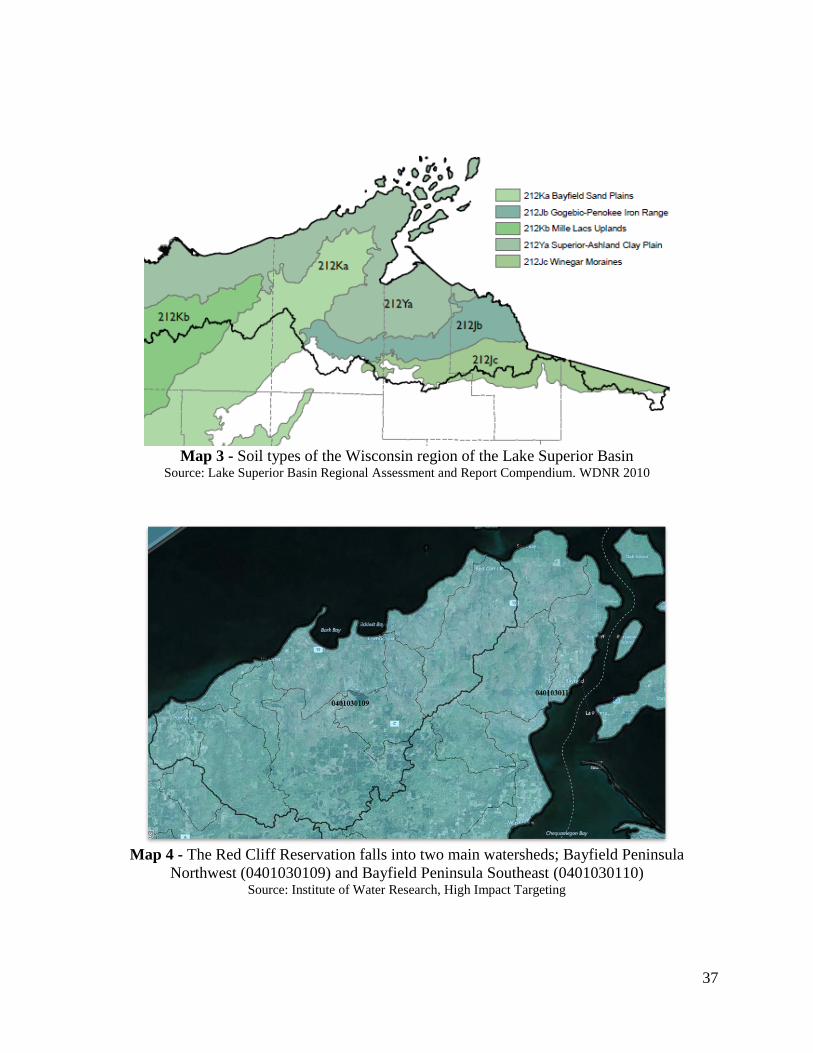
37
Map 3 - Soil types of the Wisconsin region of the Lake Superior Basin Source: Lake Superior Basin Regional Assessment and Report Compendium. WDNR 2010
Map 4 - The Red Cliff Reservation falls into two main watersheds; Bayfield Peninsula
Northwest (0401030109) and Bayfield Peninsula Southeast (0401030110) Source: Institute of Water Research, High Impact Targeting
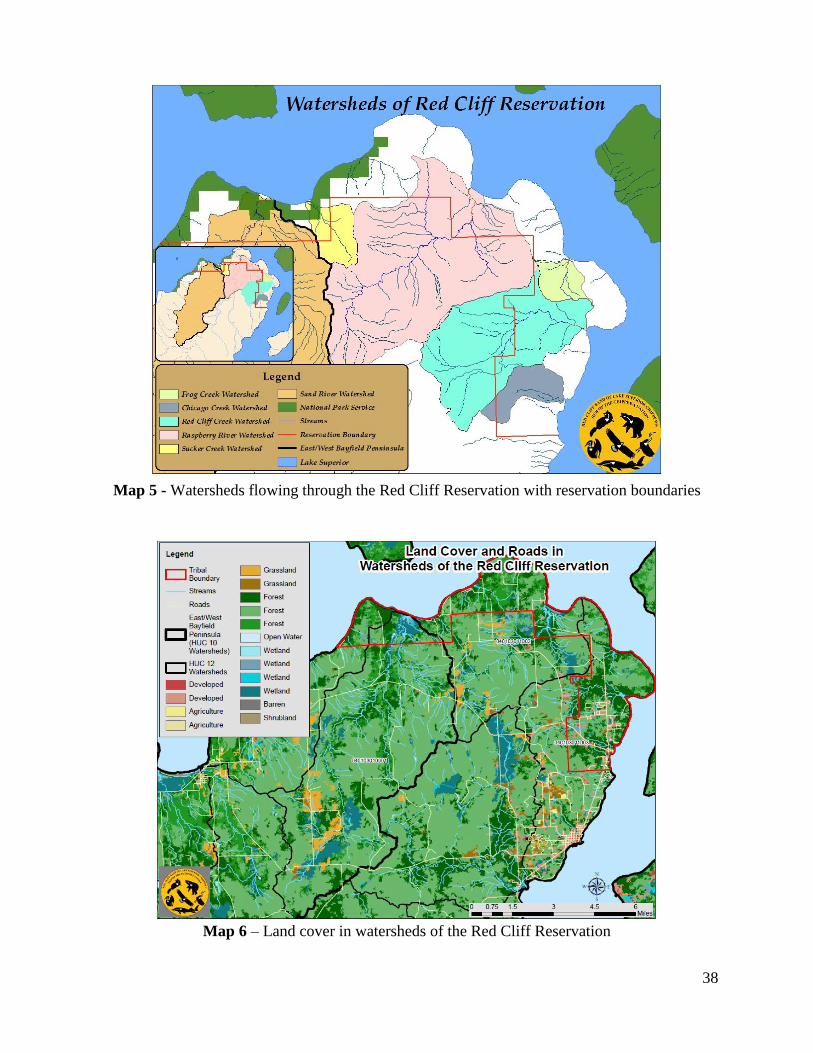
38
Map 5 - Watersheds flowing through the Red Cliff Reservation with reservation boundaries
Map 6 – Land cover in watersheds of the Red Cliff Reservation
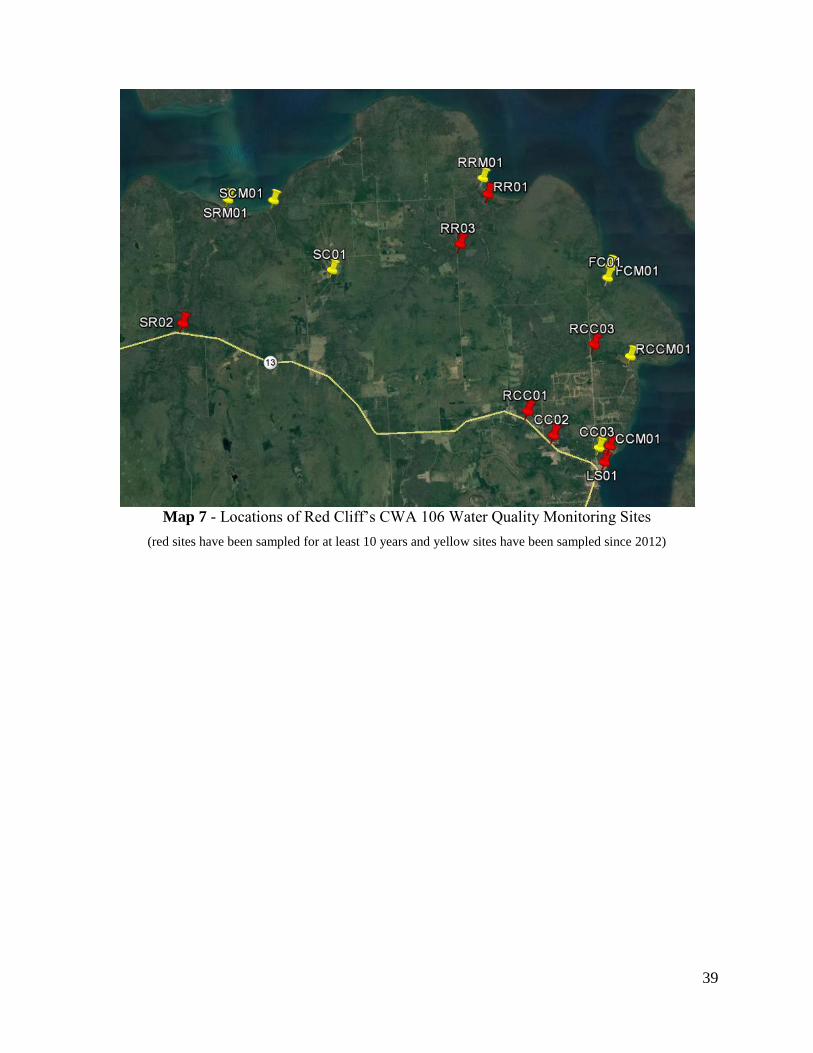
39
Map 7 - Locations of Red Cliff’s CWA 106 Water Quality Monitoring Sites
(red sites have been sampled for at least 10 years and yellow sites have been sampled since 2012)
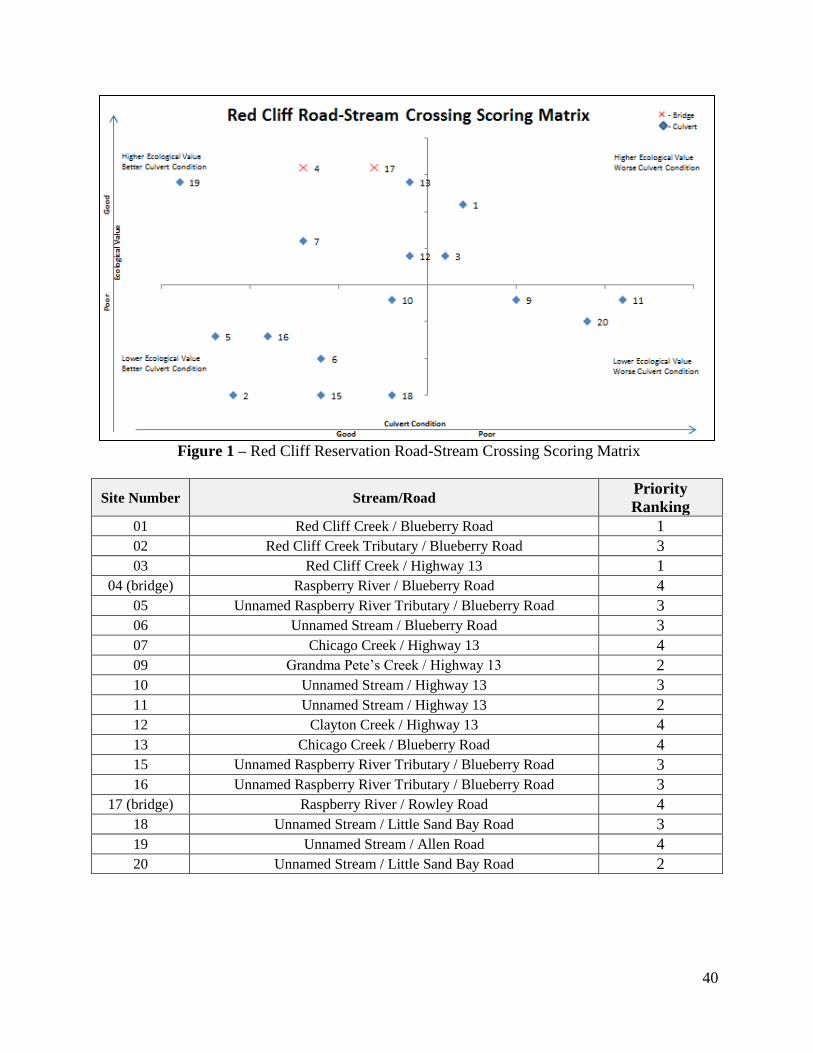
40
Figure 1 – Red Cliff Reservation Road-Stream Crossing Scoring Matrix
Site Number Stream/Road Priority
Ranking
01 Red Cliff Creek / Blueberry Road 1
02 Red Cliff Creek Tributary / Blueberry Road 3
03 Red Cliff Creek / Highway 13 1
04 (bridge) Raspberry River / Blueberry Road 4
05 Unnamed Raspberry River Tributary / Blueberry Road 3
06 Unnamed Stream / Blueberry Road 3
07 Chicago Creek / Highway 13 4
09 Grandma Pete’s Creek / Highway 13 2
10 Unnamed Stream / Highway 13 3
11 Unnamed Stream / Highway 13 2
12 Clayton Creek / Highway 13 4
13 Chicago Creek / Blueberry Road 4
15 Unnamed Raspberry River Tributary / Blueberry Road 3
16 Unnamed Raspberry River Tributary / Blueberry Road 3
17 (bridge) Raspberry River / Rowley Road 4
18 Unnamed Stream / Little Sand Bay Road 3
19 Unnamed Stream / Allen Road 4
20 Unnamed Stream / Little Sand Bay Road 2
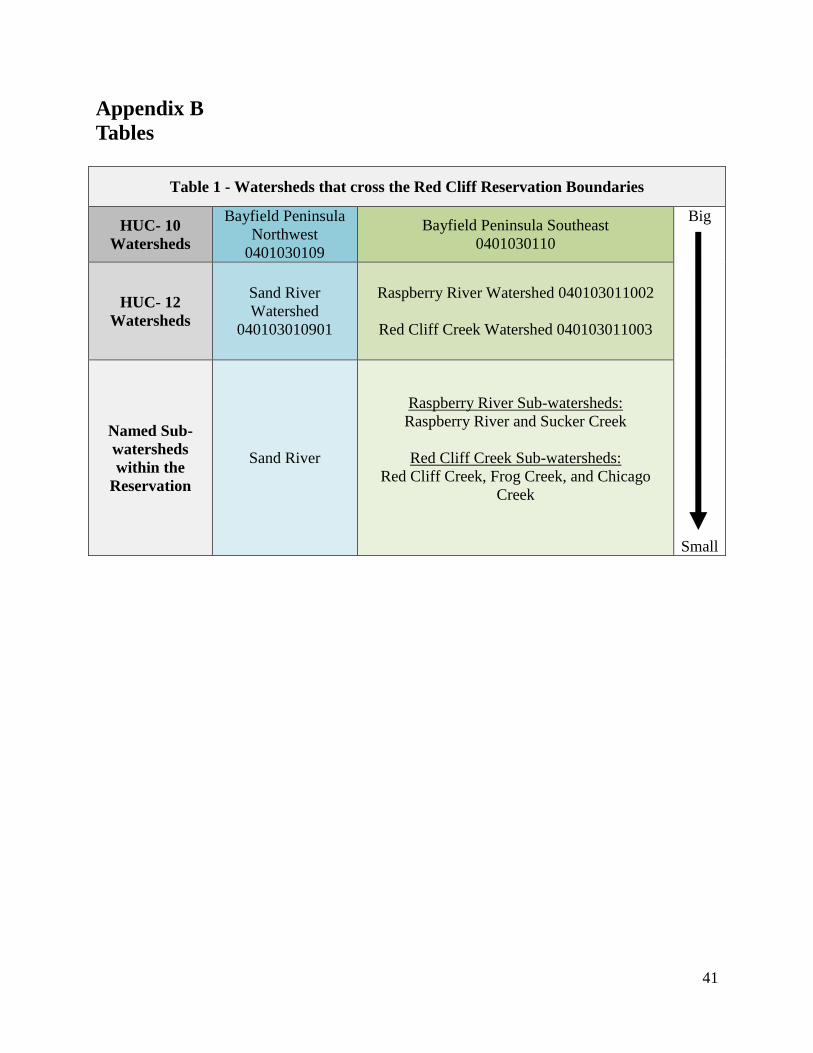
41
Appendix B
Tables
Table 1 - Watersheds that cross the Red Cliff Reservation Boundaries
HUC- 10
Watersheds
Bayfield Peninsula
Northwest
0401030109
Bayfield Peninsula Southeast
0401030110
Big
Small
HUC- 12
Watersheds
Sand River
Watershed
040103010901
Raspberry River Watershed 040103011002
Red Cliff Creek Watershed 040103011003
Named Sub-
watersheds
within the
Reservation
Sand River
Raspberry River Sub-watersheds:
Raspberry River and Sucker Creek
Red Cliff Creek Sub-watersheds:
Red Cliff Creek, Frog Creek, and Chicago
Creek
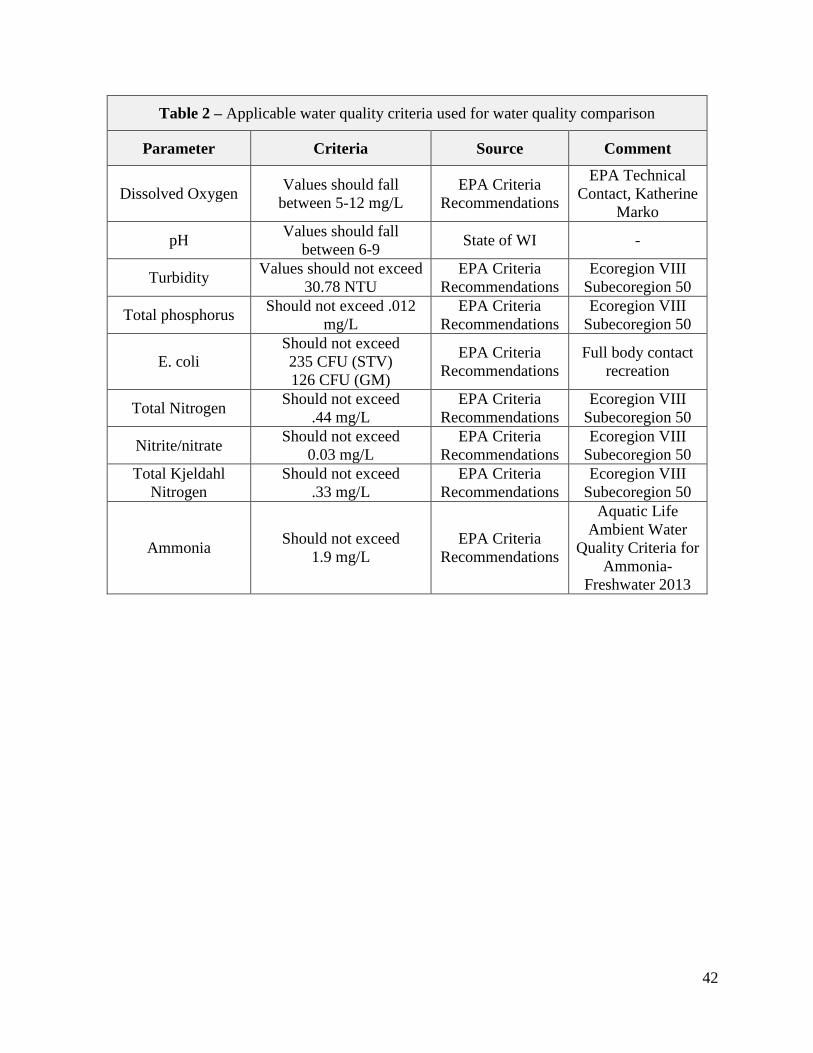
42
Table 2 – Applicable water quality criteria used for water quality comparison
Parameter Criteria Source Comment
Dissolved Oxygen Values should fall
between 5-12 mg/L
EPA Criteria
Recommendations
EPA Technical
Contact, Katherine
Marko
pH Values should fall
between 6-9 State of WI -
Turbidity Values should not exceed
30.78 NTU
EPA Criteria
Recommendations
Ecoregion VIII
Subecoregion 50
Total phosphorus Should not exceed .012
mg/L
EPA Criteria
Recommendations
Ecoregion VIII
Subecoregion 50
E. coli
Should not exceed
235 CFU (STV)
126 CFU (GM)
EPA Criteria
Recommendations
Full body contact
recreation
Total Nitrogen Should not exceed
.44 mg/L
EPA Criteria
Recommendations
Ecoregion VIII
Subecoregion 50
Nitrite/nitrate Should not exceed
0.03 mg/L
EPA Criteria
Recommendations
Ecoregion VIII
Subecoregion 50
Total Kjeldahl
Nitrogen
Should not exceed
.33 mg/L
EPA Criteria
Recommendations
Ecoregion VIII
Subecoregion 50
Ammonia Should not exceed
1.9 mg/L
EPA Criteria
Recommendations
Aquatic Life
Ambient Water
Quality Criteria for
Ammonia-
Freshwater 2013
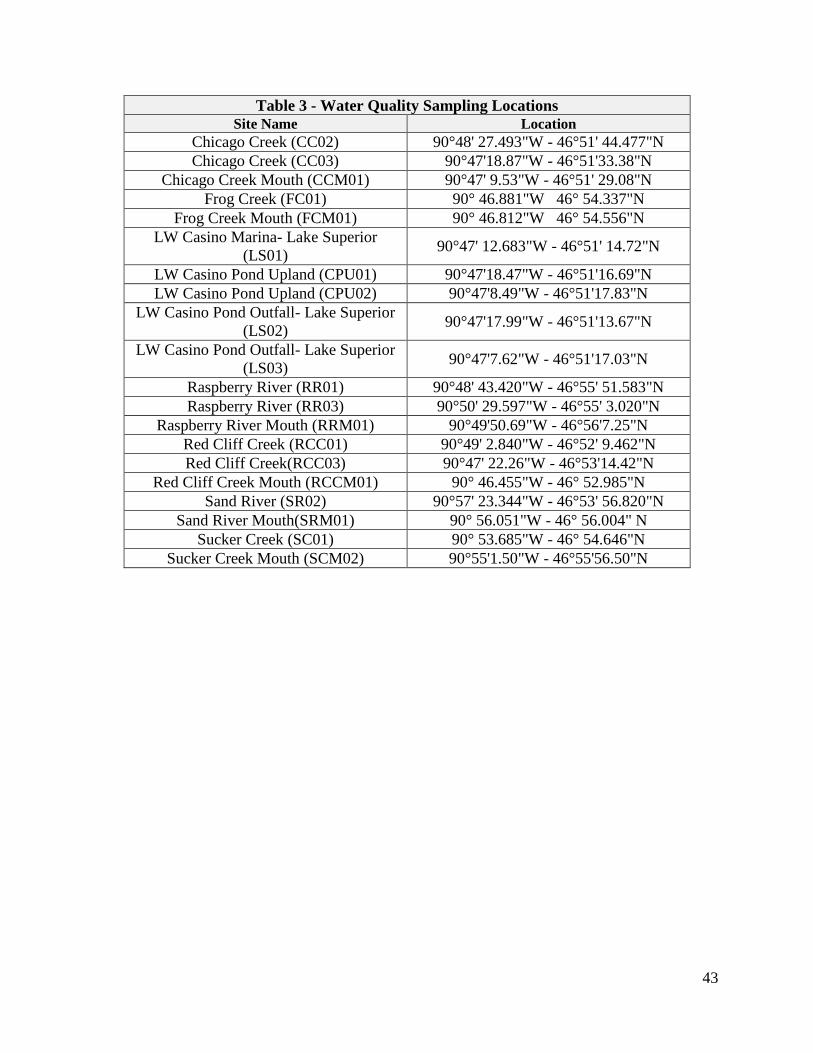
43
Table 3 - Water Quality Sampling Locations
Site Name Location Chicago Creek (CC02) 90°48' 27.493"W - 46°51' 44.477"N
Chicago Creek (CC03) 90°47'18.87"W - 46°51'33.38"N
Chicago Creek Mouth (CCM01) 90°47' 9.53"W - 46°51' 29.08"N
Frog Creek (FC01) 90° 46.881"W 46° 54.337"N
Frog Creek Mouth (FCM01) 90° 46.812"W 46° 54.556"N
LW Casino Marina- Lake Superior
(LS01) 90°47' 12.683"W - 46°51' 14.72"N
LW Casino Pond Upland (CPU01) 90°47'18.47"W - 46°51'16.69"N
LW Casino Pond Upland (CPU02) 90°47'8.49"W - 46°51'17.83"N
LW Casino Pond Outfall- Lake Superior
(LS02) 90°47'17.99"W - 46°51'13.67"N
LW Casino Pond Outfall- Lake Superior
(LS03) 90°47'7.62"W - 46°51'17.03"N
Raspberry River (RR01) 90°48' 43.420"W - 46°55' 51.583"N
Raspberry River (RR03) 90°50' 29.597"W - 46°55' 3.020"N
Raspberry River Mouth (RRM01) 90°49'50.69"W - 46°56'7.25"N
Red Cliff Creek (RCC01) 90°49' 2.840"W - 46°52' 9.462"N
Red Cliff Creek(RCC03) 90°47' 22.26"W - 46°53'14.42"N
Red Cliff Creek Mouth (RCCM01) 90° 46.455"W - 46° 52.985"N
Sand River (SR02) 90°57' 23.344"W - 46°53' 56.820"N
Sand River Mouth(SRM01) 90° 56.051"W - 46° 56.004" N
Sucker Creek (SC01) 90° 53.685"W - 46° 54.646"N
Sucker Creek Mouth (SCM02) 90°55'1.50"W - 46°55'56.50"N
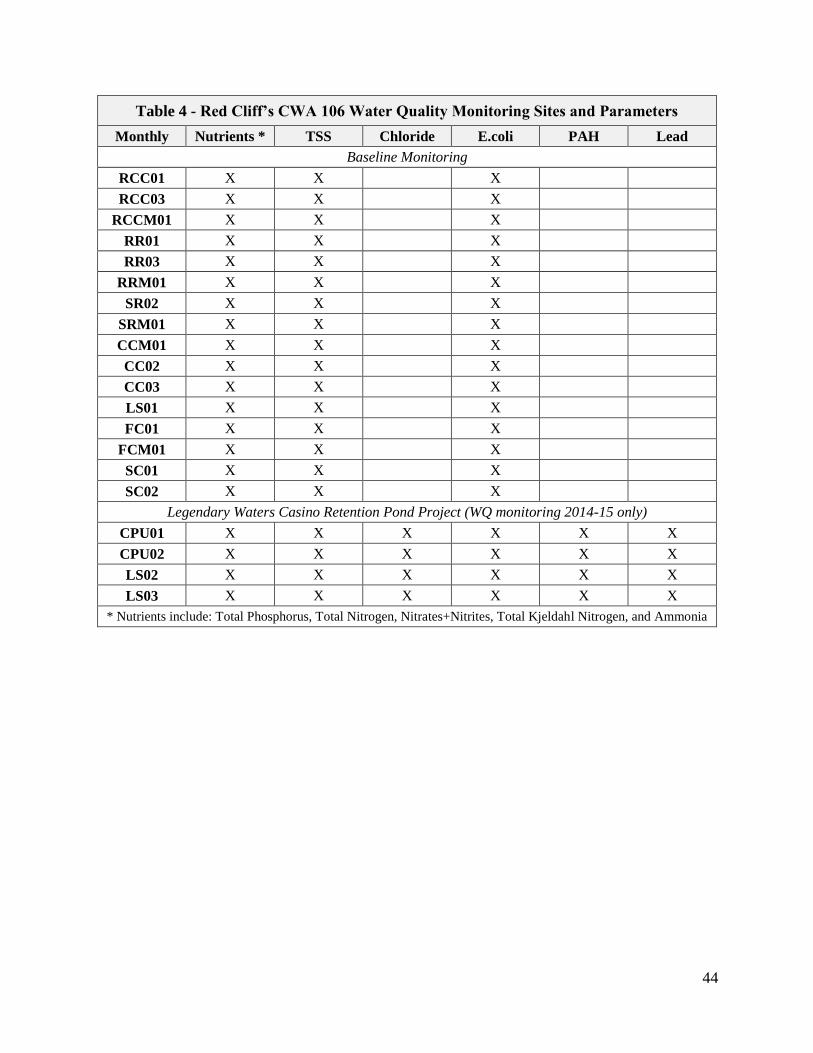
44
Table 4 - Red Cliff’s CWA 106 Water Quality Monitoring Sites and Parameters
Monthly Nutrients * TSS Chloride E.coli PAH Lead
Baseline Monitoring
RCC01 X X
X
RCC03 X X
X
RCCM01 X X
X
RR01 X X
X
RR03 X X
X
RRM01 X X
X
SR02 X X
X
SRM01 X X
X
CCM01 X X
X
CC02 X X
X
CC03 X X
X
LS01 X X
X
FC01 X X
X
FCM01 X X
X
SC01 X X
X
SC02 X X
X
Legendary Waters Casino Retention Pond Project (WQ monitoring 2014-15 only)
CPU01 X X X X X X
CPU02 X X X X X X
LS02 X X X X X X
LS03 X X X X X X
* Nutrients include: Total Phosphorus, Total Nitrogen, Nitrates+Nitrites, Total Kjeldahl Nitrogen, and Ammonia

45
Table 5 – NPS Assessment Summary
Waterbody Name &
Stream Length* (On-reservation - main stem)
NPS Pollutant(s) Use(s) Impaired Use(s)
Threatened Potential Source
Future
Potential
Source
Threats
Severity
Chicago Creek
1.75 miles
- Sediment
- Nitrogen
- Phosphorus
- E.coli
- Contact; fishing,
swimming, cultural
uses
-Aquatic life
-
- Possible outdated septic systems
- Development
- Roads
- Historic hydromodification
- Forestry Impacted
Frog Creek
~ 1.25 miles
- Sediment
- Nitrogen
- Phosphorus
-Aquatic life - Contact; fishing,
swimming, cultural uses
- Possible outdated septic systems
- Forestry
- Sandbar causing trapping of nutrients
- Roads
- Development Slightly
Impacted
Lake Superior
(Casino Marina & Beach) -Nitrogen -
- Contact; fishing,
swimming, cultural uses
-Aquatic life
- Casino turf management practices
- Development
- Roads/parking lot runoff
- Historic hydromodification
- Impacted
Casino Pond & Outfall #1
-Nitrogen
-Phosphorus
-Chloride
-
- Contact; fishing,
swimming, cultural uses
-Aquatic life
- Casino turf management practices
- Development
- Roads/parking lot runoff
- Historic hydromodification
- Impacted
Casino Pond & Outfall #2 -Nitrogen
-Phosphorus -
- Contact; fishing,
swimming, cultural uses
-Aquatic life
- Casino turf management practices
- Development
- Roads/parking lot runoff
- Historic hydromodification
- Impacted
Raspberry River
~ 2.25 miles
- Sediment
- Nitrogen
- Phosphorus
- E.coli
- Contact; fishing,
swimming, cultural
uses
-Aquatic life
-
- Forestry
- Agriculture
- Historic outhouses at the Raspberry Campground
- Development
- Roads
- Beaver activity
- Historic hydromodification
- Impacted
Red Cliff Creek
~ 3 miles
- Sediment
- Nitrogen
- Phosphorus
-E.coli
- Contact; fishing,
swimming, cultural
uses
-Aquatic life
-
- Forestry
- Agriculture
- Possible outdated septic systems
- Historic wastewater treatment pond
- Development
- Roads
- Beaver activity
- Impacted
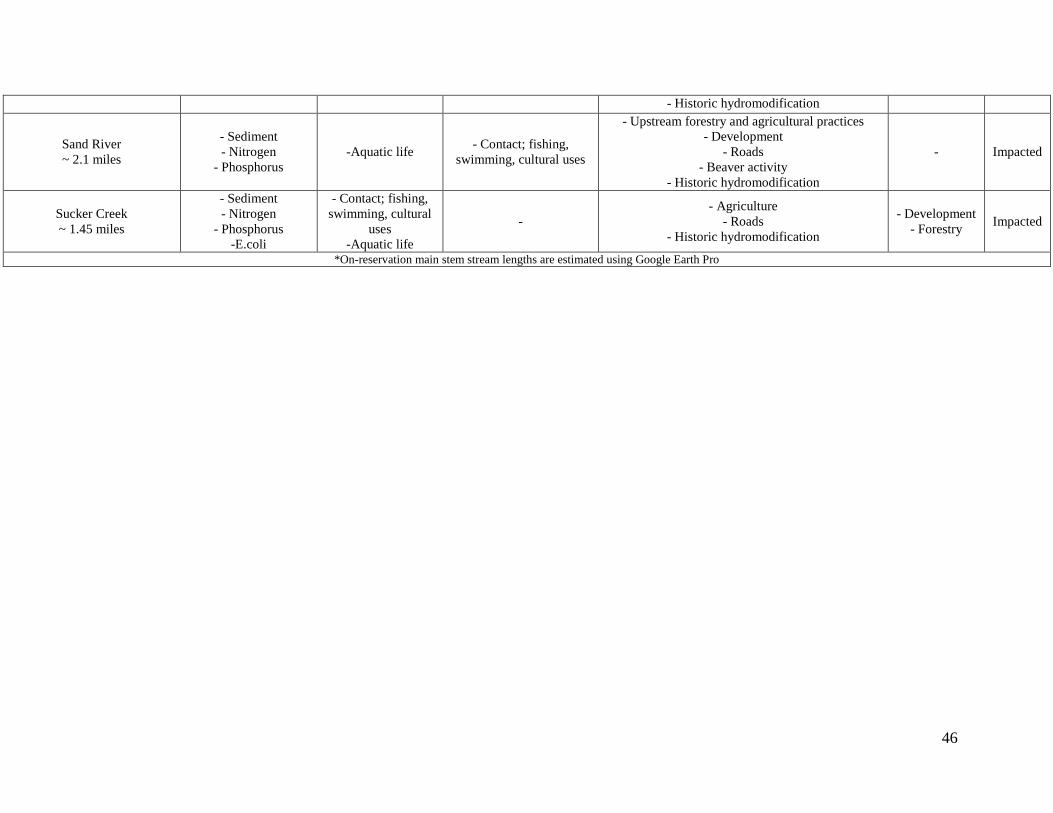
46
- Historic hydromodification
Sand River
~ 2.1 miles
- Sediment
- Nitrogen
- Phosphorus
-Aquatic life - Contact; fishing,
swimming, cultural uses
- Upstream forestry and agricultural practices
- Development
- Roads
- Beaver activity
- Historic hydromodification
- Impacted
Sucker Creek
~ 1.45 miles
- Sediment
- Nitrogen
- Phosphorus
-E.coli
- Contact; fishing,
swimming, cultural
uses
-Aquatic life
-
- Agriculture
- Roads
- Historic hydromodification
- Development
- Forestry Impacted
*On-reservation main stem stream lengths are estimated using Google Earth Pro
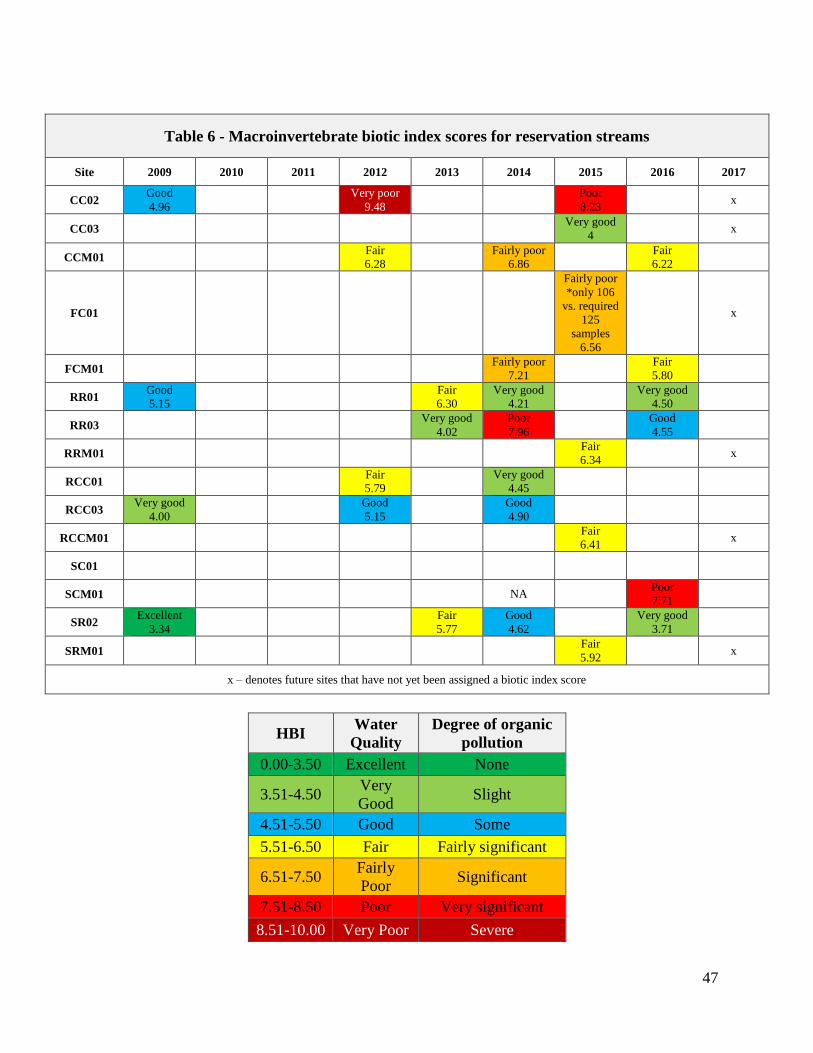
47
Table 6 - Macroinvertebrate biotic index scores for reservation streams
Site 2009 2010 2011 2012 2013 2014 2015 2016 2017
CC02 Good
4.96
Very poor
9.48
Poor
8.23 x
CC03 Very good
4 x
CCM01 Fair
6.28
Fairly poor
6.86
Fair
6.22
FC01
Fairly poor
*only 106
vs. required
125
samples
6.56
x
FCM01 Fairly poor
7.21
Fair
5.80
RR01 Good
5.15
Fair
6.30
Very good
4.21
Very good
4.50
RR03 Very good
4.02
Poor
7.96
Good
4.55
RRM01 Fair
6.34 x
RCC01 Fair
5.79
Very good
4.45
RCC03 Very good
4.00
Good
5.15
Good
4.90
RCCM01 Fair
6.41 x
SC01
SCM01 NA Poor
7.71
SR02 Excellent
3.34
Fair
5.77
Good
4.62
Very good
3.71
SRM01 Fair
5.92 x
x – denotes future sites that have not yet been assigned a biotic index score
HBI Water
Quality
Degree of organic
pollution
0.00-3.50 Excellent None
3.51-4.50 Very
Good Slight
4.51-5.50 Good Some
5.51-6.50 Fair Fairly significant
6.51-7.50 Fairly
Poor Significant
7.51-8.50 Poor Very significant
8.51-10.00 Very Poor Severe

48
Wetland Assessment Area Summary Table
Wetland Inventory and Assessment Report, Red Cliff Band of Lake Superior Chippewa.
February 8, 2016

49
Appendix C
Red Cliff Water Resource Program’s CWA 106 Water Quality
Monitoring Data
The Red Cliff Water Resource Program’s CWA 106 Water Quality Monitoring data can be
found at: http://www3.epa.gov/storet/dw_home.html
Also see Red Cliff Water Resource Program’s CWA 106 Water Quality Assessment Reports
(reports include 2013-2015 WQAR and 2016 WQAR): http://redcliff-
nsn.gov/divisions/TNRD/WR.htm

50
Appendix D
Red Cliff Water Resource Program’s CWA 106 Water Quality
Monitoring Data Graphs Chicago Creek Results
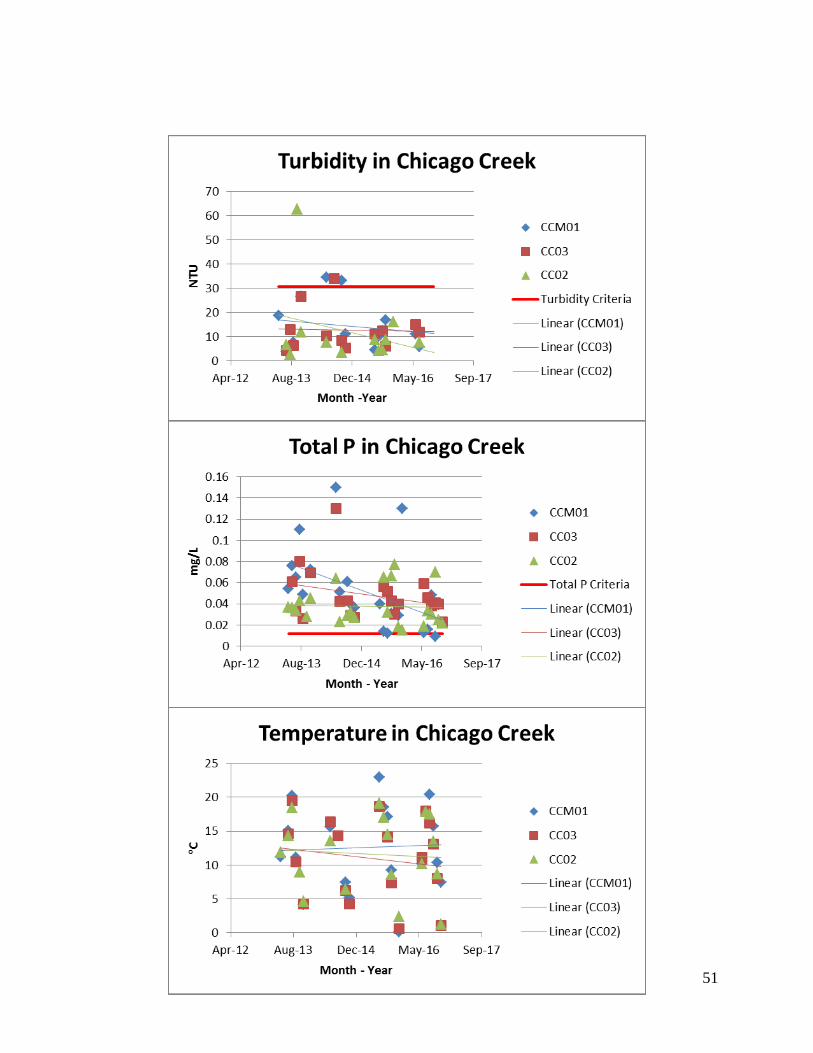
51
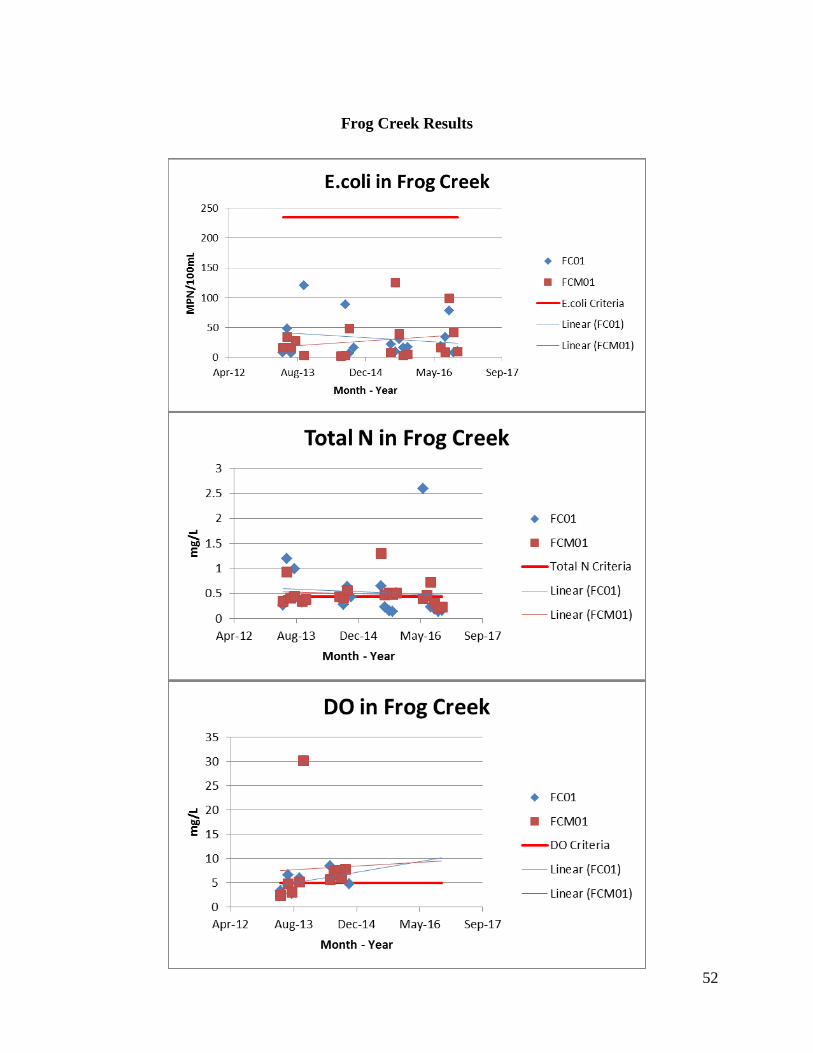
52
Frog Creek Results
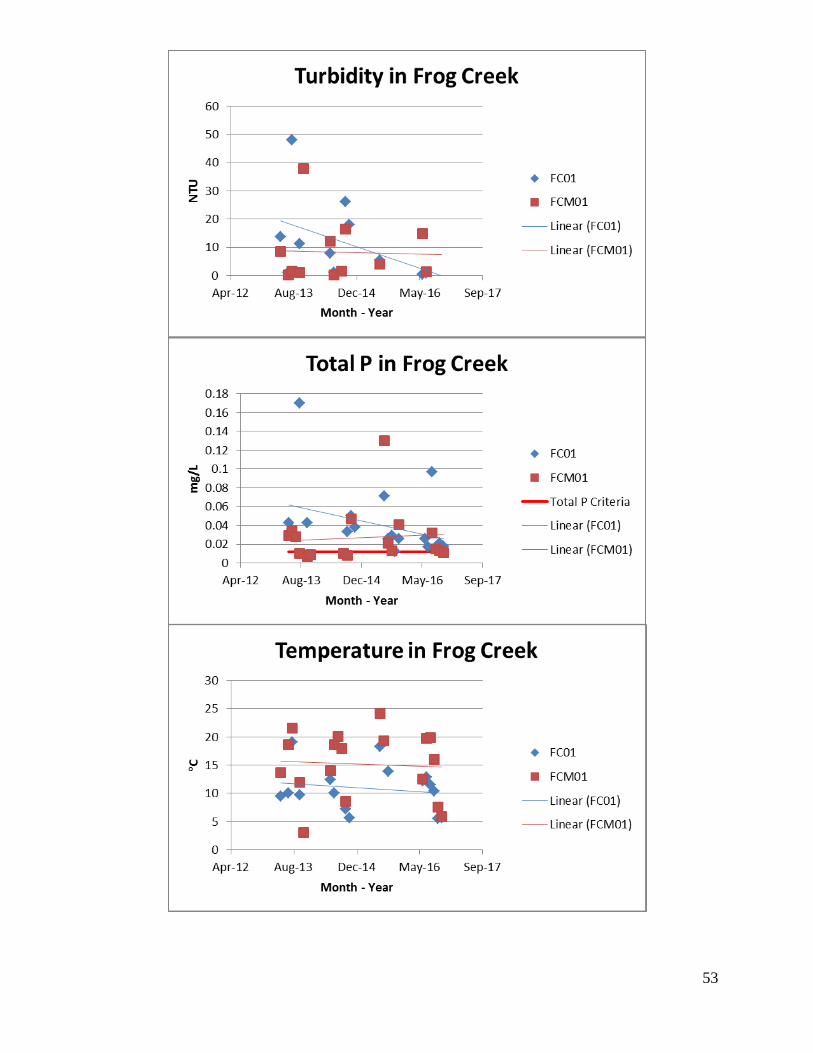
53
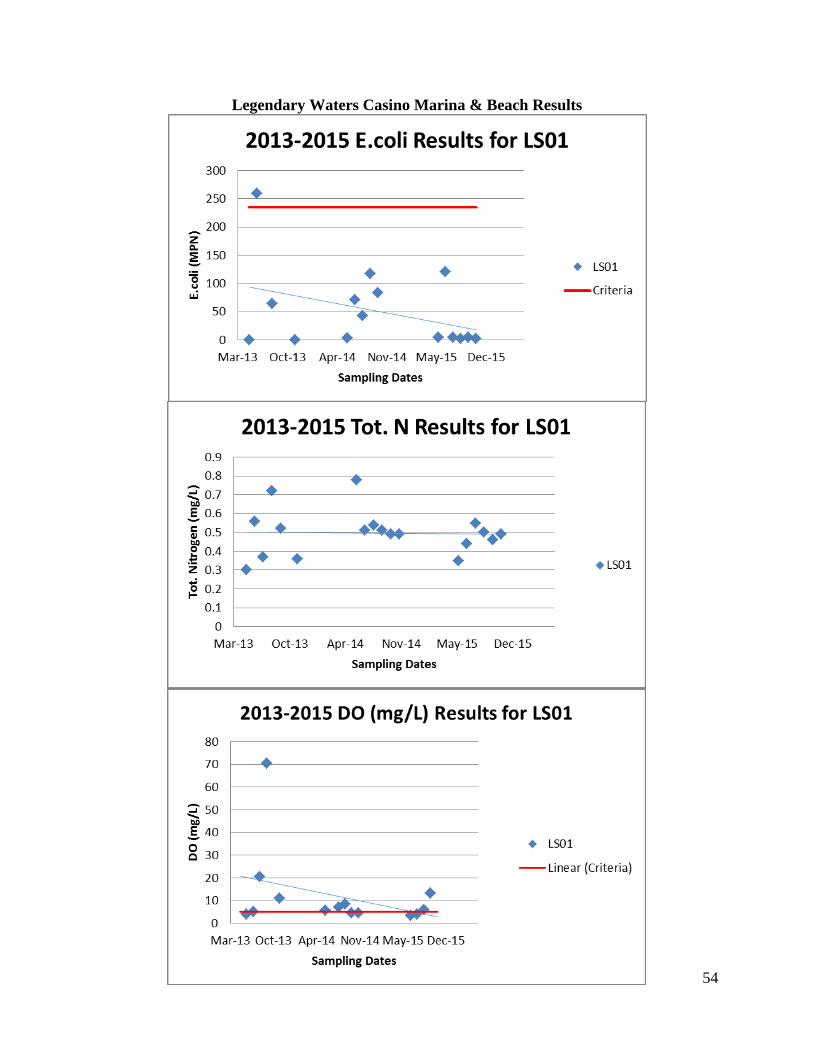
54
Legendary Waters Casino Marina & Beach Results
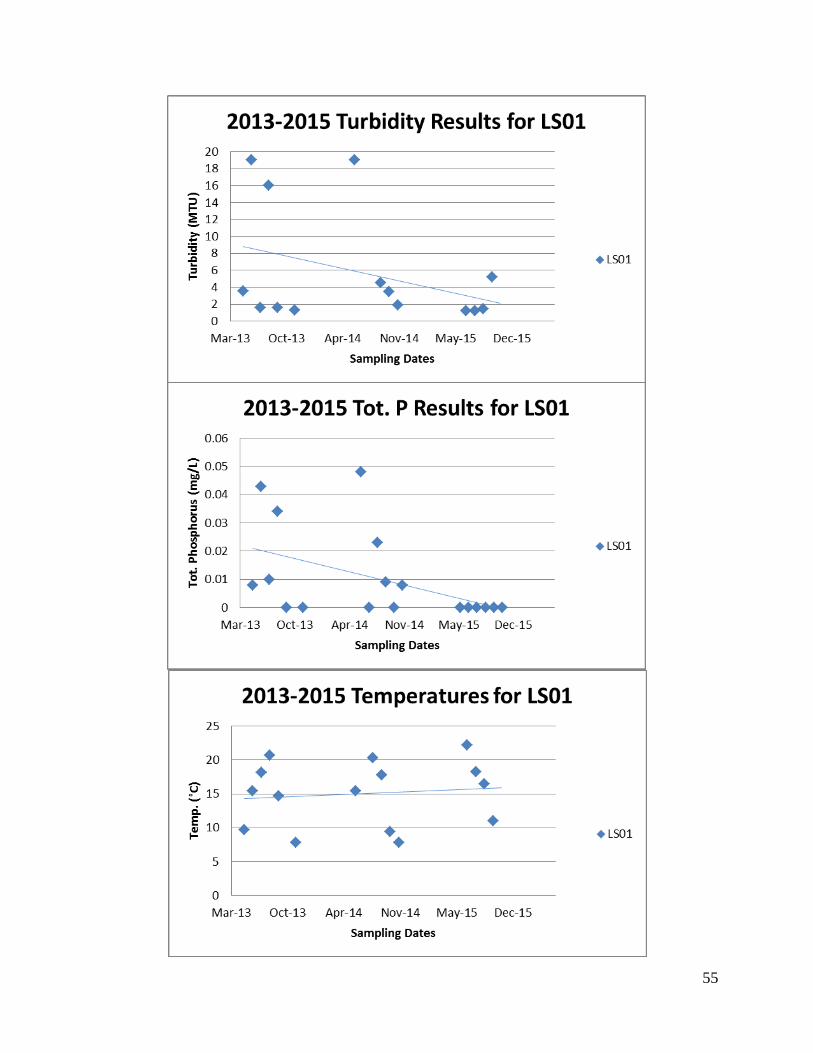
55
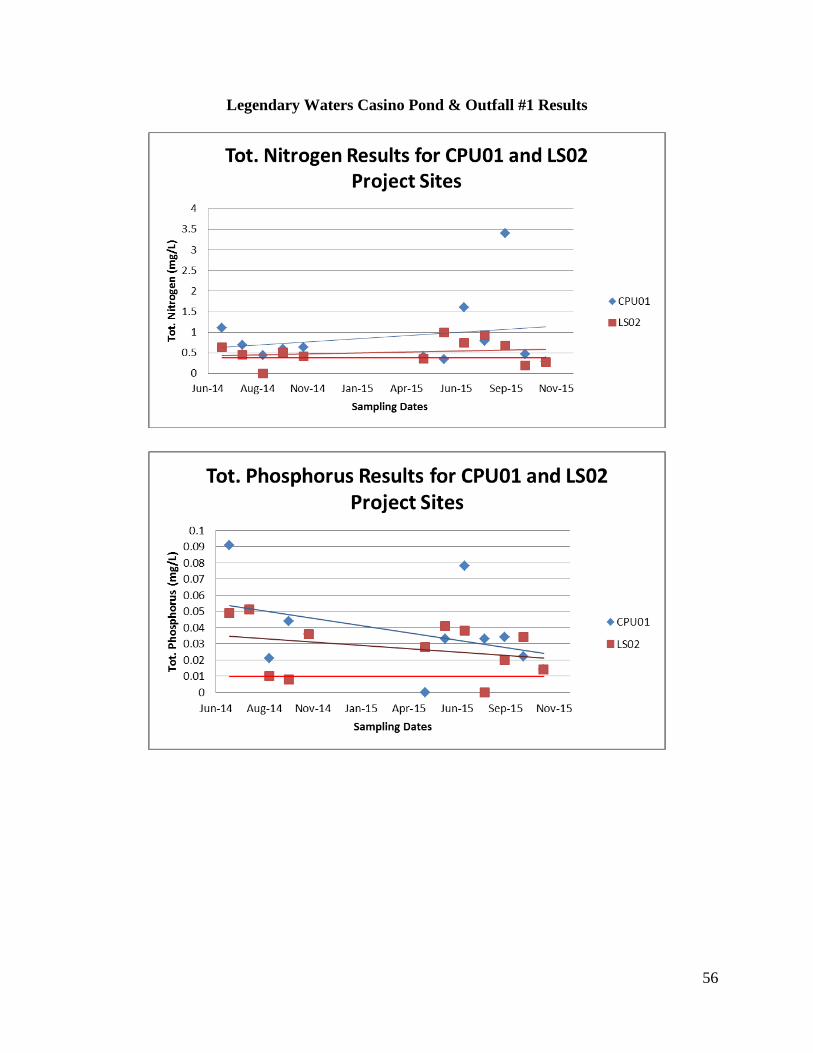
56
Legendary Waters Casino Pond & Outfall #1 Results
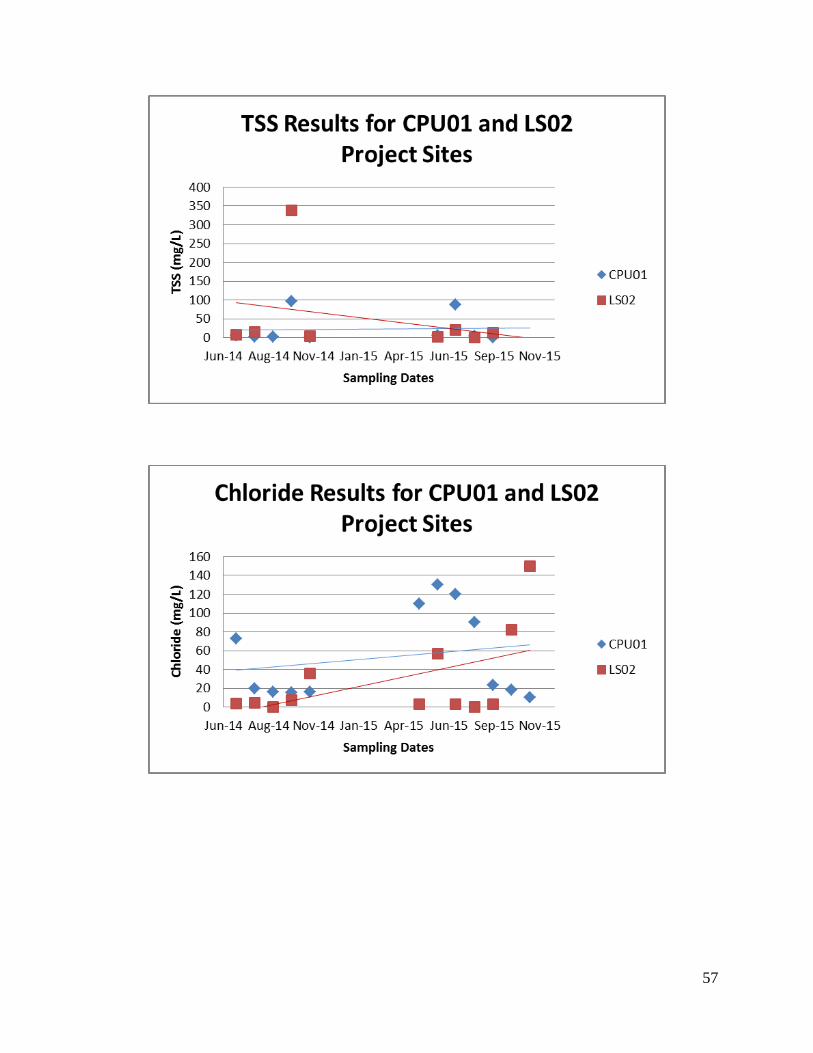
57
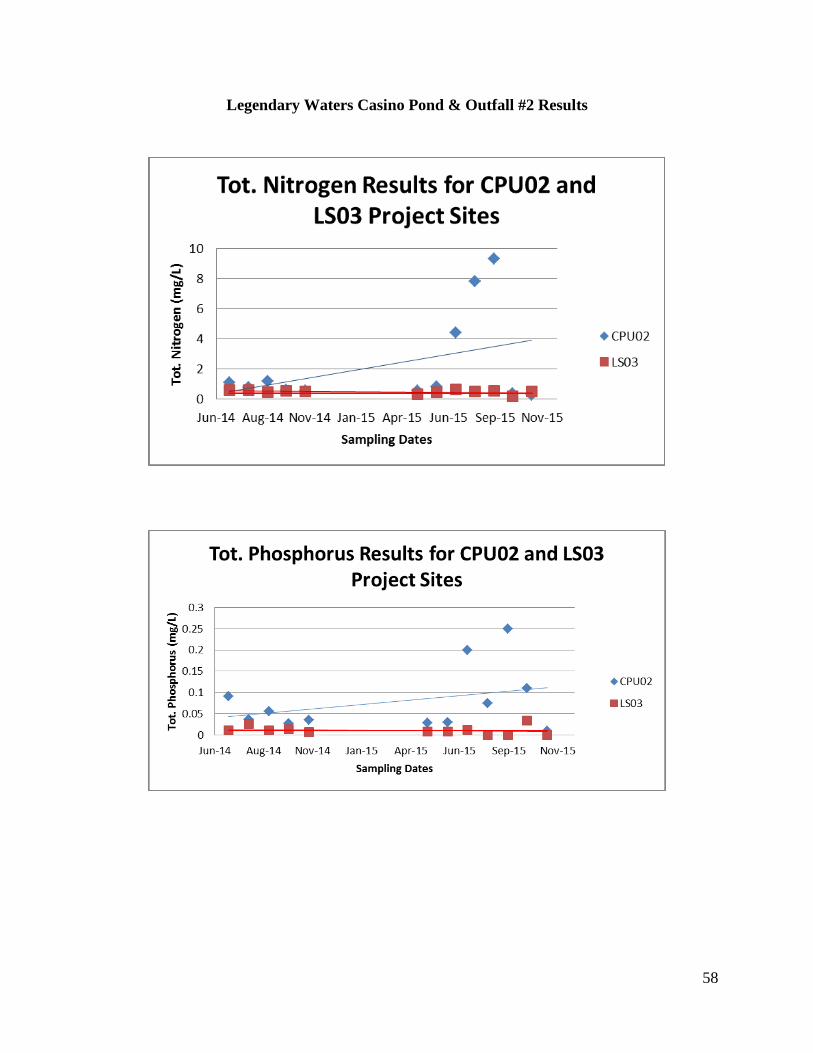
58
Legendary Waters Casino Pond & Outfall #2 Results

59
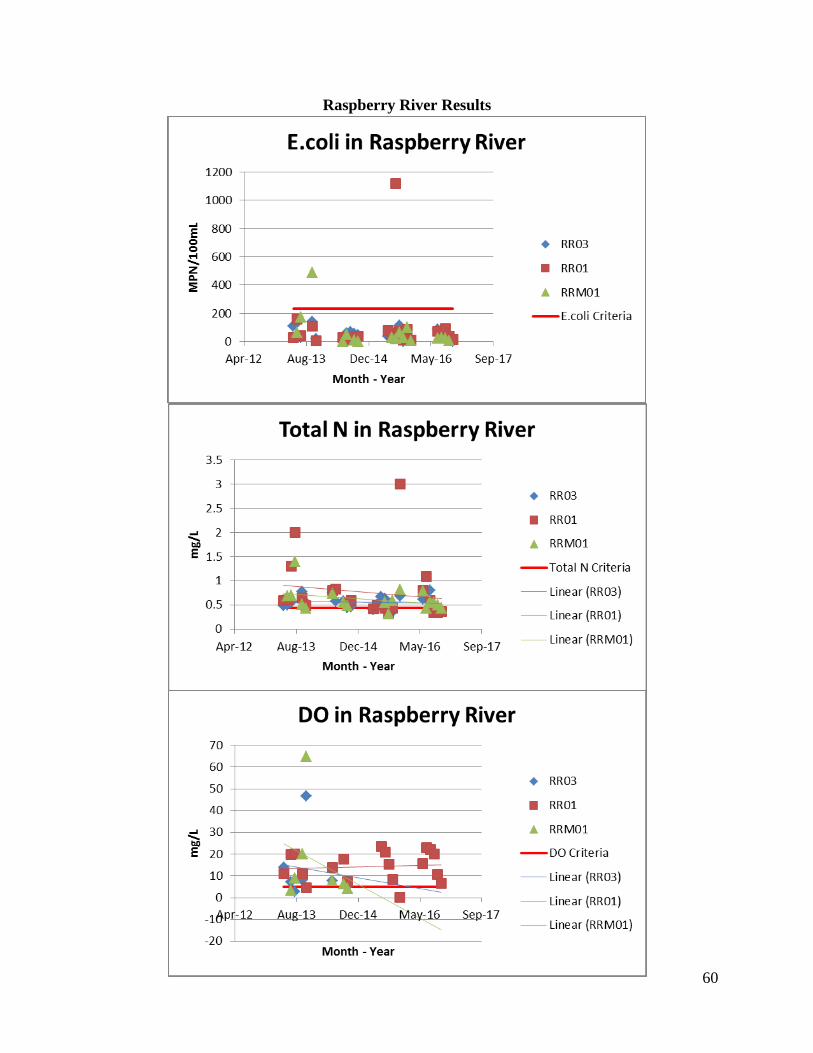
60
Raspberry River Results

61
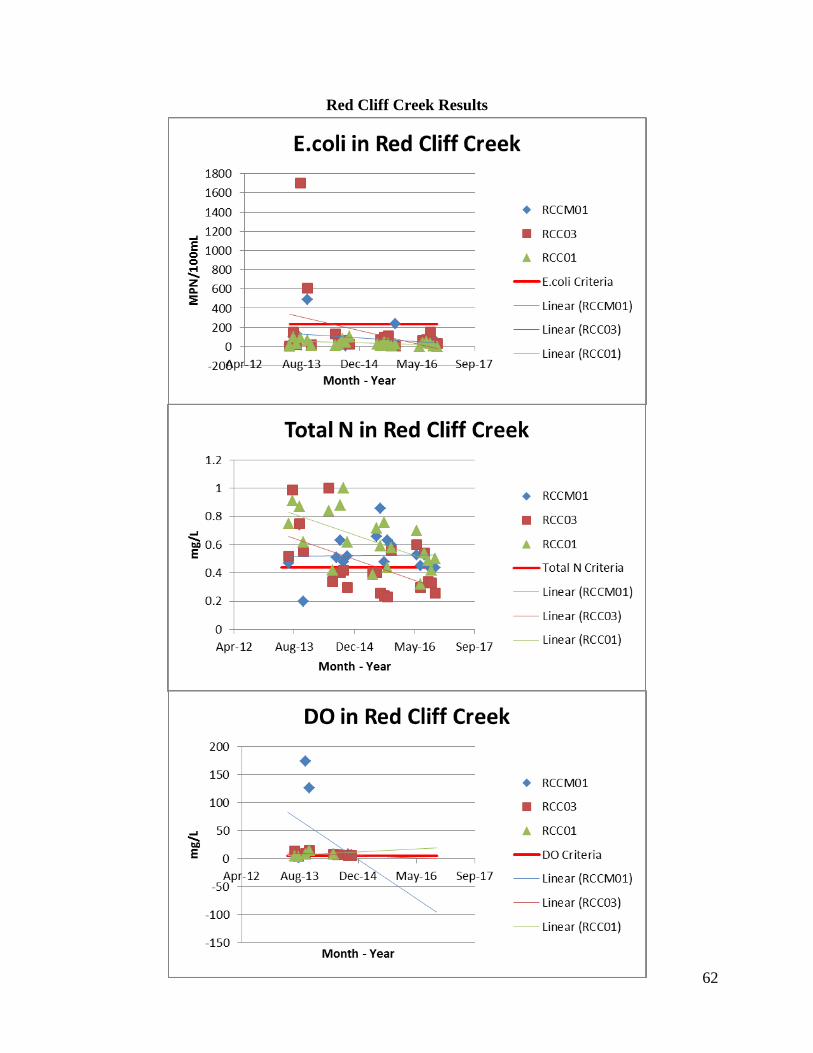
62
Red Cliff Creek Results
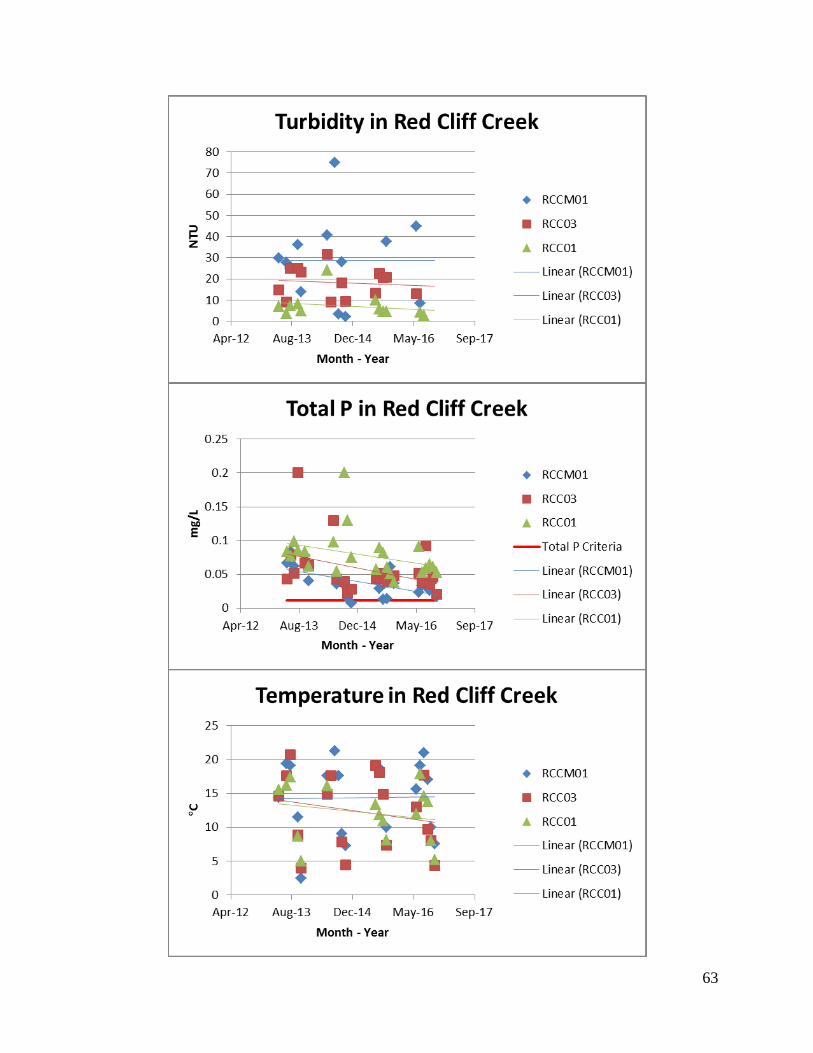
63
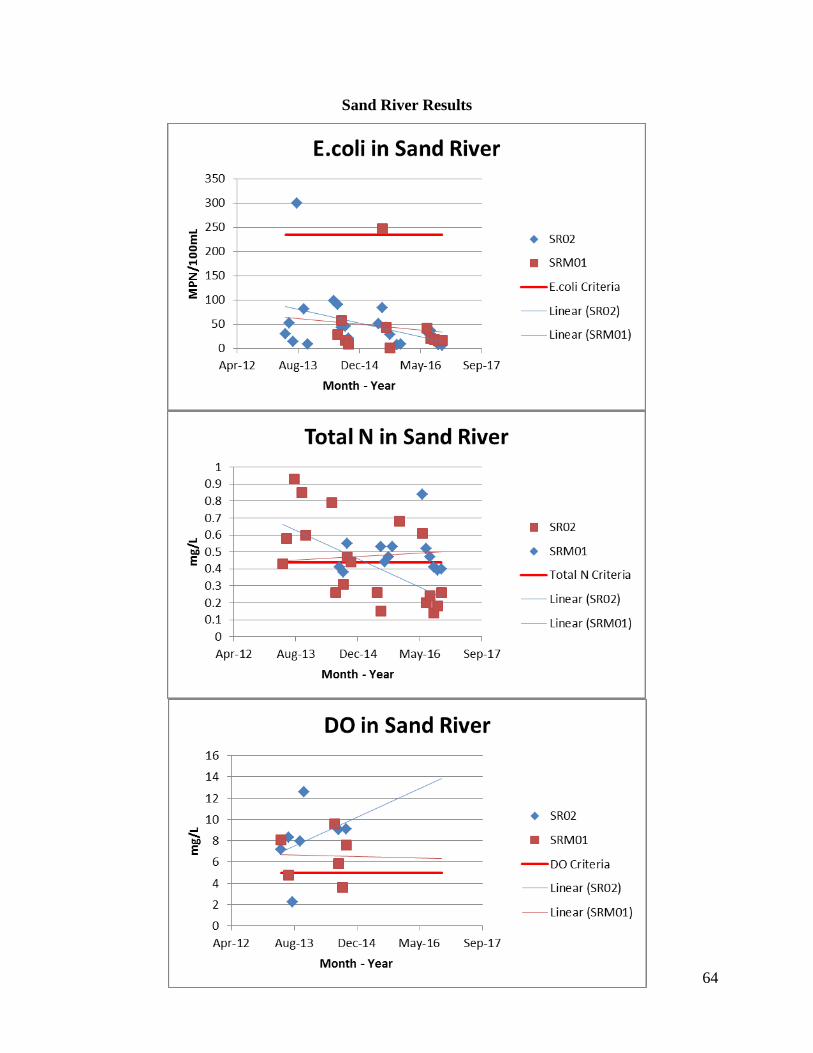
64
Sand River Results
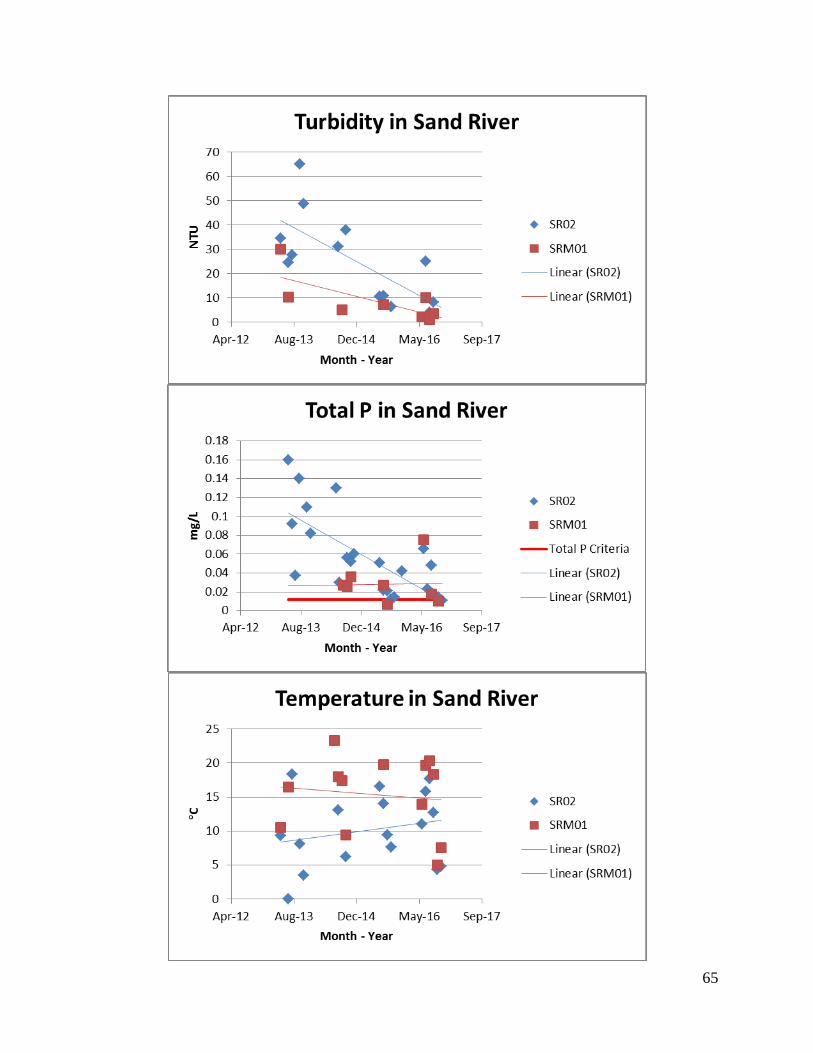
65
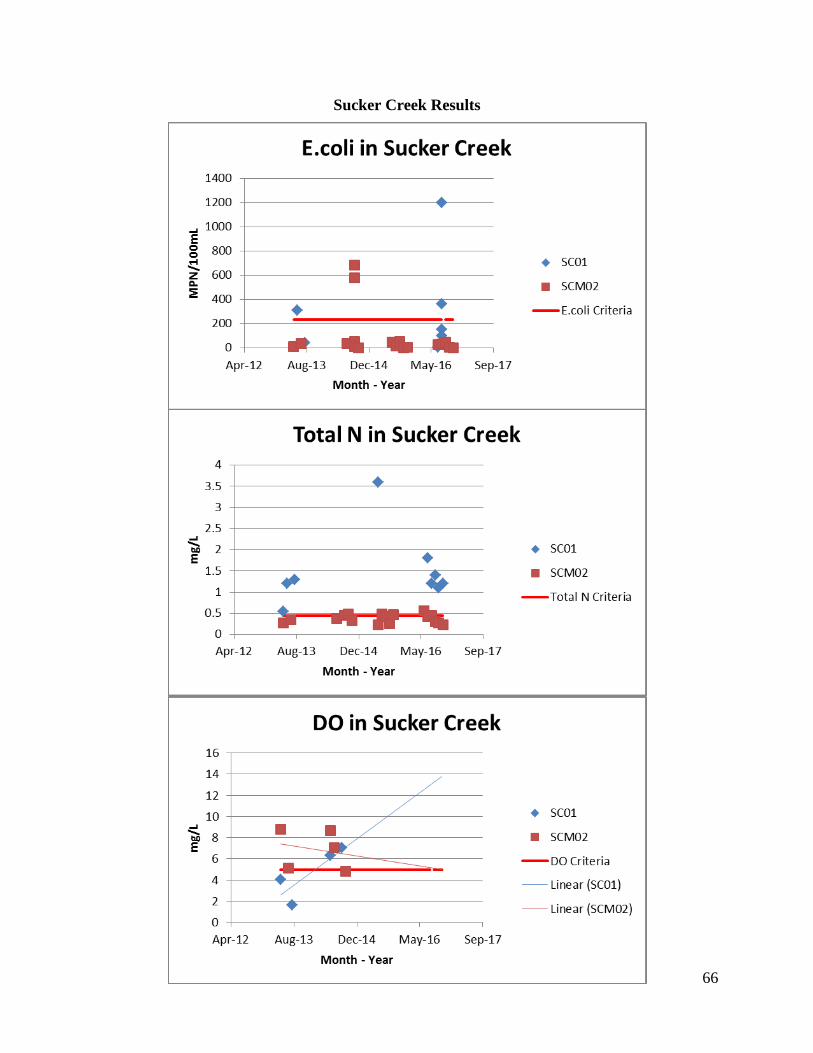
66
Sucker Creek Results
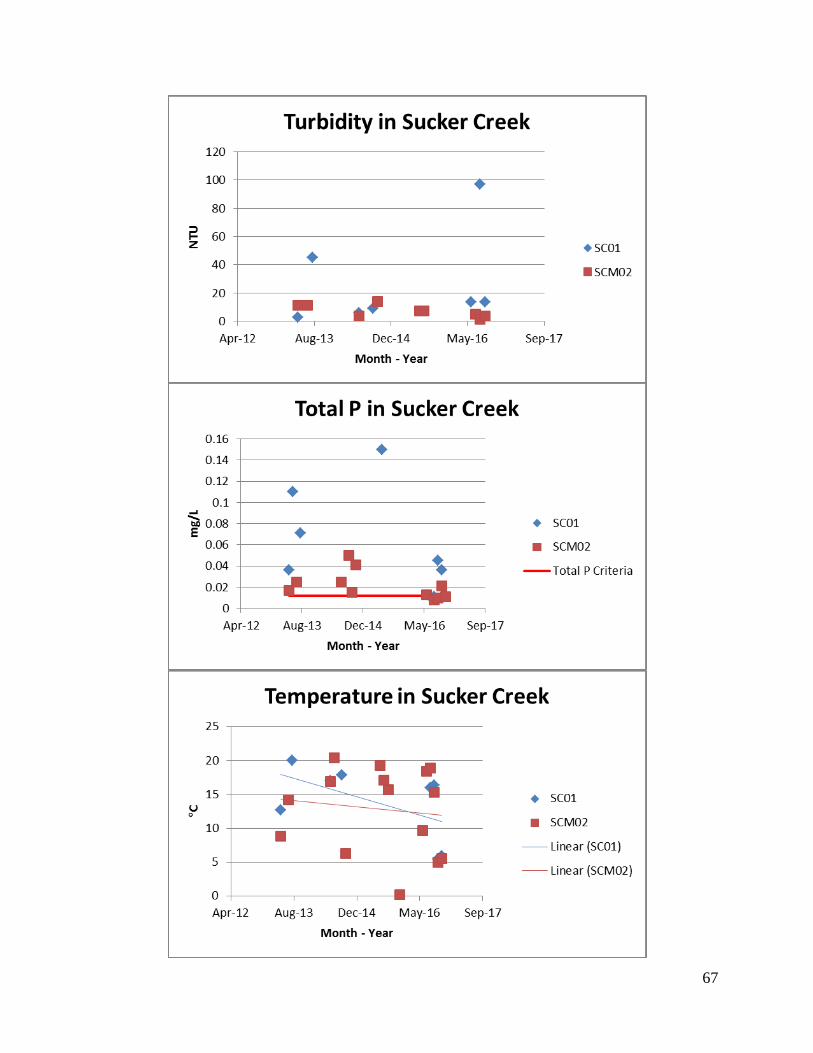
67
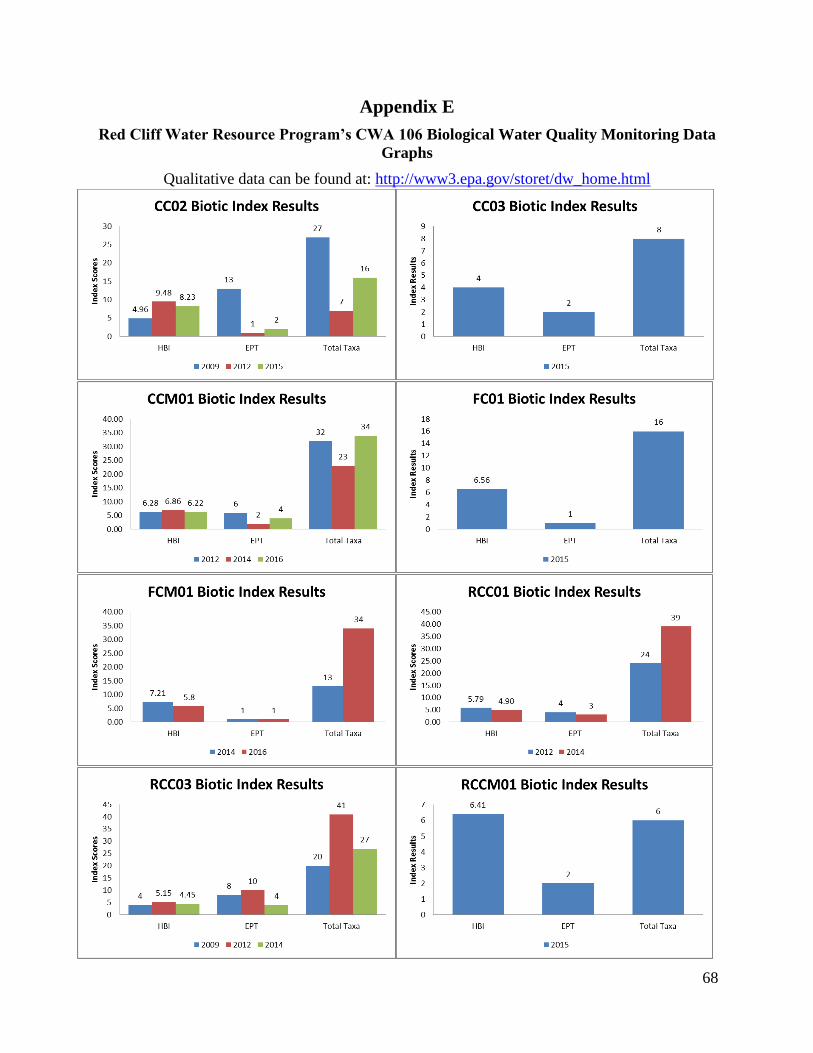
68
Appendix E
Red Cliff Water Resource Program’s CWA 106 Biological Water Quality Monitoring Data
Graphs
Qualitative data can be found at: http://www3.epa.gov/storet/dw_home.html
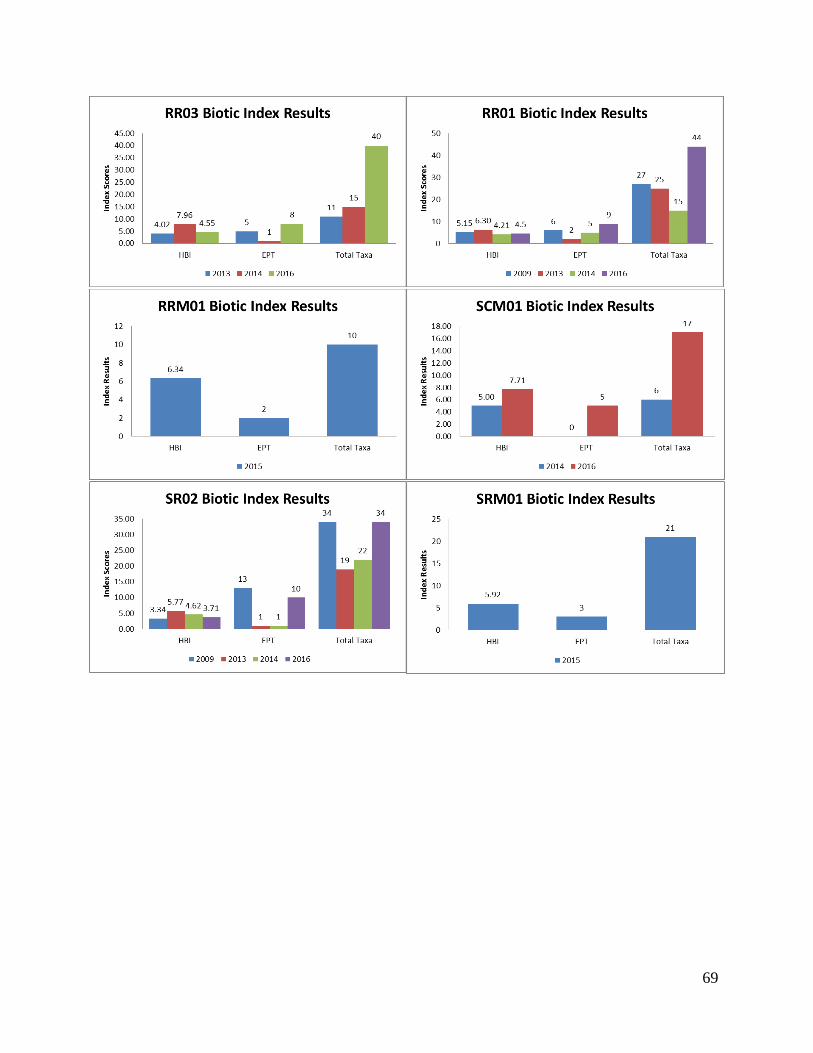
69