trinity charging experiment gregg harry, mit on behalf of dennis ugolini, trinity ligo-g060462-00-r
TRANSCRIPT

Trinity Charging Experiment
Gregg Harry, MITOn behalf of Dennis Ugolini, Trinity
LIGO-G060462-00-R

First generation – area around tip too wide, collides with chopper
Second generation – lots of noise without grounding ring
Final version

Tuning-fork chopper Rotary chopper

Probe calibration with rotary chopper
Voltage on conducting sample (V)
Pro
be
outp
ut (
μV
)
Probe output read with spectrum analyzer at chopping frequency of 500 Hz. Probe-to-sample distance is 6 mm.
Bare wire probe tip has 1mm diameter. A dollop of solder was added to the tip to broaden its surface to 3.25mm diameter, resulting in an improvement in sensitivity.
Uncertainty in each measurement = 0.5 μV, due to fluctuation in signal.

2
2
10
1 4
2 5.7 10
LV
DS
L
S = charge per unit area
V = voltage at meter = 1500 V
L = distance to sample = 2.5 cm
D = width of sample = 2.5 cm
Probe with tuning-fork chopper could not see conducting sample, due to noise peak from current coil on chopper.
Instead, the voltage from a conducting sample was measured with a surface DC voltmeter. We found 1500V on meter at 2.5cm from sample corresponded to 1 mV at probe, with an uncertainty of 0.01 mV.
= 2.6 × 10⁻⁶ C/m2 = 1.6 × 10⁹ e/cm2
Since the uncertainty is 100 times smaller than the signal, the limit to our sensitivity is thus 1.6 × 10⁷ e/cm2.
Based on the signal strength and uncertainty measured on the previous page, we find the rotary chopper probe sensitivity to be 8 × 10⁵ e/cm2.

0
0.5
1
1.5
2
2.5
3
0 20 40 60 80 100 120 140
Tim e (m inutes)
Pro
be
sig
nal
(m
V)
6/7/2006
6/8/2006
6/9/2006
0
0.5
1
1.5
2
2.5
3
1 10 100 1000
Tim e (m inutes)
Pro
be
sig
nal
(m
V)
6/7/2006
6/8/2006
6/9/2006
0
0.5
1
1.5
2
2.5
3
0 20 40 60 80 100 120 140
Tim e (m inutes)
1/S
ign
al (
1/m
V)
6/7/2006
6/8/2006
6/9/2006
Upper left – charge decay from insulating sample measured by rotary chopper probe, fit with an exponential. The data comes from three consecutive days with roughly equivalent weather.
Upper right – semilog plot of same data, showing logarithmic decay shape.
Lower left – same data displayed as 1/signal, fit to quadratic in time; in other words, S = 1/(at2+bt+c)

Rotary chopper probe with conducting sample at 15V. The probe signal shows an inverse-square relationship with sample distance. Noise (signal that persists when the sample voltage is reduced to 0V) increases rapidly at separations below 4mm.

Rotary chopper response for different chopping frequencies. Note that the probe output has been passed through a x100 low-noise amplifier; we have corrected for the amp’s frequency dependence. I’m not sure of the reason for this behavior, but it does make sense that as we approach DC, our sensitivity should disappear, since at that point we are not modulating the capacitance anymore.

We want to use the tuning-fork chopper because it is vacuum-compatible. But what to do about the noise peak at the signal frequency?
We discovered that we could measure a nearly noise-free signal at twice the chopping frequency. The reason is that we have a 50% duty cycle chopper. During the “closed” part of the cycle, the chopper blades overlap, and electric field lines can pass outside of the blades to our probe element.
We used the optical setup shown below to verify this effect. The beam is broadened to be slightly wider than the chopper blades.
= field lines
HeNe laser
Chopper
Photodiode

The tuning-fork chopper probe can clearly see the conducting sample when read at 1008 Hz. The signal size is 60% of what we found for the rotary chopper, but the uncertainty (fluctuation in the signal over time) is ~0.1 μV. This corresponds to a sensitivity of 2.7 × 10⁵ e/cm2, or about sixty times more sensitive than when read at 504 Hz.
The hope is that the signal fluctuation is due to interaction with the air between the probe and sample, and that in vacuum the probe will be even more precise.
Tuning-fork chopper probe calibration with conducting sample
0
5
10
15
20
25
30
0 5 10 15 20
Sample voltage (V)
Pro
be
sig
nal
(u
V)
3.25 mm
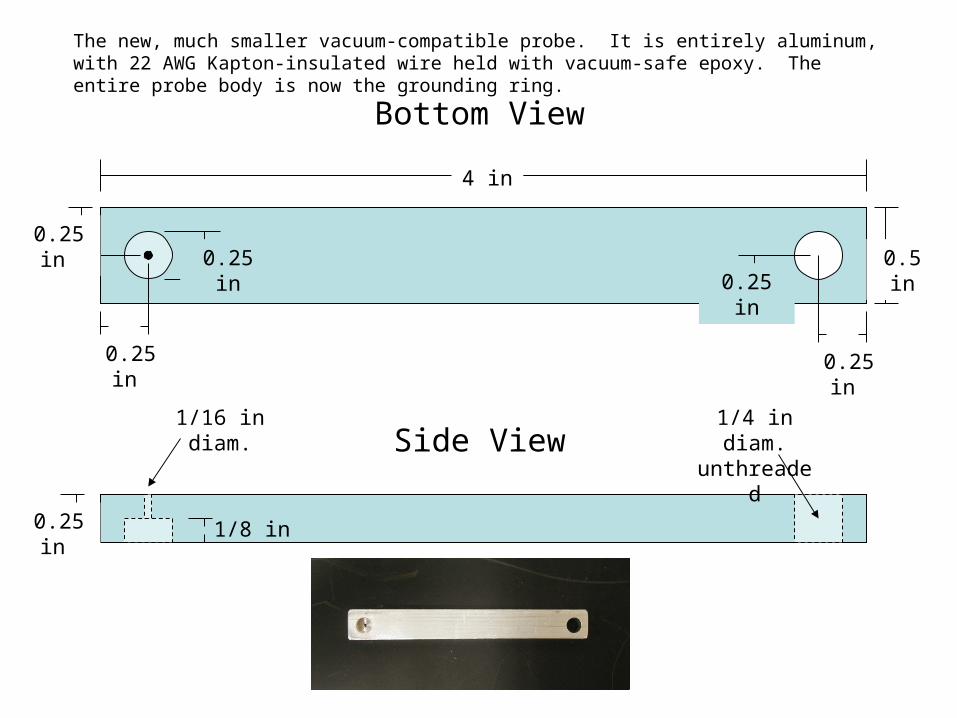
Bottom View
Side View
4 in
0.5 in 0.25 in
0.25 in
0.25 in 0.25 in
0.25 in
1/8 in 0.25 in
1/16 in diam. 1/4 in diam. unthreaded
The new, much smaller vacuum-compatible probe. It is entirely aluminum, with 22 AWG Kapton-insulated wire held with vacuum-safe epoxy. The entire probe body is now the grounding ring.

Vacuum SystemTurbomolecular drag pump
Dry diaphragm backing pump
Gate valve
Vent valve
Viewport and interior access
The pumps and chamber are on the same table just for the purposes of photography; they will be on separate tables, with a suspended 24” steel-braided hose connecting
them, to reduce vibration in the chamber. I expect to be pumping down by the end of the meeting.

Photodiode signal from optical setup
Amplified capacitive probe output with charged insulating sample
Blades open Blades closed
Well, they don’t look the same. But the probe trace (right) looks very much like the derivative of the optical trace (left). Perhaps this is what we should expect, since we are measuring an induced voltage causing charge to flow to and from the probe tip. It might also explain why our sensitivity degrades at low frequencies – the derivative of a slow change is a small signal.
Anyway, this is all guesswork. The important thing is that while we have a fluctuating 0.1 mV noise peak at the chopping frequency of 504 Hz, the noise peak at 1008 Hz is < 4 μV, while the signal is still large.