truetrends by truecar - december 2009
TRANSCRIPT
December 15th, 2009
by
Automotive intelligence covering new car prices, best car deals and more.
The Truth Will Prevail
During the last month, TrueCar acquired actual sales transaction data for more than 43% of all new vehicles sold within the United States. We continue to work to grow this number aggressively. As of November 2009, this represents more than 320,000 vehicles sold nationally in November and 4 million year-to-date.
TrueCar is insatiable about data with our goal to find 100% of all purchase transactions, even if that means finding the same transaction multiple times from multiple sources within the car-buying ecosystem.
We obtain our data directly from car dealers, respected dealer management system (DMS) providers, and well-known data aggregators within the automotive space. We also acquire vehicle configuration data, customer and dealer incentives data, financing and loan data, vehicle registration an insurance data, and much, much more.
TrueCar believes the greater our informational accuracy, the greater benefit we provide to both dealers and consumers.
Score
TrueCar Price Flex Score
1
Least Flexible 2009 Models
ModelMake
Routan
Yaris
Miata
5
CLK-Class
Toyota
Volkswagen
Mazda
Mazda
Mercedes-Benz
Lancer
Tacoma
Mitsubishi
Toyota
SLK-ClassMercedes-Benz
Accord
Titan
Honda
Nissan
8
1
11
11
12
12
15
16
16
17
93
98
89
87
82
82
82
81
80
80
Score
Most Flexible 2009 Models
ModelMake
Aspen
Cooper
Yukon
A5
Sebring
Mini
Chrysler
GMC
Audi
Chrysler
Tahoe
3-Series
Chevrolet
BMW
7-SeriesBMW
GX 470
Entourage
Lexus
Hyundai
What is the TrueCar Price Flex Score?
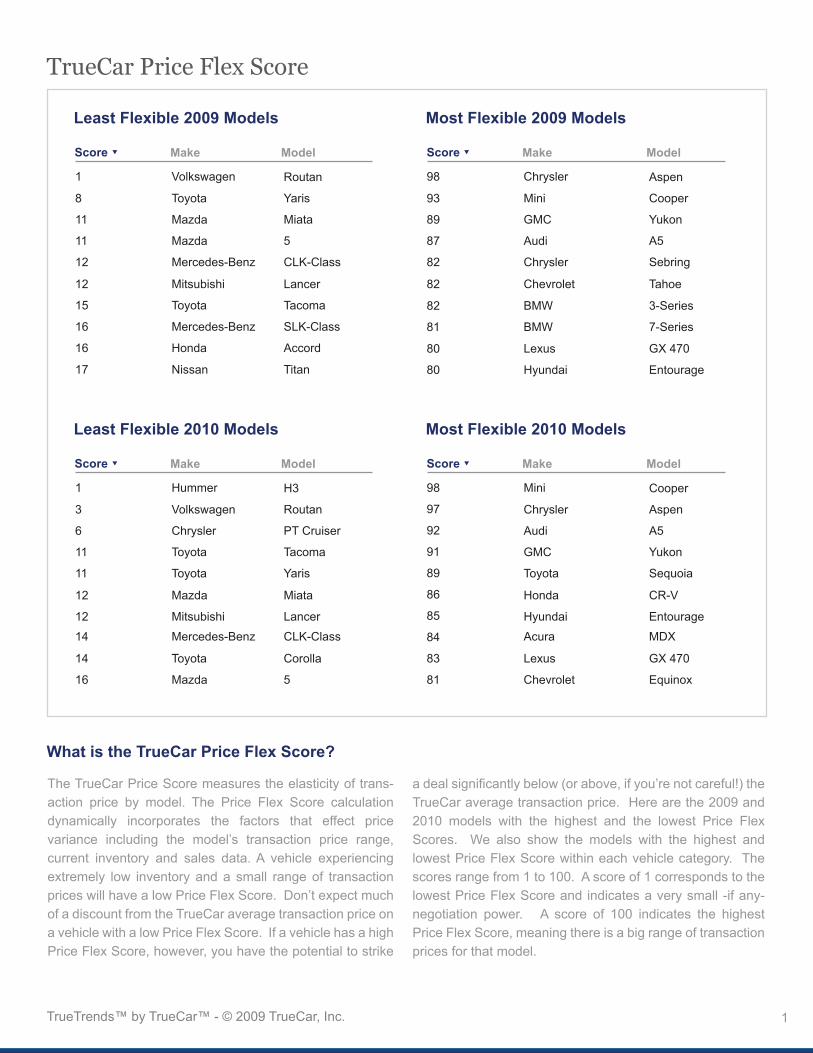
The TrueCar Price Score measures the elasticity of trans-action price by model. The Price Flex Score calculation dynamically incorporates the factors that effect price variance including the model’s transaction price range, current inventory and sales data. A vehicle experiencing extremely low inventory and a small range of transaction prices will have a low Price Flex Score. Don’t expect much of a discount from the TrueCar average transaction price on a vehicle with a low Price Flex Score. If a vehicle has a high Price Flex Score, however, you have the potential to strike
a deal significantly below (or above, if you’re not careful!) the TrueCar average transaction price. Here are the 2009 and 2010 models with the highest and the lowest Price Flex Scores. We also show the models with the highest and lowest Price Flex Score within each vehicle category. The scores range from 1 to 100. A score of 1 corresponds to the lowest Price Flex Score and indicates a very small -if any- negotiation power. A score of 100 indicates the highest Price Flex Score, meaning there is a big range of transaction prices for that model.
Score
Least Flexible 2010 Models
ModelMake
H3
Routan
PT Cruiser
Tacoma
Yaris
Volkswagen
Hummer
Chrysler
Toyota
Toyota
Miata
Lancer
Mazda
Mitsubishi
CLK-ClassMercedes-Benz
Corolla
5
Toyota
Mazda
3
1
6
11
11
12
12
14
14
16
97
98
92
91
89
86
85
84
83
81
Score
Most Flexible 2010 Models
ModelMake
Cooper
Aspen
A5
Yukon
Sequoia
Chrysler
Mini
Audi
GMC
Toyota
CR-V
Entourage
Honda
Hyundai
MDXAcura
GX 470
Equinox
Lexus
Chevrolet
TrueTrends™ by TrueCar™ - © 2009 TrueCar, Inc.
TrueCar Price Flex Score (continued...)
2
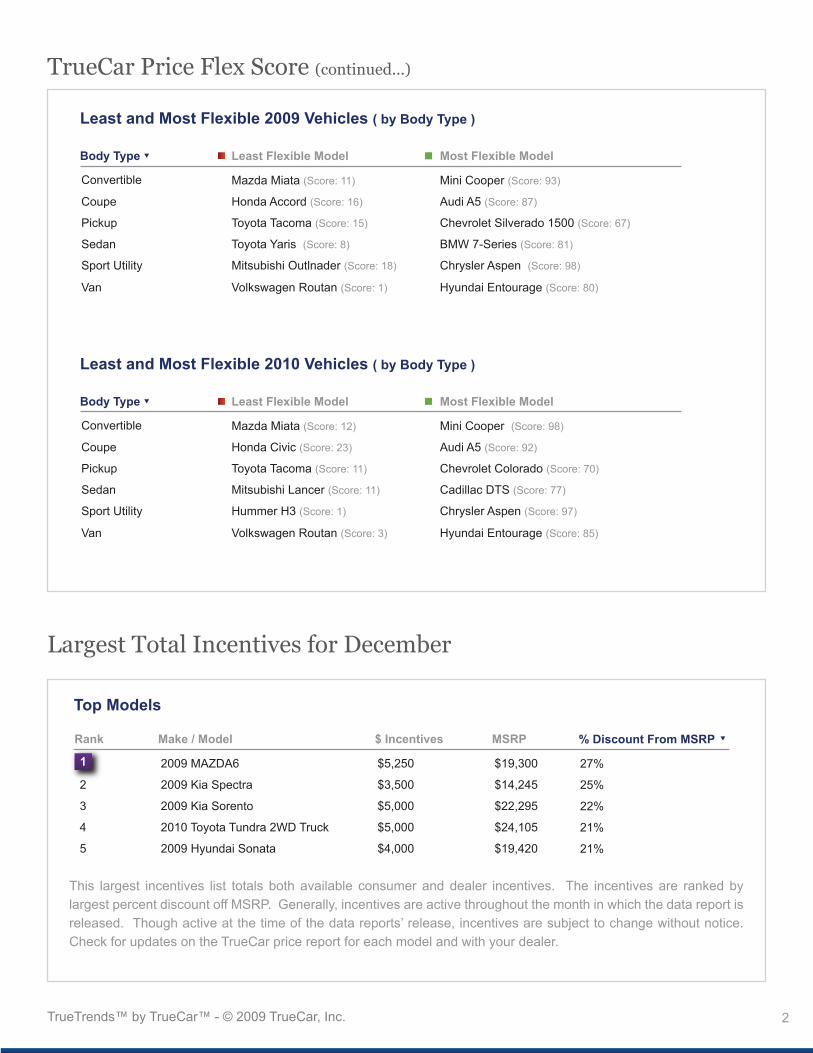
Least and Most Flexible 2009 Vehicles ( by Body Type )
Least Flexible ModelBody Type
Mazda Miata (Score: 11)
Honda Accord (Score: 16)
Toyota Tacoma (Score: 15)
Toyota Yaris (Score: 8)
Mitsubishi Outlnader (Score: 18)
Coupe
Convertible
Pickup
Sedan
Sport Utility
Volkswagen Routan (Score: 1)
Most Flexible Model
Mini Cooper (Score: 93)
Audi A5 (Score: 87)
Chevrolet Silverado 1500 (Score: 67)
BMW 7-Series (Score: 81)
Chrysler Aspen (Score: 98)
Hyundai Entourage (Score: 80)Van
This largest incentives list totals both available consumer and dealer incentives. The incentives are ranked by largest percent discount off MSRP. Generally, incentives are active throughout the month in which the data report is released. Though active at the time of the data reports’ release, incentives are subject to change without notice. Check for updates on the TrueCar price report for each model and with your dealer.
Least and Most Flexible 2010 Vehicles ( by Body Type )
Least Flexible ModelBody Type
Mazda Miata (Score: 12)
Honda Civic (Score: 23)
Toyota Tacoma (Score: 11)
Mitsubishi Lancer (Score: 11)
Hummer H3 (Score: 1)
Coupe
Convertible
Pickup
Sedan
Sport Utility
Volkswagen Routan (Score: 3)
Most Flexible Model
Mini Cooper (Score: 98)
Audi A5 (Score: 92)
Chevrolet Colorado (Score: 70)
Cadillac DTS (Score: 77)
Chrysler Aspen (Score: 97)
Hyundai Entourage (Score: 85)Van
Largest Total Incentives for December
Top Models
1
Make / ModelRank % Discount From MSRP
2009 MAZDA6 27%
2009 Kia Spectra 25%
2009 Kia Sorento 22%
2010 Toyota Tundra 2WD Truck 21%
2009 Hyundai Sonata
$ Incentives
$5,250
$3,500
$5,000
$5,000
$4,000
MSRP
$19,300
$14,245
$22,295
$24,105
$19,420
2
3
4
5 21%
TrueTrends™ by TrueCar™ - © 2009 TrueCar, Inc.
Greatest Discounts
3
1
Make
Top 2009 Makes Top 2010 Makes
Top 2009 Models Top 2010 Models
Rank % Below MSRP
Dodge 21%
Saturn 21%
Hyundai 16%
Kia 15%
Chevrolet
2
3
4
5 14%
1
MakeRank % Below MSRP
Ford 11%
Lincoln 10%
Chrysler 10%
Mercury 9%
Volvo
2
3
4
5 9%
1
Make / ModelRank % Below MSRP
Saturn Aura 24%
Nissan Titan 24%
Dodge Ram 1500 24%
Dodge Charger 22%
Hyundai Sonata
2
3
4
5 21%
1
Make / ModelRank
Ford RangerFord Ranger 17%
Jeep Grand Cherokee 15%
Jeep Commander 14%
Ford Explorer 14%
Mercury Grand Marquis
2
3
4
5 13%
% Below MSRP
Top 2009 Makes
% B
ELO
W M
SRP
5%
10%
15%
20%
25% DodgeSaturnHummerHyundaiKia
August September October November
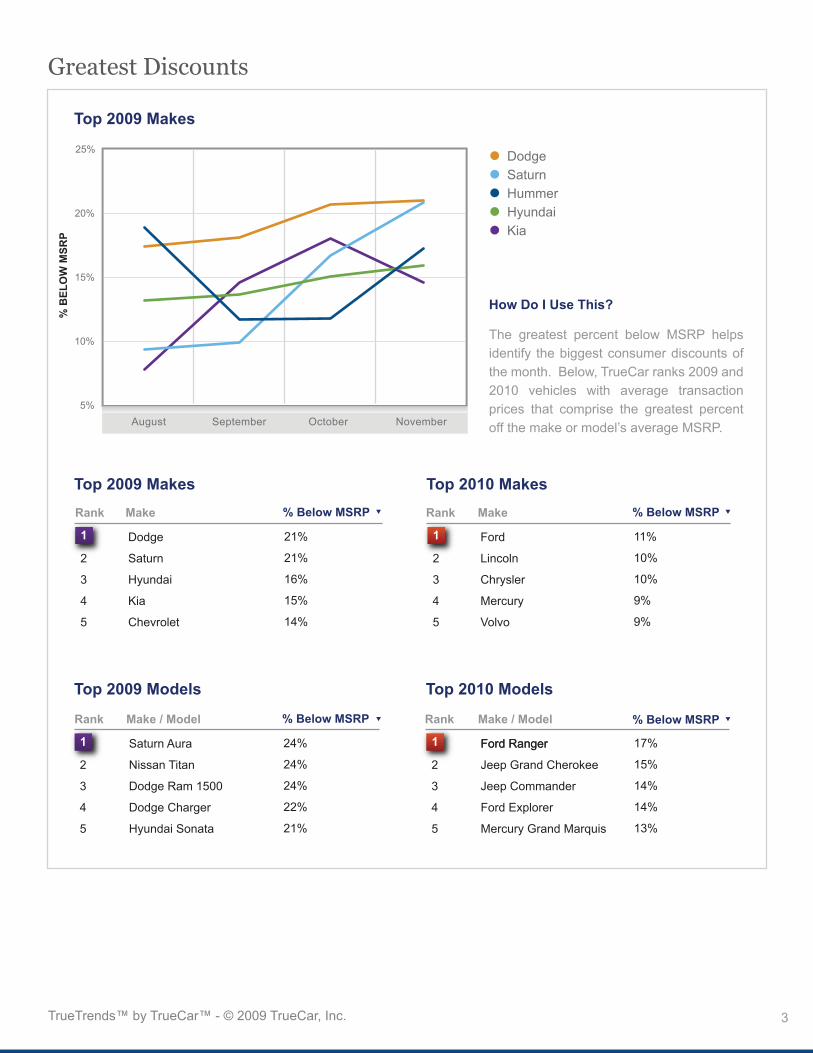
How Do I Use This?
The greatest percent below MSRP helps identify the biggest consumer discounts of the month. Below, TrueCar ranks 2009 and 2010 vehicles with average transaction prices that comprise the greatest percent off the make or model’s average MSRP.
TrueTrends™ by TrueCar™ - © 2009 TrueCar, Inc.
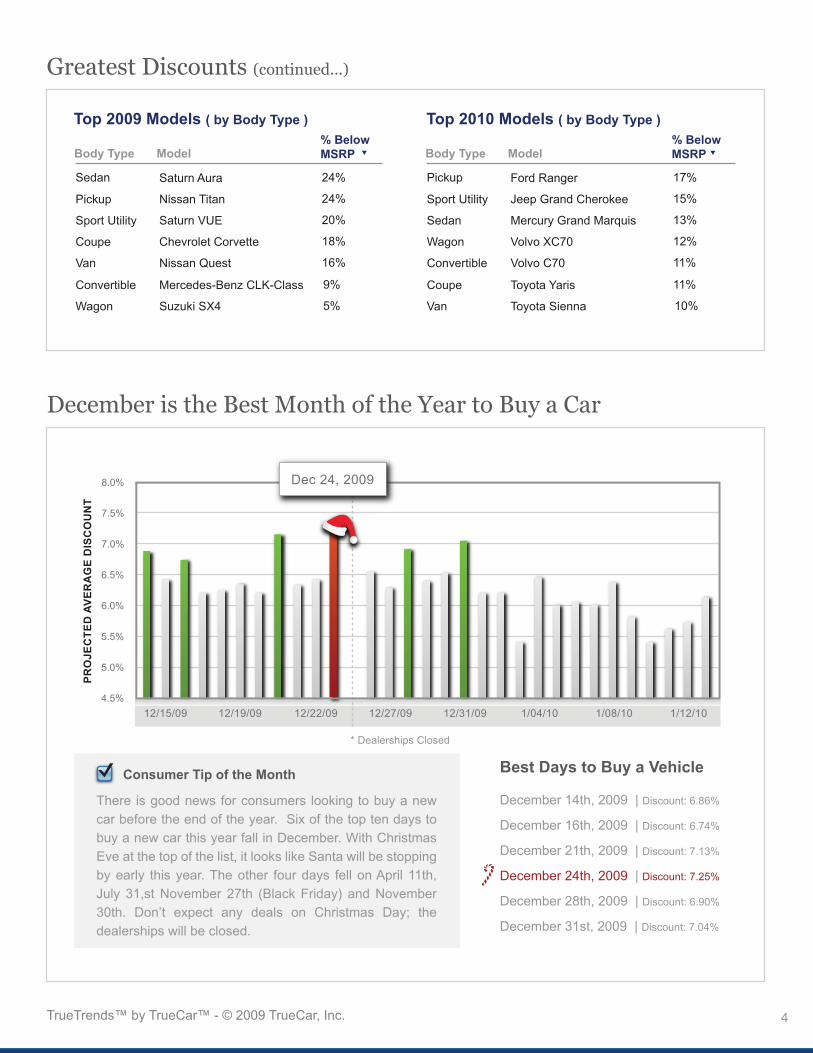
Greatest Discounts (continued...)
Top 2009 Models ( by Body Type ) Top 2010 Models ( by Body Type )
4
ModelBody Type% Below MSRP
Saturn Aura 24%
Nissan Titan 24%
Saturn VUE 20%
Chevrolet Corvette 18%
Nissan Quest
Pickup
Sedan
Sport Utility
Coupe
Van 16%
Mercedes-Benz CLK-Class 9%
Suzuki SX4 5%
Convertible
Wagon
ModelBody Type% Below MSRP
Ford Ranger 17%
Jeep Grand Cherokee 15%
Mercury Grand Marquis 13%
Volvo XC70 12%
Volvo C70
Sport Utility
Pickup
Sedan
Wagon
Convertible 11%
Toyota Yaris 11%
Toyota Sienna 10%
Coupe
Van
December is the Best Month of the Year to Buy a Car
Consumer Tip of the Month
There is good news for consumers looking to buy a new car before the end of the year. Six of the top ten days to buy a new car this year fall in December. With Christmas Eve at the top of the list, it looks like Santa will be stopping by early this year. The other four days fell on April 11th, July 31,st November 27th (Black Friday) and November 30th. Don’t expect any deals on Christmas Day; the dealerships will be closed.
PRO
JEC
TED
AVE
RA
GE
DIS
CO
UN
T
4.5%
5.0%
5.5%
6.0%
6.5%
7.0%
7.5%
8.0%
12/15/09 12/19/09 12/22/09 12/27/09 12/31/09 1/04/10 1/08/10 1/12/10
Best Days to Buy a Vehicle
December 14th, 2009 | Discount: 6.86%
December 16th, 2009 | Discount: 6.74%
December 21th, 2009 | Discount: 7.13%
December 24th, 2009 | Discount: 7.25%
December 28th, 2009 | Discount: 6.90%
December 31st, 2009 | Discount: 7.04%
* Dealerships Closed
Dec 24, 2009
TrueTrends™ by TrueCar™ - © 2009 TrueCar, Inc.

Top Vehicles ( by Body Type )
Top Vehicles (overall)
Greatest Price Drop Month Over Month
1
Year / Make / Model / TrimRank $ Drop From Last Month
2010 Jeep Grand Cherokee 4WD 4dr Laredo -$1,583
2009 Dodge Ram 1500 4WD Quad Cab 140.5" Sport -$1,567
2010 Ford F-150 4WD SuperCrew 157" XLT -$1,266
2010 Jeep Liberty 4WD 4dr Limited -$1,251
2010 Jeep Patriot 4WD 4dr Sport
2
3
4
5 -$1,016
Year / Make / Model / TrimBody Type $ Drop From Last Month
2010 Jeep Grand Cherokee 4WD 4dr Laredo -$1,583
2009 Dodge Ram 1500 4WD Quad Cab 140.5" Sport -$1,567
2009 Saturn Aura 4dr Sedan I4 XE -$674
2010 Ford Mustang 2dr Coupe -$322
2010 Lexus IS 250C 2dr Conv Man
Pickup
Sport Utility
Sedan
Coupe
Convertible -$281
2010 Honda Odyssey 4dr Wagon EX -$264
2010 Hyundai Elantra Touring 4dr Wagon Auto SE -$116
Mini-van
Wagon
5
For each body type, TrueCar tracks the average transaction price for each trim and lists vehicles with the greatest drop in price month over month. TrueCar also ranks the trims with the overall greatest drop in price from November 13th to December 11th.
TrueTrends™ by TrueCar™ - © 2009 TrueCar, Inc.
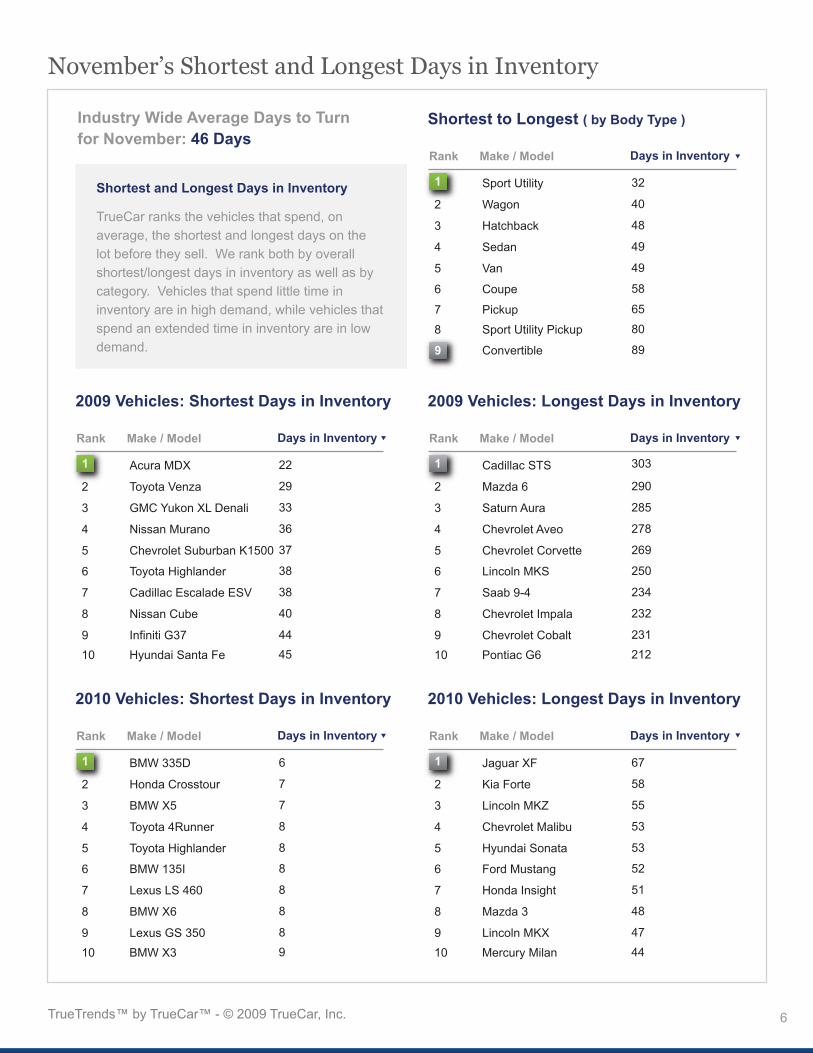
2009 Vehicles: Shortest Days in Inventory 2009 Vehicles: Longest Days in Inventory
1
Make / ModelRank Days in Inventory
Acura MDX 22
Toyota Venza 29
GMC Yukon XL Denali 33
Nissan Murano 36
Chevrolet Suburban K1500
2
3
4
5 37
Toyota Highlander 38
Cadillac Escalade ESV 38
Nissan Cube 40
Infiniti G37
6
7
8
9 44
Hyundai Santa Fe10 45
1
Make / ModelRank Days in Inventory
Cadillac STS 303
Mazda 6 290
Saturn Aura 285
Chevrolet Aveo 278
Chevrolet Corvette
2
3
4
5 269
Lincoln MKS 250
Saab 9-4 234
Chevrolet Impala 232
Chevrolet Cobalt
6
7
8
9 231
Pontiac G610 212
Shortest to Longest ( by Body Type )Industry Wide Average Days to Turn for November: 46 Days
Shortest and Longest Days in Inventory 1
9
Make / ModelRank Days in Inventory
Sport Utility 32
Wagon 40
Hatchback 48
Sedan 49
Van
2
3
4
5 49
Coupe 586
Pickup 65
Sport Utility Pickup
7
8 80
Convertible 89
2010 Vehicles: Shortest Days in Inventory 2010 Vehicles: Longest Days in Inventory
1
Make / ModelRank Days in Inventory
BMW 335D 6
Honda Crosstour 7
BMW X5 7
Toyota 4Runner 8
Toyota Highlander
2
3
4
5 8
BMW 135I 8
Lexus LS 460 8
BMW X6 8
Lexus GS 350
6
7
8
9 8
BMW X310 9
1
Make / ModelRank Days in Inventory
Jaguar XF 67
Kia Forte 58
Lincoln MKZ 55
Chevrolet Malibu 53
Hyundai Sonata
2
3
4
5 53
Ford Mustang 52
Honda Insight 51
Mazda 3 48
Lincoln MKX
6
7
8
9 47
Mercury Milan10 44
November’s Shortest and Longest Days in Inventory
TrueCar ranks the vehicles that spend, on average, the shortest and longest days on the lot before they sell. We rank both by overall shortest/longest days in inventory as well as by category. Vehicles that spend little time in inventory are in high demand, while vehicles that spend an extended time in inventory are in low demand.
6TrueTrends™ by TrueCar™ - © 2009 TrueCar, Inc.

Percent Industry Share of Model Year Vehicles
Model Year Share shows the percentage share of 2009 model year vehicles sold within the last month versus vehicles of any other model year sold. Gen-erally, the higher the model year share value, the higher the discount a consumer can expect to receive on that given model. It also reflects that dealers are more likely to cut deals on a 2009 model in order to make room for a 2010. At this time of the year, consumers should look for models with a 2009 model year share of 50% or greater.
Model Year Share
Highest Percentage of 2009 Vehicles Sold
7
Lowest Percentage of 2009 Vehicles Sold
Make / ModelRank % of Sales
67%2010 Vehicles
33%2009 Vehicles
Between 2009 and 2010 vehicles, 2010 shares 67% of total sales.
1 Subaru Outback 0.1%
Toyota Corolla 0.2%
Ford Fusion 0.2%
Toyota Sienna 0.3%
Toyota Tundra 2WD Truck
2
3
4
5 0.3%
Chevy Equinox 0.5%
Volvo V70 0.9%
Nissan Armada 1.0%
Lexus LX 570
6
7
8
9 1.2%1.2%
1
Make / ModelRank
GMC Sierra 2500HD
Chevy Silverado 2500HD
GMC Yukon XL
Mazda MX-5 Miata
Cadillac DTS
2
3
4
5
Chevy Suburban
Toyota Venza
Chevy Avalanche
Chevy Tahoe
6
7
8
9Dodge Ram 150010
% of Sales
99.6%
99.3%
98.3%
98.2%
97.8%
97.4%
97.3%
97.0%
96.8%96.6%10 Toyota Camry
TrueTrends™ by TrueCar™ - © 2009 TrueCar, Inc.
TrueTrends™ by TrueCar™ - © 2009 TrueCar, Inc. 8
Appendix
About Us
TrueCar (www.truecar.com) is the authority in new-car pricing. It aggregates multiple data sources to show car buyers and dealers how much people actually paid for a particular car in their geographic area. It is offered online, free of charge - so anyone can know at any time what is considered a good or great price. Consumers no longer walk into the dealership only partially informed and fully suspicious: they walk in knowing exactly the price of a fair deal. Dealers gain real-time, unbiased information about
Contact Us
TrueCar Inc.225 Santa Monica Blvd, 6th FloorSanta Monica, CA 90401(800) [email protected]
Visit us at www.truecar.com
marketplace pricing, helping them know how to price their cars to sell more and gain market share from other dealers. Led by a highly experienced team from the automotive and technology industries, TrueCar is based in Santa Monica, California.
Disclaimer
This report and the information contained herein is for your noncommercial, personal use on an “as-is, as available” basis and may be used by you for informational purposes only. TrueCar makes no representations or warranties, express or implied, with respect to the information contained in this report and the results of the use of such information, including but not limited to implied warranty of merchantability, fitness for a particular purpose, and non-infringement. The information contained in this report may
include technical inaccuracies or typographical errors. Neither TrueCar nor any of its parents, subsidiaries, affiliates, or their respective partners, officers, directors, employees, or agents shall be held liable for any damages, whether direct, incidental, indirect, special, or consequential, including without limitation lost revenues or lost profits, arising from or in connection with your use or reliance on the information presented in this report.