trust and the democratic temperament
TRANSCRIPT

Uslaner, The Moral Foundations of Trust, Chapter 8-1
CHAPTER 8
Trust and the Democratic Temperament
It’s difficult to have a civil society when the country is corrupt and criminalized....
When society is under stress, it’s not a good time to talk about civil society. You
need stability....Now, we are just surviving. We don’t have enough energy, time,
and money for this. It’s hard times, like during the war, and you have to survive
on your own.
Russian pollster Masha Volkenstein, quoted in Hoffman (1996, A40)
Some years ago the noted novelist E. M. Forster (1965, 70) gave “Two Cheers for
Democracy”:
...one because it admits variety and two because it permits criticism. Two cheers
are quite enough: there is no occasion to give three. Only Love the Beloved
Republic deserves that.
Perhaps there is a reason for a third cheer. Democratic societies are trusting societies.
The big pay-off from interpersonal trust, most contemporary observers say, is that it leads
to “better” government and to a public that is happier with government performance. Or maybe
good government makes people more likely to trust each other. Or perhaps both.
Here I seek to examine, in a broader, cross-national context, the causes and consequences
of trust. More specifically, I shall show that the same arguments made about the effects of trust in
American society and its polity apply more generally across nations. A host of factors have been

Uslaner, The Moral Foundations of Trust, Chapter 8-2
cited as potential determinants of trust, including education levels, media usage, a strong legal
system, corruption, and the foundation of a civil society, membership in voluntary organizations.
And trust is held by many to be the hallmark of democratic societies. If you could bolster
education, reduce television viewing, reform the judicial system, combat high-level corruption, get
more people involved in voluntary organizations, and tinker with the constitutional system to
make it “more democratic,” you could get a more trusting society–with all of the benefits that go
with it. Wrong. Many of these “causes” have no effect in multivariate analysis. Others are more
likely to be effects than determinants. When all is said and done, trust depends upon a supportive
political culture and especially on a base of economic equality. Culture has a long shadow of
history and cannot be readily changed. Economic equality is more malleable, but it seems to
change slowly over time. It does not seem to be much easier to change trust at the aggregate
level than for individuals.
The big pay-off for trust in the United States is a more engaged citizenry, greater
toleration, and a more productive government (see Chapter 7). A more trusting citizenry is more
cooperative and government seems to run more smoothly. Even though there is little direct
connection between trust in people and faith in government, there might be an indirect linkage
through improved governmental performance. This linkage was originally formulated by Putnam
(1993). Trust, he argues, is what makes democracy work. A more trusting society leads to a
cooperative spirit among the public and to a more participatory population. An active population,
mostly through voluntary organizations, is more able to make demands on government, to keep it
honest and responsive. And an honest and responsive government will bring its citizens greater
prosperity.

Uslaner, The Moral Foundations of Trust, Chapter 8-3
Putnam’s argument about trust and governmental performance is mostly correct. Trust
does lead to better government performance and greater prosperity. But it does so without the
“middleman” of an active citizenry. As I argued in Chapters 2 and 5, joining civic groups may be
all to the good, but they do not produce trust. Now we see that they do not produce better
government either. Instead, the link between governmental performance and trust is direct.
A more cooperative spirit leads people to invest their governments with the power and
authority to spend more on those who have less. Trusting societies also redistribute wealth from
the haves to the have-nots. And trust in people also leads to a more responsive and efficient
government. Trusting societies develop strong legal systems that gain the confidence of citizens.
The opposite dynamic–strong legal systems leading to greater trust–does not hold. Trusting
societies also have less corrupt governments. Trusting societies are also more open to free trade
(see Chapter 7 for American public opinion)–so the cooperative spirit leads to greater wealth as
well (Putnam, 1993, 180; Woolcock, 1998).
Trust, then, really is the chicken soup of much of social life. It is not an all-purpose elixir,
but it has many important consequences. I shall detail them below, noting that they hold primarily
for countries without a legacy of Communism. But as I show how trust is important, note what is
not so critical for government performance: voluntary associations and democratization. It is
trust, rather than civic engagement, that brings us so many good consequences. And it is trust,
not democratization, that gives us better government. Reformers go from country to country
tinkering with constitutions and seeking to instill a participatory spirit in people. Yet, there is
little evidence that either will make a society work better. It is easy to make a democracy, as
Mueller (1999) argues. It is tougher to make a democracy work (Putnam, 1993). That is the task

Uslaner, The Moral Foundations of Trust, Chapter 8-4
of trust.
Three Cheers for Democracy?
There is close to a consensus in theoretical and empirical cross-national discussions of
trust that there is a link between democracy and generalized trust (Levi, 1998, 96; Offe, 1997, 26;
Rahn, Brehm, and Carlson, 1997, 24; Putnam, 1993, 111-115; Rothstein, in press; Stolle, 1999b,
9). Democratic institutions are the foundation of a civil society. Democracy promotes the rule of
law. When people feel that their government treats them fairly, they will also believe that their
fellow citizens are trustworthy. Democracies can change preferences by structuring the range of
acceptable choices in a society, Levi argues. She does not specify how these changes occur, but
seems to argue that democracy empowers people who don’t control many resources. When
political leaders need to rely upon the mass citizenry for political support, they are not free to
adopt policies that enrich themselves (corruption) or the dominant interests in a society (economic
stratification).
Democracies also establish strong legal systems. The courts in democratic regimes relieve
individual citizens of the burden of monitoring the trustworthiness of other people. When people
know that they will be treated fairly, they will develop respect for the legal system (Tyler, 1990)
and realize that they must behave honestly themselves (Levi, 1998).
Corrupt governments set bad examples for the types of behavior that will be tolerated
from the citizenry. The most corrupt countries have the least trusting citizens.1 This is hardly
surprising, since “kleptocracies” send clear messages to the people that crime does pay.2 Citizens
feel free to flout the legal system, producing firmer crackdowns by authorities and leading to what
Putnam (1993, 115) calls “interlocking vicious circles” of corruption and mistrust.

Uslaner, The Moral Foundations of Trust, Chapter 8-5
Honest government both establishes a model for ethical behavior and enforces those
standards. When governments are either repressive or corrupt, they send signals to citizens that
honesty may not be the best policy. There is little debate over whether democracy and trust go
together. The big question seems to be whether democracy causes trust (Muller and Seligman,
1994) or trust causes democracy (Inglehart, 1997, ch. 6).
I am part of a small coterie that challenges this conventional wisdom (cf. Mueller, 1999;
Rosenblum, 1998). Just as trust in government does not lead to generalized trust (see Chapter 5),
neither does democracy. Some democracies have lots of trusting citizens, others have relatively
few. Authoritarian states can destroy trust–but you can’t build trust by changing institutions.
The formerly communist states of Eastern and Central Europe actually became less trusting as
they became more democratic.3 An Indian journalist commented on the sharp cleavages that led
to a cycle of unstable coalitions, none of which could form a government: “We have the hardware
of democracy, but not the software, and that can’t be borrowed or mimicked” (Constable, 1999,
A19).
Trust across countries, like trust in the United States, depends more on values (culture)
and the distribution of resources (economic equality) than on political institutions. There is little
evidence that trust depends either on democracy or on the level of group membership in a
country. Trust instead depends (in varying specifications) on optimism, economic equality, and
the basic values and beliefs among the population. Countries with large Protestant populations
are more trusting and more egalitarian. The “Protestant ethic” is an individualistic creed: To
succeed in a competitive world, we need to rely upon other people. In collectivist societies,
people can rely upon their peer groups and get by with particularized trust. In individualistic

Uslaner, The Moral Foundations of Trust, Chapter 8-6
societies, generalized trust becomes essential (Tocqueville, 1945, 98).
Cross-nationally, as well as in the United States, trust helps to bring about good
things–better functioning government and more redistribution from the rich to the poor. They
have more open economies and have higher growth rates. Countries with many generalized
trusters have more efficient judiciaries and bureaucracies. They also have less corruption and
their citizens have more confidence in the legal system (LaPorta et al., 1997, 335; Putnam, 1993,
111).
Yet neither honest governments nor legal systems that meet with popular approval create
trust. Honest government depends upon a foundation of generalized trust. Trusting people have
confidence in their laws because they know that they don’t have to rely upon the strong arm of
the law as a matter of course (cf. Macauley, 1963, 58, 60). Trust leads to empathy with
others–and thus a respect for the law. Statutes simply ratify the moral codes that trusters strongly
endorse (see Chapter 7).
Even the linkage between corruption and trust in other people is not the creation of the
state. While there is no gainsaying the sizeable correlation between the two, the direction of
causality goes from trust to cooperation. Political leaders are not quite so free to rob the public
purse in high trust societies. They can only get away with their con games when many people
already don’t trust one another
Trusters also have an expansive view of their moral community–and feel that people who
are less fortunate need to have a social safety net. So countries with many trusters have strong
states that redistribute resources from the rich to the poor. Trusting publics will also produce
more responsive governments and are more likely to adopt policies that will promote economic

Uslaner, The Moral Foundations of Trust, Chapter 8-7
equality–and thus create more trust.
States don’t create trust–and neither does confidence in the state. Our faith in government
reflects our estimation of how well our leaders are performing their jobs. We pledge our
allegiance to our leaders only when we have a reasonable expectation of “ethical reciprocity” from
them (Levi, 1998, 86-88). Yet, this is precisely not what we mean when we place faith in other
people, as I have emphasized in Chapters 2 and 4. It initially seems reasonable that people who
trust government would also trust other people–and vice versa. But a little reflection will show
such reasoning to be misplaced. We have come a long way from strategic trust, which I discussed
at length in Chapter 2 and then largely dismissed as unrelated to my larger themes. Here I come
back to it, showing that trust in government is contingent and depends upon what we know about
our leaders and how we come to evaluate them. Trust in other people is not contingent upon our
expectations of others. We demand evidence of trustworthiness from our leaders, perhaps
because many have proven to be unworthy of our confidence. We are more willing to make leaps
of faith about the good will of people we don’t know.
Societies with many trusters are more pleasant places to live. Not only are they more
equal, but they also have better performing governments (less red tape and more responsive
judiciaries). Their governments pursue policies that lead to even more equality: a larger public
sector, more transfers from the rich to the poor, and more spending on education.
Trust and Experience
Democracy and trust have an uneasy relationship. On the one hand, social trust provides
the bonds among an otherwise anonymous citizenry that, in Putnam’s (1993) felicitous title,
“makes democracy work.” You can have democracy without trust–and we often do (see below).

Uslaner, The Moral Foundations of Trust, Chapter 8-8
But effective democracy, a government where people can come together to resolve pressing
issues, may well depend upon the social bonds of trust.
On the other hand, democracy presumes distrust of authority as well. Consent in
democratic regimes is always contingent upon leaders’ fulfilling their part of a contract. Leaders
must keep their promises, perform reasonably well, and treat citizens fairly (Levi, 1998, 88). The
power of democracy is the ability to “chasten authority, to limit its claims and dangers” (Warren,
1996, 47).
A reasonable person might well conclude that most politicians can’t be trusted. And this
might not be such a bad thing if we used our skepticism wisely. One of the great virtues of
democracy, Forster argued, is that it “permits criticism.” Levi (1998, 95) goes further: It makes
consent possible by exposing venality. In a democracy we can uncover misdeeds and punish those
who perpetrate them. So it makes sense to be wary of our leaders: “...distrust may be the major
engine for an even more democratic state” (Levi, 1998, 96).4
Yet not everyone agrees that democracy is either necessary or sufficient to generate trust.
Mueller (1996, 118) argues: “...democracy...can function remarkably well even when people
exhibit little in the way of self-discipline, restraint, commitment, knowledge, or, certainly, sacrifice
for the general interest...Democracy’s genius in practice is that it can work even if people rarely, if
ever, rise above the selfishness and ignorance with which they have been so rich endowed by their
creator.” Well, yes and no. Mueller sees democracy as primarily procedural–the right of people
to complain about things that go wrong. And the only precondition for such procedural democ-
racy is the absence of “thugs with guns” (Mueller, 1996, 118). Without repressive authorities,
people will find democracy an entirely natural system. So no wonder democracies are all over the

Uslaner, The Moral Foundations of Trust, Chapter 8-9
map on trust. You don’t need trust to get to democracy and there is little reason to believe that
democratic regimes will build trust over time. Trust goes up and down in many nations over time
even as institutional structures remain the same (cf. Inglehart, 1997, 207-208).
Democracies are more trusting. A wide range of measures of democratization show that
the more democratic the constitutional structure, the more trusting citizens are. I show
correlations between trust and measures of democracy in Table 8-1. The indicators of democra-
tization I use are the measures of political freedoms, civil liberties, and the overall freedom score
developed by Freedom House and reported in Gastil (1991); updated Freedom House measures
for 1993-94 and 1998-99;5 a summary measure of Freedom House scores that links assigns each
country a democratization measure from the year closest to the trust measure in the WVS; Cop-
pedge’s (1991) indicator of polyarchy; measures of democratization reported in Bollen (1991);
Gurr, Jaggers, and Moore (1991); Vanhanen (1997), and updated scores for the Gurr measure
from LaPorta et al. (1997). The measures of trust are the most recent available figures from the
World Values Study for 63 countries over the course of the three waves of the WVS.6
_________________
Table 8-1 about here
The correlations of measures of trust with indicators of democracy are mostly modest,
though a few are robust.7 The message is simple: Democracies don’t necessarily go hand in hand
with high trust (cf. Inglehart, 1999). You can’t increase trust by making a country more
democratic. But you can destroy trust by making a country undemocratic. Authoritarian
governments that set people against each other, such as the former Communist regimes in Eastern
and Central Europe,8 can make trust hazardous. When people feel compelled to turn on their

Uslaner, The Moral Foundations of Trust, Chapter 8-10
friends lest the state turn on them, interpersonal trust may become too risky. In such a world, you
really can’t be too careful in dealing with people, even if everyone would strongly prefer to treat
others as if they were trustworthy. Even with democratic institutions in place, people living in
countries with legacies of oppression will neither trust their fellow citizens nor participate in civic
life. Instead, they will form close bonds with rather small groups of close associates, as in
Banfield’s Montegrano, and shut the rest of society off (Krygier, 1997, 56).
Democracies may be trusting or mistrusting. In countries with no legacy of Communist
rule, the mean proportion of trusters in highly democratic regimes is .411, compared to .217 in the
formerly Communist regimes. (I shall also refer to countries with no legacy of Communist rule as
“democracies” for short, fully recognizing that many of these nations have not always respected
the rights and freedoms associated with democratic regimes.) Democracies are all over the place
in trust, ranging from .03 (Brazil) to .65 (Norway). Formerly Communist regimes also vary in
trust, but only from .06 to .34. Half of all democracies have more than 34 percent trusters. The
standard deviation for democracies is .151. It is less than half that value (.062) for authoritarian
states. Democracies make trust possible. They don’t necessarily produce it. Totalitarian
governments make trust implausible, though not impossible.
Democracies have higher levels of trust because authoritarian states have lower levels of
trust. Democratic constitutions provide little guarantee–or even likelihood–of enhancing trust.
Yes, they can maintain order better because people believe that law enforcement is fair. And, yes,
democratic governments are almost assuredly more popular (and thus more trusted) than
dictatorships. But trust in the legal system or in government more generally is not the same as
faith in other people. Even in high trusting countries such as Sweden, there is only modest

Uslaner, The Moral Foundations of Trust, Chapter 8-11
support for the claim that people who have faith in the legal system also trust others (Rothstein,
2000).
There is certainly little evidence that democratization increases trust. The correlation
between change in trust in 22 nations from 1981 to the early 1990s (according to the World
Values Survey) and variations in Freedom House scores from 1978 to 1988 is effectively zero.9
So is a third cheer for democracy misplaced? Maybe not. There is some evidence that
democracy matters. Across 41 countries the correlation between the number of years of
continuous democracy (Inglehart, 1997, 172) and trust is .769. And no set of controls or
simultaneous equation estimation makes the linkage go away. One could, of course, agree with
Inglehart’s (1997, 180-188) reasonable argument that stable democracy depends upon a trusting
public. Regimes that merely give constitutional protections against state interference don’t need
an underbelly of civic responsibility (Mueller, 1996, 118). The democratic march to trust is a
long and winding road. It takes 46 years of continuous democracy to move a country from well
below the mean on trust to above it. Countries with less than 46 years of continuous democracy
are no more likely to have trusting citizens than authoritarian states. If institutions matter, their
effects are very slow–and difficult to disentangle from other changes occurring in societies.10
Nor does there appear to be a special type of institution that builds trust. The only two
measures of democracy (apart from the number of years of continuous democracy) that have
strong correlations with interpersonal trust are the Vanhanen and Gurr et al. indices. The first is
an indicator of political competition (the share of votes of the smallest party) and participation
(voting turnout). The second is a mixture of constitutional provisions (restrictions on participa-
tion, the extent of executive power, and formal guarantees of civil liberties) and behavior (how

Uslaner, The Moral Foundations of Trust, Chapter 8-12
executives are recruited and the levels of competition and openness of recruitment). While each
of the other measures also have some component of how well constitutional promises are met,
they focus more on the structural components of democracy. Yet, how well democratic institu-
tions function depend more on how long a country has been a democracy rather than on how
trusting its citizens are.11
Democratic institutions, such as they are, do little in the short-to-intermediate term to
build trust. The correlations between democratization and social trust in formerly Communist
states are minuscule. Some are even negative. Of the eight Eastern bloc countries for which we
have measurements on trust in 1990 and 1995-96, only one nation had an increase in faith in
others (Latvia, six percent), while seven had decreases, four of which were substantial.12 The
constitutions of Eastern and Central European nations have become increasingly democratic over
time. 13 As democratization proceeded apace, trust lagged behind and the correlation between
trust and democratization became increasingly (and significantly) negative.14
Trust is neither a prerequisite for nor a consequence of democracy. The democratic
revolution that swept Eastern and Central Europe a decade ago–and quickly spread through many
of the world’s remaining autocracies–did not depend upon social trust. Eastern bloc countries
with more trusting citizenries did not become democratic sooner than nations whose populations
had less faith in others. Formerly Communist countries with higher levels of trust didn’t create
polities with more political or property rights. There is even a perverse positive relationship
between trust and corruption in these nations as late as 1998.15 There is no simple explanation for
these results–though it may well be that Marxist regimes that permitted more economic inequality
placed less emphasis on ideology and more on the market. Markets depend upon trust.

Uslaner, The Moral Foundations of Trust, Chapter 8-13
Thus, democracy only effects trust in long-standing democracies. The correlations
between levels of democracy and generalized trust are almost always higher for countries with no
legacy of Communist rule than for all countries (see Table 8-1). The major exception is for the
earlier Gurr et al. index where all Communist countries had identical scores at the bottom of the
democratization scale. Democratization has no appreciable effect on trust for countries in Eastern
and Central European that formerly were authoritarian regimes. In some cases the correlation
between trust and democratization is even negative (though never significant).
Yes, many democracies in the sample have experienced authoritarian rule from time to
time (and more than from time to time): Ghana, Nigeria, India, Spain, Portugal, Greece, Turkey,
Peru, and Bangladesh are notable examples. And many “democracies” in form have not been
quite so “free”: South Africa, South Korea, Mexico, Taiwan, and the Dominican Republic (among
others) fit this pattern.
Democratization is correlated with trust for countries without a legacy of Communism
(see Table 8-1). Yet, even here, the correlations are often modest and largely reflect the
differences between countries with long-standing democratic traditions and countries that have
not been democratic quite so long. And all of these effects, except for the years of continuous
democracy, vanish in multivariate analyses. The long lag between democratization and trust in
Inglehart’s continuous democracy measure show how difficult it is, if it can be done at all, to
generate new values from a structural changes.
Trust Across Cultures
A principal reason why democratization does not lead to greater trust is that generalized
faith in others doesn’t move much at all over time. There are powerful correlations for trust over

Uslaner, The Moral Foundations of Trust, Chapter 8-14
time, ranging from .834 (1981 to 1995) to .930 (1990 to 1995). In each time period, 90 percent
of the countries experienced changes of less than 10 percent. Generalized trust simply doesn’t
change much over time. And half of the countries that experienced greater a than five percent
change from 1990 to 1995 were democratizing nations that became less trusting.16
Why, then, are some nations more trusting than others? As in the United States, the most
important determinant of trust is the level of economic inequality. Cultural factors matter as well,
as reflected in a country’s dominant religious tradition.
The more equitable the distribution of wealth in a country, the more trusting its people will
be. For countries without a legacy of Communism, the simple correlation of generalized trust and
the Gini index is -.684 (see Figure 8-1).17 Economic inequality is strongly related to trust, and
this connection does not vanish in multivariate tests. It does go away in the formerly Communist
nations of Eastern and Central Europe (where the correlation falls to -.239).18 The dynamic of
economic inequality and trust clearly works differently in democracies and authoritarian societies.
_________________
Figure 8-1 about here
I estimate two sets of models. The first has fewer cases (22), but it allows me to test the
link between trust and optimism. I have argued in Chapter 2, supported by data analysis from
surveys (Chapter 4) and over time (Chapter 6), that trust depends upon an upbeat world view.
The best cross-national measure of optimism available is the aggregate measure from the WVS on
whether people “can count on success in life.” Countries with more optimistic populations should
also have more trusting citizenries.19 However, the “count on success”measure is only available
for 26 countries without a legacy of communism. To estimate a broader model, I must drop the

Uslaner, The Moral Foundations of Trust, Chapter 8-15
measure of optimism and focus on other values.
Beyond economic inequality and optimism, I posit a cultural basis for generalized trust. I
expect that Protestant societies should be more trusting and Muslim societies less trusting.
Inglehart (1999, 92-93) argues that Protestant societies are more trusting because Protestant
churches have been more decentralized than Catholic churches. Decentralization meant local
control, especially compared to the hierarchical Catholic church. Individual congregants thus
could take on more responsibility and power within the Church (Lipset, 1990, ch. 5; Putnam,
1993, 175).20 The Protestant ethic is an individualistic philosophy, and, as I argued in Chapter 2,
generalized trust becomes more important in individualistic cultures (Weber, 1958, 105; Triandis,
1995, 126).
In contrast to my expectation of more trust in societies with large numbers of Protestants,
I expect less trust in Muslim societies. There are no societies with even 15 percent Muslims in the
smaller data set for the first estimation, so I only include the variable percent Muslim in the
second estimation. The Protestant culture is individualistic, the Muslim culture more
collectivist.21 Many Muslims find Western culture threatening and are thus less likely to trust
people unlike themselves–especially since Westerners had colonized many Muslim nations and
tried to convert Muslims to Christianity. Muslims also see themselves as a community apart:
Non-Muslims, according to Islamic law, belong to a “second class” of citizens, who must
acknowledge the supremacy of Islam and who stand apart from the majority of Muslims, and thus
removed from Muslims’ moral community (Esposito, 1991, 291).
Societies that are most heavily Protestant (Norway, Iceland, Denmark, and Finland) are 28
percent more trusting than the least (Spain, Italy, Belgium). And the country with the most

Uslaner, The Moral Foundations of Trust, Chapter 8-16
Muslims (Bangladesh) is 16 percent less trusting than nations with no Muslims (distributed
throughout Latin America, Asia, and Europe). To be sure, there are few countries with large
shares of Muslims in the WVS surveys–and the countries included are hardly representative.22
Nevertheless, the results below do conform to theoretical expectations; they warrant further
investigation as the number of WVS countries expands.
In the first estimation, I average the aggregate proportion of trusters in the 1981 and
1990-93 WVS samples in each country, using only countries without a legacy of communism.23
In the second I use the most recent estimate of trust, using either the 1990-93 or the 1995-96
wave. Knack (1999) argues that the causal arrow runs from trust to inequality--rather than from
inequality to trust, as I argue. To test this claim, I estimate simultaneous-equation models to see
whether trust is both the cause and effect of economic inequality.24
The first model for economic inequality includes trust and measures of economic growth,
redistribution by the government, and individualism. (Individualistic societies should be more
egalitarian.) These variables did not fare so well in the second estimation. Instead, I include the
population growth rate, the percent Muslim, and a measure of corruption (the log of the black
market currency value). Countries with more Muslims may be less trusting, but they are more
egalitarian (cf. Esposito and Voll, 1996, 25).25 And the final variable in the model indicates that
the unofficial economy perpetuates inequality. The key point of this exercise is not to explain
income inequality across countries, but rather to determine whether more trust also leads to a
more equitable distribution of income–or whether the causal connection goes only from equality
to trust. I report the estimations in Tables 8-2 and 8-3.26
________________________

Uslaner, The Moral Foundations of Trust, Chapter 8-17
Tables 8-2 and 8-3 about here
In both models, economic inequality is a powerful predictor of trust. Yet, trust has no
effect on economic inequality. The direction of causality goes only one way. In the first model,
inequality lags behind the percent Protestant as a predictor of trust. But in the second model,
with more cases, it is by far the strongest determinant of trust. There is also support for the idea
that optimism matters in the first model. There are more trusters in countries where many people
expect to achieve success in life. And there are fewer trusters (model II, Table 8-2) in Muslim
countries. In countries without a legacy of communism, trust depends upon a mixture of
economic inequality, optimism, and culture. The statistical models perform admirably, accounting
for between three quarters and 83 percent of the cross-national variation in trust.
Inequality does not depend upon trust. Instead, it reflects some cultural factors--Muslim
societies and individualistic cultures are more equal–as well as economic conditions (the growth
rate of the economy and the population), government policy (transfers), and corruption.
Inequality is more of a cause of trust than a consequence. Yet, governments seem to have the
wherewithal to reduce inequality through redistributive spending. And this suggests that by
boosting equality, they can at least indirectly increase trust. And this is fortunate, since there is
little we can do to change culture. Interpersonal trust has been rising in Sweden, from moder-
ately high to very high levels (Rothstein, in press). And economic inequality has been falling.27
The longer-term cultural variables don’t change much over time.
There is evidence that the causal connection that starts with inequality, goes through
optimism, and winds up with trust holds cross-nationally. It is not quite as strong as in the United
States, which might be expected since optimism may be more ingrained into American culture

Uslaner, The Moral Foundations of Trust, Chapter 8-18
than it is elsewhere. Cross–nationally, expectations for success do not track levels of inequality
across cultures. But they are strongly related to the overall wealth of a society as measured by
the log of the gross national product) and a measure of the “total quality of life” offered by
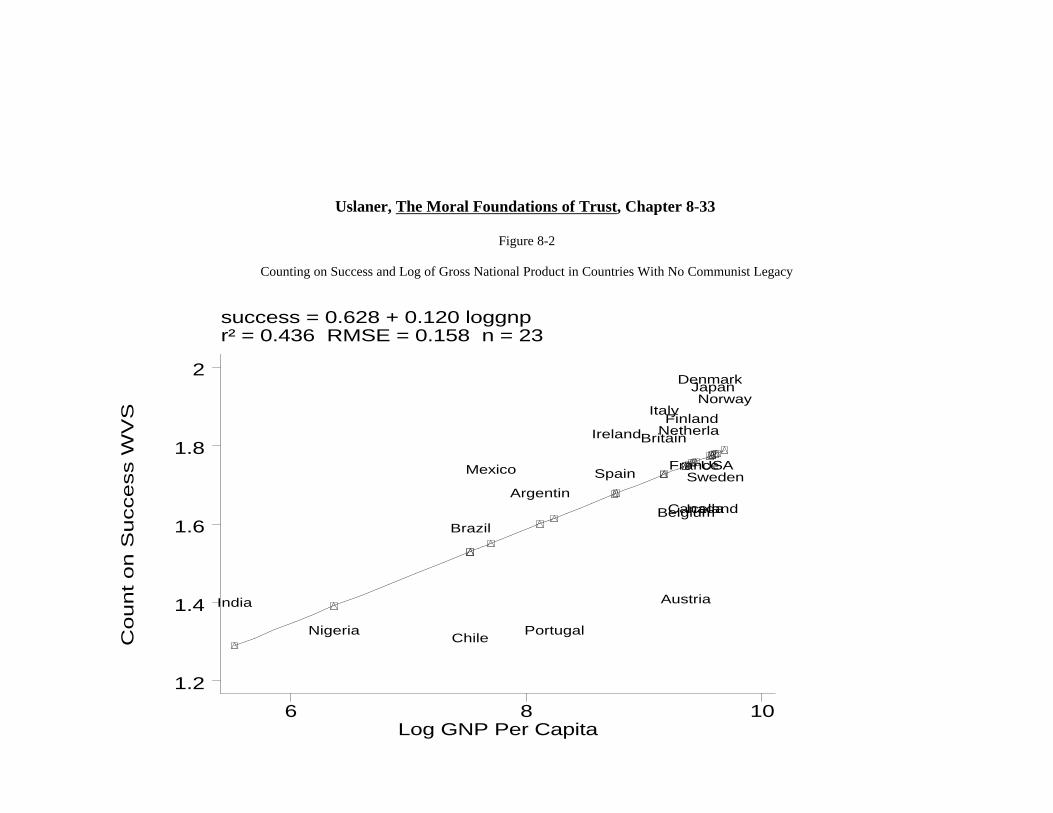
Diener.28 I present graphs of these two relationships in Figures 8-2 and 8-3. In addition to these
measures, expectations of success also vary with the infant mortality rate, how many years of
school the average person has had, and life expectancy.29
________________________
Figures 8-2 and 8-3 about here
Trust is essentially cultural, but, like culture itself, is shaped by our experiences. Ultimately
culture, economics, and politics are all intertwined, so it is well near impossible to establish a
simple causal ordering. What does stand out from the results in this chapter is that culture (and
likely economics and politics) shapes institutions more than it is (they are) formed by formal
structures.
What Doesn’t Matter
Skeptical readers might think that the models for trust may appear to leave out a lot.
Inglehart (1999), for example, argues that rich nations are trusting, poor countries more distrust-
ful. Putnam’s (1993) logic goes the other way around: Trust brings economic growth and
prosperity. We can argue either way around, but there ought to be a connection between trust
and wealth. Beyond simple measures of riches, there are several other reasonable correlates of
trust: education levels, poverty rates, infant mortality,30 life expectancy, the fertility rate, ethnic
diversity, postmaterial values, media exposure, and civic engagement. Are these factors also
associated with trust across democracies?

Uslaner, The Moral Foundations of Trust, Chapter 8-19
Perhaps the most important possible determinant of trust that I have left out so far is civic
engagement. Trust, Putnam (1993, 180) argues, may lead to better government performance, but
faith in others rests upon the foundation of an engaged citizenry. To increase trust, we must get
people involved in their communities and polities.
Trusting societies are participatory societies–though trust is not sufficient to generate
participation. More critically, trusting societies have “better” government, as Putnam (1993)
argued. Governmental institutions in trusting countries perform better. They are simply more
efficient. Corruption is less rampant in trusting societies. And, perhaps most critically, even
though trust does not lead to social equality, it is a pathway to policies that can reduce income
disparities between the rich and the poor–and, thus, boost trust in turn.
At least in democracies, membership in all organizations and secular groups are correlated
with trust. So is turnout in elections. In multivariate analyses, trust is neither the cause nor the
effect of civic engagement.31 Group membership is highest in wealthy individualistic cultures (cf.
Triandis et al., 1988), and trust has nothing significant to add beyond these factors.32 Mueller
(1996, 117-118) is certainly correct when he says that “...democracy is at base a fairly simple
thing–even a natural one. If people feel something is wrong, they will complain about it...”. You
don’t need trust to be willing to petition the government. Indeed, the simple correlation between
faith in others and willingness to petition is negative.33 All you need is something to complain
about, a feeling that the authorities are not responsive enough, and no thugs with guns. You
don’t need trust.
Another likely source of trust is ethnic homogeneity. Knack and Keefer (1997, 1278-
1279) argue that ethnically diverse societies are more likely to develop sharp cleavages–which, in

Uslaner, The Moral Foundations of Trust, Chapter 8-20
turn, destroys trust. I showed in Chapter 4 that parents who wanted their children to hold values
that emphasize the welfare of others are more likely to trust other people. Inglehart (1999)
extends this logic: People whose own values are less materialistic (or postmaterialistic) should
also be more trusting.34 He finds support for this argument only in the 15 richest nations. Putnam
(1995b) tracks changes in trust in the United States to increased viewing of television and a drop
in newspaper readership. Newspapers tie us to other people, while television keeps us inside our
homes, away from civic engagement. We might also expect that countries that rank high on
corruption will also have less trust (LaPorta et al., 1997, 335). If others are untrustworthy, why
should I play the fool, a reasonable person might ask? All of these arguments are reasonable and
none of them hold. Various measures of income, education, and well-being all fall to insignifi-
cance in multivariate analyses.35
All of the measures of income and well-being fall to the greater explanatory power of
economic inequality. Postmaterialist values are only modestly correlated with trust. All forms of
media exposure, including television viewing, are positively related to trust. Television viewing
supposedly destroys trust (Gerbner et al., 1980; Putnam, 1995b). Yet, in the aggregate analysis,
it seems to increase trust. But all of these relationships vanish too in multivariate tests.36
When I tell people about the connection between trust and inequality and why it explains
the high levels of faith in others in Scandinavian countries and in the American states of Minne-
sota and the Dakotas (cf. Rice and Feldman, 1997), at least one skeptic always points to ethnic
homogeneity as an alternative thesis. It is easy to trust other people in a homogenous society. Of
course, most people can be trusted. They look and think just like you do. And, yes, the
Scandinavian countries are more homogenous,37 but they are more egalitarian and especially more

Uslaner, The Moral Foundations of Trust, Chapter 8-21
heavily Protestant.38 Interpersonal trust in Sweden has been increasing, not declining (Rothstein,
in press), even as the society is becoming less demographically homogenous.39 Overall, ethnic
diversity does not shape trust–or, even, indirectly, economic inequality.40 Scandinavian societies
are trusting because they are more equal and more Protestant, not just because they are all blond
with blue eyes. A society doesn’t need to be predominantly Protestant to be trusting. Even a
small share such as 16 percent is enough to boost generalized faith significantly (to 44 percent).
Societies with a majority of Protestants also, on average, have majorities of trusters. This analysis
resolves the puzzle of why ethnic diversity doesn’t seem to matter.
The story so far is reassuringly similar to the one I outlined for American politics. Trust
reflects both an optimistic world view and the real world circumstances that make optimism
rational, a more egalitarian distribution of income. The Gini index in turn is tied to both an
individualistic culture and, more critically, public policies that promote economic growth and
redistribution of income. And perceptions of the ability to become successful are also based upon
reality. Such views are not strongly tied to the Gini index, but they are linked with the infant
mortality rate and per capita income for countries with no legacy of Communism.41
Political culture and economics are thus complementary, rather than alternative explana-
tions. Trust depends upon an optimistic world view and a more egalitarian distribution of income.
Its strongest roots are in Protestant cultures, which stress both entrepreneurship and the equality
of all parishioner (Lipset, 1990, ch. 5). There is something of an irony in these findings.
Protestant denominations have not been notably active in pressing for economic equality, while
Catholics have often been at the forefront of movements for economic justice, both in pronounce-
ments from Rome and in movements such as Catholic Workers and liberation theology. Yet the

Uslaner, The Moral Foundations of Trust, Chapter 8-22
ethic of social egalitarianism among Protestant denominations gave rise to the welfare state in
Europe, which led to both wealthier and more equitable societies than we find in Catholic
countries (Inglehart, 1997, 95). Individualistic cultures lead to more economic equality and hence
to greater interpersonal trust.
The Cross-National Consequences of Trust
The big payoffs from trust in the United States are ties to people who are different from
yourself–through charitable contributions and volunteering–and more cooperation in political life.
There are no comparable cross-national data, so I cannot make direct comparisons.42 But there
are three realms where there are clear cross-national effects of trust. Trusting countries have
better governments, better economies, and arguably better public policies.
Putnam (1993, 176) is correct when he argues that trust in people leads to better govern-
ment performance. Trusting countries are less corrupt than countries with many mistrusters.
They also have better performing bureaucracies and more “efficient” judicial systems, as well as
more people who trust the legal system (cf. LaPorta et al., 1997, 335-336).43 In each case, the
causal connection goes from trust to better government and not the other way around.
Trusting societies are less corrupt and have better government performance. Trust has
powerful effects on corruption (cf. LaPorta et al., 1997). Theoretically, if you could make Chile
as trusting as Denmark, it would also be as clean as this least corrupt country in the world.44 The
effect of trust on corruption is almost one and half times as large as the next most important
predictor, the average number of school years completed. We might suspect that corruption has a
greater impact on trust than faith in others has on robbing the public purse. But it doesn’t.
Kleptocracies thrive in low-trust societies. They can’t get off the ground when most people trust

Uslaner, The Moral Foundations of Trust, Chapter 8-23
each other.
Bureaucrats are more responsive–and less likely to keep public policy tied up in red tape
(LaPorta et al., 1998)–when social trust is high (cf. LaPorta et al., 1997). And once more, a
responsive bureaucracy does not lead citizens to trust each other (or, ironically, in the legislative
branch of government either).
Trust also leads to better judicial systems. An efficient judicial system (Mauro, 1995)
depends upon an underlying foundation of social trust. And, once again, good judges don’t make
good citizens. Countries with efficient judicial systems don’t become more trusting.45 The link
from trust to judicial efficacy is strong and powerful, whereas the link in the opposite direction is
insignificant with an incorrect sign.
More telling is confidence in the legal system, which Rothstein (in press) regards as the
key mechanism for translating support for the government into trust in people (see Chapter 2).
Yes, there is a link between confidence in the legal system and trust in people. There is a
moderate correlation between them for countries without a legacy of communism and a powerful
link from trust to approval of the legal system in a simultaneous equation model. Yet the
direction of causality seems to go only one way, from trust to faith in the law. The link from
confidence in the legal system to trust is insignificant with an incorrect sign. Since people who
trust others have deeper commitments to the values underlying the law (see Chapter 7 and
Uslaner, 1999b), it is hardly surprising that they have greater faith in the legal system. There is
clear evidence that people did not see the legal authorities as brokers of trust in formerly
Communist states: The aggregate correlation between confidence in the legal system and
generalized trust is moderate and negative.46

Uslaner, The Moral Foundations of Trust, Chapter 8-24
A better measure than confidence in the legal system is perceptions that the legal system is
fair. While there is no direct measure of public opinion, the Institute for Management Develop-
ment in Lausanne, Switzerland surveys business executives on their “confidence in the fair
administration of justice in society” (published in the Institute’s World Competitiveness Yearbook
and reported in Treisman, 1999, 18). The fairness of the justice system has a higher simple
correlation with trust than confidence in the legal system. But the story is very much the same:
When you have a trusting society, people see the justice system as fair. But an even-handed
judicial system will not produce trust.47
Trusting societies may breed more than confidence in the law. They may also lead to
compliance with the law. LaPorta et al. (1997, 335-336) report that countries ranking high on
trust also have lower rates of tax evasion. Rates of tax evasion are strongly correlated with trust,
even when I include formerly Communist countries. But if the model for tax evasion also includes
confidence in the legal system, trust is no longer significant.48 Since trust is a powerful predictor
of confidence in the legal system, there is at least an indirect connection from trust to tax
compliance.
Societies with more trusters also have a lower theft rate, especially when we include the
formerly Communist countries in the analysis. Here the direction of causality is somewhat more
difficult to establish (as in the time series results for the United States). Including the formerly
Communist countries in the analysis shows a powerful reciprocal relationship between theft and
trust: The more theft, the less trust; the less trust, the more theft. The theft rate is markedly
higher in formerly Communist countries,49 while the share of trusting people is smaller. When I
eliminate formerly Communist countries, trusting countries still are have fewer thefts, but there is

Uslaner, The Moral Foundations of Trust, Chapter 8-25
only a weak link from thievery to mistrust. Trust, but not confidence in the legal system or the
effectiveness of the judiciary, determines the rate of theft in both democracies and formerly
Communist countries. The long arm of the law is thus not sufficient to deter crime. You are
better off living in trusting Sweden than in a country with a reputation for swift and sure
punishment, Singapore.50 Trust is hardly a cure-all for crime, however. It is not a significant
predictor of assaults or homicides, once I control for economic conditions in a country.
Just as democracy does not breed trust, neither does good government (but see Stolle,
1999b for an alternative view). While trust does not make democracy either, it does make
democracy work (better).
In more than one way, trust makes democracies rich. The first link is indirect. Because
trust reflects sentiments toward people who are different from ourselves, it makes it easier for
societies to reach out and deal with other countries. Trusters favor free trade. And trusting
societies are more willing to reach out to outsiders: High trust goes hand-in-hand with open
economies and fewer restrictions on trade, which in turn leads to greater prosperity (cf. Wool-
cock, 1998, 158).
Even more critically, trust leads directly to economic prosperity. Trusting countries have
greater economic growth–and trust is the strongest predictor of growth.51 A growing economy
does not, however, lead to more trust. Once again, the link goes just one way.
Trust depends upon economic equality–and it leads to even more equality. Trusting
societies have bigger governments that redistribute wealth from the rich to the poor, spend more
on education, and pursue policies that will stimulate economic growth. Thus, while there is no
direct connection from trust to economic equality, trusting societies in democratic regimes pursue

Uslaner, The Moral Foundations of Trust, Chapter 8-26
programs that indirectly will boost faith in others. Trusting nations spend a more of their total
income on governmental programs in general and on education in particular. They also have a
larger share of their total population employed by the government. In particular, trusting societies
are more likely to devote a higher share of their national wealth to transfer programs that assist
the poor. Finally, trusting societies have more open economies, and trade promotes economic
growth.52
Governments that redistribute income, spend money on education, transfer wealth from
rich to poor, have large public sectors, and maintain open economies do not generate trust. Trust
seems to come first. Well, almost. Economic equality is a strong determinant of trust. And trust
leads to policies that create wealth and reduce inequalities.
Here we find what Putnam would call a “virtuous circle.” The equal become more equal.
Yet, there is also a vicious circle: Misanthropy and inequality feed on themselves. Yes, you can
increase trust indirectly by pursuing policies that reduce economic inequality: Each of the public
policies I have considered leads to more economic equality, though the correlations are moderate
except for one, for the openness of the economy.53 And, yes, you can adopt these policies
without a trusting citizenry. But a public that is public spirited gives some countries advantages
over others in reducing inequality and boosting trust. My consideration of American politics and
the findings in this chapter about responsive government also suggests that it is easier to make the
hard political decisions when there is trust in the land (cf. Rothstein, 2000).
Trust in people may lead to trust in government. People have confidence in their leaders
when government is working well. Their judgements about government performance reflect their
evaluations of specific personalities, institutions, and policies. But each of these actors must work

Uslaner, The Moral Foundations of Trust, Chapter 8-27
in, and perhaps contribute to, an atmosphere of compromise or confrontation. And political
leaders are ultimately responsible and responsive to the public and its hopes and fears. Govern-
ment cannot produce trust in people. People can provide government officials with the latitude to
work on major social problems–and thereby make it easier for government to function more
effectively. Yet, a government that works well is not always a popular government. What the
government does also matters. A regime that pursues unpopular policies may even become less
popular if it manages to adopt a big agenda.
Whatever government does, a trusting environment makes it possible for government to
act. Mueller (1996, 106) argues that we oversell the benefits of democratic government:
“Democracy is...an extremely disorderly muddle in which contending ideas and forces do
unkempt, if peaceful, battle and in which ideas often are reduced to slogans, data to distorted
fragments, evidence to gestures, and arguments to poses.” Yes, but. If Inglehart (1997, 180-188)
is correct, then democracies that are stable and that work well rest upon cultural foundations,
especially social trust.
As I have shown in Chapters 4 and 7, trust rests upon egalitarian sentiments and leads to
greater tolerance. There is some cross-national evidence for this as well. Countries where many
people believe that there is only one true religion have less trusting citizenries. I show the
relationship in Figure 8-4 (and the relationship is not confined to countries without a legacy of
communism). The direction of causality is not clear here–since this question can reflect both
acceptance of out-groups (see Chapter 4) and tolerance more generally (see Chapter 7). The
relationship is very strong, either as cause or effect. I showed in Chapter 7 that trusters are more
supportive of women’s rights in the United States. There is cross-national support for this as

Uslaner, The Moral Foundations of Trust, Chapter 8-28
well. The Gallup Millennium survey in 2000 asked a cross-national sample whether they agreed
that families will be hurt when women work. Although the sample of countries where I can match
the trust question with women’s roles is small (15), the impact of trust on support for a woman’s
right to work is powerful and stable–and even slightly more powerful than the level of women’s
education.54 Trust makes democracy work because it reflects a tolerant society.
Democratic structures cannot be dismissed, but overall they are generally less powerful
determinants of inequality than trust and usually sink to insignificance in multivariate analyses. In
the end, democracy is worth two cheers. Save the third for trust.

Uslaner, The Moral Foundations of Trust, Chapter 8-29
Table 8-1Correlations Between Measures of Democracy and Generalized Trust
Measure All countries Non-Communist Formerly Communist*
Bollen democracy score .375 (62) .530 (29) .114 (21)
Vanhanen democracy score .439 (57) .578 (37) .139 (19)
Gastil civil liberties score (1988)** .501 (58) .617 (40) -.029 (17)
Gastil political rights score (1988)** .361 (58) .369 (40) -.100 (17)
Gastil composite freedom score (1988)** .424 (58) .497 (40) -.070 (17)
Freedom House composite freedom score (1993-94)** .377 (65) .600 (41) -.188 (18)
Freedom House composite freedom score (1998-99)** .357 (69) .639 (41) -.402 (21)
Freedom House composite freedom score (Year closest to survey)**** .393 ( 67) .655 (41) -.466 (19)
Gurr et al. democratization score (1978) .604 (50) .530 (29) .000 (21)***
Gurr et al. democratization score (1994)***** .439 (57) .578 (37) .130 (19)
Coppedge polyarchy score* .311 (62) .328 (40) -.009 (21)
LaPorta et al. property rights score .530 (55) .627 (36) -.053 (19)
* China is excluded.** Scores reflected from original coding.*** Scores reflected from original coding; when survey is from 1990, 1988 Freedom House scores used; when survey is from 1995 or 1996, 1993-94 Freedom House scores are used.*** Correlation is zero because there is no variation in the coding of democratization.***** Source: LaPorta et al. (1998)

Uslaner, The Moral Foundations of Trust, Chapter 8-30
Table 8-2
Two-Stage Least Squares Estimation of Trust and Economic Inequality for Countries With No Communist Legacy: Model I
Gini Index Equation Including Trust Gini Index Equation Excluding Trust
Coefficient Standard Er-ror
t Ratio Bias Coefficient Standard Error t Ratio Bias
Equation for Trust R2 = .834 RMSE = .071
Gini index of inequality -.005** .002 -2.251 -.0003
Count on success in life (WVS) .195** .086 1.870 .005
Percent Protestant .003**** .001 5.215 .001
Constant .152 .179 .847
Equation for Gini index R2 = .642 RMSE = 6.329 R2 = .726 RMSE = 5.385
Trust in people 18.367 17.949 1.023 -.724
GDP growth rate -5.184**** 1.216 -4.263 -.007 -4.584 **** .907 -5.057 .083
Individualism score (Hofstede) -2.196** 1.197 -1.834 -.025 -1.304** .698 -1.868 -.069
Transfers as % GDP 1974-94 -.465** .218 -2.131 .007 -.401** .178 -2.254 .009
Constant 60.511**** 5.205 11.625 59.366** ** 4.326 13.724
**** p < .0001 *** p < .01 ** p < .05 * p < .10
N = 22

Uslaner, The Moral Foundations of Trust, Chapter 8-31
Table 8-3
Two-Stage Least Squares Estimation of Trust and Economic Inequality for Countries With No Communist Legacy: Model II
Gini Index Equation Including Trust Gini Index Equation Excluding Trust
Coefficient Standard Error t Ratio Bias Coefficient StandardError
t Ratio Bias
Equation for Trust R2 = .733 RMSE = .084
Gini index of inequality -.908** ** .192 -4.735 .004
Percent Muslim -.004** .002 -2.062 -.002
Percent Protestant .003**** .001 4.963 .00002
Constant .626**** .077 8.125
Equation for Gini index R2 = .619 RMSE = .066 R2 = .642 RMSE = .063
Trust in people .041 .166 .245 .062
Log black market currency value .516*** .148 3.491 .103 .490**** .100 4.914 .372
Percent Muslim -.013**** .003 -4.443 .00003 -.012**** .002 -5.733 .0002
Population growth rate .072*** .025 2.951 .006 .069*** .020 3.452 -.003
Constant .271**** .076 3.569 .289**** .020 14.542
**** p < .0001 *** p < .01 ** p < .05 * p < .10
N = 33

Uslaner, The Moral Foundations of Trust, Chapter 8-32
Trust = 0.735 - 1.106 GINIr² = 0.468 RMSE = 0.120 n = 38
Most P
eople
Can B
e T
ruste
d
Gini index economic inequality.2 .3 .4 .5 .6
0
.2
.4
.6
Belgium
WGermany
Spain
Finland
Luxembou
Canada
Australi
Netherla
Taiwan
Austria
India
Britain
Sweden
Italy
Denmark
Greece
Norway
SKorea
Ghana
Ireland
Switzerl
France
Japan
PortugalNigeria
USA
Uruguay
TurkeyPeruPhilipin
Argentin
DominicaMexico
Colombia
Venezuel
Chile
Brazil
SAfrica
Figure 8-1
Trust and Economic Inequality for Countries With out Communist Legacies
Uslaner, The Moral Foundations of Trust, Chapter 8-33
success = 0.628 + 0.120 loggnpr² = 0.436 RMSE = 0.158 n = 23
Co
un
t o
n S
ucce
ss W
VS
Log GNP Per Capita6 8 10
1.2
1.4
1.6
1.8
2
India
NigeriaChile
Brazil
Mexico
Argentin
Portugal
Spain
IrelandBritain
Italy
Austria
Belgium
NetherlaFinland
France
Canada
Denmark
Iceland
Japan
SwedenUSA
Norway
Figure 8-2
Counting on Success and Log of Gross National Product in Countries With No Communist Legacy

Uslaner, The Moral Foundations of Trust, Chapter 8-34
success = 1.478 + 0.150 totalqolr² = 0.467 RMSE = 0.160 n = 23
Count on S
uccess W
VS
Total Quality of Life (Diener)-2 0 2
1.2
1.4
1.6
1.8
2
Nigeria
India
Brazil
Turkey
Mexico
Argentin
ChilePortugal
Spain
Austria
France
Ireland
Italy
Belgium
Japan
Finland
Britain
Sweden
Denmark
Norway
USA
Netherla
Canada
Figure 8-3
Counting on Success and Total Quality of Life in Countries With No Communist Legacy

Uslaner, The Moral Foundations of Trust, Chapter 8-35
onetruegm = 1.385 + 0.013 trustr² = 0.463 RMSE = 0.198 n = 47
One
true
rel
igio
n G
allu
p M
illen
nium
trust0 20 40 60 80
1
1.5
2
2.5
PeruPhilipin
Turkey
ColombiaSlovenia
RomaniaPoland
Argentin
Nigeria
Chile
Lithuani
Uruguay
Estonia
Ghana
Slovakia
Georgia
France
Belarus
RussiaLatvia
Croatia
Hungary
Dominica
Mexico
Czech
SKoreaBulgariaSpain
Ukraine
AustriaLuxembou
Belgium
Italy
USA
Switzerl
Australi
Japan
Taiwan
Britain
Iceland
Ireland
Finland
CanadaNetherla
DenmarkSweden
Norway
Figure 8-4
Belief in One True Religion and Trust in People

Uslaner, The Moral Foundations of Trust, Chapter 8-36
APPENDIX
For the equations below, variables significant at p < .10 are underlined, variables significant at p <
.05 are in bold, variables significant at p < .001 or better are in italics, and insignificant
variables are in regular typeface.
Organizational membership equation: The other predictors are whether people say that
government rather than individuals are responsible for solving major problems (from
the WVS); percent Protestant in the population, and a society’s overall measure of
subjective well-being (Diener, 1995).
Secular group membership equation: The other predictors are a society’s individualism score
(Triandis), the percentage of people with a secondary education (from Barro and
Lee, 1994), and whether people say that government rather than individuals are responsible
for solving major problems.
Signing petitions equation: Other variables are not wanting neighbors of different races to move
into your neighborhood, from the WVS), low scores on Mauro’s (1995) judicial
responsiveness index, and the summary Freedom House measure of democratization.
Bureaucratic delay index: The index is an average of the thrice-annual scores from 1972-1995 of
the Business Environmental Risk Intelligence’s (BERI) Operation Risk Index. This
equation also includes the share of the public in nonfarm occupations (Vanhanen, 1997);
the summary Freedom House democratization index; and the LaPorta et al. (1998)

Uslaner, The Moral Foundations of Trust, Chapter 8-37
index of property rights protection.
Corruption equation: The equation also includes the average number of school years citizens
have attained (Barro and Lee, 1994), and the 1998 Freedom House democratization
score.
Judicial efficiency equation: Other variables are the average number of school years and the
summary Freedom House democratization index.
Confidence in legal system equation: A two-stage least squares estimation with trust also
endogenous. The equation for trust also includes the Gini index of inequality and the
percentage of a country’s population that is Protestant (see below for an explication of the
logic of these predictors). The other predictors in the model for confidence in the legal
system are the 1988 Freedom House measure of civil liberties (Gastil, 1991) and assassi-
nations in a country per million people per year from 1970-85 (Sachs and Warner,
1997). So countries with higher interpersonal trust, greater civil liberties, and fewer
assassinations have more confidence in the law. The impact of civil liberties is the
strongest, though the t-ratios for civil liberties and trust are about equal.
Fairness in the legal system equation: A two-stage least squares estimation with trust endoge-
nous. The equation for trust also includes the Gini index of inequality and percent
Protestant. The equation for fairness of the justice system includes trust, how extensive
the system of property rights is (from LaPorta, 1997), and assassinations in a country

Uslaner, The Moral Foundations of Trust, Chapter 8-38
per million people per year from 1970-85 (Sachs and Warner, 1997).
Theft rate equation: The theft rate in 1990 comes from Daniel Lederman of the World Bank
(personal communication, May, 1999). Estimated by two-stage least squares with trust
endogenous. The trust equation including formerly Communist states (N =29) includes
theft rate, percent Protestant, the Gini index of inequality, and the percent Muslim. The
theft equation includes trust and the Freedom House measure of civil liberties in 1988.
For countries without a legacy of Communism (N = 19), trust is significant at p < .05 for
theft, and theft is significant at p < .10 for trust.
Openness of the economy equation: The measure comes from Barro and Lee (1994). Other
predictors include transfer payments as a percentage of GDP and the country’s area
(smaller countries have more open economies). The area measure is also reported in
Barro and Lee (1994).
Growth in gross domestic product equation (see n. 50): Estimated by two-stage least squares,
with the percentage Protestant, the Gini index of inequality, and the growth in GDP rate
in the trust equation. In the GDP growth equation are trust, the change in years of
education for population 15 and over from 1970 to 1990, and growth of trade from
1980 to 1990.
Percent GDP spent on government equation: Other variables are the percentage of the popula-
tion not living on farms (Vanhanen, 1997) and how much the economy relies upon

Uslaner, The Moral Foundations of Trust, Chapter 8-39
government rather than the free market (Barro and Lee, 1994).
Education spending equation: Other variables included are the log of GNP per capita (LaPorta
et al., 1998) and the adult literacy rate (Vanhanen, 1997).
Percent of population employed in public sector equation: Other variables in the equation are
the percentage of people not living on farms and how much the economy relies upon the
government rather than the free market.
Transfers and subsidies as a percentage of GDP (average from 1975-1995) equation: This
equation also includes the log of GNP per capita, bureaucratic delays, and tax compliance
(from the Global Competitiveness Report 1996, as reported in LaPorta et al., 1998).

Uslaner, The Moral Foundations of Trust, Chapter 8-40
1. The correlation between societal corruption and interpersonal trust across 52 countries is -
.613. As in Chapter 2, the data base are the countries that have World Values Survey
questions on interpersonal trust in either 1981-82 or 1990-93. For countries with surveys
in both years, the figure for trust is the average. I eliminated China, since its trust score is
suspiciously high. (The correlation is reflected, since higher scores on the corruption
index indicate honesty in government.) Later in the chapter, I shall analyze trust data for
countries without a legacy of Communism. I simply note here that the correlation rises to
-.749 when I restrict the analysis to these 34 nations. The data on corruption (for 1998)
come from the global organization Transparency International and are found on its web
site, at http://www.transparency.de/documents/cpi/index.html.
2. The correlation between the measures of corruption and tax evasion in the LaPorta et al.
(1998) Quality of Government data set are .619.
3. These data come from the eight formerly Communist countries surveyed by the World
Study in 1990 and the mid-1990s: Belarus, East Germany, Estonia, Latvia, Lithuania,
Poland, Russia, and Slovenia (see n. 5) and the Freedom House freedom scores (see n. 4).
The eight formerly Communist countries became five percent less trusting, but the average
freedom score increased from a “not free” 11 in 1988 to 4.75 in 1998, comparable to
India, Chile, the Dominican Republic, the Philippines, and Venezuela.
NOTES

Uslaner, The Moral Foundations of Trust, Chapter 8-41
4. The correlation between trust in people and confidence in the legal system in the World
Value Survey is modest (tau-c = .069, gamma = .122). And the country by country
correlations tend to be higher where trust in people is higher.
5. These updated measures were obtained from the web site: http://www.freedomhouse.org
/rankings.pdf. The Freedom House web site contains scores for both political and civil
liberties. They were very highly correlated, so I summed the two (cf. Inglehart, 1997,
357).
6. I am grateful to Ronald Inglehart for providing updated data for the third wave (1995-96)
of the World Values Survey, where available. These figures are not averages (see below
for some analyses that use the mean trusting shares for the first and second waves). The
nations and the years for which I have trust data are: Argentina (1996), Armenia (1995)*,
Australia (1995)*, Austria (1990),* Azerbaijan (1995)*, Bangladesh (1997)*, Belarus
(1996)*, Belgium (1990), Brazil (1996), Bulgaria (1990)*, Canada (1990), Chile (1996),
China (1995)*, Colombia (1996), Croatia (1996)*, Czech Republic (1990)*, Denmark
(1990), Dominican Republic (1996), East Germany (1996)*, Estonia (1996)*, Finland
(1996), Georgia (1996)*, Ghana (1995), Greece (1990), Hungary (1990)*, Iceland
(1990), India (1996), Ireland (1990), Italy (1990), Japan (1995), Latvia (1996), Lithuania
(1996)*, Luxembourg (1990), Mexico (1996), Moldova (1996)*, Montenegro (1996)*,
Northern Ireland (1990), the Netherlands (1990), Nigeria (1995), Norway (1996), Peru

Uslaner, The Moral Foundations of Trust, Chapter 8-42
(1996), the Philippines (1996), Poland (1996)*, Portugal (1990), Romania (1990)*,
Russia (1995)*, South Africa (1996), South Korea (1996), Serbia (1996), Slovakia
(1990),* Slovenia (1995)*, Spain (1996), Sweden (1996), Switzerland (1996), Taiwan
(1995), Turkey (1996), the United Kingdom (1990), the United States (1996), the
Ukraine (1996)*, Uruguay (1996), Venezuela (1995), and West Germany (1996).
Countries marked with an asterisk either formerly had Communist governments or are still
Communist regimes (China). See the discussion in the text below. I generated some
aggregate results directly from the WVS and in other cases used the compendium by
Inglehart et al. (1998).
7. The range is from .3 for the Coppedge measure of polyarchy and the Freedom House
indicator of political rights in 1988 and the Freedom House measures in 1993-94, 1998-
99, and the summary index to .6 for the Gurr measure of democracy in 1978 and the Van-
hanen democracy scores. And these differences tell an important tale: There are important
differences between countries with democratic traditions and those without such legacies.
The Gurr et al. measure places all of the Eastern bloc countries at the lowest end of the
democracy scale–which is precisely where they were in 1978, when the index was
constructed. Even two decades later, this measure of democratization, with its strong split
between democracies and nondemocracies, has a stronger predictive power for interper-
sonal trust than do more nuanced indicators of civil, political, and property rights. Indeed,

Uslaner, The Moral Foundations of Trust, Chapter 8-43
the 1978 Gurr measure of democratization has a higher correlation with interpersonal
trust than the 1994 index does. The other good predictor of trust, Vanhanen’s (1997, 34-
35) democratization score, is a composite of the level of party competition and popular
participation in elections–and not of the constitutional structure of a nation.
8. Communist governments still existing elsewhere, as well as other tyrannical regimes fit the
pattern as well. However, I omit China from all discussions below. It has a very high (52)
percentage of generalized trusters. Inglehart (1999) attributes this to its Confucian
culture, comparing it with Taiwan (where 42 percent of people say most people can be
trusted) rather than with other countries with legacies of Communist rule. However, I see
the Chinese figure as a likely outlier that might reflect the hazards of conducting survey
research in a country that Freedom House ranks at the bottom of its rankings on both
political and civil liberties.
9. The correlation is modestly negative (-.381). Yet, all of the variation seems to come from
two countries that had large changes in freedom: Argentina and South Korea, both of
which became more democratic and less trusting over the decade. Eliminating these cases
drops the correlation to -.076.
10. The correlation is .056, N = 22, p < .237, one-tailed test.
11. The partial correlations of the early Gurr et al. index and the Vanhanen measure of

Uslaner, The Moral Foundations of Trust, Chapter 8-44
democratization with trust, controlling for the years of continuous democracy, are -.036
and .094, respectively. The partials with the years of continue democracy controlling for
trust are .673 and .616.
12. The rise in Latvia was 32 percent. The drops are: Estonia (six percent, 21.4 percent of
1990 base), Lithuania (nine percent, 29 percent of the base), Russia (14 percent, 37
percent of the base), and Poland (17 percent, 49 percent of the base). Belarus, East
Germany, and Slovenia each had a drop of one percent (four, four, and six percent of the
1990 bases). The 1996 measure on Hungary was not yet available, but there is a 1981
survey and it has more of the same bad news: Trust fell eight percent from 1981 to 1990,
or a third of the base.
13. The mean value on the freedom index ranges from 2 (completely free) to 14 (not at all
free) and it moved from 12.167 in 1978 to 11.056 a decade later to 7.222 in 1993-94 and
to 6.047 in 1998-99. By 1998-99, 44 percent of the nations of Eastern and Central
Europe had scores of three or lower. Just 50 percent of countries with no legacy of
Communism had scores of three or less. Belgium, Italy, Japan, Northern Ireland, South
Africa, Spain, Uruguay, and the United Kingdom, and the former West Germany each had
scores of three, as did the Czech Republic, the former East Germany, Estonia, Hungary,
Latvia, Lithuania, Poland, and Slovenia.

Uslaner, The Moral Foundations of Trust, Chapter 8-45
14. The correlation is -.466 in 1998-99, p < .02, one-tailed, p < .04, two tailed.
15. The correlation is .274. The measures of political and property rights come from LaPorta
et al. (1997). The correlation with corruption is reflected since higher scores on the
corruption perceptions index indicate more honesty. The trust measure used is not an
average, but rather the most recent available figure for social trust. I am grateful to
Ronald Inglehart for providing some available data from the third wave of the World
Values Survey.
16. Across 22 countries between 1981 and in 1990, the simple correlation is .907. The 1990-
1995 comparison is for 26 countries and the 1981-95 comparison for 12. The democrati-
zing countries that experienced more than 10 percent shifts are Estonia, Latvia, Lithuania,
Poland, Russia, and South Africa. Two countries are omitted from this calculation: China
(see n.1) and the United States, which had an unusually high percentage of trusters in the
WVS compared to other surveys discussed in Chapter 3.
17. The Gini index comes from Deininger and Squire (1996) and the data base available at
http://www.worldbank.org. I used the Gini index with the best available data in the
Deininger-Squire data base and matched the Gini index to the year in which trust was
measured for each case.
18. With China included, it turns positive ( r = .255).

Uslaner, The Moral Foundations of Trust, Chapter 8-46
19. Again, this only holds in countries with no legacy of Communism. In those societies, the
simple aggregate correlation between trust and success is .646. For countries in Eastern
and Central Europe, there is a negative correlation between the two measures ( r = -.177).
20. Inglehart (1999) argues that religious identification must be considered a historical cultural
influence rather than a contemporary indicator of the depth of faith–since church atten-
dance has fallen in many of the Protestant countries. The correlation between the
frequency of church attendance and the share of Protestants in a country is -.242. The
measures of percent Protestant (and later percent Muslim) come from LaPorta et al.
(1998).
21. The correlation between the Protestant share of a nation’s population and the Triandis
ranking for individualism is .497 for democracies. The correlation with the percentage
Muslim is -.472. There are not many Muslim nations in the data base–and the result is
largely due to the extreme score on the individualism scale of the only country dominated
by Islam in the data base (Bangladesh). Without Bangladesh, the correlation falls to -
.198. The correlation between trust and percent Muslim is not appreciably reduced when I
eliminate Bangladesh. Because of missing data on the Gini index, Bangladesh is not
included in the model in Tables 8-2 or 8-3 anyway.

Uslaner, The Moral Foundations of Trust, Chapter 8-47
22. There are few public surveys in Muslim nations, perhaps reflecting a distrust of others’
motives in seeking to find out what’s on people’s minds.
23. For countries that have only a 1990 measurement, I use that survey. The countries in this
analysis are as follows: Argentina, Austria,* Belgium, Brazil*, Canada, Chile*, Denmark,
Finland, France, India*, Ireland, Italy, Japan, Luxembourg*, Mexico, the Netherlands,
Norway, Portugal,* Spain, Sweden, Turkey*, the United Kingdom, and the United States.
Nations marked with an asterisk only have 1990 surveys available. I constructed Gini
indices from the Deininger-Squire data set for all available years from 1981 to 1990, using
the most accurate data sources in their data set. For countries that only have 1990
measures of trust, I used the 1990 Gini index (or the year closest to it).
24. The method is again two-stage least squares, with bootstrapping (using 1000 samples).
The model for economic inequality includes trust, the growth rate in gross domestic
product (LaPorta et al., 1998), I use LaPorta et al.’s (1998) measure of transfers as a
percentage of gross domestic product from 1974-1994. I also expect that countries with
more entrepreneurial political cultures will be more equal than collectivist societies.
Hofstede (1980) and Triandis (1989) have constructed cross-national measure of individu-
alism versus collectivism. The data for the Triandis individualism scores come from
Diener et al. (1995).

Uslaner, The Moral Foundations of Trust, Chapter 8-48
25. As Protestantism has stressed individual achievement, Islam has placed greater emphasis
on collective goals, especially on one’s economic responsibility to the larger community
(as reflected in the prohibition on charging interest on loans). So it should not be
surprising to find a powerful coefficient on percent Muslim for economic equality. Were
the sample of Muslim nations more representative, the results might be even more
powerful. Beyond Islam, two other variable shape economic equality. High population
growth rates lead to more inequality–the poor getting poorer. The data on population
growth rate come from LaPorta et al. (1998). The black market currency value is the
premium of a nation’s currency on the black market compared to its official rate. The
higher the value of the (log) of the black market currency value, the more important the
unofficial economy is to a country’s well being.
26. The equations in Table 8-5 are rather robust. The bias measures from bootstrapping are
quite small. Even the value for trust in people in the equation for the Gini index is modest,
given the size (and insignificance) of the unstandardized regression coefficient. The root
mean squared error values (RMSE) are all rather small, indicating that each equation has a
good fit to the data.
27. According to data in the Deininger-Squire data base.
28. The wealth of a society is measured by the log of its gross national product. The total

Uslaner, The Moral Foundations of Trust, Chapter 8-49
quality of life index includes basic physical needs fulfillment, physicians per capita, the
suicide rate, the literacy rate, college and university attendance, gross human rights
violations, the Gini index, deforestation, major environmental treaties, the homicide rate,
the monetary savings rate, purchasing parity power, per capita income, and subjective well
being (represented by survey responses to happiness and life satisfaction). See Diener
(1995, 113). Counting on success is a three-point scale with higher values indicating
greater optimism. The correlations of counting on success with trust are -.323 for 24
democratic countries, -.249 for all 35 countries, with the log of GNP .660 (N = 23), and
with the quality of life index .683 (N = 23).
29. The infant mortality and education rates are both logged and come from LaPorta et al.
(1998); the average life expectancy comes from Barro and Lee (1994) and is my averaging
of the male and female rates. The correlations with counting on success are -.662 for
infant mortality, .533 for education, and .563 for life expectancy.
30. I owe this suggestion to my colleague Ted Robert Gurr.
31. The correlations are .625, .599, and .736, respectively for group membership, membership
in secular organizations, and turnout..
32. The group membership variables and petitioning come from the WVS, while the turnout
figures come from Vanhanen (1997, 34-42). These and subsequent analyses in this

Uslaner, The Moral Foundations of Trust, Chapter 8-50
chapter are based upon two-stage least squares estimations.
33. The correlation is -.389. Group membership and electoral turnout don’t depend upon
trust, but are strongly related to the number of years of continuous democracy. Group
membership has an irregular pattern until a country has been democratic for 75 years and
then it leaps dramatically. Electoral turnout increases more straightforwardly as the
number of years of continue democracy gets larger. Civic engagement grows as people
become accustomed to taking part in politics, not because they trust each other. Indeed,
willingness to sign petitions points to a dissatisfaction with the political system rather than
to the belief that politicians and other citizens are trustworthy and responsive, if they only
know what’s on your mind.
34. Postmaterial values include putting more emphasis on freedom of speech and having more
say on the job (and in government) rather than maintaining order and fighting price rises
(Inglehart, 1997, ch. 4).
35. At bivariate levels, most of these variables matter at least in countries with no legacy of
Communist rule. Two measures of schooling–the total number of school years from the
Barro and Lee (1994) data set and the log of school attainment from 1960 to 1985 from
LaPorta et al. (1998)– show correlations about .60 with trust for countries with no
Communist legacy. A logged measure of infant mortality (also from LaPorta et al., 1998)

Uslaner, The Moral Foundations of Trust, Chapter 8-51
shows an even more powerful simple correlation for the same group of countries ( r = -
.711). The same story holds across a wide variety of measures of income and life quality
(Diener, 1995). The measures come from a variety of sources (and web sites): LaPorta et
al. (1998); Diener et al. (1995); the World Bank, the United Nations, the Barro-Lee
(1994) data set (located at http://www.nber.org /pub/ barro.lee /ZIP/ BARLEE.ZIP); the
Easterly-Levine data set from http://www.worldbank. org /growth /ddeale.htm; the
Johnson, Kaufmann and Zoido-Lobatón data set (1997) from http://www.worldbank.org.
The log of per capita GNP (averaged from 1970 to 1995, from LaPorta et al., 1998)
correlates at .625 with trust for countries with no legacy of Communism; the Diener et al.
measures of total quality of life and advanced quality of life correlate at .683 and .732,
respectively, with trust. For various measures of economic well-being, the correlations fall
to around .45.
36. The measures are newspaper readership per 1,000 population and the number of television
and radio receivers per 1,000 population (The Economist, 1990, 126-127). Newspaper
readership in democracies is associated with higher faith in others ( r = .686). But
television viewing supposedly destroys trust perversely also increases social trust ( r =
.597), as does listening to the radio ( r = .548). The correlations for media use all vanish
when I control for income and especially education.
37. The Scandinavian countries rank seventh (Denmark), 17th (Sweden), 20th (Norway), and

Uslaner, The Moral Foundations of Trust, Chapter 8-52
23rd (Finland) among 45 countries on the Easterly-Levine measure of ethnic fractionaliza-
tion (see n. 25). The mean score for the Scandinavian nations is .067, compared to .220
for other countries with no legacy of Communism (which only reaches significance at p <
.12, one-tailed test).
38. The average Gini index in Scandinavian countries is .383 compared to .313 for other
countries with no legacy of Communism (p < .10). But the five Scandinavian countries
have an average of 88.63 percent Protestants, compared to 18.73 percent in other
countries (p < .0001).
39. Bo Rothstein, personal communication.
40. Data on ethnic diversity come from Ted Gurr’s Minorities at Risk Phase I Dataset (Lee,
1993) and the Easterly-Levine (1997) measure of ethnic fractionalization (from LaPorta et
al., 1998). The correlations with trust are -.242 and -.108, respectively.
41. The correlation of trust with the Gini index is -.355. The correlations of logged infant
mortality rate and logged GNP per capita (both from LaPorta et al., 1998) are -.696 and
.683.
42. The WVS data on volunteering are not directly comparable to the United States data,
particularly the aggregate figures.
Uslaner, The Moral Foundations of Trust, Chapter 8-53
43. The data set is described in LaPorta et al. (1997, 1998). Each of the dependent variables
except for confidence in the legal system (from the WVS), openness of the economy
(Barro-Lee data set), and economic performance (Fedderke and Klitgaard, 1995) in this
section come from the LaPorta data set. The independent variables in the economic
performance equation also come from Fedderke and Klitgaard (1995).
I found that more trusting societies have higher rates of transfers and subsidies as a percentage of
gross domestic product from 1974 to 1994 ( r = .509, N = 40; r = .598, N = 35 for democracies).
They also devote a greater part of their gross domestic product to government programs ( r =
.630, N = 43, r = .735, N = 36 for democracies). See Chapter 8 for a more detailed discussion
and for multivariate analyses.
44. The corruption index comes from Transparency International and is the 1998 ranking.
45. In countries without a legacy of Communism, the correlation between confidence in the
legal system and interpersonal trust in the 1990-91 World Values Survey is .372. With
communist countries other than China included, it rises to .406.
46. In countries without a legacy of Communism, the correlation between confidence in the
legal system and interpersonal trust in the WVS is .372. For the 13 former Communist
countries, the correlation is -.470.
47. The simple correlation with trust (for all countries, including those with a legacy of

Uslaner, The Moral Foundations of Trust, Chapter 8-54
Communism) is .712, considerably higher than the correlation of .439 for confidence in the
legal system (.439). I am grateful to Daniel Treisman for providing me with the data on
this and other variables.
48. The simple correlations are .534 for the 32 countries with no Communist legacy and .569
for 36 countries. The multivariate estimation is a two-stage least squares including models
for trust, confidence in the legal system, and tax evasion.
49. Thirteen of the 18 formerly Communist countries have theft rates above the median.
50. Sweden ranked last of 42 countries in the theft rate, compared to Singapore’s rank of 27.
On assault, Sweden was 37th of 38, while Singapore was 14th. On homicide, it is better to
live in Singapore (ranked 35th of 47) compared to Sweden (ranked sixth).
51. The measure is the mean yearly growth in gross domestic product from Fedderke and
Klitgaard (1995).
52. All of the dependent variables except openness come from LaPorta et al. (1998). Trust is
significant at p < .01 for the share of the population employed in the public sector and at p
< .05 in the other equations.
53. The correlations are in the range of .4 to .5, except for the openness of the economy
(where the correlation approaches .7).

Uslaner, The Moral Foundations of Trust, Chapter 8-55
54. The data on women’s rights come from the International Social Survey Programme’s
1998 religion survey (which also includes the generalized trust question, although
measured differently). The data are available for download at
ftp://unix1.za.uni-koeln.de/za-koeln/uher/relig98/. Trust, the level of women’s education,
and a measure of left-right party identification of a nation’s electorate are all significant
predictors of attitudes toward women’s working (other demographic and economic
indicators are not significant) at p < .01 or less. When I multiply the regression coeffi-
cients by the range of the predictors, the regression effects for trust, women’s education
levels, and left-right party identification are .708, .689, and .476 (all reflected to indicate
support for women’s right to work). To ensure that the estimates are reliable, I boot-
strapped the estimates–and found support for the stability of all three coefficients. There
is also a moderate correlation between a dichotomized measure of trust and support for
women’s working at the individual level (tau-c = .143, gamma = .230, N = 37,420). Trust
was a significant predictor of women’s rights (at p < .0001) in an individual-level ordered
probit that also includes gender, age, education, how often one prays, how active one is in
her place of worship, and whether one describes himself as religious, as well as a set of
country dummy variables. The question on one true religion comes from the Gallup
Millennium Survey. I am grateful to Meril James, Secretary General of Gallup Interna-
tional, for providing these data.