tuberculosis laboratory cooperative agreement: annual ... · 6/22/2010 · tuberculosis laboratory...
TRANSCRIPT

Tuberculosis Laboratory Cooperative Agreement:
Annual Aggregate Report, 2008
Inaugural Report The Laboratory Capacity Activity in the Mycobacteriology Laboratory Branch (MLB) in the Division of Tuberculosis Elimination (DTBE) is pleased to introduce the first edition of the “Tuberculosis Laboratory Cooperative Agreement: Annual Aggregate Report”. The data contained herein are a compilation of the workload and turnaround time for calendar year 2008 taken from TB Elimination Cooperative Agreement narratives by public health laboratories (PHLs) receiving support via this mechanism. These data provide an opportunity for PHLs to benchmark themselves by comparing their own laboratory data with those from peers with similar testing volumes. Benchmarking may serve as a useful guide for identifying testing practices and algorithms that are successful or need examination.
A few items must be considered when reviewing this report. First, the data are self-reported by PHLs. The interpretation of the statistic and the calculation used to derive the reported values may differ between laboratories. Second, although the same data were requested from all 58 PHL, not every PHL reported complete data. In the future, we expect that all PHLs will report data for each variable. Complete reporting is imperative for providing an accurate reflection of the work being performed over time to be described in future aggregate reports. Third, unless noted otherwise, data are reported on a “per patient” and not “per specimen” basis. Lastly, due to the limitations presented above, this report is to be used only as a guide and is not intended for other purposes that may be disciplinary in nature.
The MLB thanks you for your continued dedication and hard work in providing TB laboratory testing services. We hope that you find this report both interesting and informative. Please let us know if you have any comments, questions, or suggestions that might improve the quality of future reports.
Contact Details For inquiries, please contact the laboratory consultant for your jurisdiction.
1. Angela Starks, PhD—[email protected], (404) 639-3205
2. Tracy Dalton, PhD—[email protected], (404) 639–3904
3. Frances Tyrrell, MPH, MT (ASCP), SM—[email protected], (404) 639-5451
Acknowledgements: MLB thanks both Beverly Metchock (Reference Lab Team Lead) and Mitch Yakrus for their significant contributions to the aggregate report.
INSIDE THIS REPORT:
National Workload Data 2
Ratio of Specimens per Patient 2
Time for receipt of clinical specimens 3
TAT for AFB smear microscopy 3
Positivity rate for direct detection 4
Methodology for Direct Detection 4
Methodology for ID 4
TAT for ID from clinical specimen 5
TAT for DST from clinical specimen 5
Positivity of Cultures and Isolates 6
Key Findings and Guidance 6
JUNE 22, 2010
National Center for HIV/AIDS, Viral Hepatitis, STD, and TB Prevention Division of Tuberculosis Elimination
Ratio of Total Number of Specimens to Number of Patients Tested (N=58)
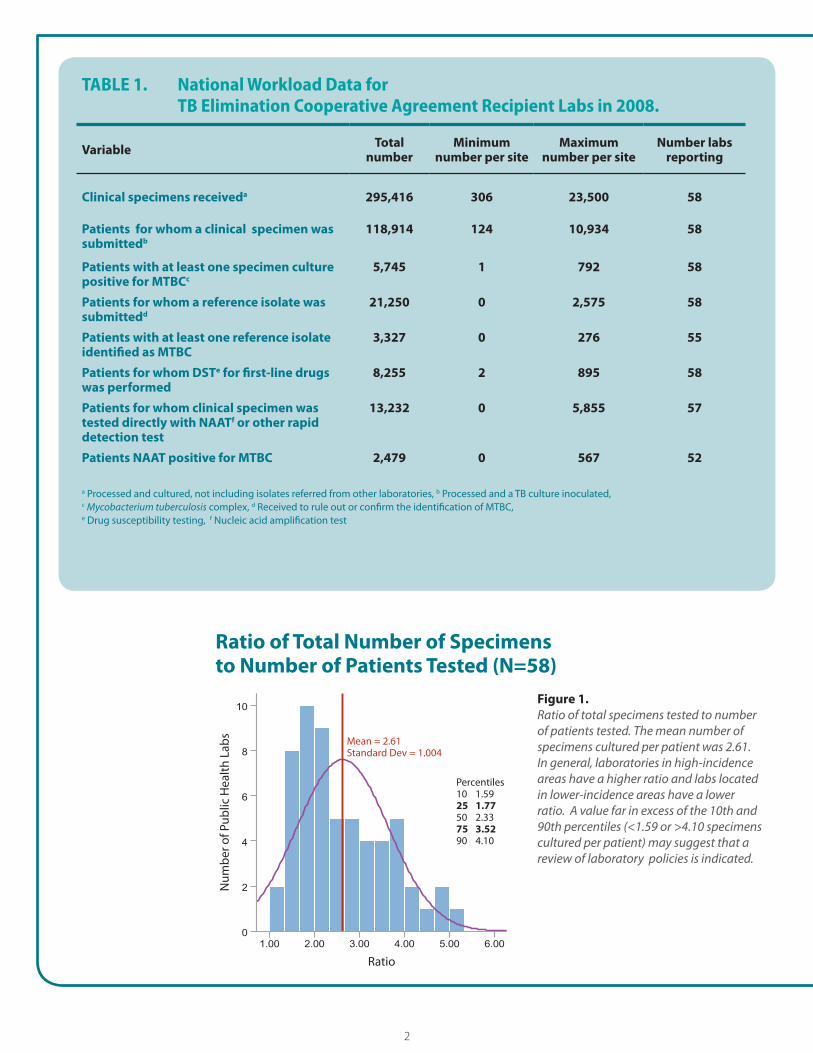
TABLE 1. National Workload Data for TB Elimination Cooperative Agreement Recipient Labs in 2008.
Variable Total number
Minimum number per site
Maximum number per site
Number labsreporting
Clinical specimens receiveda 295,416 306 23,500 58
Patients for whom a clinical specimen was 118,914 124 10,934 58 submittedb
Patients with at least one specimen culture 5,745 1 792 58 positive for MTBCc
Patients for whom a reference isolate was 21,250 0 2,575 58 submittedd
Patients with at least one reference isolate 3,327 0 276 55 identified as MTBC
Patients for whom DSTe for first-line drugs 8,255 2 895 58 was performed
Patients for whom clinical specimen was 13,232 0 5,855 57 tested directly with NAATf or other rapid detection test
Patients NAAT positive for MTBC 2,479 0 567 52
a Processed and cultured, not including isolates referred from other laboratories, b Processed and a TB culture inoculated, c Mycobacterium tuberculosis complex, d Received to rule out or confirm the identification of MTBC, e Drug susceptibility testing, f Nucleic acid amplification test
Ratio of Total Number of Specimens to Number of Patients Tested (N=58)
Ratio
Mean = 2.61 Standard Dev = 1.004
Num
ber o
f Pub
lic H
ealth
Lab
s
Percentiles 10 1.59 25 1.77 50 2.33 75 3.52 90 4.10
Figure 1. Ratio of total specimens tested to number of patients tested. The mean number of specimens cultured per patient was 2.61. In general, laboratories in high-incidence areas have a higher ratio and labs located in lower-incidence areas have a lower ratio. A value far in excess of the 10th and 90th percentiles (<1.59 or >4.10 specimens cultured per patient) may suggest that a review of laboratory policies is indicated.
2

Percent of Specimens ReceivedWithin 1, 2, and 3 Days After Collection
AFB Smear Results Reported within One Day
Percent of Specimens Received Within 1, 2, and 3 Days After Collection
0%
100%
Perc
ent S
peci
men
s Rec
eive
d
80%
60%
40%
20%
Within 1 day Within 2 days Within 3 days
Time to Specimen Receipt
State Public Health Labs City Public Health Labs
Figure 2. The current goal of laboratory receipt of specimens within 1 day of collection was achieved on average 37% of the time in state public health labs. Barriers described in cooperative agreement narratives included lack of a courier system, difficult terrain, remote locales, and limited education to providers. In addition, receipt of specimens can be affected by weekends and furlough days.
AFB Smear Results Reported Within One Day
Perc
ent A
FB S
mea
r Res
ults
Rep
orte
d
100%
90%
80%
70%
60%
50%
3rd Quartile = 99.8%
Median = 95.6%
1st Quartile = 87.0%
Mean = 91.3%
Std. Dev. = 11.4
N = 50
Min = 74.6%
Outlier 2 = 59%
Outlier 1 = 64%
Outlier 3 = 54%
Max = 100% Figure 3. Box plot display of the percent of AFB smear results reported within one day of specimen receipt. An overwhelming majority of cooperative agreement recipient labs reported 87% or more of AFB smear results within 1 day of specimen receipt. Three laboratories reported values that were statistically below the observed minimum for other sites. Outliers should assess potential reasons for difficulty in meeting this objective.
3

Positivity of Direct DetectionStratified by Testing Volume (N = 39 labs)
Rapid Direct DetectionMethods (N = 58)
ID from Culture, Primary Methods (N = 58)
0
>500
Number TB Suspects Screened by Direct Detection
11–50 51–150 151–500
2
4
6
8
10
12
14
16
Num
ber o
f Pub
lic H
ealt
h La
bs
0%
10%
20%
30%
40%
50%
60%
80%
90%
100%
Mea
n Pe
rcen
t TB
Susp
ects
(+) b
y D
irec
t Det
ectio
n
70%
No. of Public Health Labs Percentage TB Suspects (+) by Direct Detection
Positivity of Direct Detection S tratified by Testing Volume (N = 39 labs)
Figure 4. Overall, approximately 19% of TB suspects with a clinical specimen tested by a direct detection method were positive for MTBC. The positivity rate declined with an increasing number of TB suspects examined. PHL should work with submitters and their TB Control Program to determine an appropriate testing algorithm for utilization of direct detection methodologies.
Rapid Direct Detection Methods (N = 58)
DH
Unknown: 1
Lab
irect PLC:
1 Referred:
9
Developed NAAT: 8
None: 6
FDA Approved
NAAT: 33
Figure 5. Methods used by public health laboratories for rapid direct detection of MTBC from clinical specimens.
ID from Culture, Primary Methods (N = 58) Lab Referred:
developed:1Commercially
available: 2
FDA Approved
Probe: 38 HPLC:
14
1 Unknown: 2
Figure 6. Primary methods used by public health laboratories for identification of MTBC from culture.
4
Percent ID Reported Within 21 Days of Specimen Receipt Stratified by Testing Volume (N=49)
Percent First-line DST Reported Within 28 Days
Percent ID Reported Within 21 Days of Specimen Receipt Stratified by Testing Volume (N=49)
Number of public health labs
Mean Percent ID reported within 21 days of specimen receipt
0% 0
0–1000 1001–2000 2001–3000 3001–4000 >4000
Number of TB Suspects with Clinical Specimen Received by Lab
20%
40%
60%
80%
100%
Mea
n Pe
rcen
t ID
Rep
orte
d ith
in 2
1 da
ys o
f Spe
cim
en R
ecei
pt
2
4
6
8
10
12
14
16
18
Num
ber o
f Pub
lic H
ealth
Lab
s
W
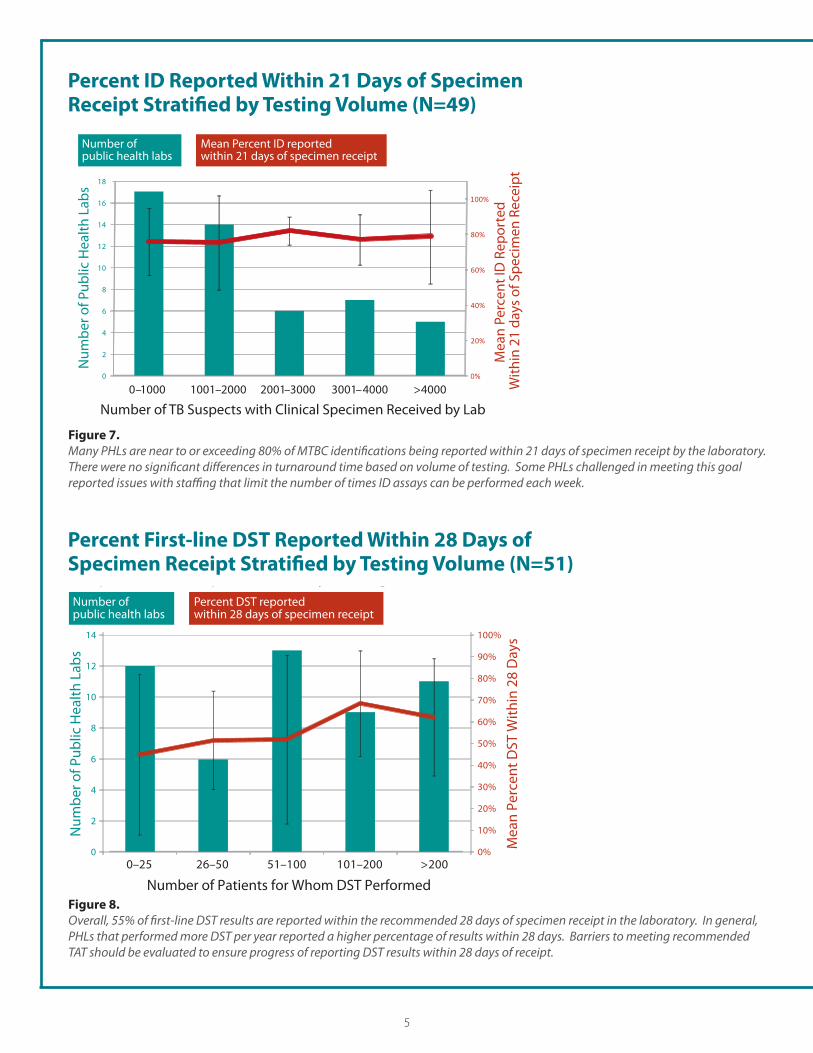
Figure 7. Many PHLs are near to or exceeding 80% of MTBC identifications being reported within 21 days of specimen receipt by the laboratory. There were no significant differences in turnaround time based on volume of testing. Some PHLs challenged in meeting this goal reported issues with staffing that limit the number of times ID assays can be performed each week.
Percent First-line DST Reported Within 28 Days of Specimen Receipt Stratified by Testing Volume (N=51) of Specimen Receipt Stratified by Testing Volume (N=51) Number of public health labs
Percent DST reported within 28 days of specimen receipt
0%
10%
20%
30%
40%
50%
60%
70%
80%
90%
100%
0–25 26–50 51–100 101–200 >200
Number of Patients for Whom DST Performed
Mea
n Pe
rcen
t DST
With
in 2
8 D
ays
0
2
4
6
8
10
12
14
Num
ber o
f Pub
lic H
ealth
Lab
s
Figure 8. Overall, 55% of first-line DST results are reported within the recommended 28 days of specimen receipt in the laboratory. In general, PHLs that performed more DST per year reported a higher percentage of results within 28 days. Barriers to meeting recommended TAT should be evaluated to ensure progress of reporting DST results within 28 days of receipt.
5
Positivity of Isolates Stratified by Volumeof Patient Isolates Tested
Positivity of Cultures Stratified by Volume of Patient Specimens Tested
Positivity of Cultures Stratified by Volume of Patient Specimens Tested
5.2
4.2
4.2
7.7
9.6
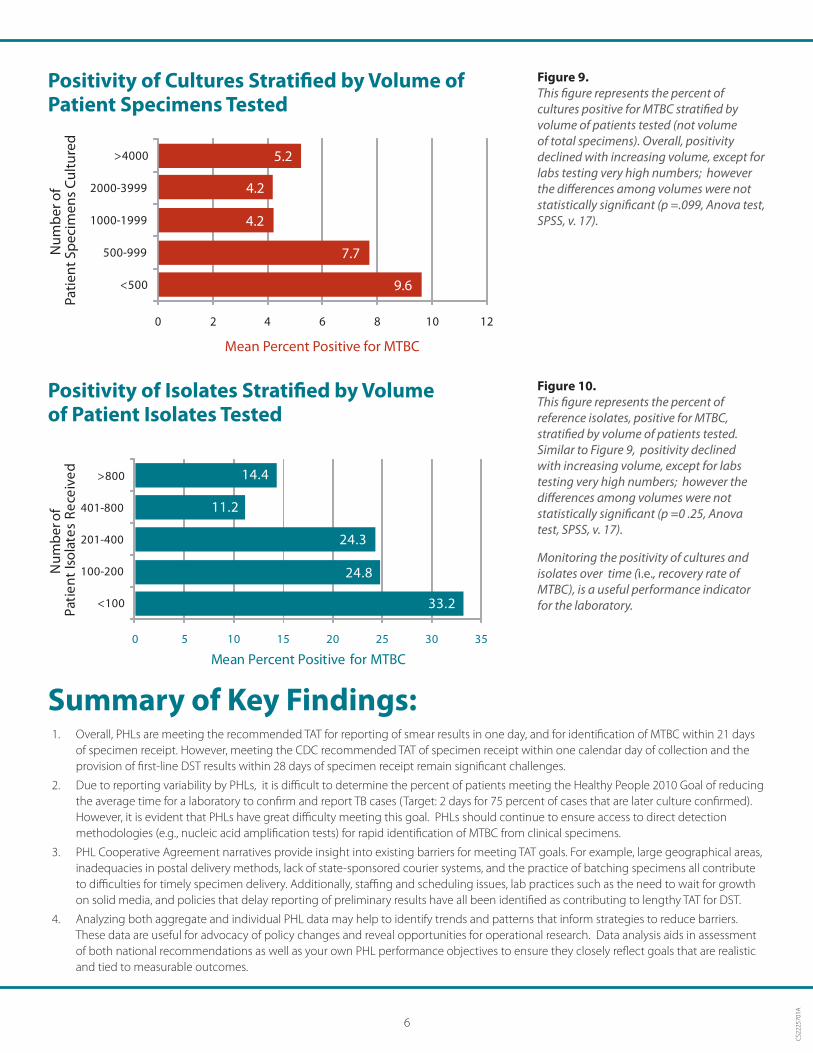
Figure 9. This figure represents the percent of cultures positive for MTBC stratified by volume of patients tested (not volume of total specimens). Overall, positivity declined with increasing volume, except for labs testing very high numbers; however the differences among volumes were not statistically significant (p =.099, Anova test, SPSS, v. 17).
Positivity of Isolates Stratified by Volume of Patient Isolates Tested
350 5 10 15 20 25 30
>800
01-800
01-400
00-200
<100
P
Mean Percent Positive for MTBC
14.4
11.2
24.3
24.8
33.2
Nu
mb
er o
fat
ien
t Is
ola
tes
Rec
eive
d
4
2
1
>4000
000-3999
000-1999
500-999
<500
Patie
nt S
peci
men
s Cu
lture
d
2
Num
ber o
f
1
0 2 4 6 8 10 12
Mean Percent Positive for MTBC
Figure 10. This figure represents the percent of reference isolates, positive for MTBC, stratified by volume of patients tested. Similar to Figure 9, positivity declined with increasing volume, except for labs testing very high numbers; however the differences among volumes were not statistically significant (p =0 .25, Anova test, SPSS, v. 17).
Monitoring the positivity of cultures and isolates over time (i.e., recovery rate of MTBC), is a useful performance indicator for the laboratory.
Summary of Key Findings: 1. Overall, PHLs are meeting the recommended TAT for reporting of smear results in one day, and for identification of MTBC within 21 days
of specimen receipt. However, meeting the CDC recommended TAT of specimen receipt within one calendar day of collection and the provision of first-line DST results within 28 days of specimen receipt remain significant challenges.
2. Due to reporting variability by PHLs, it is difficult to determine the percent of patients meeting the Healthy People 2010 Goal of reducing the average time for a laboratory to confirm and report TB cases (Target: 2 days for 75 percent of cases that are later culture confirmed). However, it is evident that PHLs have great difficulty meeting this goal. PHLs should continue to ensure access to direct detection methodologies (e.g., nucleic acid amplification tests) for rapid identification of MTBC from clinical specimens.
3. PHL Cooperative Agreement narratives provide insight into existing barriers for meeting TAT goals. For example, large geographical areas, inadequacies in postal delivery methods, lack of state-sponsored courier systems, and the practice of batching specimens all contribute to difficulties for timely specimen delivery. Additionally, staffing and scheduling issues, lab practices such as the need to wait for growth on solid media, and policies that delay reporting of preliminary results have all been identified as contributing to lengthy TAT for DST.
4. Analyzing both aggregate and individual PHL data may help to identify trends and patterns that inform strategies to reduce barriers. These data are useful for advocacy of policy changes and reveal opportunities for operational research. Data analysis aids in assessment of both national recommendations as well as your own PHL performance objectives to ensure they closely reflect goals that are realistic and tied to measurable outcomes.
CS2
2257
01A
6