tudent perceptions of leadership accountability and ...€¦ · 6.5 perceptions on the leadership...
TRANSCRIPT

STUDENT PERCEPTIONS OF LEADERSHIP, ACCOUNTABILITY, AND GOVERNANCE OF STUDENT LEADERS AND UNIONS (Findings from Student Perception Survey 2014)

Table of Contents Executive Summary .................................................................................................................................................. 1
1. Introduction ........................................................................................................................................................... 3 1.1 Youth and Politics in Nepal .............................................................................................................................. 3 1.2 Accountability, Leadership, and Governance of Free Student Unions (FSUs) and Student Leaders ............... 4
2. Objective of the Study .......................................................................................................................................... 5 3. Methodology .......................................................................................................................................................... 5
3.1 Survey Questionnaire ....................................................................................................................................... 6 3.2 Sample Size ..................................................................................................................................................... 6 3.3 Data Analysis ................................................................................................................................................... 6
4. Scope and Significance of the Study .................................................................................................................. 6 5. Respondent Demography ..................................................................................................................................... 7 6. Student Perceptions of Leadership ..................................................................................................................... 8
6.1. Knowing the Names of the FSU Representatives ........................................................................................... 8 6.2 Voting in Future FSU Elections ........................................................................................................................ 9 6.3. Interest in Representing the FSU in Future Elections .................................................................................... 10 6.4 Comfort in Sharing Issues with Student Leaders ............................................................................................ 10 6.5 Perceptions on the Leadership Skills of Male and Female Students .............................................................. 11 6.6 Perspectives on the Relationship Between Student Leaders and Campus Administration ............................ 12 6.7 Interest in Becoming a Student Leader in the Future ..................................................................................... 13
7. Student Perceptions of FSU and Student Leader Accountability ................................................................... 13
7.1. Awareness of the Role and Accountability of FSUs ...................................................................................... 13 7.2 Comfort with Expressing Opinions or Problems in Front of the FSU ............................................................. 14 7.3. Perspectives on How FSUs Have Prioritized Female Participation ............................................................... 15 7.4. Perspectives on the FSU as a Liability .......................................................................................................... 16 7.5. Perspectives on FSUs Conducting a Financial Audit .................................................................................... 17 7.6. Perspectives on Student Leader and Politial Student Organization (PSO) Commitment .............................. 18 7.7 Perspectives on the Influence of Mother Political Parties ............................................................................... 20
8. Student Perceptions on FSU Governance ........................................................................................................ 21
8.1. Participation in Decision-making and Planning Meetings .............................................................................. 21 8.2. Perspectives on How FSU Has Addressed Relevant Issues and Facilities ................................................... 21 8.3. Practice of Holding Dialogues and Interactions on Current Issues and Subjects .......................................... 22 8.4. Relationships Between Different PSOs ......................................................................................................... 23 8.5. Leadership Enhancement Opportunities ....................................................................................................... 24 8.6. How Are Relations Between the FSU and Campus Administration? ............................................................. 24 8.7. Need for FSU to Ensure Rights and Improve the Education Standard .......................................................... 25 8.8. Participation in the Decision-making of PSOs ............................................................................................... 26 8.9. Relationship Between PSOs and Campus Administration............................................................................. 26
9. Conclusion and Recommendations .................................................................................................................. 27
1 | P a g e
Executive Summary
The youth in Nepal, particularly college-level students, have played a valuable role in stabilizing the democratic process during the recent transition of political power within the country. Youth have also been instrumental in helping to secure a more comprehensive and inclusive democracy by fighting against social injustice, participating in the democratic struggle, and becoming involved in the processes of community development. One means through which students have become involved with politics on college campuses is through the Free Student Union (FSU), an elected committee of students on campus intended to represent the entire study population. However, many students question the accountability, leadership, and governance of FSUs, having encountered significant challenges with the FSU’s perceived political instability, conflict, political overlapping, and non-democratic culture. Students view FSU leaders as lacking the basic skills for and understanding of democratic processes, governance, accountability, and non-adversarial advocacy to respond to constituents’ needs. Some students believe that this leads FSUs to resort to methods that disrupt campus functions instead of improving them. This in turn causes some students to lose trust in the FSUs, withdraw from student politics, and disengage from the democratic-building process. This study was conducted by Search for Common Ground (SFCG), FACTS Research & Analytics, and Alliance for Peace (AfP) to examine the current status of youth politics and to assess students’ perceptions of peer leader and FSU accountability, leadership, and governance. This perception study was part of a larger nine-month long project started by SFCG and AfP designed to improve participation in and perceptions of FSUs, as well as to assess youth views on student politics after program implementation. A clearer understanding of student experiences and relations with student political parties and their leaders will enable appropriate program design in the future, thereby contributing to a stronger democratic process. Although the study is broadly quantitative in nature, it also pulls from a variety of other research methods such as a literature review and qualitative analyses from previous focus group discussions. This information can be applied to the design and evaluation of future student political programs, dialogues, or focus group discussions. The study employed a simple random sampling strategy; 554 total students were randomly selected from the sampled campuses, including those directly and indirectly affiliated with student politics. The survey used a simple random sampling technique to achieve a politically diverse sample. Highlights from the perception survey findings include:
Student Perceptions of Leadership
18 percent of surveyed students were unaware of the representatives of the FSU. Trichandra students were the least aware, with 43 percent of its students reporting that they did not know the names of the FSU representatives.
64 percent of students reported that they would cast their votes in the next FSU elections.
34 percent of the respondents did not want to represent FSU in future elections.
Student attitudes toward student leaders were mainly negative.
Respondents from the all-women college felt that women were more capable as leaders, whereas respondents from co-educational campuses thought that men had more capacity.
Only 27 percent of students would become a student leader if given the chance.
Students’ Perceptions of FSU and Student Leader Accountability
Over a third of the respondents (39 percent) were not aware of the role and accountability of FSU.
Only 29 percent of students believe that student organizations PSOs work to on ensuring rights and providing facilities to students.

2 | P a g e
25 percent% of students thought that the mother parties were very influential and that at least the majority of decisions (if not all) were made through pressures from these political parties.
Student Perceptions of Free Student Union Governance
A greater percentage of women compared to men (34 percent vs. 31 percent) did not participate in FSU decision-making processes and planning meetings.
33 percent of all students did not participate in FSU meetings.
Even among politically active students, only 56 percent took part in FSU meetings.
38 percent of students did not know whether the FSU or campus administration conducted any programs on leadership enhancement.
63 percent of students thought that the relationship between FSU and campus administration was at least workable, or better.
46 percent of students said that there is a need for FSUs to ensure students’ rights and improve the education standard.
33 percent of students did not participate in the decision-making or planning meetings of political student organizations.
The findings suggest that students generally do not currently see FSUs as actual working toward good leadership, accountability, and governance. Student attitudes toward student leaders and on-campus political organizations were mostly negative; many students viewed organizations like FSUs as operating only for their individual interests. Most negative was the perception among women, with a small percentage taking part in FSU meetings and the majority of respondents stating that political organizations did not listen to the concerns of women. Students were largely unaware of the financial workings of their relevant FSU, though most argued that the FSU must conduct audits to maintain transparency. Despite largely negative public perception of FSUs, students seemed willing to vote in the next round of campus elections. This report is intended to be a scientific tool that acts as a reference for future perception studies of this vein. Survey findings will be of great use to researchers, donors, FSUs, campus administrations, student leaders, and mother political parties as they provide insight into the opinions of the constituents they are meant to serve. Through this project, SFCG, FACTS, and AfP seek to provide a platform to think about—and build—student capacity and potential for governance and civic engagement.

3 | P a g e
1. Introduction
1.1 Youth and Politics in Nepal
The National Youth Policy has recognized that youth are an invaluable asset to the nation, acknowledging youths’ role as agents of economic, social, and political change. The policy emphasizes the capacity of youth in mainstream national development. One of the major aims of the policy is to boost the involvement of youth in the economic, social, and governance, during the transition process of our nation. The definitions of youth by age vary drastically across different institutions. The Youth Policy has defined youth as individuals between the ages of 16 to 40 (including women, men, and third gender), while the UN defines youth as those between the ages of 15 and 24. On the other hand, civil society groups advocate for an age bracket of 15 to 29 years, as mentioned in the draft policy (National Youth Policy, 2010). According to the 2011 census, 28 percent of the population fell in the age bracket of 15 to 24 years old, while 40 percent fell into the 15 to 29 years category. Almost half of Nepal’s population can thus far into the youth category. The youth in Nepal, especially college-level students, have played a valuable role during the recent transition of political power within the country and in helping to secure a more comprehensive democracy by fighting against social injustice, participating in the democratic struggle, and becoming involved in the processes of community development.1 A thriving democracy requires participation. Youth participation in particular can be constructive to strengthening democratic processes. For civil society to be strong, it is important to enhance the capacity of potential political leaders and advocate for improved accountability and governance in politics. Youth have been at the forefront of past popular movements, such as in 1951 when students organized protests against the government to end the 104-year-long autocratic Rana Regime. Similarly, they helped to bring an end to the three-decade long Panchayeti System in 1990 that established the multi-party system and the constitutional democracy. In April 2006, youth also helped to end a 239-year-old monarchy by protesting and restoring the democracy that was overruled by the King in 2004. Indeed, youth have played an active role in social change by bringing national attention to political and social concerns that might have otherwise been ignored by the political system, such as promoting women’s leadership and participation in politics. It is evident that youth have contributed significantly to guiding public opinion and social reform in Nepal. However, youth are often targeted during periods of conflict, while some are found driving the violence. Youth have acted as both human rights violators and victims of civil war. According to Population Action International, 80% of civil conflicts between 1970 and 1999 occurred in countries where at least 60% of the population was under the age of thirty. As noted by Alliance for Peace (2009), many students engage in an action-oriented protest and try to achieve reform through violent measures when they do not feel that their concerns are being addressed, rather than through more constructive methods such as lobbying or holding collaborative dialogues between student representatives and political parties. As a result of this tradition of protest, many youth have been victimized, suffered direct violence, lost educational and vocational opportunities, and have been displaced.2 The protection, socioeconomic integration, and participation of youth are therefore important elements for developing cooperative relationships and political reform. Although university students represent a small proportion of their generation, they have a large impact on the success of national party politics, as engagement in student politics is the professionalizing path into mainstream politics.3 In the post-1990 democratic era, student organizations have had a codependent relationship with
1 Alliance for Peace (2009), Youth in Transitional Nepal: Issues and Perceptions. 2 British Council (2011), Youth Survey of Nepal. 3Snellinger, Amanda (2011), The Young Political Generation Today, Five Years Later (Himalaya, the Journal of the Association for Nepal and Himalaya Studies: Vol. 31: No. 1, Article 15).

4 | P a g e
Nepal’s political parties. However, that student politics is incorporated into mainstream party politics creates a gap between politically active and non-active students. In many cases, the political mother parties take advantage of youth enthusiasm and idealism by mobilizing students to achieve what they had not been able to achieve in the past.4 The gap between politically active and non-active students is widening due to this process. It is imperative that youth who are involved in party politics emphasize the goals of the overall student body while promoting and practicing democratic processes. Furthermore, it is important that student politics incorporate mainstream politics in order to keep youth engaged at the national level
1.2 Accountability, Leadership, and Governance of Free Student Unions (FSUs) and Student Leaders
According to the Tribhuvan University Regulation Act 348, the Free Student Union (FSU) was established in 1980 with the goal of promoting good governance on campus. The FSU is a legally elected committee of students on campus intended to represent the whole student body. It comprises eleven to fifteen elected student representatives per campus, depending on the size of the total student population. The major roles of the FSU are to protect the rights of the students, organize and implement student programs, create a balanced academic environment on campus, maintain discipline among students, engage students in creative development activities, and resolve students’ issues and concerns by coordinating between students and the campus. However, many students question FSU accountability, leadership, and governance. The FSUs face significant challenges with political instability, conflict, political overlapping, and non-democratic culture.5 For example, elections for the FSU are supposed to occur once every two years. However, the last FSU election took place almost five years ago, while elections have been postponed indefinitely after student unions padlocked campus doors throughout the country in 2013. By not holding regular elections, FSUs are not abiding by Regulation Act 348. This also suggests that the same representatives have been serving their terms for much longer than sanctioned. Similarly, it is common knowledge that Nepali student leaders are often older than typical university students; many leaders retain their positions until they feel their aspirations have been fulfilled.6 Students are thus losing trust in the integrity of the FSUs, ultimately withdrawing from student politics and the democratic process. FSU representatives in turn are detached from their constituents, struggle with inter- and intra-party conflict, comprise predominantly men, and use adversarial methods to get heard. These attributes suggest that FSUs suffer from poor governance that lacks equity, balanced participation, and accountability. In addition, many students lack respect for campus administrators,7 which in turn has a direct impact on the university’s ability to deliver services. Furthermore, some student leaders lack basic skills—negotiations, consensus-building, non-adversarial advocacy, etc.—that would otherwise enable them to respond to constituents’ needs. This causes leaders to resort to methods that disrupt basic campus functions and threaten democratic processes. FSUs have further developed a negative reputation for opposing attempts to improve the situation. All government and most private colleges have active political party student wings that serve as incubators for emerging political leaders. While there have been efforts in the last few years to strengthen youth political leaders and groups, many of these efforts were focused on these
4Snellinger, Amanda (2005), A Crisis in Nepali Student Politics? Analyzing the Gap between Politically Active and Non-Active Students. 5Sahi, Hari Bhakta (2008), Role of Free Student Union in Tribhuvan University: A Governance perspective. 6 Snellinger, Amanda (2011), The Young Political Generation Today, Five Years Later (Himalaya, the Journal of the Association for Nepal and Himalaya Studies: Vol. 31: No. 1, Article 15). 7 Rai, Om Astha (2010), 10 campus chiefs quit to protest student excesses. http://archives.myrepublica.com/portal/index.php?action=news_details&news_id=22293
5 | P a g e
organizations’ national and regional structures. Many youth leaders feel frustrated with the student political scene when compared to national-level political movements, while students in general are not interested in politics.8 Although youth politics happen directly on campuses, there is a dearth of programs that directly target student leaders of preliminary committees or FSUs. Student politics affect the broader democratic environment. They help to promote civic participation and facilitate democratic processes among youth. Youth play a major role in the lead-up to national elections, as they did before the intended release of the new Constitution or in times of civil unrest and protests against various governments. Following a focus group discussion facilitated by SFCG in February 2014, one student expressed the following about the role of student leaders:
“If we are to bring about good governance, the change has to start from ourselves…If there is a group that [wants] to do an activity for the development of the campus, we [should] support them as much as we can.”
While FSUs and its student leaders are continuously evolving, many people view the new generation of young politicians as the solution to the current political impasse.9 There is a need to encourage improvements in accountability, leadership, and governance among these students organizations, which in turn could promote further participation and involvement in not only FSUs, but also in other civil society committees.
2. Objective of the Study
Along with partners Alliance for Peace (AfP) and FACTS Research & Analytics, SFCG designed and conducted a perception survey to measure student perceptions of the effectiveness of student leaders and the Free Student Unions (FSUs) on the basis of accountability, leadership, and governance. The study was conducted in three campuses, including the Saraswati, Padma Kanya, and Tri-Chandra campuses. This study was part of a larger nine-month SFCG and AfP project aimed at improving student perceptions of FSUs, encouraging greater participation, and assessing the perceptions of student politics after program implementation. The main objectives of this survey were to understand the current status of youth politics and examine student perceptions of leader and FSU accountability, leadership, and governance. These insights can be applied to the design and evaluation of future student political programs or focus group discussions.
3. Methodology
Although the study is broadly quantitative in nature, it employs various methods such as a literature review and focus group discussions. The survey thus complements quantitative analysis with qualitative methods to gain insight into how college students view FSUs, student leaders, and student political organizations. The survey work was carried out on three campuses: Padmakanya Campus, Saraswati Campus, and Trichandra College. A total of eight enumerators were hired to carry out the survey. The enumerators were trained to conduct interviews and engage with respondents in an effective manner. Enumerators were pre-tested after they being briefed, with the aim of providing them with on-site coaching to explain the entire process. During the pre-test, SFCG Design, Monitoring, &Evaluation (DM&E) staff clarified key issues, areas of confusion, and questions regarding the contents of the survey.
8Snellinger, Amanda (2011), (Himalaya, the Journal of the Association for Nepal and Himalaya Studies: Vol. 31: No. 1, Article 15). 9Same as above.

6 | P a g e
3.1 Survey Questionnaire
Through a consultative process with university stakeholders, SFCG, AfP, and FACTS Research & Analytics developed a public perception poll to measure perceptions of FSU effectiveness in democratic processes, leadership, inclusive governance, and accountability. The survey was designed to cover broadly quantitative modules in order to capture the current perceptions of students towards FSUs, student leaders, and campus-level political organizations. The survey consisted of a total of 26 questions. Some questions used a Likert Scale (rating scale) of 1 to 5 to capture student perceptions, with 1 indicating ‘strongly disagree’ and 5 being ‘strongly agree.’ The scale component attributes a quantitative value to qualitative information so as to make the results more conducive to statistical analysis.
3.2 Sample Size
The study employed a two-stage stratified cluster sampling strategy. First, three targeted campuses were selected. Second, respondents were selected based on their political affiliation. The sample size was calculated from a formula to estimate and reflect the proportion of the population. Due to unknown variability, =0.5 (maximum variability) was assumed. The sample size was calculated based on the standard 95% confidence level and around ±5% (0.05) precision. Although a total of 384 respondents should have been sufficient to represent the three campuses, the survey attempted to engage 550 students to insure against non-response. The sample size covers the whole targeted population, including those directly and indirectly affiliated with student politics. The survey used a simple random sampling in order to achieve a politically, ethnically, and socio-culturally diverse and representative sample. The response rate of the survey was nearly perfect.
3.3 Data Analysis
After data collection, the DM&E team cross-checked all data for completeness, validity, consistency, and accuracy. The data collected from the field survey was entered using Census and Survey Processing System (CSPro) software. It was then exported to the Statistical Package for Social Sciences (SPSS) for analysis. The data collected from the field survey is presented in tabular and graphical form. For data designed to identify knowledge, attitude, and behavior related particular impacts, the Chi-square has also been used for hypothesis testing. The results have been tested at five percent significance.
4. Scope and Significance of the Study
The study identified students’ perceptions and levels of satisfaction regarding FSUs, student leaders, and political organizations. The recommendations that have been made are based on the results from this study and will contribute to identifying areas in which students and organizations can work together to improve democratic processes and governance throughout university campuses in Nepal. Finally, the survey findings will serve as a useful reference on student opinion for researchers, donors, FSUs, campus administrations, student leaders, and mother political parties. Likewise, this survey will not only measure changing perceptions of the FSU among its constituency, but also serve as a scientific tool that can be a reference for future perception studies in this field.

7 | P a g e
5. Respondent Demography
The quantitative survey reached a total of 554 students across the three sampled campuses. The respondent demographic table is presented below. Of the sampled students, 43 percent of students were surveyed in Padmakanya, 34 percent in Saraswati, and 23 percent in Trichandra Campus.
The majority of respondents were female, as one of the surveyed campuses was an all-women campus. With 64 percent of respondents being women and 36 percent being men, the female to male ratio was nearly 2 to 1. A majority of respondents (60 percent) fell in the ‘20 to 24’ age category, followed by 21 percent in the ‘below 20’ and 18 percent in ‘25 to 29’.
Table (1) Respondent Demography
SN Disaggregation Sample Size
Number Percentage
Total 554 100%
1 By campus
Padmakanya 238 43%
Saraswati 187 34%
Trichandra 129 23%
2 By sex
Female 354 64%
Male 200 36%
3 By age
Below 20 117 21%
20-24 330 60%
25-29 97 18%
Above 30 10 2%
4 Membership in political student organization (PSO)
Yes 216 39%
No 242 44%
Do not want to disclose 96 17%
5 Level of involvement in PSO
Active 112 20%
Moderate 57 10%
Few 98 18%
No 287 52%
5 By political membership/affiliation
ANNFSU 32 6%
ANNFSU (Revolutionary) 116 21%
NSU 63 11%
Others 0 0%
Not disclosed 70 13%
Not affiliated 273 49%
44 percent of students are not actively involved in a political student organization (PSO). 44 percent of respondents were not affiliated with any PSOs, while 39 percent reported affiliation. 17 percent did not want to disclose this information. 20 percent of respondents were actively involved in campus politics, 10 percent were moderately involved, 18 percent were insignificantly involved, and more than half the students (52 percent) denied active participation in student politics. 49 percent of students are not affiliated with any political ideology. Respondents were asked about their membership in PSOs as an optional question. 49 percent of students reported no affiliation to any political organization, while 13 percent of students did not want

8 | P a g e
to disclose their political membership. 21 percent of students reported that they were affiliated with ANNFSU (Revolutionary) and another 11 percent were affiliated with NSU. Fewer respondents (6 percent) indicated that they were affiliated with ANNFSU.
6. Student Perceptions of Leadership
Those who come into politics from the college-level often lack a sophisticated understanding of democratic values and the capacity to apply democratic practices to governance. Many students are often manipulated by their leaders for political interests or gains. Much of the ineffectiveness and lack of accountability among political parties trickle down to college-level student political unions that shape the next generation of political leaders to follow the same norms of performance. Student leaders are often seen as acting in the interest of political parties rather than representing and being accountable to their fellow students. This influences the attitudes of other students toward politics and political leaders. Students are thus growing increasingly apathetic toward politics and democratic processes; this repels many capable students with leadership potential from politics. This cycle is counter-productive in consolidating and strengthening democratic processes and shaping future leaders.
6.1. Knowing the Names of FSU Representatives
18 percent of surveyed students did not know their FSU representatives. Trichandra students were the least aware, with 43 percent of its students reporting that they did not know the names of FSU representatives. 18 percent of all surveyed students did not know the names of their FSU representatives. The survey reveals that Trichandra students were the least aware, with 43 percent reporting that they did not know the names of their FSU representatives. When students were asked to write down the names of three FSU representatives, only 70 percent of those who claimed to know the names were able to do so. Furthermore, while 98 percent of Saraswati students reported that they knew the names of the representatives, only 41 percent of these students were actually able to identify three individual FSU representatives. Of the Padmakanya students who claimed familiarity with FSU representatives, 95 percent were able to write the correct names. On average, the majority of students from each campus were able to name three student representatives.
More male respondents (six percent) reported that they did not care about the names of the FSU representatives, compared to three percent of female respondents. 79 percent of males reported knowing the names of representatives, compared to 77 percent of females.
Don't care4%
Yes78%
No18%
Figure (1): Do you know the names of the representatives of FSU?

9 | P a g e
While 79 percent of male students reported that they knew the names of the representatives, only 51 percent of them were actually able to correctly identify three FSU representatives. 80 percent of women who claimed to know FSU representative names were able to write down three names correctly. Of students who claimed membership in a PSO, 96 percent reported knowing the names of FSU representatives compared to 61 percent of students who were not in a PSO. While 96 percent of students with PSO membership reported that they knew the representatives’ names, only 61 percent of them were actually able to identify three FSU representatives. No student involved in politics reported not knowing the names of FSU representatives. While 95 percent of students moderately active in campus politics reported knowing representatives’ names, only half were actually able to identify three. Similarly, only 35 percent of students insignificantly involved in campus politics who nonetheless claimed knowing the representatives (94 percent) were actually able to write down the names.
6.2 Voting in future FSU elections
64 percent of students reported that they would cast their votes in the next FSU election. 64 percent of students said they would cast their vote in future elections, while 11 percent said they would not. The largest percentage of students who stated that they would vote in future elections was from the Saraswati campus (83 percent), followed by the Padmakanya campus (55 percent), and then the Trichandra campus (51 percent). More men (74 percent) than women (58 percent) said they would cast their vote, but a larger percentage of men (16 percent) than women (9 percent) also stated that they did not care about this topic.
A majority of students who are at least a little involved in campus politics reported that they would vote in future elections. 81 percent of moderately involved students said they would vote, compared to 72 percent of active students, 68 percent of insignificantly involved students, and 56 percent of non-active students. 64 percent of PSO members would cast their vote on average, with the highest percentage consisting of those who were non-disclosed (81 percent). People with no memberships had the lowest percentage in regards to casting their vote in future elections (50 percent).
Total
Female
Male
14%
16%
8%
12%
9%
16%
11%
17%
64%
58%
74%
Figure (2): Will you cast your vote in future FSU elections?
Can't say Don't care No Yes

10 | P a g e
6.3. Interest in Representing the FSU in Future Elections
34 percent of respondents do not want to represent the FSU in future elections. 55 percent of Saraswati students reported that they wanted to represent the FSU in future elections, followed by 36 percent of Padmakanya students and 19 percent of Trichandra students. On average, 38 percent of students wished to represent the FSU in the future for all three campuses. More men (44 percent) and fewer women (36 percent) reported a desire to represent their FSU.
The active (60 percent) and moderately active students (61 percent) wished to represent the FSU more than did other groups. On average, 34 percent of students stated that they did not want to represent the FSU in the future. Across the differing levels of PSO membership, the group that wanted to represent their FSU most was members (52 percent). Only 21 percent of non-members wanted to represent the FSU, the lowest percentage among all the groups.
6.4 Comfort in Sharing Issues with Student Leaders
On average, only a fourth of students thought that leaders listened to them and implemented their suggestions. The Saraswati campus had the largest percentage of students who thought this (35 percent), followed by the Padmakanya (23 percent) and Trichandra campuses (12 percent).
Table (1): How comfortable do you feel raising your issues and problems in front of the student leaders?
Disaggregated by campus Padmakanya Saraswati Trichandra Total
N % N % N % N %
Don’t want to say 27 11% 14 7% 10 8% 51 9%
Don’t care 11 5% 6 3% 28 22% 45 8%
Leaders don't listen to student issues and problems 11 5% 0 0% 3 2% 14 3%
Leaders only listen to people they know 55 23% 24 13% 35 27% 114 21%
Leaders listen but don't work on its implementation 32 13% 8 4% 19 15% 59 11%
Leaders listen but implement only few 47 20% 69 37% 18 14% 134 24%
Leaders listen and work on effective implementation 55 23% 66 35% 16 12% 137 25%
Total 238 100% 187 100% 129 100% 554 100%
Total
No
Few
Moderate
Active
27%
25%
43%
26%
20%
38%
26%
37%
61%
60%
34%
49%
20%
12%
21%
Figure (3): Do you wish to represent FSU in future FSU elections?
Can't say Yes No

11 | P a g e
Comparable percentages of men (26 percent) and women (24 percent) felt that leaders listened to and implemented student suggestions. The percentage differences between men and women in their response to the other answers were also small.
Those who were active (29 percent) or moderately active (32 percent) in campus politics had a higher percentage of individuals who believed student leaders hear and work on implementing student opinions than non-active students (23 percent).
6.5 Perceptions on the Leadership Skills of Male and Female Students
Respondents from the all-women college felt that women were more capable as leaders, whereas respondents from co-educational campuses thought that men had more capabilities. When asked if respondents had noticed differences in leadership capabilities across genders, Padmakanya students believed that women were more capable than men, whereas both Saraswati and Trichandra students believed that men were more capable (with almost half of Saraswati students thinking this). However, 41 percent of Saraswati students also believed that both men and women could be capable leaders. An average of 12 percent believed that men were ahead of women because women had not been provided with adequate opportunities. Only 14 percent of women believe that women are more capable, while 20 percent of women believe that men are more capable. 44 percent of men believe that they are more capable, compared to only 2 percent who believe women are more capable. More females (16 percent) than males (4 percent) believe that men are ahead because they have been provided with adequate opportunities. More men (29 percent) than women (24 percent) felt that male and female leaders were equally capable. A similar percentage of students (28 to 29 percent) in all categories of political activeness—except those who were only sometimes involved (14 percent)—thought that both men and women were equally capable.
Don't want to say9%
Don't care8%
Leaders don't listen to student issues
and problems 2%
Leaders only listen to people they know
21%
Leaders listen but don't work on its implementation
11%
Leaders listen but implement only few
24%
Leaders listen and work on effective implementation
25%
Figure (4): How comfortable do you feel putting forward your issues and problems in front of the student leaders?

12 | P a g e
6.6 Perspectives on the Relationship between Student Leaders and Campus Administration
On average, a majority of students (64 percent) thought that the relationship between student leaders and campus administration was workable or better. A smaller percentage of Trichandra students believed that the relationship was at least workable (41 percent) when compared to the Padmakanya (67 percent) and Saraswati (75 percent) campuses. A significantly larger percentage of women (67 percent) than of men (56 percent) believed that relations were workable or better. More women (12 percent) than men (4 percent) believed that relations were not good. More PSO members (75 percent) than non-members (50 percent) felt that the relationship was workable or better.
0%
10%
20%
30%
40%
50%Can't say
Neither is capable
Male are aheadbecause female haven't
been provided withadequate opportunities
Female are morecapable compared to
male
Male are more capablecompared to female
Both are capable
Figure (5): In terms of leadership skills and capabilities, have you noticed any differences between male and female leaders?
Female Male
Can't say26%
Worst 2%
Overall not good9%
Workable 38%
Good17%
Excellent8%
Figure (6): How is the relationship between student leaders and campus administration?

13 | P a g e
6.7 Interest in Becoming a Student Leader in the Future
Only 27 percent of students would become a student leader if given the chance. An average of 49 percent of students did not care or know whether they would become a student leader if given the opportunity. It was found that Trichandra students demonstrated the least interest in becoming future student leaders (21 percent), in comparison to 24 percent of Padmakanya students and 37 percent of Saraswati students. More men (34 percent) than women (24 percent) expressed desire to become a student leader. 47 percent of politically active students, 46 percent of moderately active students, and 27 percent of sometimes active students wished to be future student leaders. Only 16 percent of non-active students professed the same sentiment.
Table (2): If given the opportunity, do you wish to become a student leader in the future?
Disaggregated by sex Female Male Total
N % N % N %
Can’t say 151 43% 78 39% 229 41%
Don’t care 25 7% 17 8% 42 8%
I am currently a student leader 38 11% 15 8% 53 10%
Yes 85 24% 67 34% 152 27%
No 55 16% 23 12% 78 14%
Total 354 100% 200 100% 554 100%
7. Student Perceptions of FSU and Student Leader Accountability
The major roles of the FSU are to protect the rights of the students, organize and implement student programs, create a balanced academic environment on campus, maintain discipline among students, engage students in creative development activities, and resolve students’ issues and concerns by coordinating between students and the campus. However, FSUs face big challenges of political instability, conflict, political overlapping, and non-democratic culture, prompting many students to question their accountability.
7.1. Awareness of the Role and Accountability of FSUs
Over a third of the student respondents (39 percent) were not aware of the role and accountability of FSUs. When asked if aware of the role and accountability of the FSUs, over a third of respondents (39 percent) said that they were not aware. As shown in Table (9), the students at Trichandra Campus were the least knowledgeable on the role and accountability of FSUs, with 64 percent of the students reporting that they were unaware. Padmakanya (37 percent) and Saraswati (26 percent) students claimed lack of awareness in fewer numbers. Of the 72 percent of Saraswati students who reported knowing the role and accountability of FSU, only 60 percent were actually able to list three specific details therein. As Table (3) indicates, female students were less knowledgeable about FSUs than male students, with just half of females (51 percent) reporting that they were aware of the role and accountability of FSUs. Similarly, females (5 percent) cared a bit less about the role and accountability of the FSU than did males (4 percent).
Table (3): Are you aware of the role and accountability of FSU?
Female Male
Don’t care Yes No Total
N % N % N % N %
Female 16 5% 180 51% 158 45% 354 100%
Male 8 4% 133 66% 59 30% 200 100%
Total 24 4% 313 56% 217 39% 554 100%
When compared to politically active students, students who were not actively engaged in campus politics did not seem to care about the roles and accountability of the FSU, as 54 percent of those who denied activeness in campus politics did not know the roles and responsibilities of FSU. A large percentage (84 percent) of students who are active in student politics reported knowing the role and

14 | P a g e
accountability of FSUs, while only 71 percent of these students were actually able to list three responsibilities of the FSU.
7.2 Comfort with Expressing Opinions or Problems in Front of the FSU
Only 13% of the students felt that the FSU listened to them; fewer women than men felt this way. On average, only 13 percent of all students thought that the FSU listened to them and implemented the suggestions that were given to them. Only 26 percent of Trichandra students felt that the FSU listened to suggestions and implemented at least a few changes, compared to 37 percent of Padmakanya students and 64 percent of Saraswati students. Fewer women (10 percent) than men (18 percent) thought that FSUs listened to and implemented their suggestions. More women (26 percent) than men (18 percent) thought that FSUs only listened to students they already knew.
Table (4): How comfortable are you putting forward your opinion or problem in front of FSU?
Disaggregated by campus Padmakanya Saraswati Trichandra Total
N % N % N % N %
Don’t want to say 34 14% 11 6% 9 7% 54 10%
Don’t care 9 4% 12 6% 38 29% 59 11%
FSU don't want to hear any opinion or problem 10 4% 5 3% 14 11% 29 5%
They only listen to students they know 78 33% 29 16% 21 16% 128 23%
They listen to the opinion/problems but don't ever implement 18 8% 10 5% 13 10% 41 7%
They listen to the opinion/problems but implement only few of those
76 32% 78 42% 18 14% 172 31%
They listen as well as implement the opinion/problems 13 5% 42 22% 16 12% 71 13%
Total 238 100% 187 100% 129 100% 554 100%
26 percent of students moderately active in campus politics believed that the FSU listened to and implemented others’ suggestions. A clear difference could be seen between active students (36 percent) and all others (average 23 percent) in their response to the statement ‘FSU only listens to students it knows.’
Don't want to say
Don't care
FSU don't want to hear any opinion orproblem
They only listen to students they know
They listen to the opinion/problems butdon't ever implement
They listen to the opinion/problems butimplement only few of those
They listen as well as implement theopinion/problems
12%
7%
6%
26%
7%
33%
10%
6%
17%
4%
18%
8%
28%
18%
Figure (7): How comfortable are you discussing issues and problems with the FSU?
Male Female

15 | P a g e
Only 19 percent of PSO members thought that the FSU listened to and implemented student suggestions. Fewer non-members (5 percent) felt the same way, while 19 percent of people who did not disclose their membership status agreed. Interestingly, a larger percentage of undisclosed individuals (30 percent) compared to members (25 percent) and non-members (18 percent) thought that FSUs only listened to those close to them.
7.3. Perspectives on How FSUs Have Prioritized Female Participation
58 percent of students feel that the participation of female members has been prioritized to some extent. 40 percent of Trichandra students either did not know or care about this issue. On average, 36 percent of all students thought that females had been effectively prioritized. Only 34 percent of Trichandra students felt that the FSU prioritized females at least to some extent, compared to 57 percent of Padmakanya students and 76 percent of Saraswati students. A larger percentage of women (13 percent) than men (9 perecent) did not know about FSU prioritization of female participation, while a larger percentage of men did not care about this issue. More men (40 percent) than women (33 percent) felt that female members had been effectively prioritized.
44 percent of respondents that claimed PSO membership believed that female members had been effectively prioritized, compared to 31 percent of non-members. There was no clear trend among differently politically active student groups except that more active members than non-active members cared about this issue, were knowledgeable on the topic, and believed that women had been prioritized to some extent.
0%
10%
20%
30%
40%Don't know
Don't care
Female hasn't beenprioritized
Prioritize in saying butnot in practice
Prioritize to some extent
Female has beeneffectively prioritize
Figure (8): How have FSUs prioritized the participation of female members?
Female Male

16 | P a g e
7.4. Perspectives on the FSU as a Liability
Only 29 percent of students think FSU has been accountable. On average, only 29 percent of students agreed that FSUs have been accountable. 35 percent of respondents disagreed with all the six statements below:
The FSU has been able to improve education (31% disagreed; 31% agreed).
The FSU can make decisions without pressure from political parties (33% disagreed; 28% agreed).
The FSU follows the norms and values of democratic practices (36% disagreed; 30% agreed).
The FSU is financially transparent (37% disagreed; 29% agreed).
The FSU has been effectively managing welfare funds (37% disagreed; 29% agreed).
The FSU has been involved in participatory decision-making and planning (37% disagreed; 30% agreed).
Table (5): Has the FSU been accountable for its performance in the following areas?
Don’t know Strongly disagree
Disagree Neutral Agree Strongly agree
N % N % N % N % N % N %
The FSU has been able to improve the education system
145 26% 132 24% 41 7% 65 12% 126 23% 45 8%
The FSU can take decision without pressure from political parties
136 25% 125 23% 57 10% 77 14% 107 19% 52 9%
The FSU follow the norms and values of democratic practices
120 22% 134 24% 65 12% 72 13% 115 21% 48 9%
The FSU is financially transparent
115 21% 140 25% 69 12% 67 12% 122 22% 41 7%
The FSU has been effectively managing the welfare fund
118 21% 148 27% 57 10% 69 12% 121 22% 41 7%
The FSU has been involved in participatory decision-making and planning
115 21% 147 27% 56 10% 68 12% 118 21% 50 9%
Total 749 23% 826 25% 345 10% 418 13% 709 21% 277 8%
The largest differences between those that agreed and disagreed were related to welfare fund management and financial transparency. There is a difference of 8 percentage points between those who do and those who do not believe that the FSU has been effectively managing the welfare fund, or that the FSU has been financially transparent. There was strongest overall disagreement with the statement that FSUs can make decisions without pressure from political parties. Padmakanya students disagreed most strongly with this statement with an average of 1.96 on the Likert scale, meaning that most students disagreed with this statement. On the other hand, Saraswati students averaged a mean of 3.63, which suggests that most of these students are leaning toward agreement with this statement. Overall, Padmakanya students disagreed the most with the positive statements given, followed by Trichandra and Saraswati. Though Saraswati students were most positive in their feelings on these issues, an of 3.42 on the Likert Scale for all statements shows that the students were not strongly satisfied with FSU activities (see Figure 9 below). Men were more positive than women on every statement. The largest difference (0.99 points) was with the statement ‘FSU can make decisions without pressure from political parties.’ Another

17 | P a g e
significant difference (0.96 points) was observed in the statement ‘FSU follow the norms and values of democratic process.’
Students with expressed political affiliations had a more positive perception overall toward the FSU; their Likert Scale mean of 3.00 suggests a neutral outlook. In comparison, non-PSO-members averaged a Likert Scale score of 2.30; most students disagreed with the above statements about the FSU. For PSO members, there was greatest disagreement with the statement ‘FSU is financially transparent.’ For non-members, the statement ‘FSU can make decisions without pressure from political parties’ received the most disagreement. Students who were involved in campus politics had a more positive perception of the FSU than those who were not involved. However, students who were rarely involved in politics showed the most positive outlook toward the FSU, followed by those moderately involved and those actively involved. Active students disagreed the most with the statement ‘FSU has been involved in participatory decision-making and planning.’ The results indicate that a large percentage of students think that FSUs are not accountable and have not been performing well in their roles.
7.5. Perspectives on FSU Conducting a Financial Audit
The majority of FSU members appear to have minimal regard for transparency (none of them do public audits) and accountability to constituents or authorities. Much of the ineffectiveness and lack of accountability seen in national-level political parties is negatively influencing the norms and behaviors of university students with the greatest likelihood of entering politics after graduation. 80 percent of students believe that FSUs should conduct financial audits. A majority of students (80 percent) believe that FSUs should conduct financial audits, with the percentage being highest at Saraswati campus (94 percent), followed by Padmakanya campus (74 percent) and Trichandra Campus. More men (83 percent) than women (78 percent) held this belief. More PSO members (86 percent) than non-members (72 percent) stated that there is a need for FSU to conduct financial audits. Students of all levels of involvement in campus politics (active, moderate,
The FSU has been effectively managingthe welfare fund
The FSU is financially transparent
The FSU has been involved inparticipatory decision making and
planning
The FSU follow the norms and values ofdemocratic practices
The FSU can take decision withoutpressure from political parties
FSU has been able to improve theeducation system
2.66
2.67
2.70
2.72
2.77
2.78
Figure (9): How do you rate the FSU accountability to its performance on the following issues? (Values the mean of Likert Scale)
1: Strongly disagree, 2: Disagree, 3: Neither agree nor disagree, 4: Agree, 5: Strongly Agree

18 | P a g e
few) felt that FSUs should conduct financial audits more than students who were not active in campus politics. When asked whether FSUs conduct such an audit, 43 percent of students on average did not know. Trichandra students were the least knowledgeable on this topic (57% did not know), while Saraswati students were the most knowledgeable. An average of 33 percent of students thought that a financial audit was not conducted, though 44 percent of Saraswati students believed so. 48 percent of women and 36 percent of men did not know if FSU conducted a financial audit. Among the respondents, only three percent of both men and women reported that they did not care whether FSU conducted a financial audit or not.
More PSO members (25 percent) than non-members (21 percent) stated that FSUs conduct financial audits. Students who were insignificantly involved in campus politics were the least knowledgeable on this topic (50 percent reported that they did not know). 43 percent of respondents did not know whether FSUs conduct financial audits. 33 percent of respondents said that the FSU does not conduct any financial audits. 38 percent of active students stated that the FSU did not conduct financial audits. Among other groups of active and non-active students, there was much variance in the proportions of those who believed that the FSU does not conduct financial audits. 43 percent of all respondents did not know whether the FSU conducted a financial audit.
7.6. Perspectives on Student Leader and Political Student Organization Commitment
The student attitudes toward student leaders were mainly negative. On average, 30 percent of all respondents thought that student leaders worked in the students’ interest. However, there was much variation in this perception among the different campuses, with 18 percent of Padmakanya, 58 percent of Saraswati, and 12 percent of Trichandra students believing that student leaders worked toward ensuring rights and providing facilities to students. Trichandra had the highest percentage of students who believed that student leaders only listened to those in their favor and political affiliation. More men (38 percent) than women (26 percent) thought that leaders ensured rights and provided facilities for students. More female students (8 percent) than men (0 percent) believed that student leaders did nothing for their student body.
Can’t say, 6%
Good if done, doesn't matter if not done, 10%
Yes, 80%
No, 4%
Figure 10: Is there a need for FSU to conduct financial audit?
Cant say, 43%
Don’t care, 3%
Yes, 21%
No, 33%
Figure 11: Does FSU conduct such an audit?
19 | P a g e
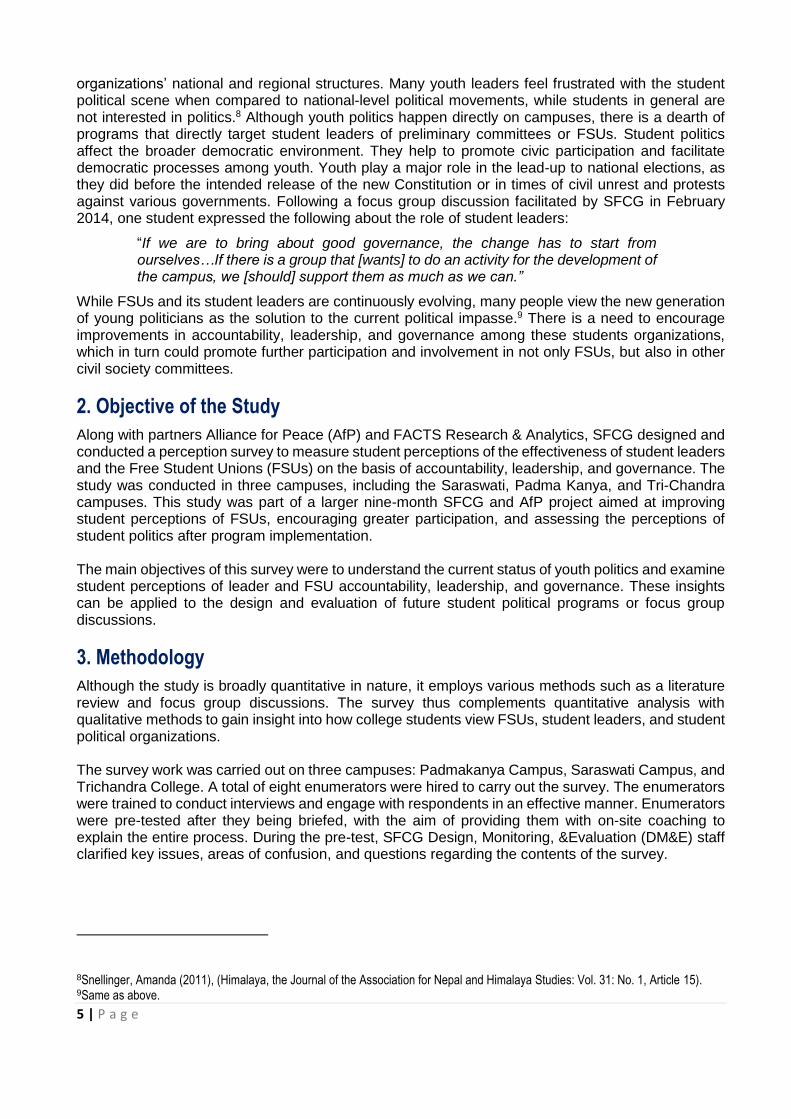
When compared to students who were not politically active, more students of varying degrees of engagement in campus politics believed student leaders work in the best interest of their students body. Significantly more PSO members (47 percent) than non-members (11 percent) or non-disclosed (41%) individuals thought that leaders worked in the best interest of students. However, 27 percent of members and 30 percent of non-members believed that leaders worked in the interest of those who shared their political affiliations. Only 29 percent of students believe that PSOs work to ensure rights and provide facilities to students. On average, 29 percent of respondents thought that student leaders worked in the students’ interest. However, there was much variation in this perception among the different campuses, with 21 percent of Padmakanya, 49 percent of Saraswati, and 16 percent of Trichandra students believing that student leaders worked toward ensuring rights and providing facilities to students. More men (34 percent) than women (27 percent) thought that organizations ensured rights and provided facilities for students. More female students (9 percent) than males (0 percent) believed that student organizations did nothing for their students. The percentages of those who believed PSOs worked in the best interest of their students were much higher for active, moderately active, and sometimes active students when compared to non-active students. Significantly more PSO members (43 percent) than non-members (18 percent) or non-disclosed individuals (28 percent) thought that PSOs worked in the best interest of the students. However, about a fourth of PSO members (26 percent) and non-members (23 percent) believed that PSOs worked only in the interest of those in their favor and political affiliation.
0%
10%
20%
30%
40%Can't say
Don't do anything forthe students
Work only to achieveown interest
Hear mainly of thosethat are in their favour
and politicalMembership
Only talk about rightsand facilities
Student leaders workmainly on ensuringrights and providing
facilities to the students
Figure (12): How committed are student leaders to ensuring rights and providing facilities for students?
Female Male

20 | P a g e
Table (6): How committed are PSOs to ensuring rights and providing facilities for students?
Disaggregated by campus Padmakanya Saraswati Trichandra Total
N % N % N % N %
Can’t say 32 13% 21 11% 39 30% 92 17%
Don't do anything for the students 28 12% 2 1% 3 2% 33 6%
Work only to achieve own interest 49 21% 3 2% 14 11% 66 12%
Listen primarily to those who support them and their political beliefs
58 24% 41 22% 41 32% 140 25%
Only talk about rights and facilities 20 8% 28 15% 12 9% 60 11%
PSOs work mainly on ensuring rights and providing facilities to the students
51 21% 92 49% 20 16% 163 29%
Total 238 100% 187 100% 129 100% 554 100%
7.7 Perspectives on the Influence of Mother Political Parties
25 percent of students thought that mother parties were very influential and that at least the majority of decisions (if not all) were made through pressures from these parties. Trichandra students were the least knowledgeable on the influence of mother political parties, with 55 percent of students responding that they either could not say anything or did not care about the issue; the average for the other two colleges was 45 percent. Saraswati campus students had the largest percentage of students who believed that the majority of decisions were made by PSOs themselves and that decisions concerning the campus are free from mother political party influence.
More males (24 percent) than females (15 percent) believed that a majority of the decisions were made by the PSOs themselves. Students with some degree of political activeness thought that the majority of decisions were made by PSOs themselves (22 percent) compared to non-active students (15 percent). A majority of students with little to no involvement in campus politics expressed that they could not say or did not care. A larger percentage of PSO members (23 percent) thought that a majority of decisions were made by the PSOs alone, compared to 9 percent of non-members.
Can't say 38%
Don't care10%
Very influential, each and every decision is directed by political
parties11%
Majority of the decisions are made in pressure from political
parties 14%
Majority of the decisions are made by
political student organizations by
themselves18%
Decision concerning the campus political
student's organizations are free
9%
Figure (13): How influential is mother political parties regarding the decisions of political student organizations?

21 | P a g e
8. Student Perceptions on FSU Governance
8.1. Participation in Decision-making and Planning Meetings
Previous research conducted in 2010 on the attitudes of partisan and non-partisan youth found that 49 percent of student representatives thought that student unions were not financially transparent. 65 percent of partisan youth agreed and 27 percent disagreed that student unions operate in a democratic way, while only 40 percent of non-partisan youth agreed and 46 percent disagreed. The research communicated the frustration and mistrust of unions by many students. This perception survey revealed that students from Trichandra campus participated in fewer meetings than those from the Padmakanya and Saraswati campuses. 68 percent of students from the Saraswati campus and 50 percent of students from the Pakmakanya campus reported participating in at least one meeting, compared to only 16 percent of Trichandra students. In all campuses, very few students still participated in a majority of the meetings or more. There is room for improvement in terms of promoting cooperation between students and FSUs. Fewer women than men (66 percent vs. 69 percent) participate in FSU decision-making and planning meetings. 48 percent of both female and male students surveyed reported participating in at least one meeting. However, only a small percentage of men and women attended the majority of meetings.
Table (7): Have you ever participated in the decision-making and planning meetings for your FSU?
Disaggregated by sex Female Male Total
N % N % N %
Don’t know 29 8% 34 17% 63 11%
Don’t care 14 4% 6 3% 20 4%
Not participated 120 34% 61 30% 181 33%
No practice of meeting and participatory decision-making 22 6% 3 2% 25 5%
Participated in few meetings (participated in 1 or 2) 86 24% 50 25% 136 25%
Participated in some of the meetings (participated in about
half of the meeting organized by FSU)
69 19% 23 12% 92 17%
Participated in majority of the meetings (without in 1 or 2) 11 3% 17 8% 28 5%
Participated in every meeting 3 1% 6 3% 9 2%
Total 354 100% 200 100% 554 100%
33 percent of all students did not participate in FSU meetings. Surprisingly, 47 percent of students who reported affiliation with a PSO participated in at least one meeting, while 48 percent of non-members attended at least one meeting. 33 percent of students across all categories (members, non-members, and undisclosed) did not participate in FSU meetings. However, even among members of political parties, only four percent participated in the majority of meetings or more. Even among politically active students, only 56 percent took part in FSU meetings. 22 percent of politically active students took part in one or two such meetings; 25 percent in about half the meetings. Even fewer students attended more than half the meetings, with five percent attending a majority of the meetings and four percent participating in all meetings.
8.2. Perspectives on How FSU Has Addressed Relevant Issues and Facilities
On average, only 18 percent of all students thought that the FSU had provided facilities to students in an equitable manner. Only 11 percent of Trichandra students held this opinion, compared to 13 percent of Padmakanya students and 30 percent of Saraswati students. More male students (24

22 | P a g e
percent) than female students (15 percent) felt that the FSU had provided for students in an equitable manner.
Many more students active in campus politics know and care about this issue compared to other groups. Fifteen percent of students believed that the FSU only provided facilities to those students who supported them politically.
8.3. Practice of Holding Dialogues and Interactions on Current Issues and Subjects
Much like in mainstream politics, university students draw on violent tactics and strikes as means of advocacy. This is particularly true during elections, causing major disruptions in university classes and provoking general civil disturbances as protests spill into public areas. These events are widely reported in the media, perpetuating an image of student unions as adversarial and youth as ‘trouble makers.’ These images undermine the role that youth can play in democratization. Student leaders are often seen as acting in the interest of political parties rather than representing and being accountable to their fellow students. This tarnishes student attitudes toward politics and political leaders – students are increasingly indifferent to a democratic process they see as corrupt. Many capable students with great leadership potential thus shy away from politics, shrinking the pool of talent from which future leaders emerge. This cycle is counter-productive to Nepal’s efforts to strengthen its democratic processes and foster future leaders. Democratic dialogues serve as mechanisms that hold student unions accountable to their constituents and facilitate democratic governance within campuses. These dialogues provide opportunities for students to put their new skills into action and begin improving campus politics. Only 36 percent of Trichandra students felt that the FSU held dialogues and interactions, compared to 64 percent of Padmakanya students and 59 percent of Saraswati students. More women did not know about this issue, but more men did not care.
Don't know 12% Don't care
9%
Nothing has been done in favour of
students4%
Only provided to those students who
are politically in their favor
15%
Only those students who have access to FSU are able to get
these 7%
Has provided to few but is not fully
equitable 35%
Has been provided to the fully
deserved students in a most equitable
manner18%
Figure (14): How do you think FSU has addressed issues and facilities

23 | P a g e
No clear differences in opinions emerged between students who differed in levels of political engagement. A very small average percentage (2 percent) thought that the FSU held dialogues/interactions on all issues, while 18 percent thought that there was no such practice. Non-active PSO members actually had the highest percentage (43 percent) of students who believed that dialogues/interactions were held on a majority of issues.
8.4. Relationships Between Different PSOs
39 percent of respondents felt that PSOs could find common ground on some issues. 14 percent of students believed there was conflict on every issue among different PSOs. 26 percent of Trichandra students did not know or care about this issue. Only 19 percent of Trichandra students felt that different PSOs could come to an agreement on some issues, compared to 29 percent of Padmakanya students and 64 percent of Saraswati students.
Table (8): How do you view the status of relations between different PSOs?
Disaggregated by campus Padmakanya Saraswati Trichandra Total
N % N % N % N %
Don’t know 44 18% 48 26% 33 26% 125 23%
Don’t care 26 11% 8 4% 33 26% 67 12%
There is a practice of opposing the view put forward by one party by other
42 18% 8 4% 22 17% 72 13%
There is always a conflict of interest in every issue 58 24% 3 2% 16 12% 77 14%
Not that bad, they come to consensus on some issues 37 16% 94 50% 18 14% 149 27%
Very good, everyone comes to consensus regarding the issues concerning the well-being of students
31 13% 26 14% 7 5% 64 12%
Total 238 100% 187 100% 129 100% 554 100%
More men (17 percent) than women (8 percent) thought that there was always a conflict on issues between different PSOs. However, more women (47 percent) than men (34 percent) believed that common ground could be achieved on at least some issues. More politically active student groups (active, moderately active, insignificantly involved) than non-active students felt that different PSOs could find common ground on at least some issues.
Don't know 19%
Don't care 7%
No practice to hold dialogue/interaction
18%
Very few dialogue/interaction on related subjects
17%
Not frequent but dialogue/interaction is hold on majority
of the issues37%
Practice to hold dialogue/interaction
on each issues2%
Figure (15): Does FSU hold dialogue and interactions on current issues and subjects?

24 | P a g e
8.5. Leadership Enhancement Opportunities
Student politics also affects the broader democratic environment; its dynamics can promote or undermine civic participation and hinder or facilitate the democratic process. Increasing the knowledge and skills of student leaders, especially among women, in implementing democratic processes will enable them to practice democratic behavior in college politics.
Table (9): Has the FSU or campus administration conducted any program on leadership enhancement for youth and students?
Disaggregated by campus Padmakanya Saraswati Trichandra Total
N % N % N % N %
Don’t know 61 26% 76 41% 73 57% 210 38%
Don’t care 5 2% 5 3% 8 6% 18 3%
Yes 104 44% 99 53% 17 13% 220 40%
No 68 29% 7 4% 31 24% 106 19%
Total 238 100% 187 100% 129 100% 554 100%
38 percent of respondents did not know whether the FSU or campus administration conducted any programs on leadership enhancement. 38 percent of students claimed they had no knowledge of FSU- or administration-instigated leadership enhancement programs. Trichandra students were the least knowledgeable on this topic (57 percent did not know), whereas Padmakanya students were the most knowledgeable (only 26 percent did not know). On average, 19 percent reported that FSU had not conducted programs concerning youth and students. Women were more knowledgeable than men on this topic. 43 percent of men did not know, while 35 percent of women did not. A significantly larger percentage of women (24 percent) answered ‘no’ compared to only 11 percent of men. On average, 57 percent of all respondents either did not know or answered ‘no.’ Only 29 percent of politically active students did not know, whereas a larger percentage of moderately active, rarely active, and non-active members did not know. More active members answered ‘no’ (37 percent) than moderately active students (21 percent). A large percentage of students responded ‘yes’ (40 percent), suggesting that a majority of students felt like leadership enhancement programs for youth were being conducted.
8.6. How Are Relations Between the FSU and Campus Administration?
63 percent of students thought the relationship between the FSU and campus administration was at least workable. The coordination between the administration and the FSU is very important in implementing FSU activities within campus premises. 50 percent of Trichandra students could not speak to the administration-FSU relationship, compared to 25 percent on average across the three campuses. Only 17 percent of Padmakanya students and 19 percent of Saraswati students were of the same outlook. 36 percent of students believed that the relationship between the two parties was either good or excellent. However, fewer students from the Trichandra campus felt that the relationship was at least good (14 percent), compared to 39 percent of Padmakanya students and 48 percent of Saraswati students. More women (38 percent) than men (32 percent) thought that the relationship was at least workable. A significantly smaller percentage of men (6 percent) than women (12 percent) thought that the relation was ‘overall not good.’ A larger percentage of PSO members (43 percent) than non-members (30 percent) believed the relationship to be good or excellent. The percentage of non-politically active students (20 percent), who thought the relationship was ‘workable’ was significantly lower than that of the other groups. More active and moderately active students believed the relationship was ‘good’ or better than did insignificantly active or non-active students.

25 | P a g e
8.7. Need for FSU to Ensure Rights and Improve the Education Standard
46 percent of students said that there is a need for FSUs to ensure students’ rights and improve the education standard. Of the three campuses, the fewest Trichandra students (26 percent) believe that FSUs need to ensure students’ rights and improve educational standards; 39 percent of Padmakanya students and 68 percent of Saraswati students share this view. On average, similar percentages said that both were acceptable (28 percent) and that there was a need to search for an alternative to FSUs (22 percent). There was a difference of opinion in the three different colleges on whether there was a need to search for alternatives to FSUs: 38 percent of Padmakanya students believed this compared to only 4 percent of Saraswati students and 19 percent of Trichandra students. More men (52 percent) than women (42 percent) thought FSUs should ensure student rights and improve the education standard. An average of 46 percent believed FSUs needed to work on rights and education standards, 28 percent stated that both were acceptable, while 22 percent stated that there was a need to search for an alternative to FSUs. More politically active students believed FSUs should work on these two agenda than non-active students.
Can't say25%
Worst 2%
Overall not good10%
Workable 27%
Good30%
Excellent6%
Figure (16): How is the relationship between FSU leaders and campus administration?
Yes
No
Both is acceptable
Need to search for option other thanFSU
42%
4%
24%
30%
52%
3%
36%
8%
Figure (17): Is there the need for FSUs to ensure the rights of the student and improve education standards?
Male Female

26 | P a g e
8.8. Participation in the Decision-making of PSOs
33 percent of students did not participate in decision-making or planning meetings of PSOs. Similar percentages of students from all three campuses did not participate in PSO decision-making or planning meetings. More students from Padmakanya (42 percent) and Saraswati (54 percent) participated in at least one meeting than those from the Trichandra campus (22 percent). 37 percent of women did not participate, compared to only 26 percent of men. Men had higher participation rates than women, with 45 percent of men participating in at least one meeting compared to 38 percent of women. Only 20 percent of politically active students did not participate, while 51 percent of sometimes active and 32 percent of not-active students did not participate. Significantly more active and moderately active students participated in at least one meeting than did non-active students. Eight percent of active students participated meaningfully in every meeting, compared to the average of four percent.
Table (1): Have you participated in PSO decision-making and planning meetings?
Disaggregated by sex Female Male Total
N % N % N %
Don’t know 38 11% 38 19% 76 14%
Don’t care 15 4% 10 5% 25 5%
Not participated 130 37% 51 26% 181 33%
No practice of meeting and participatory decision-making 34 10% 9 4% 43 8%
Participated in few meetings (participated in 1 or 2) 54 15% 28 14% 82 15%
Participated in some of the meetings (participated in about half of the meetings organized by FSU)
40 11% 22 11% 62 11%
Participated in majority of the meetings (not participated in 1 or 2) 30 8% 33 16% 63 11%
Meaningfully participated in every meeting 13 4% 9 4% 22 4%
Total 354 100% 200 100% 554 100%
8.9. Relationship Between PSOs and Campus Administration
Padmakanya (59 percent) and Saraswati (73 percent) had the largest percentage of students who believed that the relationship between PSOs and campus administration was workable or better. Only 44 percent of Trichandra students believed that the relationship was workable or better. Trichandra students were also the least knowledgeable on this topic with almost half (47 percent) of students responding ‘can’t say.’ More women (62 percent) than men (49 percent) believed the relationship to be workable or better.
Can't say 30%
Worst3%
Overall not good6%
Workable 38%
Good18%
Excellent5%
Figure (18): How influential is mother political parties regarding the decisions of political student organizations?
27 | P a g e
Overall, 61 percent of all groups thought that relations were workable or better. A larger percentage of politically active and moderately active members described the relations as good or excellent when compared to the insignificantly active and not-active members. 50 percent of active PSO members thought that relations were workable, compared to an average 32 percent for non-member and non-disclosed groups. 23 percent thought that relations were either good or excellent.
9. Conclusion and Recommendations
The youth in Nepal have played a valuable role during the recent transition of political power within the country. Young Nepalese have helped to secure a more comprehensive democracy by fighting against social injustice, participating in the democratic struggle, and becoming involved in the processes of community development. University students have stimulated social change by bringing attention to political and social questions, while their involvement in politics has been a positive force for good governance and improving democratic practices in Nepal. However, students still lack the skills to fully understand and implement democratic processes and non-adversarial advocacy. Students are not maximizing their potential to improve the function of campus environments and represent the younger generation. SFCG is committed to facilitating dialogue and capacity-building trainings that will help young leaders develop their capacity for sustained and effective civic engagement. SFCG does not only believe that Nepali youth should be equipped for the challenges of political leadership, but also that they should be able to demonstrate their ability and potential for initiative in other socio-cultural areas. SFCG seeks to provide young women and men with a platform to think about and build their capacity for effective governance and civic engagement. The findings from this study suggest that students do not currently see Free Student Unions as working toward accountable leadership or inclusive democracy. The study found that student attitudes toward student leaders and on-campus political organizations were mostly negative; there was also little awareness about FSUs’ actual roles and structures for implementing accountability. The study also illustrated some significant differences between the three surveyed campuses, as well as between men and women. Based on this research and the results of the study, SFCG hopes to facilitate trainings and dialogues that enable young people to develop their leadership capacities and become engaged citizens. SFCG provides the following recommendations for future programs aimed at improving governance and democratic processes for youth involved in politics:
Promote political participation among women and other minority groups through club meetings, forums, invitation of female speakers at campus events, and collaboration with minority organizations that already exist on campus.
Implement youth-tailored programs that provide information on student and national political issues, so young people can maintain strong links to the political process and make valuable contributions therein.
Engage in discussion sessions led by youth to address various issues through dialogue within the campus and community.
Recruit women and minority campus leaders, encouraging involvement among women faculty members.
Facilitate workshops to promote student involvement in college politics, demonstrating to youth that this can be used as an opportunity to create impactful and positive change.

28 | P a g e
This report will likely serve as a useful reference for future perception studies in this field of study. The survey findings will be of great use to researchers, donors, FSUs, campus administrations, student leaders, and mother political parties as it provides nuanced insights about university student attitudes toward organized campus politics. Through this project, SFCG, FACTS and AfP seek to provide a platform through which to think about—and build—student capacity and potential for governance and civic engagement. Future strategic approaches that focus on the needs of youth in politics have the potential to improve governance and democratic processes.