tuff r and thermax insulation · in residential and commercial wall applications. dow’s...
TRANSCRIPT

ENVIRONMENTAL PRODUCT DECLARATION
TUFF-RTM AND THERMAXTM INSULATION DOW CHEMICAL COMPANY
Dow has a long history of leadership in sustainability and energy efficiency. Dow has sustainability goals for operations, manufacturing, and energy generation which results in mutually beneficial reduction of costs and greenhouse gas emissions. Dow products contribute to a sustainable energy future by helping to improve the efficiency of virtually every major industry, including transportation and construction.
Dow Building Solutions has over 65 years of building science expertise in the global commercial and residential construction industry and provides solutions for thermal, air and moisture management that help reduce energy costs and greenhouse gas emissions while protecting against the elements. All Dow Building Solutions insulation products continue to conserve energy through the life of the building with no additional maintenance during their use.
More information about Dow Building Solutions can be found at www.dowbuildingsolutions.com
ThermaxTM and Tuff-RTM insulation products deliver continuous insulation and thermal and air barrier solutions.

Page 2 of 21
THERMRAX™ and TUFF-R™
According to ISO 14025
This declaration is an environmental product declaration (EPD) in accordance with ISO 14025. EPDs rely on Life Cycle Assessment (LCA) to provide information on a number of environmental impacts of products over their life cycle. Exclusions: EPDs do not indicate that any environmental or social performance benchmarks are met, and there may be impacts that they do not encompass. LCAs do not typically address the site-specific environmental impacts of raw material extraction, nor are they meant to assess human health toxicity. EPDs can complement but cannot replace tools and certifications that are designed to address these impacts and/or set performance thresholds – e.g. Type 1 certifications, health assessments and declarations, environmental impact assessments, etc. Accuracy of Results: EPDs regularly rely on estimations of impacts, and the level of accuracy in estimation of effect differs for any particular product line and reported impact. Comparability: EPDs are not comparative assertions and are either not comparable or have limited comparability when they cover different life cycle stages, are based on different product category rules or are missing relevant environmental impacts. EPDs from different programs may not be comparable.
PROGRAM OPERATOR UL Environment DECLARATION HOLDER DOW Building Solutions DECLARATION NUMBER 4786101271.101.1 DECLARED PRODUCT TUFF-RTM and THERMAXTM
REFERENCE PCR Product Category Rules for preparing an environmental product declaraiont (EPD) for Product Group: Building Envelope Thermal Insulation
DATE OF ISSUE August 29, 2014 PERIOD OF VALIDITY 5 Years
CONTENTS OF THE DECLARATION
Product definition and information about building physics Information about basic material and the material’s origin Description of the product’s manufacture Indication of product processing Information about the in-use conditions Life cycle assessment results Testing results and verifications
The PCR review was conducted by: Wayne B. Trusty (Chairperson) Wayne B. Trusty & Associates Limited [email protected]
This declaration was independently verified in accordance with ISO 14025 by Underwriters Laboratories ☐ INTERNAL ☒ EXTERNAL
Wade Stout, UL Environment
This life cycle assessment was independently verified in accordance with ISO 14044 and the reference PCR by:
Thomas Gloria, Life-Cycle Services, LLC
Page 2 of 19
THERMRAX™ and TUFF-R™
According to ISO 14025
Product Description and Information
Product Description
Dow’s polyisocyanurate rigid foam (ISO foam) insulation features a high-performance closed-cell polyisocyanurate foam core sandwiched between durable, exterior facers. The facers also create a barrier which minimizes air and vapor transmission. The insulation is designed to deliver energy savings, weatherization protection and other benefits in residential and commercial wall applications. Dow’s polyisocyanurate rigid foam (ISO foam) insulation is easy to install, can be applied to a variety of substrates, satisfies the applicable fire, air and water-resistive barrier requirements, and maintains a consistently high R-value throughout the lifecycle of the building.
Dow ISO foam insulation products are categorized into two product families: TUFF-RTM and THERMAXTM. The TUFF-RTM products are primarily, but not exclusively, used in residential applications. The TUFF-RTM products consist of polyisocyanurate foam, faced with trilaminate facers made up of foil, Kraft paper, and polyester films.
THERMAXTM products are primarily but not exclusively used in commercial buildings and can be left exposed to the interior of those buildings after installation because of their resistance to fire. The product consists of trimer foam, faced with aluminum foil at different thicknesses. THERMAXTM and most TUFF-RTM products have glass fiber in the foam core that improves fire resistance. Table 1 lists each ISO foam product.
Table 1: TUFF-RTM and THERMAXTM products TUFF-RTM Family THERMAXTM Family Super TUFF-RTM THERMAXTM CI
Super TUFF-RTM Commercial THERMAXTM Heavy Duty TUFF-RTM THERMAXTM Light Duty
TUFF-RTM Commercial THERMAXTM Metal Building Board THERMAXTM Sheathing THERMAXTM White Finish
TUFF-RTM and THERMAXTM rigid foam boards are made in R-values ranging from R-2 to R-26 for use in North American building applications. TUFF-RTM is manufactured in thicknesses from 0.5 in to 2 in. THERMAX TM is manufactured in thicknesses from 0.5 in to 4.25 in.The functional unit of the product as defined by the PCR is 1 square meter of insulation material with a thickness that gives an average thermal resistance (RSI) RSI=1 m2K/W (5.68h·ft2·°F/Btu) and with a building service life of 60 years. The calculated thickness which provides the required RSI value for both TUFF-RTM and THERMAXTM families is 22.2mm.
THERMAXTM and TUFF-RTM products meet ASTM C1289 – Standard Specification for Faced Rigid Cellular Polyisocyunarate Thermal Insulation Board, Type I. Other Applicable standards include: ASTM C203, ASTMC209, ASTM C518, ASTM D1621, ASTM S2126, ASTM E96 and D1623. As an example the physical properties of ThermaxTM ci are presented in Table 2.
Page 3 of 19
THERMRAX™ and TUFF-R™
According to ISO 14025
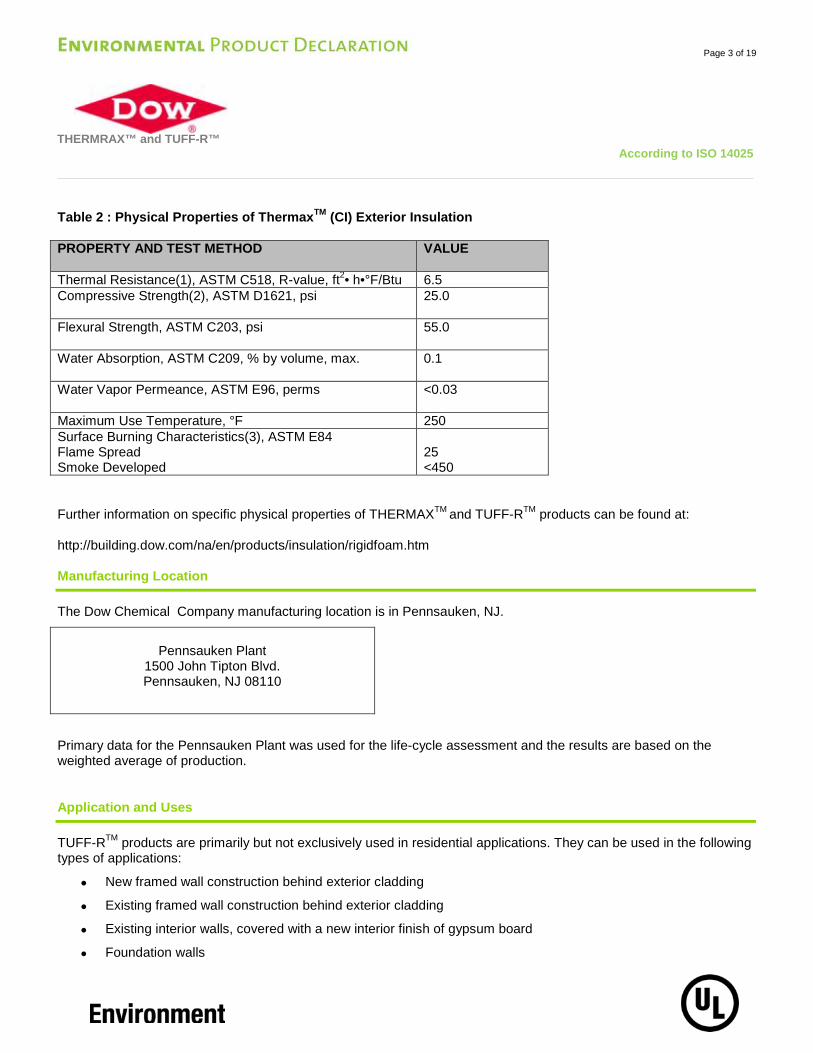
Table 2 : Physical Properties of ThermaxTM (CI) Exterior Insulation
PROPERTY AND TEST METHOD VALUE
Thermal Resistance(1), ASTM C518, R-value, ft2• h•°F/Btu 6.5 Compressive Strength(2), ASTM D1621, psi 25.0
Flexural Strength, ASTM C203, psi 55.0
Water Absorption, ASTM C209, % by volume, max. 0.1
Water Vapor Permeance, ASTM E96, perms <0.03
Maximum Use Temperature, °F 250 Surface Burning Characteristics(3), ASTM E84 Flame Spread Smoke Developed
25 <450
Further information on specific physical properties of THERMAXTM and TUFF-RTM products can be found at:
http://building.dow.com/na/en/products/insulation/rigidfoam.htm
Manufacturing Location
The Dow Chemical Company manufacturing location is in Pennsauken, NJ.
Pennsauken Plant
1500 John Tipton Blvd. Pennsauken, NJ 08110
Primary data for the Pennsauken Plant was used for the life-cycle assessment and the results are based on the weighted average of production.
Application and Uses
TUFF-RTM products are primarily but not exclusively used in residential applications. They can be used in the following types of applications:
• New framed wall construction behind exterior cladding
• Existing framed wall construction behind exterior cladding
• Existing interior walls, covered with a new interior finish of gypsum board
• Foundation walls

Page 4 of 19
THERMRAX™ and TUFF-R™
According to ISO 14025
• As a component in roof assemblies, over roof decks and in cathedral ceilings
• Interior insulation for masonry walls
THERMAXTM products are primarily but not exclusively used in commercial buildings and can be left exposed to the interior of those buildings after installation because of their resistance to fire. THERMAXTM products can be used in the following types of applications.
• Exterior cavity walls – steel stud
• Exterior cavity walls – block-backed
• Metal buildings
• Exposed interior wall applications
• Concealed interior walls
• Closed crawl spaces
• Agricultural applications
• Precast/ tilt-up
Installation
Dow TUFF-RTM and THERMAXTM rigid foam products are installed with ancillary materials such as fasteners or adhesives that attach the foam to a variety of substrates. Flashing tape or liquid applied flashing are used to seal the joints between adjacent foam sheets and around fenestrations or penetrations. This EPD covers only the rigid foam product as there are many options for ancillary materials, depending on the wall, roof or foundation assembly requirements. Installation instructions for TUFF-RTM and THERMAXTM products in a variety of applications can be found at: http://building.dow.com/na/en/tools/installations/
Page 5 of 19
THERMRAX™ and TUFF-R™
According to ISO 14025
Production
Material Content
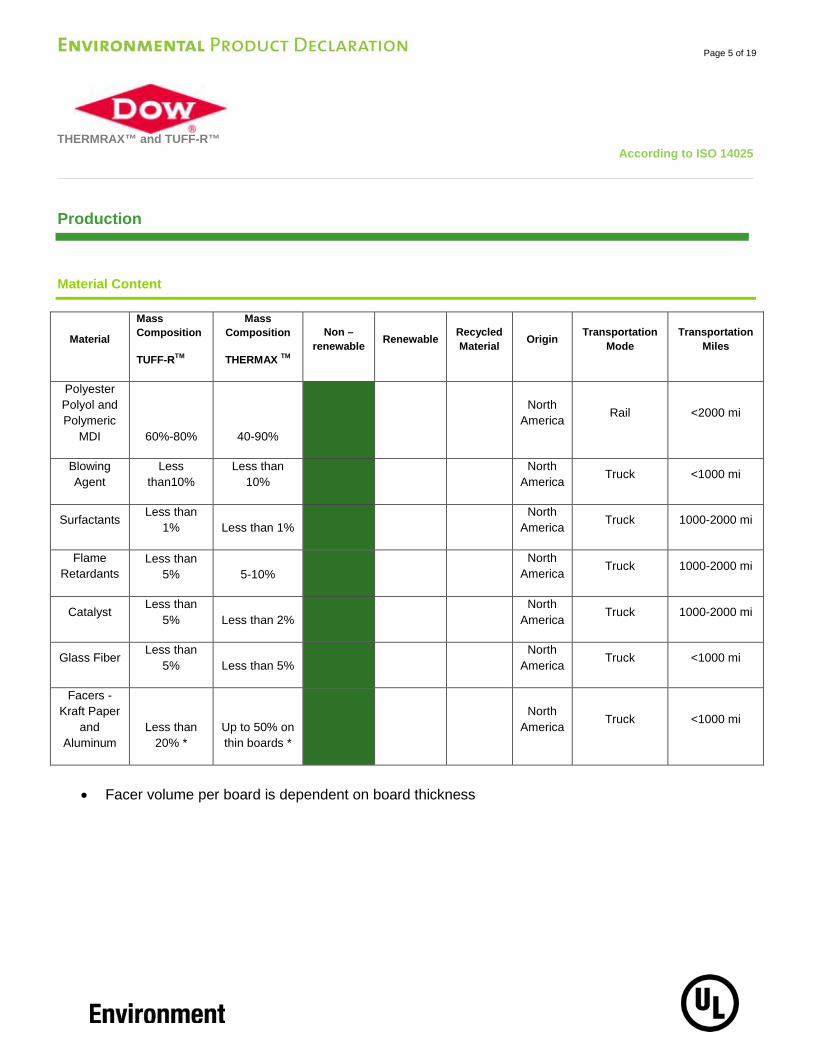
Material
Mass Composition
TUFF-RTM
Mass Composition
THERMAX TM
Non –renewable Renewable Recycled
Material Origin Transportation Mode
Transportation Miles
Polyester Polyol and Polymeric
MDI 60%-80% 40-90%
North
America Rail <2000 mi
Blowing Agent
Less than10%
Less than 10%
North America Truck <1000 mi
Surfactants Less than
1% Less than 1% North
America Truck 1000-2000 mi
Flame Retardants
Less than 5% 5-10%
North
America Truck 1000-2000 mi
Catalyst Less than
5% Less than 2%
North America
Truck 1000-2000 mi
Glass Fiber Less than
5% Less than 5%
North America
Truck <1000 mi
Facers -Kraft Paper
and Aluminum
Less than 20% *
Up to 50% on thin boards *
North
America Truck <1000 mi
• Facer volume per board is dependent on board thickness

Page 6 of 19
THERMRAX™ and TUFF-R™
According to ISO 14025
Manufacturing Process
Life Cycle Assessment – Product System and Modeling
Functional Unit
The functional unit of the product as defined by the PCR is 1 square meter of insulation material with a thickness that gives an average thermal resistance (RSI) RSI=1 m2K/W (5.68h·ft2·°F/Btu) and with a building service life of 60 years. The calculated thickness which provides the required RSI value for both TUFF-RTM and THERMAXTM families is 22.2mm.
Life Cycle Stages Assessed
The ISO foam insulation study was a cradle-to-grave analysis, so the boundaries extended upstream to materials in the earth and continued to the commercial product going to landfill. The use phase is excluded in this study. The life

Page 7 of 19
THERMRAX™ and TUFF-R™
According to ISO 14025
cycle stages assessed in this study include:
• Raw material production including extraction of primary raw materials, raw material manufacturing, and disposal of key raw material production waste
• All raw material transportation to manufacturing location
• ISO foam production, including the Pennsauken facility primary utilities and emissions data
• Facer production
• Packaging of product
• Disposal of manufacturing waste
• Commercial product transportation from plant to distributor
• Commercial product transportation from distributor to building site
• Commercial product transportation from building site to landfill
• Landfill of used product
System Boundaries
Figure 1: High level view of life cycle stages (showing only direct inputs and emissions)
SYSTEMINPUTS OUTPUTS
Raw materials
Energy
Production of raw materials from the earth and their transport to the
Pennsauken Plant
Commercial products
Emissions
Waste to disposalProduction of Isofoam up to the plant warehouse
Waste to energy(no credit taken)
Isofoam distribution and end of life

Page 8 of 19
THERMRAX™ and TUFF-R™
According to ISO 14025
Assumptions
The following assumptions were made for this life cycle assessment:
• Products are disposed of in a landfill at the end of life
• Installation requires no external energy input and no maintenance
• Blowing agent is released to the atmosphere during the 60 year study
• Transportation of the product from the distributor to the building site is assumed to be 50 miles by truck
• Transportation of the product from the building site to landfill is assumed to be 100 miles by truck
• During its service life, insulation significantly reduces the energy use in a building, thereby reducing the impact on the environment. However, building heating and cooling is excluded during the use phase of the life cycle assessment as required by the PCR. The benefits of insulation in the reduction of building energy use is described separately in this declaration as additional information beyond the scope of the product life cycle assessment.
• Dismantling and demolition were not considered during the end of life stage.
Cut-Off Criteria
Cut-off criteria are conditions that specify how much of the data obtained in the study will be used in modeling the system. For an extremely detailed life cycle inventory, accounting for every input is likely to be impractical within reasonable time constraints; hence, cut-off criteria help guide the rationale for excluding any data. According to the PCR, a process or activity that contributes no more than 2% of the total mass and uses no more than 1% of the total energy may be omitted from the inventory analysis. An exception is that omissions of any material flows that may have a relevant contribution to the selected impact categories of the products underlying the Environmental Product Declaration will be justified, if applicable, by a sensitivity analysis. The sum of the excluded material flows must not exceed 5% of mass, energy or environmental relevance.
To provide a robust analysis, and to thereby enhance the credibility of the study, the approach taken was to include as much of the life cycle inventory data in the models as possible. All known inputs to ISO foam production have been included. The implicit cut-off for this data source is relevance: inputs and outputs related directly to the foam production operation are included; ancillary inputs (office supplies and travel, for example) are not included. Capital production process items (machines, equipment etc) were excluded from this study.
This EPD is in compliance with the cut-off criteria. No processes were neglected or excluded.
Transportation
Transportation was included for all inbound raw materials, shipment of commercial product to distributor, shipment from distributor to building site, and end of life product to landfill. The raw material transport were categorized as being less than 1000 miles or between 1000 miles and 2000 miles by either rail or truck. Actual distances were used in the life cycle assesment. Transportation of the product from the distributor to the building site is assumed to be 50 miles by truck. Transportation of the product from the building site to landfill is assumed to be 100 miles by truck

Page 9 of 19
THERMRAX™ and TUFF-R™
According to ISO 14025
Period Under Consideration
All Dow primary data for the production used in the study were from the year of 2012.
Secondary Background Data
All Dow primary data for the energy and material inputs and emissions during production was collected internally from Dow facilities. The data was used for the energy and material inputs and emissions during production. Ecoinvent was the standard reference for library LCA data.
Data Quality
Overall, the data used in this study, a combination of Dow production data and Ecoinvent library data, allowed the construction of life cycle models that describe the production of ISO foam insulation. Primary data was obtained for the most critical inputs – MDI production and ISO foam production in Pennsauken. This is high quality data since it comes directly from Dow facilities. Secondary data, from Ecoinvent 2.2 was used for upstream process models to provide an established, documented and reasonable source of information. Stoichiometric models for flame retardants and catalysts were developed to increase accuracy of the study.
Allocation
In a production process where more than one type of product is generated, it is necessary to allocate the environmental impacts (inputs and outputs) from the process to the different products in order to obtain product-based inventory data. Allocation rules should reflect the goal of the production process. For production of building envelope thermal insulation products, allocation is preferably carried out according to mass. This was used in this project to divide utilities use and emissions known on an annual basis across all production of the plant. Different specific ISO foam products are manufactured at the plant. All carried the same direct manufacturing burdens per unit mass.
Use
THERMAX™ and TUFF-R™ foam insulation do not require any additional resources to perform its intended use as a thermal insulator. Ancilliary materials may be needed to satisfy requirements as an air, water or fire resistive assembly, but they have not been included in the analysis. During use, there are reductions in the energy consumption of a building and also the release of the blowing agent. For the purposes of this study all ablowing agent is assumed to be released at disposal at the end of the modeled time period of 60 years.
End-of-Life
For the purposes of this study the end of life stage for ISO foam is disposal to a landfill. The transportation of the foam boards from building site to landfill is considered to be 100 miles.
Page 10 of 19
THERMRAX™ and TUFF-R™
According to ISO 14025
Environmental Product Declaration
Use of Material and Energy Resource
TUFF-R™
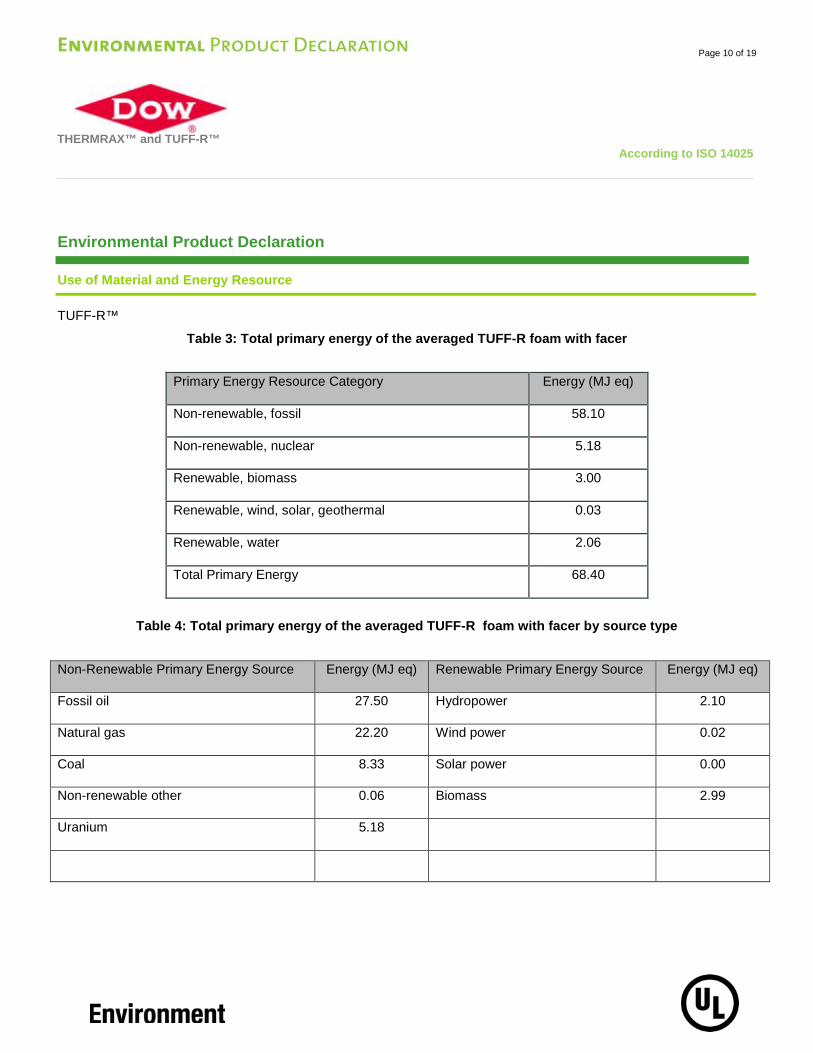
Table 3: Total primary energy of the averaged TUFF-R foam with facer
Primary Energy Resource Category Energy (MJ eq)
Non-renewable, fossil 58.10
Non-renewable, nuclear 5.18
Renewable, biomass 3.00
Renewable, wind, solar, geothermal 0.03
Renewable, water 2.06
Total Primary Energy 68.40
Table 4: Total primary energy of the averaged TUFF-R foam with facer by source type
Non-Renewable Primary Energy Source Energy (MJ eq) Renewable Primary Energy Source Energy (MJ eq)
Fossil oil 27.50 Hydropower 2.10
Natural gas 22.20 Wind power 0.02
Coal 8.33 Solar power 0.00
Non-renewable other 0.06 Biomass 2.99
Uranium 5.18

Page 11 of 19
THERMRAX™ and TUFF-R™
According to ISO 14025
44%
35%
13%
0% 8%
Nonrenewable energy by source
Fossil oil
Natural gas
Coal
Non-renewable other
Uranium
40%
1% 0%
59%
Renewable Energy by Source
Hydropower
Wind power
Solar power
Biomass

Page 12 of 19
THERMRAX™ and TUFF-R™
According to ISO 14025
THERMAX™
Table 5: Total primary energy of the averaged THERMAX™ foam with facer
Primary Energy Resource Category Energy (MJ eq)
Non-renewable, fossil 84.20
Non-renewable, nuclear 9.10
Renewable, biomass 0.44
Renewable, wind, solar, geothermal 0.03
Renewable, water 5.78
Total Primary Energy 99.60
Table 6: Total primary energy of the averaged THERMAX™ foam with facer
Non-Renewable Primary Energy Source Energy (MJ eq) Renewable Primary Energy Source Energy (MJ eq)
Fossil oil 39.40 Hydropower 5.78
Natural gas 29.70 Wind power 0.03
Coal 15.10 Solar power 0.00
Non-renewable other 0.00 Biomass 0.44
Uranium 9.10

Page 13 of 19
THERMRAX™ and TUFF-R™
According to ISO 14025
Primary Energy by Life Cycle Stages
42%
32%
16%
0% 10%
Nonrenewable energy by source
Fossil oil
Natural gas
Coal
Non-renewable other
Uranium
92%
1% 0% 7%
Renewable Energy by Source
Hydropower
Wind power
Solar power
Biomass
Page 14 of 19
THERMRAX™ and TUFF-R™
According to ISO 14025
TUFF-R™
Impact category Unit Total Raw
materials Raw Material Transport Manufacturing Gate to Grave
Transport End of life
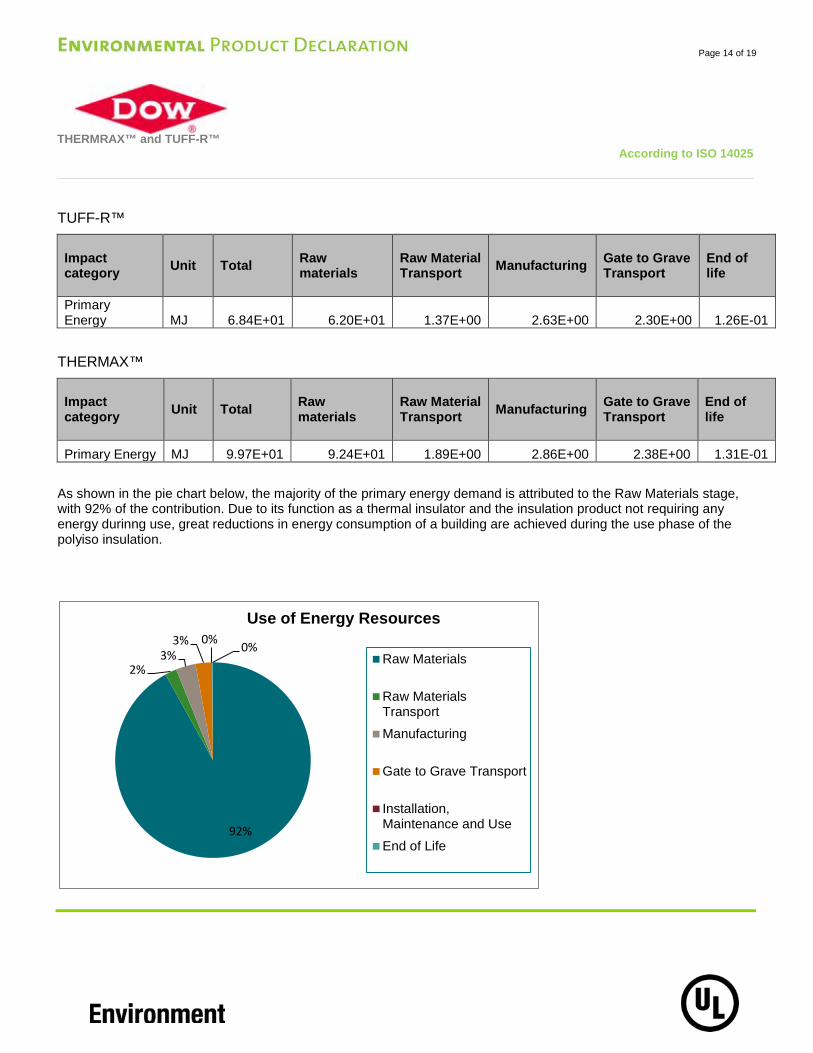
Primary Energy MJ 6.84E+01 6.20E+01 1.37E+00 2.63E+00 2.30E+00 1.26E-01
THERMAX™
Impact category Unit Total Raw
materials Raw Material Transport Manufacturing Gate to Grave
Transport End of life
Primary Energy MJ 9.97E+01 9.24E+01 1.89E+00 2.86E+00 2.38E+00 1.31E-01
As shown in the pie chart below, the majority of the primary energy demand is attributed to the Raw Materials stage, with 92% of the contribution. Due to its function as a thermal insulator and the insulation product not requiring any energy durinng use, great reductions in energy consumption of a building are achieved during the use phase of the polyiso insulation.
92%
2% 3%
3% 0% 0%
Use of Energy Resources
Raw Materials
Raw MaterialsTransport
Manufacturing
Gate to Grave Transport
Installation,Maintenance and Use
End of Life
Page 15 of 19
THERMRAX™ and TUFF-R™
According to ISO 14025
Life Cycle Assessment – Product
TUFF-R™
Impact category Unit Total Raw
materials Raw Material Transport
Manufacturing Gate to Grave Transport
End of life
Ozone depletion
kg CFC-11 eq 4.27E-07 3.75E-07 1.47E-08 7.26E-09 2.86E-08 1.79E-09
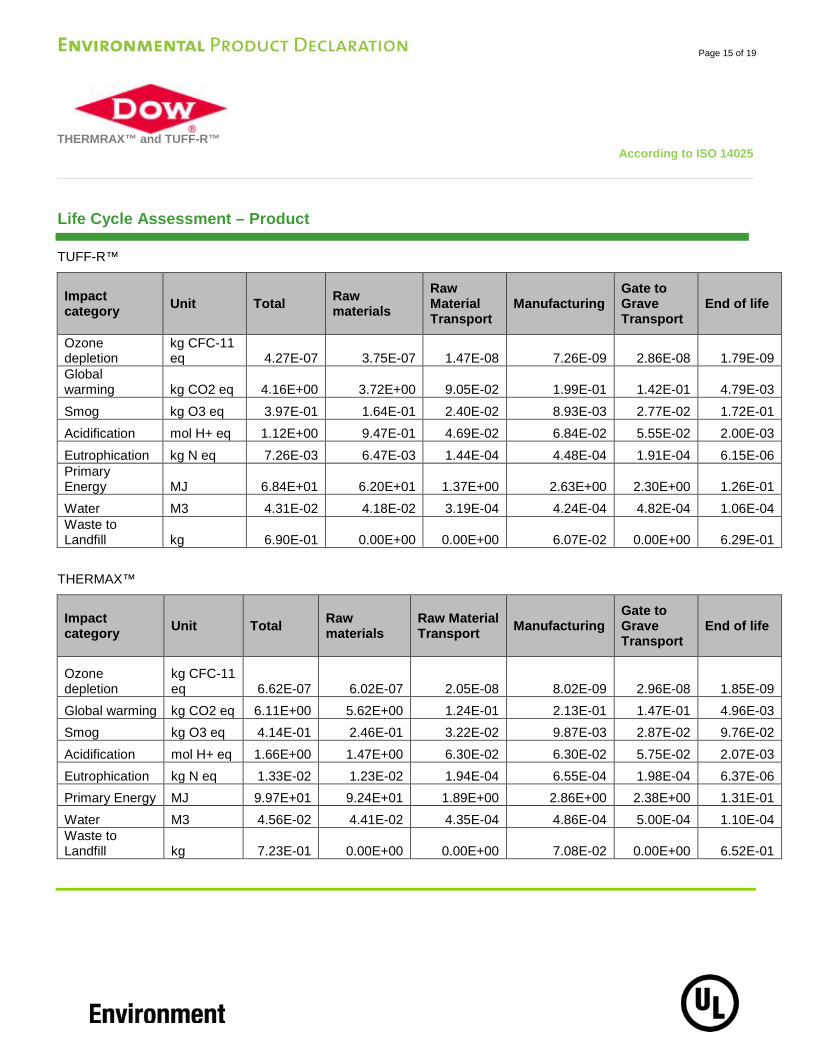
Global warming kg CO2 eq 4.16E+00 3.72E+00 9.05E-02 1.99E-01 1.42E-01 4.79E-03 Smog kg O3 eq 3.97E-01 1.64E-01 2.40E-02 8.93E-03 2.77E-02 1.72E-01 Acidification mol H+ eq 1.12E+00 9.47E-01 4.69E-02 6.84E-02 5.55E-02 2.00E-03 Eutrophication kg N eq 7.26E-03 6.47E-03 1.44E-04 4.48E-04 1.91E-04 6.15E-06 Primary Energy MJ 6.84E+01 6.20E+01 1.37E+00 2.63E+00 2.30E+00 1.26E-01 Water M3 4.31E-02 4.18E-02 3.19E-04 4.24E-04 4.82E-04 1.06E-04 Waste to Landfill kg 6.90E-01 0.00E+00
0.00E+00 6.07E-02 0.00E+00 6.29E-01
THERMAX™
Impact category Unit Total Raw
materials Raw Material Transport Manufacturing
Gate to Grave Transport
End of life
Ozone depletion
kg CFC-11 eq 6.62E-07 6.02E-07 2.05E-08 8.02E-09 2.96E-08 1.85E-09
Global warming kg CO2 eq 6.11E+00 5.62E+00 1.24E-01 2.13E-01 1.47E-01 4.96E-03 Smog kg O3 eq 4.14E-01 2.46E-01 3.22E-02 9.87E-03 2.87E-02 9.76E-02 Acidification mol H+ eq 1.66E+00 1.47E+00 6.30E-02 6.30E-02 5.75E-02 2.07E-03 Eutrophication kg N eq 1.33E-02 1.23E-02 1.94E-04 6.55E-04 1.98E-04 6.37E-06 Primary Energy MJ 9.97E+01 9.24E+01 1.89E+00 2.86E+00 2.38E+00 1.31E-01 Water M3 4.56E-02 4.41E-02 4.35E-04 4.86E-04 5.00E-04 1.10E-04 Waste to Landfill kg 7.23E-01 0.00E+00 0.00E+00 7.08E-02 0.00E+00 6.52E-01
Page 16 of 19
THERMRAX™ and TUFF-R™
According to ISO 14025
Additional Environmental Information
Other Environmental
Cradle to Cradle Basic Certification
Top 10 Green Building Products GreenSpec Listed for 2012
Contributes to LEED points in the Material and Resources, Energy and Atmosphere and Indoor Environmental Quality sections.
Building Use Stage Benefits
Insulation requires no extra energy or utilities to operate over its useful life. The polyisocyanurate insulation reduces the energy associated with heating and cooling the building, and contributes to reduction in greenhouse gas emissions.
An example presented below provides the net energy savings for average rigid polyisocyanurate insulation in a medical office building. The net energy saved is the total energy saved minus the life cycle energy for production and disposal of rigid polystyrene insulation.
The case study used for the analysis is a two story medical office building 21,335 square foot insulated to ASHRAE 90.1 2013 minimum R-value requirements for walls and roofs. The conditioned space within the building is 20836 sq ft. The wall insulated area is 10,003 square feet . The roof insulated area is11,493 square feet. The example includes an analysis of a mass wall frame structure and a steel wall frame structure for four locations: Dallas, TX, Nashville, TN, Saginaw, MI, Minneapolis, MN all in four different ASHRAE Zones. The modeling was performed using EnergyPlus, an hourly energy analysis simulation program. This actual medical office building is located in Saginaw, MI and the building was modeled with the appropriate HVAC equipment necessary.
In comparison to the case study presented below an office building not used for medical purposes would have a faster payback due to the mechanical system needed. Additionaly, buildings insulated to ASHRAE 90.1-2010 or 2007 would also have a faster payback due to less insulation being required. This case study building has an energy savings payback ranging from 2 years in a cold climate (Zone 5 and 6) to 3.8 years in a warm climate (Zone 3).

Page 17 of 19
THERMRAX™ and TUFF-R™
According to ISO 14025
Energy Savings
Life Cycle MJ for Insulation
Used in Building
MJ Saved/ Year for Case
Study Building
Net MJ Saved (First
Year)
Payback Time
(Years)
MJ Saved over 60 Year Use
Phase Zone 3 - Dallas, TX Mass Wall 524,000 140,000 -384,000 3.7 7,886,000
Steel Frame 596,000 153,000 -443,000 3.9 8,593,000 Zone 4 - Nashville, TN Mass Wall 635,000 184,000 -450,000 3.4 10,431,000
Steel Framed 716,000 197,000 -518,000 3.6 11,121,000 Zone 5 - Saginaw, MI Mass Wall 664,000 331,000 -334,000 2.0 19,175,000
Steel Framed 755,000 347,000 -407,000 2.2 20,092,000 Zone 6 - Minneapolis, MN Mass Wall 793,000 370,000 -423,000 2.1 21,422,000 Steel Framed 793,000 380,000 -413,000 2.1 22,008,000
Greenhouse Gas Avoidance
Life Cycle kg-CO2 Equiv.
for Insulation Used in Building
Kg- CO2 Saved/ Year
for Case Study
Building
Net kg-CO2 Saved (First
Year)
Payback Time
(Years)
Kg-CO2 Saved over 60 Year Use Phase
Zone 3 - Dallas, TX Mass Wall 32,000 18,000 -14,000 1.7 1,068,000 Steel Frame 36,000 20,000 -16,000 1.8 1,175,000 Zone 4 - Nashville, TN Mass Wall 39,000 25,000 -14,000 1.6 1,442,000 Steel Framed 44,000 26,000 -17,000 1.7 1,541,000 Zone 5 - Saginaw, MI Mass Wall 41,000 40,000 -1,000 1.0 2,340,000 Steel Framed 46,000 42,000 -4,000 1.1 2,488,000 Zone 6 - Minneapolis, MN Mass Wall 48,000 41,000 -7,000 1.2 2,437,000 Steel Framed 48,000 43,000 -5,000 1.1 2,535,000
The polyisocyanurate foam has a low global warming potential, therefore the payback time for the greenhouse gas avoidance ranges from 0.8 to 1.6 years depending on the location of the building. USEPA eGRID Version 9.0 was used to determine CO2 equivalent numbers due to electricity. The natural gas conversion was determined based on the USEPA Greenhouse Gas Equivalent Calculator.

Page 18 of 19
THERMRAX™ and TUFF-R™
According to ISO 14025
References
• International Standard ISO 14040, “Environmental management – Life cycle assessment – Principles and framework”, Second edition, 01 July 2006
• International Standard ISO 14044, “Environmental management – Life cycle assessment – Requirements and guidelines”, First edition, 01 July 2006
• European Commission - Joint Research Centre - Institute for Environment and Sustainability: International Reference Life Cycle Data System (ILCD) Handbook - General guide for Life Cycle Assessment - Detailed guidance. First edition March 2010. EUR 24708 EN. Luxembourg. Publications Office of the European Union; 2010.
• Underwriters Laboratories. “Product Category Rules for preparing an environmental product declaration (EPD) for Product Group: Building Envelope Thermal Insulation”. September 12, 2011 (valid through September 12, 2016)
• Ecoinvent v2.2, Swiss Centre for Life Cycle Inventories, 2010