tullett prebon · •precious metals •soft commodities •soft commodities options •uk power...
TRANSCRIPT

Tullett Prebon
Capital Markets Day
12th June, 2015
John Phizackerley
Chief Executive, Tullett Prebon

Agenda for the morning
TIME SESSION PRESENTER
08:30 – 09:00 Registration and coffee
09:00 – 09:30 Introduction and general insights John Phizackerley, Chief Executive
09:30 – 09:50 EMEA Angus Wink, CEO, EMEA
09:50 – 10:10 The Americas John Abularrage, CEO and President, The Americas
10:10 – 10:25 Asia Pacific Angus Wink, CEO, EMEA
10:25 – 10:50 Coffee break
10:50 – 11:10 Energy Andrew Polydor, Global Head of Energy and
Commodities
11:10 – 11:30 Tullett Prebon Information Frank Desmond, CEO, Tullett Prebon Information
11:30 – 11:40 Summary John Phizackerley, Chief Executive
11:40 – 12:05 Q & A
12:05 – 13:00 Lunch
3
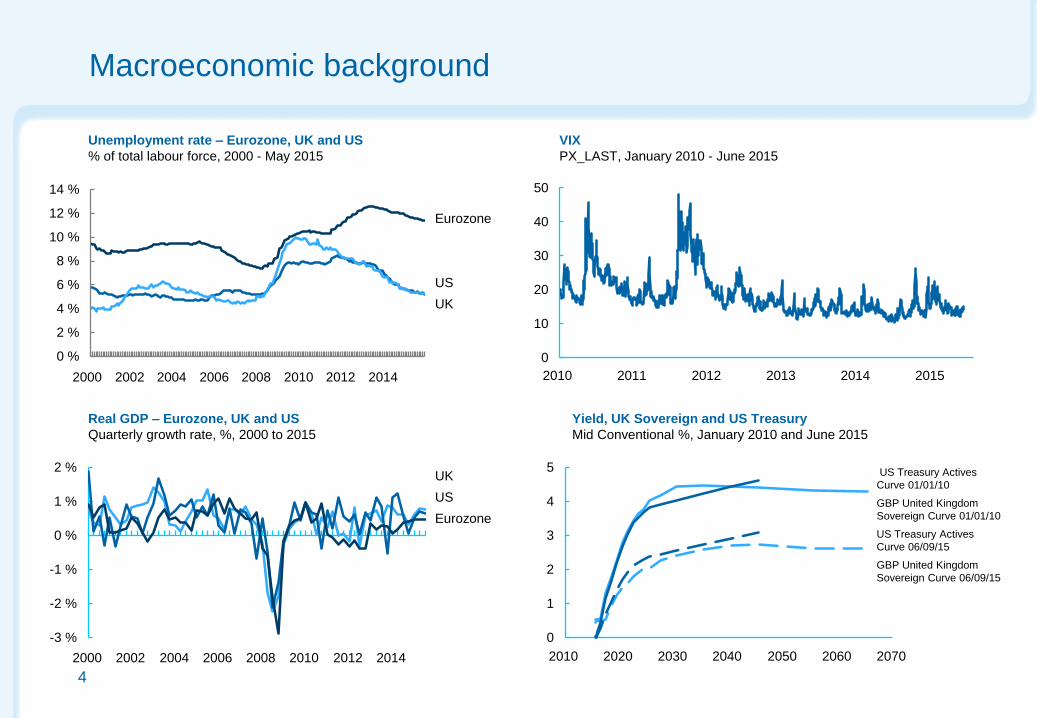
Macroeconomic background
Unemployment rate – Eurozone, UK and US
% of total labour force, 2000 - May 2015
0 %
2 %
4 %
6 %
8 %
10 %
12 %
14 %
Eurozone
UK
US
2014 2010 2012 2008 2004 2002 2006 2000
0
10
20
30
40
50
2010 2012 2013 2011 2015 2014
VIX
PX_LAST, January 2010 - June 2015
Yield, UK Sovereign and US Treasury
Mid Conventional %, January 2010 and June 2015
0
1
2
3
4
5
2070 2060 2050 2030 2010 2020 2040
US Treasury Actives
Curve 06/09/15
US Treasury Actives
Curve 01/01/10
GBP United Kingdom
Sovereign Curve 06/09/15
GBP United Kingdom
Sovereign Curve 01/01/10
Real GDP – Eurozone, UK and US
Quarterly growth rate, %, 2000 to 2015
-3 %
-2 %
-1 %
0 %
1 %
2 %
US
Eurozone
UK
2006 2004 2000 2002 2012 2010 2008 2014
4
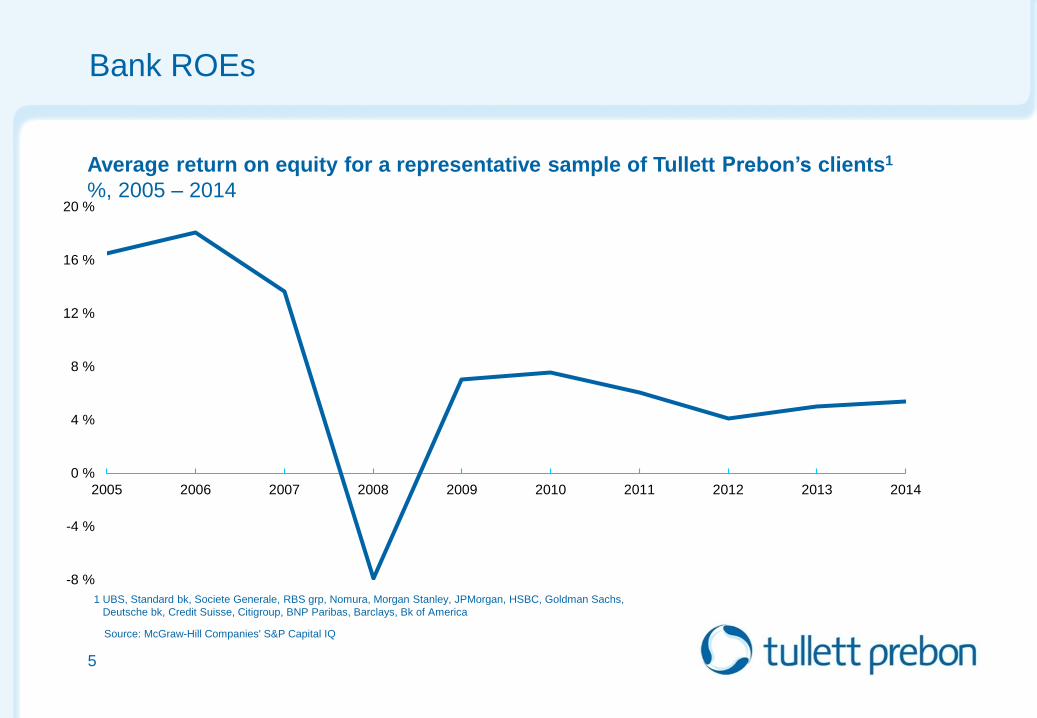
Bank ROEs
5
Source: McGraw-Hill Companies' S&P Capital IQ
-8 %
-4 %
0 %
4 %
8 %
12 %
16 %
20 %
2005 2006 2007 2008 2009 2010 2011 2012 2013 2014
1 UBS, Standard bk, Societe Generale, RBS grp, Nomura, Morgan Stanley, JPMorgan, HSBC, Goldman Sachs,
Deutsche bk, Credit Suisse, Citigroup, BNP Paribas, Barclays, Bk of America
Average return on equity for a representative sample of Tullett Prebon’s clients1
%, 2005 – 2014
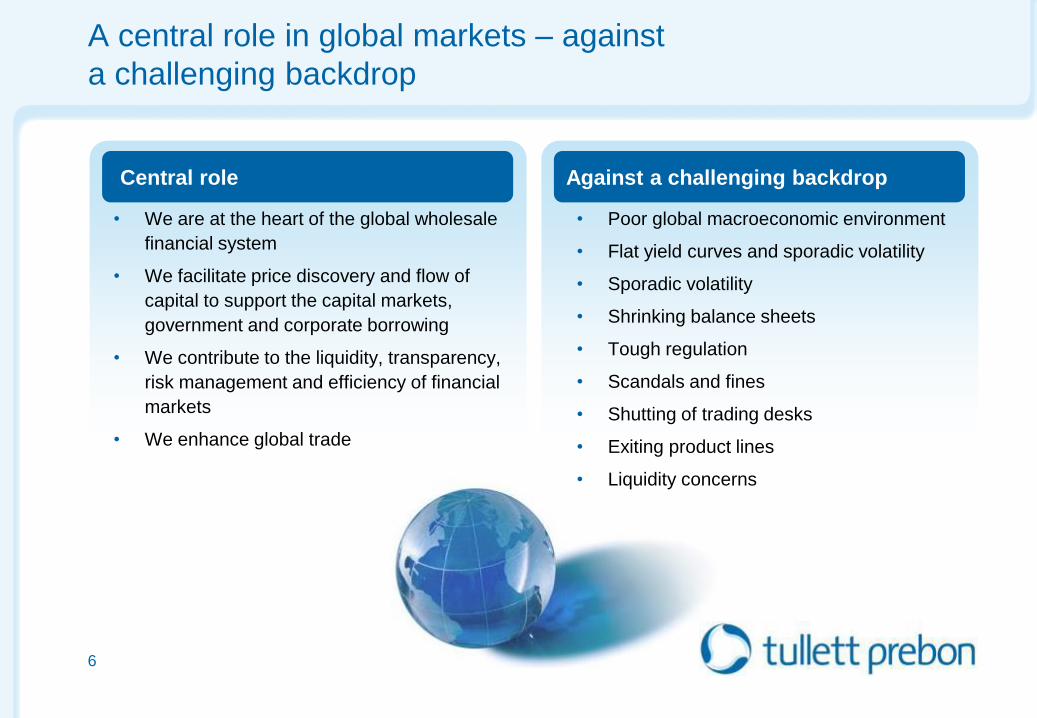
Against a challenging backdrop
A central role in global markets – against
a challenging backdrop
• We are at the heart of the global wholesale
financial system
• We facilitate price discovery and flow of
capital to support the capital markets,
government and corporate borrowing
• We contribute to the liquidity, transparency,
risk management and efficiency of financial
markets
• We enhance global trade
6
• Poor global macroeconomic environment
• Flat yield curves and sporadic volatility
• Sporadic volatility
• Shrinking balance sheets
• Tough regulation
• Scandals and fines
• Shutting of trading desks
• Exiting product lines
• Liquidity concerns
Central role
Industry recognition: awards
7
Risk Magazine’s 2014
Annual Interdealer
Rankings
More No. 1 positions than any
other single interdealer broker
Voted best overall IDB in
Currency
FX Week Best Banks
Awards 2014
Best Broker for Forward FX
14th year running
Inside Market Data
Awards 2015
Best Data Provider (Broker)
5th year running
Industry recognition: energy awards
8
Risk and Energy Risk
Commodity Rankings 2014
Overall Top Broker
in Electricity Products
for 6th year running
Overall Top Broker
in Oil Products
Futures and Options
Awards 2014
Commodities Broker
of the Year and Best
Innovation by a Broker
GlobalCapital’s 2014
Global Derivatives Awards
Commodity Derivatives
Interdealer Broker
of the Year
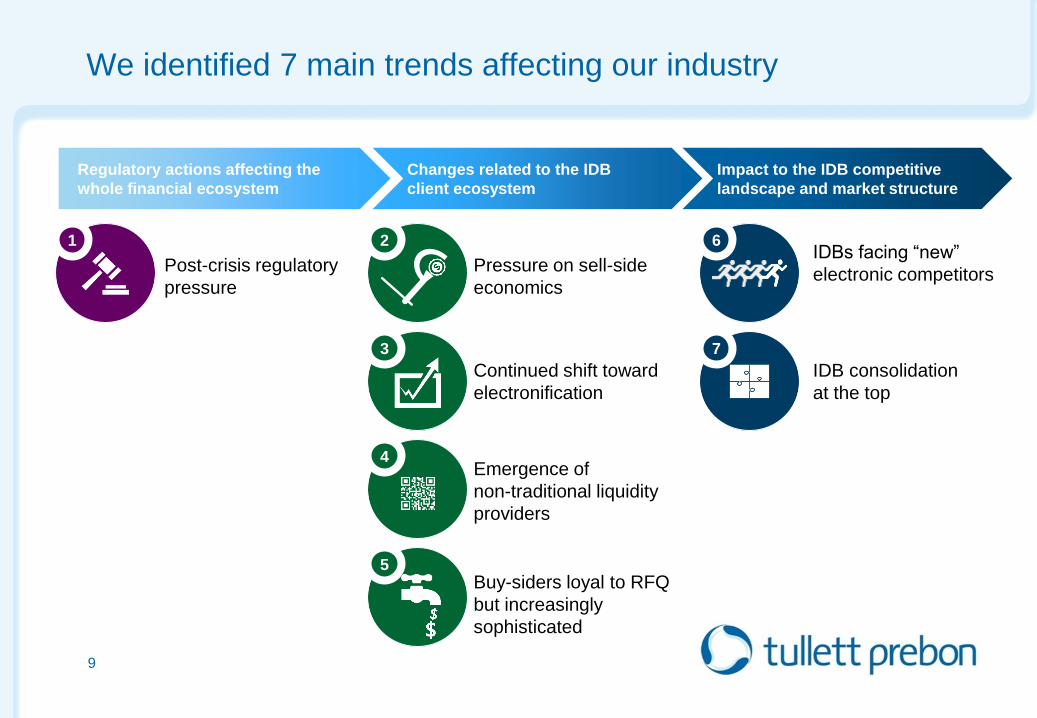
We identified 7 main trends affecting our industry
Post-crisis regulatory
pressure
Continued shift toward
electronification
Buy-siders loyal to RFQ
but increasingly
sophisticated
Pressure on sell-side
economics
Emergence of
non-traditional liquidity
providers
IDBs facing “new”
electronic competitors
IDB consolidation
at the top
Regulatory actions affecting the
whole financial ecosystem
Changes related to the IDB
client ecosystem
Impact to the IDB competitive
landscape and market structure
2
3
5
4
6
7
1
9
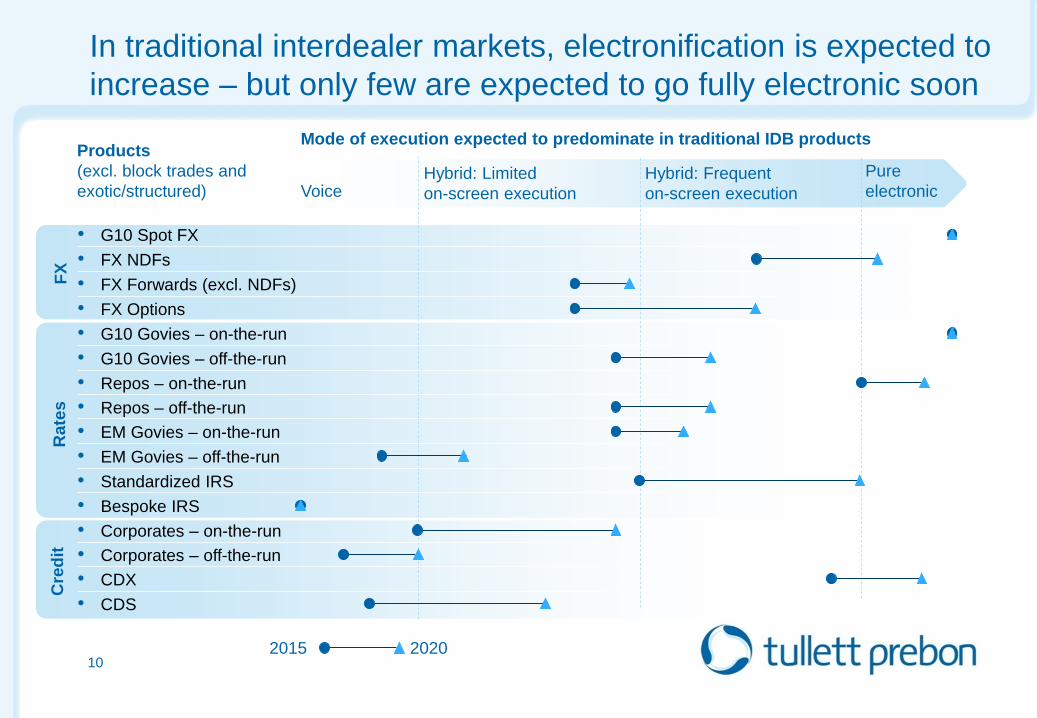
In traditional interdealer markets, electronification is expected to
increase – but only few are expected to go fully electronic soon
Pure
electronic Voice Hybrid: Limited
on-screen execution
Hybrid: Frequent
on-screen execution
FX
R
ate
s
Cre
dit
Mode of execution expected to predominate in traditional IDB products Products
(excl. block trades and
exotic/structured)
• FX NDFs
• FX Forwards (excl. NDFs)
• G10 Govies – off-the-run
• Repos – on-the-run
• Repos – off-the-run
• EM Govies – on-the-run
• EM Govies – off-the-run
• Standardized IRS
• G10 Govies – on-the-run
• Bespoke IRS
• Corporates – off-the-run
• CDX
• Corporates – on-the-run
• CDS
• FX Options
• G10 Spot FX
10 2015 2020
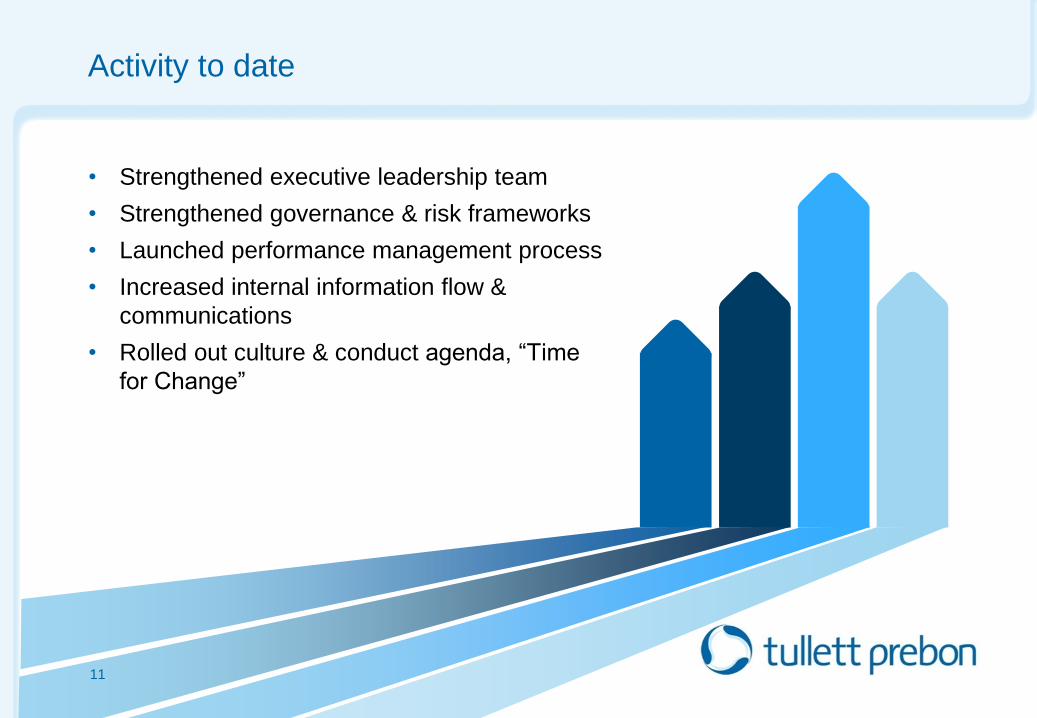
Activity to date
• Strengthened executive leadership team
• Strengthened governance & risk frameworks
• Launched performance management process
• Increased internal information flow &
communications
• Rolled out culture & conduct agenda, “Time
for Change”
11

12
2015 Town halls held in all major regions
12

2015 Strategy Management meeting
13

10 arrows
14
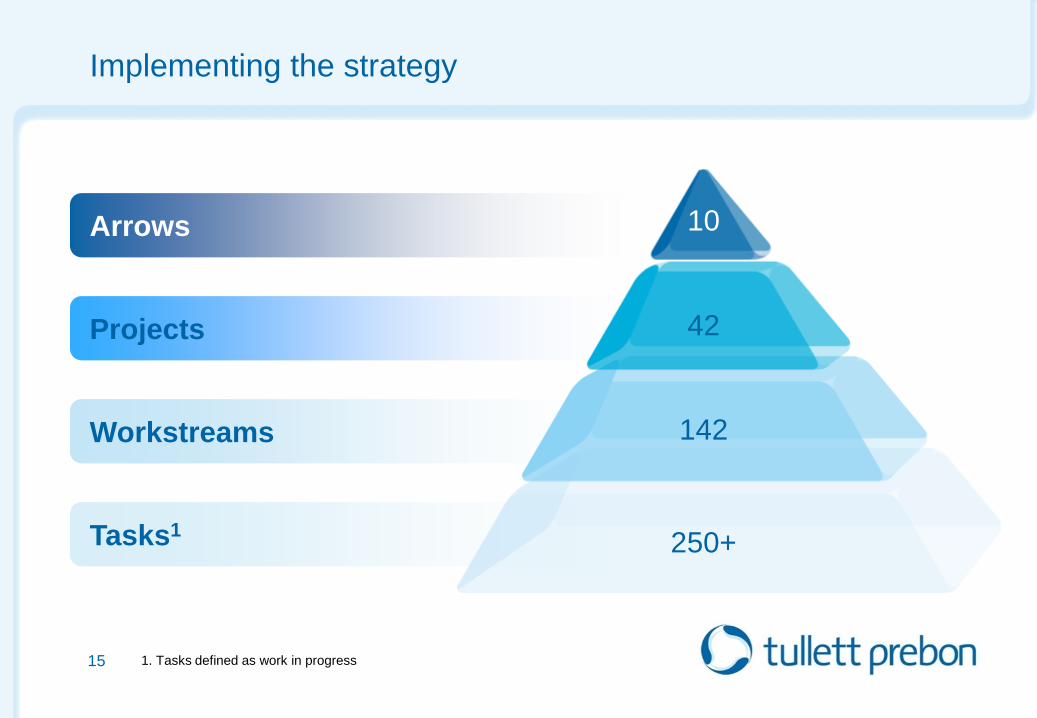
Implementing the strategy
1. Tasks defined as work in progress
Arrows
Projects
Workstreams
Tasks1
15
250+
142
42
10
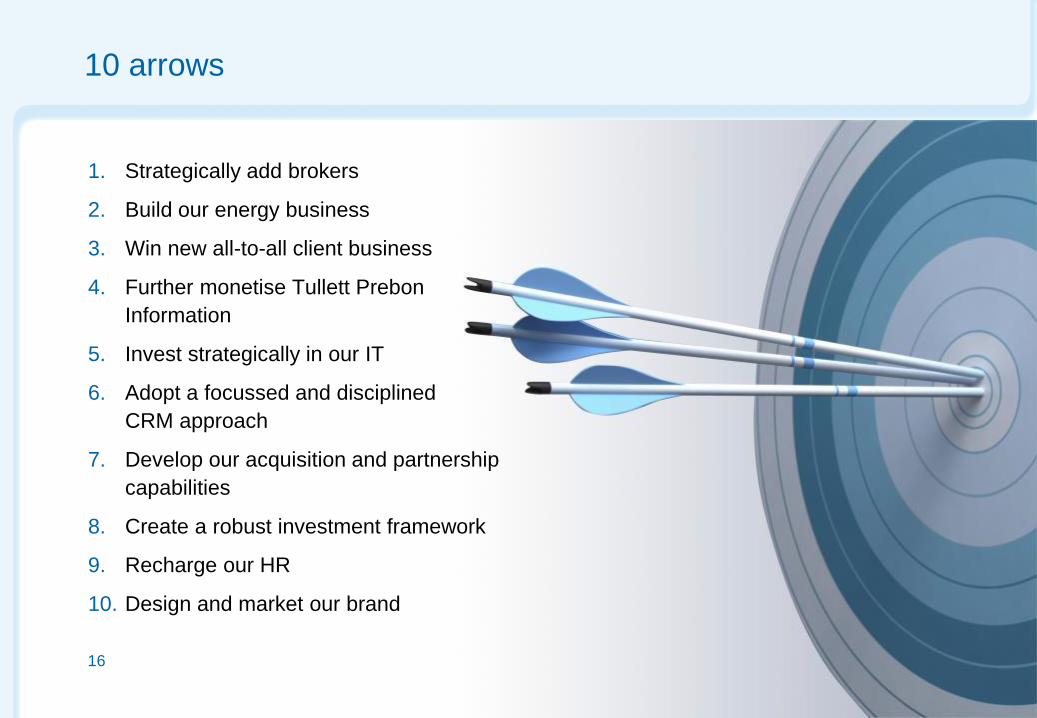
10 arrows
1. Strategically add brokers
2. Build our energy business
3. Win new all-to-all client business
4. Further monetise Tullett Prebon
Information
5. Invest strategically in our IT
6. Adopt a focussed and disciplined
CRM approach
7. Develop our acquisition and partnership
capabilities
8. Create a robust investment framework
9. Recharge our HR
10. Design and market our brand
16
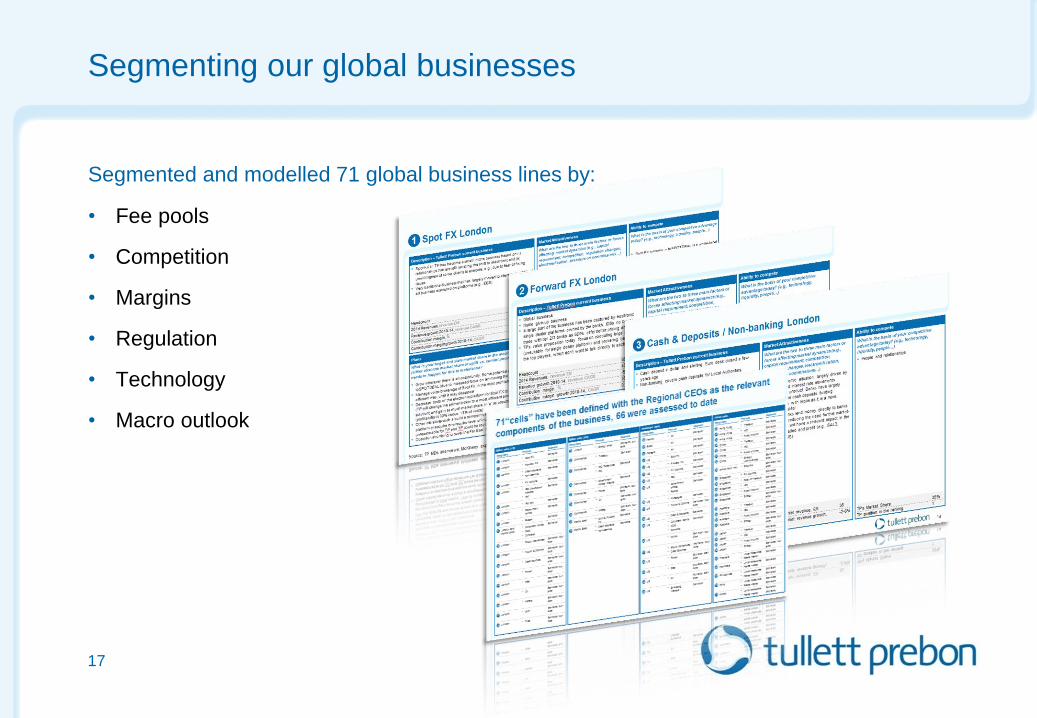
Segmenting our global businesses
Segmented and modelled 71 global business lines by:
• Fee pools
• Competition
• Margins
• Regulation
• Technology
• Macro outlook
17
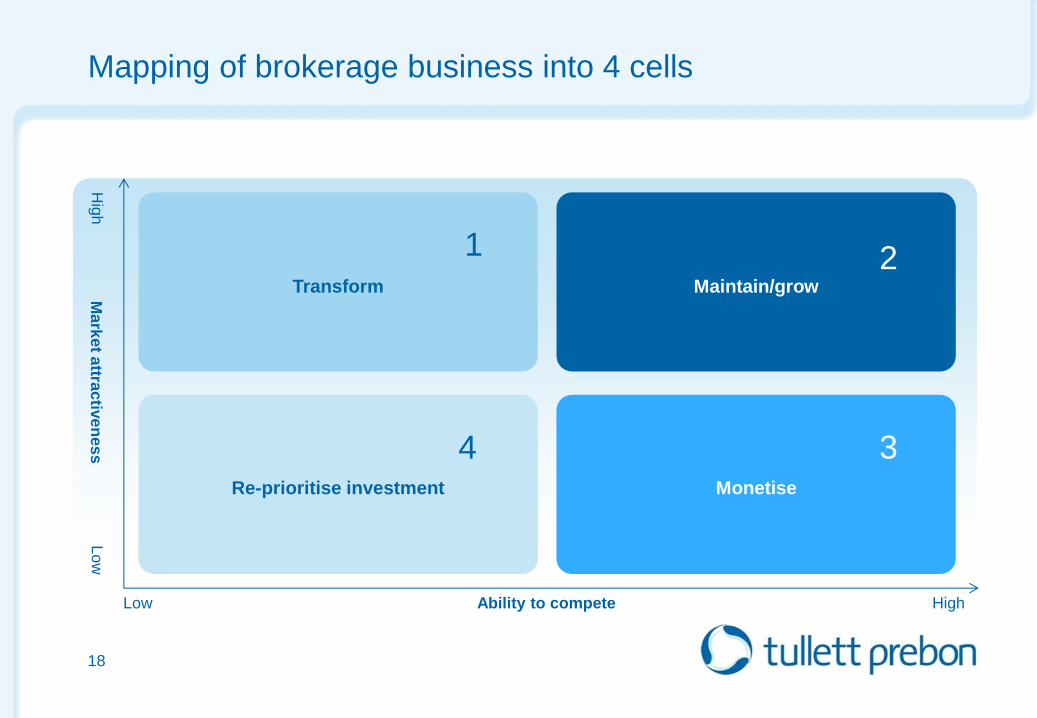
Mapping of brokerage business into 4 cells
18
Ma
rke
t attra
ctiv
en
es
s
Lo
w
High Low Ability to compete
Transform
Re-prioritise investment
Maintain/grow
Monetise
Hig
h
1
4 3
2
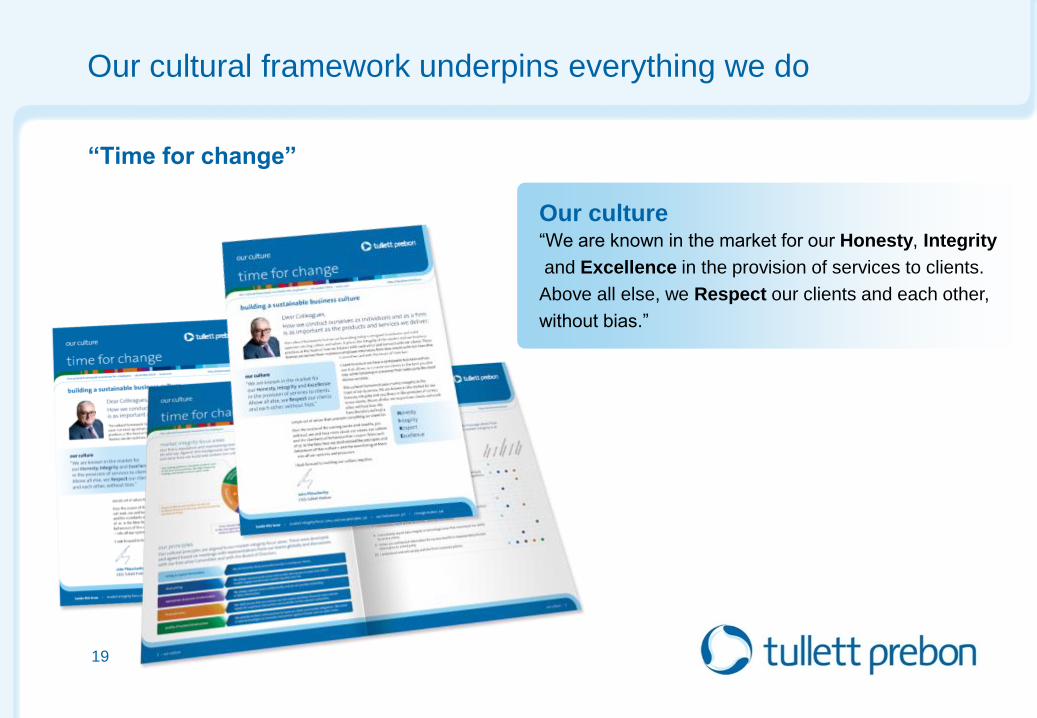
Our cultural framework underpins everything we do
“Time for change”
Our culture “We are known in the market for our Honesty, Integrity
and Excellence in the provision of services to clients.
Above all else, we Respect our clients and each other,
without bias.”
19
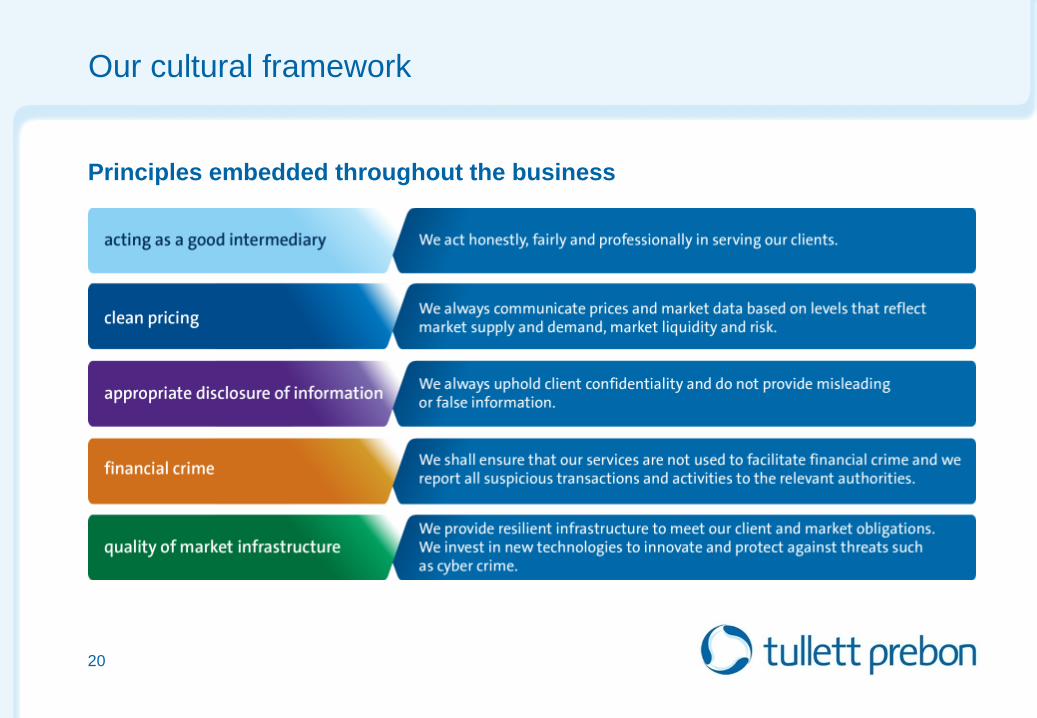
Principles embedded throughout the business
20
Our cultural framework
Tullett Prebon EMEA
Capital Markets Day
12th June, 2015
London
Angus Wink
CEO, EMEA
22
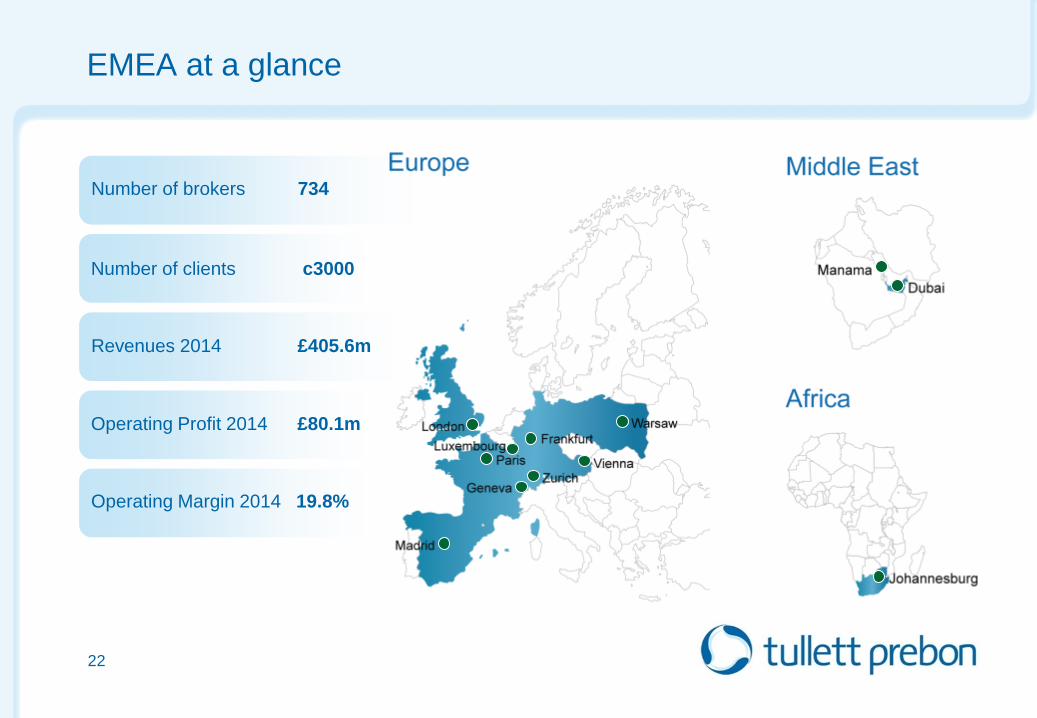
EMEA at a glance
Number of brokers 734
Number of clients c3000
Revenues 2014 £405.6m
Operating Margin 2014 19.8%
Operating Profit 2014 £80.1m
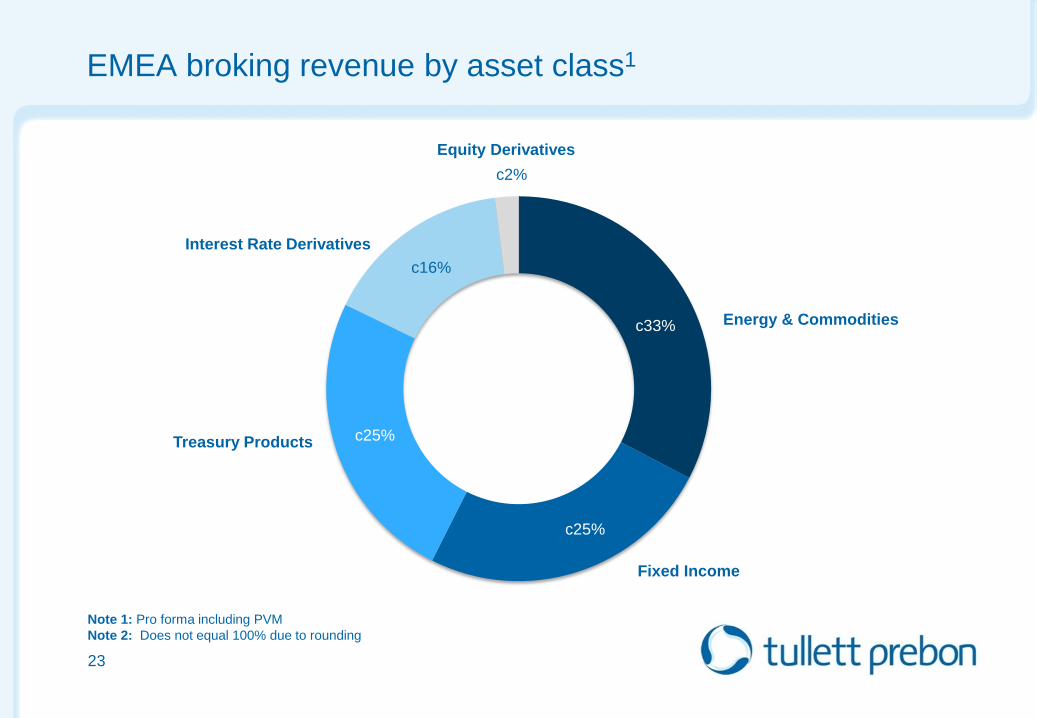
EMEA broking revenue by asset class1
23
Note 1: Pro forma including PVM
Note 2: Does not equal 100% due to rounding
Energy & Commodities
Treasury Products
Interest Rate Derivatives
Fixed Income
Equity Derivatives
c33%
c25%
c2%
c25%
c16%
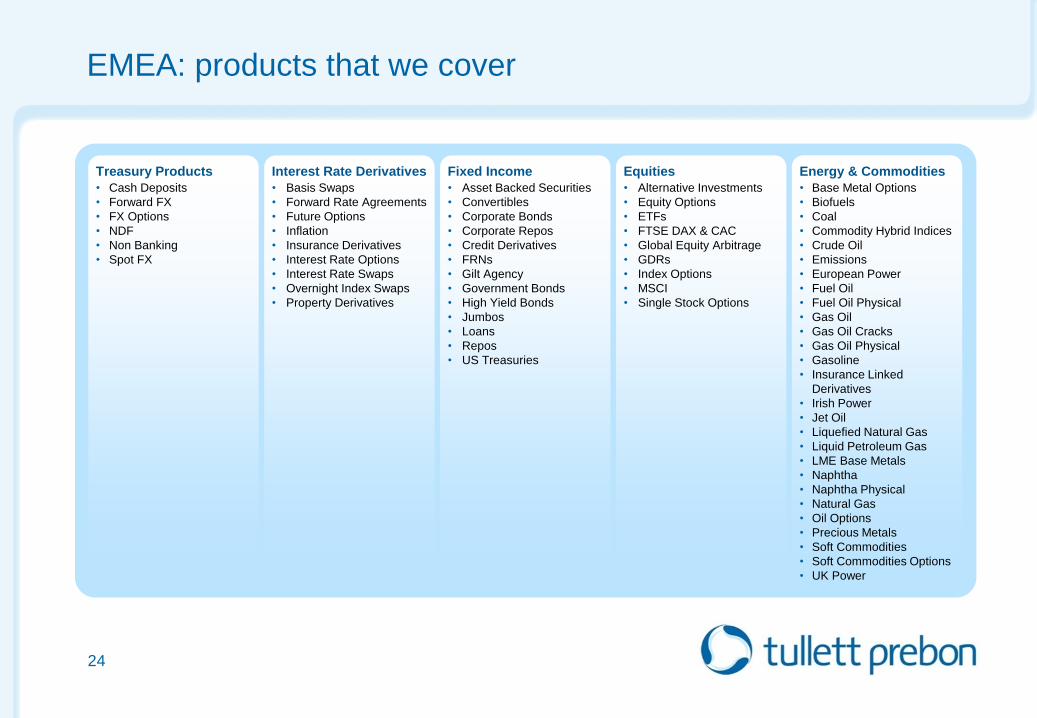
EMEA: products that we cover
24
Equities
• Alternative Investments
• Equity Options
• ETFs
• FTSE DAX & CAC
• Global Equity Arbitrage
• GDRs
• Index Options
• MSCI
• Single Stock Options
Energy & Commodities
• Base Metal Options
• Biofuels
• Coal
• Commodity Hybrid Indices
• Crude Oil
• Emissions
• European Power
• Fuel Oil
• Fuel Oil Physical
• Gas Oil
• Gas Oil Cracks
• Gas Oil Physical
• Gasoline
• Insurance Linked
Derivatives
• Irish Power
• Jet Oil
• Liquefied Natural Gas
• Liquid Petroleum Gas
• LME Base Metals
• Naphtha
• Naphtha Physical
• Natural Gas
• Oil Options
• Precious Metals
• Soft Commodities
• Soft Commodities Options
• UK Power
Interest Rate Derivatives
• Basis Swaps
• Forward Rate Agreements
• Future Options
• Inflation
• Insurance Derivatives
• Interest Rate Options
• Interest Rate Swaps
• Overnight Index Swaps
• Property Derivatives
Fixed Income
• Asset Backed Securities
• Convertibles
• Corporate Bonds
• Corporate Repos
• Credit Derivatives
• FRNs
• Gilt Agency
• Government Bonds
• High Yield Bonds
• Jumbos
• Loans
• Repos
• US Treasuries
Treasury Products
• Cash Deposits
• Forward FX
• FX Options
• NDF
• Non Banking
• Spot FX
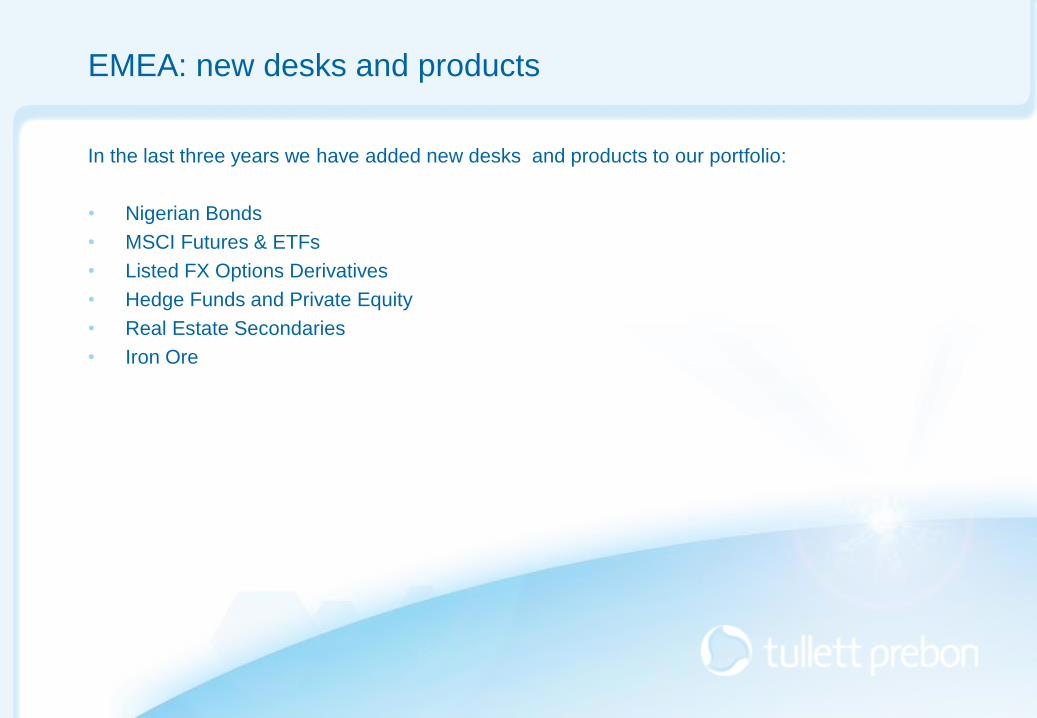
EMEA: new desks and products
In the last three years we have added new desks and products to our portfolio:
• Nigerian Bonds
• MSCI Futures & ETFs
• Listed FX Options Derivatives
• Hedge Funds and Private Equity
• Real Estate Secondaries
• Iron Ore
25
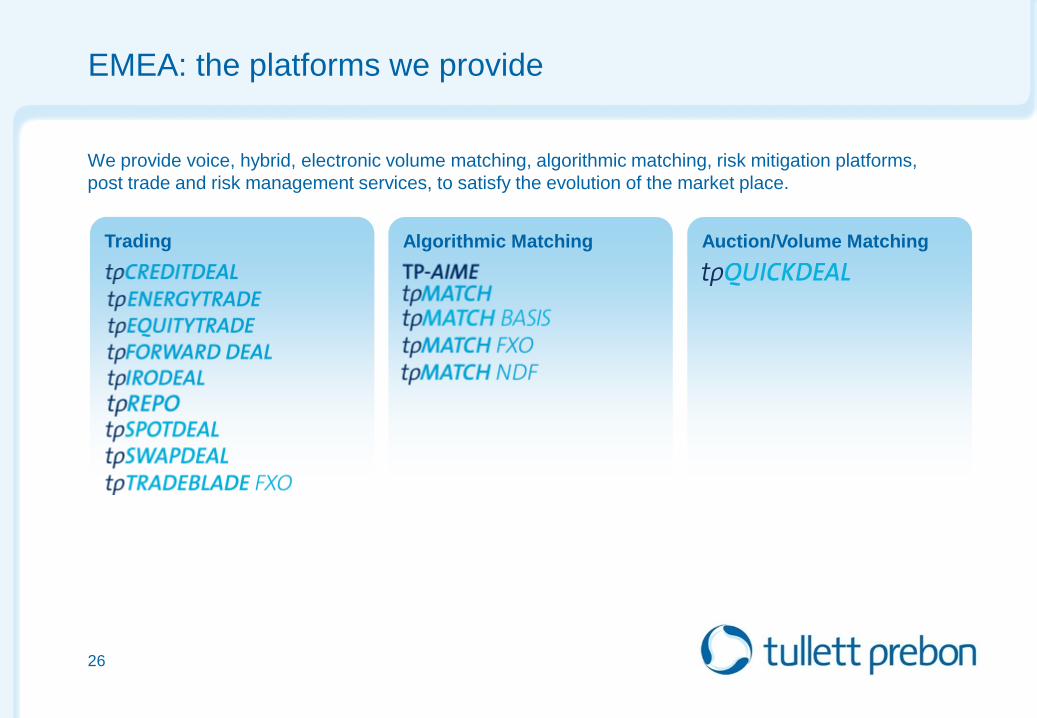
Trading
EMEA: the platforms we provide
We provide voice, hybrid, electronic volume matching, algorithmic matching, risk mitigation platforms,
post trade and risk management services, to satisfy the evolution of the market place.
26
Algorithmic Matching Auction/Volume Matching
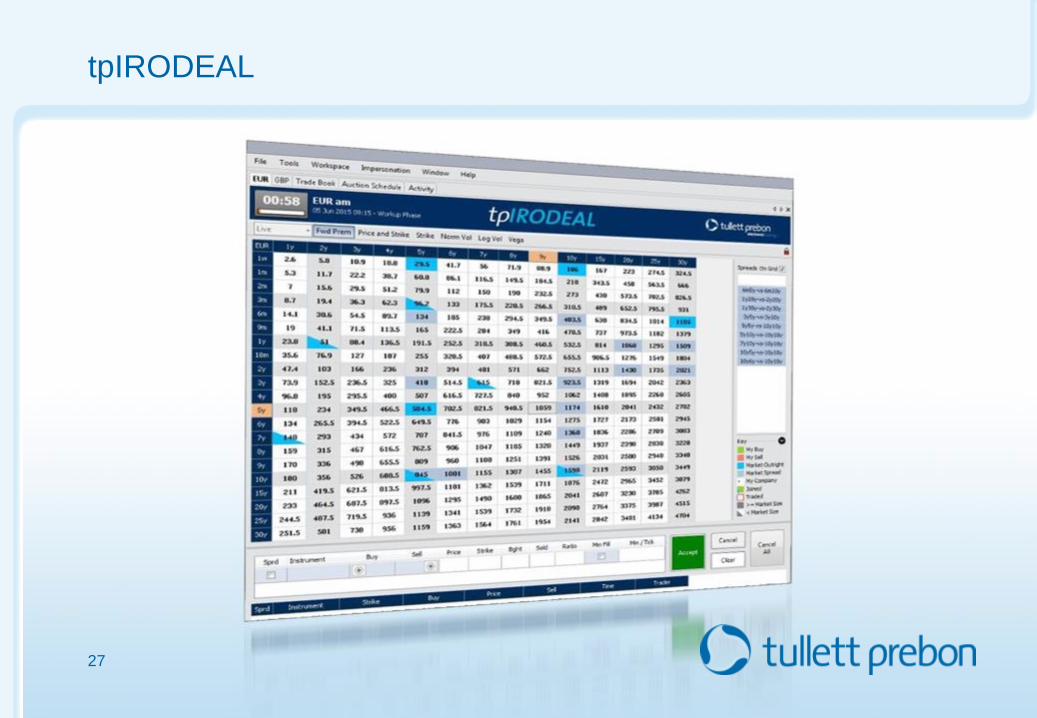
tpIRODEAL
27
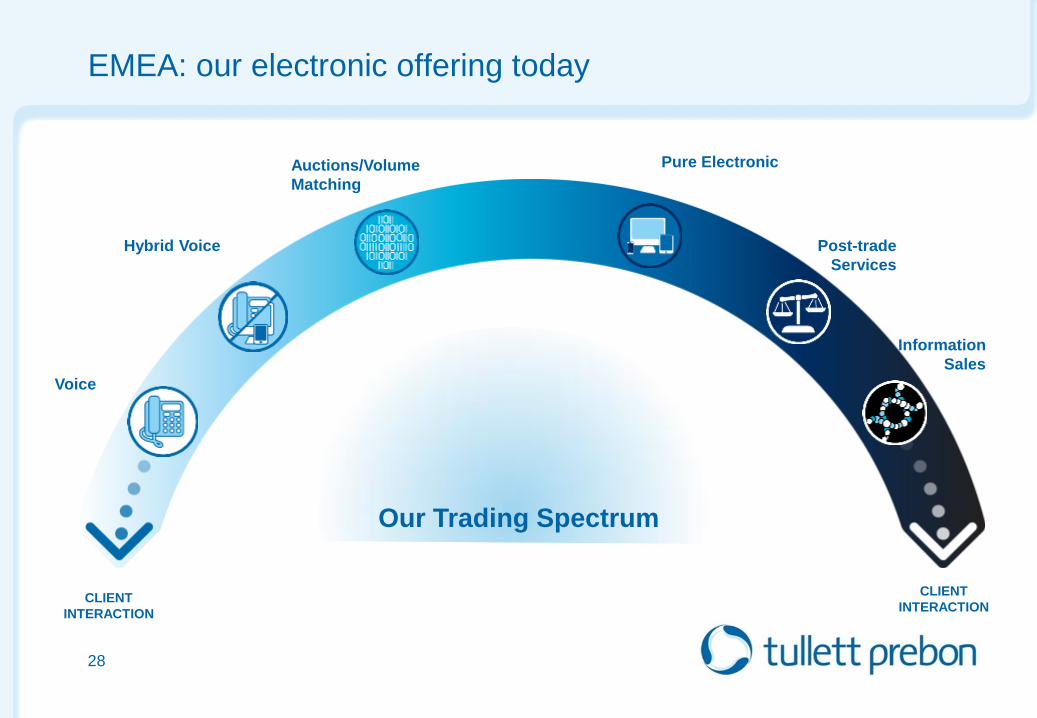
EMEA: our electronic offering today
28
Our Trading Spectrum
Voice
Hybrid Voice
Auctions/Volume
Matching
Pure Electronic
Post-trade
Services
Information
Sales
CLIENT
INTERACTION
CLIENT
INTERACTION
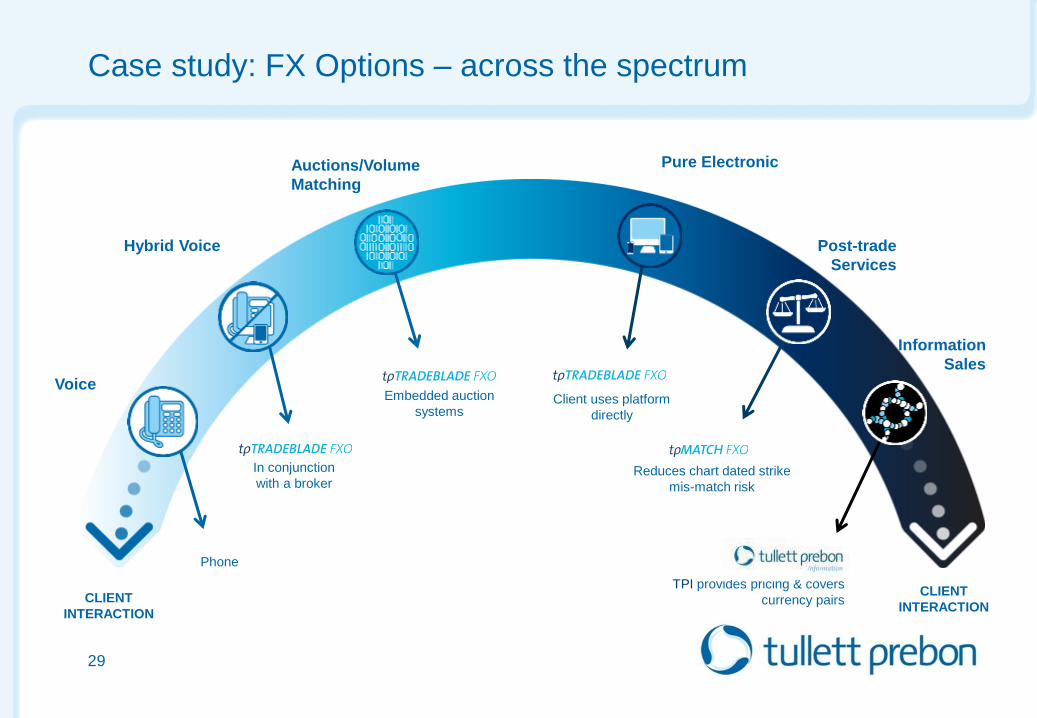
Case study: FX Options – across the spectrum
29
In conjunction
with a broker
Embedded auction
systems
Reduces chart dated strike
mis-match risk
TPI provides pricing & covers
currency pairs
Phone
CLIENT
INTERACTION
CLIENT
INTERACTION
Client uses platform
directly
Voice
Hybrid Voice
Auctions/Volume
Matching
Pure Electronic
Post-trade
Services
Information
Sales
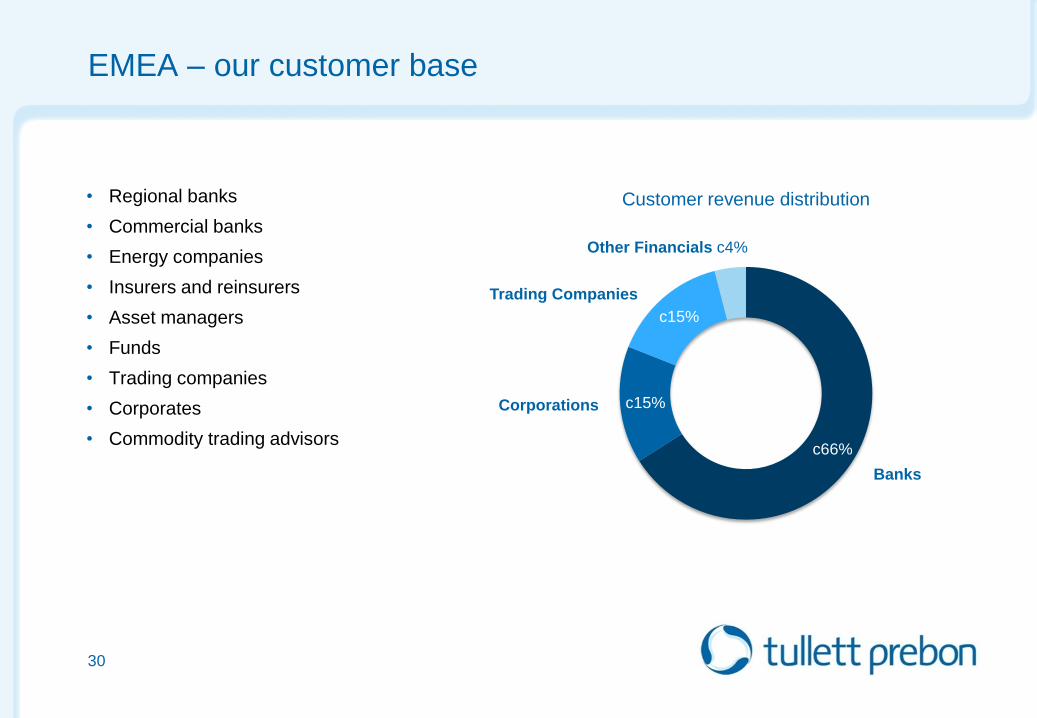
EMEA – our customer base
• Regional banks
• Commercial banks
• Energy companies
• Insurers and reinsurers
• Asset managers
• Funds
• Trading companies
• Corporates
• Commodity trading advisors
30
Other Financials c4%
Banks
Corporations
Customer revenue distribution
Trading Companies
c66%
c15%
c15%
Corey -

31
EMEA: meeting our key challenges
Regulation Infrastructure

32
EMEA: opportunities
• New entrants as sell side banks reduce their
presence; a potential new client base for Tullett
Prebon
• Deepening our client relationships through
rigorous CRM
• Hiring talented staff
• Clients previously served by banks now seeking
our expertise
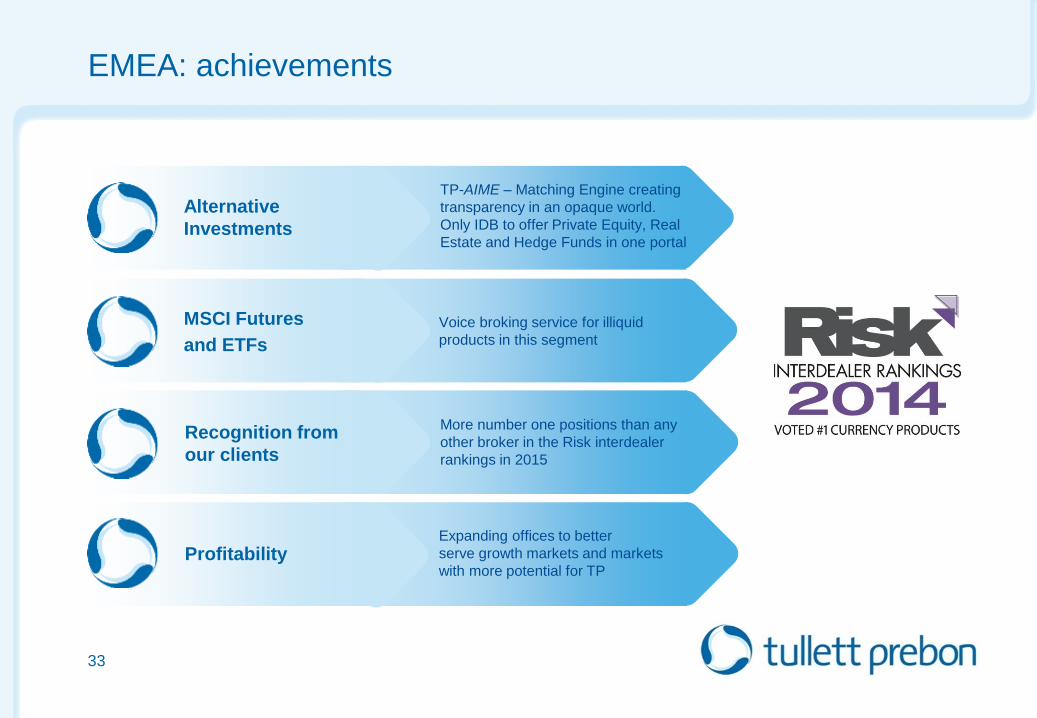
TP-AIME – Matching Engine creating
transparency in an opaque world.
Only IDB to offer Private Equity, Real
Estate and Hedge Funds in one portal
Voice broking service for illiquid
products in this segment
More number one positions than any
other broker in the Risk interdealer
rankings in 2015
Expanding offices to better
serve growth markets and markets
with more potential for TP
EMEA: achievements
33
Alternative
Investments
MSCI Futures
and ETFs
Profitability
Recognition from
our clients
Key takeaways
1. We have a big network in Continental Europe, we are very strong in the Middle East and we have a
presence in Johannesburg
2. Our range of products makes us a “one stop shop”
3. Clients can interact with us across the full trading spectrum
4. The platforms in EMEA will be ready for MIFID II
5. The mix of our client base is changing and we are diversifying away from dependence on wholesale banks
6. EMEA remains at the heart of Tullett Prebon and is well placed to drive the business forward
34
Tullett Prebon America
Capital Markets Day
12th June, 2015
London
John Abularrage
CEO & President of the Americas
36
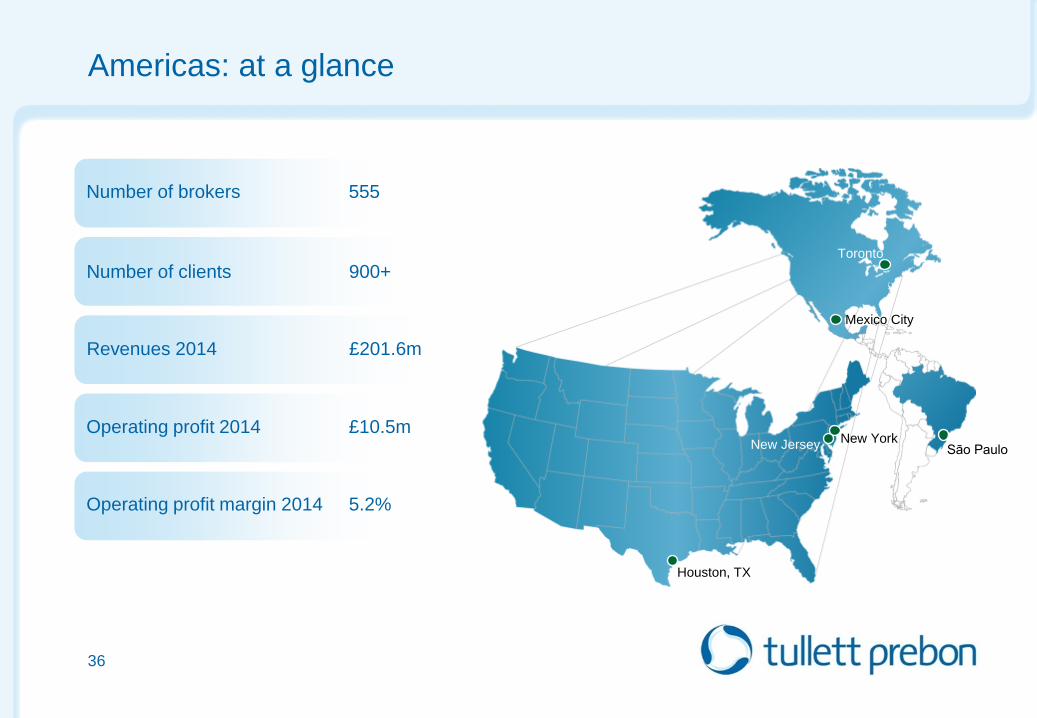
Americas: at a glance
Number of brokers 555
Number of clients 900+
Revenues 2014 £201.6m
Operating profit margin 2014 5.2%
Operating profit 2014 £10.5m New York New Jersey
Houston, TX
Sāo Paulo
Toronto
Mexico City
37
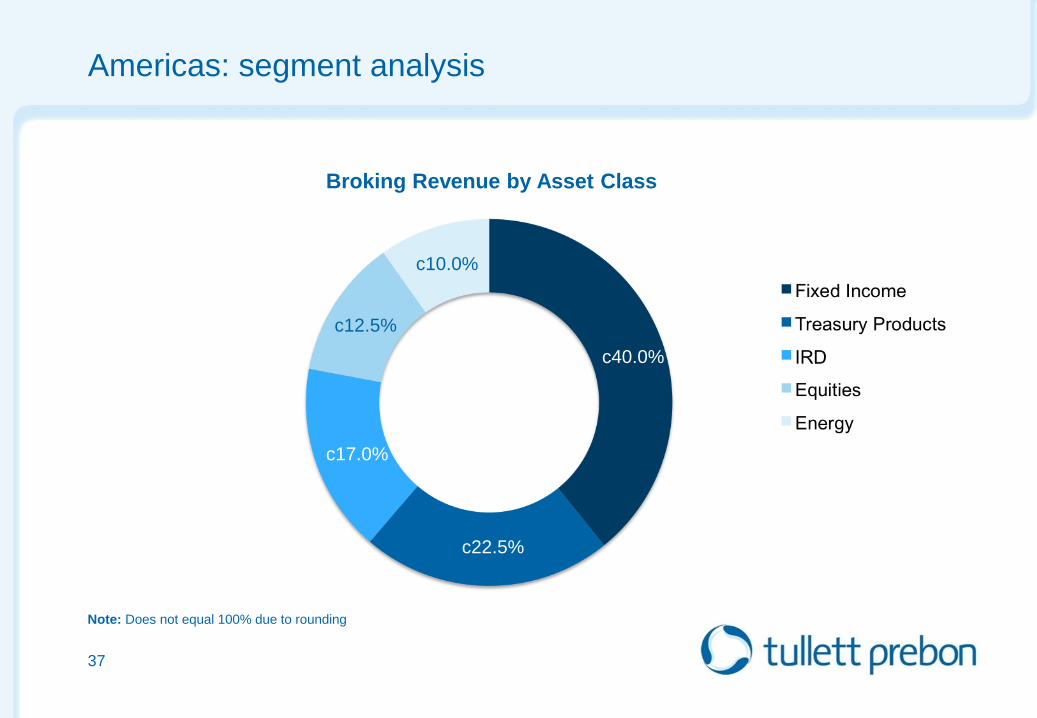
Broking Revenue by Asset Class
Americas: segment analysis
Note: Does not equal 100% due to rounding
c40.0%
c22.5%
c17.0%
c12.5%
c10.0%
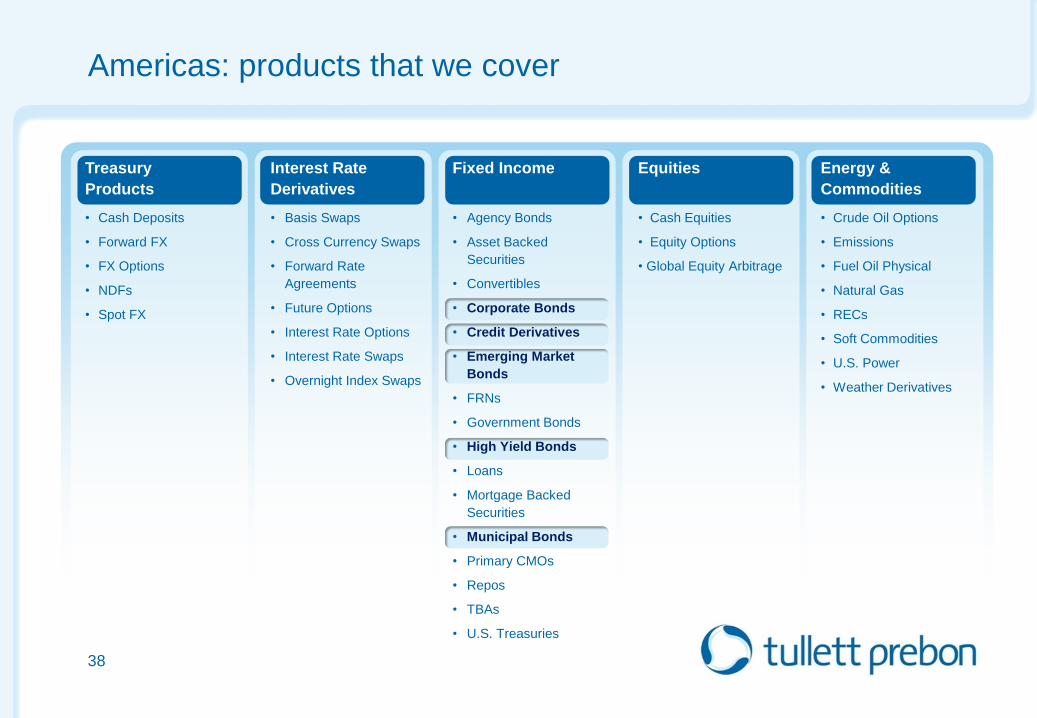
Americas: products that we cover
38
Equities
• Cash Equities
• Equity Options
• Global Equity Arbitrage
Energy &
Commodities
• Crude Oil Options
• Emissions
• Fuel Oil Physical
• Natural Gas
• RECs
• Soft Commodities
• U.S. Power
• Weather Derivatives
Interest Rate
Derivatives
• Basis Swaps
• Cross Currency Swaps
• Forward Rate
Agreements
• Future Options
• Interest Rate Options
• Interest Rate Swaps
• Overnight Index Swaps
Treasury
Products
• Cash Deposits
• Forward FX
• FX Options
• NDFs
• Spot FX
Fixed Income
• Agency Bonds
• Asset Backed
Securities
• Convertibles
• Corporate Bonds
• Credit Derivatives
• Emerging Market
Bonds
• FRNs
• Government Bonds
• High Yield Bonds
• Loans
• Mortgage Backed
Securities
• Municipal Bonds
• Primary CMOs
• Repos
• TBAs
• U.S. Treasuries
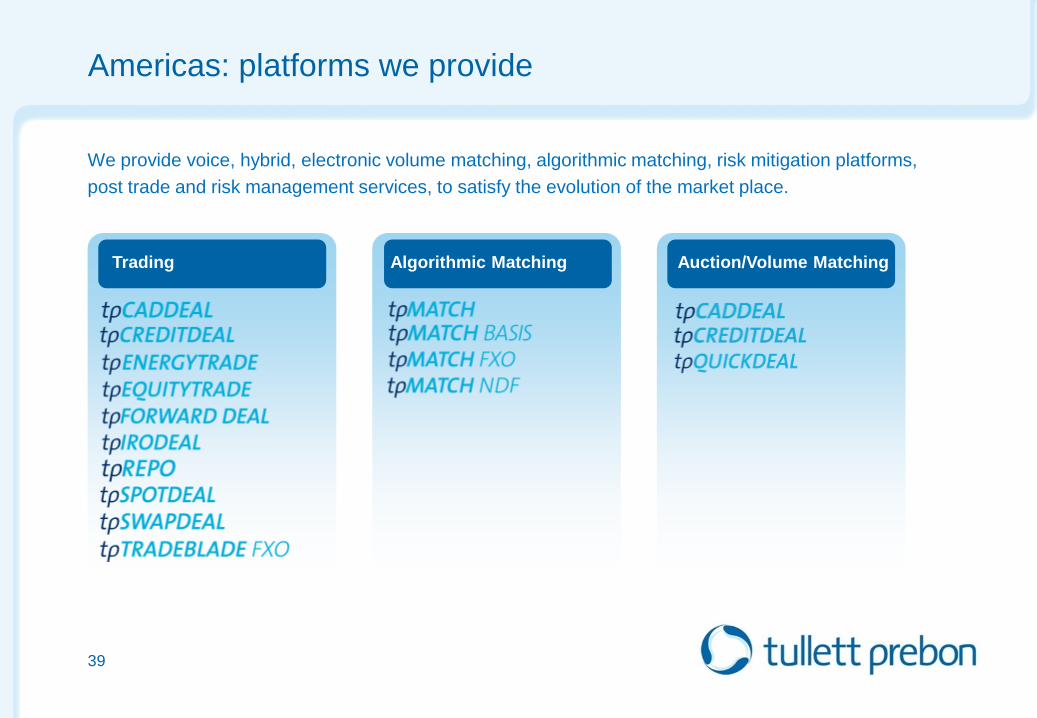
Americas: platforms we provide
We provide voice, hybrid, electronic volume matching, algorithmic matching, risk mitigation platforms,
post trade and risk management services, to satisfy the evolution of the market place.
39
Auction/Volume Matching Algorithmic Matching Trading
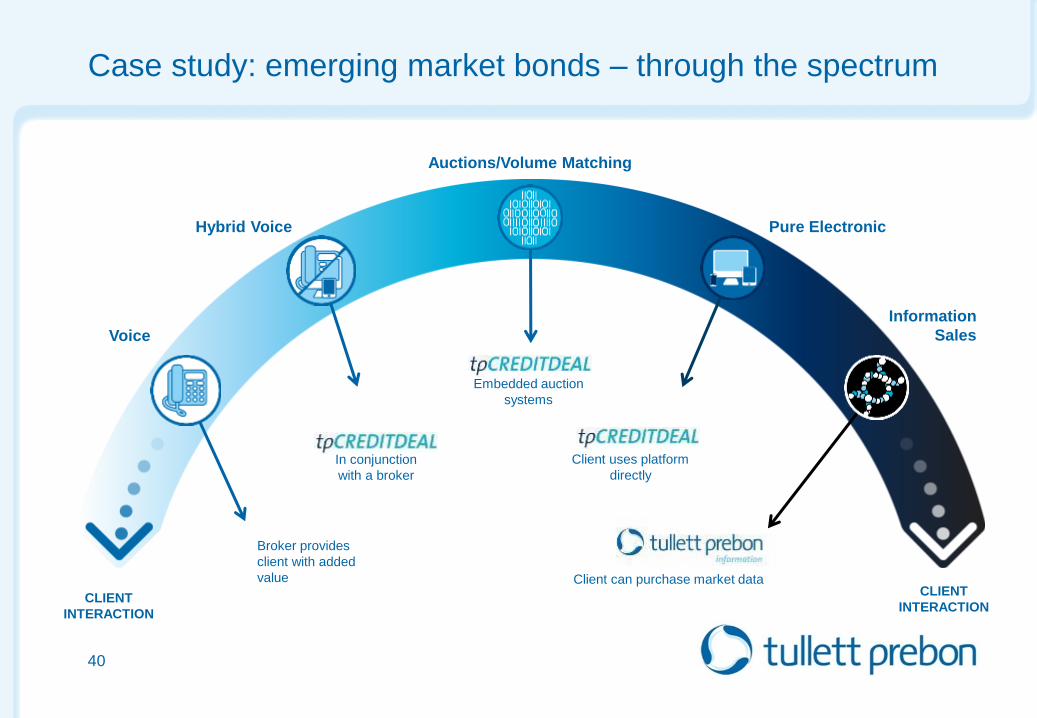
Case study: emerging market bonds – through the spectrum
40
In conjunction
with a broker
Embedded auction
systems
Client can purchase market data
Broker provides
client with added
value
CLIENT
INTERACTION
CLIENT
INTERACTION
Client uses platform
directly
Voice
Hybrid Voice
Auctions/Volume Matching
Information
Sales
Pure Electronic
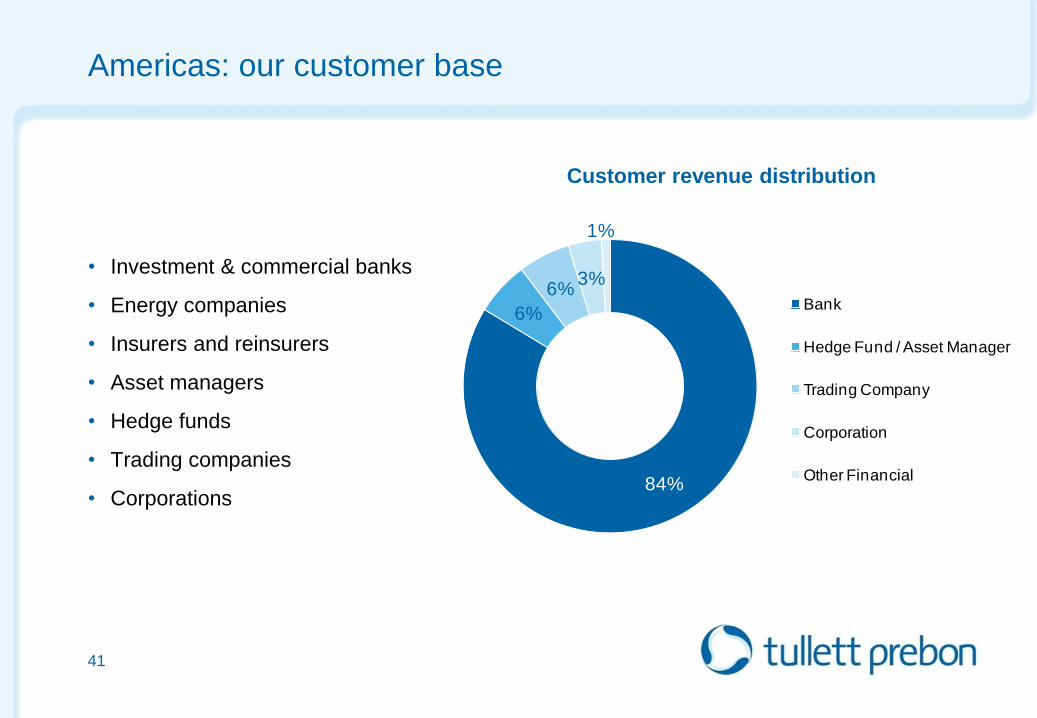
• Investment & commercial banks
• Energy companies
• Insurers and reinsurers
• Asset managers
• Hedge funds
• Trading companies
• Corporations
Americas: our customer base
41
84%
6%
6%3%
1%
Bank
Hedge Fund / Asset Manager
Trading Company
Corporation
Other Financial
Customer revenue distribution

Creating scale
42

43

Changing regulation brings opportunities
• Compliance costs have increased significantly since Dodd Frank
• Smaller firms struggle to afford the additional overheads
• Many are seeking a good parent
• Our reputation as a good home is strong
• There are a number of strategic opportunities for us to evaluate
• Draw on our expertise at integrating businesses successfully
44
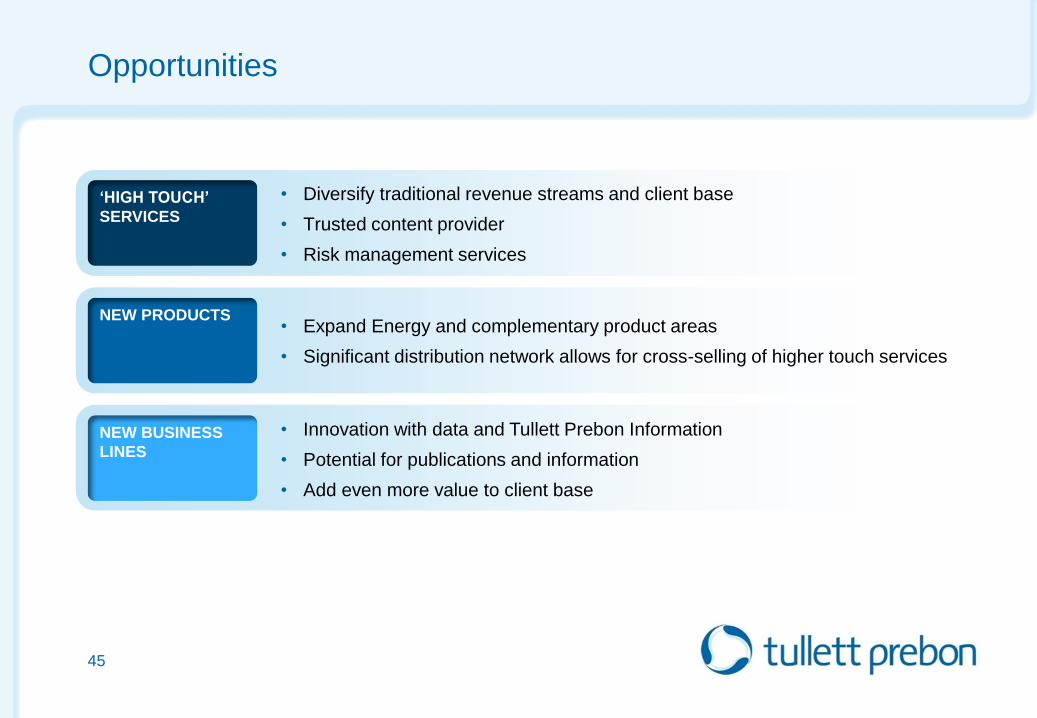
Opportunities
45
‘HIGH TOUCH’
SERVICES
NEW PRODUCTS
NEW BUSINESS
LINES
• Diversify traditional revenue streams and client base
• Trusted content provider
• Risk management services
• Expand Energy and complementary product areas
• Significant distribution network allows for cross-selling of higher touch services
• Innovation with data and Tullett Prebon Information
• Potential for publications and information
• Add even more value to client base
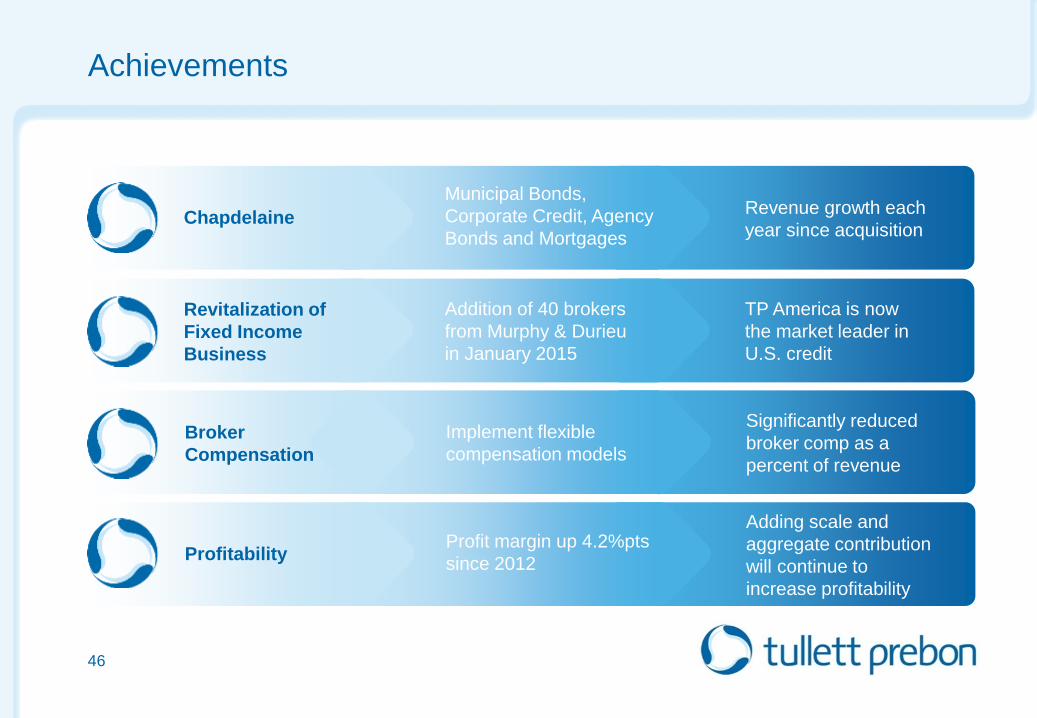
Achievements
46
Municipal Bonds,
Corporate Credit, Agency
Bonds and Mortgages
Revenue growth each
year since acquisition Chapdelaine
Addition of 40 brokers
from Murphy & Durieu
in January 2015
TP America is now
the market leader in
U.S. credit
Revitalization of
Fixed Income
Business
Profit margin up 4.2%pts
since 2012
Adding scale and
aggregate contribution
will continue to
increase profitability
Profitability
Implement flexible
compensation models
Significantly reduced
broker comp as a
percent of revenue
Broker
Compensation
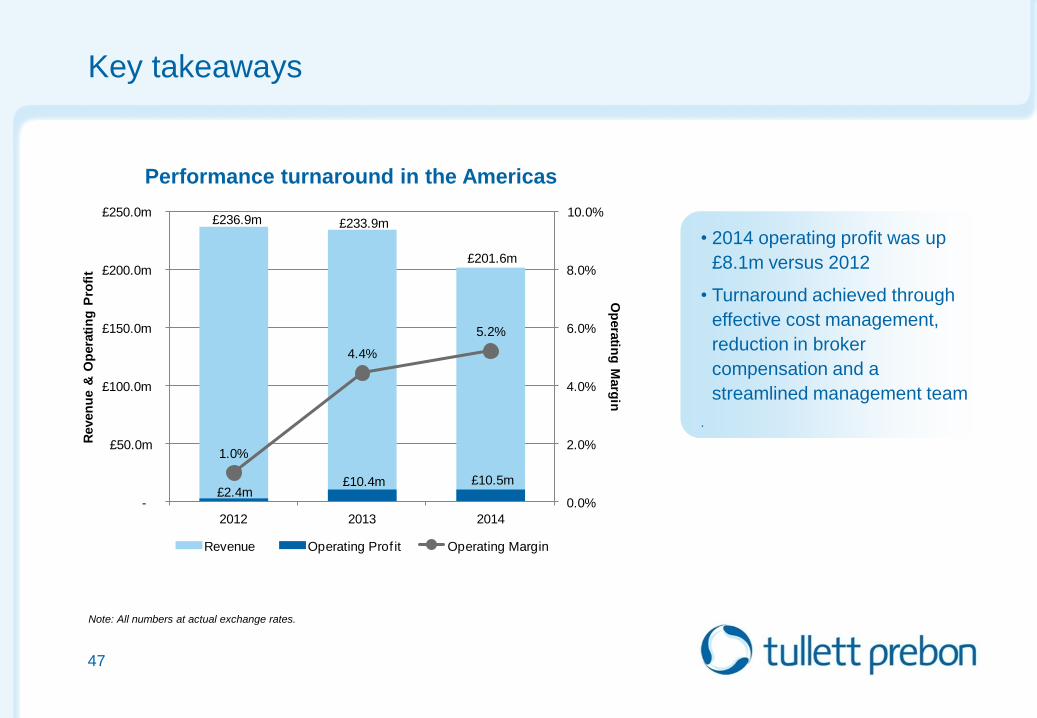
• 2014 operating profit was up
£8.1m versus 2012
• Turnaround achieved through
effective cost management,
reduction in broker
compensation and a
streamlined management team
.
£236.9m £233.9m
£201.6m
£2.4m £10.4m £10.5m
1.0%
4.4%
5.2%
0.0%
2.0%
4.0%
6.0%
8.0%
10.0%
-
£50.0m
£100.0m
£150.0m
£200.0m
£250.0m
2012 2013 2014
Op
era
ting
Marg
in
Reven
ue &
Op
era
tin
g P
rofi
t
Revenue Operating Prof it Operating Margin
Key takeaways
47
Performance turnaround in the Americas
Note: All numbers at actual exchange rates.

Tullett Prebon Asia Pacific
Capital Markets Day
12th June, 2015
London
Angus Wink
CEO, EMEA
Sydney
Tokyo
Seoul
Shanghai
Hong Kong
Singapore
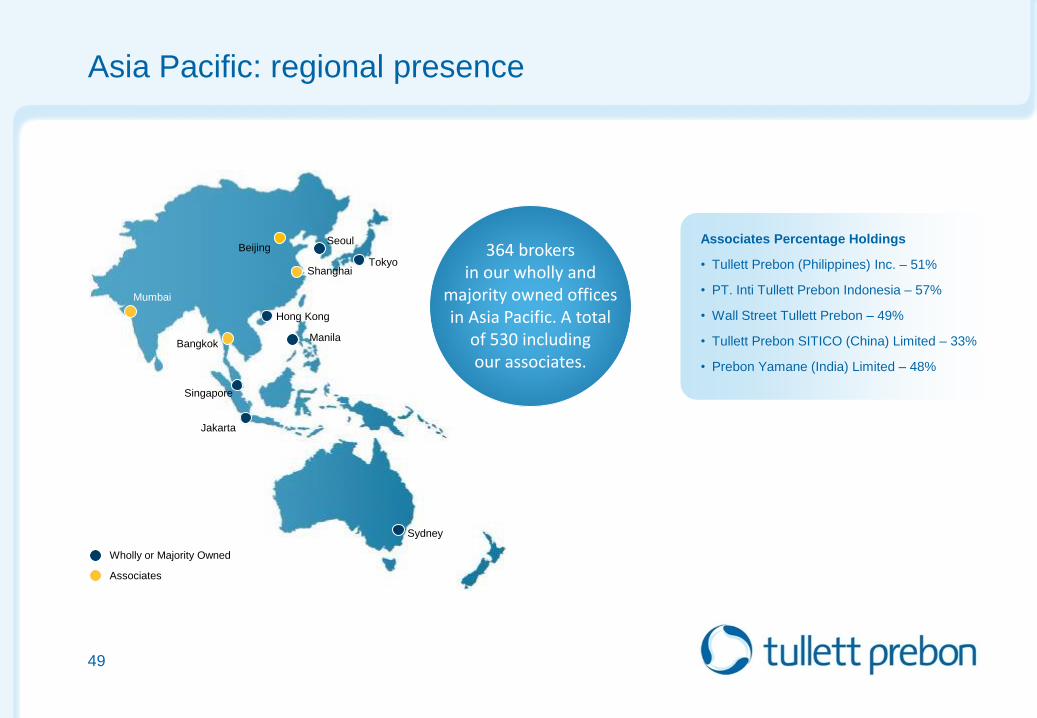
Asia Pacific: regional presence
49
Jakarta
Mumbai
Manila Bangkok
Wholly or Majority Owned
Associates
Beijing Associates Percentage Holdings
• Tullett Prebon (Philippines) Inc. – 51%
• PT. Inti Tullett Prebon Indonesia – 57%
• Wall Street Tullett Prebon – 49%
• Tullett Prebon SITICO (China) Limited – 33%
• Prebon Yamane (India) Limited – 48%
364 brokers in our wholly and
majority owned offices in Asia Pacific. A total
of 530 including our associates.
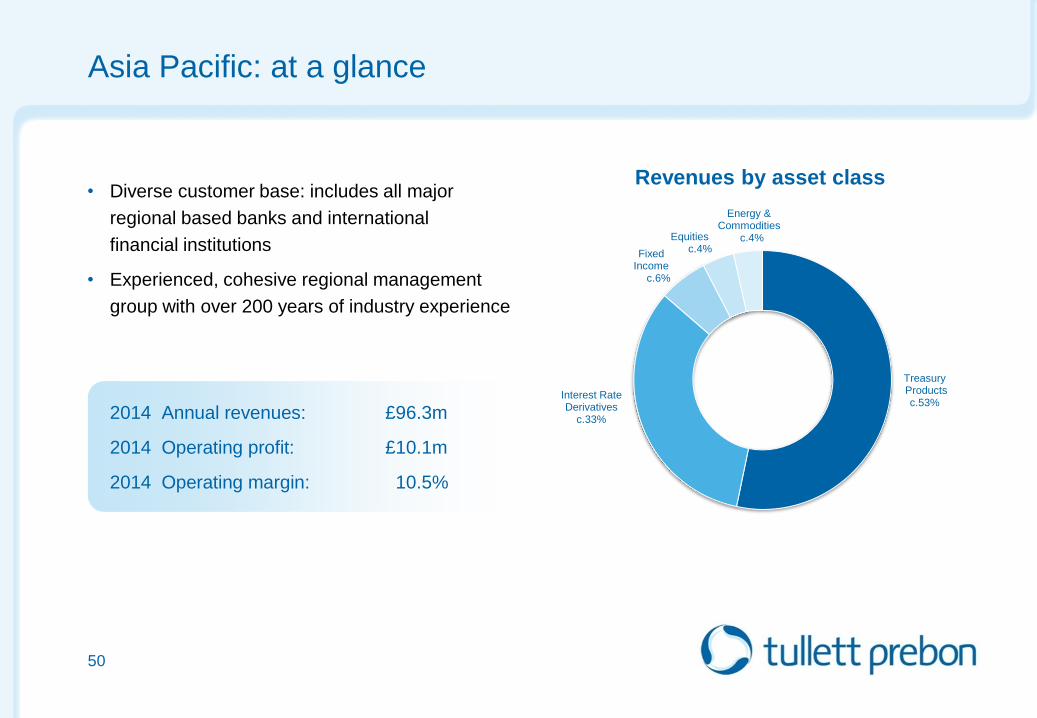
Asia Pacific: at a glance
• Diverse customer base: includes all major
regional based banks and international
financial institutions
• Experienced, cohesive regional management
group with over 200 years of industry experience
2014 Annual revenues: £96.3m
2014 Operating profit: £10.1m
2014 Operating margin: 10.5%
50
Revenues by asset class
Treasury Products
c.53% Interest Rate Derivatives
c.33%
Fixed Income c.6%
Equities c.4%
Energy & Commodities
c.4%
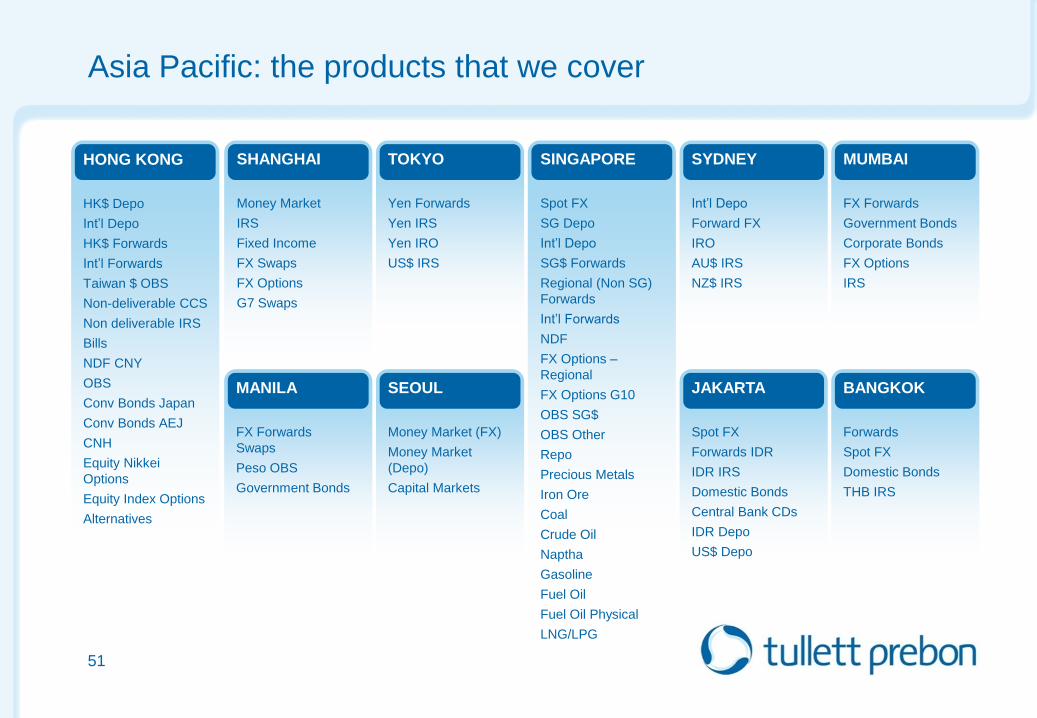
Asia Pacific: the products that we cover
51
HONG KONG
HK$ Depo
Int’l Depo
HK$ Forwards
Int’l Forwards
Taiwan $ OBS
Non-deliverable CCS
Non deliverable IRS
Bills
NDF CNY
OBS
Conv Bonds Japan
Conv Bonds AEJ
CNH
Equity Nikkei
Options
Equity Index Options
Alternatives
SHANGHAI
Money Market
IRS
Fixed Income
FX Swaps
FX Options
G7 Swaps
TOKYO
Yen Forwards
Yen IRS
Yen IRO
US$ IRS
SEOUL
Money Market (FX)
Money Market
(Depo)
Capital Markets
MANILA
FX Forwards
Swaps
Peso OBS
Government Bonds
SINGAPORE
Spot FX
SG Depo
Int’l Depo
SG$ Forwards
Regional (Non SG)
Forwards
Int’l Forwards
NDF
FX Options –
Regional
FX Options G10
OBS SG$
OBS Other
Repo
Precious Metals
Iron Ore
Coal
Crude Oil
Naptha
Gasoline
Fuel Oil
Fuel Oil Physical
LNG/LPG
SYDNEY
Int’l Depo
Forward FX
IRO
AU$ IRS
NZ$ IRS
JAKARTA
Spot FX
Forwards IDR
IDR IRS
Domestic Bonds
Central Bank CDs
IDR Depo
US$ Depo
MUMBAI
FX Forwards
Government Bonds
Corporate Bonds
FX Options
IRS
BANGKOK
Forwards
Spot FX
Domestic Bonds
THB IRS
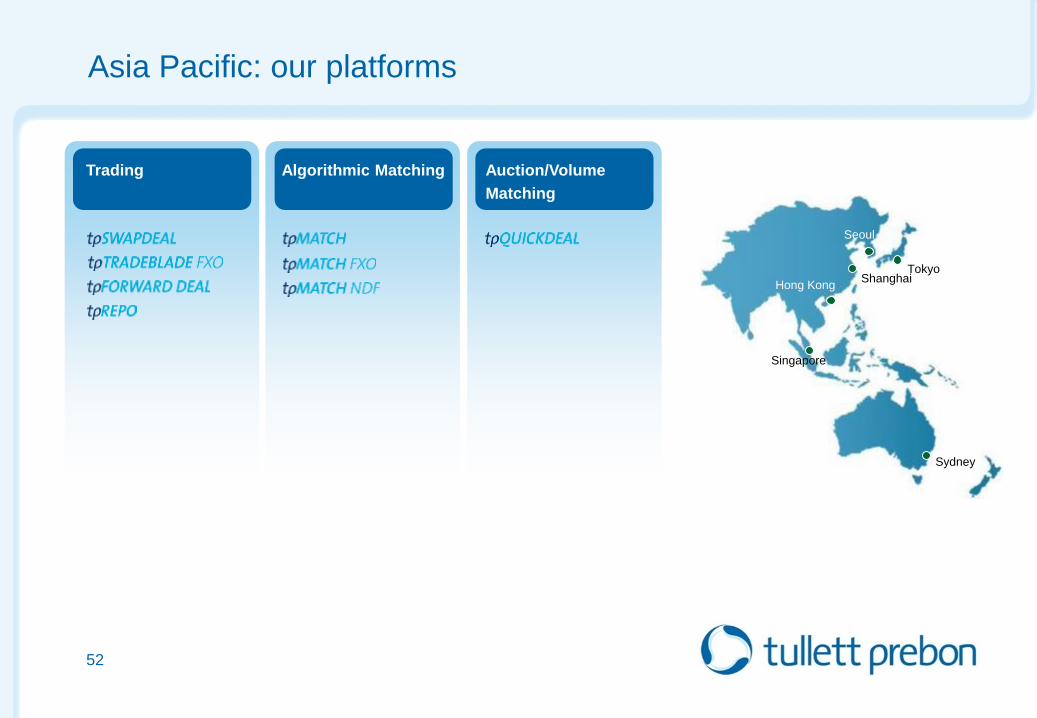
Auction/Volume
Matching
Algorithmic Matching Trading
Asia Pacific: our platforms
52
Sydney
Tokyo
Seoul
Shanghai Hong Kong
Singapore
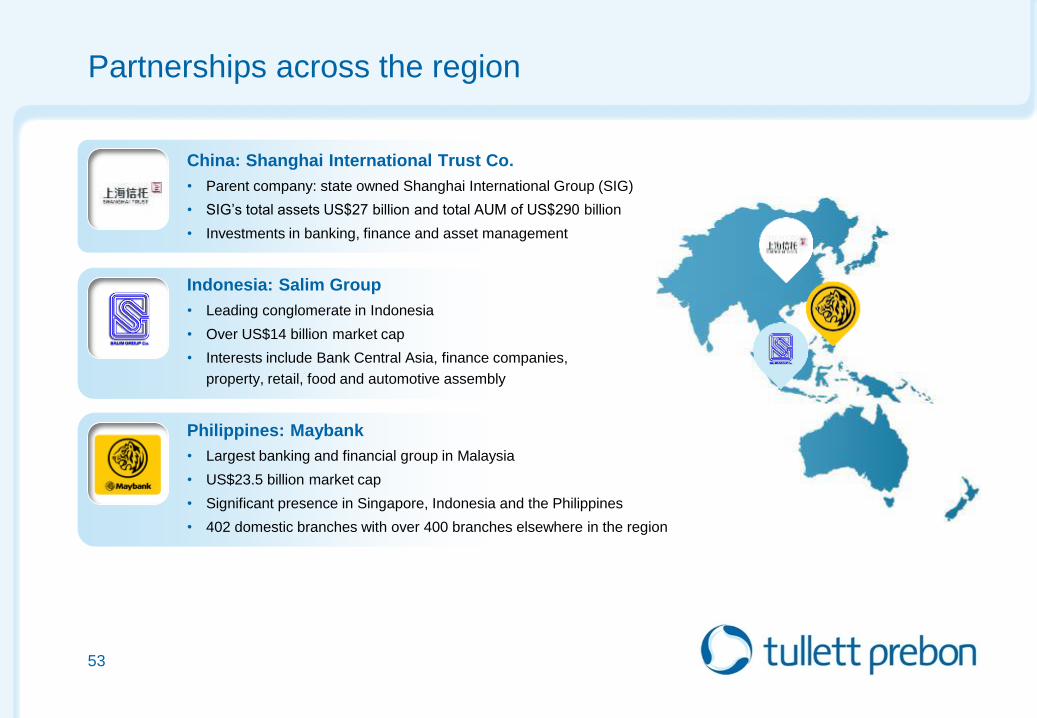
Partnerships across the region
China: Shanghai International Trust Co.
• Parent company: state owned Shanghai International Group (SIG)
• SIG’s total assets US$27 billion and total AUM of US$290 billion
• Investments in banking, finance and asset management
Indonesia: Salim Group
• Leading conglomerate in Indonesia
• Over US$14 billion market cap
• Interests include Bank Central Asia, finance companies,
property, retail, food and automotive assembly
Philippines: Maybank
• Largest banking and financial group in Malaysia
• US$23.5 billion market cap
• Significant presence in Singapore, Indonesia and the Philippines
• 402 domestic branches with over 400 branches elsewhere in the region
53

Opportunities
China and Hong Kong Asia FX and Rates
• Continued growth in the use of off-shore renminbi,
not only in trade but also financing
• Our strong position in CNH will enable the Group
to seize opportunities as they arise
Commodities
• Exploring opportunities to build
our presence
• Singapore’s Energy and Commodities
has scope to grow
54

Tullett Prebon Asia Pacific: awards
55
Asia Risk Rankings 2014 Individual Categories Interest Rate Products
#1 Interest Rate Products – USD (Asia Time Zone)
#1 Interest Rate Products – EUR (Asia Time Zone)
#1 Interest Rate Products – RMB (Chinese Renminbi)
#1 Interest Rate Products – HKD (Hong Kong $)
#1 Interest Rate Products – IDR (Indian Rupee)
#1 Interest Rate Products – SGD (Singapore $)
Key takeaways
• Tullett Prebon’s strong regional footprint is a competitive advantage:
– Well balanced presence in the region
– Experienced management team
• Asian commodity and energy markets offer growth prospects
• Tullett Prebon is well placed to benefit from China-related growth
– Established and growing presence in China
• A strong brand and powerful heritage
56

Coffee Break
Tullett Prebon Energy
Capital Markets Day
12th June, 2015
London
Andrew Polydor
Global Head of Energy and Commodities
Energy: at a glance
59
OIL GAS POWER RENEWABLES
BASE METALS PRECIOUS METALS SOFT COMMODITIES FERROUS METALS COAL
169
Full year
including PVM
0
100
200
1 2 3 4 5 6 7 8
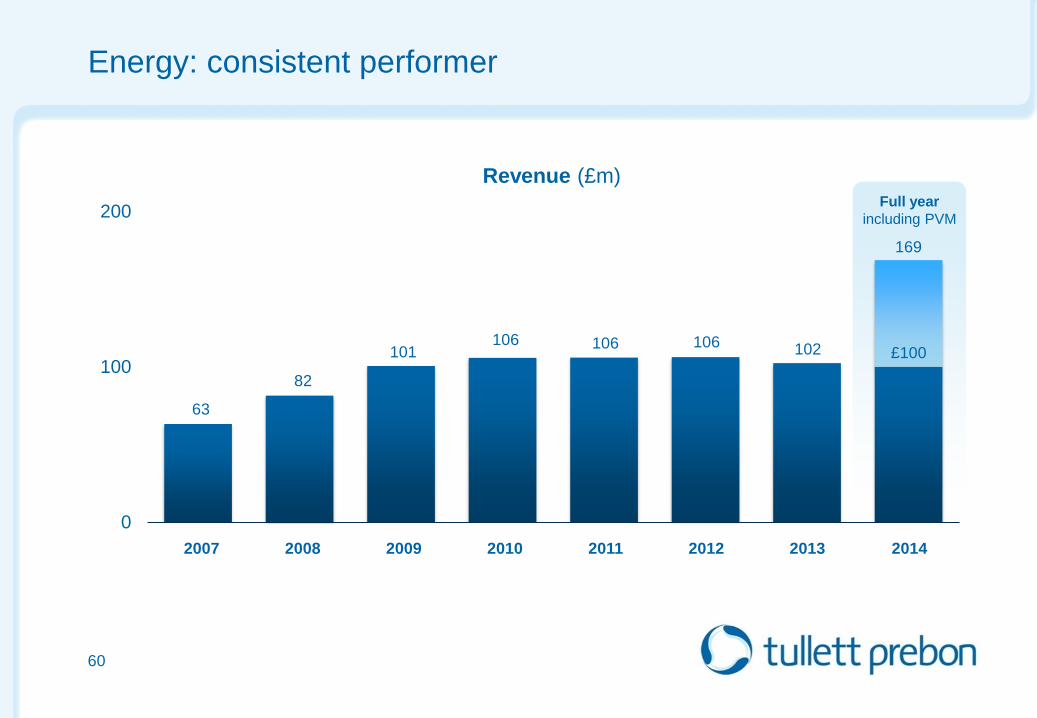
Energy: consistent performer
60
63
2008
106
102
Revenue (£m)
106 106
£100
2007 2010 2009 2012 2011 2013 2014
101
82

PVM
61
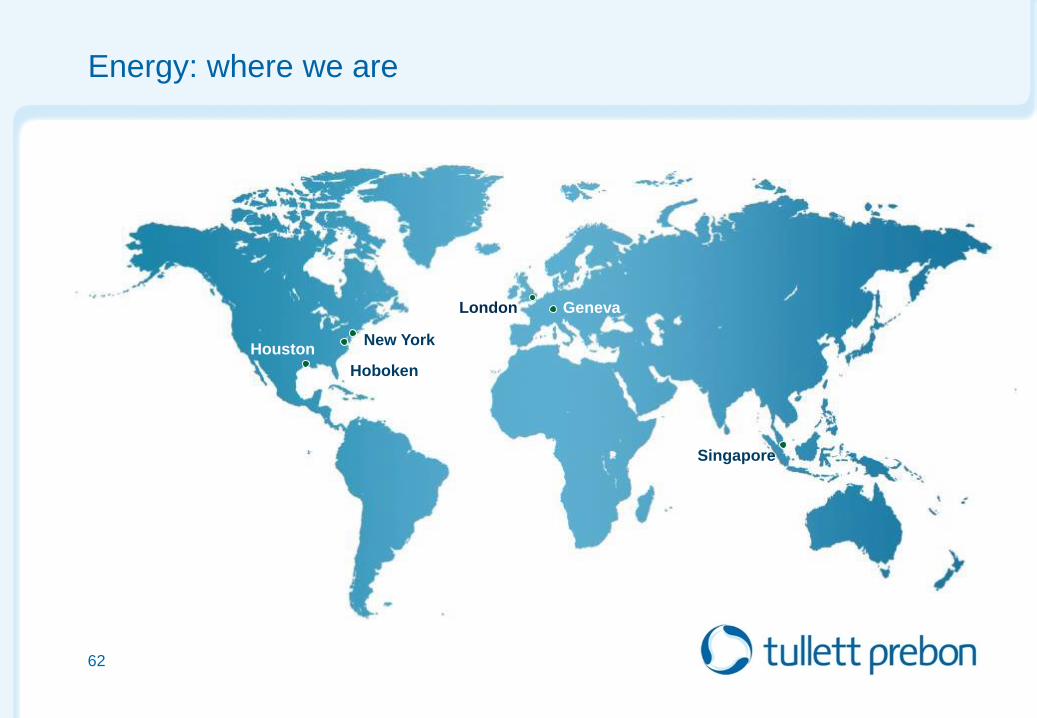
Energy: where we are
62
Houston New York
Singapore
Hoboken
London Geneva
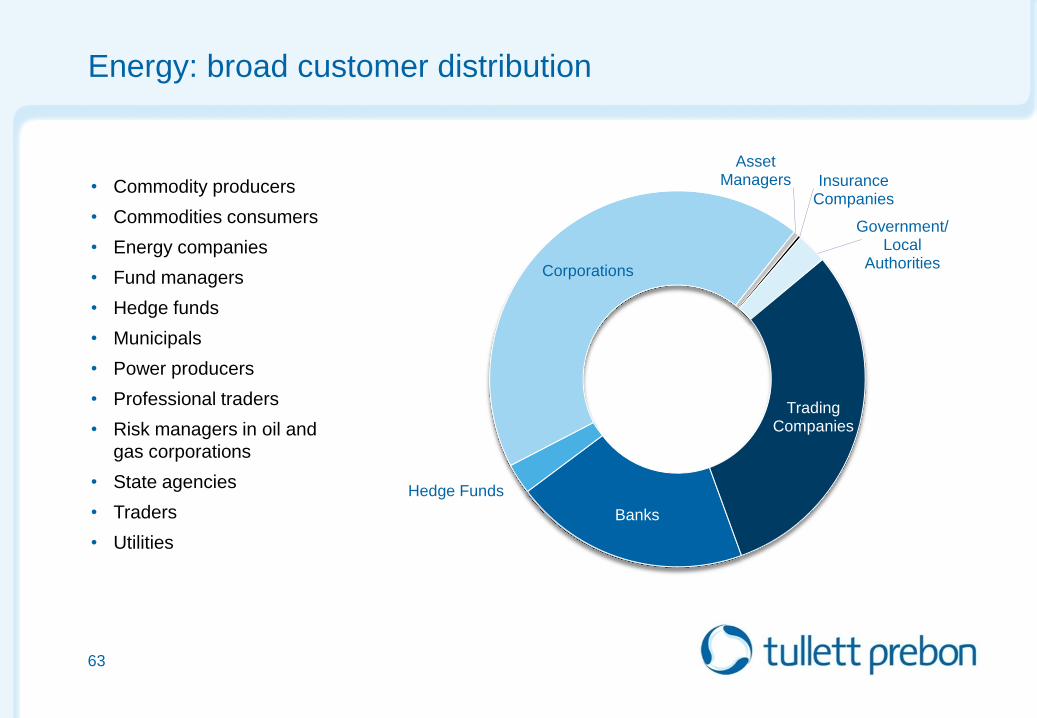
Energy: broad customer distribution
Banks
Hedge Funds
Corporations
Asset Managers Insurance
Companies
Government/ Local
Authorities
Trading Companies
• Commodity producers
• Commodities consumers
• Energy companies
• Fund managers
• Hedge funds
• Municipals
• Power producers
• Professional traders
• Risk managers in oil and
gas corporations
• State agencies
• Traders
• Utilities
63
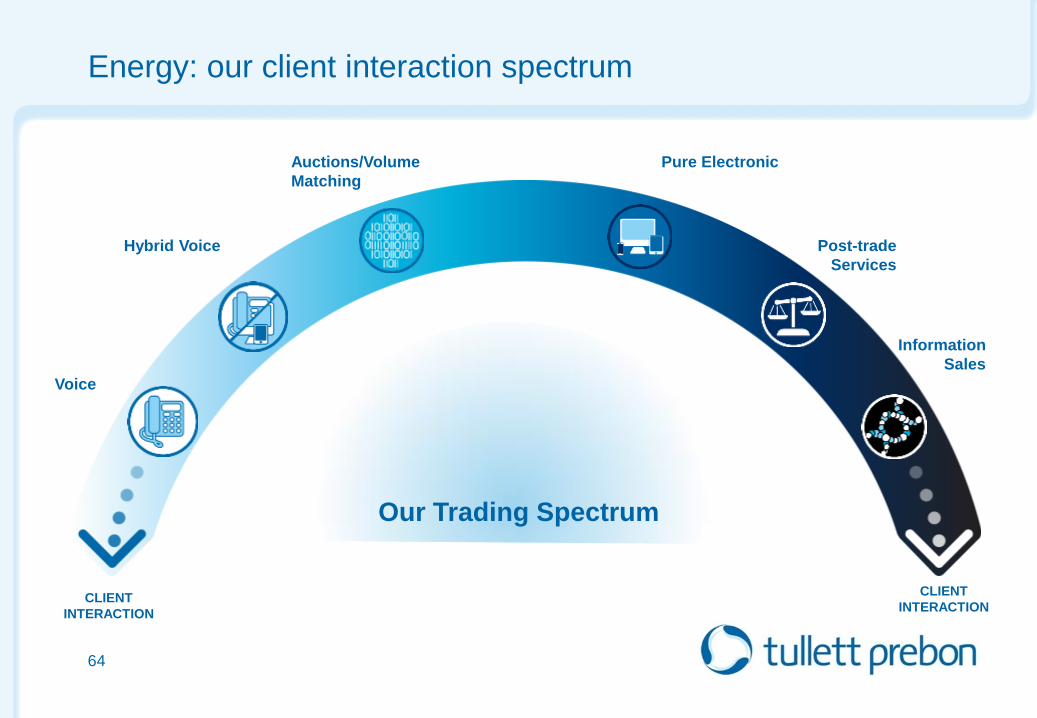
Energy: our client interaction spectrum
64
Our Trading Spectrum
Voice
Hybrid Voice
Auctions/Volume
Matching
Pure Electronic
Post-trade
Services
Information
Sales
CLIENT
INTERACTION
CLIENT
INTERACTION

Physical oil products require the human touch
• We broke physical oil and that market is exotic in nature
• Each trade is specifically structured
• Each cargo has a specific chemical composition
• Many specifications to be agreed before a trade reaches conclusion
• These are bespoke trades that require broker skill and depth and breadth of knowledge
65
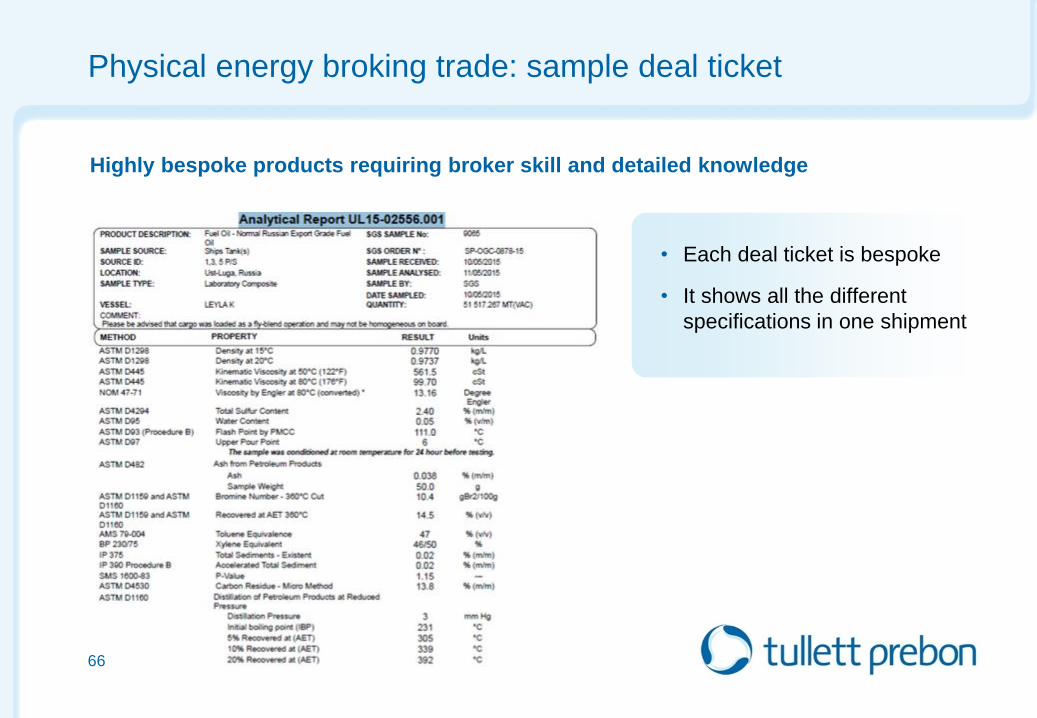
Physical energy broking trade: sample deal ticket
• Each deal ticket is bespoke
• It shows all the different
specifications in one shipment
66
Highly bespoke products requiring broker skill and detailed knowledge
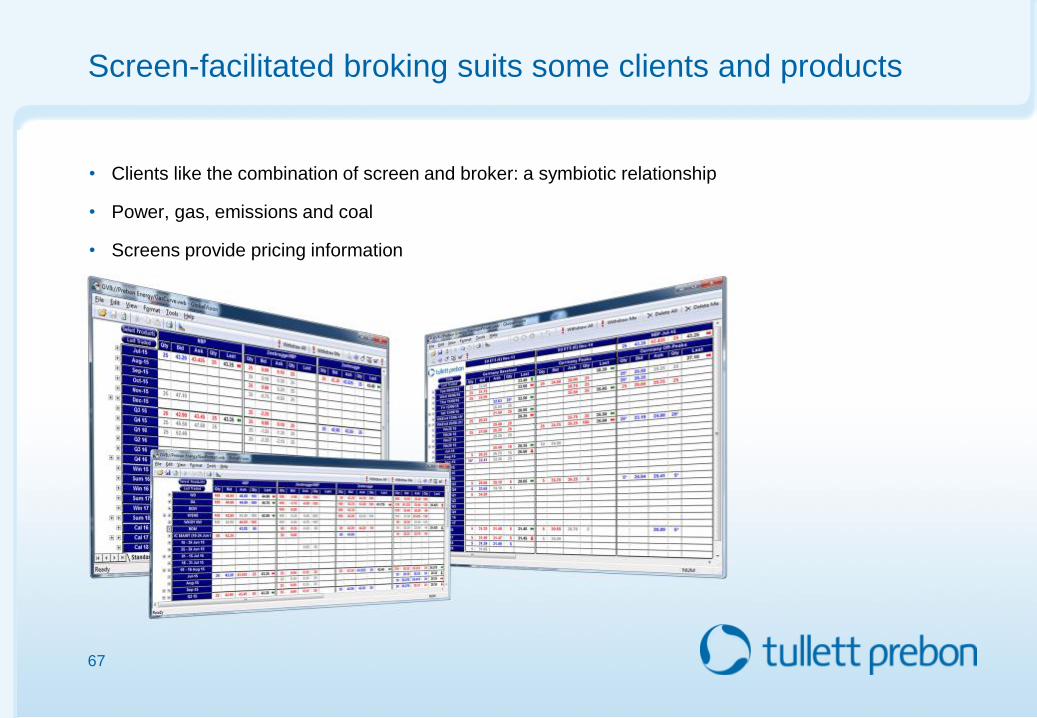
Screen-facilitated broking suits some clients and products
• Clients like the combination of screen and broker: a symbiotic relationship
• Power, gas, emissions and coal
• Screens provide pricing information
67
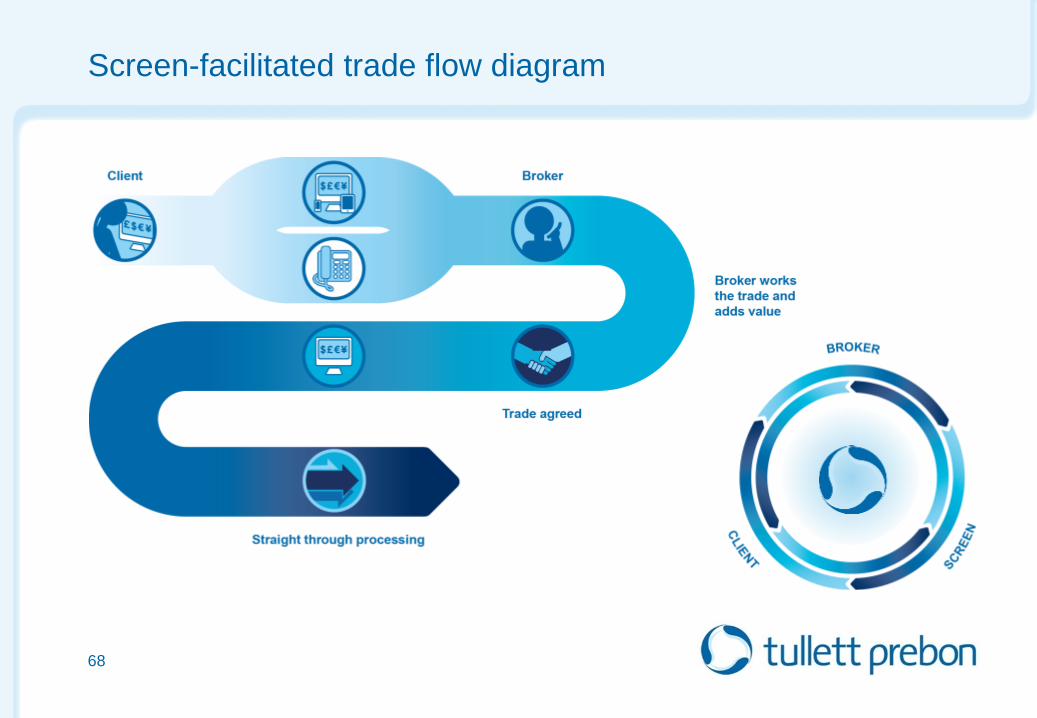
Screen-facilitated trade flow diagram
68
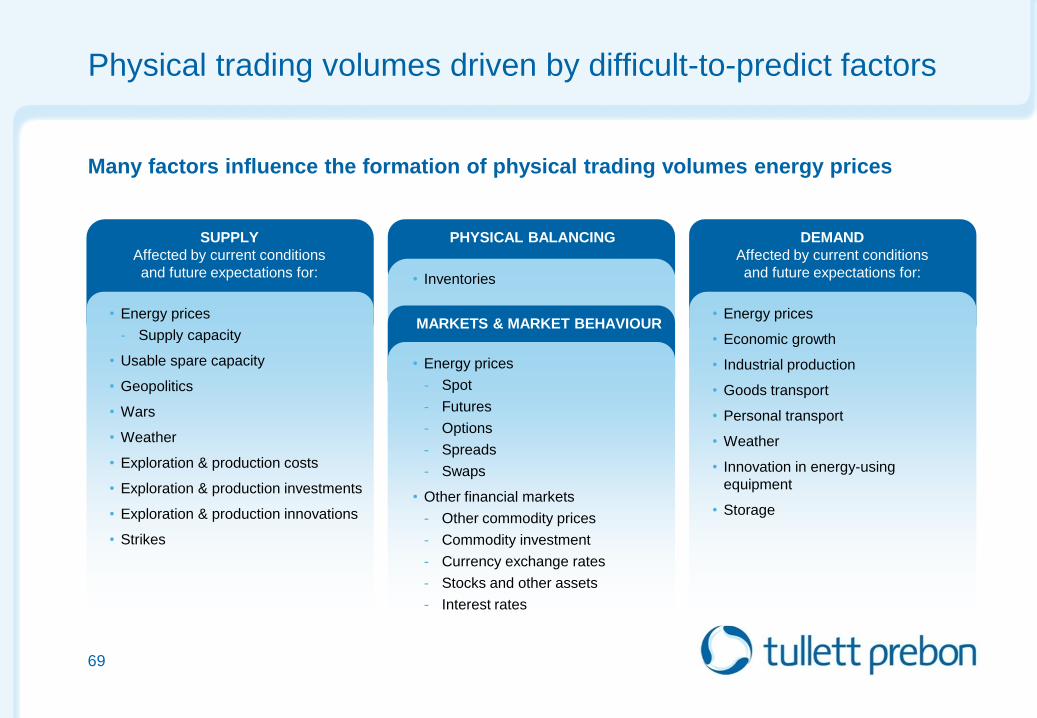
Physical trading volumes driven by difficult-to-predict factors
Many factors influence the formation of physical trading volumes energy prices
69
SUPPLY
Affected by current conditions
and future expectations for:
• Energy prices
- Supply capacity
• Usable spare capacity
• Geopolitics
• Wars
• Weather
• Exploration & production costs
• Exploration & production investments
• Exploration & production innovations
• Strikes
DEMAND
Affected by current conditions
and future expectations for:
• Energy prices
• Economic growth
• Industrial production
• Goods transport
• Personal transport
• Weather
• Innovation in energy-using
equipment
• Storage
PHYSICAL BALANCING
MARKETS & MARKET BEHAVIOUR
• Inventories
• Energy prices
- Spot
- Futures
- Options
- Spreads
- Swaps
• Other financial markets
- Other commodity prices
- Commodity investment
- Currency exchange rates
- Stocks and other assets
- Interest rates

Energy sector trends
• Deregulation of retail energy markets in the US
• Longer term, deregulation of energy in some parts of the Asia
• Demand in fast growing economies in Asia could drive growth in physical
and derivative energy products
• Regulation of energy derivative products in some areas, such as
post trade reporting, is likely to be introduced
in the US and Europe
70
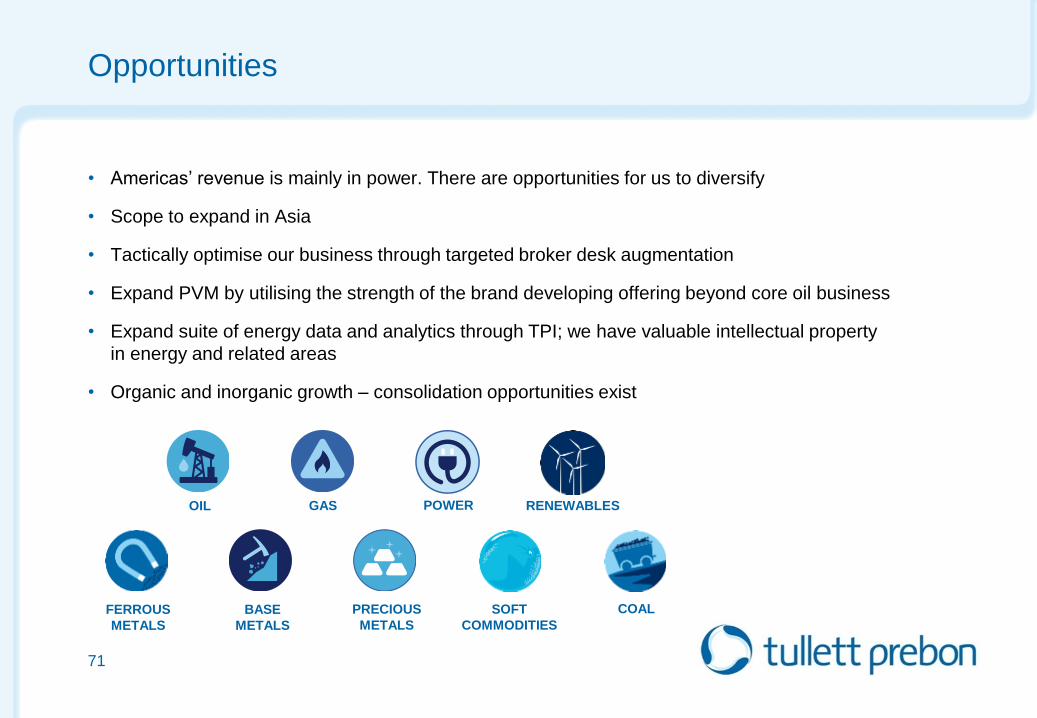
Opportunities
• Americas’ revenue is mainly in power. There are opportunities for us to diversify
• Scope to expand in Asia
• Tactically optimise our business through targeted broker desk augmentation
• Expand PVM by utilising the strength of the brand developing offering beyond core oil business
• Expand suite of energy data and analytics through TPI; we have valuable intellectual property
in energy and related areas
• Organic and inorganic growth – consolidation opportunities exist
71
OIL GAS POWER RENEWABLES
BASE
METALS
PRECIOUS
METALS
SOFT
COMMODITIES
FERROUS
METALS
COAL
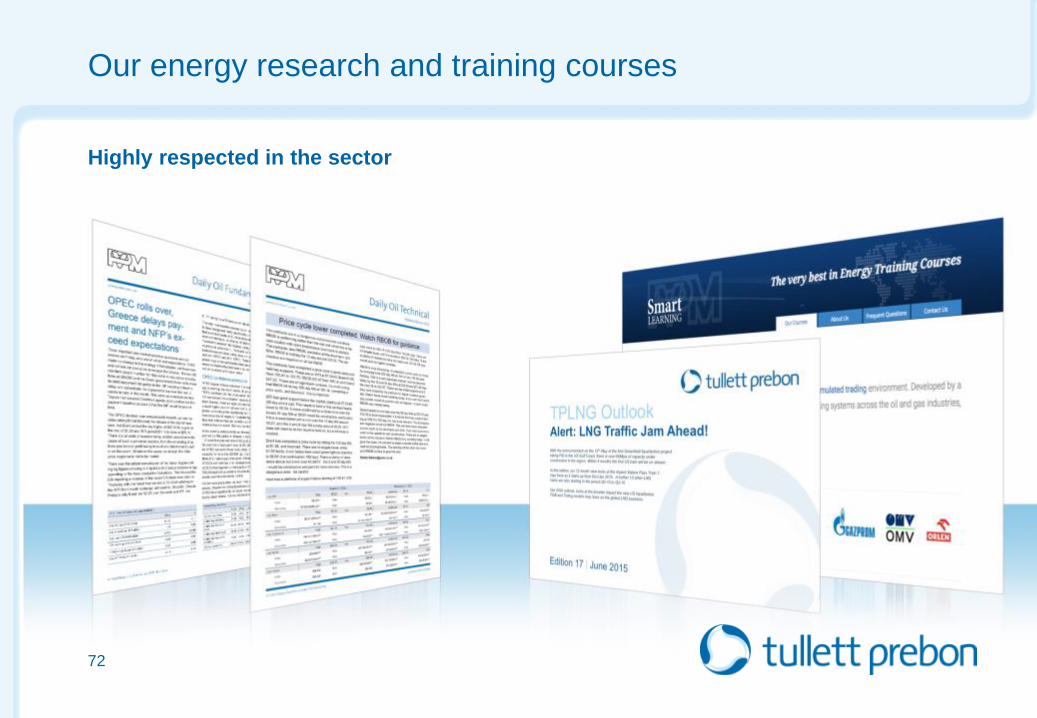
Our energy research and training courses
Highly respected in the sector
72
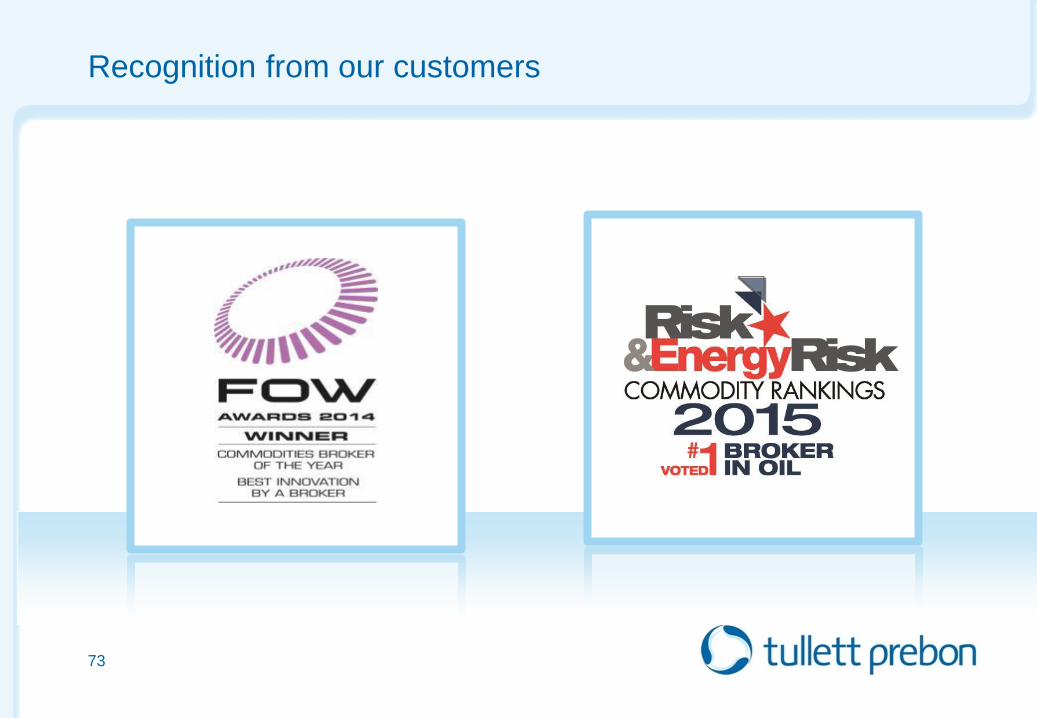
Recognition from our customers
73
Key takeaways
74
• Energy & Commodities is an increasingly important part of the business
• We have the relevant skill sets
• Part of our client diversification strategy
• With PVM, we have shown that we can acquire well, in line with our overall strategy
• Global growth sector
• Opportunity to build a global franchise
Tullett Prebon Information
Capital Markets Day
12th June, 2015
Frank Desmond
CEO, Tullett Prebon Information

Introduction to Tullett Prebon Information
76
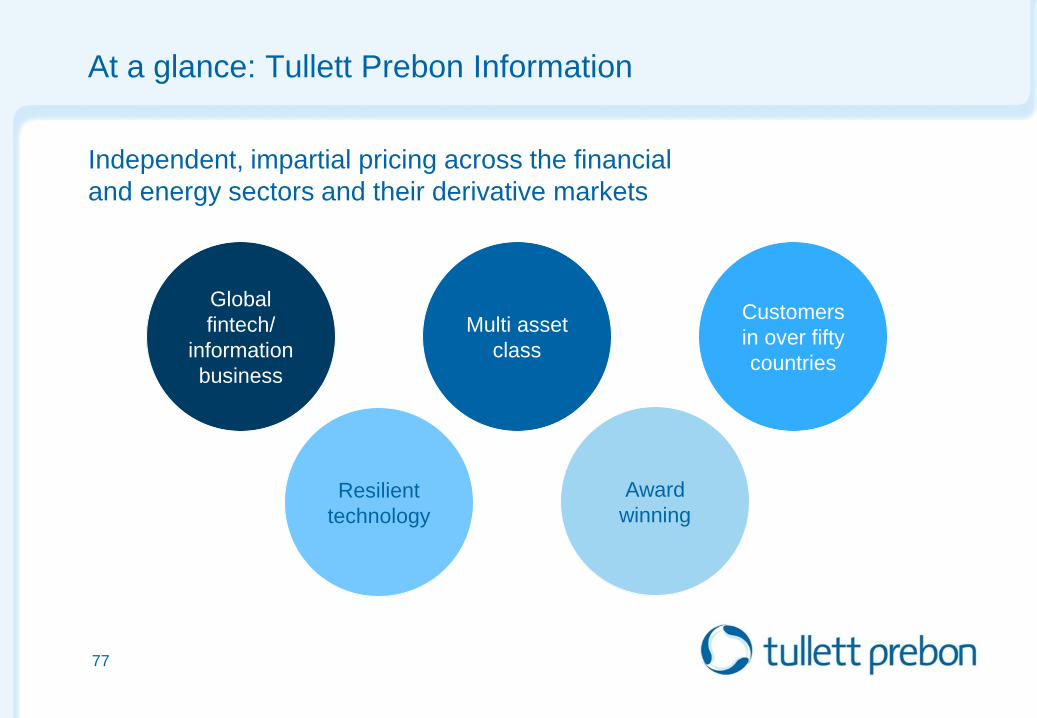
At a glance: Tullett Prebon Information
Independent, impartial pricing across the financial
and energy sectors and their derivative markets
Global
fintech/
information
business
Multi asset
class
Customers
in over fifty
countries
Resilient
technology
Award
winning
77
0
10
20
30
40
50
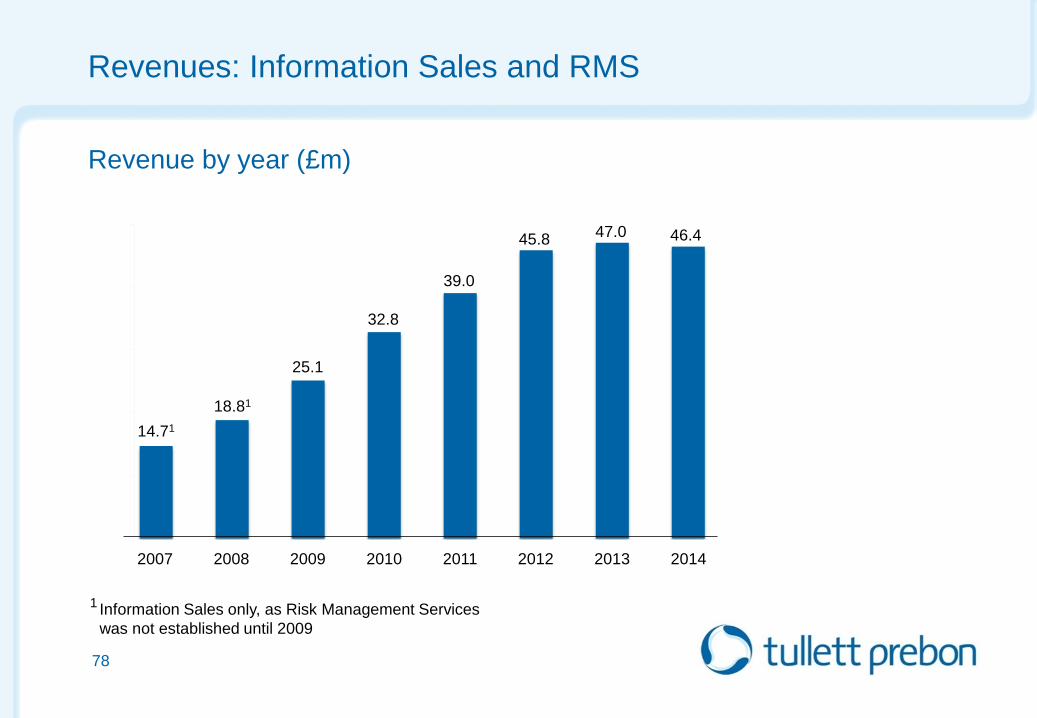
Revenues: Information Sales and RMS
78
2014 2013 2012 2011 2010 2009 2008 2007
46.4 45.8
39.0
32.8
25.1
18.81
14.71
Revenue by year (£m)
Information Sales only, as Risk Management Services
was not established until 2009
1
47.0
Tullett Prebon Information: Best Data Provider at Inside Market Data Awards for fifth year running
Awards
79
Market ecosystem and segments 2013
80
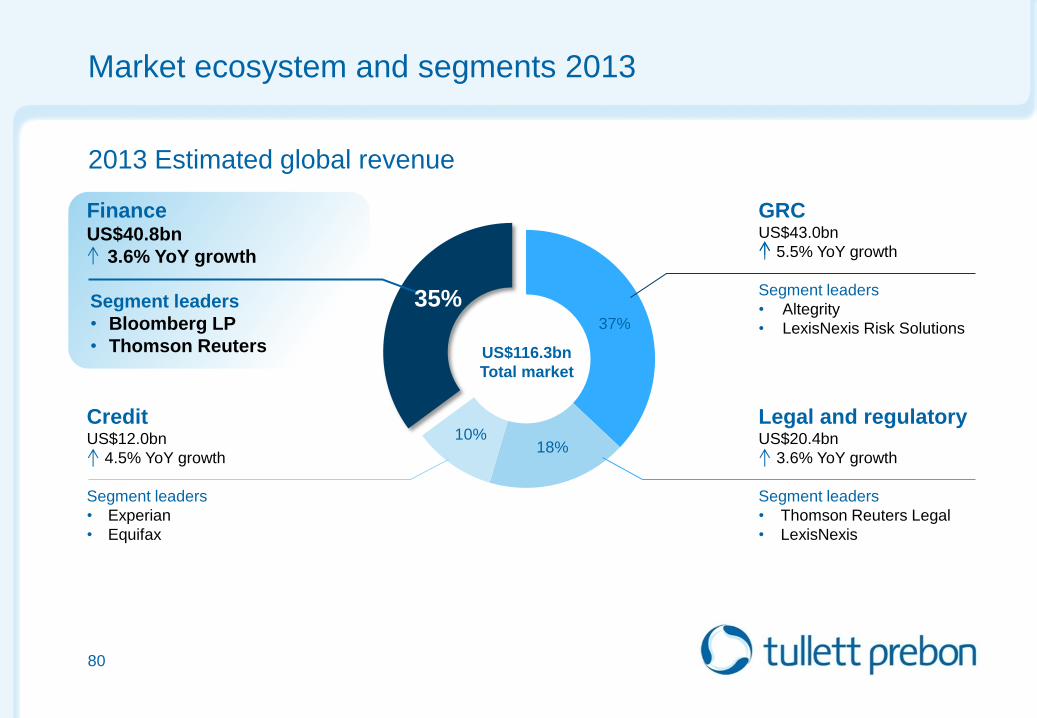
2013 Estimated global revenue
Finance US$40.8bn
3.6% YoY growth
Segment leaders
• Bloomberg LP
• Thomson Reuters
Credit US$12.0bn
4.5% YoY growth
Segment leaders
• Experian
• Equifax
GRC US$43.0bn
5.5% YoY growth
Segment leaders
• Altegrity
• LexisNexis Risk Solutions
Legal and regulatory US$20.4bn
3.6% YoY growth
Segment leaders
• Thomson Reuters Legal
• LexisNexis
US$116.3bn
Total market
35%
10% 18%
37%
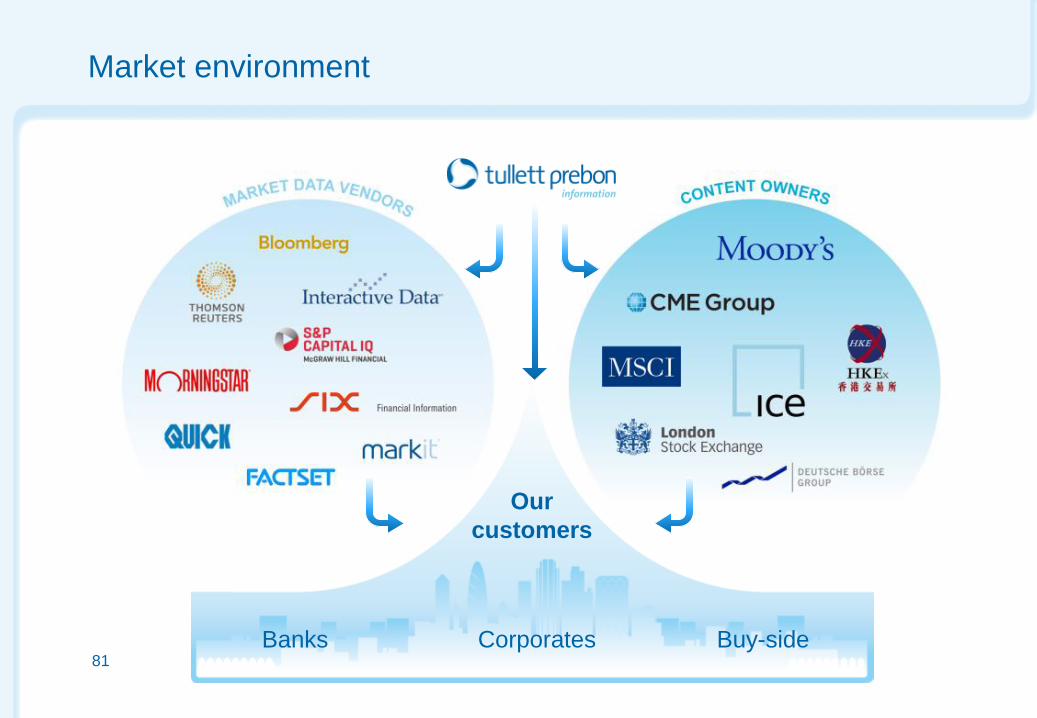
Market environment
81
Our
customers
Banks Corporates Buy-side
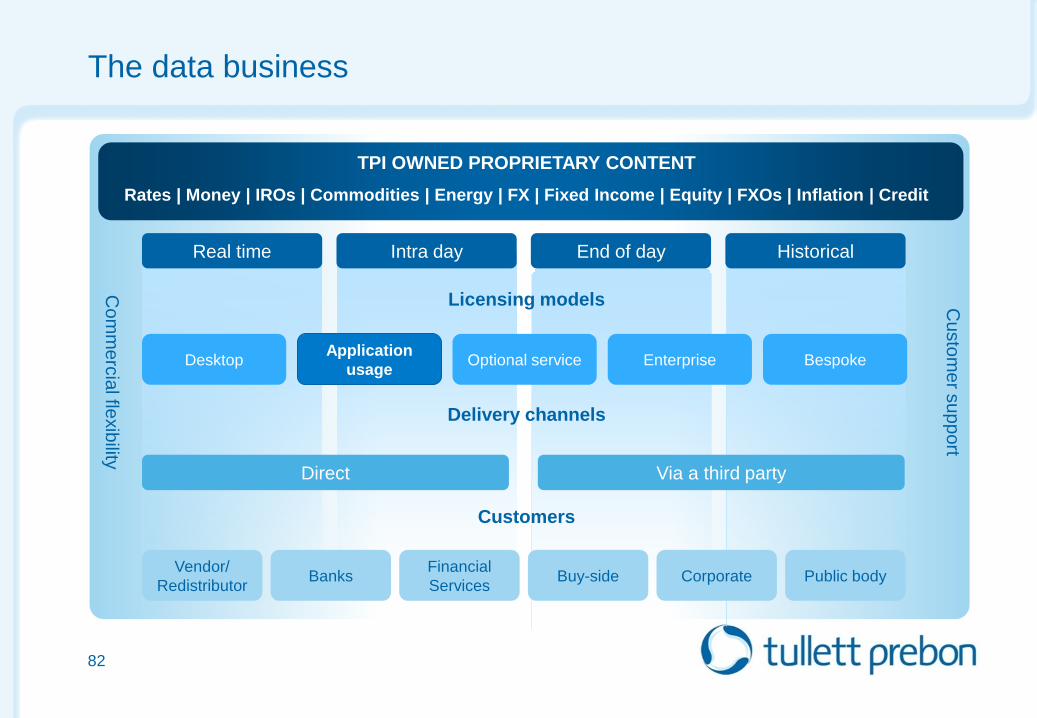
The data business
82
TPI OWNED PROPRIETARY CONTENT
Rates | Money | IROs | Commodities | Energy | FX | Fixed Income | Equity | FXOs | Inflation | Credit
Real time Intra day End of day Historical
Licensing models
Desktop Application
usage Optional service Enterprise Bespoke
Direct Via a third party
Delivery channels
Customers
Vendor/
Redistributor Banks
Financial
Services Buy-side Corporate Public body
Co
mm
erc
ial fle
xib
ility
Cu
sto
me
r su
pp
ort
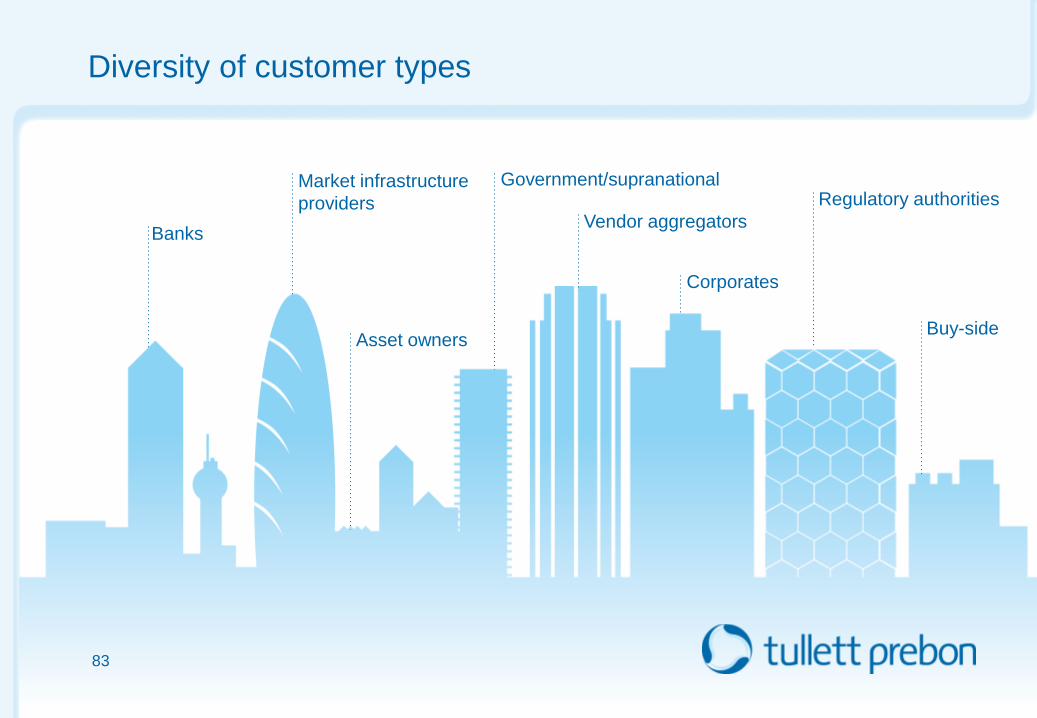
Diversity of customer types
Banks
Buy-side
Vendor aggregators
Market infrastructure
providers
Government/supranational
Asset owners
Corporates
Regulatory authorities
83
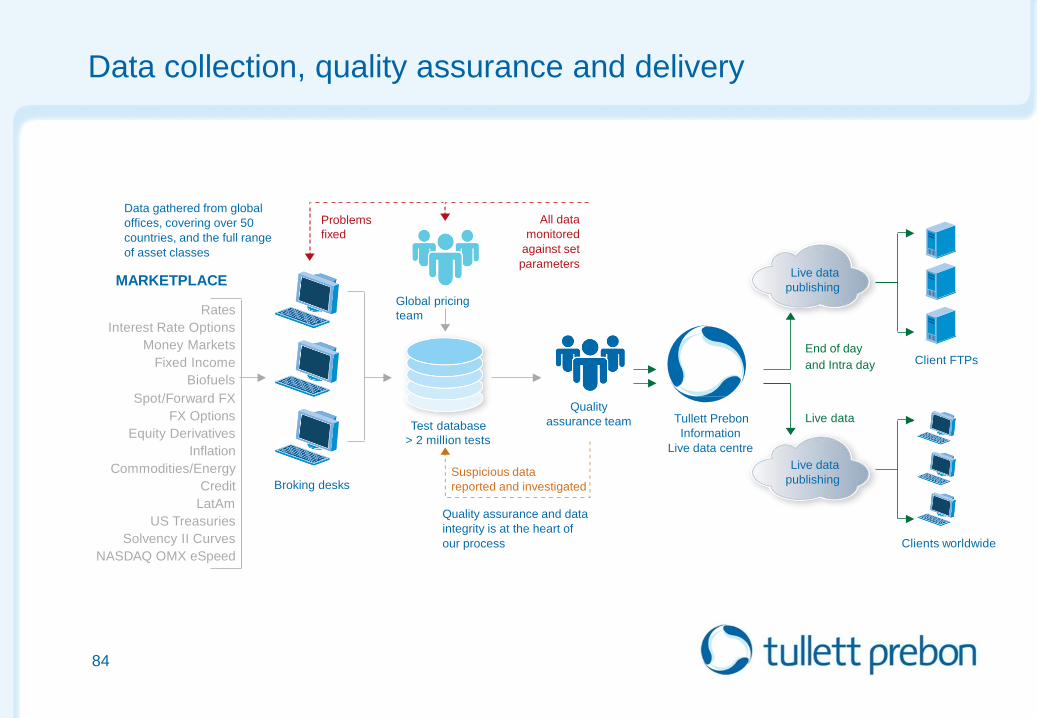
Data collection, quality assurance and delivery
Rates
Interest Rate Options
Money Markets
Spot/Forward FX
Fixed Income
Equity Derivatives
Biofuels
Commodities/Energy
FX Options
Inflation
Credit
LatAm
Solvency II Curves
NASDAQ OMX eSpeed
US Treasuries
MARKETPLACE
Broking desks
Test database
> 2 million tests
Client FTPs
Quality assurance and data
integrity is at the heart of
our process
Live data
End of day
and Intra day
Data gathered from global
offices, covering over 50
countries, and the full range
of asset classes
Global pricing
team
Live data
publishing
Live data
publishing
Clients worldwide
Quality
assurance team
Suspicious data
reported and investigated
All data
monitored
against set
parameters
Problems
fixed
84
Tullett Prebon
Information
Live data centre
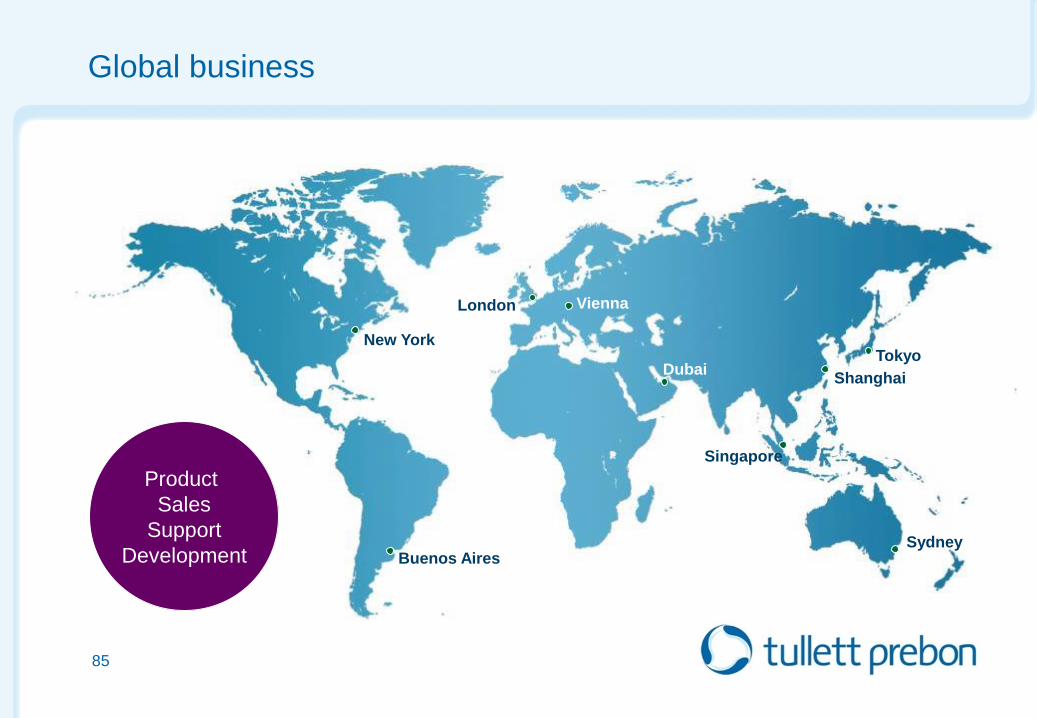
Global business
London
New York
Buenos Aires
Singapore
Tokyo
Shanghai Dubai
Product
Sales
Support
Development
85
Vienna
Sydney
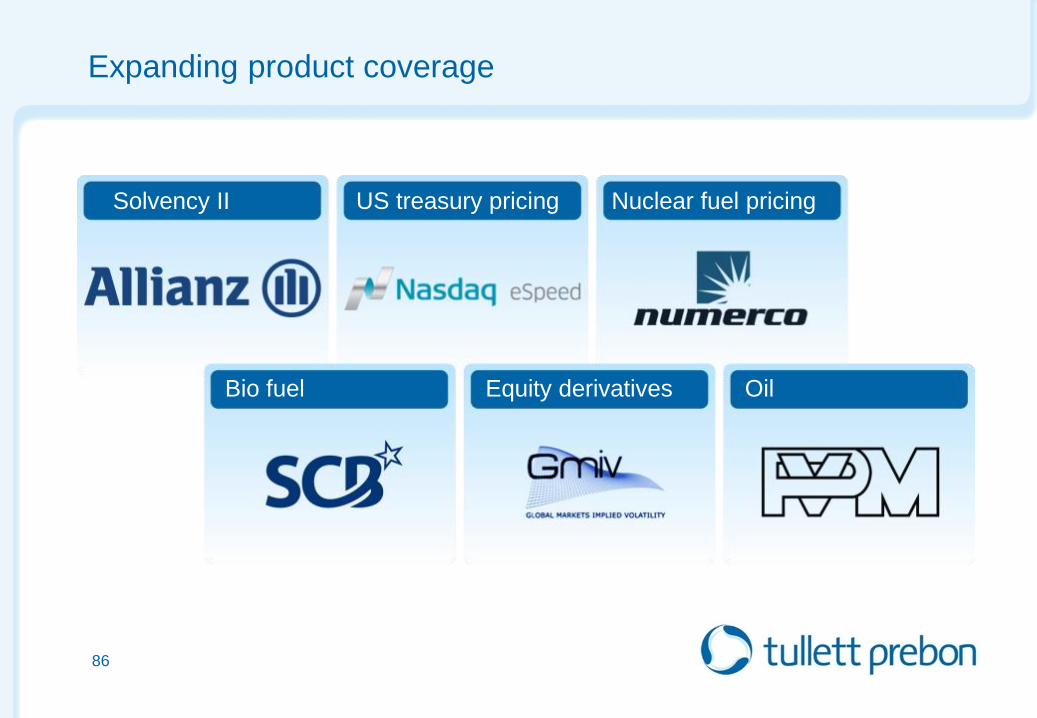
Expanding product coverage
86
Solvency II US treasury pricing Nuclear fuel pricing
Bio fuel Equity derivatives Oil
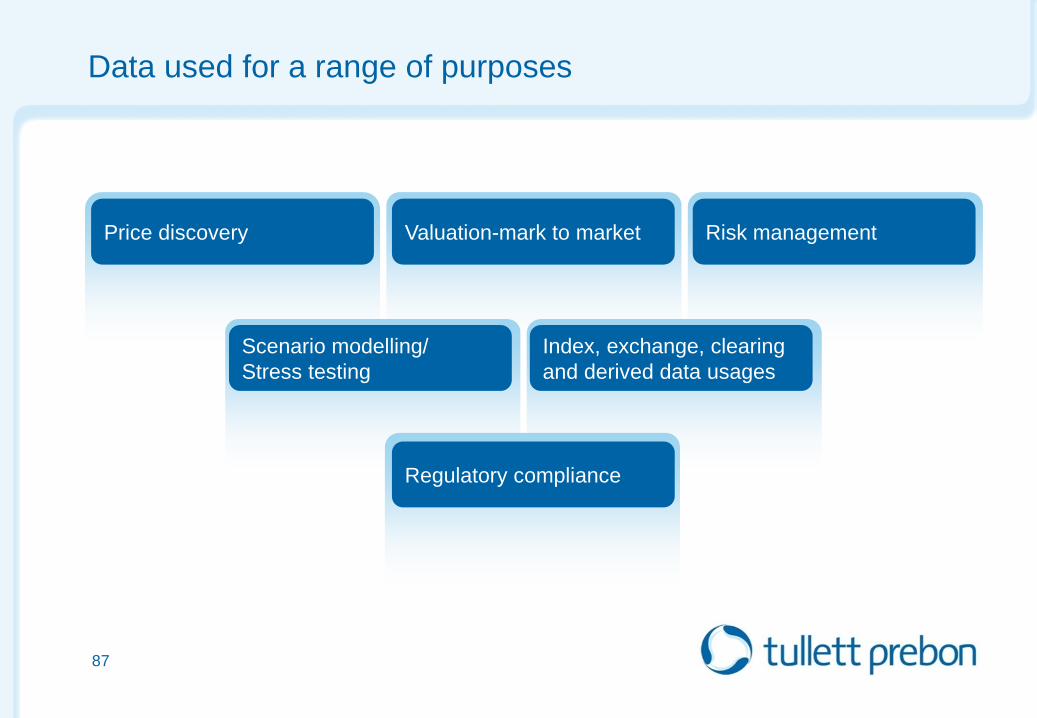
Data used for a range of purposes
87
Price discovery Valuation-mark to market Risk management
Scenario modelling/
Stress testing
Index, exchange, clearing
and derived data usages
Regulatory compliance
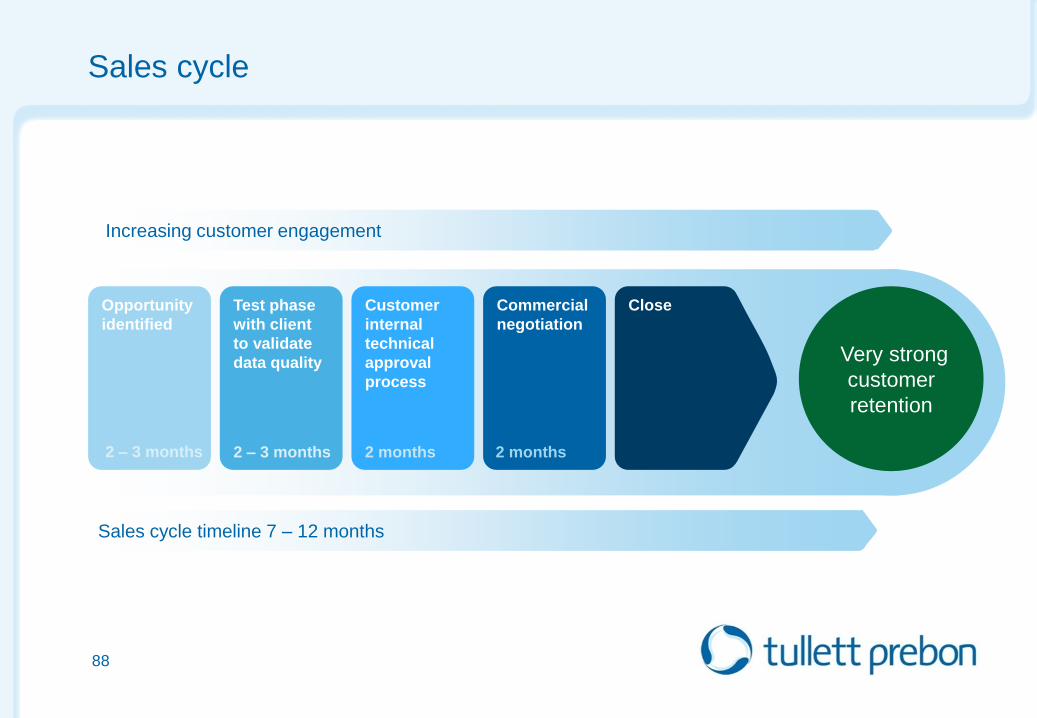
Sales cycle
Timeline 7-12 Months
Very strong
customer
retention
Close Commercial
negotiation
Customer
internal
technical
approval
process
Test phase
with client
to validate
data quality
Opportunity
identified
Sales cycle timeline 7 – 12 months
2 – 3 months 2 months 2 months
88
Increasing customer engagement
2 – 3 months
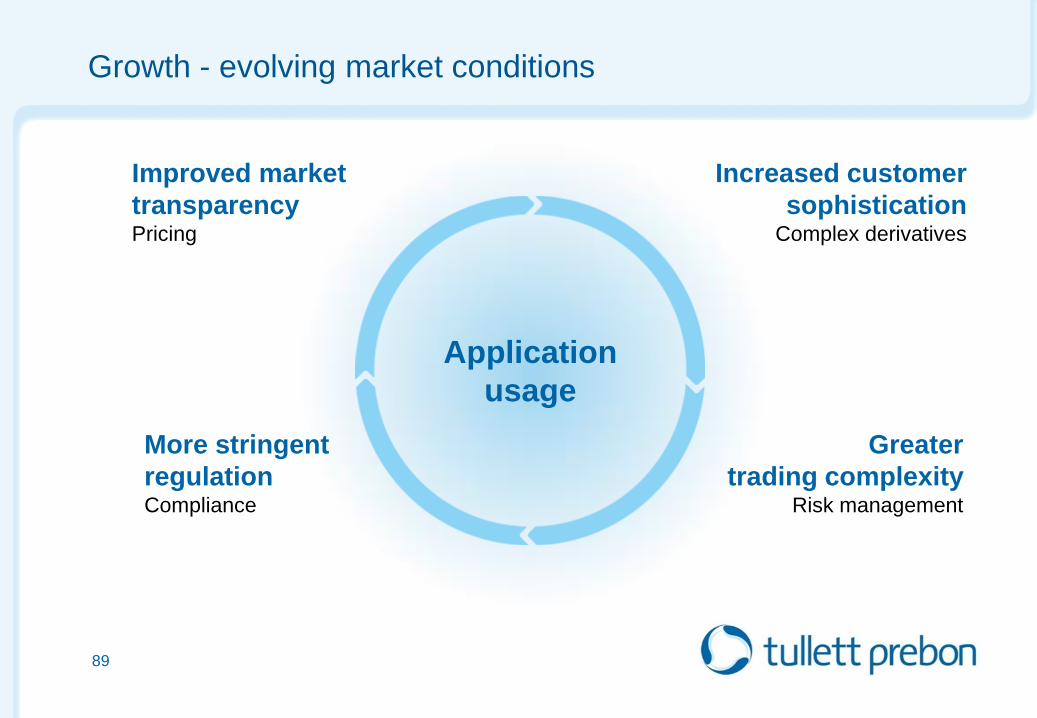
Growth - evolving market conditions
Application
usage
Improved market
transparency Pricing
Increased customer
sophistication Complex derivatives
More stringent
regulation Compliance
Greater
trading complexity Risk management
89
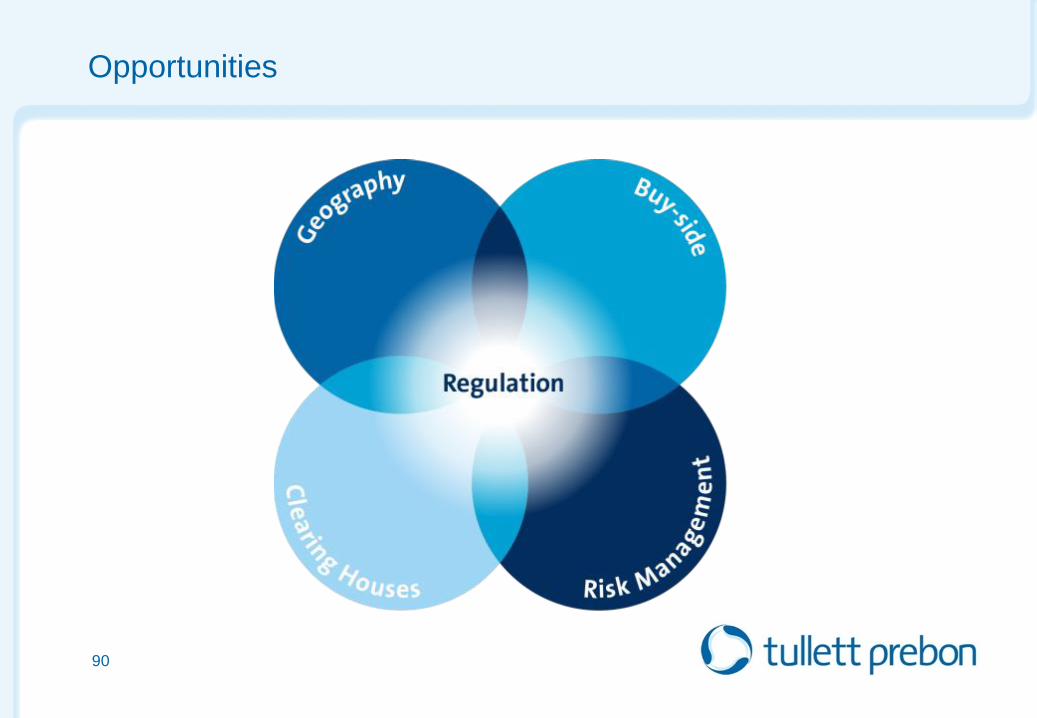
Opportunities
90

Key takeaways
91
• Award-winning content business
• Great customer retention
• Expanding market supported by global regulation
• Growth business
Tullett Prebon
Capital Markets Day
12th June, 2015
John Phizackerley
Chief Executive, Tullett Prebon
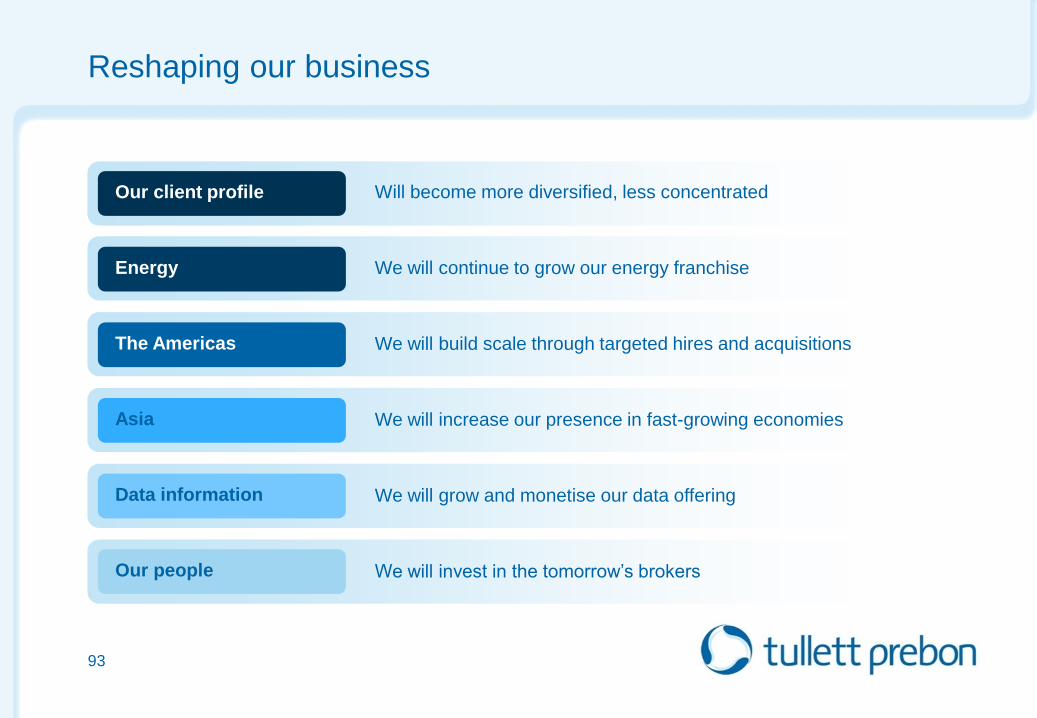
Reshaping our business
93
We will continue to grow our energy franchise
We will build scale through targeted hires and acquisitions
We will increase our presence in fast-growing economies
We will invest in the tomorrow’s brokers
Will become more diversified, less concentrated
Energy
The Americas
Asia
Data information
Our people
We will grow and monetise our data offering
Our client profile

94

Tullett Prebon
The best operator in
the hybrid voice sector
95

Q&A