tumor-infiltrating lymphocytes and response to … · tumor-infiltrating lymphocytes and response...
TRANSCRIPT

Tumor-Infiltrating Lymphocytes and Response toNeoadjuvant Chemotherapy With or Without Carboplatinin Human Epidermal Growth Factor Receptor 2–Positiveand Triple-Negative Primary Breast Cancers
Carsten Denkert, Gunter von Minckwitz, Jan C. Brase, Bruno V. Sinn, Stephan Gade, Ralf Kronenwett,Berit M. Pfitzner, Christoph Salat, Sherene Loi, Wolfgang D. Schmitt, Christian Schem, Karin Fisch,Silvia Darb-Esfahani, Keyur Mehta, Christos Sotiriou, Stephan Wienert, Peter Klare, Fabrice André,Frederick Klauschen, Jens-Uwe Blohmer, Kristin Krappmann, Marcus Schmidt, Hans Tesch, Sherko Kümmel,Peter Sinn, Christian Jackisch, Manfred Dietel, Toralf Reimer, Michael Untch, and Sibylle Loibl
See accompanying editorial on page 969
Author affiliations appear at the end ofthis article.
Published online ahead of print atwww.jco.org on December 22, 2014.
Processed as a Rapid Communicationmanuscript.
Supported by European CommissionGrant No. 278659 (RESPONSIFY).
Presented orally at the San AntonioBreast Cancer Symposium, San Anto-nio, TX, December 10-14, 2013, and50th Annual Meeting of the AmericanSociety of Clinical Oncology, Chicago,IL, May 30-June 3, 2014.
Terms in blue are defined in the glos-sary, found at the end of this articleand online at www.jco.org.
Authors’ disclosures of potentialconflicts of interest are found in thearticle online at www.jco.org. Authorcontributions are found at the end ofthis article.
Corresponding author: Carsten Denkert,MD, Institut für Pathologie, CharitéUniversitätsmedizin Berlin, Charitéplatz1, 10117 Berlin, Germany; e-mail:[email protected].
© 2014 by American Society of ClinicalOncology
0732-183X/15/3309w-983w/$20.00
DOI: 10.1200/JCO.2014.58.1967
A B S T R A C T
PurposeModulation of immunologic interactions in cancer tissue is a promising therapeutic strategy. Toinvestigate the immunogenicity of human epidermal growth factor receptor 2 (HER2) –positive andtriple-negative (TN) breast cancers (BCs), we evaluated tumor-infiltrating lymphocytes (TILs) andimmunologically relevant genes in the neoadjuvant GeparSixto trial.
Patients and MethodsGeparSixto investigated the effect of adding carboplatin (Cb) to an anthracycline-plus-taxane combination(PM) on pathologic complete response (pCR). A total of 580 tumors were evaluated before randomassignment for stromal TILs and lymphocyte-predominant BC (LPBC). mRNA expression of immune-activating (CXCL9, CCL5, CD8A, CD80, CXCL13, IGKC, CD21) as well as immunosuppressive factors(IDO1, PD-1, PD-L1, CTLA4, FOXP3) was measured in 481 tumors.
ResultsIncreased levels of stromal TILs predicted pCR in univariable (P � .001) and multivariable analyses(P � .001). pCR rate was 59.9% in LPBC and 33.8% for non-LPBC (P � .001). pCR rates � 75%were observed in patients with LPBC tumors treated with PMCb, with a significant test forinteraction with therapy in the complete (P � .002) and HER2-positive (P � .006), but not theTNBC, cohorts. Hierarchic clustering of mRNA markers revealed three immune subtypes withdifferent pCR rates (P � .001). All 12 immune mRNA markers were predictive for increased pCR.The highest odds ratios (ORs) were observed for PD-L1 (OR, 1.57; 95% CI, 1.34 to 1.86; P � .001)and CCL5 (OR, 1.41; 95% CI, 1.23 to 1.62; P � .001).
ConclusionImmunologic factors were highly significant predictors of therapy response in the GeparSixto trial,particularly in patients treated with Cb. After further standardization, they could be included inhistopathologic assessment of BC.
J Clin Oncol 33:983-991. © 2014 by American Society of Clinical Oncology
INTRODUCTION
Treatment of human epidermal growth factor re-ceptor 2 (HER2) –positive and triple-negative breastcancers (TNBCs) with neoadjuvant therapy leads topathologic complete response (pCR) rates of 30% to50%,1,2 which have been linked to long-term bene-fit.3,4 For TNBC, the use of platinum-based chemo-therapy is currently under evaluation as a newchemotherapeutic option.5,6 However, a relevant
number of patients still do not respond to treatment,and therefore, new treatment options are needed.
Previous investigations have shown that im-munologic parameters are relevant for response toneoadjuvant chemotherapy in BC7-10 as well as foroutcome after adjuvant therapy.11-13 These immunesignals are particularly strong in HER2-positive andTNBCs.14,15 Comparably high response rates werereported in initial clinical trials evaluating inhibitorsof immune checkpoints, such as anti–PD-L1,
JOURNAL OF CLINICAL ONCOLOGY O R I G I N A L R E P O R T
VOLUME 33 � NUMBER 9 � MARCH 20 2015
© 2014 by American Society of Clinical Oncology 983
from 130.219.8.11Information downloaded from jco.ascopubs.org and provided by at UNIV MED DNSTRY NEW JERSEY on March 30, 2015
Copyright © 2015 American Society of Clinical Oncology. All rights reserved.

anti–PD-1, or anti-CTLA4 antibodies.16-18 Therefore, it would beinteresting to evaluate expression levels and predictive capacity ofimmune markers in clinical cohorts as a basis for future combinedimmunotherapy approaches in BC. These combinations might beparticularly promising, because it has been shown that many chemo-therapeutic agents are immunogenic.19
In this study, we prospectively validated tumor-infiltrating lym-phocytes (TILs) in 580 tumor samples of HER2-positive and TNbreast carcinomas in the neoadjuvant GeparSixto trial (Fig 1A).5 Onthe molecular level, mRNA expression levels of 12 immune genes weremeasured, including immune-activating (CXCL9, CCL5, CD8A,CD80, CXCL13, IGKC, CD21) and putative immunosuppressive fac-tors (IDO1, PD-1, PD-L1, CTLA4, FOXP3). The rationale for selectionof markers was to include T-cell markers, B-cell markers, chemokines,and immune checkpoint markers that are currently under evaluationas therapeutic targets. We prospectively evaluated the hypothesis thatpCR rates would be higher in tumors with increased levels of TILs inthe pretherapeutic core biopsy. Secondary aims were the evaluation ofthe immunologic infiltrate and immune mRNA markers in subgroupswith or without carboplatin (Cb) for TN and HER2-positive BCs.
PATIENTS AND METHODS
Study Population
In GeparSixto (ClincalTrials.gov NCT01426880), patients with centrallyconfirmed HER2-positive or TNBC were treated for 18 weeks with paclitaxel80 mg/m2 once every week and nonpegylated liposomal doxorubicin 20mg/m2 once every week (PM). Patients were randomly assigned at a 1:1 ratio toreceive simultaneously Cb (PMCb; area under curve, 1.5 [initially 2.0] onceevery week) or not (ie, PM only). Patients with TNBC received bevacizumab15 mg/kg once every 2 weeks, and patients with HER2-positive disease receivedtrastuzumab 6 mg/kg (loading dose 8 mg/kg) once every 3 weeks and lapatinib750 mg daily simultaneously. Pretherapeutic formalin-fixed paraffin-embedded core biopsies were collected after written informed consent. Hor-mone receptor positivity was defined as � 1% positive cells for estrogen (ER)and/or progesterone receptors (PRs). Ethical approval was obtained for allclinical centers and from the institutional review board of the Charité Berlin.We defined pCR as the absence of residual invasive or noninvasive tumor cellsin breast and lymph nodes (ypT0 ypN0). This study is reported according tothe REMARK (Reporting Recommendations for Tumor Marker PrognosticStudies) criteria.20
Statistical Analysis Plans
The investigations on TILs and mRNA markers were conducted as twoseparate translational research studies. The evaluation of TILs was part of theoriginal study protocol of GeparSixto as a secondary end point. TILs wereevaluated prospectively before random assignment, and the results were doc-umented in a signed histopathologic report that was sent to the central studyoffice for each patient. A prespecified statistical analysis plan for TIL evaluationwas defined before statistical evaluation started.
The evaluation of mRNA markers was performed as a separate projectusing the existing tumor samples after the clinical study was completed. Thisseparate project had a separate statistical analysis plan and study outline, whichwere also completely defined before the evaluation was started.
Prospective Histopathologic Evaluation of
Inflammatory Infiltrates
TIL evaluation was performed on hematoxylin and eosin–stained sec-tions in a routine diagnostic setting.7 Each patient case was evaluated by two ofsix pathologists. We evaluated the percentage of stromal as well as intratu-moral TILs separately. The predominant lymphocytic infiltrate was located inthe stroma (Figs 1B to 1E). Intratumoral TILs had lower levels and were
correlated with stromal TILs (Appendix Fig A1, online only). Therefore, in thisanalysis, we focused on stromal TILs as a continuous parameter. For someanalyses, we used lymphocyte-predominant (LP) BC (� 60% of either intra-tumoral or stromal TILs) as a predefined categorical parameter, based on aprevious study.8 To evaluate interobserver variance of TIL assessment, threeindependent pathologists (C.D., B.M.P., W.D.S.) evaluated 87 digital imagesof selected regions from 29 tumors. The results were compared with auto-mated image analysis.21,22
Evaluation of mRNA Markers
Immunologically relevant genes were selected based on previous evalu-ations7 and published data on checkpoint inhibitors.16-18 Total RNA wasextracted from 5-�m whole formalin-fixed paraffin-embedded sections with� 30% tumor area, as defined in a previous study,23 using a fully automatedmethod (VERSANT; Siemens, Tarrytown, NY).24 Genes were measured intriplicate by quantitative real-time polymerase chain reaction (RT-PCR) usingthe SuperScript III Platinum One-Step quantitative RT-PCR system with ROX(Invitrogen, Karlsruhe, Germany) in a ViiA 7 RT-PCR system (Applied Bio-systems, Darmstadt, Germany). The thermal profile included 30 minutes at50°C, 20.5 minutes at 8°C and 2 minutes at 95°C followed by 40 cycles of 15seconds at 95°C and 30 seconds at 60°C. Primer and probe sequences (Appen-dix Table A1, online only) were selected by empiric rules and Primer Expresssoftware (version 3.0; Applied Biosystems). No-template controls, a standard-ized reference RNA control (Clontech Laboratories, Saint-Germain-en-Laye,France), and a pooled RNA control from TNBC samples (for CTLA4, FOXP3,and PD-1) were measured in parallel. Cycle threshold (Ct) values were calcu-lated using ViiA 7 software (version 1.2.1; Applied Biosystems). Relativeexpression levels of genes of interest were calculated as�Ct values (�Ct�20�[CtGOI � Ct(mean of RPL37A, CALM2, OAZ1)]), where GOI indicates gene ofinterest. Trained laboratory personnel strictly blinded to clinical data per-formed all mRNA analyses after the end of the recruitment period.
Statistical Analyses
Associations between LPBC and pCR were investigated with �2 tests forcategorical variables using SPSS software (version 21; SPSS, Chicago, IL) andwith univariable logistic regression. Odds ratios (ORs) and 95% CIs withtwo-sided P values were used. A P value � .05 was considered statisticallysignificant; no adjustment for multiple comparisons was performed. For thelogistic regression, the following clinical variables were used: ER negative/PRnegative versus ER positive and/or PR positive; HER2 positive versus HER2negative; grade 3 versus grade 1 or 2; cT1-2 versus cT3-4; cN0 versus cN�; PMversus PM plus Cb; and age � 50 versus � 50 years. Stromal TILs were alsoincluded in an additional exploratory multivariable analysis of mRNA mark-ers. An interaction test was performed for some analyses.
Interobserver variance was measured using Cohen’s kappa and the in-traclass correlation coefficient (ICC).25 The ICC was calculated using themixed model and absolute agreement. The ICC for single measures is an indexfor reliability of single raters, whereas the ICC for average measures is an indexfor reliability of different raters averaged together (which is similar to diagnos-tic approach used in GeparSixto); we report both ICC values.
RESULTS
Baseline Clinical Data
A total of 580 tumors (98.6%) were prospectively evaluatedfor TILs, including 266 HER2-positive (45.9%) and 314 TN tu-mors (54.1%; Appendix Table A2, online only). Eight patient caseswere excluded from the evaluation, because the diagnostic biopsywas from a lymph node. Median patient age was 47 years. mRNAmarkers were measured in 481 samples (82.9%; Fig 1A). For 99patients (17.1%), the mRNA markers could not be measured be-cause of low tumor-cell content.
Denkert et al
984 © 2014 by American Society of Clinical Oncology JOURNAL OF CLINICAL ONCOLOGY
from 130.219.8.11Information downloaded from jco.ascopubs.org and provided by at UNIV MED DNSTRY NEW JERSEY on March 30, 2015
Copyright © 2015 American Society of Clinical Oncology. All rights reserved.
pCR Rates in LPBC
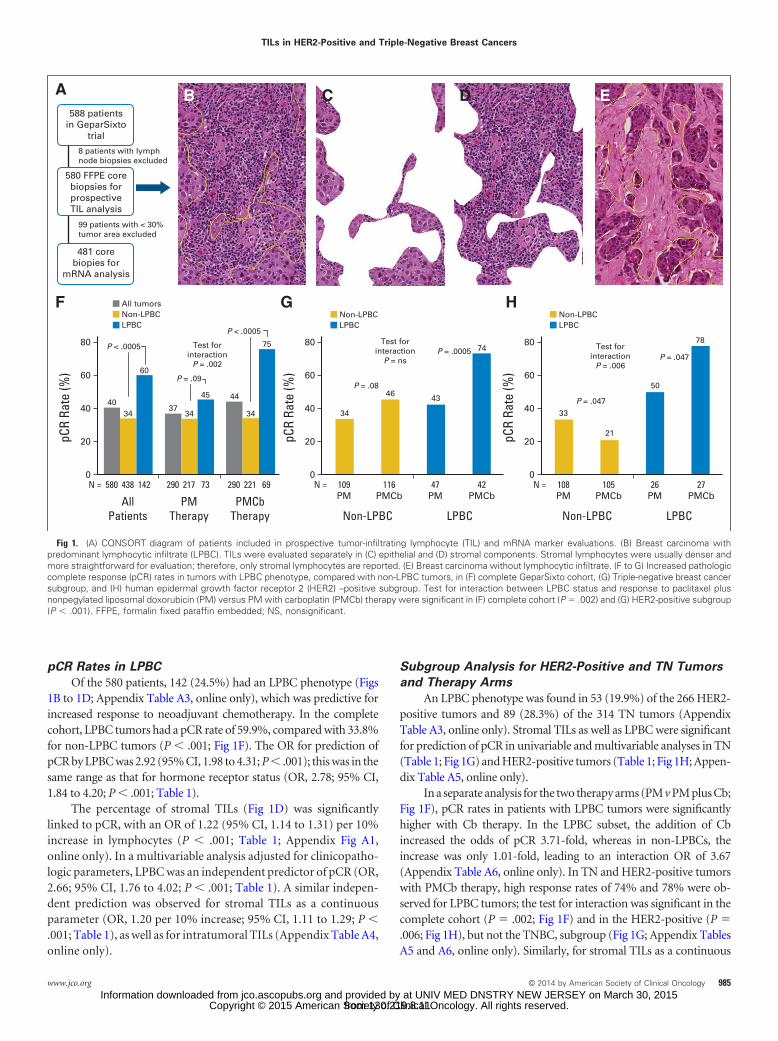
Of the 580 patients, 142 (24.5%) had an LPBC phenotype (Figs1B to 1D; Appendix Table A3, online only), which was predictive forincreased response to neoadjuvant chemotherapy. In the completecohort, LPBC tumors had a pCR rate of 59.9%, compared with 33.8%for non-LPBC tumors (P � .001; Fig 1F). The OR for prediction ofpCR by LPBC was 2.92 (95% CI, 1.98 to 4.31; P � .001); this was in thesame range as that for hormone receptor status (OR, 2.78; 95% CI,1.84 to 4.20; P � .001; Table 1).
The percentage of stromal TILs (Fig 1D) was significantlylinked to pCR, with an OR of 1.22 (95% CI, 1.14 to 1.31) per 10%increase in lymphocytes (P � .001; Table 1; Appendix Fig A1,online only). In a multivariable analysis adjusted for clinicopatho-logic parameters, LPBC was an independent predictor of pCR (OR,2.66; 95% CI, 1.76 to 4.02; P � .001; Table 1). A similar indepen-dent prediction was observed for stromal TILs as a continuousparameter (OR, 1.20 per 10% increase; 95% CI, 1.11 to 1.29; P �.001; Table 1), as well as for intratumoral TILs (Appendix Table A4,online only).
Subgroup Analysis for HER2-Positive and TN Tumors
and Therapy Arms
An LPBC phenotype was found in 53 (19.9%) of the 266 HER2-positive tumors and 89 (28.3%) of the 314 TN tumors (AppendixTable A3, online only). Stromal TILs as well as LPBC were significantfor prediction of pCR in univariable and multivariable analyses in TN(Table 1; Fig 1G) and HER2-positive tumors (Table 1; Fig 1H; Appen-dix Table A5, online only).
In a separate analysis for the two therapy arms (PM v PM plus Cb;Fig 1F), pCR rates in patients with LPBC tumors were significantlyhigher with Cb therapy. In the LPBC subset, the addition of Cbincreased the odds of pCR 3.71-fold, whereas in non-LPBCs, theincrease was only 1.01-fold, leading to an interaction OR of 3.67(Appendix Table A6, online only). In TN and HER2-positive tumorswith PMCb therapy, high response rates of 74% and 78% were ob-served for LPBC tumors; the test for interaction was significant in thecomplete cohort (P � .002; Fig 1F) and in the HER2-positive (P �.006; Fig 1H), but not the TNBC, subgroup (Fig 1G; Appendix TablesA5 and A6, online only). Similarly, for stromal TILs as a continuous
A
HGF
CB D E588 patients
in GeparSixtotrial
580 FFPE corebiopsies forprospectiveTIL analysis
481 corebiopies for
mRNA analysis
99 patients with < 30%tumor area excluded
8 patients with lymphnode biopsies excluded
4034
60
3734
45 44 43
33
50
78
21
34 34
75 74Test forinteraction
P = .002
Test forinteraction
P = ns
Test forinteraction
P = .006
P = .0005P = .047
46
pCR
Rate
(%)
80
60
40
20
0580 = N= N= N 438 142 290 217 73 290 221
AllPatients
PMTherapy
PMCbTherapy
69
pCR
Rate
(%)
80
60
40
20
0109PM
116PMCb
47PM
Non-LPBC LPBC
42PMCb
P < .0005
P < .0005
P = .09P = .08
All tumorsNon-LPBCLPBC
Non-LPBCLPBC
pCR
Rate
(%)
80
60
40
20
0108PM
105PMCb
26PM
Non-LPBC LPBC
27PMCb
P = .047
Non-LPBCLPBC
Fig 1. (A) CONSORT diagram of patients included in prospective tumor-infiltrating lymphocyte (TIL) and mRNA marker evaluations. (B) Breast carcinoma withpredominant lymphocytic infiltrate (LPBC). TILs were evaluated separately in (C) epithelial and (D) stromal components. Stromal lymphocytes were usually denser andmore straightforward for evaluation; therefore, only stromal lymphocytes are reported. (E) Breast carcinoma without lymphocytic infiltrate. (F to G) Increased pathologiccomplete response (pCR) rates in tumors with LPBC phenotype, compared with non-LPBC tumors, in (F) complete GeparSixto cohort, (G) Triple-negative breast cancersubgroup, and (H) human epidermal growth factor receptor 2 (HER2) –positive subgroup. Test for interaction between LPBC status and response to paclitaxel plusnonpegylated liposomal doxorubicin (PM) versus PM with carboplatin (PMCb) therapy were significant in (F) complete cohort (P � .002) and (G) HER2-positive subgroup(P � .001). FFPE, formalin fixed paraffin embedded; NS, nonsignificant.
TILs in HER2-Positive and Triple-Negative Breast Cancers
www.jco.org © 2014 by American Society of Clinical Oncology 985
from 130.219.8.11Information downloaded from jco.ascopubs.org and provided by at UNIV MED DNSTRY NEW JERSEY on March 30, 2015
Copyright © 2015 American Society of Clinical Oncology. All rights reserved.
parameter, the test for interaction with therapy was also positive in thecomplete cohort (P � .006) and the HER2-positive subgroup (P �.007; Table 2), but not in the TNBC subgroup (Appendix Tables A5and A6, online only).
In an exploratory logistic regression using the alternative pCRdefinition (ypT0is ypN0), stromal lymphocytes as well as LPBCs were
still highly significant (stromal lymphocytes: OR, 1.19; 95% CI, 1.11 to1.28; P � .001; LPBCs: OR, 2.83; 95% CI, 1.89 to 4.23; P � .001). Withthe wider pCR definition, the pCR rate of LPBC tumors with Cbtreatment was 79% (for TNBC) and 85% (for HER2-positive BC).Using ypT0is ypN0 as an end point, the test for interaction betweentherapy and LPBC was still significant in the complete cohort
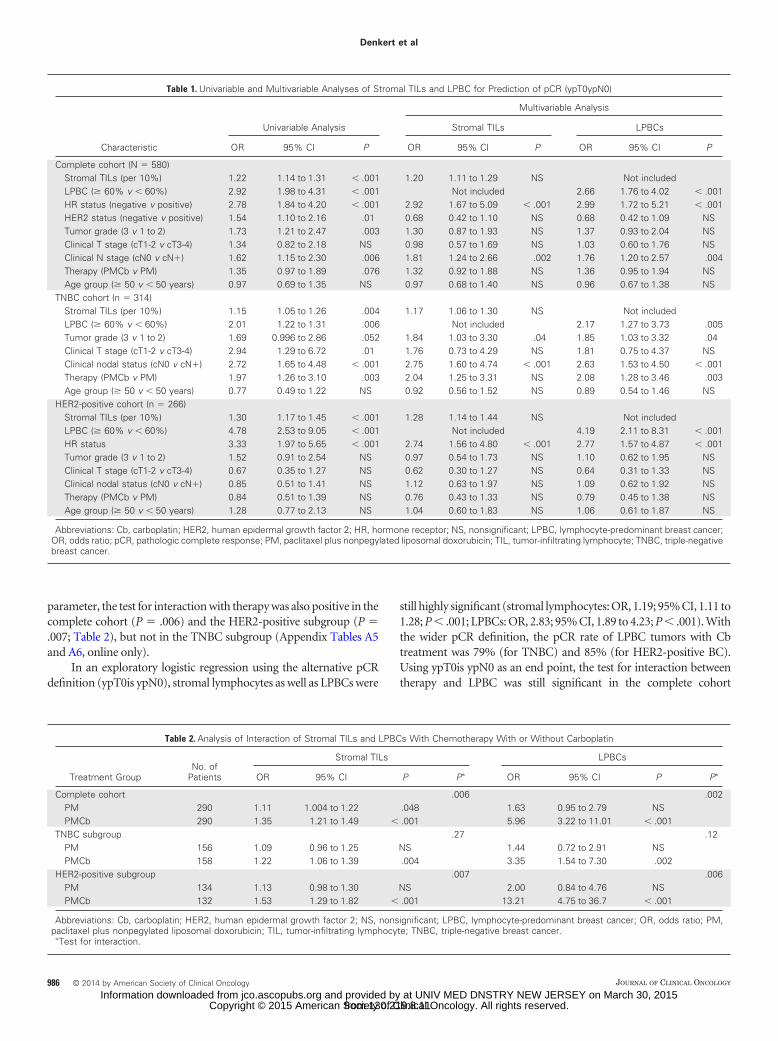
Table 1. Univariable and Multivariable Analyses of Stromal TILs and LPBC for Prediction of pCR (ypT0ypN0)
Characteristic
Univariable Analysis
Multivariable Analysis
Stromal TILs LPBCs
OR 95% CI P OR 95% CI P OR 95% CI P
Complete cohort (N � 580)Stromal TILs (per 10%) 1.22 1.14 to 1.31 � .001 1.20 1.11 to 1.29 NS Not includedLPBC (� 60% v � 60%) 2.92 1.98 to 4.31 � .001 Not included 2.66 1.76 to 4.02 � .001HR status (negative v positive) 2.78 1.84 to 4.20 � .001 2.92 1.67 to 5.09 � .001 2.99 1.72 to 5.21 � .001HER2 status (negative v positive) 1.54 1.10 to 2.16 .01 0.68 0.42 to 1.10 NS 0.68 0.42 to 1.09 NSTumor grade (3 v 1 to 2) 1.73 1.21 to 2.47 .003 1.30 0.87 to 1.93 NS 1.37 0.93 to 2.04 NSClinical T stage (cT1-2 v cT3-4) 1.34 0.82 to 2.18 NS 0.98 0.57 to 1.69 NS 1.03 0.60 to 1.76 NSClinical N stage (cN0 v cN�) 1.62 1.15 to 2.30 .006 1.81 1.24 to 2.66 .002 1.76 1.20 to 2.57 .004Therapy (PMCb v PM) 1.35 0.97 to 1.89 .076 1.32 0.92 to 1.88 NS 1.36 0.95 to 1.94 NSAge group (� 50 v � 50 years) 0.97 0.69 to 1.35 NS 0.97 0.68 to 1.40 NS 0.96 0.67 to 1.38 NS
TNBC cohort (n � 314)Stromal TILs (per 10%) 1.15 1.05 to 1.26 .004 1.17 1.06 to 1.30 NS Not includedLPBC (� 60% v � 60%) 2.01 1.22 to 1.31 .006 Not included 2.17 1.27 to 3.73 .005Tumor grade (3 v 1 to 2) 1.69 0.996 to 2.86 .052 1.84 1.03 to 3.30 .04 1.85 1.03 to 3.32 .04Clinical T stage (cT1-2 v cT3-4) 2.94 1.29 to 6.72 .01 1.76 0.73 to 4.29 NS 1.81 0.75 to 4.37 NSClinical nodal status (cN0 v cN�) 2.72 1.65 to 4.48 � .001 2.75 1.60 to 4.74 � .001 2.63 1.53 to 4.50 � .001Therapy (PMCb v PM) 1.97 1.26 to 3.10 .003 2.04 1.25 to 3.31 NS 2.08 1.28 to 3.46 .003Age group (� 50 v � 50 years) 0.77 0.49 to 1.22 NS 0.92 0.56 to 1.52 NS 0.89 0.54 to 1.46 NS
HER2-positive cohort (n � 266)Stromal TILs (per 10%) 1.30 1.17 to 1.45 � .001 1.28 1.14 to 1.44 NS Not includedLPBC (� 60% v � 60%) 4.78 2.53 to 9.05 � .001 Not included 4.19 2.11 to 8.31 � .001HR status 3.33 1.97 to 5.65 � .001 2.74 1.56 to 4.80 � .001 2.77 1.57 to 4.87 � .001Tumor grade (3 v 1 to 2) 1.52 0.91 to 2.54 NS 0.97 0.54 to 1.73 NS 1.10 0.62 to 1.95 NSClinical T stage (cT1-2 v cT3-4) 0.67 0.35 to 1.27 NS 0.62 0.30 to 1.27 NS 0.64 0.31 to 1.33 NSClinical nodal status (cN0 v cN�) 0.85 0.51 to 1.41 NS 1.12 0.63 to 1.97 NS 1.09 0.62 to 1.92 NSTherapy (PMCb v PM) 0.84 0.51 to 1.39 NS 0.76 0.43 to 1.33 NS 0.79 0.45 to 1.38 NSAge group (� 50 v � 50 years) 1.28 0.77 to 2.13 NS 1.04 0.60 to 1.83 NS 1.06 0.61 to 1.87 NS
Abbreviations: Cb, carboplatin; HER2, human epidermal growth factor 2; HR, hormone receptor; NS, nonsignificant; LPBC, lymphocyte-predominant breast cancer;OR, odds ratio; pCR, pathologic complete response; PM, paclitaxel plus nonpegylated liposomal doxorubicin; TIL, tumor-infiltrating lymphocyte; TNBC, triple-negativebreast cancer.
Table 2. Analysis of Interaction of Stromal TILs and LPBCs With Chemotherapy With or Without Carboplatin
Treatment GroupNo. of
Patients
Stromal TILs LPBCs
OR 95% CI P P� OR 95% CI P P�
Complete cohort .006 .002PM 290 1.11 1.004 to 1.22 .048 1.63 0.95 to 2.79 NSPMCb 290 1.35 1.21 to 1.49 � .001 5.96 3.22 to 11.01 � .001
TNBC subgroup .27 .12PM 156 1.09 0.96 to 1.25 NS 1.44 0.72 to 2.91 NSPMCb 158 1.22 1.06 to 1.39 .004 3.35 1.54 to 7.30 .002
HER2-positive subgroup .007 .006PM 134 1.13 0.98 to 1.30 NS 2.00 0.84 to 4.76 NSPMCb 132 1.53 1.29 to 1.82 � .001 13.21 4.75 to 36.7 � .001
Abbreviations: Cb, carboplatin; HER2, human epidermal growth factor 2; NS, nonsignificant; LPBC, lymphocyte-predominant breast cancer; OR, odds ratio; PM,paclitaxel plus nonpegylated liposomal doxorubicin; TIL, tumor-infiltrating lymphocyte; TNBC, triple-negative breast cancer.
�Test for interaction.
Denkert et al
986 © 2014 by American Society of Clinical Oncology JOURNAL OF CLINICAL ONCOLOGY
from 130.219.8.11Information downloaded from jco.ascopubs.org and provided by at UNIV MED DNSTRY NEW JERSEY on March 30, 2015
Copyright © 2015 American Society of Clinical Oncology. All rights reserved.

(interaction P � .009), but it was not significant in the TNBC orHER2-positive subgroup (data not shown).
Analytic Validation of TIL Assessment
To obtain data on interobserver variance of TIL assessment, threepathologists evaluated a set of digital images of 87 regions of interestfrom 29 tumors. For LPBC versus non-LPBC, Cohen’s kappa valuesfor comparison of the three evaluators with one another were 0.90,0.69, and 0.60. For stromal TILs, the ICC for the 29 patient cases andthree pathologists was 0.92 (95% CI, 0.83 to 0.96; P � .001) for singlemeasures and 0.97 (95% CI, 0.93 to 0.99; P � .001) for averagemeasures. Measurement of stromal TILs by automated image analysisshowed that the lymphocytic infiltrate varied between � 500 and� 11,000 lymphocytes per mm2 of stromal tissue (Appendix Fig A2,online only). The differences between the three observers were partic-ularly relevant in those tumors with intermediate TIL levels between20% and 50% that also showed increased intratumoral heterogeneitybetween the three regions of interest.
Evaluation of Immunologic mRNA Markers in Tumor
Samples From GeparSixto
On the basis of previous reports by our group and others, weselected 12 immunologically relevant mRNA markers for detailed
evaluation in breast cancer tissue, including T-cell markers, B-cellmarkers, chemokines, and immune checkpoint parameters (CXCL9,CCL5, CD8A, CD80, CXCL13, IGKC, CD21, IDO1, PD-1, PD-L1,CTLA4, FOXP3).
Hierarchic clustering of mRNA expression revealed three differ-ent immune subtypes of tumors with different expression of immu-nologic genes and different amounts of TILs (Fig 2A). Immune groupA tumors showed low expression of all immune genes, immune groupC tumors had high immunologic gene expression levels, and immunegroup B tumors had intermediate gene expression levels. Similar pat-terns were observed in the HER2-positive and TN subgroups (Appen-dix Fig A3, online only). The distribution of the three groups in thedifferent subtypes is summarized in Appendix Table A3 (online only).The three immune subtypes had largely different response rates tochemotherapy. The pCR rates of immune groups A, B, and C were24%, 37.4%, and 56.2%, respectively (�2 test for trend P � .001; Fig2B). The percentages of LPBC tumors in immune groups A, B, and Cwere 1.1%, 19.1%, and 50.4%, respectively (�2 test for trend P � .001;Fig 2B).
All immune markers had highly significant (P � .001)positive correlations with one another and with stromal TILs(Appendix Fig A4, online only). Interestingly, even those mark-ers that were linked to immunosuppressive activity in tumor
Immune groupHR+HR−
Stromal TILs (%)
LPBC
A B C
60
0
3
2
1
0
−1
−2
−3
PDL1
IDO1
PD1
CTLA4
CXCL9
CD8A
CCL5
CXCL13
IGKC
CD21
FOXP3
CD80
BA
C
PD1
CXCL9
15
14
11
12
13
10
9
10 12 14 16 18 20 22
Perc
enta
ge o
f Tum
ors 60
50
30
40
20
10
0Immune-CImmune-BImmune-A
LPBC (%) P = .0000000000001pCR (%) P = .0000008
24
1
37
19
56
50
Corr: 0.813
Fig 2. (A) Hierarchic clustering of 12 immunologically relevant genes in 481 tumors from GeparSixto showed three different immune groups of tumors with differentexpression of immunologic genes and different amounts of tumor-infiltrating lymphocytes (TILs). Immune group A tumors showed low expression of all immune genes;immune group C tumors showed high expression of immunologic genes; immune group B tumors showed intermediate gene expression levels. Corresponding levelsof stromal TILs for each tumor as well as lymphocyte-predominant breast cancer (LPBC) status is shown in lower section of panel. (B) Evaluation of CXCL9 and PD-1mRNA levels in 481 tumors from GeparSixto showed positive correlation (corr) between both markers (Pearson correlation coefficient, 0.813). (C) Three immuneclusters were significantly different for percentage of LPBC tumors (�2 test for trend P � .001) and pathologic complete response (pCR) rate (�2 test for trend P � .001).HR, hormone receptor.
TILs in HER2-Positive and Triple-Negative Breast Cancers
www.jco.org © 2014 by American Society of Clinical Oncology 987
from 130.219.8.11Information downloaded from jco.ascopubs.org and provided by at UNIV MED DNSTRY NEW JERSEY on March 30, 2015
Copyright © 2015 American Society of Clinical Oncology. All rights reserved.

tissue (PD-1, PD-L1, CTLA4, IDO1) had a significant positivecorrelation with the other immune markers and with TILs (Fig 2C;Appendix Fig A4, online only).
Prediction of Response to Neoadjuvant
Chemotherapy by Immunologic mRNA Expression
All 12 immune mRNA markers were significantly linked to in-creased pCR (Table 3; Fig 3A). The highest ORs were observed forPD-L1 (OR, 1.57 per �Ct; 95% CI, 1.34 to 1.86; P � .001) and CCL5(OR, 1.41 per �Ct; 95% CI, 1.23 to 1.62; P � .001). The ORs were
generally higher in HER2-positive compared with TN tumors (Figs 3Band 3C), which might be explained by an interaction of the immunesystem with the additional anti-HER2 therapy.
Eleven of the 12 mRNAs were also significant in multivariableanalysis adjusted for clinicopathologic factors (Table 3). As shownin Figures 3A to C, even putative immunosuppressive markerssuch as PD-1, PD-L1, CTLA4, and IDO1 had a positive correlationwith chemotherapy response. The test for interaction with PMversus PMCb therapy was significant for CCL5 (P � .002), CD8A(P � .01), PD-1 (P � .02), and IDO1 (P � .03; Table 3). Inclusion
Table 3. Univariable and Multivariable Analyses of Immunologic mRNA Markers for Response to Chemotherapy and Interaction With Therapy Groups
Marker
Univariable Analysis
Multivariable Analysis
Clinical Parameters Clinical Parametersand Stromal TILs
P
PM VersusPMCb Therapy
P†OR� 95% CI P OR� 95% CI P
Complete cohort (n � 481)Stromal TILs 1.26 1.16 to 1.36 � .001 1.24 1.14 to 1.35 � .001 — .007CCL5 1.41 1.23 to 1.62 � .001 1.39 1.20 to 1.61 � .001 .04 .002CXCL9 1.25 1.14 to 1.38 � .001 1.21 1.09 to 1.34 .003 NS NSCXCL13 1.16 1.06 to 1.26 .001 1.14 1.04 to 1.25 .006 NS NSCD8A 1.29 1.13 to 1.48 � .001 1.28 1.11 to 1.48 .001 NS .01PD-1 1.43 1.24 to 1.66 � .001 1.41 1.20 to 1.65 � .001 NS .02PD-L1 1.57 1.34 to 1.86 � .001 1.53 1.29 to 1.82 � .001 .005 NSCTLA4 1.38 1.19 to 1.60 � .001 1.35 1.16 to 1.58 � .001 NS NSFOXP3 1.23 1.003 to 1.50 .05 1.29 1.04 to 1.60 .02 NS NSIDO1 1.25 1.14 to 1.36 � .001 1.22 1.11 to 1.34 � .001 .05 .03IGKC 1.15 1.06 to 1.24 � .001 1.14 1.05 to 1.23 .002 NS NSCD80 1.59 1.26 to 2.01 � .001 1.59 1.24 to 2.05 � .001 NS NSCD21 1.11 1.02 to 1.21 .01 1.07 0.98 to 1.18 NS NS NS
TNBC cohort (n � 255)Stromal TILs 1.16 1.04 to 1.28 .007 1.19 1.06 to 1.33 .004 — NSCCL5 1.30 1.07 to 1.56 .007 1.36 1.11 to 1.68 .004 NS .02CXCL9 1.17 1.02 to 1.33 .02 1.16 1.005 to 1.34 .04 NS NSCXCL13 1.18 1.04 to 1.35 .01 1.19 1.03 to 1.38 .02 NS NSCD8A 1.21 1.01 to 1.46 .04 1.24 1.01 to 1.52 .04 NS .02PD-1 1.27 1.05 to 1.53 .01 1.35 1.09 to 1.66 .005 NS NSPD-L1 1.44 1.18 to 1.77 � .001 1.45 1.16 to 1.82 .001 .04 NSCTLA4 1.30 1.07 to 1.58 .009 1.37 1.10 to 1.71 .005 NS NSFOXP3 1.09 0.84 to 1.42 NS 1.23 0.92 to 1.65 NS NS NSIDO1 1.18 1.05 to 1.32 .004 1.21 1.06 to 1.37 .004 NS .05IGKC 1.10 0.998 to 1.21 NS 1.11 0.998 to 1.24 NS NS NSCD80 1.74 1.28 to 2.38 � .001 1.93 1.36 to 2.73 � .001 .005 NSCD21 0.99 0.89 to 1.11 NS 0.98 0.87 to 1.12 NS NS NS
HER2-positive cohort (n � 226)Stromal TILs 1.37 1.22 to 1.55 � .001 1.37 1.20 to 1.57 � .001 — .008CCL5 1.52 1.24 to 1.87 � .001 1.46 1.17 to 1.81 .001 NS NSCXCL9 1.34 1.16 to 1.56 � .001 1.30 1.11 to 1.53 .001 NS NSCXCL13 1.12 0.99 to 1.26 NS 1.12 0.98 to 1.27 NS NS NSCD8A 1.39 1.13 to 1.70 .002 1.34 1.08 to 1.66 .008 NS NSPD-1 1.67 1.31 to 2.12 � .001 1.58 1.22 to 2.05 .001 NS NSPD-L1 1.79 1.37 to 2.34 � .001 1.75 1.31 to 2.33 � .001 NS NSCTLA4 1.45 1.17 to 1.80 .001 1.40 1.11 to 1.76 .005 NS .05FOXP3 1.61 1.15 to 2.26 .005 1.53 1.08 to 2.16 .02 NS NSIDO1 1.31 1.14 to 1.50 � .001 1.29 1.11 to 1.49 .001 NS NSIGKC 1.21 1.07 to 1.37 .002 1.18 1.04 to 1.35 .01 NS NSCD80 1.38 0.96 to 1.97 NS 1.29 0.88 to 1.88 NS NS NSCD21 1.25 1.10 to 1.43 .001 1.19 1.04 to 1.38 .02 NS NS
Abbreviations: Cb, carboplatin; HER2, human epidermal growth factor 2; NS, nonsignificant; OR, odds ratio; PM, paclitaxel plus nonpegylated liposomal doxorubicin;TIL, tumor-infiltrating lymphocyte; TNBC, triple-negative breast cancer.
�For stromal TILs, OR is reported per 10%; for RNA markers, OR is reported per � cycle threshold.†Test for interaction.
Denkert et al
988 © 2014 by American Society of Clinical Oncology JOURNAL OF CLINICAL ONCOLOGY
from 130.219.8.11Information downloaded from jco.ascopubs.org and provided by at UNIV MED DNSTRY NEW JERSEY on March 30, 2015
Copyright © 2015 American Society of Clinical Oncology. All rights reserved.

of TILs and mRNA markers in a combined exploratory multivari-able analysis demonstrated that pathologic as well as molecularparameters provided comparable information in many analyses(Table 3). However, some mRNA markers, such as CCL5, PD-L1,and IDO1 in the complete cohort as well as PD-L1 and CD80 in TNtumors, were significant in multivariable analysis even if the stro-mal TILs were included. In TNBC, the markers CCL5, CD8A, andIDO1 provided predictive information for Cb response (test forinteraction P � .02 for CCL5; P � .02 for CD8A; P � .05 for IDO1;Table 3).
DISCUSSION
In this study, we performed a prospective validation of TILs in a largeclinical trial. Two pathologists performed the analysis for each tumorat the time of random assignment in a setting that was comparable toroutine diagnostic histopathology. Although a general positive rolefor TILs in chemotherapy response has been reported in manystudies,7-10,13 our study is the first to our knowledge to suggest thatsome types of chemotherapy, such as Cb, have a particularly stronginteraction with the immune system. It has been shown that platinumchemotherapeutics have the ability to induce an immunogenic type ofcell death,26 which might explain the effects observed in our study. Arecent study evaluating postneoadjuvant samples also described a rolefor immune cells in BC outcome.27
TILs in hematoxylin and eosin–stained sections are a basic pa-rameter, considering the complexity of the immune system. There-fore, we further validated our results by investigation of mRNAexpression of key modulators of immune reactions. All mRNA mark-ers were significantly linked to pCR, and CCL5, CD8A, CTLA4, andIDO1 had a positive test for interaction with PM-plus-Cb versus PMchemotherapy. In TNBC, where stromal TILs had no significant in-teraction with PM-plus-Cb versus PM therapy, CCL5, IDO1, andCD8A had a significant test for interaction. Additional validations inlarger cohorts are needed to validate mRNA signatures for additionalpredictive information beyond TILs.
Our evaluation included promising therapeutic targets such asCTLA4, PD-1, and PD-L1, which are already in clinical evaluation.16-18
There is an ongoing debate about the best biomarkers for these newimmunomodulatory therapies. In our study, mRNA markers such asPD-1, PD-L1, CTLA4, and FOXP3 showed a positive correlation withproimmune markers, stromal TILs, and treatment response. Immu-nosuppressive checkpoint markers were expressed in parallel with theproimmune markers, suggesting a feedback activation of immuno-suppressive pathways as part of the immune reaction. Our results areconcordant with a recent study by Schalper et al,28 who showed thatincreased mRNA expression of PD-L1 was positively correlated withincreased TILs as well as improved survival. The positive correlation ofimmunosuppressive markers with improved outcome and improvedtherapy response has been described in other studies as well.29-32
The cluster analysis shows that there are distinctive immunologicsubtypes of BC and that a considerable amount of those tumors showfeatures of immunogenicity. Therefore, it might be interesting toinclude certain types of BC in clinical evaluations of immunomodu-latory agents. Such approaches might be able to change the intratu-moral immune patterns observed in our hierarchic clustering andincrease response rates to chemotherapy.
A
B
C
1.37 (1.22 to 1.55) .0000003CCL5 1.52 (1.24 to 1.87) .00008CXCL9 1.34 (1.16 to 1.56) .0001CXCL13 1.12 (0.99 to 1.26) .07CD8A 1.39 (1.13 to 1.70) .002PD1 1.67 (1.31 to 2.12) .00003PDL1 1.79 (1.37 to 2.34) .00002CTLA4 1.45 (1.17 to 1.80) .001FOXP3 1.61 (1.15 to 2.26) .005IDO1 1.31 (1.14 to 1.50) .0001IGKC 1.21 (1.07 to 1.37) .002CD80 1.38 (0.96 to 1.97) .08CD21 1.25 (1.10 to 1.43) .001
1.16 (1.04 to 1.28) .007CCL5 1.30 (1.07 to 1.56) .007CXCL9 1.17 (1.02 to 1.33) .02CXCL13 1.18 (1.04 to 1.35) .01CD8A 1.21 (1.01 to 1.46) .04PD1 1.27 (1.05 to 1.53) .01PDL1 1.44 (1.18 to 1.77) .0004CTLA4 1.30 (1.07 to 1.58) .009FOXP3 1.09 (0.84 to 1.42) nsIDO1 1.18 (1.05 to 1.32) .004IGKC 1.10 (0.998 to 1.21) .06CD80 1.74 (1.28 to 2.38) .0005CD21 0.99 (0.89 to 1.11) ns
0.6 0.8 1.0 1.2 1.4 1.6 1.8 2.0 2.2 2.4
All tumorsStromal TILs
TNBC n = 255Stromal TILs
HER2+ n = 226Stromal TILs
1.26 (1.16 to 1.36) .00000001CCL5 1.41 (1.23 to 1.62) .000001CXCL9 1.25 (1.14 to 1.38) .000006CXCL13 1.16 (1.06 to 1.26) .001CD8A 1.29 (1.13 to 1.48) .0002PD1 1.43 (1.24 to 1.66) .000001PDL1 1.57 (1.34 to 1.86) .00000003CTLA4 1.38 (1.19 to 1.60) .00001FOXP3 1.23 (1.003 to 1.50) .05IDO1 1.25 (1.14 to 1.36) .0000005IGKC 1.15 (1.06 to 1.24) .0004CD80 1.59 (1.26 to 2.01) .0001CD21 1.11 (1.02 to 1.21) .01
OR (95% CI) P
OR (95% CI) P
OR (95% CI) P
More pCRLess pCR
0.6 0.8 1.0 1.2 1.4 1.6 1.8 2.0 2.2 2.4
More pCRLess pCR
0.6 0.8 1.0 1.2 1.4 1.6 1.8 2.0 2.2 2.4
More pCRLess pCR
Fig 3. Univariable logistic regression for prediction of response to neoadjuvantchemotherapy, including stromal tumor-infiltrating lymphocytes (TILs) and 12 immuno-logically relevant genes measured by quantitative real-time polymerase chain reaction,for (A) complete cohort, (B) triple-negative breast cancer (TNBC) tumors, and (C) humanepidermal growth factor receptor 2 (HER2) –positive tumors. All mRNA markers,including immunosuppressive markers IDO1, PD-1, PD-L1, CTLA4, and FOXP3, werecorrelated positively to response to neoadjuvant therapy. For stromal TILs, odds ratio(OR) is shown per 10% change. For mRNA markers, OR is shown per one � cyclethreshold value, which approximately corresponds to doubling of mRNA levels. pCR,pathologic complete response.
TILs in HER2-Positive and Triple-Negative Breast Cancers
www.jco.org © 2014 by American Society of Clinical Oncology 989
from 130.219.8.11Information downloaded from jco.ascopubs.org and provided by at UNIV MED DNSTRY NEW JERSEY on March 30, 2015
Copyright © 2015 American Society of Clinical Oncology. All rights reserved.

There are some limitations to our study. We showed the interac-tion with Cb response for the specific comparison with the PM controlarm in GeparSixto, and a validation in other clinical studies of Cbshould be performed. The reduced pCR rate with PMCb in HER2-positive tumors with low TILs needs further validation, because thiswas not observed in the TNBC subcohort. We did not correct formultiple testing; however, the internal consistency of the results sup-ports the conclusions regarding the relevance of immunologic inter-actions. It should be further noted that the TNBC and HER2-positivepatient cohorts had somewhat uneven sample sizes and slightly differ-ent event rates, which translated into uneven power to detect marker-outcome associations for the same markers in the two distinct groups.
The analytic validation of TILs was not the main focus of thisstudy and was just performed on a subset of samples. In this subset, theassessment of TILs by three observers had an ICC of 0.92 to 0.97. It isnot clear at present if the methods for TIL evaluation would lead tosimilar results in a multicenter setting. However, even our single-center evaluation was performed by randomly assigned pathologists.Recently, a first guideline paper was published for further standard-ization of TIL evaluation.33
In summary, we prospectively validated the relevance of TILs andmRNA markers as response predictors in a large clinical trial. Interest-ingly, the effect size measured as OR was in a similar range for LPBC(OR, 2.92; 95% CI, 1.98 to 4.31; P � .001) and hormone receptorstatus (OR, 2.78; 95% CI, 1.84 to 4.20; P � .001). This suggests thatafter further international standardization, TILs could become anadditional parameter for chemotherapy response prediction, with an
importance similar to that of the established parameter of hormonereceptor status.
AUTHORS’ DISCLOSURES OF POTENTIAL CONFLICTSOF INTEREST
Disclosures provided by the authors are available with this article atwww.jco.org.
AUTHOR CONTRIBUTIONS
Conception and design: Carsten Denkert, Gunter von Minckwitz, Jan C.Brase, Ralf Kronenwett, Sherene Loi, Kristin Krappmann, ChristianJackisch, Michael Untch, Sibylle LoiblProvision of study materials or patients: Christian Schem, Peter Klare,Sherko Kuemmel, Peter Sinn, Christian Jackisch, Toralf Reimer, MichaelUntch, Sibylle LoiblCollection and assembly of data: Carsten Denkert, Jan C. Brase, BrunoSinn, Ralf Kronenwett, Berit Pfitzner, Wolfgang Schmitt, SilviaDarb-Esfahani, Keyur Mehta, Stephan Wienert, Christian Jackisch,Manfred DietelData analysis and interpretation: Carsten Denkert, Jan C. Brase,Stephan Gade, Ralf Kronenwett, Christoph Salat, Sherene Loi, ChristianSchem, Karin Fisch, Silvia Darb-Esfahani, Keyur Mehta, ChristosSotiriou, Stephan Wienert, Peter Klare, Fabrice André, FrederickKlauschen, Jens-Uwe Blohmer, Marcus Schmidt, Hans Tesch, SherkoKümmel, Peter Sinn, Christian Jackisch, Manfred Dietel, Toralf Reimer,Michael Untch, Sibylle LoiblManuscript writing: All authorsFinal approval of manuscript: All authors
REFERENCES
1. Gianni L, Pienkowski T, Im YH, et al: Efficacyand safety of neoadjuvant pertuzumab and trastu-zumab in women with locally advanced, inflamma-tory, or early HER2-positive breast cancer(NeoSphere): A randomised multicentre, open-label,phase 2 trial. Lancet Oncol 13:25-32, 2012
2. Baselga J, Bradbury I, Eidtmann H, et al:Lapatinib with trastuzumab for HER2-positive earlybreast cancer (NeoALTTO): A randomised, open-label, multicentre, phase 3 trial. Lancet 379:633-640,2012
3. Cortazar P, Zhang L, Untch M, et al: Patholog-ical complete response and long-term clinical bene-fit in breast cancer: The CTNeoBC pooled analysis.Lancet 384:164-172, 2014
4. Untch M, Fasching PA, Konecny GE, et al:Pathologic complete response after neoadjuvantchemotherapy plus trastuzumab predicts favorablesurvival in human epidermal growth factor receptor2–overexpressing breast cancer: Results from theTECHNO trial of the AGO and GBG study groups. JClin Oncol 29:3351-3357, 2011
5. von Minckwitz G, Schneeweiss A, Loibl S, etal: Neoadjuvant carboplatin in patients with triple-negative and HER2-positive early breast cancer(GeparSixto; GBG 66): A randomised phase 2 trial.Lancet Oncol 15:747-756, 2014
6. Sikov WM, Berry DA, Perou CM, et al: Impactof the addition of carboplatin (Cb) and/or bevaci-zumab (B) to neoadjuvant weekly paclitaxel (P) fol-lowed by dose-dense AC on pathologic completeresponse (pCR) rates in triple-negative breast cancer(TNBC): CALGB 40603 (Alliance). Presented at the
San Antonio Breast Cancer Symposium, December10-14, 2013 (abstr S5-01)
7. Denkert C, Loibl S, Noske A, et al: Tumor-associated lymphocytes as an independent predic-tor of response to neoadjuvant chemotherapy inbreast cancer. J Clin Oncol 28:105-113, 2010
8. Issa-Nummer Y, Darb-Esfahani S, Loibl S, etal: Prospective validation of immunological infiltratefor prediction of response to neoadjuvant chemo-therapy in HER2-negative breast cancer: A substudyof the neoadjuvant GeparQuinto trial. PLoS One8:e79775, 2013
9. West NR, Milne K, Truong PT, et al: Tumor-infiltrating lymphocytes predict response toanthracycline-based chemotherapy in estrogenreceptor-negative breast cancer. Breast Cancer Res13:R126, 2011
10. Yamaguchi R, Tanaka M, Yano A, et al: Tumor-infiltrating lymphocytes are important pathologicpredictors for neoadjuvant chemotherapy in patientswith breast cancer. Hum Pathol 43:1688-1694, 2012
11. Schmidt M, Hellwig B, Hammad S, et al: Acomprehensive analysis of human gene expressionprofiles identifies stromal immunoglobulin � C as acompatible prognostic marker in human solid tu-mors. Clin Cancer Res 18:2695-2703, 2012
12. Loi S, Sirtaine N, Piette F, et al: Prognostic andpredictive value of tumor-infiltrating lymphocytes ina phase III randomized adjuvant breast cancer trial innode-positive breast cancer comparing the additionof docetaxel to doxorubicin with doxorubicin-basedchemotherapy: BIG 02-98. J Clin Oncol 31:860-867,2013
13. Gu-Trantien C, Loi S, Garaud S, et al: CD4�follicular helper T cell infiltration predicts breastcancer survival. J Clin Invest 123:2873-2892, 2013
14. Ignatiadis M, Singhal SK, Desmedt C, et al:Gene modules and response to neoadjuvant chemo-therapy in breast cancer subtypes: A pooled analy-sis. J Clin Oncol 30:1996-2004, 2012
15. Bianchini G, Gianni L: The immune systemand response to HER2-targeted treatment in breastcancer. Lancet Oncol 15:e58-e68, 2014
16. Brahmer JR, Tykodi SS, Chow LQ, et al:Safety and activity of anti-PD-L1 antibody in patientswith advanced cancer. N Engl J Med 366:2455-2465, 2012
17. Hodi FS, O’Day SJ, McDermott DF, et al:Improved survival with ipilimumab in patients withmetastatic melanoma. N Engl J Med 363:711-723,2010
18. Wolchok JD, Kluger H, Callahan MK, et al:Nivolumab plus ipilimumab in advanced melanoma.N Engl J Med 369:122-133, 2013
19. Galluzzi L, Senovilla L, Zitvogel L, et al: Thesecret ally: Immunostimulation by anticancer drugs.Nat Rev Drug Discov 11:215-233, 2012
20. McShane LM, Altman DG, Sauerbrei W, et al:Reporting recommendations for tumor marker prog-nostic studies (REMARK). J Natl Cancer Inst 97:1180-1184, 2005
21. Wienert S, Heim D, Saeger K, et al: Detectionand segmentation of cell nuclei in virtual microscopyimages: A minimum-model approach. Sci Rep2:503, 2012
22. Wienert S, Heim D, Kotani M, et al: Cognition-Master: An object-based image analysis framework.Diagn Pathol 8:34, 2013
23. Denkert C, Loibl S, Kronenwett R, et al: RNA-based determination of ESR1 and HER2 expressionand response to neoadjuvant chemotherapy. AnnOncol 24:632-639, 2013
Denkert et al
990 © 2014 by American Society of Clinical Oncology JOURNAL OF CLINICAL ONCOLOGY
from 130.219.8.11Information downloaded from jco.ascopubs.org and provided by at UNIV MED DNSTRY NEW JERSEY on March 30, 2015
Copyright © 2015 American Society of Clinical Oncology. All rights reserved.

24. Bohmann K, Hennig G, Rogel U, et al: RNAextraction from archival formalin-fixed paraffin-embedded tissue: A comparison of manual, semiau-tomated, and fully automated purification methods.Clin Chem 55:1719-1727, 2009
25. Polley MY, Leung SC, McShane LM, et al: Aninternational Ki67 reproducibility study. J Natl Can-cer Inst 105:1897-1906, 2013
26. Hato SV, Khong A, de Vries IJ, et al: Molecularpathways: The immunogenic effects of platinum-based chemotherapeutics. Clin Cancer Res 20:2831-2837, 2014
27. Dieci MV, Criscitiello C, Goubar A, et al:Prognostic value of tumor-infiltrating lymphocyteson residual disease after primary chemotherapy for
triple-negative breast cancer: A retrospective multi-center study. Ann Oncol 25:611-618, 2014
28. Schalper KA, Velcheti V, Carvajal D, et al: Insitu tumor PD-L1 mRNA expression is associatedwith increased TILs and better outcome in breastcarcinomas. Clin Cancer Res 20:2773-2782, 2014
29. West NR, Kost SE, Martin SD, et al: Tumour-infiltrating FOXP3(�) lymphocytes are associatedwith cytotoxic immune responses and good clinicaloutcome in oestrogen receptor-negative breast can-cer. Br J Cancer 108:155-162, 2013
30. Salama P, Phillips M, Grieu F, et al: Tumor-infiltrating FOXP3� T regulatory cells show strongprognostic significance in colorectal cancer. J ClinOncol 27:186-192, 2009
31. Jacquemier J, Bertucci F, Finetti P, et al: Highexpression of indoleamine 2,3-dioxygenase in thetumour is associated with medullary features andfavourable outcome in basal-like breast carcinoma.Int J Cancer 130:96-104, 2012
32. Loi S, Michiels S, Salgado R, et al: Tumorinfiltrating lymphocytes is prognostic and predictivefor trastuzumab benefit in early breast cancer: Re-sults from the FinHER trial. Ann Oncol 25:1544-1550, 2014
33. Salgado R, Denkert C, Demaria S, et al: Harmoni-zation of the evaluation of tumor infiltrating lymphocytes(TILs) in breast cancer: Recommendations by an interna-tional TILs-working group 2014. Ann Oncol [epub aheadof print on September 11, 2014]
Affiliations
Carsten Denkert, Bruno V. Sinn, Berit M. Pfitzner, Wolfgang D. Schmitt, Silvia Darb-Esfahan, Stephan Wienert, Frederick Klauschen,and Manfred Dietel, Charité Universitätsmedizin Berlin; Carsten Denkert, German Cancer Consortium (DKTK); Peter Klare, Praxisklinikand Breast Center; Jens-Uwe Blohmer, St Gertrauden Krankenhaus and Charité Universitätsmedizin; Micheal Untch, Helios KlinikumBerlin-Buch, Berlin; Gunter von Minckwitz, Stephan Gade, Keyur Mehta, and Sibylle Loibl, German Breast Group, Neu-Isenburg; Guntervon Minckwitz, Women’s Hospital, University of Frankfurt; Hans Tesch, Bethanien Hospital, Frankfurt; Jan C. Brase, Ralf Kronenwett, KarinFisch, and Kristin Krappmann, Sividon Diagnostics, Cologne; Ralf Kronenwett, Heinrich-Heine University Düsseldorf, Düsseldorf; ChristianSchem, Christian-Albrechts Universität zu Kiel, Kiel; Christoph Salat, Onkologische Schwerpunktpraxis, Munich; Marcus Schmidt, Johannes-Gutenberg Universität Mainz, Mainz; Sherko Kümmel, Kliniken Essen-Mitte, Essen; Peter Sinn, University of Heidelberg, Heidelberg;Christian Jakisch and Sibylle Loibl, Sana Klinikum Offenbach, Offenbach; Toralf Reimer, Klinikum Südstadt, Rostock, Germany; Sherene Loi,Peter MacCallum Cancer Center, Melbourne, Victoria, Australia; Sherene Loi and Christos Sotiriou, Institute Jules Bordet, Brussels, Belgium;and Fabrice André, Institute Gustave Roussy, Villejuif, France.
■ ■ ■
GLOSSARY TERMS
CTLA4 (CD152): receptor on activated T cells that binds B7molecules with a higher affinity than CD28, downregulatingT-cell responses by inhibiting CD28 signaling.
immune checkpoint: immune inhibitory pathway that neg-atively modulates the duration and amplitude of immune re-sponses. Examples include the CTLA-4:B7.1/B7.2 pathway, andthe PD-1:PD-L1/PD-L2 pathway.
immunogenic: capable of inducing an immune response.
immunotherapy: a therapeutic approach that uses cellularand/or humoral elements of the immune system to fight adisease.
neoadjuvant therapy: the administration of chemotherapy priorto surgery. Induction chemotherapy is generally designed to decreasethe size of the tumor prior to resection and to increase the rate of com-plete (R0) resections.
pathologic complete response: the absence of any residual tu-mor cells in a histologic evaluation of a tumor specimen.
PD-1: programmed cell death protein 1 (CD279), a receptor expressedon the surface of activated T, B, and NK cells that negatively regulatesimmune responses, including autoimmune and antitumor responses.
PD-L1: programmed cell death 1 ligand 1 (CD274; also known as B7-H1), the major binding partner (ligand) for the PD-1 inhibitory im-mune receptor. PD-L1 is expressed on the surface of activated antigenpresenting cells, such as dendritic cells, and by many types of cancercells. Its expression is induced by the inflammatory cytokine interferon.
TILs in HER2-Positive and Triple-Negative Breast Cancers
www.jco.org © 2014 by American Society of Clinical Oncology 991
from 130.219.8.11Information downloaded from jco.ascopubs.org and provided by at UNIV MED DNSTRY NEW JERSEY on March 30, 2015
Copyright © 2015 American Society of Clinical Oncology. All rights reserved.

AUTHORS’ DISCLOSURES OF POTENTIAL CONFLICTS OF INTEREST
Tumor-Infiltrating Lymphocytes and Response to Neoadjuvant Chemotherapy With or Without Carboplatin in Human Epidermal Growth FactorReceptor 2–Positive and Triple-Negative Primary Breast Cancers
The following represents disclosure information provided by authors of this manuscript. All relationships are considered compensated. Relationships areself-held unless noted. I � Immediate Family Member, Inst � My Institution. Relationships may not relate to the subject matter of this manuscript. For moreinformation about ASCO’s conflict of interest policy, please refer to www.asco.org/rwc or jco.ascopubs.org/site/ifc.
Carsten DenkertStock or Other Ownership: Sividon DiagnosticsHonoraria: RocheResearch Funding: Sividon Diagnostics (Inst)Patents, Royalties, Other Intellectual Property: Inventor on Patent No.EP14153692.0
Gunter von MinckwitzEmployment: German Breast Group ResearchStock or Other Ownership: German Breast Group ResearchHonoraria: Amgen, AstraZeneca, RocheConsulting or Advisory Role: AstraZeneca, Abbvie, Celgene, NanoStringTechnologies, Pfizer, RocheResearch Funding: Pfizer (Inst), GlaxoSmithKline (Inst), sanofi-aventis(Inst), Amgen (Inst), Roche (Inst), Novartis (Inst), Celgene (Inst), Teva(Inst), Boehringer Ingelheim (Inst)Patents, Royalties, Other Intellectual Property: Inventor on Patent No.EP14153692.0
Jan C. BraseEmployment: Sividon DiagnosticsPatents, Royalties, Other Intellectual Property: Inventor on Patent No.EP14153692.0
Bruno SinnNo relationship to disclose
Stephan GadeNo relationship to disclose
Ralf KronenwettEmployment: Sividon DiagnosticsStock or Other Ownership: Sividon DiagnosticsPatents, Royalties, Other Intellectual Property: Inventor on Patent No.EP14153692.0
Berit PfitznerNo relationship to disclose
Christoph SalatNo relationship to disclose
Sherene LoiPatents, Royalties, Other Intellectual Property: Inventor on Patent No.EP14153692
Wolfgang SchmittNo relationship to disclose
Christian SchemConsulting or Advisory Role: Roche, AstraZenecaTravel, Accommodations, Expenses: Roche
Karin FischEmployment: Sividon Diagnostics
Silvia Darb-EsfahaniPatents, Royalties, Other Intellectual Property: Inventor on Patent No.EP14153692.0
Keyur MehtaNo relationship to disclose
Christos SotiriouPatents, Royalties, Other Intellectual Property: Inventor on Patent No.EP14153692.0
Stephan WienertEmployment: VMscopeStock or Other Ownership: VMscope
Peter KlareNo relationship to disclose
Fabrice AndréNo relationship to disclose
Frederick KlauschenNo relationship to disclose
Jens-Uwe BlohmerNo relationship to disclose
Kristin KrappmannEmployment: Sividon Diagnostics
Marcus SchmidtNo relationship to disclose
Hans TeschHonoraria: Roche, Novartis, Amgen
Sherko KümmelHonoraria: Roche, Teva, Celgene, NovartisConsulting or Advisory Role: Roche
Peter SinnConsulting or Advisory Role: Novartis, Genomic Health
Christian JackischConsulting or Advisory Role: Roche
Manfred DietelStock or Other Ownership: Sividon Diagnostics
Toralf ReimerNo relationship to disclose
Michael UntchNo relationship to disclose
Sibylle LoiblPatents, Royalties, Other Intellectual Property: Inventor on Patent No.EP14153692.0
Denkert et al
© 2014 by American Society of Clinical Oncology JOURNAL OF CLINICAL ONCOLOGY
from 130.219.8.11Information downloaded from jco.ascopubs.org and provided by at UNIV MED DNSTRY NEW JERSEY on March 30, 2015
Copyright © 2015 American Society of Clinical Oncology. All rights reserved.

Acknowledgment
We thank all patients, clinicians, and pathologists participating in the clinical studies and biomaterial collection and Britta Beyer, SylwiaHandzik, Ines Koch, Petra Wachs, and Christiane Rothhaar for their excellent technical assistance.
Appendix
Table A1. Genes of Interest/References Genes and Corresponding Primer/Probe Sequences
SequenceIdentifier Gene Probe Forward Primer Reverse Primer
1 CALM2 TCGCGTCTCGGAAACCGGTAGC GAGCGAGCTGAGTGGTTGTG AGTCAGTTGGTCAGCCATGCT2 CCL5 CTCTGCGCTCCTGCATCTGCCTC CGCTGTCATCCTCATTGCTACT TGTGGTGTCCGAGGAATATGG3 CD21 (CR2) CCCTGGCGGTTTGCAGATCCC GCCAATCGGATCACCAATG ACCACAAAGGACAGGAGCAAGT4 CD80 AGGCCAGCGCCAGAACCCAGA CAGGGAGGTGACCCGAATTA AAAGGGAAAGAGCACCAGAGTTAG5 CD8A CAAATGTCCCCGGCCTGTGGTC CAGGGAACCGAAGACGTGTT TAGACGTATCTCGCCGAAAGG6 CTLA4 CCTGGGCATAGGCAACGGAACCC TCATGTACCCACCGCCATACT GGCACGGTTCTGGATCAATT7 CXCL13 TGGTCAGCAGCCTCTCTCCAGTCCA CGACATCTCTGCTTCTCATGCT AGCTTGTGTAATAGACCTCCAGAACA8 CXCL9 CCACTAACCGACTTGGCTGCTTCCTCTAG AAAGGGAA CGGTGAAGTACTAAGC AACTGGGCACCAATCATGCT9 FOXP3 TGACAGTTTCCCACAAGCCAGGCTG GCGTGGTTTTTCTTCTCGGTAT TGGTGAAGTGGACTGACAGAAAAG
10 IDO1 CGCCTGTGTGAAAGCTCTGGTCTCC GCCTGCGGGAAGCTTATG GTACTTAGTCACGATTTGCAGATGGT11 IGKC AGCAGCCTGCAGCCTGAAGATTTTGC GATCTGGGACAGAATTCACTCTCA GCCGAACGTCCAAGGGTAA12 OAZ1 TGCTTCCACAAGAACCGCGAGGA CGAGCCGACCATGTCTTCAT AAGCCCAAAAAGCTGAAGGTT13 PD-1 (PDCD1) TGAGCCCCAGCAACCAGACGG CAACACATCGGAGAGCTTCGT GGAAGGCGGCCAGCTT14 PD-L1
(CD274)CAGAAGTGCCCTTTGCCTCCACTCAA CCCTAATTTGAGGGTCAGTTCCT CTCAGTCATGCAGAAAACAAATTGA
15 RPL37A TGGCTGGCGGTGCCTGGA TGTGGTTCCTGCATGAAGACA GTGACAGCGGAAGTGGTATTGTAC
TILs in HER2-Positive and Triple-Negative Breast Cancers
www.jco.org © 2014 by American Society of Clinical Oncology
from 130.219.8.11Information downloaded from jco.ascopubs.org and provided by at UNIV MED DNSTRY NEW JERSEY on March 30, 2015
Copyright © 2015 American Society of Clinical Oncology. All rights reserved.

Table A2. Clinicopathologic Data of GeparSixto Cohort
Characteristic
TIL Evaluation (N � 580) mRNA Analysis (n � 481)
No. % No. %
Age group, years� 50 338 58.3 283 58.8� 50 242 41.7 198 41.2
Tumor typeDuctal/other 570 98.3 475 98.7Lobular 10 1.7 6 1.2
Tumor grade1 to 2 207 35.7 171 35.63 373 64.3 310 64.4
ER/PR status (central IHC)ER negative/PR negative 420 72.4 341 70.9ER positive and/or PR positive 160 27.6 140 29.1
Receptor status combined (central IHC/SISH)HER2 negative and ER negative/PR negative (TNBC cohort) 314 54.1 255 53.0HER2 positive (HER2-positive cohort) 266 45.9 226 47.0HER2 positive and ER negative/PR negative 106 18.3 86 17.9HER2 positive and ER positive and/or PR positive 160 27.6 140 29.1
Clinical tumor stagecT1-2 496 85.5 413 85.9cT3-4 82 14.1 67 13.9Missing 2 0.3 1 0.2
Clinical nodal statuscN0 336 57.9 265 55.1cN� 232 40.0 206 42.8Missing 12 2.1 10 2.1
Type of chemotherapyPMCb 290 50.0 238 49.5PM 290 50.0 243 50.5
Pathologic response (ypT0 ypN0)No pCR 347 59.8 287 59.7pCR 233 40.2 194 40.3
Abbreviations: Cb, carboplatin; ER, estrogen receptor; HER2, human epidermal growth factor 2; IHC, immunohistochemistry; pCR, pathologic complete response;PM, paclitaxel plus nonpegylated liposomal doxorubicin; PR, progesterone receptor; SISH, silver in situ hybridization; TIL, tumor-infiltrating lymphocyte.
Table A3. Distribution of LPBC Tumors and Immune mRNA Groups in Complete Cohort and TNBC and HER2-Positive Subgroups
Group
TILs
mRNA Clustering
No. ofPatients
Non-LPBC LPBCNo. of
Patients
Immune GroupA (low)
Immune GroupB
(intermediate)Immune Group
C (high)
No. % No. % No. % No. % No. %
All tumors 580 438 75.5 142 24.5 481 87 18.1 257 53.4 137 28.5TNBCs 314 225 71.1 89 28.3 255 46 18.0 82 32.2 127 49.8HER2 positive 266 213 80.1 53 19.9 226 52 23.0 138 61.1 36 15.9
Abbreviations: HER2, human epidermal growth factor 2; LPBC, lymphocyte-predominant breast cancer; TIL, tumor-infiltrating lymphocyte; TNBC, triple-negativebreast cancer.
Denkert et al
© 2014 by American Society of Clinical Oncology JOURNAL OF CLINICAL ONCOLOGY
from 130.219.8.11Information downloaded from jco.ascopubs.org and provided by at UNIV MED DNSTRY NEW JERSEY on March 30, 2015
Copyright © 2015 American Society of Clinical Oncology. All rights reserved.

Table A4. Univariable and Multivariable Logistic Regression for Evaluation of Intratumoral TILs in Complete Cohort and TNBC and HER2-Positive Subgroups
Intratumoral TILs (per 10%)
Univariable Analysis Multivariable Analysis�
OR 95% CI P OR 95% CI P
Complete cohort 1.30 1.12 to 1.50 � .001 1.24 1.07 to 1.45 .006TNBC subgroup 1.22 1.03 to 1.43 .02 1.28 1.07 to 1.54 .007HER2-positive subgroup 1.47 1.05 to 2.08 .03 1.26 0.87 to 1.84 NS
Abbreviations: HER2, human epidermal growth factor 2; NS, nonsignificant; OR, odds ratio; TIL, tumor-infiltrating lymphocyte; TNBC, triple-negative breast cancer.�Including clinical parameters shown in Table 1.
Table A5. Correlation Between LPBC Status and pCR Rate in Different Subgroups of GeparSixto
Subgroup No. of Patients
pCR Rate (%)
P�All Patients Non-LPBC LPBC
Complete cohortBoth arms 580 40.2 33.8 59.9 � .001PM therapy 290 36.6 33.6 45.2 NSPMCb therapy 290 43.8 33.9 75.4 � .001
TNBC subgroupBoth arms 314 44.9 40.0 57.3 .006PM therapy 156 36.5 33.9 42.6 NSPMCb therapy 158 53.2 45.7 73.8 .002
HER2-positive subgroupBoth arms 266 34.6 27.2 64.2 � .001PM therapy 134 36.6 33.3 50.0 NSPMCb therapy 132 32.6 21.0 77.8 � .001
Abbreviations: Cb, carboplatin; HER2, human epidermal growth factor 2; LPBC, lymphocyte-predominant breast cancer; NS, nonsignificant; pCR, pathologiccomplete response; PM, paclitaxel plus nonpegylated liposomal doxorubicin; TNBC, triple-negative breast cancer.
�Non-LPBC versus LPBC; two-sided Fisher’s test.
Table A6. Interaction Between LPBC and Therapy in Complete Cohort and HER2-Positive and TNBC Subgroups
Treatment Group OR for pCR 95% CI P
Complete cohort (N � 580)Non-LPBC
PM 1.00PMCb 1.01 0.68 to 1.51 NS
LPBCPM 1.00PMCb 3.71 1.81 to 7.59 � .001
Interaction term 3.67 1.62 to 8.29 .002TNBC subgroup (n � 314)
Non-LPBCPM 1.00PMCb 1.64 0.96 to 2.81 NS
LPBCPM 1.00PMCb 3.81 1.55 to 9.35 .004
Interaction term 2.32 0.82 to 6.63 NSHER2-positive subgroup (n � 266)
Non-LPBCPM 1.00PMCb 0.53 0.29 to 0.98 .04
LPBCPM 1.00PMCb 3.5 1.1 to 11.5 .04
Interaction term 6.60 1.73 to 25.2 .006
Abbreviations: Cb, carboplatin; HER2, human epidermal growth factor 2; LPBC, lymphocyte-predominant breast cancer; NS, nonsignificant; OR, odds ratio; pCR,pathologic complete response; PM, paclitaxel plus nonpegylated liposomal doxorubicin; TNBC, triple-negative breast cancer.
TILs in HER2-Positive and Triple-Negative Breast Cancers
www.jco.org © 2014 by American Society of Clinical Oncology
from 130.219.8.11Information downloaded from jco.ascopubs.org and provided by at UNIV MED DNSTRY NEW JERSEY on March 30, 2015
Copyright © 2015 American Society of Clinical Oncology. All rights reserved.

A
B 100
80
60
40
20
0
100806040200
60
40
20
0
8070
6050
4030
20
1 41 81 121 161 201 241 281 321 361 401 441 481 521 561
Perc
enta
ge o
f TIL
s
580 Tumors
*LPBC
non-LPBC
Age
iTu
Ly
s t rLy
Intra
tum
oral
TIL
s
iTu
ly
Stromal TILs
Intratumoral TILsStromal TILs
No pCRpCR
Fig A1. (A) Correlation of stromal and intratumoral tumor-infiltrating lymphocytes (TILs) in GeparSixto. Stromal TILs typically have higher level than intratumoral TILs.Filled circles indicate patient cases of pathologic complete response (pCR). Variable patient age was added for improved visualization to reduce overlay of spots. (B)Levels of intratumoral and stromal TILs. All 580 tumors from GeparSixto were sorted first by ascending stromal TILs (circles) and then by ascending intratumoral TILs(triangles). For each tumor, stromal and intratumoral TILs are shown. Figure indicates that stromal TILs have higher values in majority of tumors and reach higher values.(*) Lymphocyte-predominant breast cancer (LPBC) status is mainly driven by stromal TILs; there was only one LPBC tumor that had high intratumoral and low stromalTILs. All other LPBC tumors were defined solely on basis of increased stromal TILs.
Denkert et al
© 2014 by American Society of Clinical Oncology JOURNAL OF CLINICAL ONCOLOGY
from 130.219.8.11Information downloaded from jco.ascopubs.org and provided by at UNIV MED DNSTRY NEW JERSEY on March 30, 2015
Copyright © 2015 American Society of Clinical Oncology. All rights reserved.

0Pe
rcen
tage
of S
trom
al T
ILs
TILs per mm2 Stromal Area
100
80
60
40
20
2,500 5,000 7,500 10,000
Fig A2. Validation of tumor-infiltrating lymphocytes (TILs) by automated image analysis and interobserver assessment; 29 tumors were selected from GeparSixtoto cover complete range of TILs. From each tumor, three representative stromal regions of interest (ROIs) were marked on digital slide. These regions were evaluatedby three pathologists and by automated image analysis; these pathologists assessed each ROI, and mean of three ROIs was used as value for tumor. Diagram showson y-axis pathologist assessment as mean and standard deviation (SD) of three pathologists for each tumor. For image analysis, mean and SD of three ROIs are shown.Therefore, SDs on y-axis indicate interobserver variance among three pathologists; SDs on x-axis indicate intratumoral heterogeneity of TILs based on image analysisof three ROIs. Those tumors with increased interobserver variance often also had increased intratumoral heterogeneity; these tumors were more often found inintermediate TIL range.
TILs in HER2-Positive and Triple-Negative Breast Cancers
www.jco.org © 2014 by American Society of Clinical Oncology
from 130.219.8.11Information downloaded from jco.ascopubs.org and provided by at UNIV MED DNSTRY NEW JERSEY on March 30, 2015
Copyright © 2015 American Society of Clinical Oncology. All rights reserved.

A
B
TNBC
HER2+
C A B
Stromal TILs (%)
LPBC
Stromal TILs (%)
LPBC
Immune group
Immune group
A C B
40
80
0
40
80
0
CD8A
CCL5
PD1
CXCL9
CTLA4
PDL1
IDO1
IGKC
CD21
CXCL13
FOXP3
CD80
PDL1
CTLA4
CD8A
CCL5
CXCL9
CXCL13
IDO1
PDL1
CD80
IGKC
FOXP3
CD21
Fig A3. Hierarchic clustering of 12 immune genes in (A) triple-negative breast cancer (TNBC) and (B) human epidermal growth factor receptor 2 (HER2) –positivesubgroups of GeparSixto. Corresponding levels of stromal tumor-infiltrating lymphocytes (TILs) and lymphocyte-predominant breast cancer (LPBC) status for eachtumor are shown in lower panel sections.
Denkert et al
© 2014 by American Society of Clinical Oncology JOURNAL OF CLINICAL ONCOLOGY
from 130.219.8.11Information downloaded from jco.ascopubs.org and provided by at UNIV MED DNSTRY NEW JERSEY on March 30, 2015
Copyright © 2015 American Society of Clinical Oncology. All rights reserved.

0.53 0.574 0.557 0.544 0.611 0.535 0.562 0.33 0.414 0.512 0.472 0.318
0.806 0.802 0.752 0.812 0.726 0.832 0.48 0.628 0.597 0.648 0.413
0.874 0.741 0.836 0.775 0.821 0.508 0.68 0.57 0.653 0.467
0.657 0.846 0.72 0.812 0.531 0.604 0.591 0.653 0.494
0.703 0.742 0.729 0.376 0.583 0.547 0.606 0.357
0.786 0.843 0.521 0.692 0.589 0.677 0.522
0.802 0.487 0.733 0.564 0.649 0.406
0.56 0.728 0.624 0.699 0.527
0.508 0.359 0.332 0.3
0.383 0.495 0.332
0.518 0.412
0.525
strLy CXCL9 CCL5 CD8A IDO1 PD1 PDL1 CTLA4 FOXP3 CD80 IGKC CXCL13 CD21
strL
yC
XC
L9C
CL5
CD
8AID
O1
PD
1P
DL1
CT
LA4
FOX
P3
CD
80IG
KC
CX
CL1
3C
D21
Fig A4. Correlation analysis of 12 immunologically relevant genes and stromal tumor-infiltrating lymphocytes (TILs). All genes showed positive correlation with oneanother and with stromal TILs; correlation coefficients are also shown. This positive correlation also included those genes with reported immunosuppressive function,such as PD-1, PD-L1, IDO1, and CTLA4.
TILs in HER2-Positive and Triple-Negative Breast Cancers
www.jco.org © 2014 by American Society of Clinical Oncology
from 130.219.8.11Information downloaded from jco.ascopubs.org and provided by at UNIV MED DNSTRY NEW JERSEY on March 30, 2015
Copyright © 2015 American Society of Clinical Oncology. All rights reserved.