turbulence effect on around a circular cylinder at ... · pdf filearound a circular cylinder...
TRANSCRIPT
NASA Contractor Report 362 2
Turbulence Effect on Around a Circular Cylinder at Subcritical Reynolds Numbers
Willy 2. Sadeh and Daniel B. Saharon
GRANT NSG-3 12 7 NOVEMBER 1982
https://ntrs.nasa.gov/search.jsp?R=19830005116 2018-05-17T04:43:22+00:00Z

NASA Contractor Report 3622
Turbulence Effect on Crossflow Around a Circular Cylinder at Subcritical Reynolds Numbers
Willy 2. Sadeh and Daniel B. Saharon Colorado State University Fort Collins, Colorado
Prepared for Lewis Research Center under Grant NSG-3 12 7
National Aeronautics and Space Administration
Scientific and Technical Information Branch
1982


TABLE OF CONTENTS Page
SUMMARY................. * . . . . . .
1.
2.
3.
4.
5.
6.
7.
8.
INTRODUCTION ................... 2
EXPERIMENTAL ARRANGEMENT. ............ 4 2.1 Wind Tunnel ................. 4 2.2 Circular Cylinder .............. 4 2.3 Turbulence-Generating Grid ......... 6
EXPERIMENTAL TECHNIQUE .............. 8 3.1 Separation Line Visualization ........ 8 3.2 Freestream Conditions ............ 8 3.3 Surface Pressure .............. 10 3.4 Blockage Correction ............. 12
FLOW ESTABLISHMENT ................ 15
RESULTS IN SMOOTH INCIDENT FLOW ......... 5.1 Surface Pressure Distribution ........ 5.2 Laminar Separation Angle .......... 5.3 Discussion of Pressure Distribution ..... 5.4. Parameters Affecting the Pressure
Distribution ................ 5.5 Laminar Drag Coefficient .......... 5.6 Discussion of Drag Coefficient .......
18 18 19 20
23 24 25
RESULTS IN TURBULENCE INCIDENT FLOW ....... 6.1 Incident Turbulence ............. 6.2 Mean Surface Pressure Distribution ..... 6.3 Favorable Pressure Gradient Region ..... 6.4 Minimum Pressure .............. 6.5 Adverse Pressure Gradient Region ...... 6.6 Base Region ................. 6.7 Pressure Rise Coefficient .......... 6.8 Turbulent Separation Angle ......... 6.9 Turbulent Separation Parameter ....... 6.10 Mean Turbulent Drag Coefficient .......
DISCUSSION OF RESULTS ..............
CONCLUDING REMARKS ................
REFERENCES ....................
FIGURES .....................
APPENDIX I - SURFACE PRESSURE COEFFICIENT IN TURBULENT INCIDENT FLOW ...........
APPENDIX II - BLOCKAGE CORRECTION ........
31 31 36 38 38 40 42 45 48 52 57
61
67
70
76
132
134
iii
1

II II I.. 11.1, m-1, -.-m.11.11 -.. I - .-,., .-- . . . . . . . . . . . . . . . -.... --
Paqe
APPENDIX III - FLOW PARAMETERS DATA . . . . . . . 136
APPENDIX IV - SURFACE PRESSURE DISTRIBUTION IN SMOOTH INCIDENT FLOW . . . . . . . . . . . . 138
APPENDIX V - DRAG COEFFICIENT IN SMOOTH INCIDENT FLOW . . . . . . . . . . . . . . . . . . . . 140
APPENDIX VI - TURBULENCE DATA AND SURFACE PRESSURE DISTRIBUTION IN TURBULENT INCIDENT FLOW . . . . . . . . . . . . . . . . . ...141
APPENDIX A - LIST OF SYMBOLS . . . . . . . . . . . 146
iv

TURBULENCE EFFECT ON CROSSFLOW AROUND A CIRCULAR CYLINDER AT SUBCRITICAL REYNOLDS NUMBERS
by Willy Z. Sadehl and Daniel B. Saharon" Colorado State University, Fort Collins, Colorado
SUMMARY
An investigation of the effect of freestream turbulence on the flow around a smooth circular cylinder at subcritical Reynolds numbers from 5.2~10~ to 2.09x10⁵ was conducted. Measurements show that the interaction of incident turbu- lence with the initial laminar boundary layer: (1) modifies the characteristics of the mean surface pressure distribu- tion; (2) induces an aft shift in the separation point ranging from 5 to 50° beyond the laminar separation angle of 80'; and, (3) reduces the mean drag coefficient to values between 97 and 46% of its nearly constant laminar counterpart. The extent of these changes depends on the particular Reynolds number-background turbulence combina- tion. These results demonstrate that a boundary-layer flow similar to that found in critical, supercritical and/or transcritical flow regimes is induced by turbulence at sub- critical Reynolds numbers and, hence, the effect of turbu- lence is equivalent to an effective increase in the Reynolds number. The change in the nature and properties of the boundary layer in the subcritical regime, consequent upon the penetration of turbulence into it, is in agreement with the model proposed by the vorticity-amplification theory.
lProfessor of Engineering and Fluid Mechanics, Department of Civil Engineering
"Research Assistant, ibid.

1. INTRODUCTION
The effect of freestream turbulence in crossflow about a circular cylinder in delaying the separation and in reduc- ing its drag at subcritical Reynolds numbers has long been recognized. This effect was first reported by Fage & Warsap in 1929 (ref. 1) and by Fage & Falkner in 1931 (ref. 2) in their pioneering experimental investigations and subse- quently was verified in numerous other studies (see, e.g., ref. 3). Fage & Warsap (ref. 1) found that the drag coeffi- cient of a smooth circular cylinder decreases when free- stream turbulence is superimposed by means of an upwind square-mesh rope netting. They further found out that the reduction in the drag coefficient at a given Reynolds number was higher as the rope netting was positioned closer to the circular cylinder. Soon thereafter, Fage & Falkner (ref. 2), using a similar experimental setup in the same wind tunnel and at the same subcritical Reynolds numbers, reproduced the drag reduction reported in ref. 1 and found, in addition, that turbulence in the incident stream effects a delay in the separation angle.
No information on the intensity and properties of the incident turbulence, and on the surface roughness of the circular cylinder are given in these two papers. Moreover, no explanation concerning the mechanism responsible for the interaction of the oncoming turbulence with the cylinder boundary layer and the resulting separation delay and drag reduction was proposed in either study. To date, as a matter of fact, a theory that addresses the role of free- stream turbulence in affecting the separation on and the drag coefficient of a circular cylinder at subcritical Reynolds numbers has yet to be advanced. The objective of the present investigation was to demonstrate that the vorticity-amplification theory offers a satisfactory expla- nation and proposes a suitable physical model for these effects of freestream turbulence. This theory is not reviewed here since the background literature is readily accessible (refs. 4,5,6). A summary of its basic physical ideas is, however, given below in order to point out the guidelines applied in conducting this investigation.
The vorticity-amplification theory suggests that freestream turbulence, no matter how small initially, exper- iences significant amplification as it is conveyed by the mean flow toward the stagnation zone of a circular cylinder. This turbulence amplification is governed by the stretching and accompanying streamwise biased tilting of cross-vortex tubes which are induced by the flow divergence around the circular cylinder. The volume and angular momentum of each cross-vortex tube are conserved throughout its stretching and tilting provided that viscous dissipation is neglected.
2

As a result, the scale of the tube decreases, its angular velocity (or vorticity) increases, the streamwise turbulent velocity amplifies and turbulent kinetic energy accumulates within each stretched cross-vortex tube. A fundamental tenet of the vorticity-amplification theory is that the amplification occurs at scales larger than the neutral scale of the stagnation flow. At scales smaller than this neutral scale, the turbulence dissipates more rapidly than it amplifies due to the viscous action.
The emergence of a coherent substructure near the stagnation zone of the body is the outcome of the stretching process and the preferred amplification of turbulence. This coherent substructure consists of a regular array of stand- ing cross-vortex tubes of approximately equal scales distri- buted spanwise and with their cores outside the circular cylinder boundary layer (ref. 6). Turbulent kinetic energy accumulates within the cells of this organized substructure which represents, in fact, an array of energy-containing eddies. Most of the turbulence amplification transpires at a most amplified scale characteristic of this coherent sub- structure which is generally greater than but commensurate with the thickness of the boundary layer. Discrete vortices (or eddies) are continuously drawn out from this coherent substructure and swept downstream by the mean flow around the body. These highly energetic eddies penetrate into the prevailing boundary layer, energize it and render it par- tially or even fully turbulent if it was initially laminar (ref. 6) or enhance the turbulence within it. In the case of an initial laminar boundary layer on a smooth circular cylinder at subcritical Reynolds numbers, the change in its nature necessarily fosters retardation of the separation and reduction of the drag.
This investigation focused on examining the effective- ness of freestream turbulence in modifying the surface pres- sure distribution, in delaying the separation on and in diminishing the drag coefficient of a smooth circular cylin- der in crossflow at subcritical cylinder-diameter Reynolds numbers ranging from about 5.2~10~ to 2.09x10⁵. In order to assess the extent to which the pressure distribution, the separation angle and drag coefficient are affected by free- stream turbulence, they were first measured in smooth (or laminar) incident flow. Freestream turbulence susceptible to experiencing amplification owing to the stretching mecha- nism was subsequently produced in a controlled fashion using an appropriate turbulence-generating grid. Finally, both the separation angle and the drag coefficient were deter- mined from the surface pressure distribution for a variety of turbulent incident flow conditions.
3
I
i -

2. EXPERIMENTAL ARRANGEMENT
2.1 Wind Tunnel
The experimental investigation reported herein was conducted in a low-speed closed-circuit single-return wind tunnel at the Fluid Dynamics and Diffusion Laboratory, Colorado State University. This wind tunnel has a 183 cm (6 ft) square cross section, a test section 27 m (88 ft) long and a contraction ratio of 9:l. The side panels and parts of the ceiling of the test section are made of high quality tempered glass and/or Plexiglas to facilitate flow visualization. Stable airspeeds up to about 36 m/s (120 ft/s) are generated by a 4-blade propeller driven by a 400 hp DC motor. Continuous variation of the airspeed is achieved by adjusting the pitch of the propeller blades and/or its motor speed. The freestream velocities corre- sponding to the cylinder-diameter Reynolds-number range of interest were adjustable with a resolution better than 5%. At the same time, the wind-tunnel turbulence intensity in an empty test section was about 0.4 to 0.45% within this free- stream velocity range. The wind tunnel is equipped with a computer-operated triaxial motorized traversing mechanism that was used to position any measuring probe with a resolu- tion of about 6.4 pm (0.25 mils).
2.2 Circular Cylinder
A circular cylinder 15.88 cm (6-l/4 in) in diameter D and 183 cm (6 ft) long made of light aluminum alloy was used. This cylinder was machined from a seamless pipe and consisted of three sections, one 51 cm (20 in) long and two each 66 cm (26 in) in length. In assembling these three sections together, all the joints were tightly sealed with silicone grease. After joining the three sections, the cylinder was rounded to within 0.50 mm (20 mils) and, sub- sequently, it was sandblasted, polished and, finally, coated with dead-black lacquer (3M Co., Nextel Velvet Coating, Series lOl-ClO). A uniform coating was ensured by wet spray- ing the paint while rotating the cylinder at constant rpm by means of a lathe. After the film dried, the cylinder was buffed to produce a smooth surface with a grainless finish of high luster. The final thickness of the coating was about 76 pm (3 mils) with an average roughness height k = 2.5 pm (0.1 mils) according to the specifications supplied by the manufacturer. An extremely smooth surface with a relative surface roughness k/D of about 1.6~10~~ was thus obtained. A sketch of the circular cylinder, in which the two systems of coordinates used-viz., Cartesian and polar- are shown, is displayed in Fig. 2.1. Note that the origin of the Cartesian system of coordinates is at the cylinder stagnation point while that of the polar system of coordinates is at the
4

cylinder center. The blockage coefficient, which is given by the ratio of the cylinder diameter D to the height h (or width) of the wind-tunnel square cross section D/h, was 0.087. This is also the cylinder diameter-to-span ratio (or slenderness) D/S of this cylinder since its span (or length) S was equal to the height (or width) of the wind-tunnel cross section.
The diameter of the circular cylinder was selected in order to secure a relatively thick stagnation-point laminar boundary layer at the subcritical Reynolds numbers of interest. In this case, the thickness &Q of the laminar boundary layer at the cylinder stagnation point is given by (ref. 5)
6Q = 1.2D/Re' , (2-l)
in which Re designates the cylinder-diameter Reynolds number based on the freestream velocity. Within the sub- critical Reynolds-number range from 5.2~10~ to 2.09x10⁵, the thickness of the stagnation-point laminar boundary layer varies from about 0.84 to 0.42 mm (33 to 16 mils). Thicken- ing of the theoretical laminar boundary layer along the cylinder circumference was estimated by means of the Blasius power-series method (ref. 7, pp. 168-173) up to a peripheral angle 8 = 80° (measured from the cylinder stagnation point). The thickness of the theoretical laminar boundary layer at this angle ranges from 1.38 to 0.69 mm (55 to 27 mils) with increasing Reynolds numbers from 5.2~10~ to 2.09x10⁵.
A total of 130 pressure taps 1.6 mm (l/16 in) in diameter were drilled along the midsection of the cylinder that extended over a length of 86.40 cm (34 in), viz, from Z = 43.20 to 43.20 cm. They were positioned as follows: (a) on the upwind face along the cylinder axis in the planes Z = 0, f7.60, f15.20, f22.80, f30.40 and f43.20 cm (0, f3, f6, f9, f12 and f17 in); (b) along the cylinder circumfer- ence at intervals of 5O from 8 = 0 to 30°, of loo from 6 = 40 to 100' and of 20° from Cl = 120 to 180° in the planes z = 0, f7.60, f15.20, +30.40 and +43.20 cm (0, f3, f6, +12 and +17 in). Their distribution is portrayed in Fig. 2.1. Plastic Tygon tubing 1.6 mm (l/16 in) I.D. was utilized to connect the pressure ports to a scanning valve.
The cylinder was installed across the wind-tunnel width 23 m (75 ft) downstream of the test-section entrance with its axis 61 cm (2 ft) above the wind-tunnel floor (at l/3 of the height of the wind-tunnel cross section). This posi- tioning of the cylinder was selected to facilitate its mounting and the flow probing. At this station, the cylin- der was exposed to uniform crossflow since the thickness of
5

the boundary layer along the wind-tunnel floor varied from about 38 to 28 cm (15 to 11 in) within the Reynolds-number range of interest.
The cylinder was mounted by means of collars attached to two supporting endplates (or flanges) as shown. in Fig. 2.1 which, in turn, were fastened to the wind-tunnel walls. Each endplate-collar assembly was 9.2 cm (3.62 in) wide. Gaps between the supporting flanges and the wind- tunnel walls were tightly sealed with tape to prevent leak- age of high pressure air from the stagnation zone into the near wake. All the pressure tubes were ducted through several holes in one of the end plate-collar assembly. These holes were sealed without constricting the tubes passing through them. The cylinder could be continuously rotated inside its collar by means of a manually operated rotation compound. Angular positioning of any pressure tap was possible with an accuracy of 0.5".
2.3 Turbulence-Generating Grid
Production of freestream turbulence (or vorticity) in a controlled manner was achieved using a mobile, special pur- pose turbulence-generating grid. This grid consisted of 24 vertical finely polished aluminum rods that spanned the height of the wind-tunnel cross section. Each rod was 1.27 cm (l/2 in) in diameter d and the mesh M (center-to- center interval between two rods) was adjustable. A mesh M = 6.35 cm (2-l/2 in) was used in this experiment and, hence, the open spacing between two rods was 5 cm (2 in). In terms of the cylinder diameter D, the mesh and the open spacing were 0.40 and 0.31D, respectively.
This mesh was selected in order to obtain a grid geometric solidity within the stable range. The geometric solidity (or blockage) u is defined as the ratio of the projected solid area of the grid to its total area. Then the solidity of the present grid reduces to the ratio of the rod diameter to the mesh-i.e., u = d/M-and its value was 0.20. This solidity is much below the unstable range which generally occurs for solidities greater than about 0.34 to 0.37 (refs. 8 (pp. 530-532),9,10). Reasonable lateral homo- geneity in both mean velocity and streamwise turbulence intensity was obtained as a result of this stable solidity (ref. 11).
The vertical orientation of the rods was chosen specifically to produce vorticity primarily in the direction perpendicular to the axis of the cylinder (y-direction) with turbulent velocity fluctuations in the streamwise direction (x-direction). This cross vorticity and its associated streamwise turbulent velocity are those components of
6

a general three-dimensional field most susceptible to undergoing amplification due to stretching in this flow situation. Anisotropic turbulence was thus deliberately generated in order to exploit the stretching mechanism of this crossflow about a cylinder.
The rod diameter was selected in order to ensure production of turbulence at scales much larger than the neutral scale of this stagnation flow about a circular cylinder in view of the selective amplification of turbu- lence at these scales. For this stagnation flow, the neutral wavelength A6 is given by (ref. 5)
ho = nD/Re' , (2.2)
and it decreases from 2.19 to 1.09 mm (0.09 to 0.04 in) with increasing cylinder-diameter Reynolds number from 5.2~10~ to 2.09x10⁵. Within this range of the cylinder-diameter Reynolds number, the Reynolds number of each rod of the grid, based on the rod diameter and the freestream velocity upwind of the grid, varied from 4000 to 17000. The Strouhal number S is about 0.21 at these rod Reynolds numbers (ref. 12). Most of the turbulent energy was consequently concentrated at a Strouhal scale As = d/S of about 60.50 mm y,'f" pi estimated under the frozen-pattern assumption
. It should be noted that the Strouhal scale is independent of the velocity when the Strouhal number remains constant with increasing rod Reynolds number as in this case. Turbulence was thus mainly produced at a scale about 28 to 56 times larger than the neutral scale depending upon the particular cylinder-diameter Reynolds number. The turbulence-generating grid therefore met the necessary criteria for producing the desired freestream turbulence.
This experiment was carried out with the turbulence- generating grid installed at three different distances up- wind of the cylinder stagnation point, viz., at x = 63.50, 111.13 and 158.75 cm (25, 43-3/4, and 62-l/2 in)? A sche- matic diagram of the experimental arrangement including all important dimensions, the turbulence-generating grid and the system of coordinates is displayed in Fig. 2.2. In addition, a still photograph of the test section showing the circular cylinder and the turbulence-generating grid mounted at a distance of 158.75 cm upstream of the cylinder is given in Fig. 2.3.

3. EXPERIMENTAL TECHNIQUE
3.1 Separation Line Visualization
Visualization of the separation line on the cylinder was conducted using a dry-surface coating method specifically developed for this purpose. This method is not restricted to any particular Reynolds-number range and it can be used for either laminar or turbulent incident flow. Furthermore, it supplies a clear permanent record of good photographic quality since the signature of the separation line is not affected by the removal of the airflow. coating technique
This dry-surface relies on the color reaction of a pH
indicator contained in a thin film with a suitable gas released into the recirculating flow within the cylinder wake. The outcome of this reaction is the formation of two sharply contrasting colored sections on the cylinder surface demarcated by a narrow transition band of several milli- meters width whose centerline approximates the location of the separation line. In this experiment, Congo Red indicator and ammonia gas were employed. Then the coatings of the separated and attached flow regions plain blue, respectively.
became deep red and The transition band between these
two colored sections never exceeded a width of about 7 mm (276 mils) corresponding to an arc of 5'. Separation angles indicated by this visualization technique were within f4% of their counterpart reduced from the mean wall pressure dis- tribution. All the details of this dry-surface coating method including its reliability testing are described in ref. 14.
Color 16 mm movies were shot at a speed of 24 fps (frames per second) utilizing a Bolex H-16 SBM reflex camera with a governor-controlled spring motor (Paillard, S-A.). High-speed color reversal films (Kodak Ektachrome EF 7242) with exposure indexes of ASA 80 (20 DIN) in daylight and ASA 125 (22 DIN) for Tungsten lighting (3200 K) were employed. Lighting was supplied by floodlights and spot- lights (Berkey Photo, Inc.) of fixed and variable focus equipped with built-in barn doors for generating light sheets. The composition and intensity of the lighting were adjusted in illumination.
each flow situation to produce the needed
3.2 Freestream Conditions
In order to provide a standard in presenting the results for both smooth and turbulent incident flows, the cylinder-diameter Reynolds number is defined herein in terms of a reference freestream velocity U,. The latter is the uniform velocity upstream of the cylinder and upwind of the turbulence-generating grid when it is present. This
8

experimental investigation was carried out at subcritical cylinder-diameter Reynolds numbers ranging from 5.2~10~ to 2.09x10⁵ (air at 20°C (68OF), kinematic viscosity v = 1.48~10'~ m2/s (1.59x10m4 ft2/s)) as earlier mentioned. The uniform freestream velocity corresponding to this Reynolds-number range varied from 4.9 to 19.5 m/s (16 to 64 ft/s).
Continuous monitoring of the uniform freestream velocity was accomplished using a Pitot-static tube of modified Prandtl type 3.2 mm (l/8 in) in outside diameter with an impact orifice 0.80 mm (l/32 in) (United Sensor and Control Corp. I Model PAC-12-KL). This Pitot-static tube, called hereinafter the reference tube, was installed along the wind-tunnel centerline 11.52 m (37.80 ft, 72.5D) upwind of the cylinder, as indicated in Fig. 2.2, and 1.22 m (4 ft) above the floor. The Reynolds number of this Pitot-static tube (based on its outside radius (1.6 mm (l/16 in)) varied from about 500 to 2100 within the experimental freestream velocity range. No viscous correction was thus necessary since its Reynolds numbers were much larger than 10 (ref. 15). The reading of the reference Pitot-static tube was further unaffected by the superimposed turbulence in the case of turbulent incident flow since it was positioned upstream of the turbulence-generating grid. There, the effect of prevailing turbulence, whose intensity was of the order of 0.4 to 0.45% (see Sect. 2.1), is completely negligible (refs. 16,17).
An electronic pressure meter (MKS Instruments Inc., MKS Baratron Type 77 with Type 77H Series Pressure Heads) was used to measure the dynamic pressure. This pressure meter is a differential micromanometer with an overall range of 30 mm Hg divided into eight ranges for higher accuracy and its resolution is 0.5 pm Hg. Its full scale DC output voltage for each range is 100 mV. This DC output voltage is linearly proportional to the pressure reading within 1 to 3 mV. It was measured by means of a digital integrating voltmeter (Dymec, Model 2401C) with a resolution of 1 I.IV. In conduct- ing this pressure measurement an integration time of 30 s was utilized. The averaging time was monitored by means of an electronic counter (Hewlett-Packard Co., Model 522B).
The stream temperature was continuously monitored by means of a shielded copper-constantan thermocouple located in the same plane as the Pitot-static tube as shown in Fig. 2.2. A digital temperature indicator (Doric Scientific Div., Trendicator Model 415A) was used to measure the thermocouple output with a resolution of 0.056OC (O.lOF). In addition, the turbulence intensity of the freestream flow was continuously monitored by means of a hot-wire anemometer installed in the same plane as the Pitot-static tube.
9

3.3 Surface Pressure
A survey of the uniformity in the stagnation pressure along the span of the cylinder midsection was first carried out in order to check the flow two-dimensionality. To this end, the stagnation pressure was monitored in smooth inci- dent flow in plane
of the cylinde: = ' o at 11 pressure taps along the
span midsection, i.e., over a distance extending from z = 43.20 to -43.20 cm which amounts to 47% of the cylinder span (183 cm). Measurement of the surface (or wall) pressure distribution in smooth and turbulent incident flows (i.e., without and with the turbulence- generating grid installed upstream of the cylinder) was conducted over half the cylinder circumference in the mid- plane z = 0 in view of its symmetric distribution. The surface static pressure was monitored in smooth incident flow at 18 pressure ports distributed from 8 = 0 to 180° without rotating the cylinder. Measurement of the surface mean static pressure in turbulent incident flow included five additional stations in the interval 100 to 140° in order to provide greater resolution in that region where separation was expected. The survey at these additional stations was performed by rotating the cylinder. Sequential selection of each pressure orifice was achieved by means of a scanning valve and the wall pressure was measured using a measurement system identical to that utilized to monitor the reference Pitot-static tube (an electronic pressure meter, an integrating digital voltmeter and an electronic counter, see Sect. 3.2).
In conducting the surface pressure measurements in turbulent incident flow, the objective was to learn the effect of the oncoming amplified turbulence upon the mean pressure distribution and, hence, upon the separation. Consequently, the local fluctuating pressure was not moni- tored. An averaging time of 30 s was nevertheless applied in measuring the mean pressure. This averaging time was determined based on recovering the flow stagnation pressure at the stagnation-point pressure tap (at 8 = OO). Further- more, the measurements were repeated several times and average values were deduced.
The surface pressure coefficient is given by
C P = [P(O) - P,l/wJ; I (3.1)
in which p(8) is the measured surface static pressure at any azimuthal angle 8, p
and unifgrm and U denote
velogity, the freestream
static pressure respectively, and p stands for the density of air in consistent units. Both freestream static pressure and uniform velocity were measured by the reference Pitot-static tube (see Sect. 3.2).
10

The foregoing relation was used in computing the pressure coefficient in smooth incident flow. Its use in a turbulent incident flow is, on the other hand, hampered by the presence of the turbulence-generating grid between the reference Pitot-static tube and the cylinder. The grid produces losses that are readily expressed in terms of the difference in the stream static pressure Ap, across it. Then the surface mean pressure coefficient in turbulent incident flow C' was computed, as according to thePrelationship
described in App. I,
C’ = c P P + ApJ%pD~, (3.2)
in which C is P
given by Eq. (3.1) and AP, = P, - P:, where p&, denotes the freestream static pressure downstream of the grid.
The difference in the static pressure across the grid APCD was measured by means of two identical Pitot-static tubes in the absence of the cylinder. One was the reference tube while the second probe was located downstream of the grid exactly at the stagnation point of the cylinder but in its absence. The turbulence intensity at this position never exceeded 4.5% for all three grid positions at the freestream velocities of interest. No turbulence correction was applied to the reading of the downstream Pitot-static tube since it amounts to less than 1% at this level of turbulence (refs. 16,17).
The form (or pressure) drag of the cylinder was estimated based on the measured wall pressure. Within the subcritical Reynolds-number range of interest, the friction drag (skin friction) is completely negligible since it amounts to less than 2% of the total drag (refs. 2,18,19). Then the sectional cylinder drag coefficient was computed for both smooth and turbulent incident flows by integrating the measured pressure distribution according to the relationship
cD = % cp c0se de , (3.3)
where C is given by either Eq. (3.1) or (3.2) depending upon thePnature of the oncoming flow. A modified trapezoi- dal rule for unequal intervals determined by the spacing of the pressure taps was used to numerically evaluate the drag coefficient.
11

I. I I .
3.4 Blockage Correction
The blockage effect (wall interference effect) was accounted for in reducing the data collected in smooth inci- dent flow. It is apparent that the correction method advanced by Allen & Vincenti (ref. 20) is thus far the best available and the most widely used despite its inherent limitations (refs. 21,22,23). This correction method was advanced for an airfoil placed on the centerline of a wind tunnel in compressible flow, but it also applies at low speed (for the flow of an incompressible fluid). This method is particularly suited for correcting the drag coef- ficient of a circular cylinder when the blockage coefficient is smaller than 0.10 (ref. 22) and even it can be applied when the cylinder axis is not exactly located on the wind- tunnel centerline (ref. 23). For these reasons and for the sake of facilitating comparison with other germane results, the Allen-Vincenti correction technique was adopted herein.
The correction formulas for the freestream velocity and the drag coefficient are expressed at low velocity (i.e., in a flow of an incompressible fluid) in terms of their mea- sured counterparts (U, and CD) and the blockage coeffi- cient (D/h) by the relationships (ref. 20, Eqs. (94); see APP. II)
upJoD = 1 + 0.25CD(D/h) + 0.82(D/h)" , (3.4)
and
CC/CD = 1 - 0.50CD(D/h) - 2.467(D/h)i , (3.5)
in which the asterisk denotes corrected values and the measured drag coefficient CD is given by Eq. (3.3). It follows that the correction for the Reynolds number is then exactly the same a2 for the freestream velocity expressed by Eq. (3.4), i.e., Re/Re = LIZ/U,.
The corrected pressure coefficient "Z
was computed according to the relation (ref. 21; see App. II)
‘C;; - wcp - 1) = (UyJ,)‘” , (3.6)
where the freestream velocity ratio is given by Eq. (3.4). This equation is obtained under the condition that the difference between the wall static pressure p(e 1 and the flow stagnation pressure p is the same in both the unrestricted and constrained0 streams, i.e., P*(e) - P:, = P(e) - P,. As a result, this correction for the pressure
12

coefficient depends solely on the correction for the freestream velocity.
It is important to stress that not all possible interference effects are accounted for by this blockage cor- rection. The latter is more dependable when the drag coef- ficient is almost constant with varying Reynolds number (ref. 21) such as in the present smooth incident flow. Con- sequently, the blockage correction was consistently applied solely to the data obtained in smooth incident flow. In reducing the data obtained in turbulent incident flow, the blockage correction was not applied in view of the drastic variation in the drag coefficient with changing Reynolds number.
Another semiempirical correction scheme for a body in a smooth incident stream at low velocity proposed by Maskell (ref. 24) deserves attention in the light of its relative popularity. This method was initially developed for a sharp-edged bluff body where the origin of the wake is independent of the wind-tunnel constraint (i.e., for a bluff body with sharp-edge separation) and uniform base pressure. The wind-tunnel wall interference is represented in this method by a simple increase in the velocity of the unre- stricted stream in view of the underlying assumption of invariance under constraint of the pressure distribution on the body. Then the corrected values of the pressure and drag coefficients, the base pressure parameter, the free- stream velocity and the Reynolds number are related to their measured counterparts by the expression (ref. 24, Eq. (17))
(c;-l)/cp-l) = c;/c* = k*z/,$ = (Uz/U,)-' = (R*e/Re)-', (3.7)
in which the corrected values are also denoted by the aster- isk. In the foregoing relationship, eter k* = 1 - C
the base pressure param- pb' where 'pb designates the base pressure
coefficient. The corrected base k*z = 1 - c*
pressure parameter pb is further approximated by successive itera-
tions according to the formula (ref. 24, Eq. (16))
ky = k' [I + ,;p"',]-I, (3.8)
where k** is the nth approximation to the base pressure paramete: and when the zeroth approximation is the measured base pressure parameter k'.
13

The Maskell method of correcting the drag coefficient was satisfactorily substantiated for blockage coefficients up to 0.045 (ref. 25) but it was used even for a blockage coefficient of 0.20 (ref. 26). On the other hand, this approach apparently leads to erroneous correction for the pressure coefficient and, consequently, an empirical modifi- cation was proposed to this end in Ref. 25. It is further important to point out that slight variations of the Maskell technique have been applied to correct the drag coefficient for a variety of bluff bodies without meeting the essential conditions of sharp-edge separation and uniform base pres- sure (refs. 2X,26), despite the admonition of its own pro- ponent (ref. 24). In that vein, the Maskell method was applied in the present study to selected cases in smooth incident flow in order to illustrate the disparities that can occur in the values of the various corrected flow parameters when different correction methods are used.
14

4. FLOW ESTABLISHMENT
The investigation of the pressure distribution along the cylinder surface was conducted in smooth and turbulent incident flows at exactly the same five subcritical Reynolds numbers. Smooth (or laminar) incident flow is the approach- ing crossflow in the absence of a turbulence-generating grid upwind of the cylinder while turbulent incident flow is the oncoming crossflow in the presence of a turbulence- generating grid. As previously mentioned, the Reynolds number was based on the cylinder diameter and the uniform freestream velocity upstream of the cylinder and/or the turbulence-generating grid. The five cylinder-diameter Reynolds numbers Re and their corresponding freestream velocities U,, which are listed in Table A.III.l in App. III, are : 5.2x10=', 9.4x10⁴, 1.25x10⁵, 1.67x10⁵, 2.09xlOa and 4.9, 8.8, 11.7, 15.6, 19.5 m/s (16, 28.8, 38.4, 51.2, 64 ft,'s), respectively.
The results obtained in smooth incident flow are presented in their corrected form according to the Allen- Vincenti method unless otherwise mentioned. The corrected cylinder-diameter Reynolds numbers R*e and uniform freestream velocities UC, which are also tabulated in Table A.III.l, App. III, are: 5.4x10⁴, 9.7x10", 1.29x10⁵, 1.72x10⁵, 2.14~10~ and 5, 9, 12, 16, 20 m/s (16.5, 29.6, 39.5, 52.6, 65.7 ft,'s), respectively. In addition, the thickness of the laminar boundary layer at stagnation point 6, (see Eq. (2.1)) and the neutral scale A, (vid., Eq. (2.2)) cor- responding to these five Reynolds numbers (uncorrected) are given in Table A.III.2, App. III, for convenience. Their dimensionless values defined in terms of the cylinder radius R-viz., hQ = 6g./R and A, = ha/R-are also summarized there.
The correction for the uniform freestream velocity and Reynolds number was always smaller than 3%. Higher cor- rected values, amounting from 5.8 to 7.1% with increasing freestream velocity, were consistently obtained when the Maskell correction method was applied. As a result, the corrected uniform freestream velocities and Reynolds numbers computed by means of the Maskell scheme were 3.3 to 4.5% larger than their counterparts calculated according to the Allen-Vincenti method. The corrected freestream velocities and Reynolds numbers obtained by the Maskell scheme, along with the ratio of the corrected freestream velocity computed by Maskell scheme to its counterpart obtained by Allen- Vincenti method UiM/Uz, are given in Table A.III.3, App. III, for the sake of illustrating their overestimation with respect to their values computed by the Allen-Vincenti method.
15

Cartesian and polar coordinates, which are shown in Fig. 2.1, are used in presenting the results. The latter coordinates are employed in reporting the surface pressure distribution and for pointing out particular azimuthal positions of interest along the cylinder circumference. Dimensionless Cartesian coordinates are defined in terms of the cylinder radius R (7.94 cm) by
5, "y, "z = x/R, y/R, z/R (4.1)
A prerequisite in carrying out this investigation was to ensure that the oncoming freestream turbulence was the sole factor affecting the separation and the drag coeffi- cient. In order to meet this goal it was imperative: (1) to minimize the effect of the surface roughness; (2) to assess the flow two-dimensionality; and, (3) to alleviate leakage of high pressure air from the stagnation zone into the near wake through the cylinder end gaps. The last two conditions were checked in smooth incident flow.
Surface roughness induces an increase in the separation angle and an associated decrease in the drag coefficient. The relative surface roughness of the cylinder used was 1.6~10~~ (see Sect. 2.2) which is one of the lowest reported (ref. 27). In the light of this extremely fine relative surface roughness, one can assume that this cylinder was in practice perfectly smooth.
Inspection of the flow two-dimensionality was confined, to the cylinder midsection which extended from z = 5.44 to -5.44 as shown in Fig. 2.1. Reasonable two-dimensional flow was expected since the effective slenderness (diameter-to- span ratio) of this cylinder was 0.087 (see Sect. 2.2). The criterion in ascertaining the flow two-dimensionality was a spanwise variation of the stagnation pressure coefficient C (C at f%fil?ed
13 = 0") not larger than 1%. This condition was over the entire Reynolds-number range. For
example, at a Reynolds number of 9.7~10~ the maximum span- wise variation of the stagnation pressure coefficient along the cylinder midsection span amounted to 0.7%. Thus, the flow along the cylinder midsection was satisfactorily two-dimensional.
Prevention of leakage of high pressure air from the stagnation zone into the near wake was achieved by succes- sively sealing all potential pathways through the cylinder end gaps until no further change in the base pressure coef- ficient was detected. The base pressure is taken herein, as commonly done (ref. 28), as the surface pressure at the base point Bb = 180' notwithstanding that the surface pres- sure within the base region (i.e., the separated flow region
16

or the wake region) generally exhibits a slight variation. One can define the base pressure by an average of the sur- face pressure over the entire base region or over a selected arc around 0 = 180° in order to account for its variation. Such an average base pressure leads to an underestimation in the drag coefficient (ref. 29) and, hence, it is advisable not to use it. Tests for the leakage were conducted at all five Reynolds numbers and in every case the sealing caused the base pressure to level off. For instance, at a Reynolds number of 1.29x10⁵ the base pressure leveled off at an abso- lute value about 8.5% larger than its initial value, e.g., the sealing reduced the base pressure coefficient from -0.767 to -0.832. Similar leveling of the base pressure was obtained at the other Reynolds numbers and, therefore, the leakage was adequately controlled. In conclusion,X!z ~~0~ COM- ditioti we,te. deemed adequaak @tr ccnduting the dc%Lted expeLmental inve,4n;tigtion.
17
5. RESULTS IN SMOOTH INCIDENT FLOW
5.1. Surface Pressure Distribution
The surface pressure distribution was measured in smooth incident flow in order to establish a reference against which to assess the effect of turbulence. The tur- bulence intensity of the smooth incident flow varied from 0.56 to 0.42% with increasing Reynolds number (corrected) from 5.4~10~ to 2.14~10~ and, thus, its level was of the same magnitude as that in an empty test section (0.4 to 0.45x, see Sect. 2.1).
The distribution of the corrected (Allen-Vincenti method) pressure coefficient C*
P with increasing azimuthal
angle 8 over half of the cylinder at each of the five sub- critical Reynolds numbers is shown in a polar form in Fig. 5.1 and in conventional form in Figs. 5.2 and 5.3. Positive and negative pressure coefficients are represented in the polar plots by inward and outward pointing arrows, respec- tively. For the sake of illustration, the pressure coeffi- cient distribution computed according to potential flow theory-i.e., a cylinder in uniform flow, C = 1 - 4sin26 (ref. 30)-is depicted in Fig. 5.1(a). The mea&red pressure coefficients (Cp) and their corrected values according to both Allen-Vincenti (Ci) and Maskell (CgM) methods, along with the corresponding ratios of the latter to the former ( c;/cp and CgM/Cp ), are given at all the five Reynolds numbers in Table A-IV.1 in App. IV. In addition, the ratios of the corrected values obtained by the Maskell scheme to those obtained by the Allen-Vincenti method (Cl,/Cc) are also tabulated in this table. The correction in the pressure coefficient varies with the azimuthal angle. It amounted from 0.1 to about 6% with increasing peripheral angle from 5 to 25O. The largest correction of about -26 to -28% was consistently found at 40'. Within azimuthal angles from 80 to 180" the correction was about -11%. Corrections larger than even twice those were invariably obtained by means of the Maskell scheme. It is thus apparent that the Maskell method overestimates the blockage effect for a bluff body.
The minimum pressure coefficient C* pm
was constantly monitored at an azimuthal angle of about 70° while the base region (i.e., the region of nearly constant pressure) started at an azimuthal angle of about 80° at all five sub- critical Reynolds numbers. These features are clearly exhibited by the distributions of the pressure coefficient portrayed in Figs. 5.1 to 5.3. Note that the angular posi- tion of minimum pressure is marked off in Figs. 5.2 and 5.3
18

by em- Within the base region, the change in the pressure coefficient with respect to the base pressure coefficient
% (Cp at eb = 180') amounted from -4 to about +5.6x.
Similar pressure distributions are reported in refs. 7 (p. 21), 19 & 31 at comparable subcritical Reynolds numbers. A minimum pressure near 70' is reported in refs. 7 (p. 21) & 31 at a Reynolds number of 1.9x10⁵ while at a Reynolds number of lo5 a minimum in the pressure at about 65O is reported in ref. 19. Inspection of the pressure coefficient distributions given in these three references reveals that the base region always starts at an angle of about 80°.
5.2 Laminar Separation Angle
The separation angle es was estimated based on the distribution of the pressure coefficient since the skin friction was not measured. Recall that the friction drag is about 2% of the total drag within this Reynolds-number range (see Sect. 3.3). Although the separation evolves over a relatively narrow finite region, the point at which the skin friction vanishes is considered as the separation angle since it indicates the completion of the boundary layer separation. At the same time, the angle of zero skin fric- tion corresponds to the beginning point of the base region (refs. 2,19). This criterion was applied here and, hence, the angular position where the base region begins was taken as the separation angle. Examination of the pressure coef- ficient distributions displayed in Figs. 5.2 to 5.3 reveals, according to the foregoing criterion, a laminar (or smooth flow) separation angle es of about 80° at all five subcrit- ical Reynolds numbers. Note that the separation angle is marked off by es in these figures.
This separation angle was further confirmed by the dry-surface coating visualization of the separation line. At all Reynolds numbers, a separation angle of about 80° within f2O (f2.5%) was consistently indicated by the visual- ization. A sample of the separation line disclosed by the visualization is shown in the black-and-white still photo- graph given in Fig. 5.4 which was reproduced from a color movie. The separation line is delineated by the transition band between the deep red separated flow region and the plain blue attached flow region. In the black-and-white still, the red and blue regions are represented by the light and dark areas which are denoted by R and B, respectively. A scale marking off the azimuthal angle at 5O intervals, with its origin at the stagnation point, is incorporated in the still for convenient estimation of the separation angle.
19
A similar laminar separation angle is reported in the literature for a nominally smooth cylinder at subcritical Reynolds numbers. For instance, a laminar separation point of about 81° is given in ref. 7 (p. 173). Laminar separation angles varying randomly between 73 and 84O are reported in ref. 19 at Reynolds numbers (measured) ranging from 6~10~ to 2x10⁵ for a cylinder with a relative surface roughness of 1.33x10⁻⁵. In ref. 32, a laminar separation angle between 80 to 85O is reported for Reynolds numbers (measured) of lo4 to 10s. In the oft-cited early investigation of Fage & Falkner (ref. 2), a laminar separation point of about 81° is reported at Reynolds numbers (measured) ranging from 6~10~ to 1.06~10~ for a cylinder 7.44 cm (2.93 in) in diameter, and of 78O at a Reynolds number of 1.06~10~ for a cylinder 14.96 cm (5.89 in) in diameter. On the other hand, extremely large separation angles of 130 and 140° are reported for the latter cylinder at Reynolds numbers (measured) of 2.12~10~ and 1.66x10⁵, respectively, in a nominally smooth incident flow. It is suspected that these two large separation angles were induced by some unreported changes in the turbulence level of the incident flow and/or by the cylinder surface roughness. The lack of a better agreement among the various results can be attributed, in all likelihood, to differences in the cylinder surface roughness, the blockage coefficient, the turbulence level of the nominally smooth incident cross- flow, the experimental conditions (e.g., the leakage) and procedure. One cannot, unfortunately, estimate these effects due to the want of sufficient information. At the present time, the accepted value of the laminar separation angle in a smooth incident flow at subcritical Reynolds numbers up to 2~10~ is apparently about 80° (ref. 28). Thus, Xhe tirninatc depahdtion angle. 06 aboti 80° meanuhed in tti expekment h in agkeemcnt uLth ia cammolzey uccepted vah~e.
5.3 Discussion of Pressure Distribution
Comparison of the pressure distribution obtained in this study with those of other investigations is of interest for the purpose of corroboration. To this end, the measured pressure coefficient distributions on a smooth circular cylinder in a smooth incident crossflow at similar subcriti- cal Reynolds numbers reported by Fage & Falkner (ref. 2), Achenbach (ref. 191, Modi & El-Sherbiny (ref. 26), Batham (ref. 33) and Guven et al. (ref. 34) were used. The pres- sure coefficient distributions were grouped into five classes based on close correspondence of the Reynolds numbers given in these studies to those in the present test, viz., within *15x. These five groups are outlined in Table 1 below in which the measured and corrected cylinder-diameter Reynolds number (Re and Rg), the blockage coefficient (D/h), the relative surface roughness (k/D), the cylinder slenderness (D/S) and the freestream turbulence
20

intensity (TUT) of the approaching nominally smooth flow are listed for each one of these five studies and for the present test. No information concerning the surface roughness is supplied in these papers except by Achenbach (ref. 19). Only the overall appearance of the surface is described in the other studies as 'highly polished' (ref. 2), 'smooth as machined' (ref. 33) or 'smooth to the touch' (ref. 34). In ref. 26 no mention of the surface roughness is made. Data on the freestream turbulence inten- sity is always provided except by Fage & Falkner (ref. 2). Lack of information is denoted in Table 1 by NR which means not reported. Whenever the reported data was not corrected for the blockage effect, as annotated in Table 1 below by UC (means uncorrected), the Allen-Vincenti correction method was applied for standardization's sake. Information about preventing leakage of high pressure air from the stagnation zone into the near wake is not reported in any of these studies.
Source
TABLE 1. CYLINDER DATA SUMMARY
Ref. Re R$ D/h k/D D/S Turn BC Fig.
(x10-d) (%) (x105) (%) (%) NO.
Present Test 5.2 5.4 0.7 1.6 0.7 0.56 C Modi & El-Sherbiny 26,Fig. 1 5.0 5.2 9.0 NR 12.0 0.07 UC 5.5 Fage & Falkner 2,Tb. III* 6.0 6.1 6.1 NR 6.1 NR UC
Present Test 9.4 9.7 a.7 Modi & El-Sherbiny 26,Fig. 1 8.0 8.2 9.0
Fage & Falkner 2,Tb. 111" 8*-3-8.5-+ 10.6 10.8
Achenbach 19,Fig. 3 10.0 10.7 16:7
1.6 8.7 0.46 C NR 12.0 0.07 UC 5.6(a) NR NR 1'/3
,i;; ,!I fi 5.6(b)
Present Test Batham Fage & Falkner
12.5 12.9 8.7 33,Fig. 1
III+ 10.9 11.1 5.0
2,Tb. 10.6 11.1 12.3
1.6 0.7 0.45 c NR 15.0 0.50 c 5.7 NR 12.3 NR UC
Present Test III+
16.7 17.2 6.7 1.6 8.7 0.44 c 5.8 Fage & Falkner 2,Tb. 16.6 17.2 12.3 NR 12.3 NR UC ~___
Present Test III+
20.9 21.4 8.7 1.6 8.7 0.42 C Fage & Falkner 2,Tb. 21.2 21.8 12.3 NR 12.3 NR UC 5.9 Guven et al. 34,Tb. 4.2 20.7 22.4 17.8 NR 32.4 0.20 C
Tb. means Table; BC means blockage correction; NR means nonreported; C means
corrected; UC means uncorrected; *2.93 in dia. cyl.; +5.89 in dia. cyl.
The distributions of the pressure coefficient C* P
over half of the cylinder for the cases listed in Table 1 are portrayed in Figs. 5.5 to 5.9 where they are identified according to their Reynolds number R% and blockage coeffi- cient. The latter is specified in view of its wide range
21

covered in these investigations, viz., D/h = 0.05 to 0.178. Examination of the pressure coefficient distributions reveals that ;the nati 06 Xhe p&eneti inweAA@a;tion atre btiica.Uy con.hXen.t with tione 05 0;the.h atudi~ except for the distribu- tions measured by Fage & Falkner (ref. 2) at Reynolds num- bers of 1.72~10~ and 2.18~10~ (vid., Figs. 5.8 & 5.9). Differences among the various distributions of the pressure coefficient are, however, observed at practically the same Reynolds numbers starting for the most part from a peri- pheral angle of about 60°.
In order to underscore the essential features of these differences, the variations of the pressure coefficients with increasing Reynolds number was examined at several selected azimuthal angles. To this end, the variations of: (1) the pressure coefficient in the favorable pressure gra- dient region at 0 = 30°; (2) the pressure coefficient at 0 = 7o", which generally corresponds to the point of minimum pressure coefficient; and, (3) the base pressure coefficient
%b (cP at 8 = 180°) obtained in the present test and in
the other five studies are displayed as a function of increasing Reynolds number in Fig. 5.10. For consistency's sake, the blockage coefficient for each case is given in this figure. The largest scattering is exhibited at any Reynolds number by the pressure coefficient at 8 = 70° even when the blockage coefficient is practically the same. For instance, a difference of about 24% is found between the results of Fage & Falkner (ref. 2, D/h = 0.061) and Batham (ref. 33, D/h = 0.05) at a same Reynolds number of about 11.1x10⁴. Larger discrepancies and opposite trends are observed as the difference among the blockage coefficients becomes greater. The differences between the pressure coef- ficients at 8 = 70° obtained in the present study and that reported by Guven et al. (ref. 34), on the one hand, and that given by Fage & Falkner (ref. 2), on the other hand, amount to 25 and 55x, respectively, when the attendant blockage coefficients are 0.087, 0.178 and 0.123. Smaller differences are observed for the base pressure coefficient and the smallest differences are found in the favorable pressure gradient region at an angle of 30°. It is interesting to note that the pressure coefficients reported by Fage SC Falkner (ref. 2) are the lowest in all cases except for the base pressure coefficients at Reynolds numbers larger than 1.5x10⁵ which are greater than all the others. The pressure coefficients obtained in the present investigation at these three azimuthal angles are in good agreement with those reported by Modi & El-Sherbiny (ref. 26) at corresponding blockage coefficients.
22

5.4 Parameters Affecting the Pressure Distribution
One cannot readily assess the reasons for the differences in the pressure coefficient distributions since they are induced by a variety of causes which act simulta- neously. These causes were, as a matter of fact, previously alluded to regarding the observed discrepancies in the laminar separation angle. The cylinder slenderness is not considered herein since its effect on the pressure distribu- tion is, apparently, completely negligible at subcritical Reynolds numbers (refs. 34,35). Leakage of high pressure air from the stagnation zone into near wake through the cylinder end gaps leads to higher pressure (less negative pressure) in the base region. No attempt to assess the con- tribution of the leakage to the observed differences in the pressure coefficient distributions was undertaken because of nonavailability of data.
Increasing blockage at a given Reynolds number promotes lower positive pressure coefficients and further reduction in the negative pressure coefficients provided that both the surface roughness and freestream turbulence level are un- changed (ref. 23,26,36). A similar effect occurs at constant blockage with increasing Reynolds number all else being the same. Removal of the blockage effect by means of a correc- tion scheme, as the one applied here, is not entirely suc- cessful in securing a unique pressure distribution at given Reynolds number. This is distinctly borne out by inspection of the distributions of the corrected pressure coefficient obtained at essentially the same Reynolds numbers but with different blockage coefficients displayed in Figs. 5.5 to 5.10. One thus must consider the relative surface roughness and the freestream turbulence level to better explain the discrepancies encountered in the pressure coefficient distributions.
Higher relative surface roughness induces at subcritical Reynolds numbers, all other factors being the same, a reduction (a more negative) in the minimum pressure coefficient, (refs. 1,27,34). On the other hand, its effect upon the pressure distribution within the base region is not yet clearly established. The pressure coefficient there can be either larger or smaller than that for a smooth cylinder depending on the particular subcritical Reynolds number (refs. 1,27). Freestream turbulence generally affects the pressure distribution in a manner similar to the surface roughness (refs. 1,2,26) provided that its scales are com- mensurate with the thickness of the prevalent laminar bound- ary layer (ref. 6). In view of the fact that in most of the cited studies the cylinder surface is only qualitatively classified as being 'highly polished' or 'smooth,' any reasonable estimation of the role played by this factor with
23

regard to the observed disparities in the pressure distributions is not feasible. Similarly, one cannot assess the effect of the freestream turbulence since no information concerning its scale structure is given and even its inten- sity is not reported in all the cases (e.g., Fage & Falkner, ref. 2).
When the Reynolds number, the relative surface roughness and the freestream turbulence level are compar- able, similar distributions of the corrected pressure coef- ficient are expected. This is clearly revealed by the pres- sure coefficient distributions obtained in the present experiment and by Achenbach (ref. 19) which are displayed in Fig. 5.6(b). These pressure distributions were obtained at Reynolds numbers of 9.7x10⁴ and 1.07x10⁵, relative surface roughnesses of 1.6~10~~ and 1.33~10-~, and freestream turbu- lence intensities of 0.46 and 0.7x, respectively (see Table 1). The pressure coefficients reported in these two cases are practically identical everywhere (within the limits of the experimental error) except in the neighborhood of the minimum pressure and within the adverse pressure gra- dient region (for 60° < 8 < 80°) as observed in Fig. 5.6(b). These differences can, in all likelihood, be ascribed to the limitation in the blockage correction. Recall that the blockage coefficient in Achenbach's experiment (ref. 19) was almost twice as great than that in the present study (0.087
0.167 vid Table 1). The largest disparities in the lressure'coeffycients are found between the results obtained in the present investigation and those given by Fage & Falkner (ref. 2) within the neighborhood of minimum pressure and the adverse pressure gradient region at Reynolds numbers of 1.72~10~ and 2.14~10~ (vid., Figs. 5.8 SC 5.9). The dif- ferent variations of the pressure coefficients given by Fage SC Falkner (ref. 2) strongly suggest that they are due to some unreported relative surface roughness and/or freestream turbulence. Recall that extremely large separation angles (140 and 130°) were reported by Fage SC Falkner (ref. 2) at these two Reynolds numbers.
5.5 Laminar Drag Coefficient
The sectional laminar drag coefficient CDJI was computed at each Reynolds number in order to establish a useful datum for judging the extent to which its value is affected by turbulence. Computation of the drag coefficient was accomplished by integrating the measured surface pres- sure distribution according to Eq. (3.3). This drag coeffi- cient represents solely the form (or pressure) drag which amounts to more than 98% of the total drag within the present subcritical Reynolds-number range, as previously mentioned (refs. 2,18,19).
24

Variations of the measured and corrected (Allen-Vincenti method) drag coefficients (CDs and C&) with increasing measured and corrected Reynolds number (Re and Rg) are dis- played in Figs. 5.11 and 5.12, respectively. The measured drag coefficients (CDs) and its corrected values obtained by both Allen-Vincenti (C&) and Maskell (CGXM) schemes, along with the corresponding ratios of the corrected to measured values ($,/CD, and C&,M/CDa), are tabulated in Table A.V.l in App. V. In addition, the ratios of corrected drag coef- ficients obtained by Maskell scheme to those computed by Allen-Vincenti method (CsaM DR /C* ) are also given in this table. Values of the measured drag coefficient CDR ranging from 1.07 to 0.93 were obtained with increasing Reynolds number Re from 5.2~10~ to 2.09x10⁵, i.e., a decrease in the drag coefficient of about 13% over a fourfold increase in the Reynolds number as shown in Fig. 5.11. The drag coeffi- cients corrected by the Allen-Vincenti method Cka varied from 1.0 to 0.87 over the corresponding range of the cor- rected Reynolds number from 5.4~10~ to 2.14~10~ as observed in Fig. 5.12. Thus, the blockage correction amounted to about 6.5%. Larger corrections of 11 to 13% were obtained in applying the Maskell method (see App. V). These results, which exhibit a trend similar to that for the corrected pressure coefficient, further reinforce the conclusion that the Maskell scheme leads to overestimation of the blockage correction for a bluff body.
5.6 Discussion of Drag Coefficient
The drag coefficients found in the present experiment were further compared with those obtained in several other investigations in a nominally smooth incident flow at corresponding subcritical Reynolds number in order to gain a better perspective. In addition to the findings presented in the five studies listed in Table 1, drag coefficients reported by Fage SC Warsap (ref. 1), Giedt (ref. 3), Wieselsberger (ref. 37), Schmidt & Wenner (ref. 38), Bursnall & Loftin (ref. 39), Delany & Sorensen (ref. 40) and Polhamus (ref. 41) were employed for this purpose. These drag coefficients were obtained by: (1) integration of the pressure distribution, i.e., form drag (refs. 2, 3, 33, 34, 38 (see ref. 3), and 39); (2) integration of both pressure distribution and skin friction, i.e., total drag (ref. 19); and, (3) measurement of the total drag by means of a force balance (refs. 1,26,37,40,41). The ranges in the values of the drag coefficient and in the corresponding cylinder-diameter Reynolds number given in these twelve selected investigations along with those in the present test are summarized according to their increasing blockage
25

coefficient (D/h) in Table 2 below. In addition, the relative surface roughness (k/D) and the freestream turbu- lence (Turn) of the nominally smooth incident flow are listed, whenever reported, in this table. Lack of informa- tion is also denoted in this table by NR which means not
- reported in view of their relevance.
TABLE 2. CYLINDER DRAG COEFFICIENT DATA PART I. DRAG COEFFICIENT-MEASURED
Source Ref. Re CDs D/h k/D (x10-') (X) (xlOS)
Wieselsberger 37, Fig. 1 5.0 -20.0 1.20-1.10 - NR Schmidt & Wenner 38, Fig. 6 3.98-17.0 0.97-0.81 - NR Bursnall & Loftin 39, Fig. 9 20.0 1.2 2.0 NR Fage & Falkner 2, Tb. II* 6.0 -10.6 1.19-1.22 6.1 NR Present Test 5.2 -20.9 1.07-0.93 8.7 1.6 Modi & El-Sherbiny 26, Fig. 4 5.0 - 9.0 1.0 9.0 NR Giedt 3, Fig. 6.9 -21.2 1.18-0.41 11.1 NR Fage & Falkner 2, Tb.
6, II 10.6 -21.2 l-24-0.52 12.3 NR
Fage & Warsap 1, Fig. 1 4.7 -20.9 1.08-0.54 12.7 NR Achenbach 19, Fig. 9 4.0 -22.5 1.24-0.78 16.7 1% Guven et al. 34, Tb. 4.2 15.5 -20.8 1.31-1.22 17.8 NR Modi & El-Sherbiny 26, Fig. 4 5.0 -20.0 1.31-1.33 20.5 NR
*2.93 in dia. cyl.; +5.89 in dia. cyl.
PART II. DRAG COEFFICIENT-BLOCKAGE CORRECTED
Source Ref. R*e %n D/h k/D (x10-4) (%) (x105)
Delany & Sorensen 40, Fig. 5* 5+
5.0-10.0 1.1 1.0 NR Delany & Sorensen 40, Fig. 5.0-20.0 1.0 3.0 NR Batham 33, Tb. 1 11.1 1.17 5.0 NR Present Test 5.4-21.4 1.00-0.87 8.7 1.6 Polhamus 41, Fig. 3 12.7-20.0 1.19-1.13 10.0 NR Guven et al. 34, Tb. 4.2 16.8-22.5 1.06-0.99 17.8 NR
.L
=%l (%) NR NR NR NR
0.56-0.42 0.07
Cl.0 NR NR
0.70 0.20 0.07
Tu
(%T
NR NR
0.50 0.56-0.42
NR 0.20
Tb. means Table; NR means not reported; *2.93 in dia. cyl.; '5.89 in dia. cyl.
The data in Table 2 is tabulated as given in the above investigations, i.e., either measured or corrected for the blockage effect. No attempt was undertaken to apply the blockage correction whenever it was not initially performed. The reason for this was to pinpoint the role played by the blockage in determining the drag since, generally, the latter is higher with increasing blockage coefficient. As a result, Table 2 is divided into two parts. Measured data is summarized for ten different blockage coefficients ranging from 0.020 to 0.205 in Part I while corrected data for six different blockage coefficients varying from 0.010 to 0.178 are tabulated in Part II. The results of the present test are included in both parts. No blockage coefficients are given for the data reported by Wieselsberger (ref. 37) and Schmidt & Wenner (ref. 38) since they were obtained in an open-jet flow wind tunnel and in a partially open stream
26

from a nozzle, respectively. Information concerning the relative surface roughness is given only by Achenbach (ref. 19) and in the present experiment. Data on the free- stream turbulence intensity is provided in nine out of the seventeen cases as indicated in Table 2. Lack of data is designated in this table, as previously, by NR which means not reported.
The variations of the measured and corrected drag coefficient with increasing Reynolds number for all the cases listed in both parts of Table 2 are displayed in Figs. 5.11 and 5.12, respectively. Each case is identified in these two figures by its blockage coefficient D/h. Inspection of these variations indicates that Xhe ckag coed&L- cieti obftined in the pntieti te& h geneJ&Q wtikin Xhe b&h vdeuti hepotied in Xhe o.thm &ve,&Cgtioti. For instance, the measured drag coefficients found in the present experiment at Reynolds numbers in the range 5.2~10~ to 9.4x10⁴ are about 7 to 5% larger than those reported by Modi & El-Sherbiny (ref. 26) at comparable blockage coefficient (0.087 v. 0.09) and background freestream turbulence intensity (0.56 to 0.46% v. 0.07%; vid., Fig. 5.11). At Reynolds numbers rang- ing from about 5~10~ to 1.3x10⁵, the measured drag coeffi- cients obtained herein are within -6 to +3% of their coun- terparts given by Fage & Warsap (ref. 1) despite the fact that the blockage coefficient in the latter case was about 46% greater than that in the present test (1.123 v. 0.089; vid., Fig. 5.11). In the Reynolds-number range from 1.25~10~ to 2.09x10⁵, the measured drag coefficients found here are from 3 to 11% larger than those reported by Achenbach (ref. 19) at comparable relative surface roughness (1.6~10-~ V. 1.33x10⁻⁵) and background freestream turbulence intensity (0.45 to 0.42 v. 0.7%) even though the blockage coefficient in the former case amounted to 52% of the latter (0.087 v. 0.167; vid., Fig. 5.11). All these differences in the drag coefficients are, in all likelihood, within the limits of experimental error provided that the role of the blockage is disregarded.
Further scrutiny of the variations of the measured drag coefficients listed in Table 2, Part I, and displayed in Fig. 5.11 reveals significant scattering in the results of the various investigations. All the drag coefficients sur- veyed within the Reynolds-number range from about 5~10~ to 2x10⁵ are confined between a maximum of 1.33 (ref. 26) and a minimum of 0.41 (ref. 3). Particularly conspicuous is the random variation of the drag coefficient within this range regardless of the corresponding blockage coefficient. As a matter of fact, the values of the drag coefficient are not in clear agreement with their expected increase with higher blockage. For instance, an almost constant drag coefficient of 1.20 and drag coefficients varying between 0.97 to 0.81
27
L

are reported by Wieselsberger (ref. 37) and by Schmidt & Wenner (ref. 38), respectively, under conditions of practi- cally no blockage. Moreover, the drag coefficients given by Wieselsberger (ref. 37) at Reynolds numbers larger than 12x104 are greater than those found by Giedt (ref. 3), Fage & Falkner (ref. 2), Fage & Warsap (ref. 1), Achenbach (ref. 19) and in the present experiment at blockage coefficients ranging between 0.087 and 0.167. Drag coefficients found by Modi & El-Sherbiny (ref. 26) at a blockage coefficient of 0.090 are smaller than those reported in the other studies at both lower and higher blockage coefficients. Likewise, the drag coefficient given by Bursnall & Loftin (ref. 39) at a relatively low blockage coefficient of 0.020 is larger than its counterparts at the same Reynolds number and at much higher blockage coefficient found in several other investigations (see Giedt (ref. 3), Fage & Falkner (ref. 2), Fage & Warsap (ref. l), Achenbach (ref. 19), and the present experiment). This drag coefficient is, in fact, of almost the same magnitude (smaller by about 2%) as that reported by Guven et al. (ref. 34) at a blockage coefficient of 0.178.
The variations of the blockage-corrected drag coefficients % summarized in Table 2, Part II, and por- trayed in Fig. 5.12 exhibit disparities similar to those observed for the measured ones. It is apparent that a unique value for the drag coefficient at a given Reynolds number is not obtainable as a result of applying the block- age correction. An identical conclusion was reached previ- ously, as a matter of fact, when the pressure distribution was corrected for the blockage. The corrected drag coeffi- cients examined range between a maximum of 1.19 (ref. 41) and a minimum of 0.87 (present test), i.e., a 27% change. As far as the distribution of the corrected drag coefficient within this range is concerned, it reveals a random varia- tion with the blockage coefficient similar to that observed for the measured one. For instance, the corrected drag coefficients "I;2 obtained here at Reynolds numbers Rz ranging from 5.2~10~ to 1.29x10⁵ are within 3% smaller than those given by Delany & Sorensen (ref. 40) at a blockage coefficient of about l/3 of that in the present study (0.03 V. 0.087) as observed in Fig. 5.12. The corrected drag coefficient reported by Batham (ref. 33) at a blockage coef- ficient of 0.050 is higher than those found in other studies at blockage coefficients both smaller and larger. and, fur- thermore, is of the same magnitude as those given by Polhamus (ref. 41) at a blockage coefficient twice as large (0.10, vid., Fig. 5.12). Corrected drag coefficients given by Delany & Sorensen (ref. 40) at two relatively low block- age coefficients (0.010 and 0.030) differ by 10% in their values with the larger ones at the smaller blockage coeffi- cient. Both sets of these drag coefficients are smaller
28

than those reported by Batham (ref. 33) and Polhamus (ref. 41) at higher blockage coefficients (0.050 and 0.10) and, at the same time, larger than those found in the present exper- iment at a blockage coefficient of 0.087 as observed in Fig. 5.12. Moreover, the values of the corrected drag coefficient reported in ref. 40 at a blockage coefficient of 0.030 are smaller within at most 6% than those given by Guven et al. (ref. 34) at a blockage coefficient of 0.178 for Reynolds numbers greater than 1.6~10~.
The foregoing brief examination of both the measured and the blockage-corrected drag coefficients indicates that their variations are not consistent with the trend called for by increasing blockage and reveals that the capability of the correction in compensating for the blockage is limited. Other factors that can affect the value of the drag coefficient at any given blockage are the relative sur- face roughness, the freestream turbulence intensity of the nominally smooth incident flow and the leakage effect, as previously mentioned with regard to the pressure distribu- tion. Larger relative surface roughness and higher free- stream turbulence intensity lead to a lower drag coefficient (refs. 1,27). A similar effect is induced by leakage of high pressure air from the stagnation zone into the near wake. The latter depends upon the particular experimental setup and it is more likely to occur when the drag is measured by means of a force balance. Whenever leakage was detected (refs. 1,40) no action to prevent it was taken.
The extent to which the observed scattering in the values of the drag coefficient (measured and corrected) was affected by these three agents cannot, at the present time, be assessed due to the lack of sufficient information (vid., Table 2). One can, however, conjecture that these factors played a role in those cases when unusually low drag coeffi- cients were found at subcritical Reynolds numbers. For instance, the relatively low measured drag coefficients given by Fage & Warsap (ref. l), Fage & Falkner (ref. 2) and Giedt (ref. 3) at Reynolds numbers greater than 1.2~10~ and at almost identical blockage coefficients (0.127, 0.123 and 0.111, respectively; 14% variation) can, in all likelihood, be attributed to either unreported surface roughness or to changes in the freestream turbulence or both. Leakage also could have played a role in inducing the low drag coeffi- cients reported by Fage & Warsap (ref. 1) since it was not prevented despite the fact that it was detected.
In carrying out the present investigation, the blockage correction was consistently applied in smooth incident flow to both the pressure coefficient and the drag coefficient. Every effort to reduce the surface roughness and to prevent leakage was further undertaken. In addition, the freestream
29

leakage was further undertaken. In addition, the freestream turbulence of the smooth incident flow was practically main- tained at an intensity equal to that in an empty wind-tunnel test section. The pressure distribution, the separation angle and the drag coefficient measured here in smooth inci- dent flow under these controlled conditions ahe genehaDy cavdhtent w&z hUukt-5 hepotied in o;thm h&Aid ti contrtiponding hubchiticat ReynoU numbw as indicated by the comparison analysis conducted above. Achievement of a better quantita- tive agreement among the various results is, in practice, precluded as long as differences in the blockage coeffi- cient, surface roughness, freestream turbulence and leakage are present, and in view of the inherent limitation of the blockage correction. In conclusion, the heAti obai.Cned in ti htudy in hmooath incideti 6Low hepheheti an aceptable hetjehence lW gauging Xhe eddeot 06 turbulence.
30

6. RESULTS IN TURBULENCE INCIDENT FLOW
6.1 Incident Turbulence
Turbulent incident flow was obtained by superimposing freestream turbulence on the smooth flow using a turbulence- generating grid, as previously mentioned. In order to deter- mine the positioning of the cylinder behind the grid, the evolution of the mean velocity defect and axial turbulent velocity downstream of the grid was surveyed in the absence of the cylinder. The turbulent flow behind the grid with the cylinder absent is viewed as the background turbulent flow as far as the cylinder is concerned. Comprehensive hot-wire measurements of the background turbulent flow were conducted over a half-mesh interval off the grid centerline (viz., midmesh centerline) at increasing distances downwind of the grid. These measurements were carried out at three different freestream velocities within the range correspond- ing to that used in the presence of the cylinder behind the grid, viz., at freestream velocities U = 4.9, 11.7 and 19.5 m/s which corres 1.25~10~ and 2.09x10 P
ond to cylinder-diam%ter Re = 5.2x10⁴, (see Sec. 4 and App. III). Recall
that the freestream velocity is the uniform velocity moni- tored upwind of the grid. It should further be noted that the grid centerline corresponds to the cylinder stagnation streamline, viz., the x-axis (vid., Fig. 2.2). The results of this investigation of the background turbulent flow are reported elsewhere in ref. 11. However, those results directly pertinent to the positioning of the cylinder down- wind of the grid are briefly reviewed herein.
In determining the positioning of the cylinder behind the grid, the following criteria were applied to the back- ground turbulent flow:- (1) lateral uniformity in the back- ground mean velocity Ub, i.e., negligible mean velocity defect; (2) lateral homogeneity in the background axial tur- bulence intensity; (3) a level of background axial turbu- lence intensity smaller than 5%; (4) varying level of back- ground axial turbulence intensity at given freestream velocity at that position behind the grid where the cylinder was to be located; and, (5) a turbulence intensity smaller than 10% in the presence of the cylinder at that distance upwind of it where the stretching action starts (i.e., at the front end of the amplification range, ref. 5). Examina- tion of the lateral uniformity in the background mean veloc- ity nb was performed by referring it to the uniform free- stream velocity TJ,, i.e., Ub/Um. Similarly, the background axial turbulence intensity was defined in terms of the uni- form freestream velocity by
31

Tub = upm I (6.1)
where % is the rms value (q)' of the background axial turbulent velocity.
The foregoing first three conditions were reasonably met starting from a distance downstream of the grid of about 9 mesh lengths (9M = 57.15 cm (22-l/2 in), where mesh M = 6.35 cm (2-l/2 in), see Sec. 2.3). For instance, the lateral variation over a half mesh in both the dimensionless background mean velocity and axial turbulence intensity was smaller than 5% at 9.6 mesh lengths (9.6M = 60.96 cm (24 in)) and reduced to less than 2% at 17.4 mesh lengths (17.4M = 110.50 cm (43-l/2 in)) behind the grid. In view of this negligible defect in the mean velocity and the accept- able lateral homogeneity in the axial turbulence intensity, their values along the grid centerline (midmesh centerline) were taken as representative of the background turbulent flow. The background axial turbulence intensity Tub along the grid centerline at the two aforementioned distances behind the grid was smaller than about 5 and 3%, respec- tively, at all freestream velocities of interest.
In order to evaluate the effect of varying background axial turbulence intensity upon the pressure distribution at given cylinder-diameter Reynolds number (or corresponding freestream velocity), positioning of the cylinder at several distances behind the grid was necessary. Based on the vari- ation of the background axial turbulence intensity along the grid centerline, the cylinder was positioned at 10, 17.5 and 25 mesh lengths (lOM, 17.5M, 20M = 63.50, 111.13, 158.75 cm (25, 43-3/4, 62-l/2 in)) behind the grid. In terms of the cylinder radius R (7.94 cm), the grid was located at distances of 8, 14*and 20R upwind of the cylinder stagnation point, i.e., at xg = 8,14, and 20. The positions of the cylinder stagnation point behind the grid are referred to as the test positions while the corresponding grid locations upwind of the cylinder are called the grid positions.
Variations of the background axial turbulence intensity Tub with increasing freestream velocity U, and correspond- ing cylinder-diameter Reynolds number Re at the three cylinder test positions are displayed in Fig. 6.1. The back- ground axial turbulence intensity exhibits an almost slightly linear decrease at the first two test positions (10Mr 17.5M) from about 4 to 3.5% and 2.7 to 2.5x, respec- tively, with increasing freestream velocity (or correspond- ing cylinder-diameter Reynolds number). At the third test position (25M), it remained at an almost constant level of about 2.1% at all freestream velocities. Simultaneously,
32

the background axial turbulence intensity diminished with farther test position at given freestream velocity. Thus, ,the bachgnound ;twtbutence itietitiy me;t the treqtied cond.iaXon?l.
In producing the background turbulence, attention was further paid to obtain at the test positions turbulent energy primarily concentrated at scales smaller than the cylinder diameter and simultaneously larger than the neutral scale of the present stagnation flow. Concentration of turbulent energy at scales smaller than the diameter of the cylinder was sought to ensure its exposure to oncoming tur- bulent flow. Oncoming flow in which turbulence is mainly present at scales much larger than the diameter of the cylinder is, as a matter of fact, perceived by the latter as smooth incident flow. The need for turbulence at scales greater than the neutral scale of the stagnation flow stems from the fact that this is that particular turbulence that undergoes amplification according to the vorticity- amplification theory.
The scale structure of the background turbulence is characterized by its longitudinal integral scale Ab. Com- putation of the integral scale was accomplished by deducing it from the one-dimensional energy spectrum E(n) (n denotes frequency) of the axial turbulent velocity according to the relationship (ref. 42, p. 65)
*b = (tb/4u9E(0) , (6.2)
in which ub and UT are the background mean velocity and the mean-square value of background axial turbulent velocity at the test position, respectively. The background mean velocity at the test position is, in practice, equal to the uniform freestream velocity by continuity condition, viz., "b = urn, since it was measured in the absence of the cylin- der. In the foregoing relationship, E(0) is the value of the energy spectrum at zero frequency (at n = 0) which was obtained by extrapolation. The estimated error in determin- ing the integral scale amounts to about &5% owing to the inevitable arbitrariness associated with the extrapolation of the energy spectrum to zero frequency.
The dependence of the background turbulence longitudinal integral scale at the test positions upon the freestream velocity was first inspected. To this end, the variations of this integral scale with increasing freestream velocity Urn and/or corresponding cylinder-diameter Reynolds number Re are displayed in Fig. 6.2. The integral scale made dimen- sionless in terms of the grid mesh-viz., Ah/M-is shown in this figure. A similarly linear increase with higher
33

freestream velocity (01 corresponding cylinder-diameter Reynolds number) is exhibited by the background turbulence longitudinal integral scale at all three test positions. Recall that the grid mesh was constant.
In order to assess the overall similarity of the turbulence produced by the present grid to that generated by an ordinary square-mesh grid, the evolution of the longi- tudinal integral scale with downstream distance from the grid was surveyed as reported in ref. 11. The growth of the integral scale with distance behind the grid was reasonably approximated by a straight line. A similar approximately linear increase in the longitudinal integral scale is generally found downstream of an ordinary square-mesh grid of stable solidity (refs. 43,44,45). It should be noted that an exact linear increase implies complete self- preservation. On the other hand, a power-low growth for the integral scale behind a square-mesh grid of unstable solidi- ties of 0.34 and 0.44 is proposed in ref. 9.
As far as the exposure of the cylinder to oncoming turbulent flow is concerned, the ratio of the background turbulence longitudinal integral scale to the cylinder diameter Ah/D at the test positions was examined. Varia- tions of this ratio with increaseing freestream velocity UC0 and/or corresponding cylinder-diameter Reynolds number Re are also portrayed in Fig. 6.2. The integral scale was con- sistently much smaller than the cylinder diameter at all test positions and freestream velocities. At the same time, the integral scale displayed a similarly linear increase with higher freestream velocity (or corresponding cylinder- diameter Reynolds number) at each test position. The linear increase in the integral scale amounted from 0.208 to 0.261D, 0.168 to 0.216D, and 0.208 to 0.261D as the test position was at 10, 17.5 and 25M, respectively, downstream of the grid. Thus, bachgkruund ;tuhbu&ncc wti auppk5Lc.d at ncaLti athti ensum cthe. expobum 06 the cy.Lindctr to uncaming ;tuhbuRevLt @a~.
The ratio of the background turbulence longitudinal integral scale to the neutral scale of the stagnation flow Ab'ho was next scrutinized at each test position to deter- mine as to whether oncoming turbulence was concentrated at scales susceptible to undergoing amplification by stretch- ing. Variations of this ratio with increasing Reynolds number Re are shown in Fig. 6.3. Note that the neutral scale at all five Reynolds numbers of interest is tabulated in this figure for convenience's sake. The background tur- bulence longitudinal scale was consistently larger than the neutral scale at all three test positions. It ranged from about 8.98 to 25.04ho, 12.18 to 31.46Ao, and 15.07 to 38.05ho as the cylinder test position was farther from the
34
grid at 10, 17.5 and 25M, respectively. Thtie heAuJ% indictie that backghound XuhbukLence aui.tab& 20 exp&encing ampR&ction by b;OrtichLng WM phoduced.
Turbulence approaching a body experiences amplification starting from a certain upwind axial distance whose extent is determined by the stretching action. The axial turbu- lence intensity, based on the freestream velocity U,, at the front end of this amplification range is defined as the critical turbulence intensity as far as the turbulence amplification is concerned. Thus, the critical turbulence intensity Tut is given by
T”C = u’ miniUrn ’ (6.3)
where YLn is the minimum rms value (2. 5 min )' attained by
the axial turbulence velocity prior to its amplification. The critical turbulence intensity and the axial extent of the amplification range depend upon the test position, i.e., upon the distance between the cylinder and the grid. In order to detect the position of minimum turbulence inten- sity, the evolution of the rms value of the axial turbulent velocity along the stagnation streamline (x-axis) was monitored by means of a single hot wire for each grid posi- tion over the entire Reynolds-number range-of interest. Once this upwind position, denoted herein by xmin, was located, the critical turbulence intensity was computed according to Eq. (6.3).
Variations of the critical turbulence intensity Tut with increasing cylinder-diameter Reynolds number Re for the three grid positions are portrayed in Fig. 6.4. The criti- cal turbulence intensity was consistently larger than that of the background turbulence owing to the presence of the cylinder, but yet smaller than 10% as desired. Its level ranged from about 7 to 6.7x,-4.8 to 4.4x, and 3.5 to 2.5% as the grid was positioned at
xg = 8,14 and 20, respectively.
A linear decay in the critical turbulence intensity with greater Reynolds number w_as obtained for each grid position. The upwind axial extent xmin of the amplification range was the same at all Reynolds numbers for given grid position and it was larger as the grid was installed farther from the cylinder as indicated in Fig. 6.4. It increased from 1.6 to 2.2 and to 2.5R (12.70, 17.50, 19.84 cm (5, 6.9, 7.8 in)) ,as the grid was positioned farther from the cylinder at
xg = 8,14 and 20, respectively. It is thus apparent that
the stretching mechanism acts over a larger distance upwind
35

of the cylinder as the critical turbulence intensity is smaller at given Reynolds number.
6.2 Mean Surface Pressure Distribution
The mean surface pressure distribution in turbulent incident flow was measured for each $f the three upwind turbulence-generating grid positions (x
g = 8,14,20) at the
same five subcritical Reynolds numbers as in smooth incident flow, viz., at Re = 5.2x10⁴, 9.4x10⁴, 1.25x10⁵, 1.67x10⁵, 2.09x10⁵. Computation of the surface mean pressure coeffi- cient was accomplished by means of Eq. (3.2). No blockage correction was applied to the freestream velocity, the Reynolds number and the pressure coefficient, as earlier mentioned, in view of the significant change in the cylinder drag coefficient with varying Reynolds number. The measured pressure coefficient C'
P in turbulent incident flow and its
ratio to that measured in smooth incident flow Cl/C at P P
each Reynolds number Re and azimuthal angle 8 are given in Table A.VI.l in App. VI. In addition, the grid position xg'
the background turbulence intensity Tub and the dimen- sionless background turbulence longitudinal integral scale based on the cylinder diameter Ah/D at each test position, the critical turbulence intensity Tut and the position upwind of the cylinder where it was detected gmin are tabulated in this table for each case. The distributions of the pressure coefficient C' in
P turbulent incident flow
with increasing peripheral angle 0 over half of the cylin- der at the five subcritical Reynolds numbers are shown in Figs. 6.5 to 6.9. Variations of the pressure coefficient for all three upwind grid positions at a single Reynolds number are portrayed in each figure. In addition, the dis- tributions of the pressure coefficient C
P measured (uncor-
rected) in smooth incident flow at the same Reynolds numbers are depicted in these figures for comparison's sake.
In order to point out the effect of amplified turbulence upon the pressure distribution, it is relevant to examine the changes within its three regions. These three regions are: (1) the favorable pressure gradient region which extends from the stagnation point up to the point of minimum pressure 0;; (2) the adverse pressure gradient region which stretches from the point of minimum pressure up to the starting point of the base region 0;; and, (3) the base region which extends point to the base point Bb.
from the base region starting
36

The angular position of minimum pressure was deduced from the measured pressure distribution. In deducing e;, the estimated error amounted to about f4% in view of the inherent sensitivity associated with the detection of this inflection point and the lack of more data points within its immediate vicinity. The starting point of the base region was taken, as in smooth incident flow, at that peripheral angle where a distinct trend toward a leveling off in the surface pressure was observed. in estimating this angle was
A second condition applied a difference up to about 15%
between the pressure coefficient at this point and the base pressure coefficient Cbb (Cb at eb = 180'). This criterion was used in view of the slight variation of the surface pressure within this region and the selection of the base pressure coefficient as characteristic of the entire base region (see Sect. 4). The estimated error in approximating ek is about f2 to 4% considering the relatively arbitrari- ness in determining the starting point of the levelling off in the surface pressure.
The starting point of the base region e$ represents a reasonable approximation of the separation angle since it indicates the point of boundary-layer flow detachment which corresponds to the position of zero mean skin fric- tion (ref. 46). Such a correspondence between the starting point of the base region and the position of zero mean skin friction was found for a relatively rough cylinder (relative surface roughness k/D of 1.1x10-" to 4.5x10e3, i.e., about 69 to 281 greater than in the present test) in smooth inci- dent flow at subcritical Reynolds numbers (1.0x10⁵, 1.3x10⁵, 1.7x10⁵, 2.4~10~) and at higher critical and supercritical Reynolds numbers (4.3x10⁵, 6.5x10⁵, 3.0x10⁶, ref. 27). It should be noted that the surface roughness generally affects the pressure distribution and the separation in a manner similar to the freestream turbulence. Both the angular posi- tions of the minimum pressure eri and the starting point of the base region (or separation angle) eL are marked off in Figs. 6.5 to 6.9 and listed in Table A.VI.2, App. VI. Note that their counterparts in smooth incident flow, Bm and es, are given in Table A.VI.3, App. VI, for convenience's sake.
Ideally, the penetration of amplified turbulence into the boundary layer induces lower (more negative) pressure in the favorable and adverse pressure gradient regions and higher (less negative) pressure in the base region. The differentiation between the pressure distributions in tur- bulent and smooth incident flows in these three regions becomes more pronounced as the grid is closer to the
37

cylinder-i.e., with higher background and/or critical turbulence intensity-and with increasing Reynolds number. These trends are by and large discerned in Figs. 6.5 and 6.9. In discussing below the changes and trends in the pressure distribution within these three regions, allowance was made for the associated inevitable experimental uncertainty.
6.3 Favorable Pressure Gradient Region
The distributions of the pressure coefficient in turbulent and smooth incident flows within the favorable pressure gradient region started parting company at an azi- muthal angle ranging between 20 and 40° depending upon the particular Reynolds number-grid position combination as observed in Figs. 6.5 to 6.9. This differentiation between these two types of pressure coefficient distributions occurs at a smaller angle-viz., closer to the stagnation point-as the Reynolds number is larger. With further increase in the peripheral angle, the pressure coefficient in turbulent incident flow gradually became smaller (more negative) than its counterpart in smooth incident flow till their differ- ence reached a maximum in the neighborhood of the point of minimum pressure. The rate of decrease in the pressure coefficient in turbulent incident flow was consistently greater than that in smooth incident flow. This decrease was steeper at lower Reynolds numbers (5.2x10⁴, 9.4x10⁴) when the grid was closer to the cylinder. The effect of the grid position diminished with increasing Reynolds number. An identical steep decrease in the pressure coefficient was obtained for all three grid positions at the higher Reynolds number (1.67x10⁵, 2.09x10⁵) as shown in Figs. 6.8 and 6.9. Thus, the pen&a;tion 06 ;twrbuRence into Xhe boundcuq .taye?L inducti along XhE Q~ont 06 a cyfinden. a mom dawotrablk ptre.hhWN gnaidcti Xhan in hmooath incideti &LOW.
6.4 Minimum Pressure
A more favorable pressure gradient leads to a lower (more negative) minimum pressure and to a rearward shift in its angular position. Examination of these changes in the minimum pressure is of prime concern in view of its role in determining the development of the adverse pressure gradient region and, consequently, the inception of separation and the base pressure. Variations of the minimum pressure coef- ficient C'
pm in turbulent incident flow for all grid posi-
tions and of its counterpart C pm
in smooth incident flow with increasing Reynolds number are depicted in Fig. 6.10, while their values are listed in Tables A-VI.2 and A.VI.3, APP. VI, respectively. Values of the minimum pressure coef- ficient in turbulent incident flow were estimated from the
38

lr
pressure coefficient distributions shown in Figs. 6.5 to 6.9. Whenever no direct measurement was performed at the corresponding angular position, the minimum pressure coeffi- cient was interpolated from the pressure coefficient distri- butions as annotated in Table A.VI.2, App. VI. Inspection of the variations of the minimum pressure coefficient reveals a distinct opposite behavior in smooth and turbulent incident flows. The minimum pressure coefficient in smooth incident flow was constantly higher (less negative) than in the latter flow and slightly increased (became less nega- tive) with increasing Reynolds number. In turbulent inci- dent flow, on the other hand, the minimum pressure coeffi- cient decreased (became more negative) with increasing Reynolds number for each grid position. The reduction in the minimum pressure coefficient was larger as the grid was closer to the cylinder, i.e., critical turbulence intensity.
with higher background and/or
Indication of the degree to which the turbulence reduced the minimum pressure coefficient is supplied by the ratio of the minimum pressure coefficient in turbulent inc'dent flow to its counterpart in smooth incident flow
d Cbm'Cpm' The values of this ratio are tabulated for each case in Table A.VI.2, App. VI. Variations of this ratio with increasing Reynolds number for all three grid positions are portrayed in Fig. 6.11. The decrease in the minimum pressure coefficient in turbulent incident flow C' ranged from 1.12 to 2.61 times depending upon the Etrticular Reynolds number-grid position combination. This demonstrates that the minimum pressure coefficient in turbulent incident flow was more negative than in smooth incident flow at all Reynolds numbers and for all grid positions, i.e., always C' cc
pm pm' It should further be noted that the minimum
pressure coefficient attained a constant value of about -2.45 at the highest subcritical Reynolds number of 2.09x10⁵ for all three grid positions.
Further examination of the pressure coefficient distributions shown in Figs. 6.5 to 6.9 indicates that the reduction in the minimum pressure coefficient in turbulent incident flow was accompanied, as previously mentioned, by a rearward shift in its angular position. Variations of the angular position of the minimum pressure coefficient in both turbulent and smooth incident flows-viz., (3; and em, respec- tively-with increasing Reynolds number Fig.
are portrayed in 6.12. The point of minimum pressure coefficient in
smooth incident flow was monitored at an angle of about 7o" at all Reynolds numbers (see Sect. 5.1). In turbulent incident flow, on the other hand, the point of minimum pres- sure coefficient gradually shifted rearward from 70 to a
39

maximum of 80' with increasing Reynolds number for all grid position. This maximum aft shift occurred at smaller Reynolds numbers when the grid was closer to the cylinder. Thus, the interaction of turbulence with the boundary layer induces at each Reynolds number a finite downstream shift in the angular position of minimum pressure coefficient whose measure depends upon the intensity and scales of the back- ground turbulence.
Reduction in the minimum pressure coefficient and its manifestation at azimuthal angles between 70 and 90' are generally characteristic of pressure distributions on a smooth cylinder in a smooth incident flow at higher criti- cal, supercritical and transcritical Reynolds numbers i.e., at Re > 2-2.5~10~ (refs. 19,21,31,33,34,47,48,49,50). In a smooth incident flow at these higher Reynolds numbers, the diminution in the minimum pressure and its rearward shifting are accompanied by a lengthening of the adverse pressure gradient region, a shortening of the base region and, ulti- mately, an aft shift in the separation angle. One can, them- do&e., uqw..t a himiLan behawiotr. at hubchLtic& Rcynol& numbm in a ;tutbufknt incident @Tow. 68
6.5 Adverse Pressure Gradient Region
The difference between the pressure distributions in turbulent and smooth incident flow is prominent within the adverse pressure gradient region as noticed in Figs. 6.5 to 6.9. Particularly noticeable is the longer streamwise extent of this region in turbulent incident flow. Varia- tions of the angular extent of this region with increasing Reynolds number in turbulent incident flow for all three grid positions and of that in smooth incident flow are depicted in Fig. 6.13. The angular extent was approximated by the arc between the base region starting point and the minimum pressure point, i.e., by eHrn = 6;-6; and 8 =
sm 's-'rn in turbulent and smooth incident flows, respec- tively. Their values are summarized in Tables A.VI.2 and A.VI.3, App. VI. This region extended in turbulent incident flow over an arc ranging from 15 to a maximum of 50° with increasing Reynolds number and depending upon the particular grid position. In smooth incident flow, on the other hand, this region stretched at all Reynolds numbers over a con- stant arc of about 10'.
The variation of the streamwise extent of the adverse pressure gradient region with higher Reynolds number and with closer grid position is, as a matter of fact, similar to that of the minimum pressure point. At each Reynolds number, the adverse pressure gradient region broadened as the grid was closer to the cylinder, i.e., as the intensity
40

of the background turbulence was higher and its integral scale was smaller. Simultaneously, this region asymptoti- cally attained a maximum extent of 50° with increasing Reynolds number for all grid positions. The attainment of this maximum extent depends, as for the minimum pressure point, upon the Reynolds number-grid position combination. When the grid was closer to the cylinder, it was reached at lower Reynolds numbers as seen in Fig. 6.13. ThA widening 06 ;the advme phehhuhe ghCKi!kti hegiOM necehnbahiey &?a& Xo a hhotim btie hcgion similarly to that found at higher Reynolds number in a smooth incident flow (refs. 19,21,31,33,34,47,48,49,50).
The pressure coefficient in turbulent incident flow was smaller (more negative) throughout the entire adverse pressure gradient with
re_gion (at Re = 5.2~10~ and 9.4x10⁴ the grid at xg = 20) or throughout most of it (all
the other cases) than its counterpart at corresponding angles and the same Reynolds numbers in smooth incident flow as seen in Figs. 6.5 to 6.9. Note that the corresponding angular positions in the smooth incident flow are already in the base region. Illustration of the decrease in the pres- sure coefficients in turbulent incident flow with respect to their counterparts in smooth incident flow is provided by their ratios C'/C
P P tabulated in Table A.VI.1, App. VI.
The relatively large negative pressure in the adverse pres- sure gradient region is consequent upon the prevailing much smaller minimum pressure. At the same time, this large negative pressure is associated with the broadening of this region. As the pressure is more negative, a longer distance is needed to attain the much higher (less negative) base pressure.
Examination of the variation in the pressure coefficient with grid position at given Reynolds number reveals that it was smaller (more negative) as the grid was closer to the cylinder. This trend, however, faded gradually away with increasing Reynolds number. At the highest subcritical Reynolds number of 2.09x10⁴, for instance, the pressure distributions for all three grid positions practically col- lapsed onto a single curve as observed in Fig. 6.9. This indicates that the effect of turbulence upon the lengthening of the adverse pressure gradient is confined within a finite range with higher Reynolds number regardless of the grid position.
Further careful inspection of the pressure coefficient variations reveals the probable existence of a relatively short flat zone at Re = 5.2~10~ and 9.4x10⁴ with the
around 90_to 100° grid at x4 = 8 and 20, respectively, as
observed in Figs. 6.5 and 6.6. Such a short plateau, which
41

is generally found in the adverse pressure gradient region at higher critical and supercritical Reynolds numbers indi- cates the occurrence of a short laminar separation bubble followed by transition and reattachment to a turbulent boundary layer and turbulent separation (refs. 47,48,51). One can thus infer that a short laminar separation bubble transpired, in all likelihood, in these two cases. In all the other cases, on the other hand, a flat zone or a distinct drend toward its manifestation were not detected. The absence of a laminar separation bubble signifies reali- zation of direct transition from a laminar to a turbulent boundary layer ahead of separation.
6.6 Base Region
The effect of the penetration of turbulence into the boundary layer is distinctly manifested in the contrast between the characteristics of the base region in turbulent and smooth incident flows. Differences between the base regions include a shorter extent and, in most cases, a less negative (or higher) pressure in turbulent incident flow as observed in Figs. 6.5 to 6.9.
Variations of the angular extent of the base region with increasing Reynolds number in turbulent incident flow for all three grid positions and of that in smooth incident flow are portrayed in Fig. 6.14. This angular extent was estimated by the arc between the base point and the base region starting point (or separation angle), i.e., by eis = eb-8; and 'bs = 'b-'s in turbulent and smooth inci- dent flows, respectively. Their values are listed in Tables A.VI.2 and A.VI.3, App. VI. The base region decreased in turbulent incident flow from an arc of 95 to 50° with higher Reynolds number and depending on the grid position conse- quent upon the corresponding lengthening of the adverse pressure gradient region. In smooth incident flow, on the other hand, the base region extended over a constant arc of about 100' at all Reynolds numbers. The shrinking of the base region was greater at each Reynolds number as the grid was closer to the cylinder and, at the same time, the mini- mum extent of 50° was attained asymptotically for all grid positions with higher Reynolds number. Hence, the shorten- ing of the base region is constrained within a finite range similarly to the rearward shift of the minimum pressure point and the widening of the adverse pressure gradient region. The immediate COVLJ ecjuence 06 ;tti hhotiening 06 Xhe ban E kegion ti an a@ h&&t in Xhe hepawdion angle.
The pressure in the base region was less negative in turbulent incident flow than that in smooth incident flow for almost all Reynolds number-grid position combinations as observed in Figs. 6.5 to 6.9. Only in four cases, viz.,
42

at the lowest Re = 5.2~10~ si
for all three grid p_ositions g
= 8,14,20 and at Re = 9.4x10⁴ with the grid at xg
= 20, the pressure throughout the base region in turbulent inci- dent flow was either about equal to or slightly more nega- tive (up to about 10%) than that in smooth incident flow. One can attribute this more negative pressure to the pecu- liar behavior of the boundary layer in these four cases which is discussed later. The extent to which the turbu- lence induced a less negative pressure coefficient within the base region is expressed by the ratio to its counterpart
smooth :;p. VI.
incident flow C'/C P P
given in Table A.VI.l,
The base pressure C' pb' which characterizes the almost
constant pressure within the entire base region, plays a prime role in determining the drag coefficient and, there- fore, its change in turbulent incident flow was examined. As a matter of fact, the base pressure coefficient supplies an immediate indication of the drag coefficient since the latter is smaller when the former is less negative and vice versa. The slight change in the pressure in the base region with respect to the base pressure amounted from -4 to roughly +15x depending upon the particular Reynolds number- grid position combination. Variations of the base pressure coefficient C' ' pb In turbulent incident flow for all grid positions, along with that in smooth incident flow 'pb' with increasing Reynolds number are shown in Fig. 6.15. Their values are further summarized in Table A.VI.2 and A.VI.3, App. VI, for convenience's sake. A less negative base pressure coefficient was constantly obtained in turbu- lent incident flow except in the four cases previously men- tioned, which are marked off by a flag in Fig. 6.15.
The base pressure coefficient in both incident flows increased (became less negative) with higher Reynolds number, with a greater increase in turbulent incident flow. This increase amounted in the latter flow to 51, 54 and 55% with increasing Reynolds numb-er from 5.2~10~ to 2.09x10⁵ as the grid was positioned at
xg = 8,14 and 20, respectively.
On the other hand, the increase in the base pressure coeffi- cient in smooth incident flow over the same Reynolds-number range was about 21%. It should further be noted that the base pressure coefficient in turbulent incident flow reached an upper limit of about -0.49 for all three grid positions at the same highest subcritical Reynolds number of 2.09x10⁵. Recall that the minimum pressure coefficient attained its lowest value (most negative value; vid., Fig. 6.10) for all grid positions at the same Reynolds number.
43

The absolute value of the ratio of the base pressure coefficient in turbulent incident flow to its counterpart in smooth incident flow C' /C
pb pb was next examined in order to
point out the increase (less negative values) of the former. Variation of this ratio with increasing Reynolds number for all three grid positions is depicted in Fig. 6.16, while their values are given in Table A.VI.2, App. VI. The abso- lute value of the base pressure coefficient in turbulent incident flow amounted in most cases-viz., eleven out of fifteen-to about 62 to 92% of its counterpart in smooth incident flow depending upon the particular Reynolds number- grid position combination. ThQne. &hh negtive btie. pheAhuhe coed- &&-&~ti in ;tuhbuRence. incident @ow necehhahiey induce hma.&?eh hag Co- ed&&Leti ;than in hmooXh incident @OW CLt the hame hubctLi;ticd ReynoLA numbm. In the four cases earlier mentioned, which are indicated by a flag in Fig. 6.16, the base pressure coeffi- cient in turbulent incident flow was, similarly to the pres- sure in the entire base region, about equal to or slightly more negative than that in smooth incident flow. Specifi- cally! cbb/cpb = 1.004 and 1.013 at Re = 5.2~10~ and 9.4x10⁴ with the grid at "x = 8 and 20, and C' /C
g = 1.085 and 1.105 at Re = 5.2~10~
pb ,.,pb with the grid at
xg = 14 and 20.
The occurrence of a less negative base pressure coefficient in turbulent incident flow is associated with a concurrent diminution in the minimum pressure' coefficient (more negative) as revealed by the distributions of the pressure coefficient portrayed in Figs. 6.5 to 6.9. It is thus apparent that the reduction in the minimum pressure, which induces a longer adverse pressure gradient region, an aft shift in the separation angle and a shorter base region, also leads to a less negative base pressure. This is demon- strated by the variation of the base pressure coefficient with decreasing minimum pressure coefficient shown in Fig. 6.17. The simultaneous increase in the base pressure coefficient (less negative) and decrease in the minimum pressure coefficient (more negative) with higher Reynolds number is indicated by an arrow in this figure. It is important to remark that the increase in the base pressure coefficient with decreasing minimum pressure coefficient is described by a unique linear variation for all Reynolds number-grid position combinations. As the minimum pressure coefficient decreased by about 53% (from -1.288 to -2.453), the base pressure coefficient became less negative by about 225% (from -1.090 to -0.484). Another aspect of interest is that the base pressure coefficient attained its smallest negative value as the minimum pressure coefficient reached its largest negative level. The existence of a linear cor- relation between these two pressure coefficients is of para- mount significance in view of their major role in determin- ing the separation angle and the drag coefficient. As the
44

minimum pressure is more negative and the associated base pressure is less negative, the separation point moves rear- ward and the drag coefficient becomes smaller.
It is further relevant to note the opposite variations of the base pressure coefficient as function of the minimum pressure coefficient in turbulent and smooth incident flows. To this end, the variation in the latter flow of the base pressure coefficient (Cpb) with changing minimum pressure coefficient (C,,) is included in Fig. 6.17. It is also described by's straight line, but the slope is exactly oppo- site to that in turbulent incident flow. These two pressure coefficients became concurrently less negative in smooth incident flow, while in turbulent incident flow the base pressure coefficient became less negative as the minimum pressure coefficient was more negative. The simultaneous increase of both pressure coefficients in smooth incident flow with higher Reynolds number is also indicated by an arrow in Fig. 6.17. Thus, the penetration of turbulence into the boundary layer modifies completely the effect of minimum pressure upon the base pressure.
6.7 Pressure Rise Coefficient
A coefficient which provides a measure of the effect of turbulence upon the position of separation is the pressure rise across the adverse pressure gradient region (refs. 52, 53). This pressure rise is strongly dependent upon the boundary-layer characteristics and relatively insensitive to blockage, slenderness and end effects (ref. 34). An approximation of this pressure rise coefficient is supplied by the difference between the base and minimum pressure coefficients
C' pbm = C' -C' pb pm * (6.4)
In computing this pressure rise coefficient, the slight change of the pressure in the base region was neglected and, hence, the pressure at the starting point of the base region was taken equal to the base pressure. Variations with increasing Reynolds number of the pressure rise coefficient $brn in turbulent incident flow for all grid positions and of its counterpart 'pbm in smooth incident flow are por- trayed in Fig. 6.18. At the same time, their values are listed in Table A-VI.2 and A.VI.3, App. VI.
The pressure rise ,coefficient in smooth incident flow was consistently smaller than that in turbulent incident flow and almost constant over the Reynolds-number range
45

of interest as seen in Fig. 6.18 (see also Table A.VI.3, App. VI). Its value ranged randomly between 0.164 and 0.191 (viz., a 16% variation) with varying Reynolds number. In turbulent incident flow, on the other hand, the pressure rise coefficient exhibited an almost 10 times increase with higher Reynolds number, viz., from 0.198 to a maximum of about 1.969. Specifically, the increase amounted to about 3.1, 6.2 and 9.7 times with increasing Reynolds nun$er from 5.2~10~ to 2.09x10⁵ as the grid was positioned at
xg = 8,14
and 20,. respectively. A greater pressure rise coefficient was obtained at any given Reynolds number as the background turbulence intensity was greater and, at the same time, the integral scale of the background turbulence was smaller at the cylinder test position (viz., as the grid was closer to the cylinder). The pressure rise coefficient attained fur- ther asymptotically an upper limit of about 1.96 at the highest present Reynolds number of 2.09x10⁵ regardless of the grid position similarly to the asymptotic behavior found fo,r both the minimum and base pressure coefficients (vid., Frgs. 6.10 & 6.15). Essentially, the variation of the pres- sure rise coefficient in turbulent incident flow for each particular Reynolds number-grid position combination is prescribed by the concomitant increase in the base pressure coefficient (less negative) and decrease in the minimum pressure coefficient,(more negative).
It ' important to notice that the pressure distributik:s on a nominally smooth cylinder in turbulent incident flow at comparably subcritical Reynolds numbers reported in refs. 26,33 & 54 reveal pressure rise coeffi- cients of about the same magnitude as those obtained in the present experiment. The pressure rise coefficients deduced from the data given in these three studies is also displayed in Fig. 6.18 for comparison sake. Differences among the pressure rise coefficients obtained here and in these three investigations can, in all likelihood, be attributed to the different characteristics of the background turbulence in each case. Turbulence was produced in these three studies in a random fashion by means of ordinary square-mesh biplanar grids without attempting to adequately control the scale distribution of turbulent energy. As a result, both the background turbulence intensity and longitudinal integral scale are generally different from those in the present work. Herein, background turbulence was specifically pro- duced in a controlled fashion by means of a grid consisting of parallel vertical rods with due attention paid to ensure its simultaneous concentration at scales smaller than the cylinder diameter and greater than the neutral scale of the stagnation flow. In order to underscore the differences in the background turbulence, its characteristics-viz., turbu- lence intensity Tub, longitudinal integral scale referred
46

to cylinder diameter Ah/D and to neutral scale of the stagnation flow hb/Ao-at the test positions in the present experiment and in the foregoing three studies are summarized in Table 3 below. The background turbulence intensity and longitudinal integral scale are reported in these investiga- tions while the neutral scale of the stagnation flow was computed in each case according to Eq. (2.2).
TABLE 3. BACKGROUND TURBULENCE CHARACTERISTICS
Source Ref. Re Tub 'bD hb'Ao (x10-') (%I
Present Test 5.2-20.9 2-l-4.5 0.124-O-261 9.0-30.0
Mody & 6.7 El-Sherbiny 26,Fig. 1 I:', 5.0 9.2 0.486 34.60
33,Fig. 2 11.1 23.5
3.38 14.7 4.40 257.5 surry 54,Fig. 3 3.54 10.5 0.36 21.6
3.62 10.0 4.30 260.4 4.42 2.5 9.80 605.8
It should be noted that the pressure rise coefficient deduced from the data given in ref. 54 decreased and even became smaller than that in the present smooth incident flow as the background turbulence longitudinal integral scale was greater than the cylinder diameter (i.e., as Ah/D > 1) as observed in Fig. 6.18. As a matter of fact, the pressure distributions reported there (ref. 54, Fig. 3) exhibited in these cases an increasing resemblence to that typical in a smooth incident flow. This result substantiates the need to produce background turbulence at scales smaller than the diameter of the cylinder in order to ensure its exposure to an oncoming turbulent flow. Fulfillment of this condition in the present experiment is indicated by the constantly larger pressure rise coefficient in turbulent incident flow as seen in Fig. 6.18. Even in these four cases in which the base pressure in turbulent incident flow was more negative than that in smooth incident flow (vid., Figs. 6.15 & 6.16), the pressure rise coefficient was greater in the former flow.
The increase in the pressure rise coefficient caused by turbulence is further revealed by the ratio of this coefficient in turbulent incident flow to its counterpart in smooth incident flow C' pbm"pbm. Variations of this pressure rise coefficients ratio with increasing Reynolds number for each grid position are depicted in Fig. 6.19, while their
47

values are tabulated in Table A.VI.2, App. VI. This ratio exhibits a similar variation with Reynolds number as the pressure rise coefficient in turbulent incident flow since its counterpart in smooth incident flow was in practice con- stant. The aspect of interest is that the increase in the pressure rise coefficient in turbulent incident flow with respect to that in smooth incident flow ranged from about 1.2 to a maximum of 11.8 according to each particular Reynolds number-grid position combination. Similarly to the pressure rise coefficient in turbulent incident flow, the maximum increase in the pressure rise coefficients ratio was reached asymptotically at the highest Reynolds number (2.09x10⁵) independently of the grid position. The increase in the pressure rise coefficient with higher Reynolds number and its relatively large value (with respect to that in smooth incident flow) further indicates a rearward shift in the separation angle. In fact, as the pressure rise coeffi- cient is greater, a larger aft shift in the separation angle is expected. It should further be noted that the streamwise extent of the base region, and the level of both the base pressure coefficient and the pressure rise coefficient obtained herein are generally of the same magnitude as those for a smooth cylinder in smooth incident flow at higher critical, supercritical and transcritical Reynolds numbers (refs. 19,21,31,33,34,47,48,49,50).
6.8 Turbulent Separation Angle
The separation angle eH was taken at the starting point of the base region which corresponds to the boundary- layer detachment point (the point of zero mean shear stress at the wall), as earlier mentioned. Variation of the sepa- ration angle in turbulent incident flow with increasing Reynolds number for all three grid positions is depicted in Fig. 6.20. The laminar separation angle es is also shown in this figure for comparison's sake. Separation angles ranging from about 85 to a maximum of 130° were obtained depending upon the particular Reynolds number-background turbulence combination. The increase in the separation angle is due to the transfer of turbulent momentum to the boundary layer which enables the flow to follow the cylinder contour for a longer distance.
The smallest rearward shift in the separation angle was found in these two cases in which the base pressure was more negative than in smoot_h incident flow, viz., at Re = 5.2~10~ with the grid at x
g = 14 and 20 (vid., Figs.
6.15 and 6.16). In these two cases, which are marked off by a flag in Fig. 6.20, separation angles of roughly 95 and 85', respectively, were obtained. The maximum turbulent
48

separation angle of about 130' was attained asymptotically with increasing Reynolds number for all grid positions. This finite upper limit was reached at a lower Reynolds numbers as the grid was closer to the cylinder. For instance, it was _obtained at Re = 1.25~10~ when the grid was pozitioned at
xg = 8 and at Re = 2.09x10⁵ with the grid at x = 20.
A similar asymptotic behavior with increasing R&-nolds number was exhibited by the other key characteristics of the pressure distribution, viz., by Cim, 8;, 6krn, 81Js, Cib and 'Gbrn.
Corroboration of the separation angles deduced from the pressure coefficient distributions was next supplied by the dry-surface coating visualization. The visualization was conducted for a variety of Reynolds number-grid position combinations within the range used during the surface pres- sure survey. A sample of the separation angle indicated by the visualization is provided by three black-and-white still photographs given in Fig. 6.21. These stills were repro- duced from a color movie so that the red separated flow region (the light area) and the blue attached flow region (the dark area) are marked off in the figure by R and B, respectively, as in the smooth indicent flow case. Turbulent separation angles of about 110, 115 and _120° at = 7.5~10~ and 1.25~10~ with the grid positioned at
xg = 8,14 and 20,
respectively, are distinctly observed in these stills. These separation angles are with about -2% of those obtained from the pressure distribution shown in Fig. 6.20. A similar correspondence within f4%, at the most, was found for all other Reynolds number-grid position combinations. It is further important to stress that separation angles of about the same magnitude as those obtained here for a smooth cylinder in turbulent incident flow at subcritical Reynolds numbers are found in higher critical, supercritical and transcritical flow regimes for a smooth cylinder in a smooth incident flow (refs. 19,21,31,33,34,47,48,49,50).
Indication of the extent to which the penetration of turbulence into the boundary layer posttines the separation is given by the difference between the separation angles in turbulent and smooth incident flows A6; = 6; - es, which is also shown in Fig. 6.20 at each Reynolds number-grid posi- tion combination. The aft shift in the separation point caused by the turbulence amounted from 5 to 50° since the laminar separation angle was about 80° at all the present subcritical Reynolds numbers. It is, thus,, apparent that one can phoduce any dti.imd a& hki&t in tie hepanaA;con pai& a.it&n Rkin nange by htible COVUYLOL ad ReynoL& numbm-bacbghound ;ttibu.J!ence combintion.
49

The separation point is essentially determined by the extent of the adverse pressure gradient region which, in turn, is governed by the pressure rise and base pressure coefficients. Variations of the angular extent of the adverse pressure gradient region (6Am) and of the separation angle (0;) with increasing pressure rise coefficient (Cl pbm)' and of the separation angle with increasing pressure base coefficient (Cib) are displayed in Figs. 6.22, 6.23 and 6.24, respectively. The larger is the pressure rise coeffi- cient and the less negative is the base pressure coeffi- cient, the longer is the adverse pressure gradient region and the greater is the separation angle. At the same time, both eLrn and eA reached asymptotically their maximum values with increasing Reynolds number as these pressure coefficients attained simultaneously their upper bounds. Their increase with higher Reynolds number is indicated by an arrow in these figures. It is next important to note that the variations of both f3Lm and eA are described by single similar curves for all Reynolds number-grid position combinations. The existence of such correlations permits one to determine at any given Reynolds number the extent of the adverse pressure gradient region and the separation angle based on the pressure rise and base pressure coefficients.
The aft shift in the separation angle beyond 90' necessarily causes a narrower wake. When the separation point is on the front of the cylinder (es < go"), the wake is wider than the cylinder diameter, viz., dw > D, where dw denotes the wake width. As the separation point moves to the back of the cylinder (0; > go"), the wake width becomes smaller than the cylinder diameter, viz., d; < D. Detailed mapping of the wake was not carried out because of time constraints of the present investigation. However, single hot-wire vertical traverses were conducted within the wake at a distance of 0.64D (10 cm (4 in)) downstream of the cylinder in smooth incident flow at a Re = 1.25~10~ and in turbulent-incident flow at the same Reynolds number with the grid at
xg = 14. The goal of these measurements was to
detect the free-shear layer (or free streamline), according to the free-streamline model for the wake (ref. 21), and, hence, it was restricted to simply monitoring of the mean velocity variation. In this free-streamline model, the pressure on the wake boundary is assumed constant and equal to the base pressure from the separation point up to that point downwind where the wake boundary becomes parallel to the freestream and the pressure recovers to the freestream
50

value. It should be noted that the results of this survey supply soley a gross approximation of the wake boundary in view of the entrainment across the free-shear layers, the large transverse velocity fluctuations associated with the vortex shedding, and because of adopting the ideal free- streamline model. Nevertheless, they are indicative of the narrowing of the wake induced by the rearward shift of the separation point. A wake width about 33% larger than the cylinder diameter (dw Z 1.33D) was found in smooth incident flow when the separation angle es E 80". In turbulent incident flow, when the separation angle % z 128" We = 1.25x10⁵, "x = 14), the wake
g width reduced to about
86% of the cylinder diameter (d& r 0.86D) and, hence, it amounted to roughly 0.65 of its counterpart in smooth inci- dent flow (d;/dw = 0.65).
Simultaneously with the narrowing of the wake, turbulence induces a shorter wake formation region close behind the cylinder (viz., a shorter near wake), weakens the forming vortexes there, promotes the diffusion of the free- shear layers into the wake and, as a result, fosters a less negative base pressure. These strongly interrelated changes in the wake characteristics are caused by the drawing across the wake of fluid from the outer turbulent flow according to the entrainment mechanism proposed in ref. 55. The assump- tion is made that this mechanism, which was advanced based on data at Reynolds numbers of lo3 to 104, applies to the present higher subcritical Reynolds numbers. Outer fluid entrained periodically along each side of the wake is of vorticity of opposite sign to that of the entraining shear layer since it bears vorticity from the other shear layer across the wake. This periodic entrainment along each side is due to the action of the growing vortex on the other side of the wake axis. The entrained fluid of oppositely-signed vorticity inhibits the increase in the reversed flow within the formation region as it weakens the forming vortex there, and it even cancels some circulation at the cylinder rear surface. As a result, the formation region becomes shorter.
The weakening of the forming vortexes is further enhanced by greater diffusion of the free-shear layers into the interaction region, i.e., into the region of the growing vortex downwind of the formation region. Increase in the turbulence of these layers, which is effected by the outer turbulent flow, is responsible for their stronger diffusion. This .greater vorticity diffusion leads to less entrainment into the growing vortex and, hence, to more entrainment within the formation region. As a result, the scale of the formation region and the strength of the forming vortexes
51

are reduced. The diffusion of the free-shear layers and its effect upon the formation region are furthermore larger with increasing outer (or freestream) turbulence at given Reynolds number (ref. 55). The aspect of prime interest concerning the weakening of the forming vortexes is its effect upon the base pressure. As the strength of the form- ing vortices diminishes, the base pressure increases (becomes less negative). This is thus the mechanism respon- sible for the observed increase in the base pressure in turbulent incident flow.
Further examination of the variation of the separation angle with varying base pressure coefficient shown in Fig. 6.24 reveals that the latter increases from about -1.070 to -0.484 as the former shifts rearward from 85 to 13OO. In other words, as the separation angle moves on the back of the cylinder and, consequently, the wake narrows, the base pressure becomes less negative. One then can infer that weakening of the forming vortices is more powerful in turbulent incident flow when the wake is narrower than the cylinder diameter. On the other hand, when the wake is wider than or roughly of the same width as the cylinder diameter (viz., at a separation angle smaller than or around 90°) the base pressure coefficient in turbulent incident flow was more negative or about equal to that in smooth incident flow (vid., Figs. 6.15, 6.16 and 6.24). It is suspected that the entrainment in these cases occurred primarily in the wake interaction region without strongly affecting the formation region.
6.9 Turbulent Separation Parameter
The increase in the pressure rise coefficient and the associated aft shift of the separation point are effected by the penetration of turbulence into the boundary layer. In considering the effect of turbulence upon them it is neces- sary to account for its intensity and scale structure. The latter is of crucial significance since only turbulent energy concentrated at scales greater than the neutral scale of stagnation flow and, at the same time, smaller than the cylinder diameter amplifies and interacts with the cylinder boundary layer.
Examination of the effect of turbulence intensity upon the increase in the pressure rise coefficient and the atten- dant aft shift of the separation angle was accomplished by introducing a turbulence parameter for each Reynolds number- turbulence situation. This turbulence parameter is given by the product of the square of a characteristic turbulence intensity (based on the freestream velocity) and the Reynolds number, viz., by TuzRe, (ref. 8, p. 546). In fact, this turbulence parameter is a measure of the ratio of
52

turbulent energy production (or turbulent momentum transport) to viscous momentum transport (transport of mean momentum due to the action of viscous stresses). At the same time, this turbulence parameter is the product of a characteristic turbulence intensity and a turbulent Reynolds number Re t based on the rms value u' of turbulent veloc- ity since u' = (T)%.
TuzRe = TuRet, where Tu = u'/U,, Ret = u'D/v and
Variations of the pressure rise coefficient C' pbm
and turbulent separation angle 9; as function of this turbu- lence parameter are portrayed in Figs. 6.25 and 6.26, respectively. Their variations with the turbulence param- eter expressed in terms of the background turbulence intensity at the test position TugRe and the critical tur- bulence intensity TusRe are shown in each figure for each grid position ((a) and (b) in Figs. 6.25 and 6.26). In addition, their changes with these two turbulence parameters at given Reynolds number with varying grid position (or test position) is portrayed in these two figures by dashed curves. The relatively high values of either turbulence parameter-viz., TugRe = 87 to 256 and TuERe = 64 to 949, which are tabulated in Table A.VI.2, App. VI-indicate that the flow is dominated by turbulence and that the viscous effects are negligible. Both C'
pbm and % exhibit an
almost similar continuous increase with either turbulence parameter for any grid position and at any given Reynolds number reflecting the increasing effect of turbulent momen- tum transfer to the boundary layer. At the present highest subcritical Reynolds number of 2.09x10⁵, both C'
pbm and 0;
attained asymptotically maximum values independently of the grid position. This limiting behavior attests to the finite effect of the amplified turbulence upon the increase in the pressure rise coefficient and the rearward shift of the separation angle.
The issue at stake is to account for the scale structure of the background turbulence in addition to its intensity. To this end, one can use the background turbu- lence longitudinal integral scale at the test position which is representative of the energy-containing eddies (see Sect. 6.1). The pressure rise across the adverse pressure gradient region is basically a function of the fluid proper- ties (density p and dynamic viscosity p), the rms value of background fluctuating velocity
longitudinal in:zgral slale L = (<)%) and the
background turbulence ' ' ' lAb) at
53

the cylinder test position, and the cylinder diameter (D).
the freestream velocity (Uo3), Thus,
pb - pm = F(Pr,P J$rAb,U/'), (6.5)
where the pressure at separation point is taken equal to the base pressure pb, as previously mentioned, and pm denotes the minimum pressure. These variables can readily be grouped in dimensionless terms as following:
C' = F(Ab % pUaD --- @m D 'Uol' 1-1 )I (6.6)
where the pressure rise coefficient across the adverse pres- sure gradient region
C’ pb - pm pbm= kpup e
0
This functional relationship for the pressure rise coeffic.ient can next be expressed in the form
C’ Ab pbm
= F(a TubRe%), (6.8)
in order to account for the neutral scale of the stagnation flow ho = rcD/Re', and where TubRe '/2 is exactly the square- root of the turbulence parameter based on the background turbulence intensity earlier introduced. In terms of the neutral scale, the product of these two dimensionless parameters is given by (Ab/ho)Tub. The angular extent of the adverse pressure gradient region BArn and the separa- tion angle (2 are closely associated with and, as a matter of fact, determined by the pressure rise coefficient. One consequently can assume that they obey the same functional dependence and, hence,
(6.9)
The product of the two dimensionless parameters accounts at once for the intensity and integral scale of background turbulence at the cylinder test position, the
54

Reynolds number, the cylinder diameter, the neutral scale of the stagnation flow, and the transfer of turbulent momentum to the boundary layer through the square-root ot the turbu- lence parameter previously introduced. As a result, one can view the function given by the product of the dimensionless integral scale and the square-root of the turbulent param- eter (Ab/xD)TubRe' as a turbulent separation parameter or criterion for any given Reynolds number-background turbu- lence combination.'
Variations of the pressure rise coefficient Cl pbm' the angular extent of the adverse pressure gradient region 8krn and the separation angle eA with increasing turbulent separation parameter are portrayed in Figs. 6.27, 6.28 and 6.29, respectively. Examination of their variations reveals the existence of distinctly similar correlations between them and the turbulent separation parameter for each partic- ular background turbulence (or grid position). The results over the entire Reynolds-number range collapse on single similar curves for each grid position. At given Reynolds number, C' pbm' 6Hrn and 6; took on higher values as the intensity of the background turbulence was simultaneously,
larger and, its integral scale was smaller, i.e., as the
grid was closer to the cylinder. They further reach asymp- totically an upper limit with increasing turbulence separa- tion parameter regardless of the grid position.
The separation is determined by the pressure rise across the adverse pressure gradient region and, therefore, it is important to examine the change in the adverse pres- sure gradient with varying turbulence separation parameter (Ab/nD)TubReS. An approximation of the average adverse pressure gradient is supplied by the ratio of the pressure rise coefficient to the angular extent of the adverse pres- sure gradient region C~bm'e~m according to
1. Q N p"i $brn Rae- D 'Hm '
(6.10)
where R is the cylinder radius and eLrn is measured in radians. This average adverse pressure gradient also pro- vides an estimate for the shear stress gradient normal to the wall at separation. Another function whose change with the turbulence separation parameter is of prime concern is the ratio of the pressure rise coefficient to the separation angle Cibm/e; (where 6; is in radians). This ratio is
55

essentially a measure of the effect of the pressure rise coefficient upon the position of turbulent separation and, hence, it can be viewed as a separation coefficient.
Variations of the average adverse pressure gradient and the separation coefficient as function of the turbulent separation parameter are displayed in Figs. 6.30 and 6.31, respectively. The values of ( Ab/nD )TubRe 4 , C;bm/e Am and
Cibm'ek are further tabulated in Table A.VI.2, App. VI, for each Reynolds number-grid position combination. Both exhibit an identical change for each grid position. Their variations with increasing turbulent separation parameter are, in fact, similar to those of their components. The aspect of interest is that both the average adverse pressure gradient and separation coefficient are described over the entire subcritical Reynolds-number range by single correla- tions for each particular grid position.
The behavior of the average adverse pressure gradient (C' pbm"km) and the separation coefficient (Cl pbm/e;), along with that of their components (Cl pbm' 'Am and eg), with increasing turbulent separation parameter is similar to those of the other characteristics of the pressure distribu- tion (Cl
pm' e;, eHrn, eAs, cl pb and C' pbm) with higher Reynolds
number. This general similar behavior of all these charac- teristics of the pressure distribution is the result of the change in the nature of the initial laminar boundary layer to partially or even fully turbulent effected by the ampli- fied turbulence. The increase in the values of these char- acteristics up to certain plateaus is due to the penetration into the boundary layer of these energy-containing eddies within which the turbulent energy amplifies and which are, at the same time, of scales commensurate with the boundary- layer thickness. One cannot expect a continuous increase in the values of these characteristics with higher turbulent separation parameter and/or Reynolds number because of the inherent attendant increase in the size of the energ-y- containing eddies. As the scale of these eddies becomes larger, the amount of turbulent energy supplied to the boundary layer settles down at some constant level. Conse- quent upon attaining such a state of equilibrium, the values of the various characteristics of the pressure distribution reach finite upper limits with increasing turbulent separa- tion parameter and/or Reynolds number. It should further be noted that one cannot expect to express the variations of the various characteristics of the pressure distribution by means of single correlations in terms of the turbulent separation parameter for all Reynolds number-background turbulence combinations. This is due to the evolution of the properties of turbulence and, particularly, its
56

amplification by stretching as it is conveyed by the mean flow toward the cylinder.
The important aspect of the various correlations based on athe ;twtbuLent sepahtion ptiamti~ LA that ;they phov.ide an empihic~ m&hod ;to e~C.maAe. the ctuhbutent bepatration angle. and aclnociated charr- ac;tti;ticn 06 the advme phenhuhe ghadieti heggion don an.y given ReynoiU numben-bachghound ttibu&znce combina;tion in X~YWS 06 no&&y ;two headily mcmutrablee. phOpen;tie?, 06 athe bachghound ttibulence, Xhe. Reynolds numbm and the cylinden Cam&%
6.10 Mean Turbulent Drag Coefficient
The sectional mean turbulent drag coefficient CDt was computed for each Reynolds number-background turbulence (or grid position) combination by integrating the corresponding measured surface pressure distribution according to Eq. (3.3). This drag coefficient accounts solely for the form (or pressure) drag which, as a matter of fact, constitutes the major part of the total drag since the friction drag is negligible compared with the former as in smooth incident flow (refs. 2,18,19).
The mean turbulent drag coefficients for all fifteen Reynolds number-grid position cases are plotted as function of increasing Reynolds number in Fig. 6.32. For compari- son's sake, the measured (uncorrected) laminar drag coeffi- cients 'DQ over the same Reynolds-number range are also shown in this figure. Values of both drag coefficients and their ratio are further compiled in Tables A-VI.2 and A.VI.3, App. VI. The drag coefficient in both incident flows decreased with higher Reynolds number, with a much greater decrease in turbulent incident flow. As a matter of fact, the greater decrease of the drag coefficient in turbu- lent incident flow reflects the associated increase of the corresponding base pressure coefficient (vid., Fig. 6.15) and, hence, the variation of the former is essentia&ly the mirror image of the latter.
The mean turbulent drag coefficient decreased from about 1.0 to 0.44, 1.13 to 0.43 and 1.14 to 0.43 with increasing Reynolds number from 5.2~10~ to 2.09x10⁵ as the grid was positioned at "x4 = 8,14 and 20, respectively. On the other hand, the laminar drag coefficient diminished over the same Reynolds-number range from about 1.07 to 0.93. Turbulent drag coefficients smaller than their laminar counterparts were, for the most part, obtained at each Reynolds number. These smaller drag coefficients are the result of the attendant increase in the base pressure coefficients (less negative).
57

._ -- --.- .-. .-.-..- _.-.--..-
Only in two cases in which the base pressure coefficient was more negative in turbulent incident flow than in smooth incident -flow, viz., at the lowest Re = 5.2~10~ with the grid at x4 = 14 and 20 (vid., Fig. 6.15), the drag coeffi- cient was greater by about 6 to 7% than its laminar counter- part. One can conjecture that these two slightly larger drag coefficients in turbulent incident flow are due to insufficient weakening of the forming vortices since the wake width was, in all likelihood, of about the same magni- tude as the cylinder diameter according to the corresponding separation angles (95 and 85O). These two cases are marked off by a flag in Fig. 6.24 for convenience's sake. It is further important to note that the turbulent drag coeffi- cient decreased to a minimum value of about 0.43 to 0.44 independently of the background turbulence (or grid posi- tion) at the highest present Reynolds number of 2.09x10⁵. This asymptotic behavior of the turbulent drag coefficient with increasing Reynolds number is similar to that found for all the other characteristics of the pressure distribution.
The ratio of the turbulent drag coefficient to its laminar counterpart CDt/CDQ was next inspected in order to point out the reduction of the drag coefficient induced by turbulence. Variations of this ratio with increasing Reynolds number for each grid position are depicted in Fig. 6.33, while their values are listed in Table A.VI.2, App. VI. Note that the two cases in which the turbulent drag coefficient was slightly greater than its laminar counterpart are also marked off by a flag in this figure. The turbulent drag coefficient amounted in most cases-viz., thirteen out of fifteen different Reynolds number-background turbulence cases surveyed-from about 97 to 46% of the laminar drag coefficient depending upon the particular Reynolds number-background turbulence combination. Larger reduction of the turbulent drag coefficient was generally found at each Reynolds number when the grid was closer to the cyl&nder, i.e., at higher intensity and, simultaneously, smaller integral scale of background turbulence. This not- able diminution of the turbulent drag coefficient testifies to the energizing of the boundary layer consequent upon the penetration of turbulence into it.
It should further be noted that the turbulent drag coefficients obtained here at subcritical Reynolds numbers are generally of the same magnitude as those for a smooth cylinder in a smooth incident flow at higher critical, supercritical and even transcritical Reynolds numbers (refs. 19,34,47,48,50). This contLenpondence 04 Xhe drrag coed&- tier&, aLong wtih thti 06 the bep&on pain&, ,wzLica;tti ;thaat athe pene.a%Lion 05 ;twrbLLeence in20 Xhe boundatry Laym inducen ove~~al?L phop- err;tien climieti to alone dound a.X much highen Reynol& nwnbm.
58
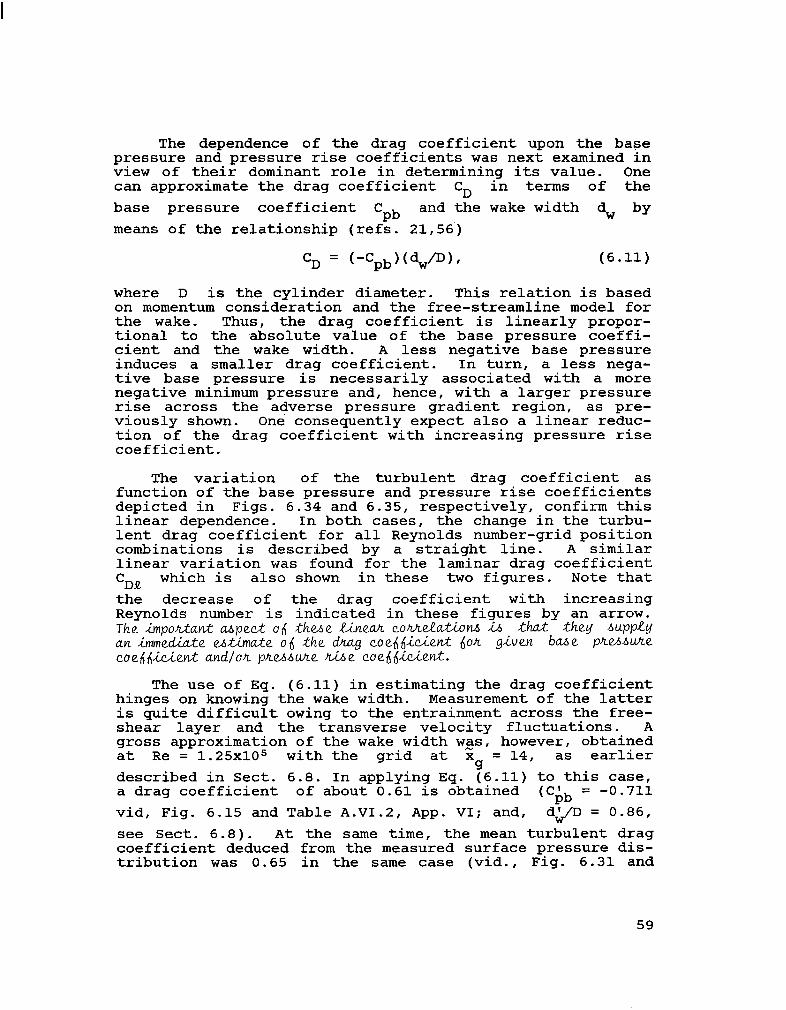
The dependence of the drag coefficient upon the base pressure and pressure rise coefficients was next examined in view of their dominant role in determining its value. One can approximate the drag coefficient CD in terms of the base pressure coefficient Cpb and the wake width dw by means of the relationship (refs. 21,56')
cD = (-Cpb) <d,/D) t (6.11)
where D is the cylinder diameter. This relation is based on momentum consideration and the free-streamline model for the wake. Thus, the drag coefficient is linearly propor- tional to the absolute value of the base pressure coeffi- cient and the wake width. A less negative base pressure induces a smaller drag coefficient. In turn, a less nega- tive base pressure is necessarily associated with a more negative minimum pressure and, hence, with a larger pressure rise across the adverse pressure gradient region, as pre- viously shown. One consequently expect also a linear reduc- tion of the drag coefficient with increasing pressure rise coefficient.
The variation of the turbulent drag coefficient as function of the base pressure and pressure rise coefficients depicted in Figs. 6.34 and 6.35, respectively, confirm this linear dependence. In both cases, the change in the turbu- lent drag coefficient for all Reynolds number-grid position combinations is described by a straight line. A similar linear variation was found for the laminar drag coefficient 'DQ which is also shown in these two figures. Note that the decrease of the drag coefficient with increasing Reynolds number is indicated in these figures by an arrow. The impotiant tipat 06 thtine L&eat co~~eLtion~ A that they hupp&i
an immediate e,&Cma;te 06 the dhag coet$dicier?;t doh given bane pheAhu&t coe~,(icien.t and/oh pheAh#Le nine coefi~icient.
The use of Eq. (6.11) in estimating the drag coefficient hinges on knowing the wake width. Measurement of the latter is quite difficult owing to the entrainment across the free- shear layer and the transverse velocity fluctuations. A gross approximation of the wake width w_as, however, obtained at Re = 1.25~10~ with the grid at xg = 14, as earlier described in Sect. 6.8. In applying Eq. (6.11) to this case, a drag coefficient of about 0.61 is obtained (Cbb = -0.711 vid, Fig. 6.15 and Table A.VI.2, App. VI; and, dp = 0.86, see Sect. 6.8). At the same time, the mean turbulent drag coefficient deduced from the measured surface pressure dis- tribution was 0.65 in the same case (vid., Fig. 6.31 and
59

Table A.VI.2, App. VI) and, hence, it was about 7% greater than that deduced by means of Eq. (6.11). This relatively reasonable agreement indicates that one can apply Eq. (6.11) to roughly approximate the mean turbulent drag coefficient. A poorer agreement was, on the other hand, found at the same Reynolds number in smooth incident flow. The measured laminar drag coefficient was about 1.05 (vid., Fig. 6.32), while that estimated according to Eq. (6.11) amounted to 1.25 (Cpb = -0.939, via., Fig. 6.7 and Table A.VI.3, App. VI; and dw/D = 1.33, see Sect. 6.8). Thus, the mea- sured laminar drag coefficient was about 16% smaller.
Attempts to estimate the wake width according to Eq. (6.11) based on the measured values of C'
pb and 'Dt
were only partially successful. In five cases (viz., at Re = 5.2~10~ with the grid at "x = 8 and 14; at Re = 9.4x10⁴ with the grid at "x
cl = 14 and 2: ; and at Re = 1.25~10~ with
the grid at 2 g
= 20) in which the observed separation angle was distinctly greater than 90°, the calculated values of the wake width were larger than the cylinder diameter (viz., d;/D varied between 1.01 and 1.07). It is conjectured that these larger values are due to the intrinsic limitations of the free-streamline model of the wake since the entrainment across the wake and its dependence upon the Reynolds number are not accounted for in this model. It is interesting to remark that a similar lack of agreement was found in smooth incident flow at higher supercritical Reynolds numbers (ref. 21).
60

7. DISCUSSION OF RESULTS
The separation angles and mean turbulent drag coefficients, along with the characteristics of the mean surface pressure distribution, obtained here for a smooth cylinder in turbulent incident flow at subcritical Reynolds numbers are by and large of the same magnitude as those found for a smooth cylinder in smooth incident flow at higher critical, supercritical and transcritical Reynolds numbers, as previously alluded to. In order to stress this striking similarity and its implication concerning the nature of the boundary layer, it is imperative to compare the present results with those reported at these higher Reynolds numbers.
The division of smooth flow about a smooth cylinder into four distinct regimes with increasing Reynolds number beyond lo4 is associated with the nature of the boundary layer and the properties of the wake. Consequently, speci- fication of these regimes in terms of Reynolds-number ranges depends on myriad interweaved characteristics, viz., magni- tude and position of the minimum pressure, angular extent of the adverse pressure gradient region and the pressure rise across it, magnitude of the base pressure, laminar separa- tion, occurrence of a laminar separation bubble followed by transition and reattachment to a turbulent boundary layer and turbulent separation, direct transition from a laminar to a turbulent boundary layer followed by turbulent separa- tion, shear layer instabilities, narrowing of the wake and entrainment across it, vortex shedding frequency and associ- ated Strouhal number, and the drag coefficient. In view of this complex dependence, which is not yet completely eluci- dated, the Reynolds-number ranges of these flow regimes are estimated based on the position of the separation point and the magnitude of the drag coefficient as briefly outlined hereinafter.
The subcritical flow regime extends to a Reynolds number of about 1.2~10~ (ref. 47) or 2~10~ (ref. 21) or even 2.5~10~ (ref. 19). This flow regime is characterized by a laminar boundary layer with laminar separation around 80°, high negative base pressure, a relatively wide wake, and a drag coefficient approximately constant at values ranging between 1.20 and 0.90.
The critical (or lower transition) flow regime develops as the Reynolds number increases to about 5~10~ (ref. 21) or 6~10~ (ref. 47). In this flow regime, the laminar separa- tion shifts initially to about 110' (ref. 47) with increas- ing Reynolds number as the flow is able to follow the body contour over a longer distance consequent upon a decrease in the friction forces. With further increase in the Reynolds
61

number, there appears a short laminar separation bubble in the adverse pressure gradient region followed by transition and reattachment to a turbulent boundary layer and turbulent separation at 130 to 140° (ref. 47) which is associated with a less negative base pressure and a narrower wake. In this flow regime, the drag coefficient drops quite rapidly from its nearly constant subcritical value to a minimum of about 0.30 (refs. 21,47) and even to O-14-0.20 (refs. 48,50). This minimum drag coefficient is found at a criti- cal Reynolds number of 3~10~ (ref. 47) or 5~10~ (refs. 21, 34,50).
The supercritical (or upper transition ) flow regime extends between Reynolds numbers of 5-6~10~ and 2x10⁶ (ref. 47) or 3.5~10~ (refs. 19,21). Characteristic of this flow regime is the forward movement of the transition to a turbulent boundary layer which leads to the gradual exter- mination of the laminar separation bubble and, hence, to direct transition to a turbulent boundary layer at angles larger than 90° and even slightly smaller than 90°. As a result, the turbulent separation angle moves forward to around 120°, the wake slightly opens, the base pressure becomes more negative, and the drag coefficient increases to about 0.40 to 0.70 (refs. 21,47,48,50). It should be noted that both the critical and supercritical flows are highly sensitive to any flow disturbance.
Finally, the transcritical flow regime exists at Reynolds numbers greater than 2~10~ (ref. 47) or than 3.5~10~ (ref. 21). In this flow regime, the direct transi- tion from a laminar to a turbulent boundary layer moves upstream on the front of the cylinder at angles smaller than 9o" followed by turbulent separation on its back part. Transition occurs at angles ranging from 80 to about 20' with increasing Reynolds number and turbulent separation transpires at a nearly constant angle between 110 and 120°. The base pressure and the wake width remain at almost con- stant levels and, at the same time, the drag coefficient is approximately constant at values varying from 0.40 to 0.70 (refs. 21,47,48,50).
It is apparent that the boundaries among these four flow regimes are loosely delineated and that no consensus concerning the Reynolds-number range of each flow regime has yet been reached. This is due to the inherent differences among the results of the various investigations and the want for a calibration experiment specifically conceived to advance standard Reynolds-number range for each flow regime. In view of the observed disparaties and based on a review of published data (refs. 19,21,34,47,48,50,57), including that of the present investigation, the following Reynolds-number ranges are proposed for these four flow regimes: (1) subcritical flow at Re < 2.5~10~; (2)
62

critical flow at 2.5~10~ < Re < 5~10~; (3) supercritical flow at 5x10⁵ < Re < 3.5~10~; and, (4) transcritical flow at Re > 3.5~10~. These Reynolds-number ranges are advanced, according to the established custom, based on the variations of the separation angle and the drag coefficient with increasing Reynolds number in smooth incident flow.
The results obtained here in turbulent incident flow at subcritical Reynolds numbers were compared with those reported by Achenbach (refs. 19,47), Guven et al. (ref. 34), James et al. (ref. 48) and Jones et al. (ref. 50) for a smooth cylinder in a smooth incident flow in critical, supercritical and transcritical flow regimes. A summary of the experimental conditions under which the data taken from these five studies was collected is provided in Table 4 below. In addition to the Reynolds numbers, the freestream turbulence intensity (Tu) of the nominally smooth incident flow, the freestream Mach number (M), the blockage coeffi- cient (D/h), and the relative surface roughness (k/D) are listed in this table. Lack of information is denoted by NR which means not reported. The experimental conditions of the present test (background turbulence intensity at the test position, blockage coefficient, relative surface rough- ness) are given in this table for convenience's sake. It is apparent that the incident flow in these five studies can be classified as smooth since the freestream turbulence inten- sity was always below 1%. The Mach number is included in Table 4 in order to point out that the compressibility effect upon the separation angle and drag coefficient can be disregarded at the selected high transcritical Reynolds numbers. This effect is important at Mach numbers greater than about 0.25 or 0.30 (ref. 50). The blockage coefficient is listed for comparison's sake despite that no correction was applied. Note that the blockage was the smallest in the present test. The values of the relative surface roughness indicate the high degree of smoothness of the cylinders used
TABLE 4. EXPERIMENTAL CONDITIONS
Source Ref. (JK%)
Tu (%I
19,Figs. 4-6, 2.6-36 0.70 Achenbach 9-10
47,Figs. 6-9 1.0-40 0.45 Guven et al. 34,Tb. 4.2 2.24-5.63 0.20 James et al. 48,Figs. 3-6 9.2-109 NR
Jones et al. 50,Figs. 5,lO 4.0-90 0.17 Tb. 1
Present Test 0.52-2.09 2.05-4.10
Tb. means Table; NR means not reported.
M D/h (%I
< 0.1 16.7
c 0.1 16.4 < 0.1 17.8
0.27- 9.2- 0.28 13.1
< 0.30 19.3
< 0.1 8.7
1%
NR NR
0.185- 0.309
0.185
1.6
63

in these studies. In the two cases in which the relative surface roughness is not reported, the appearance of the cylinder surface is described as 'highly polished'.
Variations of the separation angle Us and drag coefficient CD measured here, along with those given and/or deduced from the data reported in the foregoing five studies, are portrayed as function of increasing Reynolds number in Figs. 6.36 and 6.37, respectively. In addition, the variations with increasing Reynolds number of the angular extent of the adverse pressure gradient region es,, the base pressure coefficient
%b and the pressure rise
coefficient C pbm
obtained in the present investigation and in the aforementioned studies are shown in Figs. 6.38, 6.30 and 6.40, respectively. The four flow regimes are deline- ated in all these figures according to the Reynolds-number ranges introduced herein.
The similarity of the present results with those in smooth incident flow at higher Reynolds numbers is clearly discerned. This remarkable similarity attests to the effect of the interaction of amplified turbulence with the boundary layer as proposed by the vorticity-amplification theory. The prevalent laminar boundary layer in the subcritical regime is energized by the penetrating turbulence and, conse- quently, its characteristics and nature are drastically altered. It should be noted that the behavior of the modi- fied boundary layer cannot exactly be assessed at this time since measurements of the velocity variation within it, the skin friction and the wake have not yet been completed. One can, however, hypothesize what are the main changes in the nature of the boundary layer based on the observed similar- ity of the various characteristics. In view of the depen- dence of these changes upon Reynolds number-background tur- bulence combination and of the division of smooth incident flow in distinct flow regimes, each case is examined accord- ing to the observed separation angle and associated mean drag coefficient. Inspection of the gradual increase in the separation angle and the attendant reduction of the mean turbulent drag coefficient with higher Reynolds number for each grid position (or background turbulence) shown in Figs. 6.36 and 6.37 suggests the realization of four different types of boundary layer.
At the present 1owesJ subcritical Reynolds number of 5.2~10~ with the grid at xg
= 14 and 20, separation angles (95 & 85") and drag coefficients (1.13 & 1.14) slightly larger than in smooth incident flow were found. These results indicate that the interaction of turbulence with the
64

boundary layer supplied additional momentum that enabled the flow to follow the cylinder contour for a little longer dis- tance but, in all likelihood, not sufficient to alter the initial laminar nature of the boundary layer. The slight increase in the drag is, as a matter of fact, the outcome of this lengthening. One can view this slightly longer laminar boundary layer as being buffeted by the turbulence, viz., a buffeted laminar boundary layer. As far as the similarity of this buffeted laminar boundary layer to that in smooth- incident flow at higher Reynolds numbers is concerned, it corresponds to that found in the lower Reynolds-number range (Re < 3~10~) of the critical regime.
Separation angles greater than 90° (105 & llO") and drag coefficients slightly smaller than in smooth incident flow (1.0 & 1.03)-were obtained at Re = 5.2~10~ and 9.4x10⁴ with the grid at
xg = 8 and 20, respectively. In addition,
a short laminar separation bubble apparently occurred around the cylinder crest (around 90 to 100°) ahead of separation in these two cases, as earlier mentioned. One can, there- fore, infer that the penetration of turbulence into the boundary layer provided sufficient momentum to arrest the growth of the laminar separation bubble and to induce, down- stream of it, transition and reattachment to a short turbu- lent boundary layer followed by turbulent separation. This boundary layer can also be considered as buffeted by the turbulence in view of its structure. It is further apparent that this boundary layer is essentially similar to that prevailing in smooth incident flow in the critical regime.
At Re = 9.4x10⁴ with the grid at xg = 8 and 14 and at Re = 1.25~10~ with the grid at zg = 20, separation angles on the back of the cylinder (125,120 & 122O) along with drag coefficients smaller than in smooth incident flow (0.68,0.93 SC 0.85) were monitored. Simultaneously, no indi- cation of the occurrence of a laminar separation bubble was detected. One can, therefore, deduce that the energizing of the boundary layer by the penetrating turbulence caused in these cases eradication of the laminar separation bubble and, hence, direct transition to a turbulent boundary at angles larger than 90° followed by turbulent separation. Thus, this boundary layer exhibits features similar to those found in smooth incident flow in the supercritical regime.
Finally, at Re = 1.25~10~ with the grid at "x g = 8 and
14 and at R_e = 1.67~10~ and 2.09x10⁵ for all three grid positions (xg = 8,14,20), nearly constant separation angle of 130° (128 to 130°) and drag coefficients much smaller than in smooth incident flow and of almost constant magni- tude (0.65 to 0.43) were obtained. This behavior indicates
65
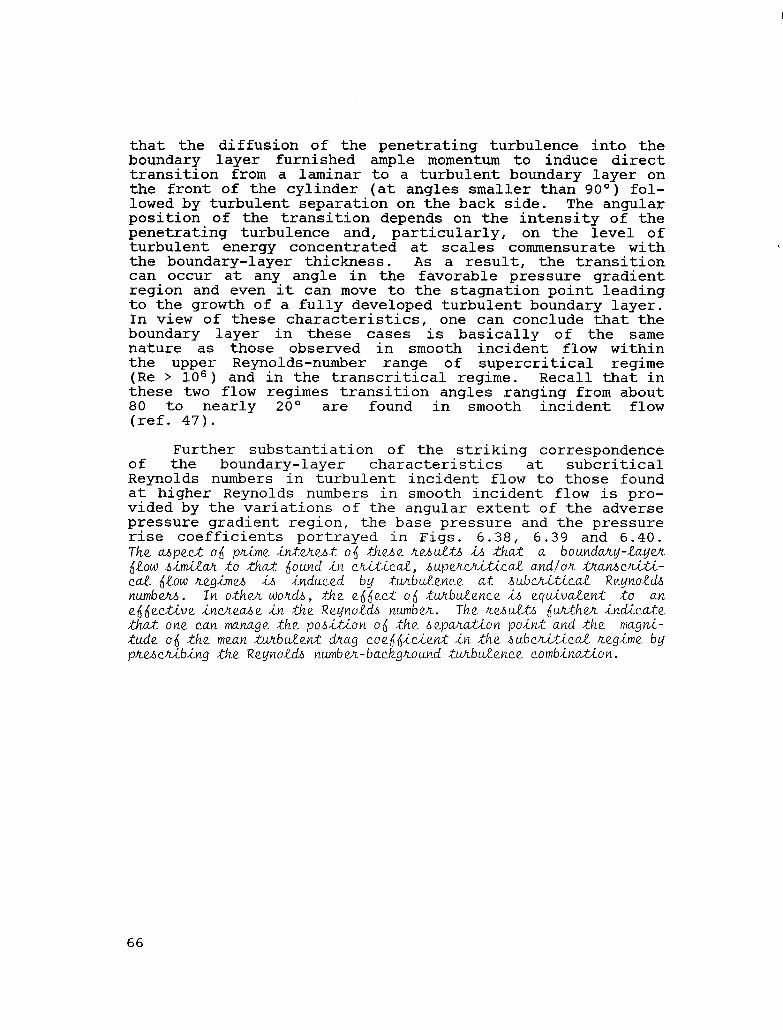
that the diffusion of the penetrating turbulence into the boundary layer furnished ample momentum to induce direct transition from a laminar to a turbulent boundary layer on the front of the cylinder (at angles smaller than 90") fol- lowed by turbulent separation on the back side. The angular position of the transition depends on the intensity of the penetrating turbulence and, particularly, on the level of turbulent energy concentrated at scales commensurate with the boundary-layer thickness. As a result, the transition can occur at any angle in the favorable pressure gradient region and even it can move to the stagnation point leading to the growth of a fully developed turbulent boundary layer. In view of these characteristics, one can conclude that the boundary layer in these cases is basically of the same nature as those observed in smooth incident flow within the upper Reynolds-number range of supercritical * (Re > 106) and in the transcritical regime. Recall tiea??: these two flow regimes transition angles ranging from about 80 to nearly 20° are found in smooth incident flow (ref. 47).
Further substantiation of the striking correspondence of the boundary-layer characteristics at subcritical Reynolds numbers in turbulent incident flow to those found at higher Reynolds numbers in smooth incident flow is pro- vided by the variations of the angular extent of the adverse pressure gradient region, the base pressure and the pressure rise coefficients portrayed in Figs. 6.38, 6.39 and 6.40. The anpec;e 06 ptime in;te,tent 06 XhtinQ trenul% 22~ XhaX a boundany-layeh &tow nimieah Xo XhaR: hound in c&t&de, aupehcttitic& andlok ;trraticni;ti- cd. @OW hegimeh in induced by twLbuRence at subchi.ticaX Reyno&& numbm. 7n o,the,t wohcik, athe. e~~w.t 06 tutbukknce in equiv~eti .to an e~~ectiwe inchetie. in Rhe. Reynoki6 numbeh. The hehL&& ljtihen indica;te rtha;t one can manage Xhe po&a%on 06 ;thg ~qztu.LLon point and Xhe. mugrzi- ;tude 06 ;the mean twrbu&ti dhag coe6fjicient in ihe aubchitical? hC?gime by phebchibing ;the RcynoLds numba-bachghound tuhbuknce combintion.
66

8. CONCLUDING REMARKS
The results presented in this work indicate quite clearly that the interaction of incident turbulence with the initial laminar boundary layer on a smooth circular cylinder in crossflow at subcritical Reynolds numbers from 5.2~10~ to 2.09x10⁵ modifies the characteristics of the mean surface pressure distribution, delays the separation and reduces the drag. These changes exhibited a distinct dependence upon the Reynolds number-background turbulence combination, where the latter is the grid-produced turbulence monitored behind the grid at the test position of the cylinder in its absence. Generally, the modifications of the characteris- tics of the mean surface pressure distribution consisted of: (1) a more favorable pressure gradient along the front of the cylinder; (2) a more negative minimum pressure and a rearward shift in its angular position; (3) a longer adverse pressure gradient region and a greater pressure rise across it; (4) a shorter base region; and, finally, (5) a less negative base pressure than in smooth (laminar) incident flow at the same Reynolds number. The aft shift in the separation point ranged from 5 to a maximum of 50° beyond the constant laminar separation angle of about 80°, since separation angles varying from 85 to 130° were obtained based on the mean surface pressure distribution and further corroborated by their visualization. At the same time, the mean turbulent drag coefficient reduced from around 1.0 to about 0.43 with increasing Reynolds number and, hence, it amounted, for the most part, from 97 to 46% of its nearly constant laminar counterpart. Only in two cases out of the different fifteen Reynolds number-background turbulence situations surveyed, the mean drag coefficient was slightly greater (by about 6 to 7%) than in smooth incident flow due to the nature of the boundary layer.
These significant changes in the properties of the boundary layer result, according to the vorticity-amplifica- tion theory, from the energizing of the initial laminar boundary layer by penetrating turbulence concentrated at scales commensurate with its thickness. Turbulent energy accumulates within such eddies owing to the preferred ampli- fication of freestream turbulence induced by the stretching of cross-vortex tubes in the diverging flow around the cylinder. These energy-containing eddies form a coherent substructure near the cylinder stagnation zone (refs. 6,58), which ensures a continual supply of turbulent momentum and energy to the boundary layer.
This turbulence-boundary layer interaction mechanism is supported by the correlations among the various character- istics of the mean surface pressure distributions and the position of the separation point with a turbulence parameter
67

TuiRe (or TugRe) and a turbulent separation parameter (Ab/nD)TubReS. These correlations attest to the transfer of turbulent momentum to the boundary layer and to the dependence of the interaction on the scale of the background turbulence. In addition, these correlations supply a method that permits immediate estimation of the turbulent separa- tion angle and associated characteristics of the adverse pressure gradient region for any given Reynolds number- background turbulence combination in terms of solely- two readily measurable properties of the background turbulence, the Reynolds number and the cylinder diameter.
The separation angles, the mean drag coefficients and the characteristics of the mean surface pressure distribu- tion, measured at the present subcritical Reynolds numbers (5.2x10⁴-2.09x10⁵) in turbulent incident flow are gener- ally of the same magnitude as those reported for a smooth cylinder in smooth incident flow at higher critical (2.5x10⁵-5x10⁵), supercritical (5x10 5-3.5x1O6) and trans- critical (> 3.5x10⁶) Reynolds numbers. This similarity substantiates the proposition that the penetrating turbu- lence modifies the nature and properties of the initial laminar boundary layer. However, the degree of modification depends: (1) on the extent to which the penetrating ampli- fied turbulence supplies sufficient momentum to enable the flow to follow the cylinder contour for a longer distance; and, (2) on the increase in the base pressure (less nega- tive) consequent upon the weakening of the forming vortexes in the near wake which, in turn, is induced by the e.ntrain- ment across the wake of fluid from the outer turbulent flow.
Further examination of the correspondence of the separation angles and the drag coefficients suggests that turbulence promotes, depending on the particular Reynolds number-background turbulence (or grid position) combination, the development of: (1) a buffeted laminar boundary layer at lower subcritical Reynolds number, which is similar to that found in the critical regime; (2) direct transition on the back of the cylinder from a laminar to a turbulent boundary layer followed by turbulent separation at inter- mediate subcritical Reynolds numbers, which is similar to that found in the supercritical regime; and, for the most part, (3) direct transition on the front of the cylinder and, in all probability, even at the stagnation point to a turbulent boundary layer followed by turbulent separation on the back side at higher subcritical Reynolds numbers, which is generally similar to that found in the supercritical and, particularly, in the transcritical regime. A buffeted laminar boundary layer is either a slightly longer laminar boundary layer that separates laminarly around the cylinder crest and/or a laminar boundary layer with a short laminar separation bubble around the cylinder crest followed on the
68

back of the cylinder by transition and reattachment to a short turbulent boundary layer and turbulent separation.
These hypotheses are submitted here based on the observed similarity of the separation angles and drag coef- ficients, along with that of the key characteristics of the surface pressure distribution, since the survey of the modified boundary layer has not yet been consummated. Notwithstanding the relatively conjectural aspect of these hypotheses, the results clearly point out that the interac- tion of turbulence with the boundary layer is equivalent to an effective increase in the Reynolds number. Another aspect of major interest revealed by the results is that one can manage the position of the separation point and the magnitude of the mean drag coefficient at subcritical Reynolds numbers by controlling the Reynolds number- background turbulence combination.
In conclusion, the change in the nature of the boundary layer in the subcritical regime as a result of the penetra- tion of turbulence into it is in basic agreement with the model put forward by the vorticity-amplification theory.
69
REFERENCES
1.
2.
3.
4.
5.
6.
7.
8.
9.
10.
11.
Fage, A. & Warsap, J. H.: The effects of turbulence and surface roughness on the drag of a circular cylinder. ARC R&M 1283, 1929, pp. l-8.
Fage, A. & Falkner, V. M.: Further experiments on the flow around a circular cylinder. ARC R&M 1369, 1931, PP- 186-198.
Giedt, W. H.: Effect of turbulence level of incident air stream on local heat transfer and skin friction on a cylinder. J. Aero. Sciences, vol. 18, no. 11, 1951, PP- 725-730.
Sutera, S. P., Maeder, P. F. & Kestin, J.: On the sensitivity of heat transfer in the stagnation-point boundary layer to freestream vorticity. J. Fluid Mech., vol. 16, part 4, 1963, pp. 497-520.
Sadeh, W. Z., Sutera, S. P. & Maeder, P, F.: Analysis of vorticity amplification in the flow approaching a two-dimensional stagnation point. Z. angew. Math. Phys. (ZAMP-J. Appl. Math. & Phys.), vol. 21, fast. 5, 1970, pp. 699-716.
Sadeh, W. Z. & Brauer, H. J.: A visual investigation of turbulence in stagnation flow about a circular cylinder. J. Fluid Mech., vol. 99, part 1, 1980, PP- 53-64.
Schlichting, H.: Boundary-Layer Theory. 7th ed., McGraw-Hill Book Co., New York, New York, 1979.
Corrsin, S.: Turbulence: Experimental Methods. Encyclopedia of Fhysics, eds. Fliigge, S. & Truesdell, C Fluid Dynamics II, vol. VIII/2, Springer-Verlag, Berlin, 1963.
Comte-Bellot, G. & Corrsin, S.: The use of a contraction to improve the isotropy of grid-generated turbulence. J. Fluid Mech., vol. 25, part 4, 1966, PP- 657-682.
Gad-el-Hak, M. & Corrsin, S.: Measurements of nearly isotropic turbulence behind a uniform jet grid. J. Fluid Mech., vol. 62, part 1, 1974, pp. 115-143.
Sadeh, W. Z. SC Sullivan, P. P.: Turbulence behind a grid of parallel rods (to be published).
70

12.
13.
14.
15.
16.
17.
18.
19.
20.
21.
22.
23.
Roshko, A.: On the development of turbulent wakes from vortex streets. NACA TR 1191, 1954.
Taylor, G. I.: The spectrum of turbulence. Proc. Roy. sot., A, Vol. CLXIV, 1938, pp. 524-533.
Sadeh, W. Z., Brauer, H. J. & Durgin, J. R.: Dry- surface coating method for visualization of separation on a bluff body. AIAA J., vol. 19, no. 7, 1981, PP- 954-956.
Hurd, C. W., Chesky, K. P. & Shapiro, A. H.: Influence of viscous effects on impact tubes. Trans. ASME, J. Appl. Mech., vol. 20, no. 2, 1953, pp. 253-256.
Dean, R. C., Jr., ed.: Aerodynamic Measurements. Gas Turbine Lab., Massachusetts Inst. of Technology, Cambridge, Massachusetts, 1955, pp. 61-65.
Ower, E. & Pankhurst, R. C.: The Measurement of Airflow. 4th ed., Pergamon Press, London, Englanc 1966, pp. 45-46.
Goldstein, S., ed.: Modern Developments in Fluid Dynamics. Vol. II, Dover Publications, Inc., SW York, New York, 1965, p. 428.
Achenbach, E.: Distribution of local pressure and skin friction around a circular cylinder in cross-flow up to Re = 5~10~. J. Fluid Mech., vol. 34, part 4, 1968, PP- 625-639.
Allen, H. J. & Vincenti, W. G.: Wall interference in a two-dimensional-flow wind tunnel, with consideration of the effect of compressibility. NACA Report No. 782, 1944.
Roshko, A.: Experiments on the flow past a circular cylinder at very high Reynolds number. J. Fluid Mech., vol. 10, part 3, 1961, pp. 345-356.
Dalton, C.: Allen and Vincenti blockage corrections in a wind tunnel. AIAA Journal, vol. 9, no. 9, 1971, PP- 1864-1865.
Farell, C., Carrasguel, S., Giiven, 0. & Patel, V. C.: Effect of wind-tunnel walls on the flow past circular cylinders and cooling tower models. Trans. ASME, J. Fluid Engin., vol. 99, series 1, no. 3, 1977, PP- 470-479.
71
24.
25.
26.
27.
28.
29.
30.
31.
32.
33.
34.
Maskell, E. C.: A theory of blockage effects on bluff bodies and stalled wings in a close wind tunnel. ARC R&M 3400, 1963.
McKeon, R. J. & Melbourne, W. H.: Wind tunnel blockage effects and drag on bluff bodies in a rough wall boundary layer. Proceedings, Third International Conference on Wind Effects on Buildings and Structures, Tokyo, Japan, 6-9 September 1971, ed., Japanese Organizing Committee, Saikon Co., Ltd., Tokyo, Japan, 1971, pp. 263-272.
Modi, V. J. & El-Sherbiny, S.: Wall confinement effects on bluff bodies in turbulent flows. Proceed- ings, Fourth International Conference on Wind Effects on Buildings and Structures, London, England, 8-12 September 1975, ed., Eaton, K. J., Cambridge University Press, Cambridge, England, 1977, pp. 121-132.
Achenbach, E.: Influence of surface roughness on the cross-flow around a circular cylinder. J. Fluid Mech., vol. 46, part 2, 1971, pp. 321-335.
Bearman, P. W.: On vortex shedding from a circular cylinder in the critical Reynolds number regime. J. Fluid Mech., vol. 37, part 3, 1969, pp. 577-585.
Modi, V. J. & El-Sherbiny, S.: Effect of wall confinement on aerodynamics of stationary circular cylinders. ibid Ref. 25, pp. 365-375.
Eskinazi, S.: Principles of Fluid Mechanics. Allyn and Bacon, Inc., Boston, Massachusetts, 1968, p. 304.
Flachsbart, 0.: Winddruck auf Gasbehalter, TR Aerodyn. Versuchsanstalt, Gottingen, Germany, IVth series, 1932, PP- 134-138.
Chang, P. K.: Separation of Flow. New York, New York, 1970, p-14.
Pergamon Press,
Batham, J. P.: Pressure distributions on circular cylinders at critical Reynolds numbers. J. Fluid Mech., vol. 57, part 2, 1973, pp. 209-228.
Guven, O., Patel, V. C. and Farell, C.: Surface roughness effects on the mean flow past circular cylinders. Iowa Inst. of Hydraulic Research, Rep. No. 175, University of Iowa, Iowa City, Iowa, 1975.
72

35.
36.
37.
38.
39.
40.
41.
42.
43.
44.
45.
46.
Morsbach, M.: ;;ber die Bedingungen fiir eine Wirbelstrassenbildung hinter Kreiszylinder. Disserta- tion, T. H. Aachen, Aachen, Germany, 1967.
Okamuto, T. SC Takeuchi, M.: Effect of side walls of wind-tunnel on flow around two-dimensional circular cylinder and its wake. Bulletin, Japanese Sot. of Mech. Ew- , vol. 18, no. 123, 1975, pp. 1011-1017.
Wieselsberger, C.: Neuere Feststellungen iiber die Gesetze des Fltissigkeitsund Luftwiderstandes. Physika- lishe Zeitschrift, vol. 22, no. 11, 1921, pp. 321-328.
Schmidt, E. & Wenner, K.: Heat transfer over the circumference of a heated cylinder in transverse flow. English trans., NACA TM 1050, 1943.
Bursnall, W. J. & Loftin, Jr., L. K.: Experimental investigation of the pressure distribution about a yawed circular cylinder in the critical Reynolds number range. NACA TN 2463, 1951.
Delany, N. K. & Sorensen, N. E.: Low-speed drag of cylinders of various shapes. NACA TN 3038, 1953.
Polhamus, E. C.: Effect of flow incidence and Reynolds number on low-speed aerodynamic characteristics of several noncircular cylinders with applications to directional stability and spinning. NACA TR R-29, 1959.
Hinze, J. 0.: Turbulence. 2nd ed., McGraw-Hill Book co., New York, New York, 1975, p. 65.
Dryden, H. I;., Schubauer, G. B., Mock, Jr., W. C. & Skramstad, H. K.: Measurement of intensity and scale of wind-tunnel turbulence and their relation to the critical Reynolds number of spheres. NACA Rep. 581, 1937.
Batchelor, G. K. & Townsend, A. A.: Decay of turbulence in the initial period. Proc., Royal Sot., London, A, vol. 193, 1948, pp. 539-558.
Uberoi, M. S.: Energy transfer in isotropic turbulence. Phy. of Fluids, vol. 6, no. 8, 1963, pp. 1048-1056.
Simpson, R. L.: Review - A review of some phenomena in turbulent flow separation. J. Fluids Engin., Trans. ASME, vol. 103, no. 4, 1981, pp. 520-533.
73

_ ._._ - ._._.... - -.-.--- .--
47.
48.
49.
50.
51.
52.
53.
54.
55.
56.
57.
Achenbach, E.: Total and local heat transfer from a smooth circular cylinder in cross-flow at high Reynolds number. Int. J. Heat Mass Transfer, vol. 18, 1975, PP- 1387-1396.
James, W. D., Paris, S. W. SC Malcolm, G. N.: Study of viscous crossflow effects on circular cylinders at high Reynolds numbers. AIAA J., vol. 18, no. 9, 1980, PP- 1066-1072.
Kamiya, N., Suzuki, S. & Nishi, T.: On the aerodynamic force acting on a circular cylinder in the critical range of the Reynolds number. AIAA 12th Fluids and Plasma Dynamics Conference, Williamsburg, Virginia, 23-25 July 1979, Paper 79-1475.
Jones, G. W., Cincotta, J. J. & Walker, R-W.: Aero- dynamic forces on a stationary and oscillating circular cylinder at high Reynolds numbers. NASA TR R-300, 1969.
Morkovin, M. V.: Flow around circular cylinder-A kaleidoscope of challenging fluid phenomena. Symposium on Fully Separated Flows, Philadelphia, Pennsylvania, 18-20 May 1964, ed., Hansen, A. G. ASME, pp. 102-118.
Stratford, B. S.: The prediction of separation of the turbulence boundary layer. J. Fluid Mech., vol. 5, part 1, 1956, pp. l-16.
Townsend, A. A.: The behaviour of a turbulent boundary layer near separation. J. Fluid Mech., vol. 12, part 3, 1962, pp. 536-554.
Surry, D.: Some effects of intense turbulence on aerodynamics of a circular cylinder at subcritical Reynolds number. J. Fluid Mech., vol. 52, part 3, 1972, pp. 543-563.
Gerrard, J. H.: The mechanics of the formation region of vortices behind bluff bodies. J. Fluid Mech., vol. 25, part 2, 1966, pp. 401-413.
Eppler, R.: Beitrage zu Theorie und Anwendung der unstetigen Stromungen. J. Rational Tech. Anal., vol. 3, 1954, pp. 591-644.
Farell, C.: Flow around fixed circular cylinders: Fluctuating loads. J. Eng. Mech. Div., Proc. ASCE, vol. 197, No. EM3, 1981, pp. 565-688.
74

58. Sadeh, W-Z. & Brauer, H-J.: Coherent substructure of turbulence near the stagnation zone of a bluff body. J. Wind Eng. Indus. Aero., 8, 1981, pp. 59-72.
75

I. I - .m,., m .-II .I. , ,,,. -... _ .._ ..--.. -.
Not to Scale Dim. in cm
-7-9.20 Pressure Taps 9.20 -+-q \
Endplate j--43.20-1 EndPlate -\
I \
183.00 I
Fig. 2.1 Sketch of circular cylinder showing location of pressure taps and system of coordinates.
76

b a
183
Cyl
inde
r-
4 A
A
9.20
J
y V
--I-
/Rod
1.
27 D
ia.
(24)
“Q
(c
m)
:_t
63.5
0
7 II
I.13
.6.3
5 Ty
p 15
8.75
. . .
Pito
t-Sta
tic
Tube
. .
Ther
moc
oupl
e
x,,/R
8 I4
20
Smok
e In
ject
ion
Tube
. H
ot-W
ire A
nem
omet
er
. . A
1 V
I l52b
ui”
-+---
“oB
Gla
ss P
anel
s,
l N
ot
to
Scal
e .
Endp
late
D
im. i
n cm
1 A
A I
V V
4 bl
5.88
.
Fig.
2.
2 Sk
etch
of
ex
perim
enta
l ar
rang
emen
t.

Fig. 2.3 View of test section showing the circular cylinder and the turbulence- generating grid.
78

90
CP
G
cx
(a)
C, =
I-4
sin2
8 (b
) R
:=54
000
(c)
R:
=970
00
90
90
90
o”J+
’ ’
1-3
, o”
I.0
0.
6 \\I
30
0.2
1.0
I60
0.6
0.2
6 (d )
R:
= 12
9000
c,
* cx
(e
) R
g =
1720
00
( f )
R
: =
2140
00
Fig.
5.
1 Pr
essu
re
coef
ficie
nt
(cor
rect
ed)
dist
ribut
ion
at
subc
ritic
al
Rey
nold
s nu
mbe
rs
31
in
smoo
th
inci
dent
flo
w
and
in
pote
ntia
l flo
w
(a);
pola
r fo
rm.
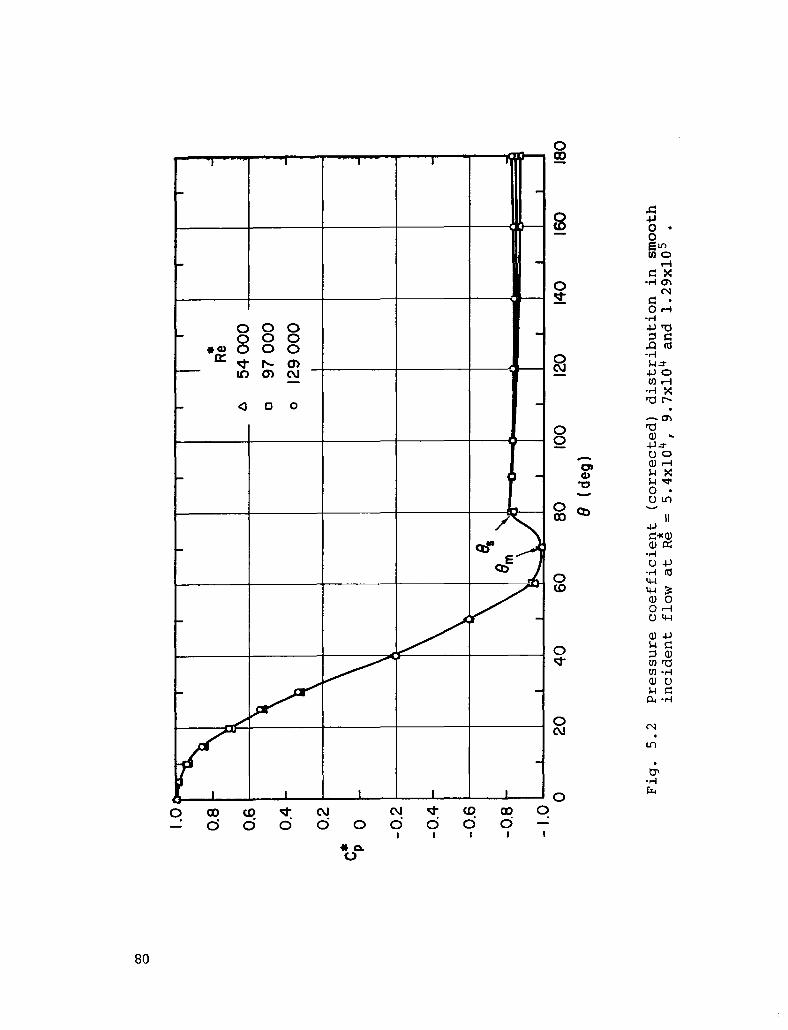
0.8
0.6
0.4
0.2
0 - 0.2
-0.4
- 0.6
- 0.8
- 1.
0
R*e
I
n 54
000
0 97
00
0 , ,
0 12
9000
0 20
40
60
80
to
o 12
0 14
0 I6
0 18
0
8 (d
eg)
Fig.
5.
2 Pr
essu
re
coef
ficie
nt
(cor
rect
ed)
dist
ribut
ion
in
smoo
th
inci
dent
flo
w
at
R$
= 5.
4x10
4,
9.7x
104
and
1.29
x105
.

0.8
0.6
0.4
0.2
r
CX 0
-0.2
L
-0.4
-0.8
E
-0.6
I 1’
i
I -T
R*e
-
4 17
2r
0 21
41
I 000
000 I ” &
I
Y Y
I I
I - 1
.0
* I
0 20
40
60
80
10
0 12
0 14
0 16
0 18
0
8 (d
eg)
Fis.
5.
3 Pr
essu
re
coef
ficie
nt
(cor
rect
ed)
dist
ribut
ion
in
smoo
th
inci
dent
flo
w
at
R$
= 1.
72~1
0~
and
2.14
~10~
.
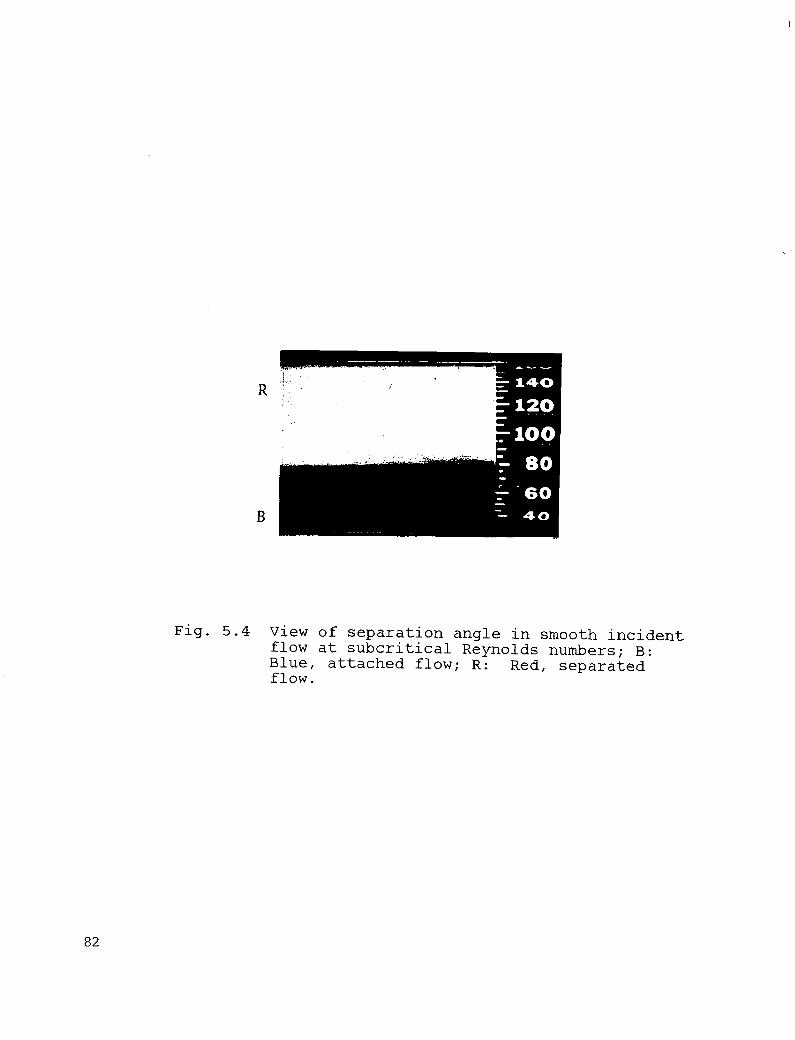
Fig. 5.4 View of separation angle in smooth incident flow at subcritical Reynolds numbers; B: Blue, attached flow; R: flow.
Red, separated
82

- 1.
5
I I
Sour
ce
Rif.
0 Pr
esen
t Te
st
5400
0 0.
087
A M
odi
8 El
-She
rbin
y 26
0 Fa
ge
S Fa
lkne
r 2
0 20
40
60
80
10
0 12
0 14
0 16
0 18
0
8 M
ea)
,
Fig.
5.
5 Pr
essu
re
coef
ficie
nt
(cor
rect
ed)
dist
ribut
ion
com
paris
on.

1.0
I -5
o
Pres
ent
Test
0.5
A M
odi
81 E
l-She
rbin
y
0 Fa
ge S
Fal
kner
. .-
0 20
40
60
80
10
0 12
0 14
0 IS
0 18
0 8
(deg
)
Fig.
5.
6(a)
Pr
essu
re
coef
ficie
nt
(cor
rect
ed)
dist
ribut
ion
com
paris
on.

0.5
0 Pr
esen
t Te
st
v Ac
henb
ach
•I F
aae
8 Fo
lkne
r
9700
0 0.
087
I9
1070
00
0. I
67
1 Y v
" Y
Y Y
‘y---
2o
40
* 0
60
80
100
120
140
160
180
8 (d
eg)
Fig.
5.
6(b)
Pr
essu
re
coef
ficie
nt
(cor
rect
ed)
dist
ribut
ion
com
paris
on.

0.5
0
o Pr
esen
t Te
st
1290
00
0.08
7 -
0 Ba
tham
I Fa
ge &
Fa
lkne
r 2
I I10
00
0. I
23
- 1.
5 0
20
40
60
80
100
120
140
160
180
8 (d
eg)
Fig.
5.
7 Pr
essu
re
coef
ficie
nt
(cor
rect
ed)
dist
ribut
ion
com
paris
on.

2 17
2000
0.
123
1720
00
0.08
7 ---
/
- 1.
5
- 2.
0 I
I I
I I
I I
I I
0 20
40
60
80
10
0 12
0 14
0 16
0 18
0
8 (d
eg)
Fig.
5.
8 Pr
essu
re
coef
ficie
nt
(cor
rect
ed)
dist
ribut
ion
com
paris
on.

o Pr
esen
t Te
st
m F
ag8
81 F
alkn
er
A G
uven
et
al
.
2 I4
000
0.08
7
2 2
I800
0 0.
I23
0 20
40
60
80
10
0 12
0 14
0 I6
0 I8
8 (d
eg)
Fig.
5.
9 Pr
essu
re
coef
ficie
nt
(cor
rect
ed)
dist
ribut
ion
com
paris
on.

0.4
c;
0.2
I9
Meg
) 30
0 -
0.8
- I.0
- 1.
2
G
- I.4
- l.6
- 0
Bath
am
0 _
1.8
8 Fa
lkne
r -
Fage
0
Pres
ent
Test
-
2.0
$tl -
0.4
- 0.
6
- 0.
8
- 1.
0
- I.2
1-m
Fa
ge &
Fa
lkne
r 2
0. I
23
I I
I I
I I
I I
I 1
c v Ac
henb
ach
I9
0. I6
7 I
A G
uven
et
al.
34
0. I
78
4 6
8 IO
I2
I4
I6
I8
20
22
R
*e x
lO-4
Fig.
5.
10
Com
paris
on
of
pres
sure
co
effic
ient
(c
orre
cted
) di
strib
utio
n as
fu
nctio
n of
R
eyno
lds
num
ber
at
thre
e pe
riphe
ral
angl
es.
180

Co,
0.
8
0.6
0 Sc
hmid
t 8
Wen
ner
38
- V
Burs
nall
81 L
oftin
39
•
I Fa
ge 8
1 Fa
lkne
r 0
Pres
ent
Test
A
Mod
i 8
El-S
herb
iny
26
A G
uven
et
al
.
I2
14
Re
x 10
e4
Fig.
5.
11
Dra
g co
effic
ient
in
sm
ooth
in
cide
nt
flow
as
fu
nctio
n of
R
eyno
lds
num
ber
and
com
paris
on
with
ot
her
resu
lts.

1.2
I. I
I.0
Go
0.9
0.8
0 D
elan
y 8
Sore
nsen
40
0.
010
v
0 D
elan
y 81
Sor
ense
n 40
0.
030
0 Ba
tham
33
0.
050
o Pr
esen
t Te
st
0.08
7 l
Polh
amus
41
0.
IO0
A G
uven
et
al.
34
0.17
8 0.
7;
I I
1 I
I I
I I
I I
I I
I I
I I
I I
6 8
IO
I2
I4
I6
I8
20
22
z R
:e x
lO-4
I
A V
Fig.
5.
12
Dra
g co
effic
ient
(c
orre
cted
) in
sm
ooth
in
cide
nt
flow
as
fu
nctio
n of
R
eyno
lds
num
ber
and
com
paris
on
with
ot
her
resu
lts.

Rex
lc4
5 7
9 II
I3
I5
I7
I9
2 I
I I
I I
I I
I I
I I
I I
I I
I 1
5-
Cyl
. Te
st
Posi
tion
M =
6.3
5 cm
q IO
M
0 I 7
.5 M
4
-. n
25M
Tub
- c
Wol
3-
0 ”
C
A 2-
c I
I I
I I
I I
I I
I I
I I
I I
8 IO
I2
I4
I6
I8
4
6
I
Fig.
6.
1
0
U,
h/s
1
Back
grou
nd
axia
l tu
rbul
ence
in
tens
ity
at
cylin
der
(Cyl
.) te
st
posi
tion
as
func
tion
of
frees
tream
ve
loci
ty
and
corre
spon
ding
cy
linde
r-dia
met
er
Rey
nold
s nu
mbe
r.

0.7
0.6
h,
‘*’
M
0.4
0.3
Re
x lc
4
5 7
9 I I
I3
I5
I7
I9
21
I
I I
I I
I I
I I
I I
I I
I I
I I-1
4 6
8 IO
I2
I4
16
I8
20
U
,(m/s
)
Fig.
6.
2 D
imen
sion
less
lo
ngitu
dina
l in
tegr
al
scal
e of
ba
ckgr
ound
tu
rbul
ence
at
cy
linde
r (C
yl.)
test
po
sitio
n as
fu
nctio
n of
fre
estre
am
velo
city
an
d co
rresp
ondi
ng
cylin
der-
diam
eter
R
eyno
lds
num
ber.
I I
I I
I I
I I
I I
I 1
I I
I -lo
.10
hb
D

50
40
30
hb
X0
20
IO F I
I I
I I
I
Rex
lOw
Aa
C
yl.
Test
-
Posi
tion
0 IO
M
5.2
9.4
0 l7
.5M
12
.5
16.7
-A
25
M
20.9
M =
6.35
cm
(rnd
2.19
-
1.63
I.4
1 1.
22
1.09
_
5 7.
5 IO
12
.5
I5
17.5
20
Re
x 10
m4
Fig.
6.
3 R
atio
of
ba
ckgr
ound
tu
rbul
ence
lo
ngitu
dina
l in
tegr
al
scal
e at
cy
linde
r (C
yl.)
test
po
sitio
n to
ne
utra
l sc
ale
of
stag
natio
n flo
w
as
func
tion
of
cylin
der-d
iam
eter
R
eyno
lds
num
ber.

0 14
z.
z
a20
2.5
:=x/
R
511
I R
= 7
.94c
m
I I
I I
P
n
n
4
7 9
I I
13
15
17
19
21
Re
x 10
m4
Fig.
6.
4 C
ritic
al
turb
ulen
ce
inte
nsity
as
fu
nctio
n of
R
eyno
lds
num
ber
for
thre
e tu
rbul
ence
-gen
erat
ing
grid
(T
GG
) po
sitio
ns.

I I
Re
= 52
000
I
R =
7.9
4cm
I
-0.5
I
I
- 1.
5.
-2.0
/
-2.5
I
I I
I I
I
0 Sm
ooth
Fl
ow
I I
0 20
40
60
80
10
0 12
0 14
0 16
0 18
0 8
Meg
I
Fig.
6.
5 M
ean
pres
sure
co
effic
ient
di
strib
utio
n in
tu
rbul
ent
inci
dent
flo
w
and
in
smoo
th
inci
dent
flo
w
at
Re
= 5.
2~10
~.

cb
CP
0
-0.5
0 Sm
ooth
Fl
ow
- I .
o
- 1.
5
-2.0
-2.5
0
20
40
60
80
100
120
140
160
180
0 (d
eg)
Fig.
6.
6 M
ean
pres
sure
co
affic
icnt
di
strib
utio
n in
tu
rbul
ent
inci
dent
flo
w
and
in
smoo
th
inci
dent
flo
w
at
Re
= 9.
4x10
".

I .Q
0.5 0
I I
I -6
l.i.
i N
C
I I
I I
-2.5
L
I I
I I
I I
I I
I I
I I
I I
I I
! 1
0 20
40
60
80
10
0 12
0 14
0 16
0 18
0 Bi
deg)
Fig.
6.
7 i'k
an
pres
sure
co
effic
ient
di
strib
utio
n in
tu
rbul
ent
inci
dent
flo
w
and
in
smoo
th
inci
dent
flo
w
at
Re
= 1.
25~1
0'.

- 3
I R
e =
1670
00
I
2.5
I I
I I
I I
I I
I I
0 20
40
60
80
10
0 12
0 14
0 16
0 18
0
8 (d
eg 1
Fig.
6.
8 M
ean
pres
sure
co
effic
ient
di
strib
utio
n in
tu
rbul
ent
inci
dent
flo
w
and
in
smoo
th
inci
dent
flo
w
at
Re
= 1.
67~1
0~.

I I
I I
I I
I I
I I
I I
I I
I
Re
= 20
9000
0 Sm
ooth
Fl
ow
8 (de
g)
Fig.
6.
9 M
ean
pres
sure
co
effic
ient
di
strib
utio
n in
tu
rbul
ent
inci
dent
flo
w
and
in
smoo
th
inci
dent
flo
w
at
Re
= 2.
09x1
05.

0 8
Ag -
Rg /
n
;g
N
I
Y BY
In
o 14
R
=7.
94cm
cbm
CP,
-2
.0
0 Sm
ooth
Flo
w
12.5
I5
17
.5
20
Rex
10e
4
Fig.
6.
10
Min
imum
pr
essu
re
coef
ficie
nt
in
turb
ulen
t an
d sm
ooth
in
cide
nt
flow
s as
fu
nctio
n of
R
eyno
lds
num
ber.
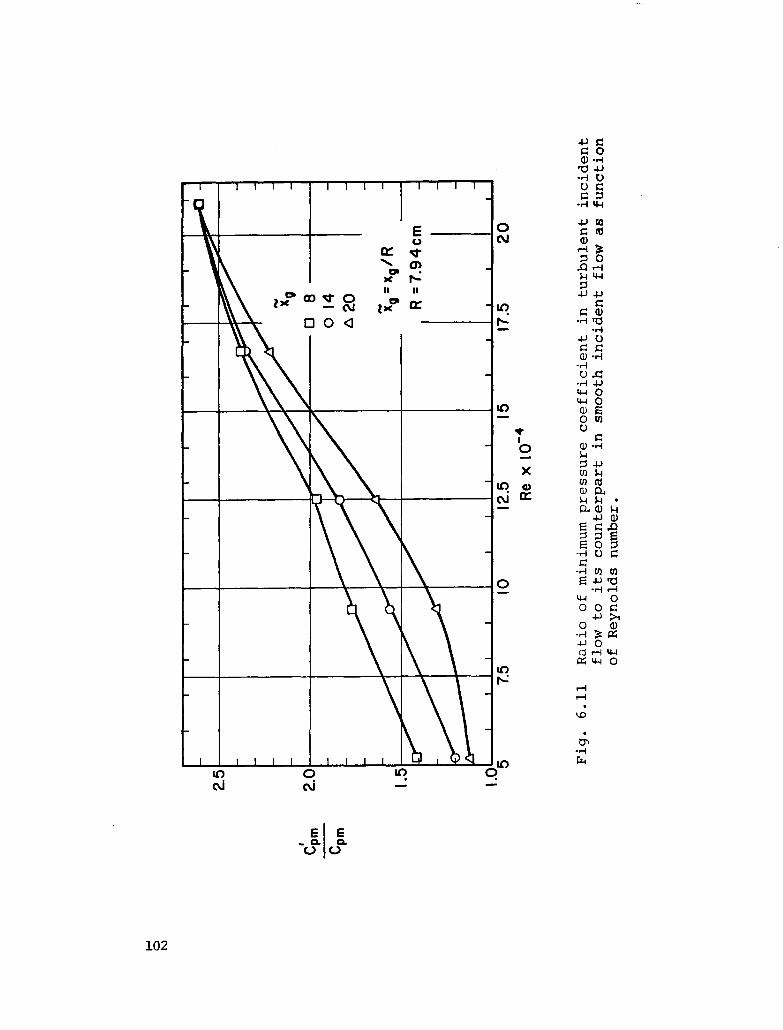
Re
x IO
-’
Fig.
6.
11
Rat
io
of
min
imum
pr
essu
re
coef
ficie
nt
in
turb
ulen
t in
cide
nt
flow
to
its
co
unte
rpar
t in
sm
ooth
in
cide
nt
flow
as
fu
nctio
n of
R
eyno
lds
num
ber.
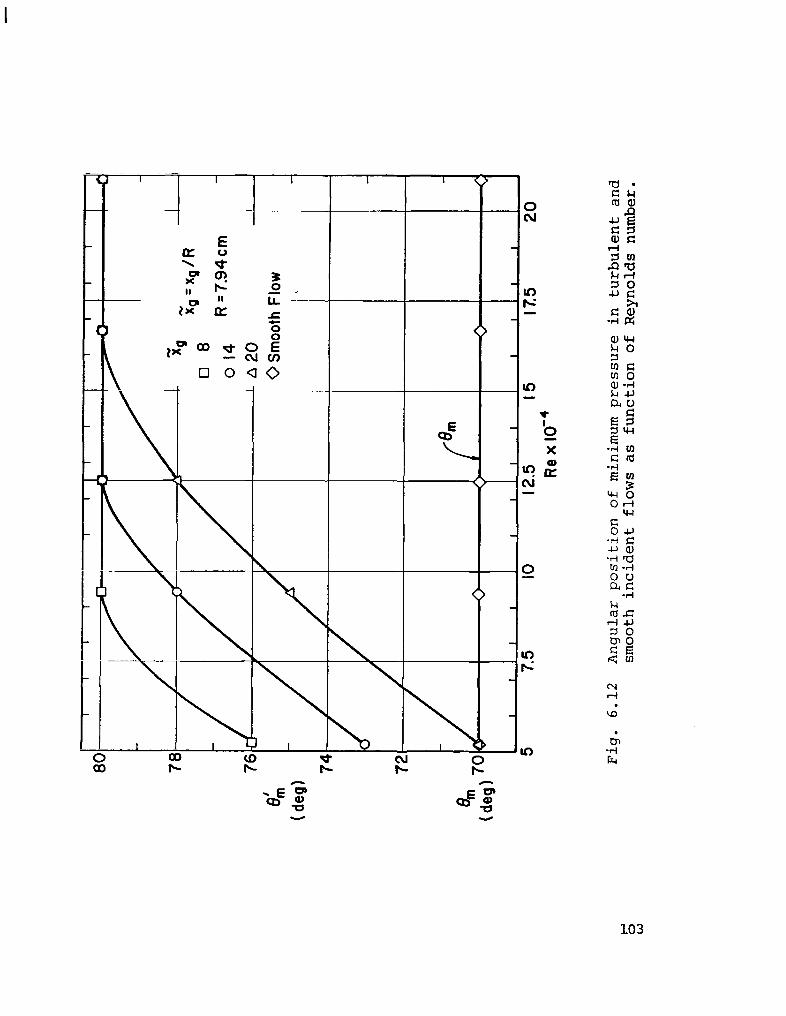
s:,
(deg
)
4n
(deg
)
0 Sm
ooth
Flo
w
70
A A
A V
V c*
I I
I I
I I
I I
I I
I I
I I
I I
5 7.
5 IO
12
.5
I5
1x5
20
Re
x 10
B4
Fig.
6.
12
Angu
lar
posi
tion
of
min
imum
pr
essu
re
in
turb
ulen
t an
d sm
ooth
in
cide
nt
flow
s as
fu
nctio
n of
R
eyno
lds
num
ber.

0 Sm
ooth
Flo
w
0 Sm
ooth
Flo
w
I I I I
I I I I
I I I I
I I I I
I I I I
I I I I
5 7.
5 IO
12
.5
Re
x IO
” I5
17
.5
20
Fig.
6.
13
Angu
lar
exte
nt
of
adve
rse
pres
sure
gr
adie
nt
regi
on
in
turb
ulen
t an
d sm
ooth
in
cide
nt
flow
s as
fu
nctio
n of
R
eyno
lds
num
ber.

%s
(deg
) Bb
s M
eg)
9 8 7
L
O- <
O- c
O-
‘0 - Q-
6
I I
I I
I I
I I
I I
I
N
I I
xg
,-, 0
ji,=x
,/R
I 1
0 14
R
=7.
94cm
02
0 0
Smoo
th F
low
l-l
5 7.
5 IO
12
.5
I5
17.5
20
Rex
10v
4
Fig.
6.
14
Angu
lar
exte
nt
of
base
re
gion
in
tu
rbul
ent
and
smoo
th
inci
dent
flo
ws
as
func
tion
of
Rey
nold
s nu
mbe
r.

-0.6
- 0.
8
-121
’1
I 0
Smoo
th
Flow
I
I I
I I
I I
I )
.
5 7.
5 IO
12
.5
I5
17.5
20
R
e x
low
4
Fig.
6.
15
Base
pr
essu
re
coef
ficie
nt
in
turb
ulen
t an
d sm
ooth
in
cide
nt
flow
s as
fu
nctio
n of
R
eyno
lds
num
ber.

c',b
hb
I I.t
JV
0.75
0.50
I
I I
I I
I I
I I
I I
I I
5 7.
5 IO
12
.5
I5
17.5
20
R
e x
IO”
Fig.
6.
16
Rat
io
of
base
pr
essu
re
coef
ficie
nt
in
turb
ulen
t in
cide
nt
flow
to
its
co
unte
rpar
t in
sm
ooth
in
cide
nt
flow
as
fu
nctio
n of
R
eyno
lds
num
ber.

-n
d.
1 I
I I
I I
I I
I l
I
%
I I
1
0 Sm
ooth
Fl
ow
I 1
I
I I
I 0
14
Xg=X
!J’R
\I -I
I ~
2.
R =
7.9&
m
- --
t-i I
-I
\ ,\
I w
c \A
dpb
/ n
_ +t
A-L
7 ’
I I
I I
I
:2.6
-2
.4
-2.2
-2
.0
-1.8
-1
.6
-I .4
-1
.2
-I .o
- 0.
6
c;b
- 0.
8
%b
- 1.
0
c;m
C
Pm
Fig.
6.
17
Varia
tion
of
base
pr
essu
re
coef
ficie
nt
with
va
ryin
g m
inim
um
pres
sure
co
effic
ient
in
tu
rbul
ent
and
smoo
th
inci
dent
flo
ws.

i A-
c+?
1.5
/ /
/
C;b
m
1.0
/
Cpb
m
I I
4:
‘;i!J
‘jig
=xg/
R
0 8
R =
7.94
cm
_ 0
I4
LJ 2
0
0 Sm
ooth
Flo
w
Sour
ce
Ref
. d
Mod
y &
El-S
herb
iny
26
_
d Ba
tham
33
-
-4
Surry
54
_
0 I
I I
I I
2.5
5 7.
5 IO
12
.5
Rex
lO-’
I5
II5
20
22.5
Fig.
6.
18
Pres
sure
ris
e co
effic
ient
in
tu
rbul
ent
and
smoo
th
inci
dent
flo
ws
as
func
tion
of
Rey
nold
s nu
mbe
r. P 0 W
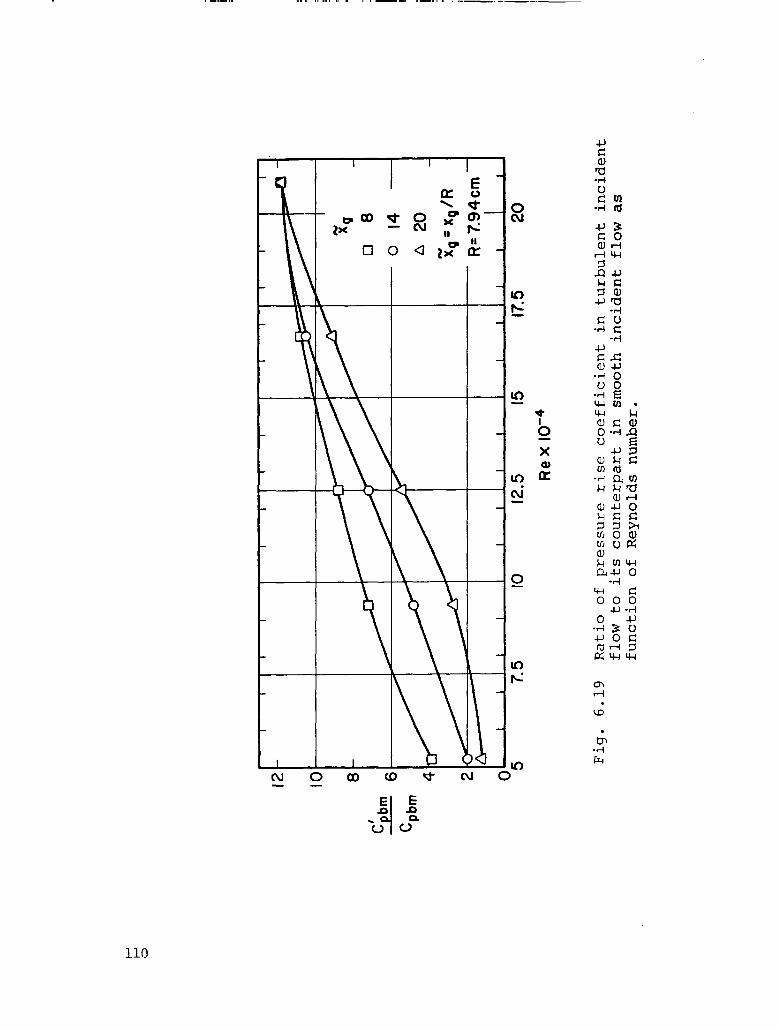
I2
IO
8 6 4 2 01
I I
I I
I I
I I
I I
I I
I I
5 7.
5 IO
12
.5
I5
17.5
20
Re
x 10
m4
Fig.
6.
19
Rat
io
of
pres
sure
ris
e co
effic
ient
in
tu
rbul
ent
inci
dent
flo
w
to
its
coun
terp
art
in
smoo
th
inci
dent
flo
w
as
func
tion
of
Rey
nold
s nu
mbe
r.

-
0 Sm
ooth
Fl
ow
tlL
800
h ”
5 7.
5 IO
12
.5
I5
17.5
20
22
.5
Re
x 10
B4
Fig.
6.
20
Varia
tion
of
sepa
ratio
n an
gle
in
turb
ulen
t an
d sm
ooth
in
cide
nt
flow
s an
d of
th
eir
diffe
xenc
e w
ith
incr
easi
ng
Rey
nold
s nu
mbe
r (T
GG
mea
ns
turb
ulen
ce-g
ener
atin
g gr
id).

Re "x s! %i
(x104) Wes)
5.2 14 95
R
7.5 a 115
12.5 20 120
Fig. 6.21 View of separation angle in turbulent incident flow at three selected subcritical Reynolcjs numbers; B: Blue, attached flow; R: Red, separated flow.
112

40
Gin
I #
ha\
H-
r N
I
20
L
0.
I I
I R
I
I I
I I
-0
0.2
0.4
0.6
0.8
1.0
C;b
m
1.2
1.4
1.6
1.8
2.0
Fig.
6.
22
Varia
tion
of
angu
lar
exte
nt
of
adve
rse
pres
sure
gr
adie
nt
regi
on
as
func
tion
of
pres
sure
ris
e co
effic
ient
.

140
I I
I I
I 1
I N
I
I
120
I I
I I
XQ
0 8
. .”
0 0
I4
100
, A2
0 Xg
=xg/
R
R =
7.9
4 cm
AC
)- I
I I
I I
I I
I I
-- 0
0.2
0.4
0.6
0.8
1.0
I.2
1.4
1.6
1.8
2.0
C;b
m
Fig.
6.
23
Varia
tion
of
sepa
ratio
n an
gle
as
func
tion
of
pres
sure
ris
e co
effic
ient
.

140
I I
I I
I I
I I
cl
•I
8 0
14
too
A 20
‘ii Q
=x,/R
R =
7.94
cm
80
I I
I I
I I
1 I
4
-1.2
-1
.1
- 1.
0 - 0
.9
-0.8
-0
.7
-0.6
-0
.5
-0.4
c;b
Fig.
6.
24
Varia
tion
of
sepa
ratio
n an
gle
as
func
tion
of
base
pr
essu
re
coef
ficie
nt.

I .8
I .6
I .4
I .2
I .o
0.8
0.6
I I
I Ilh
l I I.4
r I
I IIm
-7-g
~4x’
04-
I- I
I 11
91 I
I- I
IX/II
I
; I
.I ;‘I
; ii’“
‘“’
3 4
56
6 10
2 2
3 6
6102
2
3 4
56
6lo3
(a)
Tu; R
e (b
) Tu
2,R
e
Fi
08
0 I4
a
20
‘ji,=x
,/R
R =
7.94
cm
Fig.
6.
25
Pres
sure
ris
e co
effic
ient
as
fu
nctio
n of
tu
rbul
ence
pa
ram
eter
ba
sed
on
(a)
back
grou
nd
turb
ulen
ce
inte
nsity
an
d (b
) cr
itica
l tu
rbul
ence
in
tens
ity.

130
120
8’
II0
(d:g
)
100
so
- - -
1
a
:
L
1 - - - 1,
80
,’ 34
5661
02
2 3
(a)
Tu;R
e
1 I
xro5
,
6 6
102
2 3
456
(b)
Tui
Re
%
08
0 I4
A
20
$=xp
/R
R =
7.94
cm
Fig.
6.
26
Sepa
ratio
n an
gle
as
func
tion
of
turb
ulen
ce
para
met
er
base
d on
(a
) ba
ckgr
ound
tu
rbul
ence
in
tens
ity
and
(b)
criti
cal
turb
ulen
ce
int.e
nsitv
.

1.6
I.2
$brn
0.8
0.4
Fig. 6.27
0.5 0.6 0.7
hb z T”bd’*
Variation of pressure rise coefficient with increasing turbulent separation parameter.
118

e;m (deg)
50 50
40 40
30 30
20 20
IO IO 0.3 0.4 0.5 0.6 0.7 0.8 0.9
hb z Tub d’*
Fig. 6.28 Variation of angular exten.t of adverse pressure gradient region with increasing turbulent separation parameter.
119

9; (deg)
130 130
120 120
I IO I IO
100 100
90 90
PA PA 0.3 0.4 0.5 0.6 0.7 0.8 0.9
hb --- TlJb Rti’*
Fig. 6.29 Variation of separation angle with increasing turbulent separation parameter.
120

I I
2.2
I
~- -
-
Ab --- TU b Ri’*
‘ii, 8
I4 % = xa/R
R = 7.94cm 20
I I
0.7 0.8 0.9
Fig. 6.30 Variation of average adverse pressure gradient as function of turbulent separation parameter.
121

0.8
0.6
$bm
0; 0.4
0.2
n 2. R =7.94cm
0.3 0.4 0.5 0.6 0.7 0.8 0.9
!b Tu R;‘* xD b
Fig. 6.31 Variation of separation coefficient as function of turbulent separation parameter.
122

cDt
1.2
ry
I
k I
I I
I I
I I
I I
I z
I I A
Y -
P
DP
R =
7.94
cm
0.4
I I
I I
I
5 7.
5 IO
12
.5
I5
17.5
20
Fig.
6.
32
Mea
n tu
rbul
ent
drag
co
effic
ient
an
d la
min
ar
drag
co
effic
ient
as
fu
nctio
n of
su
bcrit
ical
R
eyno
lds
num
ber.

CD
t
CO
P
1.2
1.0
0.6
04
1 I
I I
I I
I I
I I
I I
I
%I
0 8
Tg=
xg/R
0
14
R =
7.94
cm
I I
I I
I I
I I
I I
I I
I -.
. 5 7.
5 IO
12
.5
I5
17.5
20
Re
X 10
B4
Fig.
6.
33
Rat
io
of
mea
n tu
rbul
ent
drag
co
effic
ient
to
la
min
ar
drag
co
effic
ient
as
fu
nctio
n of
R
eyno
lds
num
ber.

CD
t
CO
P 1.2
I I
I I
I I
I I
I
0 8
I
I4
itg=
x,/R
R =
7.9
4cm
20
Smoo
th
Flqw
1
0.6
’
I -1
.2
-1.1
-1
.0
-0.9
-0
.8
-0.7
-0
.6
-0.5
-0
.4
‘;b
‘pb
Fig.
6.
34
Mea
n tu
rbul
ent
drag
co
effic
ient
an
d la
min
ar
drag
co
effic
ient
as
fu
nctio
n of
ba
se
pres
sure
co
effic
ient
.
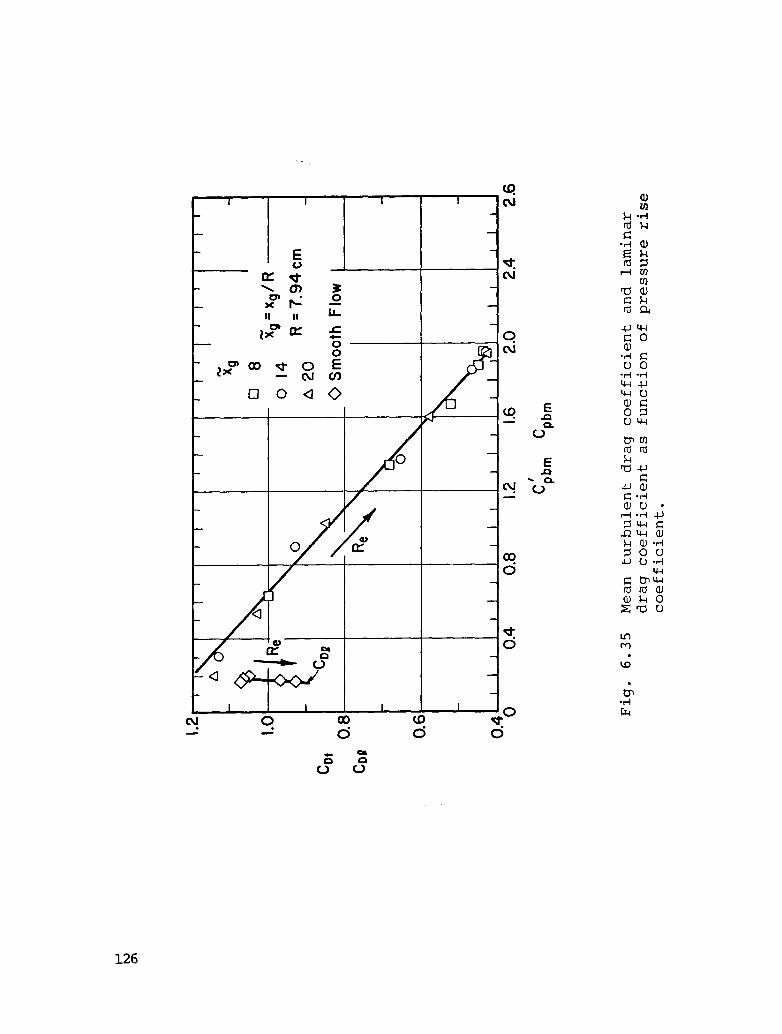
1.0
n _ [
I ia
Re
0
CD
L!
b 0.
8.
Re
I 0
8
0 14
‘ii,
=x,/R
R =
7.9
4 cm
A
20
0 Sm
ooth
Fl
ow
_
0.6
0.4
’ ’
’ I
I I
I I
I I
I I
1 I
I 0
0.4
0.8
1.2
1.6
2.0
2.4
2.6
” ‘p
bm
pbm
Fig.
6.
35
Mea
n tu
rbul
ent
drag
co
effic
ient
an
d la
min
ar
drag
co
effic
ient
as
fu
nctio
n of
pr
essu
re
rise
coef
ficie
nt.

Qs
Meg
I
Flow
R
egim
e 1
Subc
ritic
al
Crit
ical
Su
perc
ritic
al
Tran
scrit
ical
*
I_
-I,
I c
1401
I
I I
I
100
100
90
90
80
80
. - 4
6 6
IO5
2
I So
urce
’
Ref
. ‘Q
Ach
enba
ch
l9,4
7
A G
uven
et
al.
34
B Ja
mes
et a
l. 48
8 Jo
nes
et a
l. 50
!II
4 6
6 IO
6 2
Re
'-TM
-
Pres
ent
Test
---
---I
•I
8
0 I4
“ii
,=x,
/R
D
2.
R =
7.94
cm
III
II I
I I
,
4 6
6 IO
’ 2
Fig.
6.
36
Sepa
ratio
n an
gle
as
func
tion
of
Rey
nold
s nu
mbe
r.
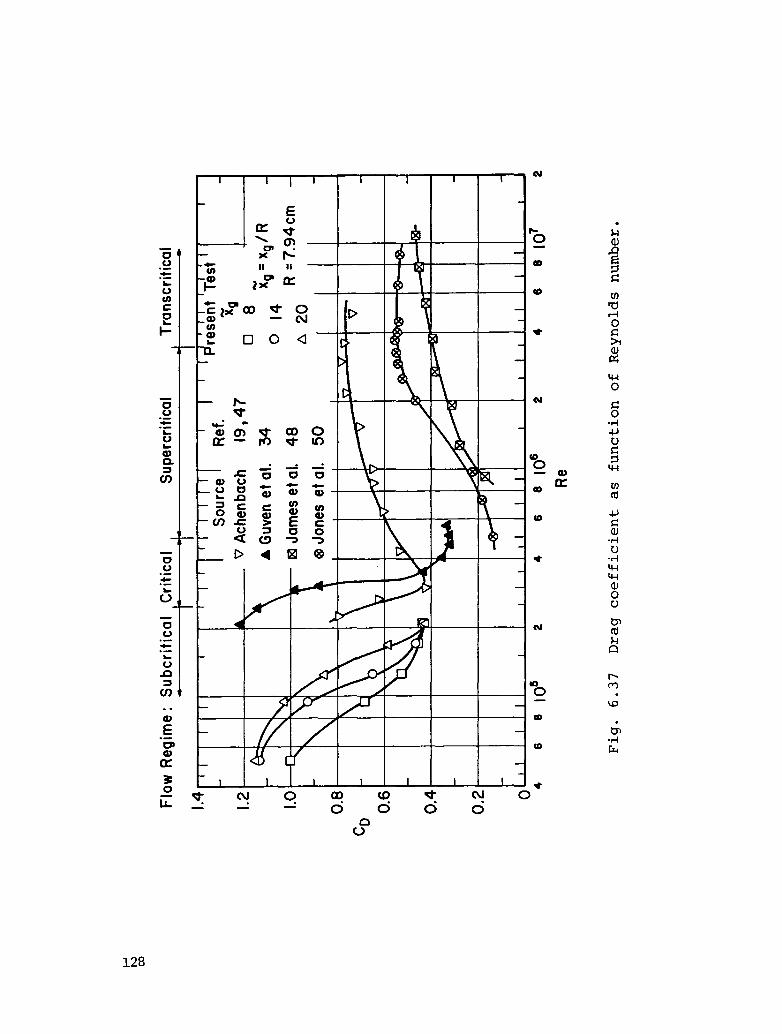
CD
Flow
R
egim
e :
Subc
ritic
al
Crit
ical
,
Supe
rcrit
ical
Tr
ansc
ritic
al
a 5
IA
0.8
A G
uven
et
al.
34
IZI J
ames
et a
l. 48
0.6
I VI
I
WI-
I I
I I
I I
\ I
I I
I
0.4
-P
I I
I /I
I
0 4
6 6
IO5
2 4
6 6
IO6
2 4
6 6
IO7
2
Re
Fig.
6.
37
Dra
g co
effic
ient
as
fu
nctio
n of
R
eyno
lds
num
ber.

Flow
Reg
ime
: Su
bcrit
ical
C
ritic
*
I
50
Flow
Reg
ime:
Su
bcrit
ical
, C
ritic
al
Supe
rcrit
ical
*
-1 T
rans
criti
cal
r- -
I I
I I
I I
III
II I
I I
III
II I
I I
A G
uven
et a
l. 34
H J
ames
et a
l. 48
R
=7.
94 c
m-
@ Jo
nes
et a
l. 50
4 6
6 IO
’ 2
4 6
6 IO
’ 2
4 6
8 IO
’ 2
Re
Fig.
6.
38
Angu
lar
exte
nt
of
adve
rse
pres
sure
gr
adie
nt
regi
on
as
func
tion
of
Rey
nold
s nu
mbe
r.

%b
-0.8
Flow
R
egim
e:
Subc
ritic
al
, Crit
ical
,
Supe
rcrit
ical
,
Tran
scrit
ical
-0.4
-0.6
- I .o
-1.2
-1.4
q Ja
mes
et a
l. 48
8 Jo
nes
et a
l. 50
I
I I
I I
III
II
4 6
6 IO
5 2
4 6
6 IO
6 2
4 6
6 IO
7 2
Re
Fig.
6.
39
Base
pr
essu
re
coef
ficie
nt
as
func
tion
of
Rey
nold
s nu
mbe
r.

Cpb
m Flow
R
egim
e:
Subc
ritic
al
, Crit
ical
I
Supe
rcrit
ical
,
Tran
scrit
ical
2.5
2.0 1.5
1.0
0.5
A G
uven
et a
l. 34
H J
ames
et a
l. 48
o Jo
nes
et a
l. 50
Re
Fig.
6.
40
Pres
sure
ris
e co
effic
ient
as
fu
nctio
n of
R
eyno
lds
num
ber.

APPENDIX I
SURFACE PRESSURE COEFFICIENT IN TURBULENT INCIDENT FLOW
Generally, the surface pressure coefficient Cp is given by Eq. (3.1) which is rewritten below for convenience. Thus,
C P = (P(O) - P,)/kQ , (A.I.l)
in which p(B) is measured surface (or wall) static pres- sure at any azimuthal angle 8, p, and U
velocity? are the free-
stream static pressure and uniform respectively, and p stands for the density of air in consistent units. This equation can be expressed in terms of the freestream stagnation pressure p, by
C P = (P(O) - P,)/%PU: + 1 ' (A-1.2)
using Bernoulli equation. The freestream conditions were measured in this experiment in the uniform flow upwind of the turbulence-generating grid in order to prevent any tur- bulence effects upon the reading of the reference Pitot- static tube. As a result, the foregoing equation cannot be applied in the case of a turbulent incident flow without accounting for the losses in the stagnation pressure induced by the grid.
In a turbulent incident flow, the surface mean pressure coefficient C' is given in terms of the freestream stagna- tion pressure pp; and velocity % downstream of the grid by
C’ = P (P(B) - p;)/Qu;* + 1 . (A.I.3)
The surface pressure P(S) according to Eq. (A.I.2) is
p(e) = ~PU:(C~ - 1) + P, , (A.I.4)
while based on Eq. (A-1.3) is
p(e) = 4,pu;*(c; - 1) + p; .
132
(A.I.5)

Since the surface pressure p(8) is independent of where the freestream conditions are monitored, one can equate the foregoing two equations and, therefore,
C' P
- 1 = (U,JU~)"(Cp - 1) + (p, - p;)/Qu;* . (A.I.~)
The freestream velocity far downstream of the grid is equal to that upwind of it by continuity condition since the wind- tunnel cross section is the same, i.e., VLi = u,. Then the loss in the stagnation pressure (p, - p;) is equal to the difference in the static pressure across the grid (p, - pL> according to Bernoulli equation, viz., p, - p; = p, - p: , where p& is the freestream static pressure downwind of the grid. Consequently, Eq. (A-1.6) reduces to
c!’ = c P P + AP,/WJ; , (A.I.7)
where C is given by Eq. (A-1.1) and Ap, = p, - p;. This equationPis exactly Eq. (3.2) in Sect. 3.3.
133

yyum = 1 + TCD + A0 , (A-11.1)
and
C;;/CD = 1 - 2WD - 3Au , (A.II.2)
where the asterisk denotes corrected values. In the fore- going two equations, A designates the body shape factor, and o and t are two blockage parameters given by
u = (x2/48 HD/h)* , (A.II.3)
and
APPENDIX II
BLOCKAGE CORRECTION
The blockage correction for the freestream velocity U, and the drag coefficient CD introduced by Allen & Vincenti (ref. 20, Eq. (941, P. 177) for the flow of an incompres- sible fluid are:
t = %(D/h) , (A.II.4)
in which D/h is the blockage coefficient, where D denotes the cylinder diameter and h is the height (or width) of the wind-tunnel cross section. The body shape factor A for a circular cylinder is equal to 4 according to the values given in Ref. 20 (Table I, p. 183). Substitution of the values of A, (5 and t in Eqs. (A.II.l) and (A.II.2) leads to the following correction relationships:
yyJm = 1 + 0.25CD (D/h) + 0.82(D/h)* , (A.II.5)
and
C&ED = 1 - 0.50CD(D/h) - 2.467(D/h)* . (A.II.~)
These are exactly Eqs. (3.4) and (3.5) given in Sect. 3.4. The correction for the Reynolds number is identical to that for the freestream velocity since cylinder.
R*e/Re = v",/U, for a given
In addition to correcting the freestream velocity, the Reynolds number and the drag coefficient, it is necessary to correct the pressure coefficient. The measured (uncorrected)
134

pressure coefficient C P is given by Eq. (3.1) or in terms
of the stagnation pressure by Eq. (A.I.2) which is written below in the form
cp - 1 = (P(O) - P,)/WJ; . (A.II.7)
In the case of unrestricted flow, the pressure coefficient is given by exactly the same equation as the foregoing pne provided that the corrected values for the surface pressure P"(O), the stagnation pressure pg and the freestream veloc- ity U* are used. fined@flow is
Thus, the pressure coefficient for uncon-
C* P - 1 = (p*(e) - P;)/%Pu;2 * (A.II.8)
Under the condition that the difference between the wall pressure and the stagnation pressure is the same in both unconfined and confined flow-i.e., (p*(e I-pt)=(p(e I-PO)-one can obtain a relationship for the corrected pressure coeffi- cient by means of Eqs. (A.II.7) and (A.II.8). This equation is
‘c; - W(Cp - 1) = (U;/Um)-2 . (A.II.9)
As a result, the corrected pressure coefficient depends solely on the corrected freestream velocity. The foregoing equation is Eq. (3.6) in Sect. (3.4).
135

APPENDIX III
FLOW PARAMETERS DATA
This experiment was conducted at five different cylinder-diameter subcritical Reynolds numbers Re ranging from 5.2~10~ to 2.09x10⁵ (based on freestream velocity U, and cylinder diameter D; air at 20°C (68OF) kinematic vis- cosity w = 1.48~10~~ m*/s (1.59x10⁻⁴ fG/s)). The corre- sponding uniform freestream velocity U , for the particular cylinder of diameter D = 15.88 cm used gere, varied from 4.9 to 19.5 m/s. All the five Reynolds numbers and corresponding freestream velocities are tabulated in Table A-III.1 below. Corrected values of the uniform freestream velocities Uo3 were computed using the Allen-Vincenti method according to Eq. (3.4) (see Sect. 3.4 & App. II) when the blockage coef- ficient of the cylinder D/h = 0.087 (see Sect. 2.2). In computing the corrected freestream velocity, the measured drag coefficient in smooth (or laminar) incident flow cDL was employed. The corrected uniform freestream velocities v*,l along with their corrected numbers R$,
corresponding Reynolds are summarized in Table A.III.l. All the
Reynolds numbers in this table are rounded to two or three significant digits.
The thickness of the laminar boundary layer at stagnation point 6Q and the neutral scale of the stagnation flow ho (vid., Eqs. (2.1) SC (2.2)), based on the measured (uncorrected) Reynolds number, are listed in Table A.III.2 below. Their dimensionless values defined in terms of the czylinder radius hO
R (7.94 cm (3-l/8 in))-viz., xn = 6Q/R and = ho/R-are also tabulated in this table.
The corrected values of the uniform freestream velocity and Reynolds number according to the Maskell method (M), UzM and R*eM, are given in Table A.III.3 below. They were com- puted using Eq. (3.7) when the corrected base pressure parameter k** was obtained at each Reynolds number by means of Eq. (3.8) within five iterations at the most (see Sect. 3.4). The measured base pressure coefficient and base pressure parameter k" =1-C
'pb pb
are listed in this table for convenience's sake. In addition, the ratio of the corrected uniform freestream velocities computed by the Maskell and Allen-Vincenti methods-viz., U~M/U~-is also tabulated in Table A.III.3 for illustration's sake.
136

TABLE A-111.1. FLOW PARAMETERS MEASURED AND CORRECTED BY ALLEN-VINCENT1 METHOD
Re %I cDd upJm UC Rke (~10~~) (m/s) (ft./s) (m/s) (ft/s) (~10~~)
5.2 4.9 16.0 1.07 1.029 5.0 16.5 5.4 9.4 8.8 28.8 1.06 1.029 9.0 29.6 9.7
12.5 11.7 38.4 1.05 1.029 12.0 39.5 12.9 16.7 15.6 51.2 0.97 1.027 16.0 52.6 17.2 20.9 19.5 64.0 0.93 1.026 20.0 65.7 21.4
TABLE A-111.2. BOUNDARY-LAYER THICKNESS AND NEUTRAL SCALE
(x10-d) (mm) (mils)
5.2 0.836 33 0.0105 9.4 0.622 24 0.0078
12.5 0.539 21 0.0068 16.7 0.466 18 0.0059 20.9 0.417 16 0.0052
TABLE A.III.3. FLOW PARAMETERS MASKELL METHOD
Re UC. CDZZ C ub kz k**
(~10~~) (m/s)
hO RO
(mm) (mils)
2.19 86 0.028 1.63 64 0.020 1.41 55 0.018 1.22 48 0.015 1.09 43 0.014
MEASURED AND CORRECTED BY
k/k* %M R& u;#J:
(m/s) (x10-d)
5.2 4.9 1.07 -0.986 1.986 1.775 1.058 5.2 5.5 1.040 9.4 8.8 1.06 -0.954 1.954 1.740 1.060 9.3 10.0 1.033
12.5 11.7 1.05 -0.939 1.939 1.724 1.061 12.4 13.3 1.033 16.7 15.6 0.97 -0.824 1.824 1.600 1.068 16.7 17.8 1.044 20.9 19.5 0.93 -0.774 1.774 1.547 1.071 20.9 22.4 1.045
137

APPENDIX IV
SURFACE PRESSURE DISTRIBUTION IN SMOOTH INCIDENT FLOW
The surface pressure coefficients Cp (vid., Eq- (3-l)) measured in smooth incident flow at 18 stations over half of the cylinder circumference-i-e., from 8 = 0 to 180°-are listed in Table A-IV.1 below at each of the five subcritical Reynolds numbers. numbers (Re and Rg)
Both the measured and corrected Reynolds are given in this table. The corrected
pressure coefficient Ci according to the Allen-Vincenti method (vid., Eq. (3.6) and App. II), along with those cor- rected by means of Maskell scheme C* pM (vid., Eq. (3.7)), are tabulated in this table. Note that the distributions of the corrected pressure coefficient by Allen-Vincenti method are shown in Figs. 5.1 to 5.4. In order to indicate the degree to which the Allen-Vincenti and Maskell blockage correction methods affect the values of the pressure coefficient and to underscore the differences in the estimates obtained by means of those two correction schemes, the following ratios are given in this table: (1) the pressure coefficient cor- rected by Allen-Vincenti method to its measured counterpart c*/c ;
P P (2) the pressure coefficient corrected by Maskell
scheme to its corresponding measured value c;M/cp ; and (3) the pressure coefficient corrected by Maskell scheme to its counterpart corrected by Allen-Vincenti method "*p#$ -
138

TABLE A-IV-l. SMOOTH INCIDENT FLOW
SURFACE PRESSURE COEFFICIENT DISTRIBUTION Rex10 -4 5.2 9.4
R:xlO-4 5.4 9.7
& 0 5
10 15 20 25
:"o
z: 70 80
1:: 120 140 160 180
cP C’
P c;/cp $I4 c;M’c, c;,/c; 1.000 1.000 1.000 1.000 1.000 0.990 0.991 1.001 0.991 1.001 0.929 0.933 1.004 0.936 1.007 0.828 0.836 1.012 0.846 1.022 0.662 0.681 1.029 0.698 1.054 0.486 0.515 1.060 0.541 1.113 0.266 0.307 1.154 0.344 1.293
-0.253 -0.103 0.723 -0.120 0.474 -0.672 -0.578 0.862 -0.494 0.735 -1.060 -0.944 0.892 -0.841 0.793 -1.150 -1.030 0.896 -0.922 0.802 -0.949 -0.840 0.885 -0.742 0.782 -0.953 -0.844 0.886 -0.745 0.782 -0.953 -0.844 0.886 -0.745 0.702 -0.949 -0.840 0.885 -0.742 0.782 -0.959 -0.849 0.885 -0.751 0.783 -0.986 -0.874 0.087 -0.775 0.786 -0.986 -0.874 0.887 -0.775 0.786
Re~l0-~ 12.5 lb.7
R&l0 -4 12.9 17.2
&, 0 5
10 15
::
:: 50 60 70 80 90
100 120 140 160 180
C C’ P P
c*/c P P
1.000 1.000 1.000 1.000 1.000 1.000 1.000 1.000 1.000 1.000 1.000 0.994 0.994 1.000 0.995 1.001 1.001 0.990 0.931 1.001 0.991 1.001 0.951 0.954 1.003 0.956 1.005 1.002 0.932 0.936 1.004 0.940 1.009 0.848 0.856 1.009 0.865 1.020 1.011 0.834 0.843 1.011 0.854 1.024 0.695 0.712 1.024 0.729 1.049 1.024 0.607 0.703 1.023 0.725 1.055 0.509 0.536 1.053 0.563 1.106 1.050 0.502 0.525 1.052 0.563 1.122 0.288 0.327 1.135 0.367 1.274 1.122 0.283 0.321 1.131 0.371 1.311
-0.271 -0.201 0.742 -0.130 0.480 0.647 -0.237 -0.172 0.726 -0.085 0.359 -0.689 -0.595 0.865 -0.502 0.729 0.844 -0.632 -0.546 0.866 -0.431 0.682 -1.070 -0.955 0.893 -0.841 0.786 0.881 -0.967 -0.864 0.893 -0.725 0.750 -1.130 -1.010 0.894 -0.894 0.791 0.885 -1.000 -0.895 o.e96 -0.754 0.754 -0.945 -0.837 0.887 -0.729 0.771 0.871 -0.866 -0.768 0.888 -0.637 0.736 -0.933 -0.826 0.885 -0.719 0.771 0.870 -0.840 -0.744 O.BBb -0.614 0.731 -0.939 -0.831 0.886 -0.724 0.771 0.871 -0.863 -0.765 0.088 -0.634 0.735 -0.945 -0.837 0.887 -0.729 0.771 0.871 -0.857 -0.760 0.887 -0.629 0.734 -0.951 -0.843 0.886 -0.735 0.773 0.872 -0.840 -0.744 0.886 -0.614 0.731 -0.939 -0.831 0.886 -0.724 0.771 0.871 -0.840 -0.744 0.886 -0.614 0.731 -0.939 -0.831 0.886 -0.724 0.771 0.871 -0.824 -0.728 0.885 -0.600 0.728
1.000 1.000 1.003 1.010 1.025 1.050 1.121 0.656 0.853 0.890 0.895 0.883 0.883 0.883 0.883 0.885 0.887 0.687
‘;M c~M/cp ‘~,/‘i
20.9
21.4
& C C’
P P P/C
P P c;M c* /c pM p ‘CM”;
0 1.000 1.000 1.000 1.000 1.000 1.000 5 0.976 0.977 1.001 0.979 1.003 1.002
10 0.929 0.933 1.004 0.938 1.010 1.005 15 0.823 0.832 1.011 0.846 1.028 1.017 20 0.675 0.691 1.024 0.717 1.062 1.038 25 0.509 0.534 1.049 0.572 1.124 1.071 30 0.293 0.329 1.123 0.383 1.307 1.164 40 -0.220 -0.158 0.718 -0.064 0.291 0.405 50 -0.590 -0.510 0.864 -0.3tr7 0.656 0.759
7": -0.906 -0.810 0.894 -0.662 0.731 0.817 -0.940 -0.842 0.896 -0.692 0.736 0.822
80 -0.808 -0.716 0.887 -0.577 0.714 0.806
1:: -0.814 -0.722 0.887 -0.5b2 0.715 0.806 -0.810 -0.718 0.888 -0.579 0.715 O.bO6
120 -0.791 -0.700 0.886 -0.562 0.710 0.603 140 -0.769 -0.680 0.084 -0.543 0.706 0.799 160 -0.784 -0.694 0.885 -0.556 0.709 0.801 180 -0.774 -0.604 0.884 -0.547 0.707 0.800
cP C' P/C
P P C*
P Pfl ';M"p c&/c;
1.000 1.000 1.000 i.000 1.000 1.000 0.992 0.992 1.000 0.993 1.001 1.001 0.947 0.950 1.003 0.953 1.006 1.003 0.836 0.845 1.011 0.854 1.022 1.011 0.691 0.708 1.025 0.725 1.049 1.024 0.496 0.524 1.056 0.551 1.111 1.052 0.279 0.319 1.143 0.358 1.283 1.122
-0.266 -0.195 0.737 -0.127 0.477 0.651 -0.706 -0.611 0.865 -0.519 0.735 0.849 -1.040 -0.926 0.093 -0.E18 0.707 o.ae3 -1.140 -1.020 0.895 -0.905 0.794 0.887 -0.920 -0.813 0.884 -0.709 0.771 0.872 -0.939 -0.831 0.885 -0.726 0.773 0.874 -0.939 -0.831 0.885 -0.726 0.773 0.874 -0.954 -0.845 0.887 -0.740 0.776 0.876 -0.954 -0.845 0.887 -0.740 0.776 0.076 -0.962 -0.853 0.887 -0.747 0.777 0.875 -0.954 -0.846 0.887 -0.740 0.776 0.876
C P 'i
CA/C PP c* PM
c* ,c PM P cyc;
l.OCO 1.000 1.004 1.013 1.031 1.066 1.156 0.494 0.789 0.839 0.842 0.829 0.829 0.829 0.828 0.825 0.825 0.824
139
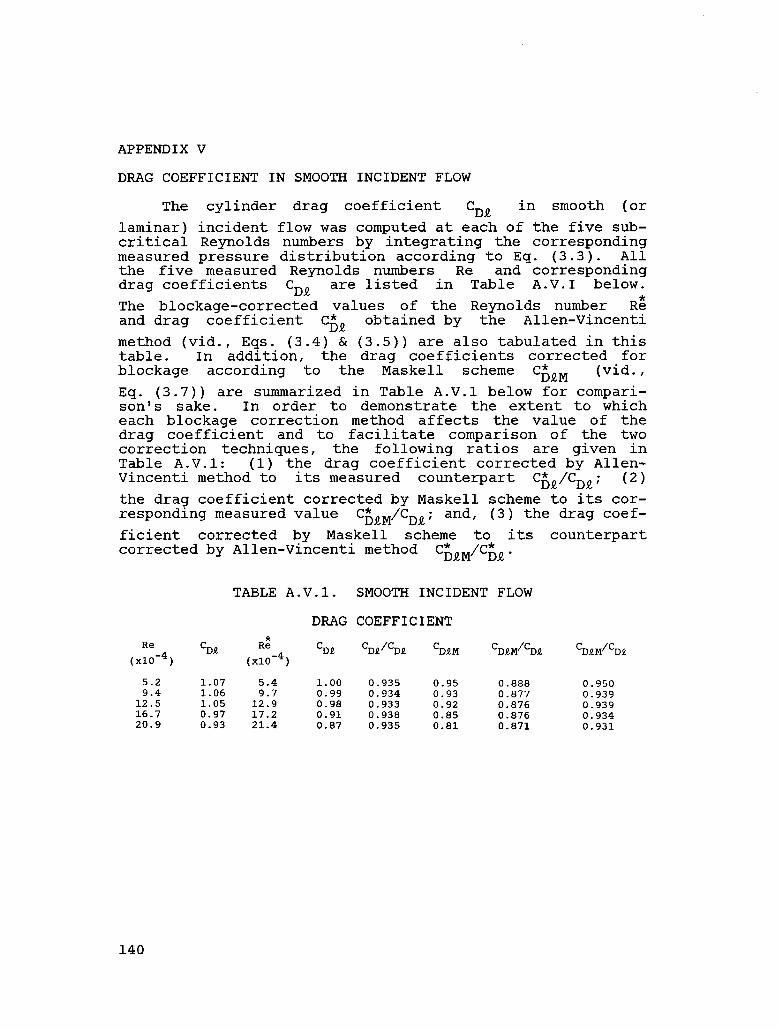
APPENDIX V
DRAG COEFFICIENT IN SMOOTH INCIDENT FLOW
The cylinder drag coefficient CDQ in smooth (or laminar) incident flow was computed at each of the five sub- critical Reynolds numbers by integrating the corresponding measured pressure distribution according to Eq. (3.3). All the five measured Reynolds numbers Re and corresponding drag coefficients 'DQ are listed in Table A-V.1 below. The blockage-corrected values of the Reynolds number R$ and drag coefficient %Q obtained by the Allen-Vincenti method (vid., Eqs. (3.4) & (3.5)) are also tabulated in this table. In addition, the drag coefficients corrected for blockage according to the Maskell scheme C* DQM (vid., Eq. (3.7)) are summarized in Table A-V.1 below for compari- son's sake. In order to demonstrate the extent to which each blockage correction method affects the value of the drag coefficient and to facilitate comparison of the two correction techniques, the following ratios are given in Table A-V-1: (1) the drag coefficient corrected by Allen- Vincenti method to its measured counterpart ChQ/CDQ; (2) the drag coefficient corrected by Maskell scheme to its cor- responding measured value CEQM/CDQ ; andI (3) the drag coef- ficient corrected by Maskell scheme to its counterpart corrected by Allen-Vincenti method CgQM/CcQ.
TABLE A-V-1. SMOOTH INCIDENT FLOW
DRAG COEFFICIENT Re
(x10-4) CDI RZ
(x10-4) CDi 'DdCDe 'DgM CDEM'CDa CDfM'CD~
5.2 1.07 5.4 1.00 0.935 0.95 0.888 0.950 9.4 1.06 9.7 0.99 0.934 0.93 0.877 0.939
12.5 1.05 12.9 0.98 0.933 0.92 0.876 0.939 16.7 0.97 17.2 0.91 0.938 0.85 0.876 0.934 20.9 0.93 21.4 0.87 0.935 0.81 0.871 0.931
140

APPENDIX VI
TURBULENCE DATA AND SURFACE PRESSURE DISTRIBUTION IN TURBULENT INCIDENT FLOW
The mean surface pressure coefficients Cl measured in turbulent incident flow at 23 stations eve: half of the cylinder circumference, along with its ratio to the measured (uncorrected) pressure coefficient Cp at the same azimuthal angle 8 in smooth incident flow CIJ/Cp, are listed in Table A.VI.l below at each of the fiye subcritical Reynolds numbers Re and each grid position
xg' In addition, the following data at each Reynolds number is tabulated in this table:
(1)
(2)
the grid position g 53 ( xg = "xg/R, R = 7.94 cm);
the background turbulence intensity Tub at each test position (vid., Fig. 6.1);
(3)
(4)
(5)
(6)
the background turbulence longitudinal integral scale referred to the cylinder diameter Ah/D at each test position (D = 15.88 cm, vid., Fig. 6.2);
the background turbulence longitudinal integral scale referred to the neutral scale of the stagna- tion flow at each test position (vid., Fig. 6.3); hb'Ao
the critical turbulence intensity Tut (vid., Fig. 6.4);
the position upwind of the cylinder Xmin (g min =x min/R) where the critical turbulence intensity was monitored (vid., Fig. 6.4);
The distributions of the pressure coefficient are shown in Figs. 6.5 to 6.9.
The following data in turbulent incident flow is further compiled at each Reynolds number and grid position in Table A-VI.2 below:
(1) the angular position of minimum pressure coeffi- cient 0; (vid., Fig. 6.12);
(2) the separation angle (or the starting point of the base region) 0; (vid., Fig. 6.20);
141

(3)
(4)
(5)
(6)
(7)
(8)
(11)
(12)
(13)
Note that
the angular extent of the adverse pressure gradi- ent region eArn (vid., Fig. 6.13);
the angular extent of the base region 0;s (vid., Fig. 6.14);
the minimum pressure coefficient CArn and its ratio to the minimum pressure coefficient in smooth incident flow Cim'Cpm (vid., Figs. 6.10 & 6.11);
the base pressure coefficient C' pb
and its ratio to the base pressure coefficient in smooth inci- dent flow $b"pb (vid., Figs. 6.15 & 6.16);
the pressure rise coefficient across the adverse pressure gradient region C'
pbm and its ratio to
the nressure rise coefficient in smooth incident flow- C' pbm/cpbm (vid., Figs. 6.18 & 6.19).
the average adverse pressure gradient across the adverse pressure gradient region Fig. 6.30);
C$,m/e;m (vid- I
the separation coefficient Fig. 6.31);
Cibm/O; (vid.,
the turbulence parameter based on background turbulence intensity at the test position TugRe (vid., Figs. 6.25 & 6.26);
the turbulence parameter based on the critical turbulence intensity 6.26);
TuERe (vid., Figs. 6.25 &
the turbulence separation parameter (Ab/rtD)TubRe %
(vid., Figs. 6.27, 6.28, 6.29, 6.30 & 6.31);
the turbulent drag coefficient 'Dt and its ratio to the corresponding measured (uncorrected) laminar drag coefficent CDt/CDa. (vid., Figs. 6.32 & 6.33).
data in turbulent incident flow is denoted by a prime. In addition, the angular position of minimum pres- sure coefficient (em), the separation angle (es), the angu- lar extents of the adverse pressure gradient region and base region (esm and ebs), the measured (uncorrected) minimum, base and pressure rise coefficients (C pm' %
and C pbm)'
142
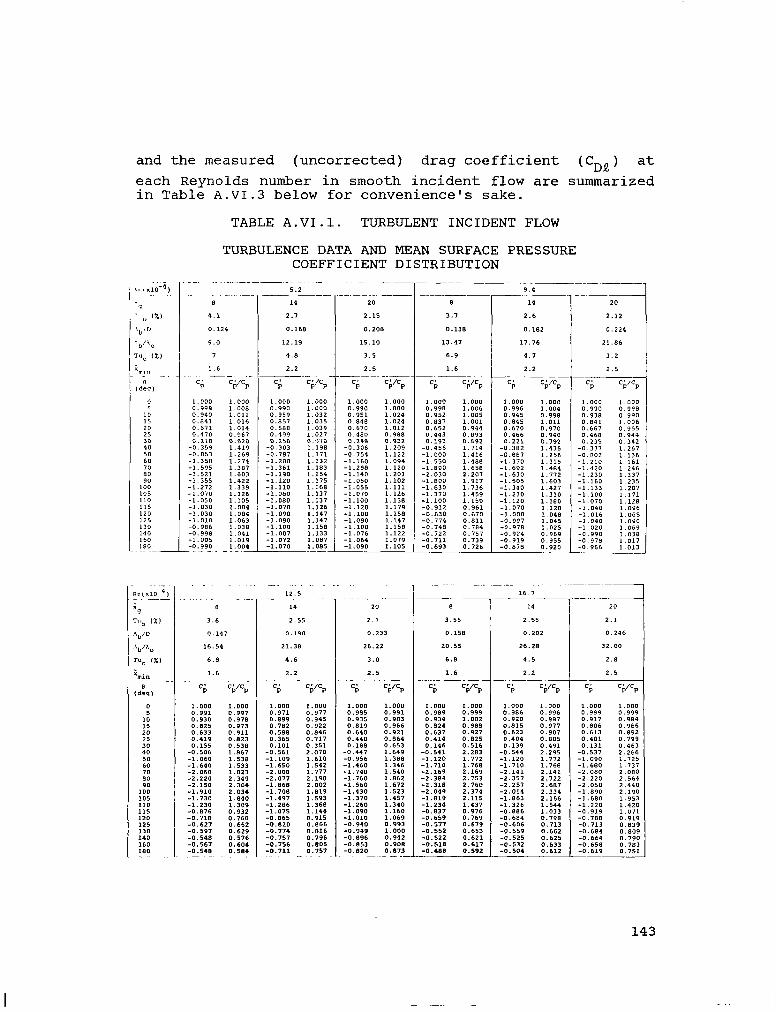
and the measured (uncorrected) drag coefficient (CDe) at each Reynolds number in smooth incident flow are summarized in Table A.VI.3 below for convenience's sake.
TABLE A.VI.1. TURBULENT INCIDENT FLOW
TURBULENCE DATA AND MEAN SURFACE PRESSURE COEFFICIENT DISTRIBUTION

Table A-VI.1 (continued)
8
3.5
0.172
25.03
6.7
1.6
ZO.,
14
2.5
0.216
31.13
2.5
2.2 ~.- C;, CP’CP
1.000 1.000 0.991 1.015 0.920 0.990 0.807 0.981 0.612 0.907 0.397 0.780 0.126 0.430
20
2.05
0.261
37.98
2.5
2.5
CP’CP
TABLE A.VI.2. TURBULENT INCIDENT FLOW
PRESSURE DISTRIBUTION CHARACTERISTICS, INCIDENT TURBULENCE
Re (XlO-4l
5.2 9.1
12.5 16.7 20.9
5.2 9.4
12.5 16.7 20.9
5.2 9.4
12.5 16.7 20.9
Re fXd)
5.2 9.4
12.5 16.7 20.9
5.2 9.4
12.5 16.7 20.9
5.2 9.1
12.5 16.7 20.9
CHARACTERISTICS, DRAG COEFFICIENT
0; e; e:. (d-3) (deg) (deg)
%s (deg)
c;"'cpm ‘;lb C;b’Cph
*Deduced by lntcrpolation.
144

TABLE A.VI.3. SMOOTH INCIDENT FLOW
PRESSURE DISTRIBUTION CHARACTERISTICS AND DRAG COEFFICIENT Re Bm es e
(x10-4) 6% 'bs 'Pm 'DQ
(deg) (*cl) 'pb 'pbm
(deg)
70 80 10 100 -1.15 -0.986 0.164 1.07
;: :: 10 100 -1.14 -0.954 0.186 1.06
12.5 10 100 -1.13 -0.939 0.191 1.05 16.7 70 80 10 100 -1.00 -0.824 0.176 0.97 20.9 70 80 10 100 -0.94 -0.774 0.166 0.93
145

APPENDIX A
LIST OF SYMBOLS
cD C
P
%b
'pbm
'pm
cPo
Cpbm'eAm
Cibm'ek D
D/h
D/S
d
dW
E(n)
h
k
k/D
M
n
P(e)
P,
pb
pm
146
drag coefficient
pressure coefficient
base pressure coefficient
pressure rise coefficient
minimum pressure coefficient
stagnation pressure coefficient
average adverse pressure gradient
separation coefficient
cylinder diameter
blockage coefficient
cylinder slenderness
rod diameter in turbulence generating-grid
wake width
one-dimensional energy spectrum
wind-tunnel cross-section height (or width)
roughness height; base pressure parameter in Sect. 3.4
relative surface roughness
mesh of turbulence-generating grid; Mach number in Sect. 7
frequency
surface static pressure
freestream static pressure
base pressure
minimum pressure

PO
R
Re
S
Tu
U 03
"b U’
2
X,Y,Z
xg X min
% 8
'b
'bs
'rn
eS
8 sm
stagnation pressure
cylinder radius
cylinder-diameter Reynolds number
cylinder span; Strouhal number in Sect. 2.3
turbulence intensity
freestream turbulence intensity
background turbulence intensity
critical turbulence intensity
turbulence parameter
freestream velocity
background mean velocity
rms value of axial turbulent velocity
mean-square value of axial turbulent velocity
rms value of background axial turbulent velocity
mean-square value of background axial turbu- lent velocity
Cartesian coordinates
turbulence-generating grid position
position of critical turbulence intensity
laminar boundary-layer thickness
azimuthal (or peripheral) angle
base point
base region angular extent
minimum pressure angular position
separation angle
adverse pressure gradient region angular extent
147

A
*b
As
P
V
P
0
t
Superscripts
I
*
Subscripts
a
M
min
t
body shape factor in App. II
longitudinal integral scale of background turbulence
neutral scale (or wavelength)
Strouhal scale
dynamic viscosity
kinematic viscosity
density
turbulence-generating grid solidity; blockage parameter in App. II
blockage parameter in App. II
means 'turbulent incident flow'
means 'blockage corrected'
means 'dimensionless'
time averaged
laminar
Maskell blockage correction method
minimum
turbulent
The International System (SI) of measurement was used throughout this work. Conversion from SI units to U.S. cus- tomary units was carried out to approximately two to three significant digits.
148

1. Report No. 2. Government Accession No. 3. Recipient’s Catalog No.
NASA CR-3622 4. Title and Subtitle 5. Report Date
TURBULENCE EFFECT ON CROSSFLOW AROUND A CIRCULAR November 1982
CYLINDER AT SUBCRITICAL REYNOLDS NUMBERS 6. Performing Organization Code
7. Author(s) 8. Performing Organization Report NO.
CER 81-82 WZS-DBS51 Willy Z. Sadeh and Daniel B. Saharon
9. Performing Organization Name and Address
Colorado State University Fluid Mechanics and Wind Engineering Program Department of Civil Engineering Fort Collins, Colorado 80523
12. Sponsoring Agency Name and Address
National Aeronautics and Space Administration
10. Work Unit No.
Washington, D. C. 20546
15. Supplementary Notes
11. Contract or Grant No.
NSG 3127 13. Type of Report and Period Covered
Contractor Report 14. Sponsoring Agency Code
505-36-12 (E -1341)
Final report. Project Manager, Peter M. Sockol, Fluid Mechanics and Acoustics Division, NASA Lewis Research Center, Cleveland, Ohio 44135.
16. Abstract
An investigation of the effect of freestream turbulence on the flow around a smooth circular cylinder at subcritical Reynolds numbers from 5. 2x10⁴ to 2.09x10⁵ was conducted. Measure- ments show that the interaction of incident turbulence with the initial laminar boundary layer: (1) modifies the characteristics of the mean surface pressure distribution; (2) induces an aft shift in the separation point ranging from 5 to 50° beyond the laminar separation angle of 80°; and, (3) reduces the mean drag coefficient to values between 97 and 46% of its nearly constant laminar counterpart. The extent of these changes depends on the particular Reynolds number- background turbulence combination. These results demonstrate that a boundary-layer flow similar to that found in critical, supercritical and/or transcritical flow regimes is induced by turbulence at subcritical Reynolds numbers and, hence, the effect of turbulence is equivalent to an effective increase in the Reynolds number. The change in the nature and properties of the boundary layer in the subcritical regime, consequent upon the penetration of turbulence into it, is in agreement with the model proposed by the vorticity-amplification theory.
17. Key Words (Suggested by Author(s))
Stagnation flow; Turbulent flow about a bluff body; Vorticity amplification; Turbulence amplification; Turbulent boundary layer;
18. Distribution Statement
Unclassified - unlimited STAR Category 34
Laminar boundary layer; Flow visualization
19. Security Classif. (of this report1 20. Security Classif. (of this page)
Unclassified Unclassified
21. No. of Pages 22. Price*
152 A08
* For sale by the National Technical information Service, Springfield, Virginia 22161 NkSA-Langley. 1982