turnaround leadership development project: preliminary ... - turnaround... · turnaround leadership...
TRANSCRIPT

Turnaround Leadership Development Project:
Preliminary Findings from a Statewide Project
Rose M. Ylimaki, Associate Professor
Educational Leadership University of Arizona
Lynnette Brunderman Associate Professor of Practice
Educational Leadership University of Arizona
A Preliminary Report prepared for Arizona Board of Regents
May 1, 2012

2
Turnaround Leadership Development Project (TLDP):
Findings from a Statewide Project
Introduction
In 2010, the Arizona Department of Education designated 252 schools across the
state at Tier III, persistently underperforming schools. Arizona schools serve culturally
diverse students with the majority being Hispanic or Latino. According to the U.S.
Census Bureau (2009) report, the percentage of Arizona population with Hispanic or
Latino origin is 30.8%. Indian and Alaska Native persons count 4.9% of Arizona
population, significantly more than the national parameter of 1.0%. The percentage of
White not Hispanic population in Arizona is 57.3%, lower than that national data of
65.1%. The percentages of other ethnicities in the Arizona population are 4.4% Black, 2.6%
Asian persons, 0.2% Native Hawaiian and Other Pacific Islander, and 1.8% reporting two
or more races (U. S. Census Bureau, 2009). Many Arizona schools also serve high
percentages of children living in poverty. Nonetheless, Arizona state policy mandates that
between one-third and one-half of principals’ evaluations are based on student academic
growth including student outcomes on state tests (ARS §15-203(A)(38). Furthermore,
support for principal performance pay is growing among many legislators tied to these
same results.
This policy environment is particularly challenging for principals of Arizona Tier
III schools that have been in school improvement for a series of years given current
curriculum and accountability politics. This paper reports empirical findings from a
mixed-methods study of a statewide turnaround leadership intervention designed to
develop Tier III Arizona principals’ and teachers’ knowledge and skills aimed at

3
curriculum change and improvements in student outcomes. The project was funded by
the Arizona Board of Regents to develop a statewide intervention for persistently
underperforming Arizona schools.
This paper is organized into five main sections. The first two sections provide an
overview and description of the Turnaround Leadership Development model. Next, the
project evaluation is presented. The fourth section describes results of the project that
indicate a large effect of the leadership development model on participating principals’
and teachers’ effectiveness (knowledge and skills). The paper concludes with
implications for research, leadership preparation, and practice.
Background
In 2011-12 Arizona turnaround schools received $ 10,114,156 for school
improvement grants (Arizona Department of Education, 2011). At the same time, none of
the Arizona turnaround providers show results from studies with at least moderate
evidence to support causal conclusions (Brinson, Kowal & Hassel, 2008). Given the lack
of Turnaround innovations with at least moderate evidence of success, the number of
low-performing schools, and the high costs of school improvement grants, there was a
definite need for a validated turnaround school innovation. Moreover, turnaround with its
related staff turnover causes intense disruption for students, producing little to no gain in
student achievement (Brinson et al., 2008). Leadership succession literature (e.g.
Leithwood & Mascall, 2008) also validates that high principal and teacher turnover
impedes school and district productivity. In Arizona for 2010 and 2011, 31 schools were
reconstituted and new principals and teachers were hired.

4
This Turnaround Leadership Development model prepared school leaders to
engage in effective strategies for using data to improve teaching and learning in all
curriculum subjects. The project results indicate that the TLDP fills these needs with a
cost-effective turnaround innovation that increases principal and teacher effectiveness,
and improves student outcomes and productivity. Results of the project suggest that it is
portable and ready to scale regionally and nationally.
Description of the Project
TLDP (Figure 1) illustrates the ways that school principals and teachers in high-
needs (Arizona Tier III) schools who learn about whole school turnaround leadership
content (Leithwood et al., 2010; Robinson, Lloyd & Rowe, 2008; Ylimaki & Jacobson,
2011) through a combination of delivery components build systems-wide capacity to
diffuse the TLDP training throughout their classrooms and schools, in turn, improving
student outcomes for all student groups, including Special Education and LEP students.
Figure 1: Logic Model for TLDP
SCHOOLWIDE EXPERIENCE
Changes in capacities,
motivation, & settings
CLASSROOM EXPERIENCE
Turnaround Leadership
Content
Improved Student
Outcomes
Direct Instruction
Regional Meetings
Building Capacity
of Systems Whole School Reform
Strategy: Implementation of the TLDP Whole School Reform Model
Outcomes
District Context
5
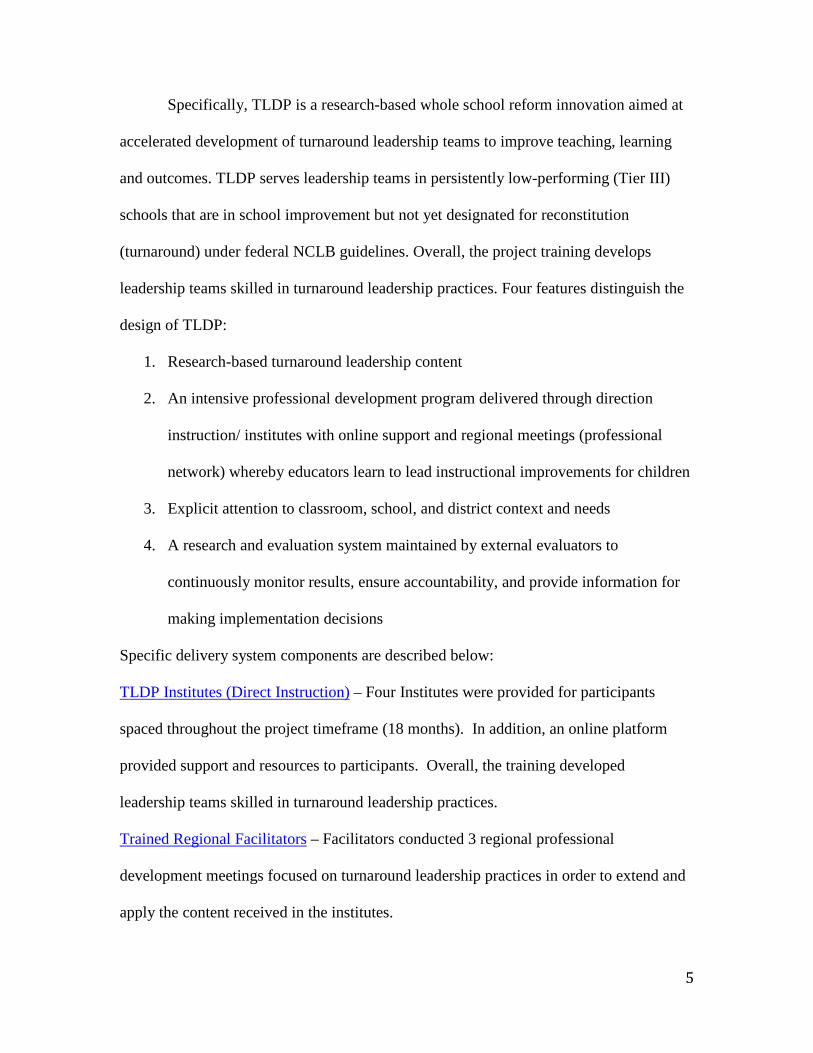
Specifically, TLDP is a research-based whole school reform innovation aimed at
accelerated development of turnaround leadership teams to improve teaching, learning
and outcomes. TLDP serves leadership teams in persistently low-performing (Tier III)
schools that are in school improvement but not yet designated for reconstitution
(turnaround) under federal NCLB guidelines. Overall, the project training develops
leadership teams skilled in turnaround leadership practices. Four features distinguish the
design of TLDP:
1. Research-based turnaround leadership content
2. An intensive professional development program delivered through direction
instruction/ institutes with online support and regional meetings (professional
network) whereby educators learn to lead instructional improvements for children
3. Explicit attention to classroom, school, and district context and needs
4. A research and evaluation system maintained by external evaluators to
continuously monitor results, ensure accountability, and provide information for
making implementation decisions
Specific delivery system components are described below:
TLDP Institutes (Direct Instruction) – Four Institutes were provided for participants
spaced throughout the project timeframe (18 months). In addition, an online platform
provided support and resources to participants. Overall, the training developed
leadership teams skilled in turnaround leadership practices.
Trained Regional Facilitators – Facilitators conducted 3 regional professional
development meetings focused on turnaround leadership practices in order to extend and
apply the content received in the institutes.
6
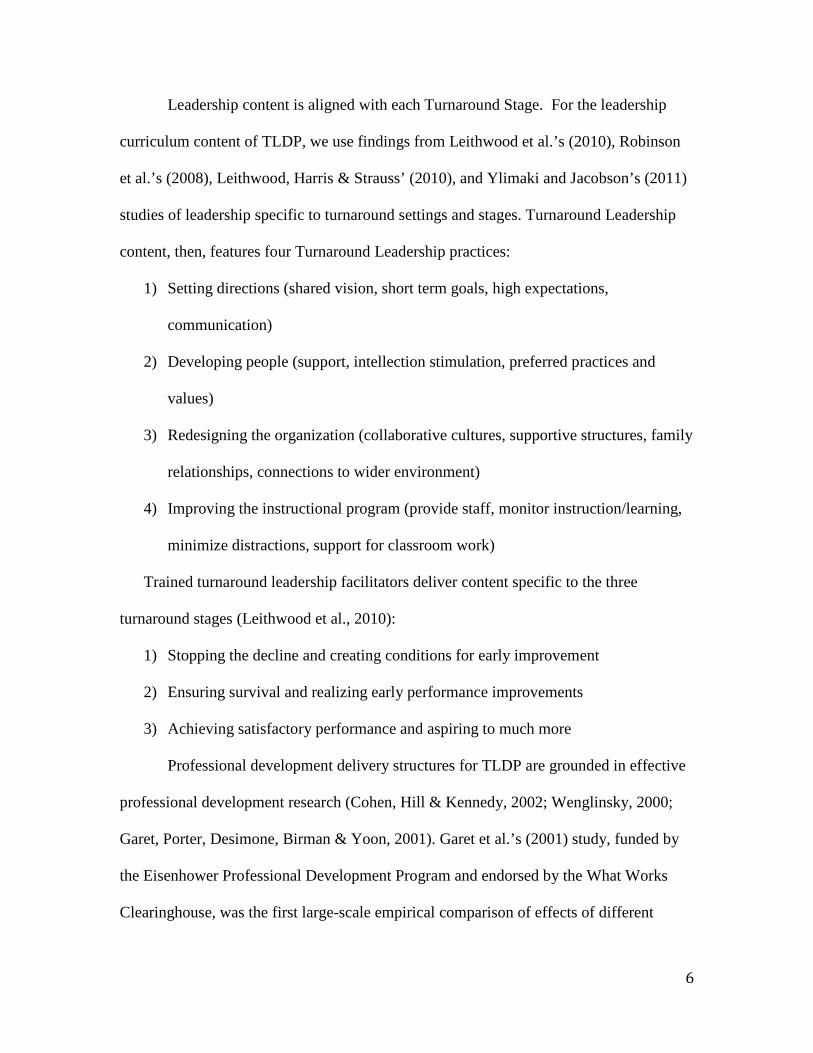
Leadership content is aligned with each Turnaround Stage. For the leadership
curriculum content of TLDP, we use findings from Leithwood et al.’s (2010), Robinson
et al.’s (2008), Leithwood, Harris & Strauss’ (2010), and Ylimaki and Jacobson’s (2011)
studies of leadership specific to turnaround settings and stages. Turnaround Leadership
content, then, features four Turnaround Leadership practices:
1) Setting directions (shared vision, short term goals, high expectations,
communication)
2) Developing people (support, intellection stimulation, preferred practices and
values)
3) Redesigning the organization (collaborative cultures, supportive structures, family
relationships, connections to wider environment)
4) Improving the instructional program (provide staff, monitor instruction/learning,
minimize distractions, support for classroom work)
Trained turnaround leadership facilitators deliver content specific to the three
turnaround stages (Leithwood et al., 2010):
1) Stopping the decline and creating conditions for early improvement
2) Ensuring survival and realizing early performance improvements
3) Achieving satisfactory performance and aspiring to much more
Professional development delivery structures for TLDP are grounded in effective
professional development research (Cohen, Hill & Kennedy, 2002; Wenglinsky, 2000;
Garet, Porter, Desimone, Birman & Yoon, 2001). Garet et al.’s (2001) study, funded by
the Eisenhower Professional Development Program and endorsed by the What Works
Clearinghouse, was the first large-scale empirical comparison of effects of different

7
characteristics of professional development on teachers’ learning. Results of the study
indicate that there are more positive outcomes from professional development activities
when all of the structural features and the core features are included:
Table 1: Alignment of Professional Development Features with TLDP
Structural and Core Features TLDP Form institutes, regional meetings Duration regular contact; collective participation—school-based teams Content focus leadership; active learning opportunities – application, reflection,
demonstration follow-up Coherence aligned with ISLLC
In sum, the TLDP model provides research-based turnaround leadership content
through a delivery system aligned with professional development best practice. In the
next section, we describe how we evaluated the TLDP model using both quantitative and
qualitative methods.
Evaluation Methods
TLDP has utilized rigorous research as a basis for design and evaluation
(Leithwood et al., 2010; Robinson et al., 2008; Ylimaki & Jacobson, 2011). The study
followed guidelines for mixed methods design. Research questions were:
1) Can the turnaround curriculum and delivery impact teachers’ and principals’
leadership knowledge and skills within the project period as a result of the
leadership development program?
2) How, if at all, do the leadership knowledge modules influence turnaround
practices?
3) To what extent has the project impacted student outcomes?
8
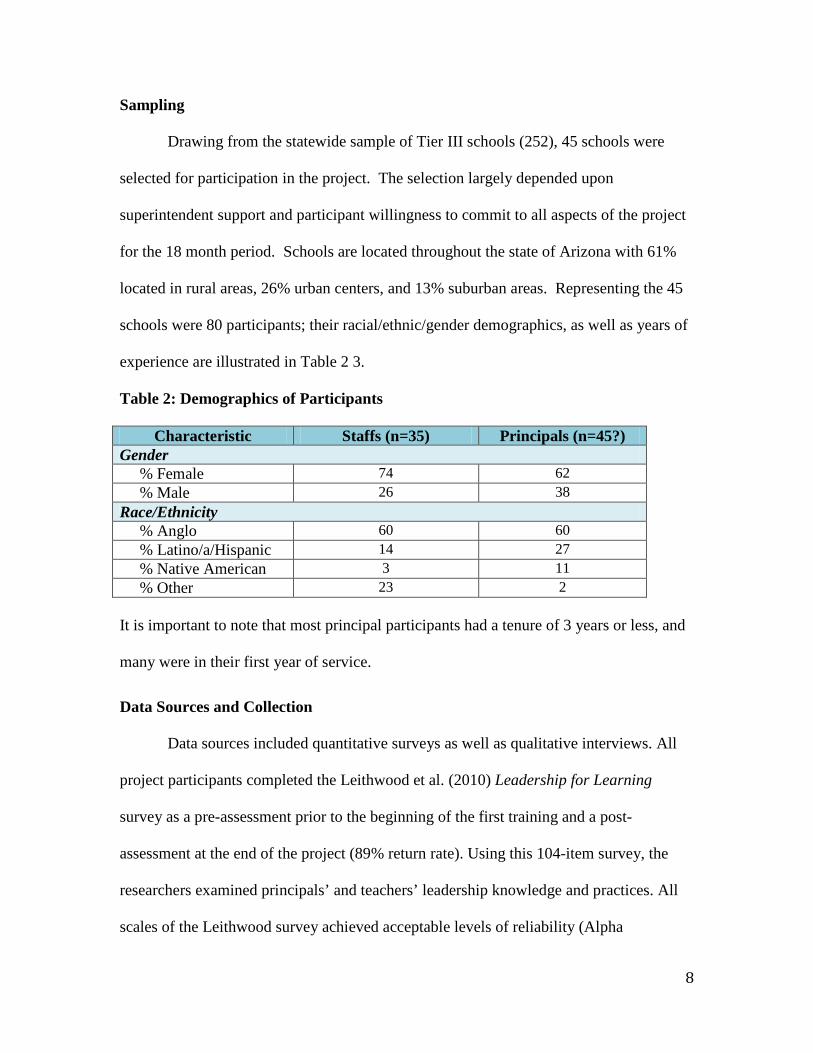
Sampling
Drawing from the statewide sample of Tier III schools (252), 45 schools were
selected for participation in the project. The selection largely depended upon
superintendent support and participant willingness to commit to all aspects of the project
for the 18 month period. Schools are located throughout the state of Arizona with 61%
located in rural areas, 26% urban centers, and 13% suburban areas. Representing the 45
schools were 80 participants; their racial/ethnic/gender demographics, as well as years of
experience are illustrated in Table 2 3.
Table 2: Demographics of Participants
Characteristic Staffs (n=35) Principals (n=45?) Gender % Female 74 62 % Male 26 38 Race/Ethnicity % Anglo 60 60 % Latino/a/Hispanic 14 27 % Native American 3 11 % Other 23 2 It is important to note that most principal participants had a tenure of 3 years or less, and
many were in their first year of service.
Data Sources and Collection
Data sources included quantitative surveys as well as qualitative interviews. All
project participants completed the Leithwood et al. (2010) Leadership for Learning
survey as a pre-assessment prior to the beginning of the first training and a post-
assessment at the end of the project (89% return rate). Using this 104-item survey, the
researchers examined principals’ and teachers’ leadership knowledge and practices. All
scales of the Leithwood survey achieved acceptable levels of reliability (Alpha

9
coefficients between .72 and .96). Leithwood et al. (2010) demonstrated with strong
evidence the indirect effects between these leadership practices (setting direction,
developing people, redesigning the organization, and improving the instructional
program) and student outcomes.
The qualitative phase of the study featured 30-45 minute semi-structured
interviews with participants that had completed all aspects of the training, including (a)
attendance at all institutes and follow-ups, (b) completion of the survey, and (c)
attendance at regional meetings. Interview questions were developed from the survey
findings, featuring capacity building, collaboration, community involvement,
accountability, and values and priorities. Semi-structured interviews were conducted
during subsequent instructional leadership institutes in order to determine what changes
in capacity-building occurred during the intervention period following the first institute.
Interview participants included 16 principals and 13 teachers (See Table 3).
Table 3: Interview Participant Characteristics (N=29)
Characteristic Staffs (n=13) Principals (n=16) Gender % Female 23 25 % Male 77 75 Race/Ethnicity % Anglo 84 56 % Latino/a/Hispanic 8 25 % Native American 0 19 % Other 8 0
After each of three institutes, external evaluators (Cloud Team) also asked
participants qualitative information about how to improve logistics, training delivery, and
communication of the project as a whole.

10
Data Analysis
Survey respondents yielded an 89% return rate. Surveys from 18 respondents
were eliminated due to large amounts of missing data. Open-ended questions revealed
survey data were incomplete due to the respondent’s lack of knowledge about the school
year as they were new in the position reducing the total survey sample to 62 participants
(35 principals, 27 staff). Mode imputation was used to replace missing data for the
remaining participants, which, at most, included 1 or 2 questions per survey.
Survey results were analyzed descriptively and using chi-squared tests to compare
means between the principals’ self-reported responses and two teachers’ familiar with
his/her practice. Reliability was .97 for the principal surveys and .95 for the staff surveys.
Independent samples t-tests were used to compare means between the principals’ self-
reported responses and staff familiar with his/her practice. Because Likert-scale
responses consist of only five categories (low to high) and technically have a range of
answers that assumes a discrete distribution rather than a normal distribution, we also
performed chi-squared tests to determine the significance of association in order to be
more statistically valid. A reliability analysis was performed for each survey. The alpha
coefficients are .95 (staff survey) and .97 (principal survey), thus indicating very strong
internal consistency.
Since the qualitative portion involves contextually sensitive data concerning
individual perceptions about the work of each teacher and principal, we employ an
interpretative lens to allow for an in-depth inquiry into the turnaround leadership
“phenomenon in real-life context” (Merriam, 2001, p. 191). Our purpose, in this
approach, is to uncover causation through “insight, discovery and interpretation”

11
(Merriam, 1988, p.10). Interview data were analyzed inductively in light of Leithwood’s
turnaround leadership practices (Leithwood, Harris & Strauss, 2010) and leadership in
the socio-cultural dimension (Ylimaki, Bennett, Fan & Villaseñor, 2012). Inductive
analysis was used to allow particular themes to emerge based on lived experiences. To
ensure reliability, codes and themes used in this study required consensus with two
additional coders.
Results
Quantitative Results
Low capacities. At the beginning of the project, teachers and principals scored as ‘low
capacity’ for turnaround readiness on 74% of all items. Shared low capacity mean scores
(14%) consisted of a ‘1’ or ‘2’ on a 5-point scale. Mean differences between staff and
principal groups on low capacity items were not statistically significant. Low capacity
means indicated challenges in shared vision and with some assessment literacy practices.
For example, respondents had difficulties in defining success (M=2.2, SD=1.06) and
consistent implementation of common formative assessments across all grade levels
(M=2.7, SD=1.21). Students were impeded in their academic progress by lack of
economic advantage or lack of safety in the surrounding neighborhood. Families were not
viewed as supportive of their children’s education. Schools also did not take steps to
provide inclusive and student relevant curriculum that engaged parental or student input
nor considered outside involvement useful in developing common formative assessments
(see Table 4). Students were also minimally involved in contributing to the direction of
the school (M=2.7, SD=.98). Isolation of the school from the community was further
evident in the lack of interactions and building positive external relationships with respect

12
to supporting curriculum, collaborating with community organizations (e.g., civic
associations, businesses, non-profits, etc.) and communicating key information about
student progress.(see Table 5). Schools did not engage their communities.
Table 4: Extent of Inclusive and Student Relevant Curriculum (N=62)
Survey Item M1 SD Student relevant curriculum 2.9 1.05 Change in student relevant curriculum over last 5 years
2.9
1.02
Students inform curriculum 2.7 1.04 Parent involvement in curriculum planning
2.6
1.05
Common formative assessments developed with multiple stakeholders
1.5
.78 1Note. Mean score of respondent on Likert-scale item (1=Low, 5 = High)
Table 5: Community Relationship Building (N=62)
Survey Item M1 SD Curriculum supported by community partnerships
2.5
1.05
Principal contributions to curriculum supported by community partnerships
2.7
1.13 Collaboration with community organizations
2.6
1.02
Vision communicated to members of the external community
2.6
1.10 Assessment data shared with the community
2.5
1.07
Principal contributions to sharing assessment data with the community
2.8
1.29 1Note. Mean score of respondent on Likert-scale item (1=Strongly Disagree, 5 = Strongly Agree)
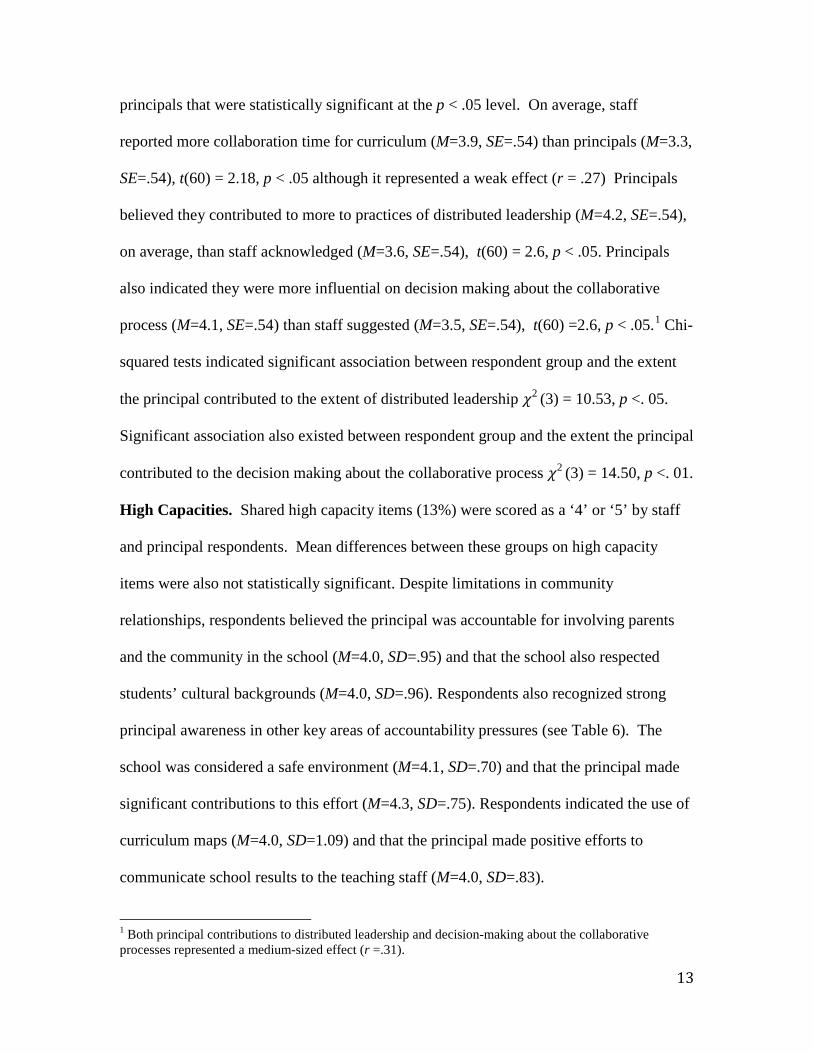
Medium capacities and discrepancies. Survey respondents scored 66% of the Likert-
scale items (responses coded ‘1’ through ‘5’) as a ‘3’ indicating medium capacity.
Limited capacities were also exemplified in the mean differences between staffs and
13
principals that were statistically significant at the p < .05 level. On average, staff
reported more collaboration time for curriculum (M=3.9, SE=.54) than principals (M=3.3,
SE=.54), t(60) = 2.18, p < .05 although it represented a weak effect (r = .27) Principals
believed they contributed to more to practices of distributed leadership (M=4.2, SE=.54),
on average, than staff acknowledged (M=3.6, SE=.54), t(60) = 2.6, p < .05. Principals
also indicated they were more influential on decision making about the collaborative
process (M=4.1, SE=.54) than staff suggested (M=3.5, SE=.54), t(60) =2.6, p < .05.1 Chi-
squared tests indicated significant association between respondent group and the extent
the principal contributed to the extent of distributed leadership 𝜒2 (3) = 10.53, p <. 05.
Significant association also existed between respondent group and the extent the principal
contributed to the decision making about the collaborative process 𝜒2 (3) = 14.50, p <. 01.
High Capacities. Shared high capacity items (13%) were scored as a ‘4’ or ‘5’ by staff
and principal respondents. Mean differences between these groups on high capacity
items were also not statistically significant. Despite limitations in community
relationships, respondents believed the principal was accountable for involving parents
and the community in the school (M=4.0, SD=.95) and that the school also respected
students’ cultural backgrounds (M=4.0, SD=.96). Respondents also recognized strong
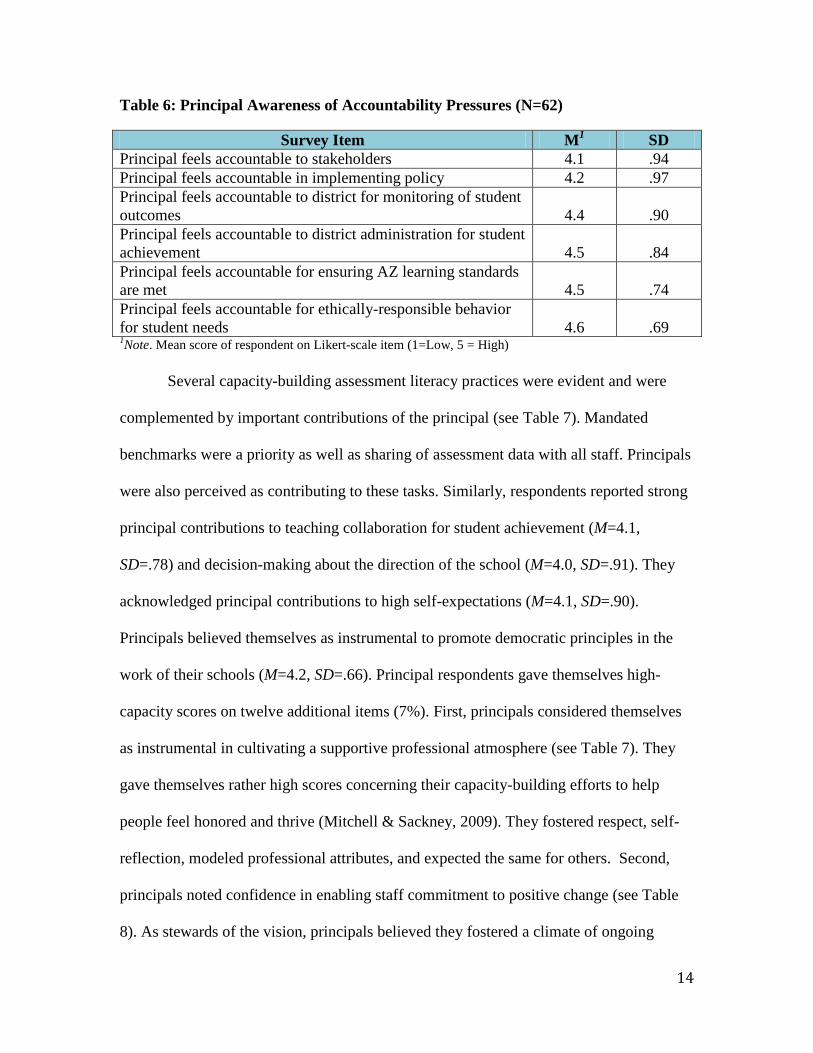
principal awareness in other key areas of accountability pressures (see Table 6). The
school was considered a safe environment (M=4.1, SD=.70) and that the principal made
significant contributions to this effort (M=4.3, SD=.75). Respondents indicated the use of
curriculum maps (M=4.0, SD=1.09) and that the principal made positive efforts to
communicate school results to the teaching staff (M=4.0, SD=.83).
1 Both principal contributions to distributed leadership and decision-making about the collaborative processes represented a medium-sized effect (r =.31).
14
Table 6: Principal Awareness of Accountability Pressures (N=62)
Survey Item M1 SD Principal feels accountable to stakeholders 4.1 .94 Principal feels accountable in implementing policy 4.2 .97 Principal feels accountable to district for monitoring of student outcomes
4.4
.90
Principal feels accountable to district administration for student achievement
4.5
.84
Principal feels accountable for ensuring AZ learning standards are met
4.5
.74
Principal feels accountable for ethically-responsible behavior for student needs
4.6
.69
1Note. Mean score of respondent on Likert-scale item (1=Low, 5 = High)
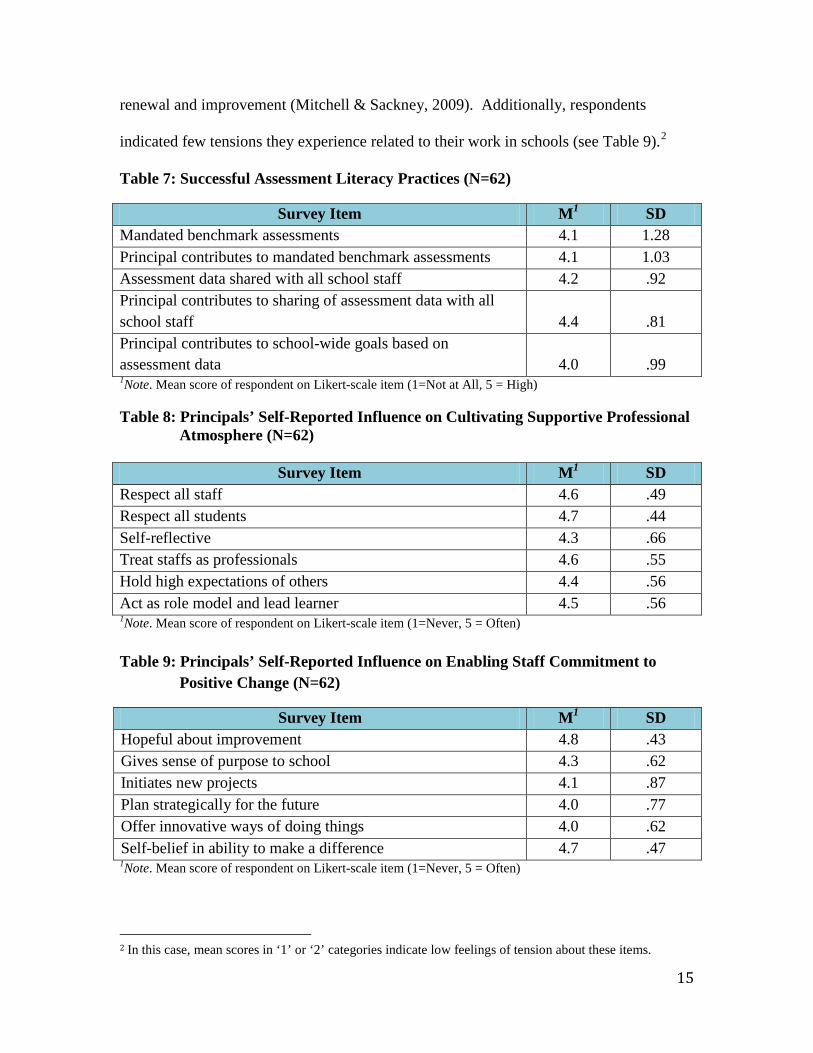
Several capacity-building assessment literacy practices were evident and were
complemented by important contributions of the principal (see Table 7). Mandated
benchmarks were a priority as well as sharing of assessment data with all staff. Principals
were also perceived as contributing to these tasks. Similarly, respondents reported strong
principal contributions to teaching collaboration for student achievement (M=4.1,
SD=.78) and decision-making about the direction of the school (M=4.0, SD=.91). They
acknowledged principal contributions to high self-expectations (M=4.1, SD=.90).
Principals believed themselves as instrumental to promote democratic principles in the
work of their schools (M=4.2, SD=.66). Principal respondents gave themselves high-
capacity scores on twelve additional items (7%). First, principals considered themselves
as instrumental in cultivating a supportive professional atmosphere (see Table 7). They
gave themselves rather high scores concerning their capacity-building efforts to help
people feel honored and thrive (Mitchell & Sackney, 2009). They fostered respect, self-
reflection, modeled professional attributes, and expected the same for others. Second,
principals noted confidence in enabling staff commitment to positive change (see Table
8). As stewards of the vision, principals believed they fostered a climate of ongoing
15
renewal and improvement (Mitchell & Sackney, 2009). Additionally, respondents
indicated few tensions they experience related to their work in schools (see Table 9).2
Table 7: Successful Assessment Literacy Practices (N=62)
Survey Item M1 SD Mandated benchmark assessments 4.1 1.28 Principal contributes to mandated benchmark assessments 4.1 1.03 Assessment data shared with all school staff 4.2 .92 Principal contributes to sharing of assessment data with all school staff
4.4
.81
Principal contributes to school-wide goals based on assessment data
4.0
.99
1Note. Mean score of respondent on Likert-scale item (1=Not at All, 5 = High) Table 8: Principals’ Self-Reported Influence on Cultivating Supportive Professional
Atmosphere (N=62)
Survey Item M1 SD Respect all staff 4.6 .49 Respect all students 4.7 .44 Self-reflective 4.3 .66 Treat staffs as professionals 4.6 .55 Hold high expectations of others 4.4 .56 Act as role model and lead learner 4.5 .56 1Note. Mean score of respondent on Likert-scale item (1=Never, 5 = Often) Table 9: Principals’ Self-Reported Influence on Enabling Staff Commitment to
Positive Change (N=62)
Survey Item M1 SD Hopeful about improvement 4.8 .43 Gives sense of purpose to school 4.3 .62 Initiates new projects 4.1 .87 Plan strategically for the future 4.0 .77 Offer innovative ways of doing things 4.0 .62 Self-belief in ability to make a difference 4.7 .47 1Note. Mean score of respondent on Likert-scale item (1=Never, 5 = Often)
2 In this case, mean scores in ‘1’ or ‘2’ categories indicate low feelings of tension about these items.

16
They felt rather insulated from pressures that caused them to neglect the interests of
students in order to comply with district requirements, choose between competing values,
or to avoid participation outside the school (e.g., committees, professional development)
because of constraints at school (see Table 10).
Table 10: Extent of Shared Inherent Tensions (N=62)
Survey Item M1 SD Tensions between district requirements and what is best for students
2.8 1.09
Tensions choosing between competing values 2.5 1.00 Tensions present at school vs. participating outside school 2.7 1.31 1Note. Mean score of respondent on Likert-scale item (1=Never, 5 = Always)
Therefore, while quantitative findings suggest principals possess high self-
capacity for developing people, commitments, setting direction, and effectively
improving some aspects of the instructional program within their schools, these views
were not equally shared by staff. Most capacities for building curriculum change at the
beginning of the intervention period ranged from low to medium and reveal certain
discrepancies or weaknesses. Schools manifested a keen awareness of accountability
pressures, and ability to comply with mandates that required use of some practices
necessary for curriculum change (e.g., curriculum maps, benchmarks) although they had
difficulties in defining success. Schools valued supportive, professional, collaborative,
democratic environments although they neither lacked deep-rooted connections or
consciousness with their communities nor seemed to value their contributions or support.
Qualitative Results
Qualitative findings extend description of key discrepancies noted in the
quantitative section in ways that suggest limited participant understanding about
turnaround leadership practices early in the project. Indeed, many participants suggested

17
that their schools were in transition and that they were at various stages of developing
capacity for change with some improvement related to intervention efforts. While
principals and teacher leaders reported that their schools were making positive changes
regarding formative assessments, data use, and growth in redesigning their organizations.
In this section, low capacity and developing processes will be discussed in terms of three
emergent themes: 1) varied definitions of effective turnaround leadership; 2) the extent of
implementation and development of organizational redesign around professional learning
communities; 3) barriers to change.
Varied Definitions of Effective Turnaround Leadership
When asked to provide their definition of turnaround leadership, participants
responded in two primary ways: leadership as formal administrative role and leadership
as a capacity for curriculum change. While some emphasized that leadership is the sole
role of administration, others talked about instructional leadership in terms of capacity or
shared with others in collaborative teams. These definitions guided their leadership
practices, particularly in terms of PLC implementation and community engagement.
Leader as principal’s role. Participants who emphasized individualized instructional
leadership focused on their administrative roles in leading the curriculum and
instructional development at their schools. They tended to answer the question of
defining turnaround leadership in I statements. For example, a charter school principal
responded that, “I’m looking at the bigger picture. I’m looking at the curriculum. I’m
looking at how everybody is approaching the kids and what they can do differently.”
For others, the principal’s role as a leader centers on his/her abilities to monitor
instruction and staff/student interactions. More specifically, participants defined this role
18
in terms of direct supervision and management. For example, one principal noted that
leadership meant “ensuring teachers are doing their best, that the students are actually
learning from the method the teacher is using, and that students are not being abused in
some way.” Similarly, a high school assistant principal emphasized that her role as a
turnaround leader is to confront ineffective instructional practice. She indicated, “if
they’re not using effective practices, we [administration] step in and make sure they do,
in whatever way that happens.”
In some contrast to the individual, managerial, approach to leadership, others
defined it in terms of collaborative practices and capacity building. For one elementary
principal, the locus of control for leadership went beyond her role as the principal. She
maintained that agency for leadership should also include “the facilitators and the
paraprofessionals. It’s the anybody who touches the child in their educational career.” For
her, the principal’s role was “to help build that [leadership capacity] within them.” Others
similarly defined leadership as an interdependent team effort consistent with Leithwood
et al.’s (2010) notion of redesigning the organization around collaboration. As one
elementary principal stated, “It should be building the capacity of everybody. We are an
interdependent team of leaders.”
While most of the definitions of collaboration leadership in terms of the school
staff, only one principal extended the definition to the other stakeholders. She defined
leadership as a collaborative practice:
where a group of people—teachers, support staff, administrators, and parents
as— stakeholders come together to evaluate their mission and vision, and where
they want to focus, and where they want to go with the school.

19
The varied and sometimes contrasting definitions of turnaround leadership
appeared to have a direct impact on the level of a shared ethos for collaboration in each
school. Participant understandings of the nature of leadership, characterized by one
teacher leader, determines “how you define the school, and how you take that role of not
necessarily the leader, but how you build that collaboration with everybody to focus what
your true priorities are for the school.” The nature of leadership enabled extent of
collaboration among staff “to really understand that we are here to serve a common
mission,” which “has to be built around the values of the school, the community.”
Turnaround leadership practices also had implications for capacity building and the
functioning of professional learning communities, a model that many of the schools have
adopted as a vehicle for organizational redesign. In the next section, varied levels of PLC
implementation and development will be discussed.
Professional Learning Communities
Participants highlighted the use of professional learning communities (PLCs) to
redesign their organizations and drive the use of formative assessments and other data
(e.g. state test results) for instructional decisions. For principals of Tier III schools, data-
based decision-making is essential to make adequate yearly progress on standardized
tests. While the majority of participants identified some level of engagement in the
development and implementation of PLCs, they were at varying levels of
implementation.
Some participants noted that the development of PLCs were in their initial stages.
For example, some participants have started to look at how they can implement PLCs
into practice at their schools. As one principal noted, “We have looked at how we instruct
20
our students, how we build community within our school.” Similarly, another principal
stated that she implemented PLCs at each of her campuses. However, principals in the
beginning stages of PLC implementation defined the implementation of PLCs as “an
ongoing process” and “slow going.” For others, the process, although slow is better than
what previously existed. An elementary school principal discussed the chaos prior to
initiating a professional learning community model at her school. In the past, “we were
always flying by the seat of our pants and this year the school is focusing on building the
culture.”
While some participants were in the beginning stages of implementing PLCs,
some were unable to “fit it into” current practices. One principal stated, “I think it is
something that has to start small and build before it goes system wide. We just don’t have
the time to put one more thing on teachers plates” referring to collaboration around data
in their professional learning communities. Likewise, a superintendent/principal
identified a lack of time and other mandates as her rationale for not promoting PLCs at
this time. According to her, the school is going to collaborate next summer “to work on
curriculum mapping, pacing guides, and creating our own formative assessments.”
Other participants have had difficulty and unexpected outcomes in their transition
toward interdependent professional learning communities. According to a middle school
principal who has been promoting PLCs at her school for several years, “the biggest
challenge has been from re-culturing the school from that old industrial model into a
professional learning community.” Another principal found that collaboration in
professional learning communities brought to light areas that were in need of focus that
went undiscovered until teachers worked together. He stated that PLCs “forced us to look
21
a little bit deeper at our data. That was kind of alarming...We maybe had that before and
really didn’t focus on it.”
Other participants saw the implementation of PLCs as an experience that changed
the way that they viewed leadership and the role of the entire school staff. For a high
school assistant principal, PLCs are:
really looking at how you define the school, and how you take the role of not
necessarily the leader, but how you build that collaboration with everybody to
focus on what your true priorities are for the school.
While PLC implementation caused some participants to transform practices from
independent decision-making to collaborative decision-making, one principal highlighted
the difficulty in implementing the PLC model when school staff is not interested in
collaboration. She, in turn, has taken a directive approach to force compliance with the
professional learning community she has begun at her school. For her, non-compliant
staff has no place in her school. She stated, “Those who don’t, who push away from their
own personal accountability and their choices, they are team members who are on their
way out unless they change their philosophy.”
Despite the struggles implementing professional learning communities, some
principals responded that the PLC model has made a positive impact on their school and
staff practices. An elementary school principal reported that, “It’s given them [teachers]
more structure for knowing what to do with data and then having the trust with each other
and with the administration that we are going to do what we need to do. For a middle
school principal, transitioning from more traditional professional development to a PLC
has improved instructional practices and focused staff. “Everybody is more on the same
22
page.” In other words, these schools are clearly beginning the process of developing a
shared vision for change.
Yet, there were several examples where schools were unlikely to develop high
capacity learning community schools because “the principal lacks trust in the staff,” “the
principal wants to control the decision-making,” and “staff bullying others into
decisions.” One principal exemplified a lack of trust in her school staff and the school’s
students when she stated, “I can’t get away today because there’s going to be some sort
of chaos, some blowup, and the only time they behave is when I’m there.” Here the
principal is also struggling with moving from a conception of “principal as individual
instructional leader” to “instructional leadership as a capacity for curriculum
improvement”.
Another principal could not release authority over her staff. Instead, she dictated
what the teachers would do and remained closed to the idea that others had something to
contribute to the discussion. She recalled a PLC meeting where several teachers had
opposing views. She recalled teachers “not really being upset when they left the meeting
because they didn’t agree with me, and my decision is right”.
For another principal, the staff had dysfunction in collaborative work that seemed
to be accepted and/or overlooked. “Each grade level has only three teachers per grade
level. It’s not a big battle because two will tell the other one this is what we’re doing .”
To her, this practice seemed normal and created efficiency while, in actuality, the
situation is the antithesis of collaborative practices (Leithwood, et al., 2010).
While many of the schools are engaged in various levels of implementing PLCs at
their school sites, a few of the schools have attempted to involve the external community

23
into their practices. Some have had little success engaging the community while some
have made strides improve their relationships with outside stakeholders although
sometimes at the expense of other priorities without more purposeful connection to the
classroom.
Barriers to Change
Participants identified several barriers to building capacity that must be overcome
in order to move their schools out of school improvement. These barriers include the
need to change past perceptions and practices regarding teachers and the community,
addressing socio-cultural, political, and historical contexts, district office practices,
overdependency on formal authority, lack of trust, and staff turnover.
Changing past perceptions and practices. For one elementary turnaround principal,
changing past perceptions about successful teaching provides him with his largest hurdle
and is based on a prior evaluation system that discounted achievement data as a
component of teacher evaluation. In other words, the principal previously used only
anecdotal evidence to evaluate instruction, which always informed teachers they were
doing a great job until the changed emphasis on integrating data. According to the
principal, “They [teachers] were told they were doing well, but they were never using
data and results to see where they really were.” As a result, he began restructuring the
evaluation of teachers to emphasize “success” as defined in NCLB and Race to the Top.
Similarly, an elementary principal noted that teaching practices were not aligned with
effective instruction. This was the barrier that she wished to address. “The students’
knowledge is vastly superior and what we need to do is bring our teachers up to teaching
at that level…Some are getting there based on their pure talents, not because we are

24
helping them get there.” And while these principals’ narratives clearly fall short of
Leithwood et al.’s third stage of sustained turnaround, these schools are under
tremendous pressure to get out of “school improvement status” and attain high
performance labels.
Some participants identified the need to transform past beliefs about “successful”
teaching practices, but others identified the deficit thinking of staff and the community as
their largest barrier. For example, one principal stated “The preconceived notion has been
talking about ‘those’ students, ‘those’ (i.e. Latino/a, Native American) kids; from the
community, from the children, and unfortunately from some educators on staff as well.”
An elementary teacher highlighted this type of deficit-thinking when confronting a peer
about the belief that educating all students was an impossible task. When recounting the
story, she recalled her statement to her peer: “All right, out of your class of 22, do you
believe that every single one of your students can learn? All right. Your job is to teach
them.” An elementary principal recalled a similar experience where she took a directive
approach with a teacher. She noted that she told the teacher that she was responsible for
teaching all students, “I mean, this is what you are going to do or you may not have a
job.” She further commented that she had adapted her practice to confront these types of
beliefs in a harsh manner because “you can’t deal with hugs or even carrots with people
who are unwilling to change.” Here the principal asserts her authority as an instructional
leader who can and will set high expectations. Yet in certain ways, this principal’s
narrative also reflects neoconservative and culturally neutral discourses.
25
While some principals and teachers identified confronting deficit thinking as a
major challenge, some principals explicitly identified their own deficit thinking as a
barrier for change. The following quote exemplifies this deficit thinking:
It’s very important for us to try and help those students coming from those homes
so that they have a better chance at the future. I live where the educated people
live. And I said that if you get a good education, you can live down there too.
[Principal in high Native population school]
In a sense, unknowingly, this principal has created a vision of her school and community
that devalues the funds of knowledge (Moll, Amanti, Neff, & Gonzalez) and lived-
experiences of the very students that she wishes to educate. Her comment overlooks
important historical and social conditions that create real barriers outlined by another
principal in a similar context. For a high school principal, it was the historical context
that provided the largest barrier for student success.
I think that the challenge that we have is the history of education on the
reservation with the BIA schools and the parochial schools that were established
on the reservation. As a result, there is a kind of resistance, or maybe an
undercurrent of resistance to education.
An assistant principal similarly noted that the disconnect between the school and
community culture creates the biggest barrier. “I think that our biggest challenge is
dealing with a culture that is kind of removed…because their life on the reservation is
quite different from the dominant culture.”
Inconsistent district support and directives. Although some participants clearly
recognized internal school barriers to capacity building, another recurrent theme centered

26
on the role that the district office plays in allowing change to occur. For some principals,
it was the lack of district support for new knowledge implementation that created a
barrier:
We don’t get to continue those collaborative discussions that then get our
superintendent, or our assistant superintendent, or our staff development person
involved. Which really, in order to implement those things that we discussed here
[institutes], we really need those people on board as well.
Others identified a lack of follow-through by district office personnel as a barrier to
building capacity across the district. This was exemplified by two participant’s responses.
The first stated, “We have only two schools participating and we were supposed to have
four. It’s just the inconsistencies that we have as a district.” Participation was not a clear
priority of the district. Participants observed that districts were too disorganized, lacking
in effective communication, or overwhelmed with too many competing demands to
encourage participation and give adequate support. The second commented, “We started
with the superintendent and other principals and now we are the only ones left. We feel
like they are missing the boat.” Lack of central office attention and follow-through made
it difficult to carry on the dialogue at the district level about the value of the intervention
participants received for free. Many did not believe their interest and enthusiasm for
curriculum change was equally shared in the district.
Still others identified the overwhelming amount of mandates as a barrier to
change. The pressure of implementing a plethora of initiatives has led to a lack of follow-
through. Statements such as “We had a lot of directives that threw teachers off this year”
or “We have so many district initiatives that we can’t focus on one thing” characterize

27
participant perspectives that so many directives inhibit capacity to implement change
with fidelity as there are so many competing priorities to address. Many participants
acknowledged, however, that these criticisms were not universally shared by district
officials. For example, one principal lamented, “We do so much professional
development that we don’t stick to any one item, and I know that the superintendent
would disagree with that.” Participants highlight the inability of participating schools to
build capacity around specific initiatives. Here district leadership transience and
inconsistent support prevented some schools from moving beyond low capacity and early
turnaround stage work.
Over-dependency on formal authority, lack of trust, and teacher retention. While
participants identified the district office as a barrier, several teachers noted that it was the
school administrator (principal) who was the largest barrier to change reinforcing an
overt over-dependency on those with formal authority:
If you don’t have the administrative power to make the change, it’s just the ideas
are there, but your superintendent and your principal are essentially the only two
who are going to make that change. I don’t think that I’ve seen any change that
has been positive yet. [Teacher]
Teachers similarly reported a lack of trust in staff decision making as a barrier to
capacity building, which becomes more problematic when formal authority is not driven
by clear district priorities in these areas. Furthermore, staff turnover and difficulty
attracting teachers were noted as barriers to many schools. One principal noted an 85%
turnover in staff has led to numerous conflicting professional development activities. She
stated that the turnover “means our professional development plan, which is a piece of

28
this; we are having to go back and professionally develop our folks.” Participants
similarly complained about frequently having to start over in preparing new teachers to
build up the same capacities for change that were lost with the departure of previous staff.
Constant repetition of this process complicates uniform professional growth. Others in
more rural areas emphasized that their school’s location and isolation prevents attracting
and retaining quality staff. “It’s hard to attract teachers because we are in an isolated area
and it’s kind of a cultural shock…some adjust and some don’t.” Many school
leaders/participants were in rural areas, and geography became a major barrier to
professional networking and capacity building. At the same time, this quote reveals some
deficit thinking about the socio-cultural context of Arizona schools generally and rural
schools in particular. It is seen to prevent attracting and retaining quality staff. “It’s hard
to attract teachers because we are in an isolated area and it’s kind of a cultural
shock…some adjust and some don’t.” Many school leaders/participants were in rural
areas, and geography became a major barrier to professional networking. At the same
time, this quote reveals some deficit thinking about the socio-cultural dimension of their
work. Qualitative findings, thus, provide more in-depth description of participant
understanding of turnaround leadership aimed at curriculum change as well as in areas
needing development identified by quantitative findings.
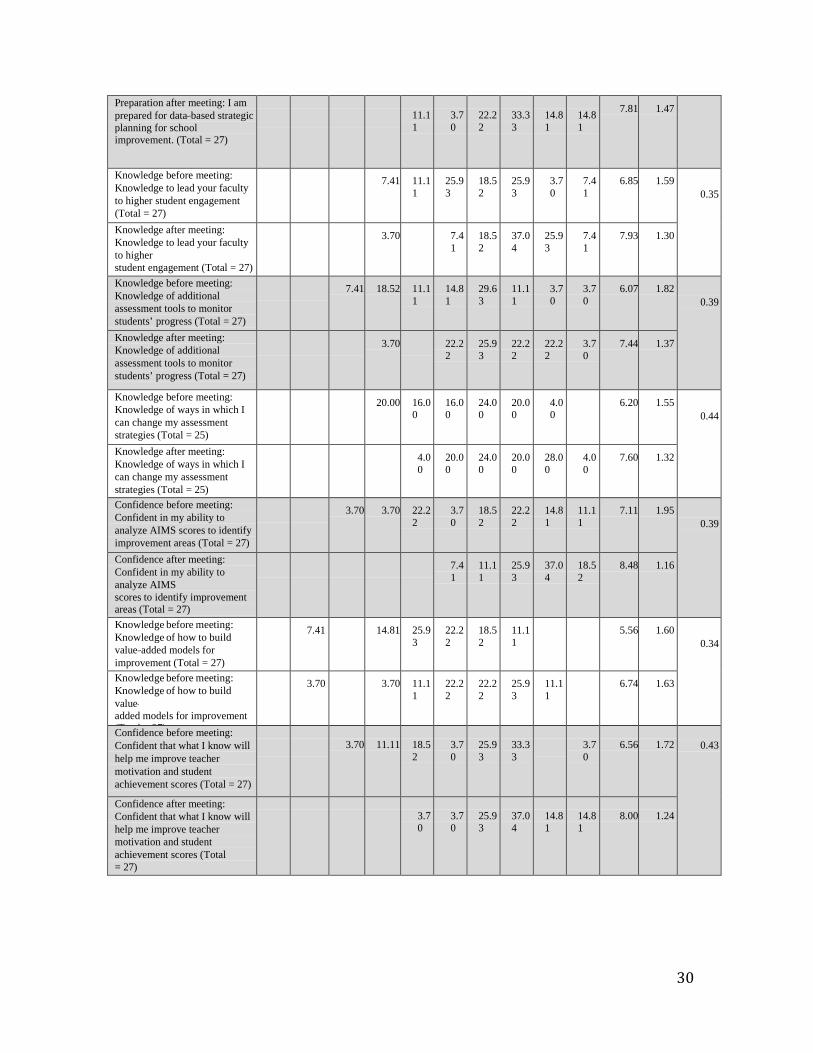
External Evaluation Results
External evaluators (Cloud Team) were contracted to examine the fidelity of the
project implementation and the effect of the training. Figure 2 (Shaw et al., 2012)
illustrates that as a result of the TLDP training, participants increased their knowledge

29
and leadership skills to improve the instructional program through data measurement and
assessment literacy (0.54 Effect Size).
Figure 2: Knowledge of measurement and data analysis
Principal and teacher leader participants increased their knowledge of turnaround
leadership for organizational redesign, people development, and collaborative direction
setting processes as a result of the training (a medium-sized effect, 0.31 Effect Size).
Effect sizes were computed and classified using the Cohen-convention for classifying
effect sizes as small (small ≥.10; medium ≥ .30; large ≥ .50).
Table _ reports effect sizes for all areas examined by the evaluators.
Table 11: Descriptive statistics of pre/post data
Percentages of Recorded Ratings Mean Std Dev Effect
Size 1 2 3 4 5 6 7 8 9 10
Knowledge before meeting: knowledge of measurement and data analysis to assess teacher improvement and student achievement (Total = 27)
7.41
29.63
11.11
22.22
22.22
3.70
3.70
6.48
1.58
0.54
Knowledge after meeting: knowledge of measurement and data analysis to assess teacher improvement and student achievement (Total = 27)
3.70
18.52
44.44
25.93
7.41
8.15
0.95
Preparation before meeting: I am prepared for data--‐based strategic planning for school improvement. (Total = 27)
7.41 11.11 14.81
7.41
33.33
22.22 3.7
0 6.33 1.75
0.42
7.4
29.6
11.1
22.2 22.2
3.7 3.7 3.7
18.5
44.4
25.9
7.4
1 2 3 4 5 6 7 8 9 10
Knowledge before Institute
Knowledge after InstituteSelf-reported ratings (1-10, 10 high) of knowledge
30
Preparation after meeting: I am prepared for data--‐based strategic planning for school improvement. (Total = 27)
11.11
3.70
22.22
33.33
14.81
14.81
7.81 1.47
Knowledge before meeting: Knowledge to lead your faculty to higher student engagement (Total = 27)
7.41 11.11
25.93
18.52
25.93
3.70
7.41
6.85 1.59 0.35
Knowledge after meeting: Knowledge to lead your faculty to higher student engagement (Total = 27)
3.70 7.41
18.52
37.04
25.93
7.41
7.93 1.30
Knowledge before meeting: Knowledge of additional assessment tools to monitor students’ progress (Total = 27)
7.41 18.52 11.11
14.81
29.63
11.11
3.70
3.70
6.07 1.82 0.39
Knowledge after meeting: Knowledge of additional assessment tools to monitor students’ progress (Total = 27)
3.70 22.22
25.93
22.22
22.22
3.70
7.44 1.37
Knowledge before meeting: Knowledge of ways in which I can change my assessment strategies (Total = 25)
20.00 16.00
16.00
24.00
20.00
4.00 6.20 1.55
0.44
Knowledge after meeting: Knowledge of ways in which I can change my assessment strategies (Total = 25)
4.00
20.00
24.00
20.00
28.00
4.00
7.60 1.32
Confidence before meeting: Confident in my ability to analyze AIMS scores to identify improvement areas (Total = 27)
3.70 3.70 22.22
3.70
18.52
22.22
14.81
11.11
7.11 1.95 0.39
Confidence after meeting: Confident in my ability to analyze AIMS scores to identify improvement areas (Total = 27)
7.41
11.11
25.93
37.04
18.52
8.48 1.16
Knowledge before meeting: Knowledge of how to build value--‐added models for improvement (Total = 27)
7.41 14.81 25.93
22.22
18.52
11.11 5.56 1.60
0.34
Knowledge before meeting: Knowledge of how to build value- added models for improvement (T t l 27)
3.70 3.70 11.11
22.22
22.22
25.93
11.11 6.74 1.63
Confidence before meeting: Confident that what I know will help me improve teacher motivation and student achievement scores (Total = 27)
3.70
11.11
18.52
3.70
25.93
33.33
3.70
6.56
1.72
0.43
Confidence after meeting: Confident that what I know will help me improve teacher motivation and student achievement scores (Total = 27)
3.70
3.70
25.93
37.04
14.81
14.81
8.00
1.24

31
Conclusions and Implications
This study yielded four primary findings: 1) schools were not at high-levels of
turnaround leadership capacity; 2) those schools in the process of building capacity
demonstrated a directive leadership approach; 3) school turnaround efforts focused on
developing professional learning communities; and 4) schools face numerous barriers to
change, including the local context and level of district support. Quantitative and
qualitative findings indicated very little evidence of high capacity building. Quantitative
findings indicated an increased focus on setting direction and visioning, however, teacher
surveys and interviews do not support the notion of shared vision. Similarly, principal
surveys and interviews revealed a higher level of collaborative work culture and
collective learning than staff responses suggest. Furthermore, varied levels of trust
hindered the ability of some schools to push capacity building forward in their schools.
Like previous research on leadership in challenging contexts (e.g., effective
schools literature in the U.S., Alma Harris’ research in the U.K., ISSPP, Jacobson,
Johnson, Ylimaki, & Giles, 2005) the principals used a directive leadership approach in
building capacity for turnaround. For instance, some school leaders placed numerous
teachers on plans for improvement and exited several others. Additionally, participants
indicated a need to focus on literacy in order to direct all efforts toward increasing rigor
for the Common Core. Principals also reported not being able to let go of authority,
which is not unusual for the early stages of turnaround (Leithwood et al., 2010). While a
directive leadership approach has been effective for school turnaround processes, this
approach reinforced a lack of trust among staff.
32
Participants relied on the use of professional learning communities in order to
redesign their organizations. Interview data indicated that schools were at varying levels
of implementation of PLCs. At the same time, principals and teachers reported that the
PLC model had made a positive impact on their schools. Because some principals
experienced difficulty in relinquishing authority to staff members, the establishment of
PLCs floundered; interviews suggested that lack of trust and authenticity contributed to
the lag in development.
Participants identified numerous barriers to change that must be overcome in
order for turnaround to occur. These barriers included 1) changing past perceptions and
practices, 2) inconsistent district support and directives, and 3) an over-dependency on
formal authority. For example, teachers were not accustomed to using data for decision-
making. Further, many participants identified the need to transform past beliefs about
“successful” school practices. Curriculum maps, mandated benchmark assessments, and
surface use of data in professional learning communities took precedence over priorities
for democratic collaborative processes and authentic community engagement.
This study is limited by the number of teacher participants per school. Participants
were selected as leadership teams by the principal or the superintendent. Nonetheless, the
survey return rate and high reliability suggests evidence of generalizability. In addition,
the external evaluators’ survey results indicate a medium to high effect size of the
training on participants’ turnaround leadership knowledge and skills. Furthermore, the
Arizona context is important because demographics foreshadow national trends. Also,
schools across the U.S. face accountability demands in culturally diverse communities.

33
Therefore, our focus on Tier III schools to make improvement gains is relevant for
research and practices.
These findings suggest several implications for the next steps. First, the
turnaround process is complex and context specific. Second, district support is essential
in order for school leaders to focus on the turnaround process. Third, with the advent of
the Common Core Standards, future turnaround leadership development models need to
include a specific literacy focus.
Future research will validate the turnaround leadership development model with a
focus on literacy for Tier III schools that links turnaround leadership, literacy curriculum
knowledge, and student achievement. Thus, the next generation of educational leaders
must have the knowledge, skills, dispositions, and analytical tools to lead schools in the
accountability culture.
34
References
Arizona Department of Education (2011), School Improvement Grants. Retrieved on April 30, 2012 from http://www.azed.gov.
Arizona Revised Statute § 15-203(A) (38).
Brinson, D., Kowal, J. & Hassel, B.C. (2008). School turnarounds: Actions and results. Public Impact Center for the Center on Innovation and Improvement, Academic Development Institute.
Cohen, D.K., Hill, H.C. & Kennedy, M. (2002). The benefit to professional development.
American Educator, 26(2), 22-25. Garet, A., Porter, A., Desimone, L., Birman, B., & Yoon, K. (2001). What makes
professional development effective? Results from a national sample of teachers. American Educational Research Journal, 38(4), 915-945.
Jacobson, S., Johnson, L., Ylimaki, R. & Giles, C. (2005). Successful school leadership
in changing times: Cross-national findings in the third year of an international research project. Journal of Educational Administration, 43(6), 607-618.
Leithwood, K., Harris, A., & Straus, T. (2010). Leading school turnaround: How
successful leaders transform low-performing schools. San Francisco, CA: Jossey-Bass.
Leithwood, K., Louis, K.S., Wahlstrom, K. & Anderson, S. (2010). Learning from
leadership: Investigating the links to improved student learning. New York: The Wallace Foundation.
Leithwood, K., & Mascall, B. (2008). Collective leadership effects on student
achievement. Educational Administration Quarterly, 44, 529-561 Merriam, S.B. (1988). Case study research in education: A qualitative approach. San
Francisco, CA: Jossey-Bass. Merriam, S.B. (2001). Case studies as qualitative research. In C.F. Conrad, J.G. Haworth,
& L.R. Lattuca (Eds.), Qualitative Research in Higher Education, pp. 191-200. Boston, MA: Pearson Custom Publishing.
Mitchell, C. & Sackney, L. (2009). Sustainable improvement: Building learning
communities that endure. Rotterdam, Netherlands: Sense Publishers. Moll, L., Amanti, C., Neff, D., & Gonzalez, N. (1992). Funds of knowledge for teaching:
Using a qualitative approach to connect homes and classrooms. Theory into Practice, 31(2), 132-141.

35
No Child Left Behind (NCLB) Act of 2001, Pub. L. No. 107-110, § 115, Stat. 1425
(2002). U.S. Department of Education. (2009). Race to the Top executive summary. Retrieved from http://www2.ed.gov/programs/racetothetop/executive-summary.pdf.
Robinson, V.M.J., Lloyd, C.A. & Rowe, K.J. (2008). The impact of leadership on student
outcomes: An analysis of the differential effects of leadership types. Educational Administration Quarterly, 44(5), 635-674.
Shaw, R., Hawk, S., Powers, S., Rillero, P., Zambo, R., Lore, C., & Mowafy, L. (2012).
Statewide, sustainable professional development in principal instructional leadership for Arizona tier III schools in high-poverty LEAs: Principal leadership workshop: External formative evaluation report. Cloud Evaluation Team, April 26, 2012.
Wenglinsky, H. (2000). How teaching matters: Bringing the classroom back into
discussions of teacher quality. Princeton, NJ: Educational Testing Service. Ylimaki, R., Bennett, J., Fan, J., and Villaseñor, E. (2012), “Notions of
‘success’ in Southern Arizona schools: Principal leadership in changing demographic and border contexts”, Leadership & Policy in Schools 11(2), 168-193.
Ylimaki, R. M. & Jacobson, S.L., Editors (2011). US and cross-national policies, practices and preparation: Implications for successful instructional leadership, organizational learning, and culturally responsive practices. Netherlands: Springer-Kluwer.