twap – transboundary waters assessment programme · twap – transboundary waters assessment...
TRANSCRIPT
TWAP – Transboundary WatersAssessment Programme
RIVER BASINS COMPONENT
Working Group
•UNEP-DHI Centre• Peter Koefoed Bjørnsen• Paul Glennie• Henrik Larsen
•IUCN
• James Dalton• Stefano Barchiesi
•SIWI
• Andreas Lindström• Rebecca Löfgren
Development ofAssessmentMethodology
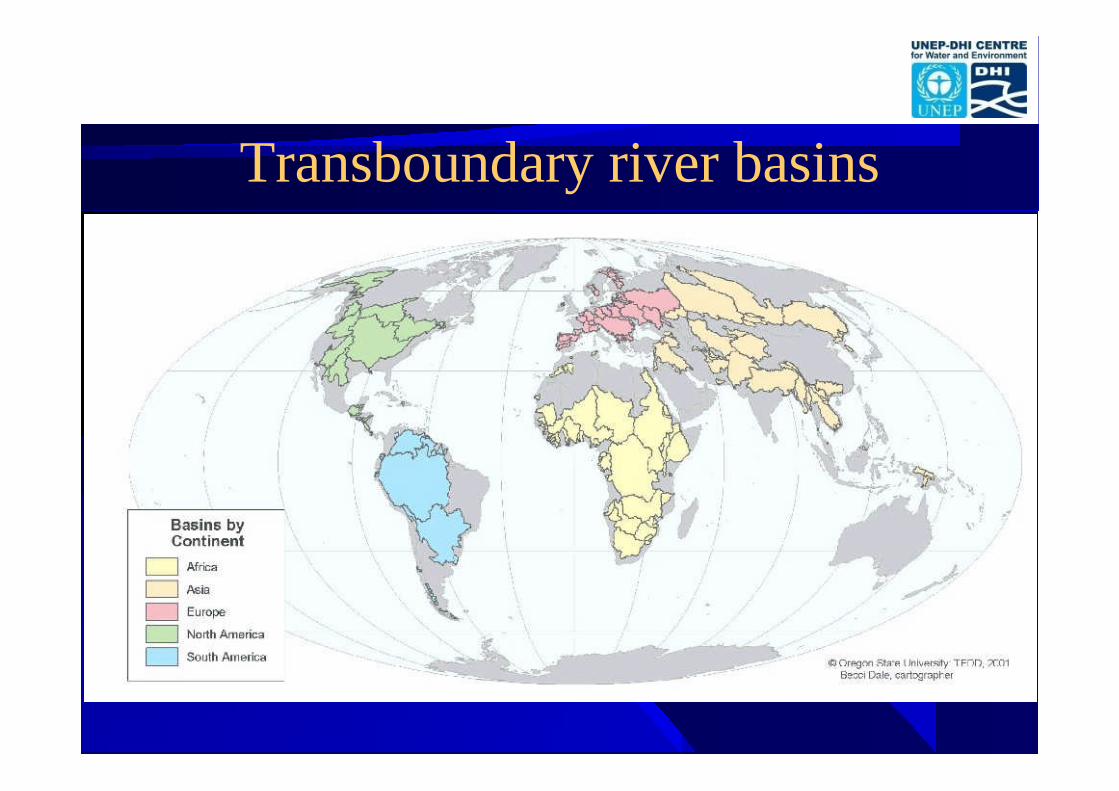
Transboundary river basins
3
PGL18

Slide 3
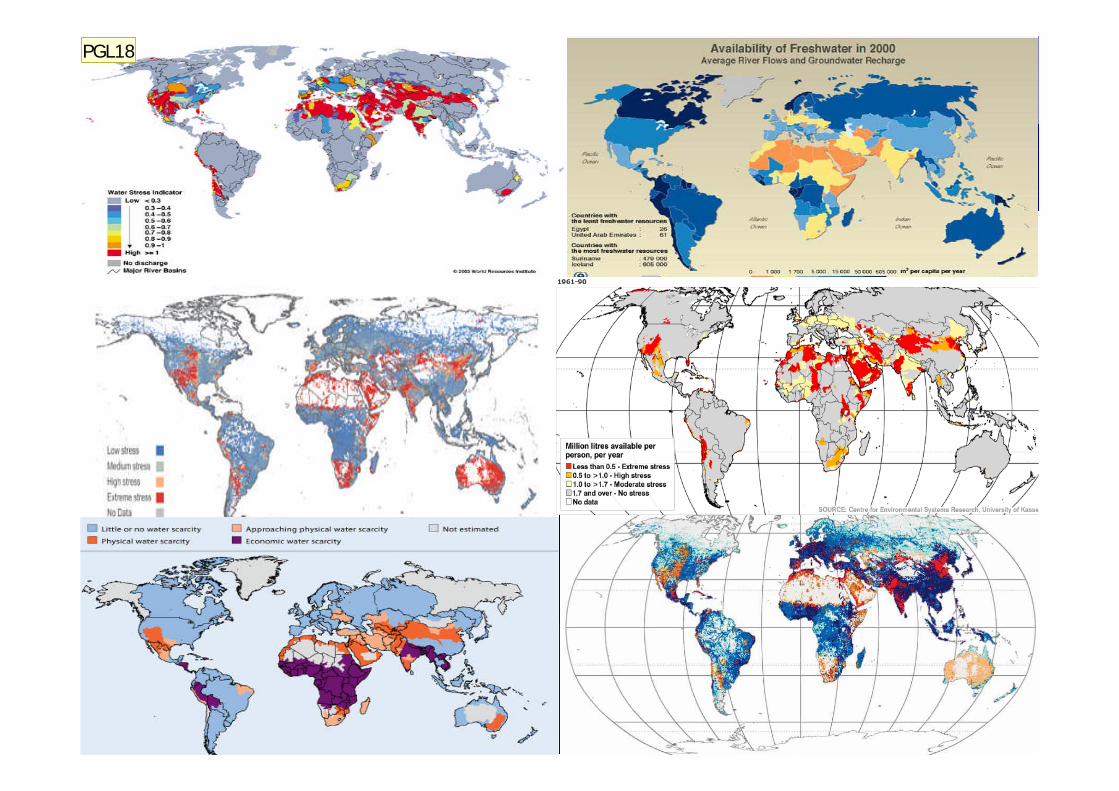
PGL18 The details of this slide are not important, but these are 6 different water scarcity maps produced by 6 different reputable institutions, allshowing different pictures.There is no 'best' picture, but this illustrates the difficulty when trying to prioritize basins.The TWAP will bring many of the key partners together to try to reduce some of the confusion and develop some more definitive maps.Paul Glennie; 18/08/2011
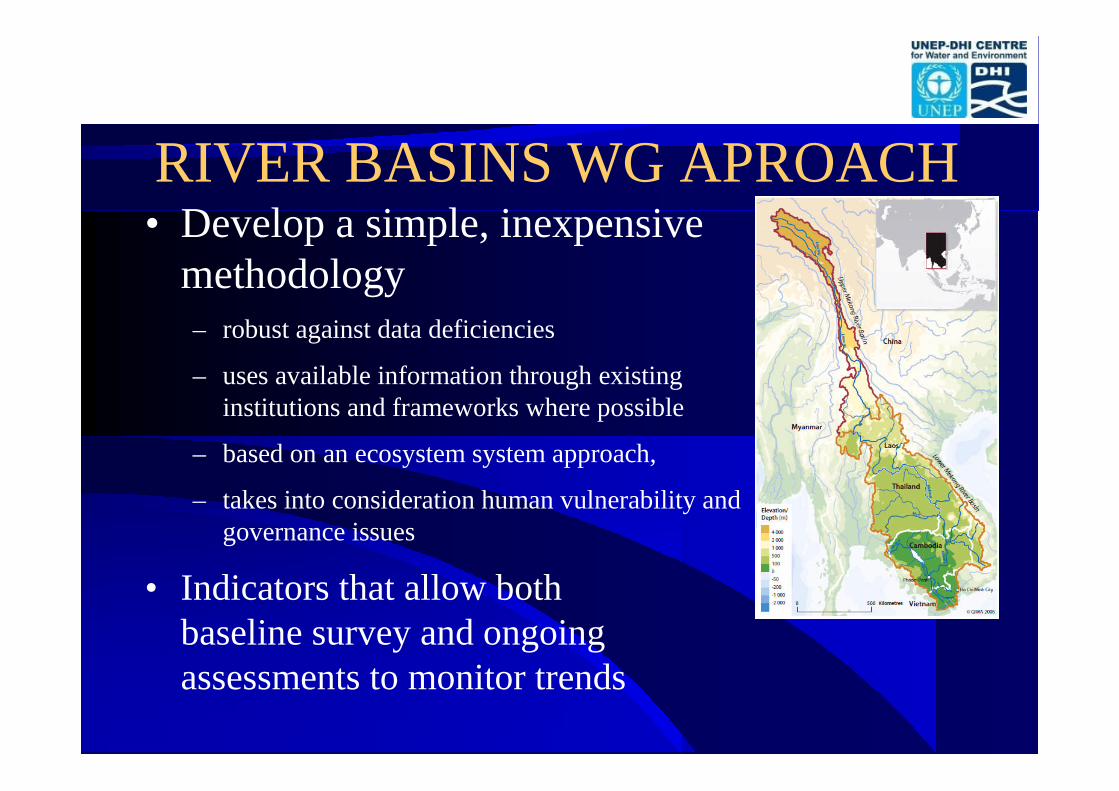
• Develop a simple, inexpensivemethodology– robust against data deficiencies
– uses available information through existinginstitutions and frameworks where possible
– based on an ecosystem system approach,
– takes into consideration human vulnerability andgovernance issues
• Indicators that allow bothbaseline survey and ongoingassessments to monitor trends
RIVER BASINS WG APROACH
55
General Approach of RIVERS WG
• Using a modified Driving force, Pressure, State, Impact,Response (DPSIR) framework and its further developmentin the Millennium Ecosystem Assessment
• An issue based approach – based on identification of currentglobal issues in transboundary basins
• Indicators describing these issues have been identified,based on the availability of data sets with global coverage,available mostly in the public domain at present
• Scalable approach: Aggregation from national or regional tobasin level
6
• Need to assess all 260+ transboundary basinsDevelopsimple, inexpensive indicators which are robust againstdata deficiencies
• Some indicators are composite indicators composed ofseveral basic indicators, combined into one single value
• Use of modelling where possible
• Short-listing criteria:
- availability (i.e. cost efficiency in acquisition)- acceptability (i.e. ownership to information among stakeholders)- applicability (i.e. relevance to transboundary issues)- aggregation at river basin level and comparability between basins
Key points on indicators
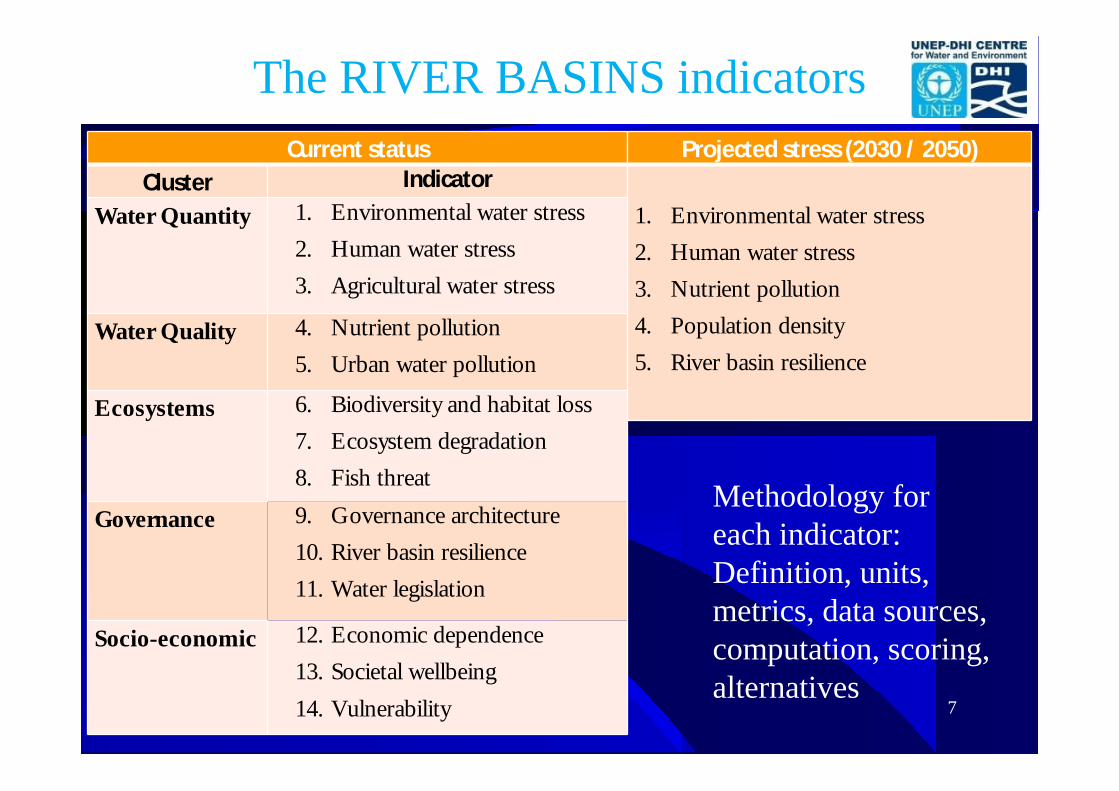
Current status
Cluster Indicator
Water Quantity 1. Environmental water stress
2. Human water stress
3. Agricultural water stress
Water Quality 4. Nutrient pollution
5. Urban water pollution
Ecosystems 6. Biodiversity and habitat loss
7. Ecosystem degradation
8. Fish threat
Governance 9. Governance architecture
10. River basin resilience
11. Water legislation
Socio-economic 12. Economic dependence
13. Societal wellbeing
14. Vulnerability 7
The RIVER BASINS indicators
Projected stress (2030 / 2050)
1. Environmental water stress
2. Human water stress
3. Nutrient pollution
4. Population density
5. River basin resilience
Methodology foreach indicator:Definition, units,metrics, data sources,computation, scoring,alternatives
8
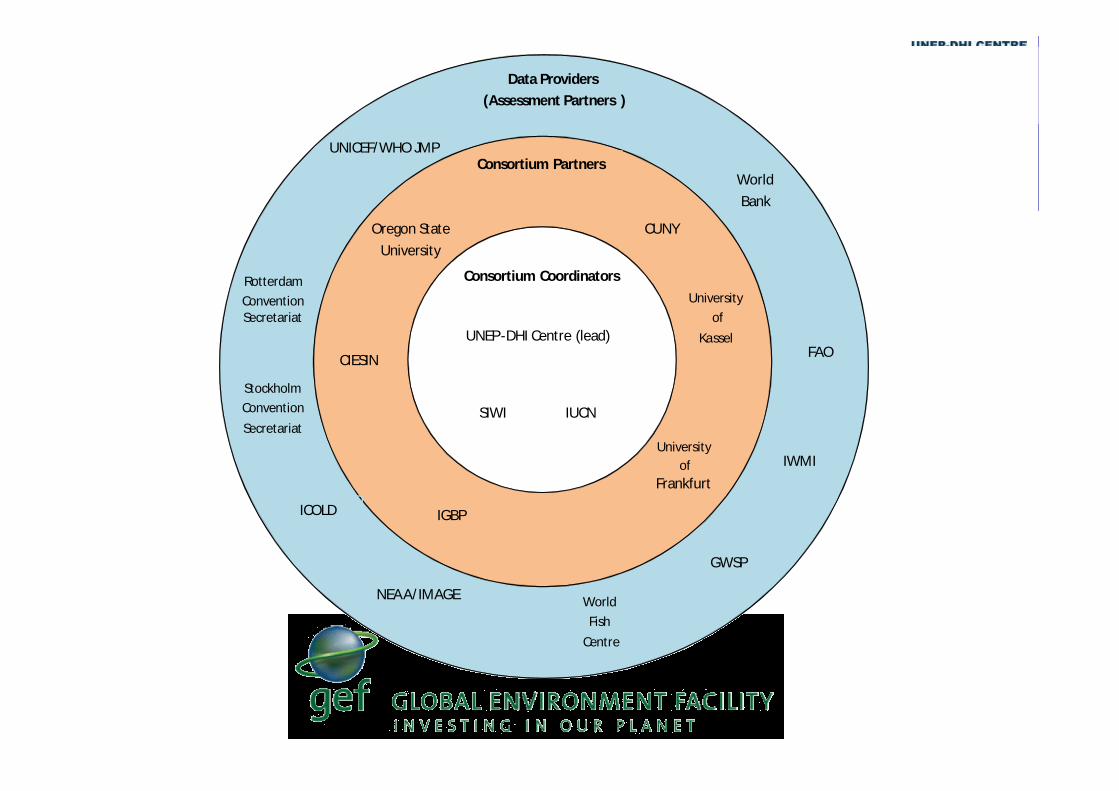
Consortium Coordinators
Consortium Partners
Data Providers
(Assessment Partners )
UNEP-DHI Centre (lead)
SIWI IUCN
CUNY
University
of
Kassel
IWMI
Oregon State
University
IGBP
CIESIN
University
of
Frankfurt
NEAA/IMAGE
FAO
UNICEF/WHO JMP
Rotterdam
ConventionSecretariat
World
Bank
GWSP
ICOLD
World
Fish
Centre
Stockholm
Convention
Secretariat