two essays on nonprofit finance heng qu
TRANSCRIPT
TWO ESSAYS ON NONPROFIT FINANCE
Heng Qu
Submitted to the faculty of the University Graduate School in partial fulfillment of the requirements
for the degree Doctor of Philosophy
in the Lilly Family School of Philanthropy, Indiana University
July 2016

ii
Accepted by the Graduate Faculty, Indiana University, in partial fulfillment of the requirements for the degree of Doctor of Philosophy.
Doctoral Committee May 6, 2016
Richard Steinberg, PhD, Chair
Sara Konrath, PhD
Mark Ottoni-Wilhelm, PhD
Jisong Wu, PhD
Janet Greenlee, PhD
iii
Acknowledgements
Foremost, I would like to thank Dr. Richard Steinberg—for the great impact he
has made on me during my doctoral journey. I am grateful to him for meeting me where I
was five years ago and for leading me out of the dark. He is a role model to me in many
aspects. As a professor, he is patient and generous with his time for students. As an
advisor, he is challenging yet encouraging and understanding. As a scholar, his rigorous
scholarship and depth of knowledge have inspired me to strive for high-quality research
and never cease to learn. My deepest gratitude to Dr. Steinberg, who has nurtured my
intellectual development and enabled me to start an academic career.
I am also grateful to Dr. Sara Konrath, who has been a very supportive mentor to
me in the past two years. I appreciate her helpful advice on my research, as well as on the
other aspects of an academic life. I appreciate the days we wrote together in coffee shops
when she inspired me to become a productive scholar. I also appreciate her support and
encouragement during my job search. Dr. Konrath’s academic intelligence, scholarly
productivity, as well as care for students, have influenced my approaches to research and
mentoring.
I would also like to thank my other dissertation committee members— Dr. Janet
Greenlee and Dr. Mark Wilhelm—for giving me constructive suggestions to my
dissertation. Thank the Science of Philanthropy Initiative and its funder, the John
Templeton Foundation, for funding and helpful suggestions to my second dissertation
essay.
Last but not the least, I cannot be more thankful to my parents, who have never
doubted the power of education and have supported me to become who I want to be.

iv
Heng Qu
TWO ESSAYS ON NONPROFIT FINANCE This dissertation consists of two essays on nonprofit finance. Nonprofit finance
concerns obtaining and managing financial resources to support the social purposes of
nonprofit organizations. A unique feature of nonprofit finance is that nonprofits derive
revenue from a variety of sources. Nonprofit finance thus involves answering two
fundamental questions: What is the optimal combination of revenue sources that supports
a nonprofit to achieve its mission? Where and how to obtain the revenue sources? The
two dissertation essays address these two questions respectively.
The first essay, titled “Modern Portfolio Theory and the Optimization of
Nonprofit Revenue Mix,” is among the first to properly apply modern portfolio theory
(MPT) from corporate finance to nonprofit finance. By analyzing nonprofit tax return
data, I estimate the expected return and risk characteristics for five nonprofit revenue
sources as well as the correlations among these returns. I use the estimates to identify the
efficient frontiers for nonprofits in different industries, based on which nonprofit
managers can select an optimal portfolio that can minimize the risk given a preferred
level of service provision or maximize the return given a level of risk. The findings also
pose a challenge to the predominant approach used in previous nonprofit finance studies
(Herfindahl-Hirschman Index) and suggest that MPT is theoretically and practically more
helpful in guiding nonprofit revenue management.
The second essay, titled “Charitable Giving in Nonprofit Service Associations:
Identities, Incentives, and Gender Differences,” concerns nonprofit resource attainment,
specifically, how do decisionmaking contexts and framing affect donations. Membership
v
in a service club is characterized by two essential elements: members’ shared interest in
the club’s charitable mission; and private benefits that often come as a result of social
interactions with other members, such as networking, fellowship, and fun. A laboratory
experiment was designed to examine 1) whether membership in a service club makes a
person more generous and 2) the effect of service club membership—stressing either the
service or socializing aspects—on individual support for collective goods. The study
finds that female individuals are the least generous when they are reminded of the
socializing aspect of service-club membership.
Richard Steinberg, PhD, Chair

vi
Table of Contents List of Tables .................................................................................................................... vii
List of Figures .................................................................................................................... ix Introduction: On Nonprofit Finance ................................................................................... 1
References ............................................................................................................. 28 Essay I Modern Portfolio Theory and the Optimization of Nonprofit Revenue Mix ....... 32
References ........................................................................................................... 113 Essay II Charitable Giving in Nonprofit Service Associations: Identities, Incentives, and Gender Differences .................................................................................................. 118
Appendices .......................................................................................................... 149
References ........................................................................................................... 168 Curriculum Vitae
vii
List of Tables Table I-1. Data Cleaning ................................................................................................... 86 Table I-2. Summary Statistics: Original Sample vs. Cleaned Sample .............................. 87 Table I-3. Cleaning Organizational Annual Returns on Revenue Sources in
Subsectors and Whole Sample .................................................................................. 88 Table I-4. Summary Statistics by Subsector and Whole Sample, 1998-2003 .................. 90 Table I-5. Summary Statistics of Organizational Annual Returns on Revenue
Sources, Arts, Culture, and Humanities, 1998-2003 ................................................ 91 Table I-6. Subsector Annual Returns on Revenue Sources, Arts, Culture, and
Humanities, 1998-2003 ............................................................................................. 91 Table I-7. Correlation Coefficients of Returns on Revenue Sources, Arts, Culture,
and Humanities ......................................................................................................... 91 Table I-8. Efficient Portfolios, Arts, Culture, and Humanities: Expected Return,
Risk, Weights, and HHI ............................................................................................ 92 Table I-9. Summary Statistics of Organizational Annual Returns on Revenue
Sources, Education, 1998-2003 ................................................................................ 93 Table I-10. Subsector Annual Returns on Revenue Sources, Education, 1998-2003 ....... 93 Table I-11. Correlation Coefficients of Returns on Revenue Sources, Education ........... 93 Table I-12. Efficient Portfolios, Education: Expected Return, Risk, Weights, and HHI . 94 Table I-13. Summary Statistics of Organizational Annual Returns on Revenue
Sources, Health, 1998-2003 ...................................................................................... 95 Table I-14. Subsector Annual Returns on Revenue Sources, Health, 1998-2003 ............ 95 Table I-15. Correlation Coefficients of Returns on Revenue Sources, Health ................. 95 Table I-16. Efficient Portfolios, Health: Expected Return, Risk, Weights, and HHI ....... 96 Table I-17. Summary Statistics of Organizational Annual Returns on Revenue
Sources, Human Services, 1998-2003 ...................................................................... 97 Table I-18. Subsector Annual Returns on Revenue Sources, Human Services,
1998-2003 ................................................................................................................. 97 Table I-19. Correlation Coefficients of Returns on Revenue Sources, Human Services . 97 Table I-20. Efficient Portfolios, Human Services: Expected Return, Risk, Weights,
and HHI ..................................................................................................................... 98 Table I-21. Summary Statistics of Organizational Annual Returns on Revenue
Sources, Whole Sample, 1998-2003 ......................................................................... 99 Table I-22. Subsector Annual Returns on Revenue Sources, Whole Sample, 1998-2003 99 Table I-23. Correlation Coefficients of Returns on Revenue Sources, Whole Sample .... 99 Table I-24. Efficient Portfolios, Whole Sample: Expected Return, Risk, Weights,
and HHI ................................................................................................................... 100 Table I-25. Robustness check: Summary Statistics of Organizational Annual Returns
on Revenue Sources, Whole Sample, 1998-2003 ................................................... 101 Table I-26. Robustness check: Subsector Annual Returns on Revenue Sources,
Whole Sample, 1998-2003 ...................................................................................... 101 Table I-27. Robustness check: Correlation Coefficients of Returns on Revenue
Sources, Whole Sample .......................................................................................... 101 Table II-1. Experimental Design ..................................................................................... 144 Table II-2. Summary Statistics ....................................................................................... 145

viii
Table II-3. Treatment Effects .......................................................................................... 146 Table II-4. Tobit Regressions on Donations, Full Sample .............................................. 147 Table II-5. Tobit Regressions on Donations, Female vs. Male ...................................... 148

ix
List of Figures
Figure I-1. The Efficient Frontier of Risky Assets ......................................................... 102 Figure I-2. Efficient Frontier and HHI, Arts, Culture, and Humanities .......................... 103 Figure I-3. HHI vs. MPT Risk of Efficient Portfolios, Arts, Culture, and Humanities .. 104 Figure I-4. Efficient Frontier and HHI, Education ......................................................... 105 Figure I-5. HHI vs. MPT Risk of Efficient Portfolios, Education .................................. 106 Figure I-6. Efficient Frontier and HHI, Health ............................................................... 107 Figure I-7. HHI vs. MPT Risk of Efficient Portfolios, Health ....................................... 108 Figure I-8. Efficient Frontier and HHI, Human Services ............................................... 109 Figure I-9. HHI vs. MPT Risk of Efficient Portfolios, Human Services ........................ 110 Figure I-10. Efficient Frontier and HHI, Whole Sample ................................................ 111 Figure I-11. HHI vs. MPT Risk of Efficient Portfolios, Whole Sample ........................ 112

1
Introduction: On Nonprofit Finance
Heng Qu
Finance, according to the Merriam-Webster Dictionary, is defined as:
1) money or other liquid resources of a government, business, group, or individual; 2) the system that includes the circulation of money, the granting of credit, the making of investments, and the provision of banking facilities; 3) the science or study of the management of funds; 4) the obtaining of funds or capital.
Thus, the concept of finance is about money, specifically the system and process of its
attainment and management. The three major areas of finance—individual, corporate,
and public finance—are well understood, but the area of study in nonprofit finance is less
developed (Young, 2007). Perhaps it is because nonprofit organizations are different.
Unlike for-profits that seek to increase the market value of their owners’ equity,
nonprofits exist primarily to promote the social values they stand for. Different from for-
profits that rely on sales as their primary source of revenue, nonprofits derive revenue
from various sources. What is more, nonprofits differ from each other in the types of
activities they engage in as well as the mixes of revenue they use to support their
activities. The uniqueness and complexities of nonprofits present the need to develop an
independent area of study in nonprofit finance.
In the past decade, some nonprofit scholars have made efforts to build the field of
nonprofit finance. So far the most comprehensive book about nonprofit finance is
Financing Nonprofits: Putting Theory into Practice (edited by Young, 2007), in which
topics are organized by sources of nonprofit revenue and the discussions provide both
theoretical contributions and practical guidance. In addition, Bowman’s (2011) book,

2
Financial Fundamentals for Nonprofits, focuses on the financial management issues of
different types of nonprofit organizations. Rather than being another financial
management textbook, it emphasizes the nonprofit differences and their implications to
nonprofit financial management. The other book, Handbook of Research on Nonprofit
Economics and Management, edited by Seaman and Young (2010), is a collection of
survey articles on various nonprofit management topics. Although it is not exclusively
devoted to topics on nonprofit finance, this book is a good source for researchers in
nonprofit management.
Mainly relying on these three sources, this paper focuses on the following
questions: First, what is nonprofit finance? What is the goal of nonprofit financial
management? Second, why does it matter to study nonprofit finance? Third, what are the
major research topics on nonprofit finance? What finance and microeconomic theories
can be borrowed to understand nonprofit finance and help build its own theories? In a
limited literature review, this paper provides a quick summary about the known and
unknown about nonprofit finance, with a greater emphasis on some topics rather than
others.
What is nonprofit finance?
How to define nonprofit finance? Let us start by looking at the major concerns of
corporate and public finance. Corporate finance focuses on the following three areas: 1)
capital budgeting—what long-term investments (e.g. new plants, new products) should a
firm make; 2) capital structure—where to obtain the long-term financing to pay for its
investments, specifically, what is the best mix of equity and debt; and 3) working

3
capital—how should a firm manage the relationship between its short-term assets and
liabilities to ensure its operations. Overall, the primary goal of corporate financial
management is to increase the market value of the equity owned by shareholders (Ross,
Westerfield, & Jordan, 2008).
Public finance is “the branch of economics that studies the taxing and spending
activities of government” (Rosen, 2003, p. 252). Essentially, the study of public finance
is about “the role of the government in the economy” (Gruber, 2005, p. 2). Some
scholars, like Rosen (2003, p. 252), think that the term public finance is “a misnomer,
because the fundamental issues are not financial (that is, relating to money). Rather, the
key problems relate to the use of real resources.” The study of public finance
encompasses both positive and normative analysis, with the former examining the cause
and effect of a government policy or activity and the latter dealing with ethical issues like
fairness (Rosen, 2003).
In light of corporate and public finance, the study of nonprofit finance should be
considered from both financial and mission perspectives. First, the pure financial
concerns are about obtaining and managing various sources of income. As Young
suggests (2007, p.339), “any theory of non-profit finance must account for three basic
issues—financing of current operations, financing of longer term capital needs, and the
balance or mix among different sources of income for these purposes.” This is very
similar to the three concerns of corporate finance. Second, the pure financial concerns are
subject to nonprofit missions. As in the case of public finance, the use of nonprofit
financial resources also involves ethical concerns. Nonprofits exist in society to serve
social purposes rather than private inurement. Hence, the primary objective of nonprofit
4
financial management is “to ensure that financial resources are available when needed, as
needed, and at a reasonable cost, and are protected from financial impairment and spent
according to mission and donor purposes” (Zietlow, Hankin, & Seidner, 2007, p.43). In
all, nonprofit finance is the study of financial resources procurement and management
that support the social purposes of nonprofit organizations.
Why Study Nonprofit Finance?
Nonprofit organizations play an important role in society. They deliver goods and
services when business and government fail to do so. They represent diverse voices and
ideas that underlie a pluralistic society. They also make considerable contributions to the
U.S. economy, accounting for over 5 percent of the GDP and over 9 percent of all wages
and salaries paid in the U.S. (McKeever, 2015). Various types of nonprofit organizations
constitute a large and fast-growing nonprofit sector. Between 2003 and 2013, the number
of registered nonprofit organizations increased by 2.8 percent from 1.38 million to 1.41
million, not including the unknown number of unregistered nonprofits. About 35 percent
of the registered nonprofits reported $2.26 trillion in total revenue and $5.17 trillion in
total assets in 2013, growing even faster than the country’s GDP over the ten-year period
(McKeever, 2015).
Yet, it is not rare to find individual nonprofits facing fiscal stress and going out of
business. What should raise concerns is the “bad” management behind the scenes. There
are many advantages as well as disadvantages associated with the nonprofit status, which
have a direct impact on nonprofit financial management. Gift restrictions, for example,
pose a unique challenge to nonprofits that struggle to maintain solvency. The only way to

5
use restricted gifts is to satisfy donor restrictions. In a survey of donative faith-based
nonprofits, however, over half of the organizations reported they temporarily transferred
from current restricted funds to meet a shortfall in current unrestricted funds, indicating
that “interfund borrowing is a necessary evil practiced by many organizations” (Zietlow,
et al., 2007, p.33). More high-profile controversial stories center around nonprofit
organizations’ investments in fundraising. In 2012, CNN exposed two nonprofit
organizations for spending less than 10% of their total revenue on mission-related
services but owing millions of dollars to a direct-marketing company (Perry, 2012). How
much is too much for nonprofit fundraising expenses? While marginal analysis is
commonly used in the business world, the nonprofit sector seems to be stuck in the battle
of accountability and efficiency, particularly when donors are only concerned about the
average ratio of fundraising expenses to donations or services.
In all, nonprofit organizations provide significant social and economic values yet
can be financially vulnerable. It is important for nonprofit managers to be armed with the
appropriate knowledge that helps them to generate, manage, and make effective use of
resources in order to accomplish their organizational missions. The study of nonprofit
finance aims to provide such knowledge, through which nonprofit managers and policy
makers will gain an understanding of the distinctive features of nonprofit finance and
approaches to an effective decision-making in the complex operating environment.
Theoretical Perspectives from Microeconomics and Finance
There are in general two perspectives in the current study of nonprofit finance.
The first mainly utilizes the ideas and tools from microeconomics to understand nonprofit

6
behavior, such as the concept of incentives, the analysis of the margin, the analysis of
markets, the ideas from cost-benefits analysis, and theories of market and government
failure and public and private goods (Young, 2007). The second primarily borrows the
concepts and instruments from corporate finance to address the technical issues in
nonprofit financial management, such as understanding financial statements, developing
financial reports and ratios, liquidity management, long-term financial planning and
capital budgeting, debt management, investment policy, risk management, financial
performance evaluation, and so on (Zietlow, et al., 2007).
In addition to these two approaches, behavioral finance provides another approach
to nonprofit finance, which has yet to attract more attention in future research. Behavioral
finance studies how the psychology of investors or managers affects financial decisions
and markets. Behavioral finance offers an alternative perspective to standard finance.
Standard finance, also known as modern portfolio theory, is based on these four
foundational pillars: 1) investors are rational; 2) markets are efficient; 3) investors design
their portfolios according to the mean-variance analysis; and 4) expected returns are a
function of risk alone. According to behavioral finance, however, investors are
predictably irrational; markets are arguably inefficient; investors design portfolios
according to the rules of behavioral portfolio theory; and expected return follows
behavioral asset pricing theory (Statman, 2008). Behavioral finance may also be useful in
explaining nonprofit financial behavior. For example, it can help us understand how
nonprofit managers actually decide pricing strategies, product portfolios, and financial
portfolios.

7
Major Topics in Nonprofit Finance
The Nonprofit Distinctiveness
Nonprofit finance is distinguished from corporate finance in many ways. The first
difference lies in the objective of financial management. The goal of corporate financial
management is to maximize the market value of the existing owners’ equity. Nonprofits
do not exist primarily to generate profits nor do they distribute surplus to their
stakeholders. Rather, nonprofits are mission-driven; they use the surplus to further their
social purposes. “The absence of owners seeking a handsome return on investment
enables nonprofits to practice values-centered management” (Bowman, 2011, p.3).
Second, nonprofits differ from for-profits in the financial management decisions
regarding capital budgeting, capital structure, and working capital management. In capital
budgeting, a firm identifies the investment opportunities that will earn more than they
cost and particularly, evaluates the size, timing, and risk of future cash flows (Ross, et al.,
2008, p. 2-3). A nonprofit decides what new programs or ventures to engage in, based on
not only pure financial concerns but also mission impact. Similar to for-profits,
nonprofits can receive fees and commercial income by charging for goods and service
that are private in nature (i.e., excludable and rival in consumption). Different from for-
profits, nonprofits engage in both mission-related programs and unrelated business. The
former produces “favored goods” that directly contribute to a nonprofit’s mission but
may subtract from profits, the latter produces “disfavored goods” that are peripheral to
mission achievement but can help finance the core mission-related activities (James,
1983; Schiff & Weisbrod, 1991). The product portfolio analysis thus suggests that

8
nonprofit organizations, in deciding potential programs, should concern the overall
balance of mission impact and financial sustainability (Oster, 2010).
Regarding capital structure, a for-profit firm considers the long-term financing to
support its long-term investments, specifically, identifies the best mixture of debt and
equity. Nonprofits cannot legally issue stocks, although some regard donations as a form
of “equity” because donors receive “dividends-in-kind” when they receive the utility by
seeing the nonprofit achieved its goal (Wedig, 1994, p. 258). Without the option of
raising capital from stockholders, nonprofits rely on various forms of debt. In addition to
bank loans, nonprofits can also obtain capital through program-related investments from
foundations, which take various forms such as below-market-rate loans, loan guarantees,
linked deposits, and equity equivalents (Yetman, 2010).
Working capital management is a daily activity to ensure a firm has sufficient
resources for operations (Ross, et al., 2008, p. 3). Working capital is the difference
between a firm’s current assets and current liabilities. The working capital ratio,
measured by dividing current assets by current liabilities, indicates a firm’s liquidity. An
important nonprofit difference that challenges nonprofit working capital management is
that nonprofits have assets with donor restrictions. A gift is restricted if a donor specifies
a specific purpose or time for its use or mandates to spend the earnings of a gift only. A
gift may be temporarily or permanently restricted. As a result, nonprofits should exclude
restricted assets from working capital.
Third, unlike for-profits, nonprofits have many revenue sources. In addition to
sales of goods and services, nonprofits can generate income from many alternative
sources, such as donations, grants, investments, and dues. Looking separately, each

9
revenue source has its own complications and implications. For example, regarding
donations, special management considerations arise as there are restricted and
unrestricted gifts. The decision on fundraising expenses involves both financial and
ethical concerns. With respect to sales of goods and services, nonprofit managers need to
balance the production of preferred and non-preferred goods. Controversies may arise on
the unfair competition between nonprofits engaging in unrelated business and their for-
profit counterparts. With government grants and contracts, there have been concerns
about whether government funding crowds out private contributions (Tinkelman, 2010).
With endowments, the question is on whether a nonprofit should accumulate
endowments, which reflects a trade-off between serving the needs of the current and
future generations (Hansmann, 1987). Taken together, nonprofit managers need to
evaluate and decide an appropriate revenue composition that can best serve the
nonprofit’s mission.
In light of these distinctive features of nonprofit finance, I will summarize the
major research topics on individual revenue sources as well as on their interactions and
combinations. I will focus on individual giving, commercial income, government
funding, investment income, membership income, leaving out other relevant topics such
as foundation giving, corporate giving, the valuation of volunteer labor, income and
property tax, and financial health and risk management.
Charitable Contributions
Charitable contributions include those from individuals, foundations and
corporations. In 2014, the estimated total charitable giving was $358.38 billion, of which

10
individual giving by living individuals accounted for 72% (80% if including bequest).
Foundations giving constituted 15% of total giving and corporations only 5% (Giving
USA 2015). Charitable giving appears to be less important than commercial income and
government funding—its share in the total revenue of public charities was only 13.3% in
2014 (McKeever, 2015). It is nonetheless a primary source of income for nonprofits in
some subsectors, such as arts and environment (Roeger, Blackwood, & Pettijohn, 2012).
In fact, if seen from a different angle, charitable giving is a critical component of finance
that two out of five nonprofits would have had a deficit without it (Bowman, 2011,
p.137). I will focus on individual donations by living donors in the following discussion.
The large body of research on individual giving generally revolves around three
important research questions. First, who gives what? Second, why do people give? Third,
what is the optimal level of fundraising expenses? The first question is who gives what.
That is, what are the characteristics of individuals and households that make donations
and how are these characteristics related to how much and where people donate? In a
comprehensive review on this topic, Bekkers and Wiepking (2007) summarized the key
variables that influence people’s charitable giving behavior, including: personal and
household income, wealth, employment status, religion, education, age, marital status,
number of children, gender, race, ethnicity, immigrant/citizenship status, parental
background, volunteering, region, and so on. Knowledge on this topic is largely
descriptive. While it helps practitioners and policy makers to identify the current status
and future trends of charitable giving, it offers limited value to fundraisers on how to
design fundraising campaigns (Bekkers & Wiepking, 2007).

11
In contrast, understanding why do people give provides valuable information for
policymakers to develop tax policies and for fundraisers design fundraising campaigns.
Vesterlund (2006) did an excellent review of the economics studies on motivations for
individual charitable giving. Economists “think about charitable giving as it is just like
the purchase of any other commodity” (Vesterlund, 2006, pp. 568). Therefore,
contributions are expected to depend on an individual’s income and the price of giving.
The price of giving tells us how much it costs to give a nonprofit an additional dollar; for
itemizers, the price of giving depends on their marginal tax rate. Economists have
examined how sensitive charitable giving is to income and price, measured respectively
as the income and price elasticities of demand. In general, studies find that giving is
income inelastic but price elastic (Vesterlund, 2006). Knowing how sensitive charitable
giving is to income and price not only helps us to predict how changes in the economy
and tax policy will affect charitable giving but also can help the government to design
better tax policies.
In addition to the effects of income and price, the potential benefits of charitable
giving to donors also matter. Vesterlund (2006) summarized two types of benefits often
used by economists: public benefits (both the donor and other individuals can enjoy the
benefits from giving) and private benefits (only the donor can enjoy the benefits from
giving). Previous studies reported various types of private benefits that can motivate
individual donations, including material rewards, reputation and social acclaim, signaling
of wealth, warm glow, assuaging guilt, commitment, and so forth. According to
economists, if an individual is fully motivated by private benefits, her contributions will
not be affected by others’ donations. If the benefit is public, then an individual has an
12
incentive to free ride on others’ donations. A related issue is how an increase in
government grants to nonprofits will affect individual giving. If the benefit is purely
private, then we should observe no effect. If the benefit is purely public, then we can
expect complete crowd-out when the economy is large. Findings from many empirical
studies suggest that the last dollar donated is motivated by private benefit instead of the
nonprofit’s output (e.g., Ribar & Wilhelm, 2002), but the result may be altered when
considering the interactions among donors or the impact of social norms (Vesterlund,
2006). The knowledge about the motivations for individual giving is informative for
fundraisers who want to design effective fundraising campaigns. It can help policy
makers and nonprofit managers who are interested in developing policies and
mechanisms that can solve the free-rider problem.
The third question is what is the optimal level of fundraising expenses? There
has long been a debate on how to properly evaluate a nonprofit’s fundraising efficiency.
Donors would prefer their donations to be spent on programs rather than on fundraising
or administrative activities. Therefore, donors would like to give to nonprofits with a low
level of fundraising ratio, measured as the ratio of fundraising expenses to donations.
Nonprofits with a high fundraising ratio may suffer increased public scrutiny. The
fundraising ratio is problematic: based on financial statements or Form 990s, donors can
only obtain the historical average ratio rather than the current marginal ratio. Empirical
evidence indicates that the incremental responses of donations to increases in fundraising
expenses are poorly correlated with the average ratios (Tinkelman, 2006). Instead,
Steinberg (1991; 1986) developed a theory and suggested that nonprofits should think at
the margin. That is, program-maximizing managers can optimize their investments in
13
fundraising by spending on fundraising up to the point where an additional dollar raised
would be just offset by the last dollar spent; budget-maximizing managers can spend until
the marginal response to an additional dollar of fundraising equals zero. Knowledge on
this topic has important implications for fundraising practice, financial management, and
accountability of nonprofit organizations.
Commercial income
Nonprofit organizations can generate income by charging fees for goods and
services that are sufficiently private in nature (i.e. excludable and rival in consumption).
In addition to the sales of mission-related goods and services, they may also engage in
unrelated business that only indirectly contributes to their missions by providing financial
support. In fact, almost half of the total revenue of public charities came from private
payments for goods and services in 2013. If including fees from government sources,
such as Medicare and Medicaid, fee income accounted for 72% (McKeever, 2015). The
commercialization of nonprofits has raised a lot of scholarly attention (e.g., Weisbrod,
1998). Why do nonprofits engage in commercial activities? How should nonprofits
decide the mix of goods or services so to achieve an overall balance of mission and
revenue impact? How should nonprofits set prices for different goods and services?
Additional concerns arise as commercial activities may cause the mission drift of
nonprofits and the unfair competition between nonprofits and their for-profit
counterparts.
Multiproduct firms. James and Young (2007) summarized several economic
theories that explain the reliance of nonprofit organizations on fee income. On the
14
demand side, nonprofit organizations provide private goods and services in response to
the contract failure caused by the asymmetric information between producers and
consumers. The supply side theory emphasizes the role of entrepreneurs in establishing
nonprofit organizations and seeking additional revenue in the marketplace. According to
the model developed by James (1983) and later Shiff and Weisbrod (1991), nonprofits are
multiproduct firms in which nonprofit managers derive utilities from producing
“preferred” goods and services that satisfy their non-pecuniary motivations and also
engage in “non-preferred” commercial activities that cross-subsidize their preferred
activities. This model suggests that nonprofits “generate an overall balance of mission
impacting and revenue generating activities, such that in the end they are able to be
financially sustainable while maximizing their mission objectives” (James & Young,
2007, pp. 113). Based on this model, the nonprofit product portfolio theory provides a
framework for nonprofits to choose potential programs with an overall balance of mission
and revenue impact (Oster, 2010).
Pricing. Nonprofits can secure revenue by charging fees for goods and services
that are sufficiently “private.” Regardless of organizational form, pricing plays an
important role in reducing congestion and rationing (and shifting) usage when capacity is
constrained. Sophisticated pricing strategies, such as differential pricing and product
bundling strategies, can be used to generate more revenue (Seaman, 2010). Pricing is
more complicated for nonprofits because they are multiproduct organizations with
complex objectives and multiple revenue sources. According to Young and Steinberg
(1995, p.160-176), there are five considerations that influence nonprofit pricing
strategies: First, the interactions between sales and other sources of revenues, especially

15
donations. Second, the scope of cross-subsidizing one output using profits from another,
particularly, using profits from unrelated business to finance mission-related output.
Third, the design of price discrimination policies, specifically, charging a higher price to
customers who are able to pay while a lower price to those mission targets who are not
able to pay. Fourth, product differentiation in consideration of the long-run competition.
Last but not least, the impact of pricing on the mission objective of nonprofit
organizations, such as the attainment of output, the effectiveness of expressive missions,
the motivational effect on client effort, and the screening effect among different groups of
consumers.
In exploring nonprofit pricing, economists are especially interested in
understanding “the roles played by demand, capacity constraints and congestions, cost
and cost uncertainty, subsidies, competitive versus market power considerations, complex
objective functions, and the forces of tradition versus innovation” (Seaman, 2010, pp.
142). Also of interest are the differences between nonprofit and for-profit pricing (e.g.,
Steinberg & Weisbrod, 1998). Some areas of nonprofit pricing are better understood than
others. For example, there has been plenty of theoretical work and empirical studies on
price discrimination and product bundling, particularly among performing arts nonprofits
and universities (e.g., Hansmann, 1981; Steinberg & Weisbrod, 2005). The effect of
competition and market power on nonprofit pricing, particularly among hospitals and
universities, has also received a lot of scholarly attention (e.g., Greaney, 2006). However,
there is thinner research on the fifth issue identified by Young and Steinberg (1995), such
as the psychological role that pricing may play in the behavior of clients and its

16
implications for optimum pricing. Readers who are interested in the current status of
nonprofit pricing studies can refer to Seaman (2010).
Government funding
Government funding to nonprofit organizations come in various forms—tax
subsidies, grants, and contracts. The U.S. federal government and many state
governments support qualified nonprofits by allowing donors to deduct their charitable
contributions from their income tax. 501(c)3 nonprofit organizations are exempt from
corporate taxes. In addition to tax subsidies, many nonprofits also receive government
grants and contracts, particularly those providing health care and human services
(Grønbjerg & Salamon, 2012). In fact, the combined revenue from government grants
and contracts constituted about one third of the total revenue for public charities in 2013,
making government funding (not including tax subsidies) the second largest revenue
source after private payments for goods and services (McKeever, 2015).
Public administration scholars have examined the advantages and disadvantages
of government funding using institutional theory and resource dependence theory. On the
one hand, government funding is found to be a revenue source with high stability and
continuity (e.g., Grønbjerg, 1992; Froelich, 1999). On the other hand, scholars cast
caution to the reliance on government funding (Rushton & Brooks, 2007; Froelich,
1999). The fundamental issue related to government funding is the relationship between
the nonprofit sector and government. In a comprehensive examination of the past 30
years’ government-nonprofit relations, Grønbjerg and Salamon (2012) conclude (pp.
578):
17
After a rapid period of expanding cooperation, nonprofits have had to deal with a significant retrenchment in public funding, a widespread diversification of the forms of public assistance, a shift from producer-side to consumer-side subsidies, the loss of their “preferred-provider” status in many government programs, increased demand for efficiency, less favorable tax regimes, increased regulatory pressure, and a far more fragmented policy arena.
The implication? Government funding comes with many strings attached. Managing
government grants and contracts are likely to cause changes in the management process
and organizational structure of nonprofit organizations (e.g., Grønbjerg, 1991; 1992,
Froelich, 1999).
There is abundant research on government funding. Besides the perspectives from
public administration, economists have examined the effect of tax policies on charitable
giving and nonprofit behavior (see the section on charitable contributions), as well as the
crowding out effect of public funding on private donations (see the section on revenue
interactions).
Investment income
Investment income—interest, dividends, and capital gains from investments in
cash, stocks, or bonds—only accounted for about five percent of the total revenue of
public charities in 2013 (McKeever, 2015). Nonetheless, investment income is an
important revenue source for a small number of organizations with funds available for
investing. Nonprofit organizations can use a highly liquid working cash fund, usually
consisted of investments in money market funds or bonds with high credit quality and
short maturity (e.g., T-bills), to supply cash quickly in the event of a negative cash flow
(Bowman, 2011, p. 35). Nonprofits can also build operating reserve funds to cover
18
unexpected budget deficits, among other purposes (Bowman, 2011, p. 35). Moreover,
distinguished from for-profits, nonprofit organizations can hold endowments. Through a
well-managed portfolio of long-term investments, endowed nonprofits can have “a
perpetual source of income” (Bowman, 2011, p. 40).
Should nonprofits accumulate endowments? On the one hand, quasi-
endowments can supply a stable source of income that comes with no strings attached
and offers a hedge against the unpredictable losses in other sources of income. On the
other hand, for some assets (e.g., historical buildings), their maintenance and operation
costs may be more than their income can cover. Like in the case of a loss-making
mission-related activity, a for-profit “would get rid of any asset with a negative expected
return, but a nonprofit manager is constrained to keep it and find a way to pay for it”
(Bowman, 2007, p. 283). Challenges also come from whether accumulating a large
endowment for future is a better use of resources than spending them for today’s societal
needs. Hansmann (1990) questioned the notion of intergenerational equity as the purpose
of endowment accumulation by universities and colleges (p. 9):
In a college or university, each dollar added to endowment represents a dollar less for current research or for educational services to current students or a dollar more in tuition that must be charged current students in order to provide them with the same level of services. The amounts thus saved will presumably be used to provide more research, more education, or lower tuition in the future. Why, then, do universities save rather than spend so much of their income?
Mission-related Investments. Hansmann (1990) made a particularly intriguing
comment on the form of investments, that is, financial investments “may not be the best
means to the end” even if a university aims to help future generations, because “it is
implicitly making the judgement that the dollar will have a higher rate of return if

19
invested in stocks and bonds than in educating an undergraduate” (p. 18). Similar to
Hansmann’s comment on universities and colleges, some thought leaders and
practitioners in the field of philanthropy have been urging foundations to make better use
of their endowments. Private non-operating foundations, which account for over 90
percent of the U.S. foundations, are required by law to distribute about five percent of
their net investment assets for charitable purposes and manage the rest, around 95%, of
their assets for pure financial returns without considering social values. For this reason,
some thought leaders have been advocating bridging the gap between foundations’
charitable programs and asset management by using investment strategies that align
financial investments with mission achievement (Emerson, 2003).
Program-related investments (PRIs) and mission-related investments (MRIs) are
examples of the unconventional investments that support foundations in achieving both
charitable purposes and some financial returns. Specifically, PRIs are legally defined
charitable activities to primarily support foundations’ charitable missions. PRIs, made
from either a private foundation’s program funds or investment assets, allow a foundation
to gain moderate financial benefits through the repayment of principal and returns on
below-market-rate loans or equity. MRIs, on the other hand, are essentially financial
investments with social purposes. Made from foundations’ investment assets, MRIs are
usually market-rate investments and subject to prudent investor standards as conventional
investments (Qu & Osili, 2016). In the field of practice, PRIs and MRIs have garnered
much attention. However, the academic research on PRIs and MRIs barely exists. For
future research, on the investor side, it would interesting to examine foundations’
portfolio of mission-related investments in conjunction with other exogenous sources of

20
income and evaluate the overall impact of those investments. On the recipient side, it
would be interesting to explore the impact of mission-related investments on the capital
formation of nonprofit organizations.
Membership income
Membership income is a unique source of income to nonprofit membership
associations, which comprise about a quarter of the registered nonprofit organizations
excluding congregations (NCCS, 2015). Members support their associations in various
ways. They pay membership dues and fees; they may also make charitable donations.
While only accounting for a tiny portion (less than 1%) of the total revenue for the
average 501(c)(3) nonprofits, dues are a significant revenue source for other 501(c)
nonprofits, particularly social and recreational clubs, labor, agricultural, or horticultural
groups, and business leagues (McKeever, 2015; Steinberg, 2007). The significance of
membership dues is likely to be underestimated because the above findings are based on
the IRS 990 Form entry on “membership dues and assessments,” in which nonprofits can
report only a portion of the actual dues that are commensurate with membership benefits
and treating the rest of the dues as member contributions.
Research on the finance of nonprofit membership associations is rare. There are
only two studies that I am aware of. First, Steinberg (2007) specified a functional
definition of dues and developed a theory that provides guidance to optimize rates and
structures of dues. According to the nature of goods provided by an organization and the
organization’s governance structure, dues can function as donations, pure dues, or some
mixture of these categories. Dues are like donations when an organization provides

21
nonexcludable collective goods and members do not govern; they otherwise function as
pure dues if the organization offers members governance rights or when the organization
provides excludable collective goods. Generally, to decide member dues, an organization
should consider its mission type, solvency, fairness, member characteristics, and
competition (Steinberg, 2007). Bowman’s unpublished manuscript (collected in 2014)
offers insights into the financial management of membership associations. He found
some empirical evidence on the negative correlations between program service revenue
and membership dues, indicating that membership associations use program service
revenue to keep membership dues low.
There are many interesting but unexplored questions regarding membership
income. For example, how do membership dues interact with other sources of income,
such as member donations? Does an increase in dues come at the expense of decreased
donations? How does a due structure, that is, different rates across membership
categories, influence member donations? The unavailability of survey data on dues poses
challenges to the study of membership income. Nonetheless, some questions can be
explored through experiments. My essay on service club membership and generosity is
the first attempt, which hopefully to serve as a basis for more sophisticated experimental
studies I would like to follow later.
Revenue Interactions
I have discussed the various sources of nonprofit revenue. How do these different
sources of revenue interact with each other? That is, does the increase in one source of
revenue lead to the decrease (increase) in others? The issue of “crowding out” and
22
“crowding in” is complex and needs to be considered at three different levels: the
national level, the sectoral level, and the organizational level (Tinkelman, 2010). First, at
the national level, we compare total giving, total government spending on the program
areas that also supported by nonprofits, and the total level of other sources of nonprofit
revenue. Past empirical studies present mixed results on the interactions between
individual donations and government spending. Based on the data of federal spending
and private giving as a percent of GDP since 1966, Tinkelman (2010) found that
government spending and nonprofit program service revenue have both increased faster
than GDP while donations have stayed around 2% of GDP. Overall, donations are driven
by people’s willingness to give a certain portion of their disposable income (around 2%)
and are more or less independent of the other types of revenue.
Second, at the sectoral level, an interesting question is the national demand for a
particular public good, particularly, does an increase in government funding for a
particular public good crowd out private donations? Scholars are also interested in
whether and how various forms of government grants (i.e. matching grants, seed money,
or simple lump-sum unrestricted payments) affect the interaction. There is an impressive
body of literature on the interaction of individual giving and government funding. Both
Tinkelman (2010) and Vesterlund (2006) provided an excellent account of previous
empirical studies relying on survey or tax return data. While the reported strengths and
directions of the crowding effects vary across studies, most studies reported a crowding
out rather than crowding in by government funding. Vesterlund (2006) also summarized
some experimental studies and found that the crowding out effect is larger than that

23
reported by empirical studies. When the strong assumptions of the classical model are
relaxed, we may observe the crowding effects at various levels.
Tinkelman (2010) listed six explanations for the incomplete crowding out. First,
people may derive utility from the act of giving itself (the “warm glow”), which cannot
be substituted by the utility they derive from the level of the public good produced
(Andreoni, 1989; Steinberg, 1985; Arrow, 1972). In this case, we would expect
incomplete crowding effects. Second, a nonprofit may differentiate how its service mix is
supported, making government funding and private giving complementary. Third,
individuals may not have perfect information when making their giving decisions (e.g., a
nonprofit’s funding sources, program quality, the beneficiaries). Fourth, the cost function
of public-good provision may not be linear and continuous. Fifth, the complete crowding
out would not hold if not everyone in the economy originally contributes to the public
good (Bergstrom, Blume, & Varian, 1986). Finally, the relation between any two revenue
sources may not be a simple linear relation. It could be crowding in at low levels of
government subsidy and crowding out at higher levels (Brooks, 2000).
The third level is to consider revenue interaction at the organizational level. That
is, does the level of private donations to an organization, as well as other sources of
revenue, respond to an increase or decrease in government funding? Are the crowding
effects due to the acceptance of government funding or the strategic decisions of
nonprofit managers? Crowding out may result from not only donors’ perceptions of the
funding change but also nonprofit managers’ strategic reactions, or both. The model of
multiproduct firm indicates that managers may respond to the decrease in the revenue
from their preferred activities by pursuing revenue from non-preferred areas. Similarly,
24
when obtaining new financial resources, nonprofit managers might decrease the non-
preferred activities, such as unrelated business or fundraising efforts. Many recent studies
are consistent with the predicted managerial reactions (e.g., Andreoni & Payne, 2003).
See Tinkelman (2010) for a summary of the studies.
Revenue Diversification
Given the many revenue sources and the complexities, scholars have been
interested in nonprofit revenue choice and how a certain revenue composition may affect
the financial health and organizational success of a nonprofit. My essay on nonprofit
income portfolio optimization is also along this line. Among the existing studies, some
have focused on whether revenue diversification or concentration is associated with the
financial health of nonprofits (e.g.; Tuckman and Chang, 1991; Chang and Tuckman,
1994; Greenlee and Trussel, 2000; Carroll and Stater, 2009; Frumpkin and Keating,
2011; Chikoto and Neely, 2014). Others have developed theories that explain the revenue
choice by nonprofit managers (e.g., Grønbjerg, 1992; Bielefeld, 1992; Kingma, 1993;
Chang and Tuckman, 1994; Froelich, 1999; Kearns, 2006; Young, 2006). I will focus on
the latter issue in the following discussion. A detailed literature review on the former
issue is available in my essay on nonprofit income portfolio optimization.
What motivates a nonprofit manager’s choice of revenue mix? Scholars from
different disciplines have offered different explanations. Institutional theory posits that
nonprofits seek heterogeneous revenue sources to increase their legitimacy and
recognition in a community (Galaskiewicz, 1990; Bielefeld, 1992). Alternatively,
resource dependence theory suggests that nonprofits can achieve funding stability and

25
organizational success by concentrating on a few revenue sources as they develop a long-
time relationship with a few funders (e.g. Grønbjerg, 1992; Froelich, 1999). Based on the
utility maximization model of traditional microeconomic theory, Chang and Tuckman
(1990, 1991) hypothesize that nonprofit managers are motivated by a desire to increase
surplus to accumulate wealth and equity. As a result, nonprofit managers consciously
pursue a diversified revenue mix to manage financial risk and reduce financial
vulnerability. Similarly, Kingma (1993) interpreted the goal of nonprofit managers as “to
provide a certain level of services (a given level of expected return) while minimizing
unpredictable changes in revenues (risk)” (p. 105). According to the “multiattribute
utility theory” developed by Kearns (2007), a nonprofit organization has a complex
organizational structure with multi-stakeholders inside and outside of the organization.
Therefore, deciding nonprofit revenue mix is a process influenced by many stakeholders’
perspectives and utilities. Young’s (2006) normative theory suggests that nonprofit
managers should choose an income portfolio that reflects the mix of benefits it provides
in addition to the financial management concerns (e.g., feasibility, interactions, solvency,
risk, mission).
Despite the fruitful research, Chang and Tuckman (2010) suggest several
interesting future research topics, among which they state there is need to identify
measures of risk for the sector and to use these measures to evaluate the growth of
nonprofit revenue streams and their volatility. While with a different study motivation,
my essay on nonprofit income portfolio optimization is also a response to this suggestion
by Chang and Tuckman.

26
Connecting the Dots
Nonprofit finance concerns obtaining and managing various financial resources in
order to support the social purposes of nonprofit organizations. The concepts and tools
from corporate finance and microeconomics have informed nonprofit finance, but we
should also bear in mind that nonprofit finance is different from corporate finance in
many ways. Nonprofits differ from for-profits in both the financial management objective
and the decisions regarding capital budgeting, capital structure, and working capital
management. Unlike for-profits, nonprofits can generate income from many alternative
sources. Looking separately, each revenue source has its own complications and
implications to financial management. Taken together, the sources of revenue may
interact or correlate with each other and influence the performance of the overall
portfolio. Therefore, nonprofit financial management involves answering two
fundamental questions: What is the optimal combination of revenue sources that supports
a nonprofit to achieve its mission? Where and how to obtain the revenue sources? My
two essays address these two questions respectively.
The first essay is among the first to properly apply modern portfolio theory
(MPT) to the optimization of nonprofit revenue mix. By analyzing nonprofit tax return
data, I estimate the expected return and risk characteristics for five nonprofit revenue
sources as well as the correlations among these returns. I use the estimates to identify the
efficient frontier for nonprofits in different industries, based on which nonprofit managers
can select an optimal portfolio that can minimize the risk given a preferred level of
service provision or maximize the service given a level of risk. The findings also pose a
challenge to the predominant approach used in previous nonprofit finance studies

27
(Herfindahl-Hirschman Index) and suggest that MPT is theoretically and practically more
helpful in guiding nonprofit revenue management.
The second essay concerns nonprofit resource attainment, specifically, how do
decisionmaking contexts and framing affect donations. A laboratory experiment was
designed to test whether membership in a nonprofit service club makes a person more
generous. Membership in a service club is characterized by two essential elements:
members’ shared interest in the club’s charitable mission; and private benefits that often
come as a result of social interactions with other members, such as networking,
fellowship, and fun. The study finds that female individuals are the least generous when
they are reminded of the socializing aspect of service-club membership. Male individuals
in the social treatment donated more than those in the mission treatment mathematically,
although the results are not statistically significant. Results are consistent with a variant
of social identity theory we develop, as well as motivational crowding-out from
psychology and economics.
28
References Andreoni, J. (1989). Giving with Impure Altruism: Applications to Charity and Ricardian
Equivalence. Journal of Political Economy, 97, 1447-1458. Andreoni, J., & Payne, Abigail A. (2003). Do Government Grants to Private Charities
Crowd Out Giving or Fund-raising? American Economic Review, 93 (3), 792-812. Arrow, K. J. (1972). Gifts and Exchanges. Philosophy and Public Affairs, 1(4), 343-62. Bekkers, R., & Wiepking, P. (2007). Understanding Philanthropy: A Review of 50 Years
of Theories and Research. Bergstrom, T., Blume, L., & Varian, H. (1986). On the Private Provision of Public
Goods. Journal of Public Economics, 29 (1), 25-49. Bielefeld, W. (1992). Non-Profit Funding Environment Relations. Voluntas , 3 (1), 48-70. Bielefeld, W. (1992). Funding Uncertainty and Nonprofit Strategies in the 1980s.
Nonprofit Management and Leadership, 2 (4), 381-401. Bowman, W. (2011). Finance Fundamentals for Nonprofits: Building Capacity and
Sustainability. Hoboken, New Jersey: John Wiley & Sons. Bowman, W. (2006). Managing Endowment and Other Assets. In D. Young (Ed.),
Financing Nonprofits: Putting Theory into Practice (pp. 271-290). Lanham, MD: AltaMira.
Brooks, A. C. (2000). Public Subsidies and Charitable Giving: Crowding Out, Crowding In, or Both?. Journal of Policy Analysis and Management, 19 (3), 451-64.
Carroll, D. A., & Stater, K. J. (2008). Revenue Diversification in Nonprofit Organizations: Does it Lead to Financial Stability? Journal of Public Administration Research and Theory, 19, 947-966.
Chang, C. F., & Tuckman, H. P. (2010). Income Diversification. In B. Seaman, & D. R. Young (Eds.), Handbook of Research on Nonprofit Economics and Management (pp. 5-17). Northhamton, Massachusetts: Edward Elgar.
Chang, C. F., & Tuckman, H. P. (1994). Revenue Diversification Among Non-profits . Voluntas, 5 (3), 273-390.
Chikoto, G. L., & Neely, D. G. (2014). Building Nonprofit Financial Capacity: The Impact of Revenue Concentration and Overhead Costs. Nonprofit and Voluntary Sector Quarterly , 43 (3), 570-588.
Emerson, J. (2003). Where Money Meets Mission: Breaking Down the Firewall Between Foundation Investments and Programming. Stanford Social Innovation Review, 38–47.
Froelich, K. A. (1999). Diversification of Revenue Strategies: Evolving Resource Dependence in Nonprofit Organizations. Nonprofit and Voluntary Sector Quarterly, 28 (3), 246-268.
Frumkin, P., & Keating, E. K. (2011). Diversification Reconsidered: The Risks and Rewards of Revenue Concentration. Journal of Social Entrepreneurship, 2 (2), 151-164.
Galaskiewicz, J. (1990). Growth, Decline, and Organizational Strategies: A Panel Study of Nonprofit Organizations, 1980-1988 . Independent Sector Spring Research Forum. Boston: Independent Sector.
Giving USA: The Annual Report on Philanthropy for the Year 2014. (2015). Chicago: Giving USA Foundation.

29
Greaney, T. L. (2006). Antitrust and Hospital Mergers: Does the Nonprofit Form Affect Competitive Substance? Journal of Health Politics, Policy and Law , 31 (3), 511-529.
Greenlee, J. S., & Trussel, J. M. (2000). Predicting the Financial Vulnerability of Charitable Organizations. Nonprofit Management & Leadership, 11 (2), 199-210.
Grønbjerg, K. A. (1991). Managing Grants and Contracts: The Case of Four Nonprofit Social Service Organizations. Nonprofit and Voluntary Sector Quarterly (20), 5-24.
Grønbjerg, K. A. (1992). Nonprofit Human Service Organizations Funding Strategies and Patterns of Adaptation. In Y. Hasenfeld (Ed.), Human Services as Complex Organizations. Newbury Park, CA: Sage.
Grønbjerg, K. A., & Salamon, L. M. (2012). Devolution, Marketization, and the Changing Shape of Government-Nonprofit Relations. In L. M. Salamon (Ed.), The State of Nonprofit America (2nd Edition ed., pp. 549-86). Washington D. C.: Brookings Institution Press.
Gruber, J. (2005). Public Finance and Public Policy. New York: Worth Publications. Hannsman, H. (1981). Nonprofit Enterprise in the Performing Arts. Bell Journal of
Economics, 12, 341-361. Hansmann, H. (1990). Why Do Universities Have Endowments? The Journal of Legal
Studies, 19 (1), 3-42. James, E. (1983). How Nonprofits Grow: A Model. Journal of Policy Analysis and
Management, 2(3): 350-65. James, E., & Young, D. R. (2007). Fee Income and Commercial Ventures. In D. R.
Young (Ed.), Financing Nonprofits: Putting Theory into Practice (pp. 93-119). Lanham: AltaMira Press.
Kearns, K. (2007). Income Portfolios. In D. Young (Ed.), Financing Nonprofits: Putting Theory into Practice (pp. 291-314). Lanham, MD: AltaMira Press.
Kingma, B. R. (1993). Portfolio Theory and Nonprofit Financial Stability. Nonprofit and Voluntary Sector Quarterly, 22 (2), 105-119.
McKeever, B. S. (2015). The Nonprofit Sector in Brief 2015. Urban Institute. Washington, DC: Urban Institute.
Merriam-Webster.com. (2011). fiance. Retrieved 12 12, 2011, from Merriam-Webster.com: http://www.merriam-webster.com/dictionary/finance.
Oster, S. M. (2010). Product Diversification and Social Enterprise. In B. A. Seaman, & D. R. Young (Eds.), Handbook of Research on Nonprofit Economics and Management (pp. 195-207). Northampton, Massachusetts: Edward Elgar.
Perry, S. (2012, August 16). Nonprofit Inquiry Thrusts Fundraising Costs Into the Spotlight. Retrieved April 3, 2016, from The Chronicle of Philanthropy: https://philanthropy.com/article/Nonprofit-Inquiry-Reignites/156209
Qu, H., & Osili, U. (2016 Forthcoming.). Beyond Grantmaking: An Investigation of Program-Related Investments by U.S. Foundations. Nonprofit and Voluntary Sector Quarterly.
Ribar, D. C., & Wilhelm, M. O. (2002). Altruistic and Joy-of-giving Motivations in Charitable Behavior. Journal of Political Economy, 110 (2), 425-57.
Roeger, K. L., Blackwood, A. S., & Pettijohn, S. L. (2012). The Nonprofit Almanac 2012. Washington, D.C.: Urban Institute .

30
Rooney, P. (2007). Individual Giving. In D. R. Young (Ed.), Financing Nonprofits: Putting Theory into Practice (pp. 23-44). Lanham: AltaMira Press.
Rosen, H. S. (2003). Public Finance. (C. K. Rowley, & F. Schneider, Eds.) The Encyclopedia of Public Choice, 1, 252-262.
Ross, S. A., Westerfield, R. W., & Jordan, B. D. (2008). Fundamentals of Corporate Finance (8th Edition ed.). New York: Mcgraw-Hill.
Rushton, M., & Brooks, A. C. (2007). Government Funding of Nonprofit Organizations. In D. R. Young (Ed.), Financing Nonprofits: Putting Theory Into Practice (pp. 69-92). Lanham, MD: AltaMira.
Schiff, J., & Weisbrod, B. (1991). Competition Between For-Profit and Nonprofit Organizations in Commercial Markets. Annals of Public and Cooperative Economics, 62, 619-640.
Seaman, B. A., & Young, D. R. (Eds.). (2010). Handbook of Research on Nonprofit Economics and Management . Northampton, Massachusetts, USA: Edward Elgar Publishing, Inc.
Statman, M. (2008). What is Behavioral Finance. In F. J. Fabozzi (Ed.), Handbook of Finance (Vol. 2, pp. 79-84). Hoboken, NJ: John Wiley & Sons, Inc. .
Steinberg, R. (2007). Membership Income. In Financing Nonprofits: Putting Theory into Practice (pp. 121-155). Lanham: AltaMira Press.
Steinberg, R. (1991). The Economics of Fundraising. In Taking Fundraising Seriously: Advancing the Profession and Practice of Raising Money (pp. 238-256). San Francisco: Jossey Bass.
Steinberg, R. (1986). Should Donors Care About Fundraising? In The Economics of Nonprofit Organizations—Studies in Structure and Policy. Edited by S. Rose-Ackerman, 346–364. New York: Oxford University.
Steinberg, R. (1985). Empirical Relations Between Government Spending and Charitable Donations? Nonprofit and Voluntary Sector Quarterly, 14(2-3), 54-64.
Steinberg, R., & Weisbrod, B. A. (2005). Nonprofits with Distributional Objectives: Price Discrimination and Corner Solutions. Journal of Public Economics, 89, 2205-30.
Steinberg, R., & Weisbrod, B. A. (1998). Pricing and Rationing by Nonprofit Organizations with Distributional Objectives. In To Profit or Not to Profit (pp. 47-82). Cambridge: University of Cambridge.
Tinkelman, D. (2010). Revenue Interactions: Crowding out, Crowding In, or Neither? In B. A. Seaman, & D. R. Young (Eds.), Handbook of Research on Nonprofit Economics and Management (pp. 18-41). Northampton : Edward Elgar Publishing Limited.
Tinkelman, D. (2006). The Decision-Usefulness of Nonprofit Fundraising Ratios: Some Contrary Evidence. Journal of Accounting, Auditing & Finance, 21 (4), 441-462.
Tuckman, H. P. (1998). Competition, Commercialization, and the Evolution of Nonprofit Organizational Structures. In B. A. Weisbrod (Ed.), To Profit or Not to Profit (pp. 25-45). New York: Cambridge University Press. .
Tuckman, H. P., & Chang, C. F. (1991). A Methodology for Measuring the Financial Vulnerability of Charitable Nonprofit Organizations. Nonprofit and Voluntary Sector Quarterly , 20 (4), 445-460.

31
Vesterlund, L. (2006). Why Do People Give? In W. W. Powell, & R. Steinberg (Eds.), The Nonprofit Sector: A Research Handbook (2nd Edition ed., pp. 569-90). New Haven: Yale University Press.
Wedig, G. J. (1994). Risk, Leverage, Donations and Dividends-in-kind: A Theory of Nonprofit Financial Behavior. International Review of Economics & Finance, 3 (3), 257-278.
Weisbrod, B. A. (Ed.). (1998). To Porfit or Not To Profit: The Commercial Transformation of the Nonprofit Sector. Cambridge, United Kingdom: Cambridge University Press.
Yetman, R. J. (2010). Capital Formation. In B. A. Seaman, & D. R. Young (Eds.), Handbook of Research on Nonprofit Economics and Management (pp. 59-68). Northhampton, Massachusetts.
Young, D. R. (Ed.). (2007). Financing Nonprofits: Putting Theory Into Practice. Lanham, MD: AltaMira Press.
Young, D. R. (2007). Toward a Normative Theory of Nonprofit Finance. In D. R. Young (Ed.), Financing Nonprofits: Putting Theory into Practice (pp. 339-372). Lanham, MD: Altamira Press.
Young, D. R. (2007). Why Study Nonprofit Finance. In Financing Nonprofits: Putting Theory into Practice (pp. 3-20). Lanham: AltaMira Press.
Young, D. R., & Steinberg, R. (1995). Economics for Nonprofit Managers. New York: The Fundation Center.
Zietlow, J., Hankin, J. A., & Seidner, A. G. (2007). Financial Management for Nonprofit Organizations: Policies and Procedures. New Jersey: John Wiley & Sons, Inc.

32
Essay I Modern Portfolio Theory and the Optimization of Nonprofit Revenue Mix
Heng Qu
Abstract
A unique feature of nonprofit finance is that nonprofit organizations receive revenue from
a variety of sources. Therefore, an important question of nonprofit financial management
is: what is the optimal combination of revenue sources that best serves a nonprofit?
Previous literature on the impact of nonprofit revenue structure shows mixed results.
While most studies suggest that “revenue diversification” reduces financial vulnerability
and revenue volatility, a few other studies instead indicate revenue concentration
contributes to organizational efficiency and revenue growth. These studies predominantly
use Herfindahl-Hirschman Index (HHI) as an indicator of revenue diversification, which,
however, is an inappropriate measure according to modern portfolio theory (MPT). In
this paper, I use MPT as an alternative approach to examining nonprofit revenue mixes.
By analyzing the NCCS-GuideStar Digitized Data from 1998 to 2003, this paper
demonstrates how to find the optimal revenue mix using the MPT approach and examine
whether HHI is a reliable indicator of risk.
Key words: Modern Portfolio Theory, revenue mix optimization, revenue diversification,
revenue concentration, risk, Herfindahl-Hirschman Index

33
Introduction
Nonprofit organizations receive revenue from a variety of sources. In 2013, for
example, the $1.73 trillion total revenue reported by nearly one million public charities
was composed of 47.5 percent program service revenue from private sources, 32.5
percent government funding, 13.3 percent private contributions, 4.8 percent investment
income, and 1.9 percent other sources (McKeever, 2015). Taking a more granular look,
program service revenue from private sources can include ticket sales for arts and culture
organizations, tuition payments for education organizations, or patient revenue for
hospitals, among others. Government funding can be grants, contracts, or fees for goods
and services. Private contributions can be gifts and grants from individuals, foundations,
or corporations. Investment income includes interest on savings, dividends from
securities, rental income, and capital gains. “Other income” can include a range of
revenue sources, such as membership dues, special events, sales of assets, sales of
inventory, and so forth.
To a certain degree, nonprofit organizations have a choice over different mixes of
revenue sources. Nonprofit scholars tend to simplify it as choosing a more concentrated
or diversified revenue structure. Many empirical studies favor revenue diversification,
suggesting that diversification can increase community buy-in and organizational
legitimacy (Bielefeld, 1992; Galaskiewicz & Bielefeld, 1998), reduce financial
vulnerability (e.g., Tuckman & Chang, 1991; Greenlee & Trussel, 2000; Hager, 2001), or
decrease revenue volatility (e.g., Carroll & Stater, 2009; Wicker, Longley, & Breuer,
2013). A few studies support revenue concentration, demonstrating that such
concentration can contribute to organizational success (Grønbjerg, 1992), organizational

34
efficiency (Frumkin & Keating, 2011), and financial capacity growth (Chikoto & Neely,
2014). Many studies have been focused on what determines a nonprofit’s revenue
structure and how the structure influences a nonprofit’s financial health and performance,
but few studies provide insights on what is and how to choose the optimal combination of
revenue sources for a nonprofit organization. This paper fills the gap in the literature by
exploring the question of nonprofit revenue mix optimization.
Methodologically, previous studies predominantly use the Herfindahl-Hirschman
Index (HHI) as an indicator of revenue diversification to predict nonprofit financial
health. According to the HHI approach, a revenue mix becomes more diversified as the
number of revenue sources increases and/or the shares of sources become more equal.
The higher the degree of diversification, the lower the level of a nonprofit’s financial
vulnerability or revenue volatility. The HHI approach, however, has major drawbacks.
First, it only captures the number of revenue sources and the proportion of each source to
total revenue, without considering the covariances between revenue sources, that is, how
one individual revenue source moves in relation to another. Second, HHI uses
information on gross revenue, leaving out the expenses involved to generate a certain
level of revenue and ignoring the volatility of each revenue source. In contrast, modern
portfolio theory (MPT) suggests that simply increasing the number of revenue sources in
a portfolio does not necessarily reduce the portfolio risk and more revenue sources do not
always lead to a well-diversified portfolio (i.e. revenue mix in a nonprofit setting).
Because portfolio risk depends on both the variability of the returns on individual
revenue sources as well as the covariances between the returns, the magic of revenue
diversification works by carefully selecting revenue sources, the returns on which have

35
low correlations with one another (Markowitz, 1952; 1959). However, with the exception
of Kingma (1993) and Grasse, et al. (2015), very few studies paid attention to the
covariances between the returns on nonprofit revenue sources. Even the two articles
applying MPT did not properly use the MPT approach to calculate nonprofit portfolio
risk as their empirical results are based on the gross revenue growth rather than the net
return of revenue sources.
In this paper, I use MPT as an alternative approach to HHI to examine a less
explored but more meaningful question: what is the optimal combination of revenue
sources that can best support a nonprofit organization to achieve its mission (i.e. the
provision of mission-related services and goods)? This is a optimization problem, in
which a nonprofit manager’s goal is to choose a combination of revenue streams (i.e. a
portfolio) that can maximize the organization’s services (i.e. expected portfolio return)
given her level of risk tolerance, or alternatively, a revenue mix that can minimize the
unexpected changes (i.e. portfolio risk) given a certain level of services (Kingma, 1993).
To answer this question, I analyze the National Center on Charitable Statistics (NCCS)-
GuideStar National Nonprofit Research Database (“digitized data”) between 1998 and
2003. The five revenue sources explored in this paper include contributions and grants;
land, buildings, and equipment for investments; savings and temporary cash investments;
securities; and sales from special events and activities. For each of the four major
nonprofit subsectors (arts, culture, and humanities; education; health; and human services)
and the whole sample, I examine the expected return and risk characteristics of the five
nonprofit revenue sources as well as the correlations between the returns on revenue
sources. I then demonstrate how to use the information to identify efficient frontiers for

36
nonprofits in different industries, based on which a nonprofit manager can select the
optimal revenue mix that minimizes the risk given her preferred level of service
provision. I find that the specific expected return and risk characteristics of individual
revenue sources, as well as efficient frontiers, vary by each subsector. Regardless, similar
patterns hold across different subsectors. Contributions and grants are the riskiest (and
most rewarding) revenue source among all, and the return from contributions and grants
has significant and high correlations with the returns on savings and temporary cash
investments, and securities. Comparing HHI and the portfolio risk based on the MPT
approach, I find that revenue mixes with a small number of revenue sources, or a high
level of revenue concentration as indicated by HHI, do not always have high portfolio
risk; and lower levels of HHI exhibit no associations with optimal revenue mixes.
This paper makes methodological and theoretical contributions by correctly
applying the MPT approach to studying nonprofit finance, which, as shown from the
results, is better than the HHI approach in guiding nonprofit revenue strategies. In the
following sections, I will first summarize the literature on nonprofit revenue
diversification and introduce modern portfolio theory. Then, I will describe methods,
followed by a discussion on data. Next, I will present the results on the characteristics of
revenue sources and the efficient frontiers by subsector and the whole sample, and
compare HHI and MPT. Finally, I will conclude by discussing the contributions and
limitations of this study, along with plans for future research.
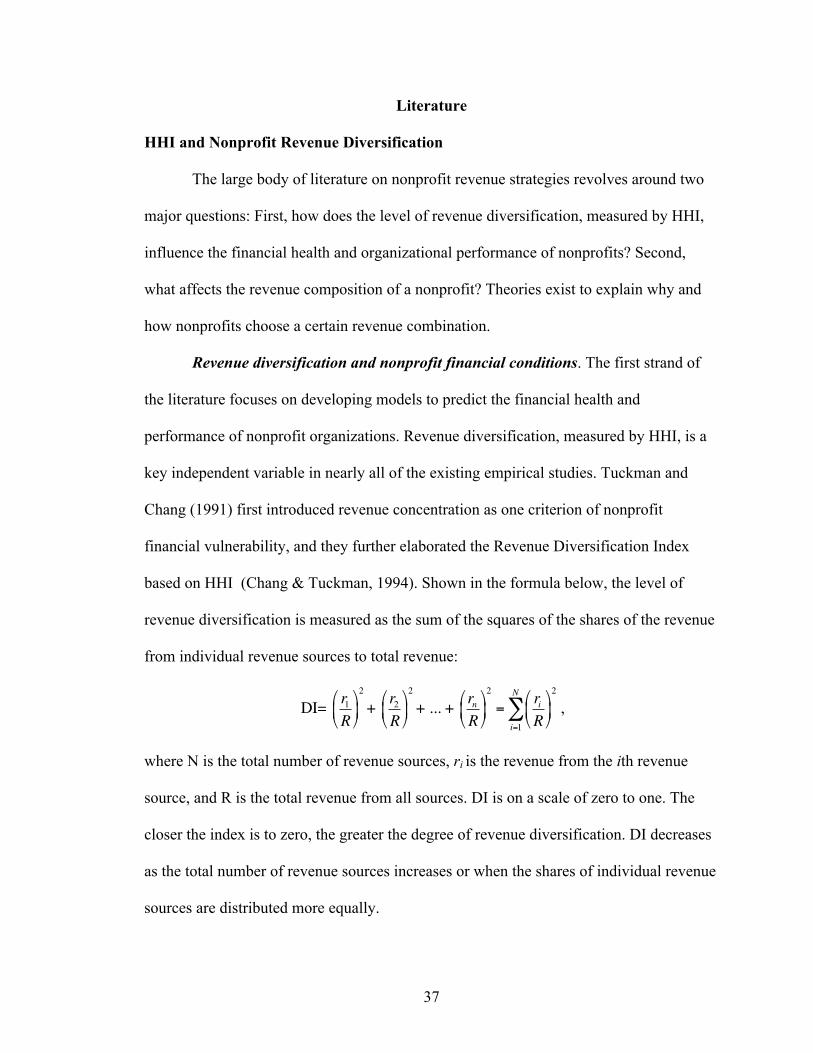
37
Literature
HHI and Nonprofit Revenue Diversification
The large body of literature on nonprofit revenue strategies revolves around two
major questions: First, how does the level of revenue diversification, measured by HHI,
influence the financial health and organizational performance of nonprofits? Second,
what affects the revenue composition of a nonprofit? Theories exist to explain why and
how nonprofits choose a certain revenue combination.
Revenue diversification and nonprofit financial conditions. The first strand of
the literature focuses on developing models to predict the financial health and
performance of nonprofit organizations. Revenue diversification, measured by HHI, is a
key independent variable in nearly all of the existing empirical studies. Tuckman and
Chang (1991) first introduced revenue concentration as one criterion of nonprofit
financial vulnerability, and they further elaborated the Revenue Diversification Index
based on HHI (Chang & Tuckman, 1994). Shown in the formula below, the level of
revenue diversification is measured as the sum of the squares of the shares of the revenue
from individual revenue sources to total revenue:
DI= r1R!
"#
$
%&
2
+ r2R!
"#
$
%&
2
+ ... + rnR!
"#
$
%&
2
=riR!
"#
$
%&
2
i=1
N
∑ ,
where N is the total number of revenue sources, ri is the revenue from the ith revenue
source, and R is the total revenue from all sources. DI is on a scale of zero to one. The
closer the index is to zero, the greater the degree of revenue diversification. DI decreases
as the total number of revenue sources increases or when the shares of individual revenue
sources are distributed more equally.

38
Tuckman and Chang (1991) initiated the line of research on nonprofit financial
vulnerability. They defined financially vulnerable nonprofits as those “likely to cut back
its service offerings immediately when it experiences a financial shock” (p.445). While
Tuckman and Chang did not offer an operational definition of financial vulnerability,
other scholars operationalized the definition, using measures as a reduction in program
expenses or a decrease in net assets (e.g., Greenlee and Trussel, 2000; Trussel, 2002;
Frumpkin and Keating, 2011). In general, these studies report a statistically significant
positive correlation between revenue concentration and financial vulnerability of
nonprofit organizations, suggesting that revenue diversification is a rewarding strategy
for nonprofit financial health.
The other line of research, also using HHI as an indicator of revenue
diversification, concentrates on revenue volatility, and generally finds that nonprofits
with a higher level of revenue diversification experience lower revenue volatility. In
addition to this general finding, Carroll and Stater (2009) admit that the “positive effect
of diversification on revenue stability does not capture possible trade-offs [crowding out]
between funding sources, for instance earned income crowding out private donations” (p.
962). Mayer and his colleagues (2012) point out that simply increasing the level of
revenue diversification does not necessarily reduce revenue volatility, and that “the
impact of a change in diversification depends very much on the composition change of a
portfolio” (p.15). Wicker and her colleagues (2013) report that revenue diversification
has a greater impact in reducing club-specific volatility than systematic volatility for a
sample of German sports clubs, which is consistent with modern portfolio theory.

39
In contrast, a few studies provide evidence in favor of revenue concentration.
Grønbjerg (1992) find that human service organizations with high reliance on a single
institutionally based revenue source scored higher in organizational success (e.g.
surpluses, fund balances). Similarly, a study of 144 nonprofits whose annual revenue had
increased to at least $50 million since 1970 shows that most of these organizations grew
by concentrating on a single revenue source that offered a good match for their work
(Foster, Kim, & Christiansen, 2009). Two other studies that use HHI to measure revenue
diversification (concentration) also report similar results. Frumpkin and Keating (2011)
note that the rewards of revenue diversification (i.e. financial health) are achieved at the
cost of organizational efficiency (i.e. administrative expenses, fundraising expenses, and
fundraising efficiency). Chikoto and Neely (2014) suggest that revenue concentration,
rather than revenue diversification, contributes to the financial capacity growth of
nonprofits.
Factors of nonprofit revenue composition. Nonprofit organizations vary in their
revenue composition. For example, private contributions are the most important revenue
source for arts, culture, and humanities organizations, while private payments for goods
and services account for a significant portion of total revenue for education, health, and
human service organizations (Roeger, Blackwood, & Pettijohn, 2012). Therefore, another
strand of literature focuses on the factors that affect nonprofit revenue composition. Some
empirical studies find that the level of revenue diversification varies by types of nonprofit
activities as well as types of organizations. For instance, commercial nonprofits have
higher revenue concentration than donative nonprofits; nonprofits with high fundraising
expenditures have a higher level of revenue diversification (Chang & Tuckman, 1994).
40
Some studies find that a nonprofit’s revenue mix is determined by the nature of the
services it provides. Contrary to the findings of Chang and Tuckman (1994), Fischer, et
al. (2011) report that nonprofits offering private benefits to a specific group of individuals
rely more on earned income and have more diversified revenue streams. In contrast, those
providing public benefits to the general public depend more on donations and have a
higher level of revenue concentration.
Scholars from different disciplines offer different explanations on the choice of
nonprofit revenue composition. Institutional theory posits that nonprofits seek
heterogeneous revenue sources to increase their legitimacy and recognition in a
community (Bielefeld, 1992). Resource dependence theory suggests that nonprofit can
achieve funding stability and organizational success by concentrating on a few revenue
sources as they develop a long-time relationship with a few funders (e.g. Grønbjerg,
1992; Froelich, 1999). According to the “multiattribute utility theory,” nonprofit portfolio
decisionmaking is influenced by many stakeholders’ perspectives and utilities (Kearns,
2007). Young’s (2007) normative theory suggests that nonprofits should choose an
income portfolio that reflects the mix of benefits it provides in addition to the financial
management concerns (e.g., feasibility, interactions, solvency, risk, mission). Last but not
the least, the economics perspective of objective maximization rationalizes nonprofit
behavior as objective-maximizing activities subject to some known constraints (e.g.,
Weisbrod, 1988; Hansmann, 1987; James, 1983). For example, Chang and Tuckman
(1990; 1991) hypothesize that nonprofit managers are motivated by a desire to increase
surplus to accumulate wealth and equity. As a result, nonprofit managers consciously
pursue a diversified revenue mix to manage financial risk and reduce financial

41
vulnerability. The objective maximization perspective has been also applied to model
optimal fundraising expenses (Steinberg, 1991) and optimal rates and structures of
membership dues (Steinberg, 2007). As to the choice of revenue composition, nonprofits
either seek to maximize their mission-related services given a level of risk tolerance; or
minimize the financial risk for a chosen level of services (Kingma, 1993). This paper
follows the economic perspective of objective maximization.
The existing research offers much insight into nonprofit revenue management but
provides little guidance on what is an optimal combination of revenue sources. For the
majority of research debating on revenue diversification versus concentration, HHI is not
a stable indicator of revenue diversification. Hence, it is important to develop a more
refined measurement of revenue diversification, which is the MPT approach discussed
below.
Modern Portfolio Theory and Nonprofit Finance
Modern portfolio theory and its key insights. Harry Markowitz, through his essay
“Portfolio Selection” (1952) and book Portfolio Selection: Efficient Diversification of
Investments (1959), developed the theory of portfolio choice, which establishes the
foundations of the modern portfolio theory. For his pioneering contributions to the theory
of financial economics and corporate finance, Harry Markowitz, along with Merton
Miller and William Sharpe, was awarded the Nobel Prize in Economic Sciences in 1990.
MPT suggests that the purpose of portfolio analysis is to find portfolios that best meet the
objectives of an investor (Markowitz, 1975, p.3). Investors can make their portfolio
choices by balancing the expected return and risk of a portfolio, also known as the mean-
42
variance analysis. The risk of a portfolio depends on the variance of return on each
individual asset as well as the pairwise covariances of returns on assets. Therefore, a
well-diversified portfolio can mitigate risk by considering both the variances and
covariances.
MPT offers three important insights to portfolio selection. First, “A good portfolio
is more than a long list of good stocks and bonds” but “a balanced whole” (Markowitz,
1975, p.3). Investments are risky due to the uncertainty of the returns on securities.
However, what matters to an investor is not the risk of an individual security, but its
contribution to the risk of the whole portfolio.
Second, returns on securities are correlated. It implies that diversification could
not eliminate the risk of a portfolio simply by adding as many securities as possible. “One
hundred securities whose returns rise and fall in near unison afford little more protection
than the uncertain return of a single security” (Markowitz, 1975, p.5). Rather,
diversification reduces portfolio risk by selecting securities with low or negative
correlations with each other.
Third, there is a tradeoff between expected return and risk, that is, high risk is
generally associated with high expected return, whereas low risk with low expected
return. As such, the analysis of portfolios involves the considerations of both return and
risk. “The proper choice among efficient portfolios depends on the willingness and ability
of the investor to assume risk” (Markowitz, 1975, p.6). Using the mean-variance analysis,
MPT suggests that investors can deliberately choose the proportions of individual
securities so to minimize the risk of the portfolio for a given level of expected portfolio
return, or maximize the expected return for a given level of risk.

43
MPT was developed for to help investors to choose security investments given
their risk preferences, but can be varied to apply for the analysis of nonprofit revenue
mixes. Markowitz referred to investors’ other sources of income as “exogenous assets”
(p.34):
For a private investor this might include a salary; for a university it would include tuition and endowments. These other sources of income are not irrelevant to the portfolio selection decision. It is desirable to choose a portfolio whose performance will not be too highly correlated with the investors’ other income. It is undesirable to have a portfolio perform worst when it is needed most. Such considerations may be handled formally by including other sources of income as a fictitious security or “exogenous asset.” The holding of this asset is not subject to choice in the analysis, but the correlations of its income with the yields of securities will influence the selection of portfolio. The Kingma Model and Nonprofit Financial Risk. Kingma (1993) applied MPT
to nonprofit financial stability and developed a model to help nonprofit managers
determine the optimal level of revenue diversification. Drawing an analogy between
corporate and nonprofit finance, Kingma interpreted the goal of nonprofit managers as to
“provide a certain level of services (a given level of expected return) while minimizing
unpredictable changes in revenues (risk)” (p. 105). “The expected revenue of a portfolio
for a nonprofit organization is the weighted sum of the expected revenues from each of
the organization’s revenue sources” (P.109). The risk, which he defined as the
unpredictability of a nonprofit’s revenue, “is a weighted sum of the variance and
covariance of its individual revenue streams” (p. 109). Assuming a nonprofit derives all
its revenue (I) from two sources—government (G) and donations (D), Kingma modeled
the expected return 𝑅! and risk of a nonprofit’s revenue portfolio as follows (p. 110)1:
1 The equation (2) of 𝑉𝑎𝑟 𝑅! in Kingma (1993, p.110) is incomplete, which I correct in the above equation.

44
𝐸 𝑅! = 𝑘𝐸 𝑅! + 1− 𝑘 𝐸[𝑅!]
𝑉𝑎𝑟 𝑅! = 𝑉𝑎𝑟[𝑘𝑅! + 1− 𝑘 𝑅!
= 𝑘!𝑉𝑎𝑟 𝑅! + 1− 𝑘! 𝑉𝑎𝑟 𝑅! + 2𝑘 𝑘 − 1 𝐶𝑜𝑣 𝑅! ,𝑅! ,
where 𝑅! and 𝑅! are the net return expected from government sources and donations
respectively, and k is the percentage of net return from government sources. The Kingma
model suggests that, for a given level of expected return 𝐸 𝑅! , the optimal level of
revenue diversification—the choice of 𝑘 that minimizes the portfolio variance
𝑉𝑎𝑟 𝑅! )—depends on both the variances of individual revenue sources and the
covariance between the sources.
Through this pioneering work, Kingma sent out invitations for more research
along this line. He also suggested future studies to test his model in different subsectors,
because “covariance of revenue sources across nonprofit organizations of different types
is irrelevant for the policy that an individual nonprofit organization must make” (p.113).
However, the Kingma model received little attention over the past 20 years, with two
exceptions. The first one was by Jegers (1997), who in theory expanded the Kingma
model by interacting nonprofit managers’ risk attitudes with the efficient frontier.
Recently, based on the Kingma model, Grasse, et al. (2015) used the digitized data to
empirically identify the efficient frontier for nonprofit arts organizations. Unfortunately,
as with many other empirical studies on revenue diversification, Grasse, et al. (2015) did
not properly define “return.” This is important because proper measurement of return is
the cornerstone of portfolio analysis, which I will discuss in detail in the following
section.

45
Return Versus Revenue Growth. In addition to the concept of revenue
diversification, another common misunderstanding in the nonprofit literature is the
definition of return. The expected return on an investment is a fundamental concept in
portfolio analysis, which is often proxied by the average of historical returns on the
investment. In corporate finance, the gain (or loss) from an investment is called the return
on that investment. It has two components. One is the income component as an investor
receives cash dividends from owning the asset. The other is the capital gain or loss when
the value of the asset increases or decreases. The sum of the dividends and capital gain or
loss is dollar returns. It is more common to use percentage returns, which tell how much
an investor earns for each dollar invested. Percentage returns are calculated as the dollar
return of an investment at the end of a period divided by the beginning value of the
investment (Ross, Westerfield, & Jordan, 2008, p.369-371):
𝑃𝑒𝑟𝑐𝑒𝑛𝑡𝑎𝑔𝑒 𝑟𝑒𝑡𝑢𝑟𝑛
=𝐷𝑖𝑣𝑖𝑑𝑒𝑛𝑑𝑠 𝑒𝑛𝑑 𝑜𝑓 𝑎 𝑝𝑒𝑟𝑖𝑜𝑑 + 𝐶𝑎𝑝𝑖𝑡𝑎𝑙 𝑔𝑎𝑖𝑛 𝑙𝑜𝑠𝑠 𝑜𝑣𝑒𝑟 𝑡ℎ𝑒 𝑝𝑒𝑟𝑖𝑜𝑑
𝐵𝑒𝑔𝑖𝑛𝑛𝑖𝑛𝑔 𝑣𝑎𝑙𝑢𝑒 𝑜𝑓 𝑎𝑛 𝑖𝑛𝑣𝑒𝑠𝑡𝑚𝑒𝑛𝑡
Previous nonprofit literature calculated the “return” from a revenue source in
various ways. For example, Wicker et al. (2013) simply used the revenue from individual
revenue sources, without considering the revenue-generating expenses. In Grasse et al.
(2015, p.17), the return for a revenue source was calculated by subtracting the revenue
received in a year from that in the previous year. This approach represents the absolute
change in gross revenue. In Kingma’s model (1993, p.110), the return was defined as the
expected percentage change in net income, where net income is gross revenue net of
revenue-generating costs (p.110). By definition, this is the percentage change in net

46
income rather than percentage return. The net income or gross revenue from
contributions received in the previous year, for example, cannot be perceived as the
beginning value of this year’s “investment.” Unlike buying and holding a stock from the
market, nonprofit organizations do not hold contributions or grants and let their value
grow (or lose) over a period of time. Instead, they spend the income for charitable
purposes. Fundraising is thus like “buying” assets (i.e. contributions, grants) that
depreciate 100% within a year or two and the return on fundraising only comes from the
income component. In this paper, I take a step further by correctly applying the MPT
approach to empirical analysis, using the net rate of return rather than the change in gross
revenue or net income.
Method
It takes several steps to obtain the efficient frontier for nonprofit organizations in
each subsector. First, for each subsector, I calculate the average annual return for each
revenue source. Second, I compute the expected return and standard deviation of these
returns over the years in the database. Third, I develop the variance-covariance matrix
and correlation coefficients between the returns on each pair of revenue sources.
Expected Return and Risk
First, suppose that the nonprofit organization i has a total number of revenue
sources S. For an individual revenue source s, given the revenue Rev and the revenue-

47
generating expenses Exp, the annual return r on the revenue source s for the organization
i in year t: 2
𝑟!"# =𝑅𝑒𝑣!"# − 𝐸𝑥𝑝!"#
𝐸𝑥𝑝!"#,
where s takes values from 1 to S, i takes values from 1 to I, t takes values from 1 to T.
Second, calculate the annual average return e(r) on individual revenue sources for
each subsector, and then obtain the expected return 𝐸(𝑅!) as the average return on source
s in the past:
𝑒 𝑟!" =1𝐼 𝑟!"#
!
!!!
, 𝑖 = 1, 2,… , 𝐼
𝐸 𝑅! =1𝑇 𝑒 𝑟!"
!
!!!
, 𝑡 = 1, 2,… ,𝑇
Third, compute the variance 𝜎!and standard deviation 𝜎 (risk) of the return on
each revenue source s:
𝜎!! = 𝑒(𝑟!")− 𝐸(𝑅!) !!
!!!
/(𝑇 − 1)
𝜎! = 𝑒(𝑟!")− 𝐸(𝑅!) !
!
!!!
/(𝑇 − 1)
Fourth, compute covariances and correlation coefficients between returns on each
pair of revenue sources. For example, given the annual returns of two revenue sources,
2 I use net income and expenses to obtain returns on total contributions and grants, and special events and activities. For savings and temporary cash investments, land, buildings, and equipment, and securities, I use net income and average investments to calculate returns. See the Data section for details.

48
𝑟!" and 𝑟!", the covariance 𝑐𝑜𝑣 𝑟! , 𝑟! and correlation coefficient 𝜌!" are calculated
respectively as:
𝑐𝑜𝑣 𝑟! , 𝑟! =(𝑒(𝑟!")− 𝐸(𝑅!))(𝑒(𝑟!")− 𝐸(𝑅!))!
!!!
𝑇 − 1
𝜌!" =𝑐𝑜𝑣 𝑟! , 𝑟!
𝜎!𝜎!
Fifth, the portfolio weight w of a revenue source is the share of the investment (or
expenses) in total portfolio investments (or total revenue-generating expenses). Given the
weight w of expenses (or average investments over a year) on each revenue source s in a
portfolio P, the portfolio return E (RP) is the weighted average return of the revenue
sources in the portfolio:
𝐸 𝑅! = 𝑤!𝐸 𝑅!
!
!!!
,
𝑤ℎ𝑒𝑟𝑒 𝑠 = 1, 2,… , 𝑆,𝑎𝑛𝑑 𝑤!
!
!!!
= 1
Finally, obtain the portfolio variance 𝜎!! and portfolio risk 𝜎!. The variance of a
portfolio combination is equal to the weighted average covariance of the returns on
individual revenue sources:
𝜎!!= 𝑤!𝑤!𝐶𝑜𝑣(𝑟!!
,!
𝑟!) = 𝑤!𝑤!𝜎!𝜎!𝜌!"!!
𝜎!= 𝑤!𝑤!𝜎!𝜎!𝜌!"!!
49
Efficient Frontier of Revenue Sources
According to MPT, all possible combinations of assets can be plotted in a risk-
return space. The collection of all these possible combinations defines a region in this
space, which is the feasible set. When there is no risk-free asset, the upward-sloped upper
boundary of this region is the efficient frontier, which is a collection of efficient portfolios
with the lowest portfolio risk for a given level of portfolio expected return or the highest
expected return for a given level of risk. When there is a risk-free asset available, the
efficient frontier is the tangent line starting from the vertical axis where the return on the
risk-free asset locates. Any portfolio above the frontier is not feasible and cannot be
achieved. Any portfolio within the feasible set but not on the efficient frontier is sub-
optimal because the portfolio that lies directly above it on the efficient frontier has higher
expected return for the same level of risk. Identifying the efficient frontier is thus to find
the set of efficient portfolios (Markowitz, 1952; 1959; Chen, Chung, Ho, & Hsu, 2010).
[Figure I-1 here]
Mathematically, the portfolio optimization problem can be formulated as solving
for the weights of investments in a portfolio by minimizing the portfolio risk for each
target level of expected portfolio return, subject to the weights summing up to one and all
weights are positive (no short sales) (Hubbert, 2012).

50
Min
𝜎!!= 𝑤!𝑤!𝐶𝑜𝑣(𝑟!!
,!
𝑟!)
Subject to
𝐸 𝑅! = 𝑤!𝐸 𝑅!!!!! = 𝑑∗, where 𝑑∗ is the target expected return,
𝑤!!!!! = 1,
𝑤! ≥ 0, 𝑠 = 1, 2,… , 𝑆
The portfolio optimization problem with the inequality constraint is a quadratic
programming problem, which is to minimize a function of the form !!𝑥!𝐷𝑥 − 𝑑!𝑥 subject
to one or more constraints of the form 𝐴!"! 𝑥 = 𝑏!" (𝑙 equality constraints) and 𝐴!"#! 𝑥 ≥
𝑏!"# (𝑚 inequality constraints), where 𝐷 is an 𝑛×𝑛 matrix, 𝑥 and 𝑑 are 𝑛×1 vectors,
𝐴!"#! is an 𝑚×𝑛 matrix, 𝑏!"#is an 𝑚×1 vector, 𝐴!"! is an 𝑙×𝑛 matrix, and 𝑏!"is an 𝑙×1
vector. Equivalently, the above portfolio optimization problem can be written as:
Min 𝑤!Σ𝑤 − 𝑞×𝑑!𝑤,
where 𝑤 is the vector of weights, equivalent of 𝑥,
Σ is the covariance matrix of returns of the revenue sources, equivalent of 𝐷,
𝑞 ≥ 0 is the level of risk tolerance: 𝑞 = 0 works to minimize portfolio variance, 𝑞 = ∞
works to maximize portfolio return,
𝑑 is the vector of expected returns,
𝑤!Σ𝑤 is the variance of portfolio returns,
𝑑!𝑤 is the expected return of the portfolio.
51
For the objective function, set 𝐷 = 2×Σ, 𝑞 = 0, and 𝑑 = (0,… ,0)′, then we have 𝑤!Σ𝑤.
For the 𝑙 = 2 equality constraints 𝑤!𝑑 = 𝑑!𝑤 = 𝑑∗and 𝑤!1 = 1!𝑤 = 1, set 𝐴!"!
(2×𝑛) =
𝑑′1′
and 𝑏!"(2×1) =
𝑑∗1 , we have 𝐴!"! 𝑥 ≡
𝑑′1′
𝑤 = 𝑑∗1 . For the 𝑚 = 𝑛 inequality
constraints 𝑤 ≥ 0 (𝑛 is the number of revenue sources), set 𝐴!"#!
(𝑛×𝑛) = 𝐼! and 𝑏!"#(𝑛×1) =
0⋮0
, we have 𝐴!"#! 𝑥 ≡ 𝐼!𝑤 = 𝑤 ≥ 0. We can then use the R package quadprog function
to solve this quadratic programming problem and find efficient portfolios.
Data
Variables
The paper uses a sample of public charities from the National Center on
Charitable Statistics (NCCS)-GuideStar National Nonprofit Research Database
(“digitized data”). The database includes tax-exempt nonprofit organizations that are
required to file IRS Form 990 or 990-EZ between 1998 and 2003 (NCCS, n.d.).3 The
time period of the database is not ideal as it covers the U.S. stock market’s Dom Com
Bubble Burst in the late 1990s followed by the early 2000s economic recession.
Nonetheless, the digitized data provide the most detailed financial information that is
necessary for calculating the expected return and risk of revenue sources. Part I of Form
990 provides information on revenue and expenses, which are recognized when they are
measurable and earned if using the accrual basis of accounting. Part IV of Form 990 is a
3 Congregations and organizations with less than $25,000 in gross receipts are not required to file Form 990 and thus not included in the database (NCCS, n.d.).

52
balance sheet that presents an organization’s assets and liabilities (beginning and end of
year). The digitized data include a variety of revenue source categories, and this paper
analyzes the following categories: 1) voluntary contributions and grants, 2) savings and
temporary cash investments, 3) securities, 4) land, buildings, and equipment, and 5)
special events and activities.4
Voluntary contributions and fundraising expenses. The IRS defines voluntary
contributions as any payments “for which the donor does not receive full retail value
from the recipient organization” (IRS, 2000, p.16). Voluntary contributions include those
that are received directly from the public (line 1a) and any payments from special events
that are in excess of the retail value of the goods or services sold. Voluntary contributions
also include those received indirectly from the public through federated fundraising
agencies (line 1b). Government grants (line 1c) are treated as contributions if their
primary purpose is to enable the recipient organization to further its exempt purposes
“rather than to serve the direct and immediate needs of the grantor” (IRS, 2000, p. 17).
Fundraising expenses (line 15) are defined as “the total expenses those incurred in
4 Several revenue sources are not included in the analysis. First, membership income is not included due to the lack of data on the corresponding expenses. Second, sales of inventory are also omitted because it is difficult to differentiate organizations that used smoothing production from those who did not. Third, program services are excluded from the analysis for two reasons. First of all, there are no data on the expenses associated with producing the services and goods for sale. Program service expenses reported on Form 990 are expenses of the organizations’ mission-related activities, which may include grants to individuals and organizations. Second, when a nonprofit receives program service revenue by charging for the tax-exempt services it provides, the nonprofit does not seek to maximize their net income from the program services. Many nonprofits offer program services at a discounted price and use income from other revenue sources to compensate for the loss (James, 1983). In corporate finance, there is little reason to invest in an asset when the expected return is negative. However, it is not rare for nonprofits to continue negative-return revenue activities, which serve their mission purpose but not financial objective. For these reasons, I do not consider the revenue from mission-related program services as a source for return maximization.

53
soliciting voluntary contributions” (IRS, 2000, p.21), which include: “publicizing and
conducting fundraising campaigns; soliciting bequests and grants from foundations or
other organizations, or government grants; participating in federated fundraising
campaigns; preparing and distributing fundraising materials; conducting special events
that generate contributions in addition to the retail value” (IRS, 2000, p.21). Form 990
reports how much a nonprofit spends on fundraising as well as how much contributions,
gifts, and grants it generates each year. Suppose a nonprofit manager chooses an amount
to spend on fundraising to obtain an amount of voluntary contributions and grants in
return, the annual return on fundraising 𝑟!" for a nonprofit i in year t can be written as: 5
𝑟!" =𝐶𝑜𝑛𝑡𝑟𝑖𝑏𝑢𝑡𝑖𝑜𝑛𝑠!" − 𝐹𝑢𝑛𝑑𝑟𝑎𝑖𝑠𝑖𝑛𝑔!"
𝐹𝑢𝑛𝑑𝑟𝑎𝑖𝑠𝑖𝑛𝑔!"
Savings and temporary cash investments include “interest-bearing checking
accounts, savings, and temporary cash investments, such as money market funds,
commercial paper, certificates of deposit, and U.S. Treasury bills or other governmental
obligations that mature in less than 1 year” (IRS, 2000, p.23). The return on savings and
temporary cash investments 𝑟!" of an organization i is the interest income (line 4) divided
by the average savings and temporary cash investments (line 46) held within year t,
where the average assets are calculated by dividing the sum of the beginning and end of
year assets by two.6
5 It is possible that the return on the current year’s fundraising (i.e. net contributions and grants) does not fully realize until the next year. I assume the lag effect of return on fundraising is sufficiently small so the formula is a reasonable approximation. 6 It is better to use the average of assets over a year rather than the beginning or ending value. First, operating assets can be bought and sold during a year, while the beginning and ending value represents information at a certain point. Second, income is earned over

54
𝑟!" =𝐼𝑛𝑡𝑒𝑟𝑒𝑠𝑡 𝑜𝑛 𝑠𝑎𝑣𝑖𝑛𝑔𝑠 𝑎𝑛𝑑 𝑡𝑒𝑚𝑝𝑜𝑟𝑎𝑟𝑦 𝑐𝑎𝑠ℎ 𝑖𝑛𝑣𝑒𝑠𝑡𝑚𝑒𝑛𝑡𝑠 !"
𝐵𝑒𝑔𝑖𝑛𝑛𝑖𝑛𝑔 𝑜𝑓 𝑦𝑒𝑎𝑟 𝑖𝑛𝑣𝑒𝑠𝑡𝑚𝑒𝑛𝑡𝑠!" + 𝐸𝑛𝑑 𝑜𝑓 𝑦𝑒𝑎𝑟 𝑖𝑛𝑣𝑒𝑠𝑡𝑚𝑒𝑛𝑡𝑠!" /2
Securities. The annual return on securities 𝑟!" of an organization i in year t is
calculated as the sum of dividends and interest from securities (line 5) and gains (or
losses) from sales of securities (line 8c, column (A)) divided by the average securities
held as investments in year t (line 54). 7
𝑟!" =𝐷𝑖𝑣𝑖𝑑𝑒𝑛𝑑𝑠&𝐼𝑛𝑡𝑒𝑟𝑒𝑠𝑡 !" + 𝐺𝑎𝑖𝑛(𝑙𝑜𝑠𝑠)!"
𝐵𝑒𝑔𝑖𝑛𝑛𝑖𝑛𝑔 𝑜𝑓 𝑦𝑒𝑎𝑟 𝑠𝑒𝑐𝑢𝑟𝑖𝑡𝑖𝑒𝑠!" + 𝐸𝑛𝑑 𝑜𝑓 𝑦𝑒𝑎𝑟 𝑠𝑒𝑐𝑢𝑟𝑖𝑡𝑖𝑒𝑠!" /2
Land, buildings, and equipment (LB&E). The annual return 𝑟!" on land, buildings,
and equipment (e.g., rental properties) held for investment purposes are expressed as net
rental income (line 6c) divided by the average investment assets in year t (55c).8
𝑟!" =𝑁𝑒𝑡 𝑟𝑒𝑛𝑡𝑎𝑙 𝑖𝑛𝑐𝑜𝑚𝑒 (𝑙𝑜𝑠𝑠) !"
𝐵𝑒𝑔𝑖𝑛𝑛𝑖𝑛𝑔 𝑜𝑓 𝑦𝑒𝑎𝑟 𝑖𝑛𝑣𝑒𝑠𝑡𝑚𝑒𝑛𝑡𝑠!" + 𝐸𝑛𝑑 𝑜𝑓 𝑦𝑒𝑎𝑟 𝑖𝑛𝑣𝑒𝑠𝑡𝑚𝑒𝑛𝑡𝑠!" /2
a year. Therefore, using the average assets would more accurately reflect the rate of return. 7 There are two issues with the ratio of return on securities. First, while securities are reported at their market value on audited financial statements, they could be reported as either book value or market value on Form 990 (IRS, 2000, p.24). The final sample includes only the organizations that followed GAAP and used accrual accounting, so it is reasonable to take the market value as a default. Second, the rate of return is calculated differently from the standard way, which is the sum of the cash component and capital gains (losses) on a security investment divided by the original cost of the investment. Form 990 does not contain information on capital gains or losses of securities, the change in the beginning and ending values of securities does not necessarily reflect capital gains (losses) result from the price change of securities. The change could also be caused by purchases or sales of securities. 8 Land, buildings, and equipment are reported at their book value, that is, their original cost minus accumulated depreciation (Form 990, p.24). I use net book value to calculate the return on LB & E investments. Note that a problem associated with this approach is that older assets may have a smaller rate of return than newer assets, because older assets have larger accumulated depreciation and thus a larger net book value.

55
Special events and activities. Special events “only incidentally accomplish an
exempt purpose. Their sole or primary purpose is to raise funds other than contributions
to finance the organization’s exempt activities. This is done by offering goods or services
that have more than a nominal value for a payment that is more than the direct cost of
those goods and services” (IRS, 2000, p.19). Examples of special events and activities
include “dinners, dances, carnivals, raffles, bingo games, other gambling activities, and
door-to-door sales of merchandise” (IRS, 2000, p.19). Special events may generate both
sales revenue (reportable on line 9a) and contributions (reportable on line 1). Treating
special events as an investment on which a nonprofit organization spends a certain
amount of expenses in order to obtain a certain amount of sales revenue (not including
contributions), the annual return on special events and activities 𝑟!" is written as net
income from special events (line 9c) divided by direct expenses other than fundraising
expenses (line 9b):
𝑟!" =𝑁𝑒𝑡 𝑠𝑎𝑙𝑒𝑠 𝑖𝑛𝑐𝑜𝑚𝑒 𝑓𝑟𝑜𝑚 𝑠𝑝𝑒𝑐𝑖𝑎𝑙 𝑒𝑣𝑒𝑛𝑡𝑠!"
𝐷𝑖𝑟𝑒𝑐𝑡 𝑒𝑥𝑝𝑒𝑛𝑠𝑒𝑠!"
Data Limitations and Cleaning
Form 990 has been publicly available since 1996 and is widely used as a source of
data for nonprofit finance research. However, the IRS Form 990 data have many
limitations, particularly regarding the accuracy of reported financial information (Keating
& Frumkin, 2003; Wing, Gordon, Hager, Pollak, & Ronney, 2006). By comparing the
Form 990 data with the audited financial statements (e.g. Froelich & Knoepfle, 1996;
Froelich, Knoepfle, & Pollak, 2000; Krishnan, Yetman, & Yetman, 2006) or with annual

56
reports to state regulatory agencies (Keating, Parsons, & Roberts, 2008; Krishnan &
Yetman, 2011), researchers revealed that some financial information reported on Form
990 is not consistent with the other documents. Specifically, quite a few studies find that
nonprofit organizations typically manipulate financial reporting on Form 990 by expense
allocation. To “improve” organizational efficiency on the form, nonprofits are found to
under-report fundraising and/or administrative expenses while over-reporting program
service expenses (Krishnan & Yetman, 2011; Keating et al., 2008; Krishnan et al., 2006;
Jones & Roberts, 2006; Urban Institute and Center on Philanthropy at Indiana University,
2004; Trussel, 2003). To minimize the unrelated business income taxes (UBIT),
organizations may shift revenue or expenses from taxable to tax-exempt activities (Omer
& Yetman, 2003; 2007).
Due to these data limitations, unusable, erroneous, or suspicious observations
need to be carefully eliminated based on several commonly used filters (e.g. Calabrese,
2013; Bowman, Tuckman, & Young, 2012; Tinkelman & Neely, 2010). The original
sample includes 1,388,480 observations, and the final sample has 135,672 observations
after the following steps of data cleaning.
Private Foundations. The original sample includes 99% of public charities and
1% of private foundations. These two types of organizations differ in their charitable and
financial activities. In addition, private foundations are required to file Form 990-PF,
which is different from Form 990 filed by public charities. Therefore, I exclude private
foundations from the original sample.
Form 990-EZ. The IRS allows small organizations (gross receipts < $100,000 and
total assets < $250,000) to file Form 990-EZ (IRS, 2000). Compared to Form 990, Form
57
990-EZ includes different line items of expenses and less detailed financial information.
There are about 20% of records filing 990-EZ in the original sample and they are
excluded.
Group Returns. The IRS allows a central organization to file a group return for its
affiliating organizations. Group returns (only 0.2% of the original observations) can bias
the sample with extremely large financials and are excluded. There are about 30%
observations that do not report whether or not they filed a group return. I follow the
previous literature to take the “unknown” type of returns as individual returns, because “it
is the most plausible default option for filers” (Bowman et al., 2012, p. 571).
Accounting methods other than accrual. Generally Accepted Accounting
Principles (GAAP) requires audited financial statements to be based on accrual
accounting methods. However, Form 990 reporting is not subject to GAAP (Keating &
Frumkin, 2003). Therefore 47 percent of the records use either cash-basis or “other”
accounting methods. The cash-basis method—recording revenue (expenses) when cash is
actually received (paid)—does not accurately reflect an organization’s financial
condition. For example, it does not reveal an organization’s unpaid bills (Bowman, 2011,
p.16). In contrast, accrual accounting records revenue (expenses) when they are earned
(incurred) (Keating & Frumkin, 2001). For example, it recognizes a purchase of services
as an expense when there is an invoice to be paid (Bowman, 2011, p.16). Although using
this filter means losing nearly half of the sample, it can be misleading to mingle the data
from both accrual and cash accounting. For example, a capital purchase is an expense
based on cash accounting; however, it is not an expense if using accrual accounting
because capital purchase does not cause change in net assets (Bowman et al., 2012). To

58
ensure the consistency, comparability, and reliability of financial reporting across
different nonprofit organizations, I follow previous literature to eliminate all the records
that are not based on the accrual method from the original sample (e.g., Bowman et al.,
2012).
Erroneous items. The Form 990 data may involve errors (Wing et al., 2006). First,
revenue items (Part I of Form 990) are not supposed to take negative values unless they
are reported as net income or (loss), such as net income or (loss) from rents (line 6c),
from sales of assets other than inventory (line 8c and 8d), from special events (line 9c), or
from sales of inventory (line 10c). Therefore, observations with negative revenue items
are excluded. In addition, for the revenue sources mentioned above, Form 990 requires
nonprofit organizations to report both gross revenue and expenses in order to calculate
net income or loss. Nonetheless, these expenses are not supposed to be negative. I take
the absolute value for a handful of negative expenses for each of these revenue sources.9
Second, I exclude the records reporting expenses erroneously, such as negative expenses
or individual expenses items in excess of total expenses. Additionally, there are a number
of records with zero expenses on program services (24%), management (31%),
fundraising (73%), or even total expenses (1%). It is hard to imagine how an organization
can function without any expenses on management or program services.10 Thus, the
records with 0 management, program services, and total expenses are all excluded. For
9 Some nonprofit organizations may insert negative expenses by error. Instead of subtracting expenses from gross revenue, they sum gross revenue and negative expenses for net income. Therefore, I use the absolute values to replace the negative expenses reported in the Revenue section of Form 990. On the other hand, gross revenue items should not be negative, so they are excluded instead. 10 It could be that some organizations did not break down total expenses into categories and only report a lump-sum number.

59
the fundraising expenses, I exclude the observations with 0 value when an organization
actually receives positive total contributions, gifts, or grants. Other erroneous items are
also eliminated, including observations with negative total assets, or those with an
unknown NTEE category.
A strongly balanced panel. After the above data cleaning steps, the sample size
drops to 306, 118. The subsector-level annual return on each revenue source is obtained
by computing the average of organizational annual returns from all organizations in a
subsector. To reduce any organizational heterogeneity that may impact the subsector-
level return, I keep a strongly balanced panel, using the annual information from the same
organizations for each year between 1998 and 2003. By only keeping organizations with
all six years’ data, the sample size is further reduced to 135,672 observations (22,612
organizations).
Table I-1 shows the data cleaning step by step. Table I-2 offers a comparison
between the original and the cleaned sample. In general, the observations in the new
sample have larger average total revenue and total end-of-year assets, but smaller total
expenses. Losing 90% of the data points may appear worrisome, but it can be more so
should I kept the erroneous or suspicious data to compute returns and risks, which would
lead to misleading results. It is also a common practice among previous studies using the
990 data to conduct rigorous data cleaning and obtain a much smaller analysis sample
(e.g., Yetman & Yetman, 2013; Calabrese, 2013; Bowman, Tuckman, & Young, 2012;
Tinkelman & Neely, 2010). Based on this sample, the results of this study is more
informative to large organizations than smaller ones.
[Table I-1 and I-2 Here]
60
Extreme and missing values of organizational annual returns. The analysis is
conducted using four subsamples (subsectors) and the whole sample. In calculating the
subsectoral annual returns on each revenue source, any organizations with extreme or
missing values for the organizational annual return of a revenue source are excluded
from the analysis with respect to that revenue source (Table I-3). First, there are some
extremely large or small values for the returns on individual revenue sources at the
organizational level. For example, in the subsample of arts, culture, and humanities
nonprofits, the largest value of organizational annual return from contributions and grants
is 61,328, while the median value 7.68. The smallest value of organizational annual
return from securities is -185, while the median value is 0.03. These extreme values could
be due to the idiosyncratic differences in organizations’ capabilities or because of
reporting errors. In either case, it is legitimate to exclude the extreme values from the
analysis and reduce the bias that they would bring to the annual average of returns at the
subsectoral level. I use the following exclusion criteria for extrems values. For
contributions and grants as well as special events, in each year, any data points that lie
more than three times the interquartile ranges (3*IQR) in each subsample and the whole
sample are labeled as extreme values. For the other revenue sources, using the 3*IQR
criteria would result in a significant loss of data points, so I only exclude the observations
with returns larger than 100% (or smaller than -100%).11 Second, there are also some
11 Note that rather than dropping all the observations with extreme values, I only exclude the extreme values from the analysis with respect to that particular revenue source. For example, an organization reporting an extremely large return on fundraising may not have an extreme value of the return on special events. Therefore, the organization is only

61
missing values. It is a missing value when an organization did not report a revenue source
or when the denominator (expenses or investments) in calculating the return is zero. After
excluding the extreme and missing values, a strongly balanced panel is maintained but
the number of organizations used for calculations varies by revenue sources. In general,
after excluding the extreme and missing values, the organizational annual returns on
revenue sources do not vary significantly by the level of organization size, as measured
by quintiles of organizations’ average total revenue, total expenses, and total assets. The
only exception is the return on rental properties, for which larger organizations tend to
have a higher level of return.
[Table I-3]
Results: Expected Return, Risk, and Efficient Portfolios
In this section, I present the expected return and risk characteristics of individual
revenue sources as well as the efficient portfolios and efficient frontiers for nonprofits in
different subsectors and in the whole sample. Based on the National Taxonomy of
Exempt Entities (NTEE) system, I examine four major nonprofit subsectors: 1) arts,
culture, and humanities (12% of the final sample); 2) education (14%); 3) health (17%);
and 4) human services (37%).12 Table I-4 presents the summary statistics of the
subsectors and the whole sample. I report three organizational size indicators: an
excluded when calculating the average fundraising return at the subsectoral level but kept in the analysis of the average return on special events. 12 The remaining 20 percent of the sample consists of miscellaneous types of organizations (e.g. environment, international, public and societal benefit, mutual benefit, religion-related), which I will not discuss by individual subsector in this paper due to the limited data points for these types of organizations. However, they are included in the analysis for the whole sample.

62
organization’s six-year average total revenue, six-year average total expenses, and six-
year average ending total assets (all values are inflation-adjusted to 2003 dollars). Seen
from the three indicators, the education organizations in the sample on average have the
largest size (revenue = $24.8M, expenses = $20.4M, assets = $85.8M), followed by
health organizations (revenue = $18.1M, expenses = $17.5M, assets = $98.2M). Arts,
culture, and humanities organizations are comparatively much smaller (revenue =
$4.35M, expenses = $3.68 M, assets = $12.3M). Human services subsector has the largest
number of organizations but the average size of human service organizations is the
smallest among the major subsectors (revenue = $3.86M, expenses = $3.66 M, assets =
$5.34M).
[Table I-4]
Arts, Culture, and Humanities
The subsample of the arts, culture, and humanities nonprofits includes 15,822
observations (2,637 organizations). Arts, culture, and humanities nonprofits, such as
theaters, museums, and historical societies, are those primarily to “promote appreciation
for and enjoyment and understanding of the visual, performing, folk, and media arts; the
humanities (e.g. archaeology, art history); history and historical events; and/or
communications (e.g. film, radio)” (NTEE, n.d.).
The summary statistics of organizational annual returns on individual revenue
sources can be found in Table I-5. At the subsector level, the annual return on a revenue
source is the average of the organizational annual return on that source over all active
organizations. To illustrate, there are 2,016 arts, culture, and humanities organizations

63
received contributions and grants for all the six years in the sample. By taking the
average of the organizational annual return of all the 2016 organizations, we get the
subsectoral annual return from contributions and grants for each of the six years between
1998 and 2003. The expected return on a revenue source at the subsector level is then the
six-year average of the subsectoral annual return, and the risk is the standard deviation of
the subsectoral annual return from the expected return. Table I-6 presents the expected
return and risk characteristics of revenue sources for the sample of arts, culture, and
humanities organizations. Fundraising for contributions and grants is the riskiest revenue-
generating activity (s=1.06), but it also comes with the largest expected return (r=9.05).
Special events and activities are also comparatively high-risk and high-reward (r=0.93,
s=0.05). In contrast, the returns from land, building, and equipment (LB&E) (r=0.032,
s=0.005), and saving and temporary cash investments (r=0.053, s=0.012), and securities
(r=0.047, s=0.031) are less riskier and less rewarding. Note the particular return and risk
characteristics of securities due to the special time period observed. Consistent with the
Dot Com Bubble Burst in the late 1990s and the following stock market crash, the return
on securities was high from 1998 to 2000 and then took a downturn from 2001. The
return on securities hit the bottom in the economic recession during 2002 and 2003. For
this particular time period, the return on securities may appear to be more risky than that
if observed during other periods.
[Table I-5, I-6]
Portfolio diversification is an attempt to find a number of revenue sources that
march to the beat of different drummers so that the odds that all sources will go down at

64
the same time become small. The drummers, or the correlation coefficients of the returns
on revenue sources, offer the key to a proper portfolio diversification. A correlation
coefficient, on a scale of -1 to 1, indicates how likely the returns of two revenue sources
move up and down together and to what degree their movements are driven by the same
market force (Investopedia, n.d.). A correlation coefficient of 1 means perfect positive
correlation, that is, the returns of two revenue sources move in the same direction with
the same magnitude 100% of the time. The closer the correlation coefficient is to 1, the
stronger the relationship between the returns of two revenue sources. On the other hand, a
correlation coefficient of -1 means perfect negative correlation, that is, the returns of two
revenue sources move in opposite directions with the same magnitude 100% of the time.
A correlation coefficient of zero indicates that there is no relationship between the returns
of two revenue sources, meaning that they are equally likely to move in the same
direction as to move in opposite directions. The closer the correlation coefficient is to 0,
the weaker the relationship between the two revenue sources.13 A well-diversified
portfolio (or revenue mix) is composed of revenue sources with little or low correlations
so that when the return from one source declines, there is a good chance that the returns
from the others increase.
For arts, culture, and humanities organizations, the returns from contributions and
grants, interest, and securities are significantly highly correlated with each other,
suggesting that the returns from these three revenue sources move up and down together
most of the time (Table I-7). For example, the correlation coefficient of the returns from
contributions and securities is 0.96, meaning that these two revenue sources, likely driven
13 Experienced investors in general take correlation coefficients equal or less than 0.7 as reasonably good but above 0.8 are poor for portfolio diversification (Anke, 2010).

65
by the same market force, move in the same direction nearly all the time. When the return
from contributions decreases, the return from securities follows in tandem. When the
return from contributions increases, so does that from securities. If starting from a single-
source portfolio consisted of 100% contributions, adding securities is not likely to
improve the portfolio by reducing the portfolio risk. In contrast, both rental properties
and special events have generally low correlations with the other revenue sources
(although not significant), so they may be used as risk-reducing sources in composing
diversified portfolios. This is why simply adding as many revenue sources as possible, as
HHI indicates, may not be productive in reducing portfolio risk but could drag down the
return of the whole portfolio.
[Table I-7]
Given the expected return/risk characteristics of the returns on individual revenue
sources, as well as the correlations between them, we can then find efficient portfolios
and plot the efficient frontier. Efficient portfolios are those with the minimum portfolio
risk for a given level of expected portfolio return or those with the maximum return for a
given level of risk. Table I-8 shows a range of efficient portfolios with different return
and risk combinations. Figure I-2 presents the efficient frontier, which is a collection of
efficient portfolios. A nonprofit manager can use the efficient frontier to obtain an
optimal portfolio for a certain level of risk or return. The lowest point of the efficient
frontier is the minimum variance portfolio, which has the smallest portfolio risk and
return (r=0.036, s=0.004). To achieve the minimum variance portfolio, an arts, culture,
and humanities organization needs to put 79% of its total investment in rental properties

66
and 21% in savings and temporary cash investments. Note that the weight of a revenue
source is the investment value of that source divided by the total portfolio value, not by
total revenue from the portfolio. Seen from Figure I-2, as the expected portfolio return
increases, so does the portfolio risk. The highest point of the efficient frontier is the
maximum return portfolio, which has the largest expected return but also the greatest risk
(r=9.049, s=1.063). To achieve the maximum return, an organization needs to invest 100%
in fundraising activities for contributions and grants. Because special events have a
decent level of return and a reasonably good correlation with contributions and grants,
including special events can mitigate the high risk involved in pursuing only
contributions and grants while achieving high levels of expected returns. A nonprofit
manager who is very risk-averse would choose the portfolios at the lower end of the
efficient frontier. Any portfolios below the frontier are feasible but sub-optimal because
they are dominated by the portfolios on the frontier.
[Table I-8 and Figure I-2 here]
Education
Nonprofit organizations in the education subsector are organizations like
preschools, elementary and secondary schools, universities, research institutes, and so on.
There are 19,326 observations (3212 organizations) in the subsample of education
nonprofits. Table I-9 exhibits the summary statistics of annual returns from revenue
sources at the organizational level. At the subsector level (Table I-10), contributions and
grants are still the revenue source with the largest expected return and risk (r = 9.32, s =
0.845), followed by special events (r = 1.133, s = 0.03). Rental properties, savings and

67
temporary cash investments, and securities are all low-risk and low-reward revenue
sources. Among them, rental properties are the least risky revenue source (r = 0.041, s =
0.003). Possibly due to the particularly volatile years for the U.S. stock market in this
study, securities make a less desirable revenue source (r = 0.052, s = 0.035), because they
have more volatility but smaller expected return than savings and temporary cash
investments (r = 0.058, s = 0.014). Comparing with the arts, culture, and humanities
organizations, the expected returns from contributions and grants, special events, and
rental properties for the education organizations are more rewarding and less risky.
[Table I-9, I-10]
Let us take a look at the correlation coefficients of the returns from each pair of
revenue sources (Table I-11). Contributions and grants, rents, interest, and securities are
all significantly highly correlated with each other, indicating that they tend to move up
and down together most of the time. That is, the portfolio combinations with any of these
four revenue sources would not necessarily be less risky than a single-source portfolio.
Special events, in contrast, have negative or low correlations (not significant) with the
other revenue sources and could be helpful in diversifying away portfolio risk.
[Table I-11]
Table I-12 lists the examples of efficient portfolios and Figure I-4 is the efficient
frontier for the education subsector. The minimum variance portfolio consists of 100%
investments in rental properties. Although rental properties approach risk-free, they do
not offer a decent level of expected return. As the level of portfolio expected return
increases, rental properties are dropped from the efficient portfolios. In contrast,

68
contributions and grants are highly risky but also highly rewarding. At the lower end of
the efficient frontier, where the portfolios have low levels of expected return and risk,
contributions and grants do not make a significant component of the portfolios due to
their high risk. As the portfolio return increases, the proportion of the investments for
contributions and grants also increases. At the higher end of the efficient frontier,
contributions and grants become a major revenue source of the high-reward portfolios.
The maximum return portfolio is a single-source portfolio with 100% investments for
contributions and grants. Consistent with the correlation coefficients discussed above,
securities are not used to compose any efficient portfolios. On the other hand, special
events can be used to form efficient portfolios in most cases for its negative or low
correlations with the other revenue sources.
[Table I-12, Figure I-4]
Health
As an important component of the U.S. nonprofit sector, the health subsector
includes a diversity of nonprofit organizations, such as hospitals, nursing homes,
counseling organizations, voluntary health associations, medical research centers, and so
forth. There are 3,872 health nonprofits (23,232 observations), accounting for 17 percent
of the nonprofit organizations in the sample. The annual returns from revenue sources at
the organizational and subsector level are reported in Table I-13 and 14, respectively.
Once again, contributions and grants are the revenue source with the largest expected
return and risk (r=11.437, s=0.474), followed by special events and activities (r=1.389,
s=0.042). Rental properties, savings and temporary cash investments, and securities are
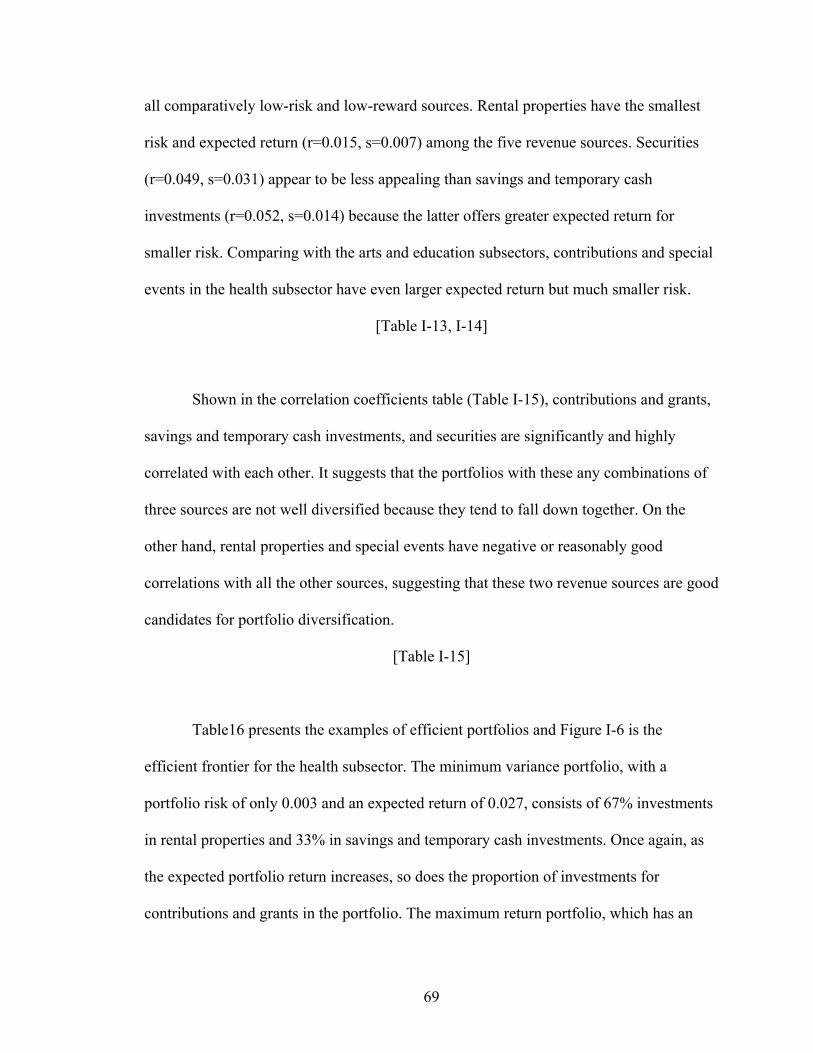
69
all comparatively low-risk and low-reward sources. Rental properties have the smallest
risk and expected return (r=0.015, s=0.007) among the five revenue sources. Securities
(r=0.049, s=0.031) appear to be less appealing than savings and temporary cash
investments (r=0.052, s=0.014) because the latter offers greater expected return for
smaller risk. Comparing with the arts and education subsectors, contributions and special
events in the health subsector have even larger expected return but much smaller risk.
[Table I-13, I-14]
Shown in the correlation coefficients table (Table I-15), contributions and grants,
savings and temporary cash investments, and securities are significantly and highly
correlated with each other. It suggests that the portfolios with these any combinations of
three sources are not well diversified because they tend to fall down together. On the
other hand, rental properties and special events have negative or reasonably good
correlations with all the other sources, suggesting that these two revenue sources are good
candidates for portfolio diversification.
[Table I-15]
Table16 presents the examples of efficient portfolios and Figure I-6 is the
efficient frontier for the health subsector. The minimum variance portfolio, with a
portfolio risk of only 0.003 and an expected return of 0.027, consists of 67% investments
in rental properties and 33% in savings and temporary cash investments. Once again, as
the expected portfolio return increases, so does the proportion of investments for
contributions and grants in the portfolio. The maximum return portfolio, which has an

70
expected return of 11.437 and risk of 0.474, consists of 100% investments for
contributions and grants. Due to its decent expected return and nice correlations with
other revenue sources, special events are included in most of the efficient portfolios
except for the minimum variance and maximum return portfolios. In contrast, securities
are not used in forming any of the efficient portfolios. Comparing with the arts and
education organizations, health organizations face much lower risk at high levels of
expected return.
[Table I-16, Figure I-6]
Human Services
Nonprofit human service agencies comprise a central piece of the U.S. nonprofit
sector and encompass a broad range of organizations and programs designed to enhance
the wellbeing of individuals, families, and the community as a whole, such as food
pantries, soup kitchens, shelters for homeless, job training centers, crime prevention
organizations, disaster preparedness and relief services organizations. Well-known
nonprofits like American Red Cross, United Way, and Salvation Army are all human
service organizations. This subsector has the largest number of organizations. There are
8,443 human service organizations (50,658 observations), which account for 37% of the
nonprofits in our sample. The subsample of human service organizations nonetheless has
the smallest size in terms of their six-year average total revenue ($3.86M), total expenses
($3.66M), and total assets ($5.34M) (Table I-3).
Shown in Table I-18, similar to the other subsectors, contributions and grants for
the human service organizations are the most rewarding and risky revenue source
(r=16.018, s=1.179), followed by special events (r=1.507, s=0.032). In fact, the expected

71
returns and risks of contributions and special events are larger than those in the other
subsectors. Once again, rental properties, savings and temporary cash investments, and
securities have comparatively smaller return and risk. Rental properties are still the least
risky revenue source that offers the smallest expected return (r=0.026, s=0.003).
Securities (r=0.043, s=0.025) are unattractive comparing with savings and temporary
cash investments (r=0.057, s=0.015), because securities have larger risk for smaller
expected return.
[Table I-17, I-18]
The correlation coefficients of the returns between contributions, savings and
temporary cash investments, and securities are significantly high and positive, indicating
they are driven by similar market forces and tend to move in tandem (Table I-19). On the
other hand, rental properties and special events have low or negative correlations with the
other revenue sources, which make them helpful for portfolio diversification.
[Table I-19]
Table I-20 presents a range of efficient portfolios and Figure I-8 is the efficient
frontier for human service nonprofits. As rental properties possess little volatility, they
are used to construct the efficient portfolios at the lower end of the efficient frontier. The
minimum variance portfolio is consisted of 98% of investments in rental properties and 2%
in special events. Similarly, because investments in contributions and grants can offer
large expected return, their weight in an efficient portfolio increases as the level of
portfolio return increases. The maximum return portfolio is the one consisted of full

72
investment in contributions and grants. Special events are used for diversifying away the
portfolio risk in most cases while securities are not used to form any efficient portfolios.
[Table I-20, Figure I-8]
The whole sample
We have seen similar patterns from the results by subsector. Finally, let us
examine the revenue sources regardless the types of organizations. In the whole sample,
there are 22,612 organizations and 135, 672 observations in total. These nonprofit
organizations on average have 34.8 million dollars in the six-year average total assets
(Table I-3). Similar to what we have found so far, the revenue source with the largest
expected return and risk is still contributions and grants (r=12.356, s=0.925). The second
place is special events and activities, with an expected return of 1.264 and a risk of 0.021.
Rental properties, savings and temporary cash investments, and securities are all in the
low-risk and low-reward category. Rental properties are nearly risk-free but they also
come with the smallest expected return (r=0.028, s=0.001). Comparing with cash
investments (r=0.054, s=0.014), securities (r=0.047, s=0.030) do not offer a decent level
of return given the associated risk (Table I-22).
[Table I-21, I-22]
The correlation coefficients of the returns from contributions and grants, savings
and cash investments, and securities are significantly high, meaning that these revenue
sources can offer little buffer to each other if included in one portfolio (Table I-23). In
contrast, both rental properties and special events have reasonably good correlations with
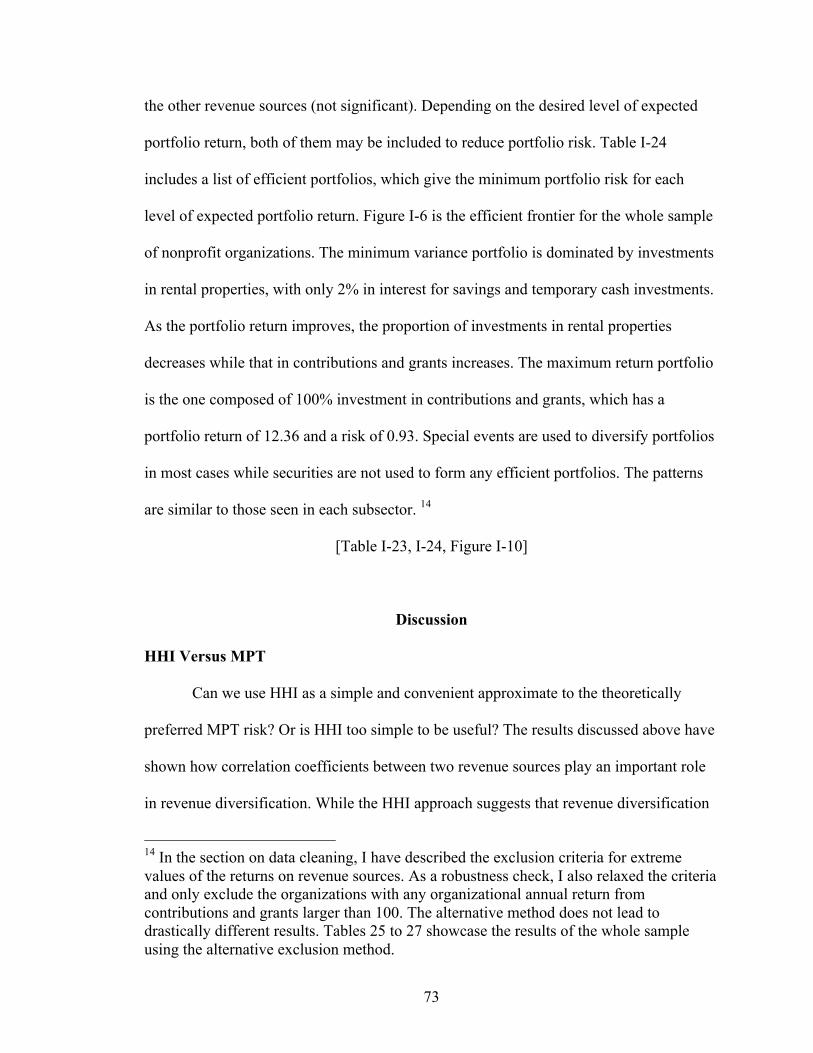
73
the other revenue sources (not significant). Depending on the desired level of expected
portfolio return, both of them may be included to reduce portfolio risk. Table I-24
includes a list of efficient portfolios, which give the minimum portfolio risk for each
level of expected portfolio return. Figure I-6 is the efficient frontier for the whole sample
of nonprofit organizations. The minimum variance portfolio is dominated by investments
in rental properties, with only 2% in interest for savings and temporary cash investments.
As the portfolio return improves, the proportion of investments in rental properties
decreases while that in contributions and grants increases. The maximum return portfolio
is the one composed of 100% investment in contributions and grants, which has a
portfolio return of 12.36 and a risk of 0.93. Special events are used to diversify portfolios
in most cases while securities are not used to form any efficient portfolios. The patterns
are similar to those seen in each subsector. 14
[Table I-23, I-24, Figure I-10]
Discussion
HHI Versus MPT
Can we use HHI as a simple and convenient approximate to the theoretically
preferred MPT risk? Or is HHI too simple to be useful? The results discussed above have
shown how correlation coefficients between two revenue sources play an important role
in revenue diversification. While the HHI approach suggests that revenue diversification
14 In the section on data cleaning, I have described the exclusion criteria for extreme values of the returns on revenue sources. As a robustness check, I also relaxed the criteria and only exclude the organizations with any organizational annual return from contributions and grants larger than 100. The alternative method does not lead to drastically different results. Tables 25 to 27 showcase the results of the whole sample using the alternative exclusion method.
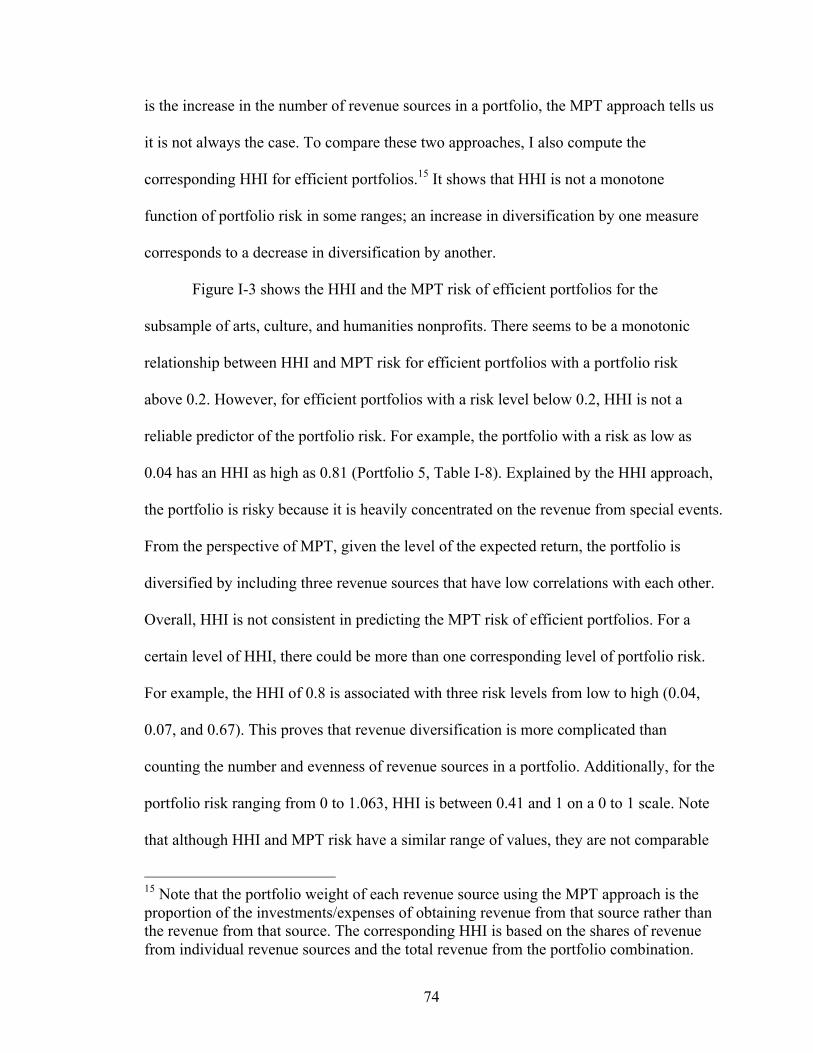
74
is the increase in the number of revenue sources in a portfolio, the MPT approach tells us
it is not always the case. To compare these two approaches, I also compute the
corresponding HHI for efficient portfolios.15 It shows that HHI is not a monotone
function of portfolio risk in some ranges; an increase in diversification by one measure
corresponds to a decrease in diversification by another.
Figure I-3 shows the HHI and the MPT risk of efficient portfolios for the
subsample of arts, culture, and humanities nonprofits. There seems to be a monotonic
relationship between HHI and MPT risk for efficient portfolios with a portfolio risk
above 0.2. However, for efficient portfolios with a risk level below 0.2, HHI is not a
reliable predictor of the portfolio risk. For example, the portfolio with a risk as low as
0.04 has an HHI as high as 0.81 (Portfolio 5, Table I-8). Explained by the HHI approach,
the portfolio is risky because it is heavily concentrated on the revenue from special events.
From the perspective of MPT, given the level of the expected return, the portfolio is
diversified by including three revenue sources that have low correlations with each other.
Overall, HHI is not consistent in predicting the MPT risk of efficient portfolios. For a
certain level of HHI, there could be more than one corresponding level of portfolio risk.
For example, the HHI of 0.8 is associated with three risk levels from low to high (0.04,
0.07, and 0.67). This proves that revenue diversification is more complicated than
counting the number and evenness of revenue sources in a portfolio. Additionally, for the
portfolio risk ranging from 0 to 1.063, HHI is between 0.41 and 1 on a 0 to 1 scale. Note
that although HHI and MPT risk have a similar range of values, they are not comparable
15 Note that the portfolio weight of each revenue source using the MPT approach is the proportion of the investments/expenses of obtaining revenue from that source rather than the revenue from that source. The corresponding HHI is based on the shares of revenue from individual revenue sources and the total revenue from the portfolio combination.

75
in cardinality. HHI takes ordinal values from 0 to 1, while MPT risk is cardinal and can
take any values.
Figure I-2 also shows the relationship between HHI and the expected return of
efficient portfolios. For efficient portfolios with an expected return below about 2, the
level of HHI fluctuates as the level of return increases. There appears to be a consistent
trade-off relationship between HHI and expected return for efficient portfolios with
higher levels of expected return, but a nonprofit manager will always end up with sub-
optimal portfolios if using HHI in the place of MPT risk to make portfolio selections.
[Figure I-3 here]
Similar patterns hold for nonprofits providing education (Figure I-5), health care
(Figure I-7), human services (Figure I-9), as well as for the whole sample (Figure I-11).
Despite the seemingly positive linear relationship between HHI and MPT risk for
efficient portfolios with higher levels of risk, HHI does not reliably or consistently
approximate the MPT risk at lower levels. A certain level of HHI may correspond to
more than one level of MPT risk. The non-monotonic relationship signifies that revenue
concentration is not always associated with high portfolio risk. The lower levels of HHI
do not appear in this chart because they are not feasible or inefficient portfolios.
[Figure I-5, I-7, I-9, I-11 here]
Figure I-4, I-6, I-8, and I-10 shows a similar pattern of the relationship between
the HHI and the expected return of efficient portfolios for education, health, human
services nonprofits, and for the whole sample. For the efficient portfolios with

76
comparatively lower levels of expected return, the level of HHI sways between moderate
to high as the level of return increases. For the efficient portfolios with higher levels of
expected return, the level of HHI increases as the expected return on efficient portfolios
rises. However, if replacing the MPT risk with HHI as a tool for portfolio selection, a
nonprofit manager will always obtain inefficient portfolios that are dominated by the
efficient portfolios on the efficient frontier.
Most previous studies suggest that HHI and nonprofit financial risk are
significantly negatively correlated, that is, a higher level of revenue concentration
predicts a higher level of financial vulnerability and volatility. In contrast, my finding
from all the subsectors and the whole sample indicate that low-risk efficient portfolios
can be achieved by revenue concentration. The HHI approach uses the number and shares
of revenue sources in a portfolio to predict risk, missing the co-movement of revenue
sources that is essential in the MPT analysis. Therefore, revenue concentration, as
indicated by a high HHI, does not always lead to a high portfolio risk. Using the approach
HHI as a tool to approximate risk in portfolio selections, a nonprofit manager would
always obtain sub-optimal portfolios, that is, falsely assuming more “risk” for a given
level of expected return. This would presumably lead to overly risk-averse behavior
among nonprofits.
Beyond Portfolio Optimization
Modern portfolio theory greatly simplifies portfolio selection as an objective
maximization problem. In addition to the expected return and risk of a portfolio, there are
nonetheless several additional choice constraints that are unique to nonprofit

77
organizations in deciding a revenue mix. The first constraint is the organizational
heterogeneity in the availability of funding streams. A revenue source could be more
readily available to some organizations than to others. For example, membership income
is only available to membership organizations. The income from the sales of a particular
good may not be available if the nature of the good is not sufficiently private or mission-
congruent. A non-excludable good cannot be charged therefore no fee income can be
derived from selling it. Generally speaking, private payments for services and goods are
primary revenue sources for education and health organizations, accounting for over half
of their total revenue. While private contributions constitute a significant portion of the
total revenue for arts and culture organizations, government funding flows more into
human service and health care organizations. Investment income, on the other hand, only
constitutes a small fraction of the total revenue for nonprofits (Roeger, et al., 2012).
The second is the constituency constraint, which comes from the differing
preferences of various types of stakeholders in the decisionmaking process of portfolio
selections. This constraint is minimal in a pure for-profit setting as there is a less
ambiguous goal common to shareholders—to increase the current stock value. In the
nonprofit sector, however, various stakeholders—donors, funders, customers,
beneficiaries—have different utility functions in evaluating the attributes of revenue
sources, such as their mission appropriateness, income significance, financial risk,
opportunity costs, impact on organizational autonomy, and so on (Kearns, 2007). This is
not contradictory with the MPT approach. In fact, a nonprofit manager can incorporate
the preferences of different stakeholders into the organization’s risk attitude or expected

78
service provisions, given which the nonprofit manager can find the optimal portfolio that
either maximizes the return or minimize the risk.
The third is the regulatory constraint. Different revenue activities may reflect
differently on an organization’s nonprofit status and mission purpose. In the U.S.,
nonprofits are governed by both state and federal laws. The state laws vary at the state
and local levels, meaning some portfolios may endanger the tax-exempt status of a
nonprofit. In addition, there has been an overall growth in fees for service, sales of goods,
investment income, and other types of commercial revenue in the past decades.
Regardless, the nonprofit sector is increasingly confronting a crisis in their nonprofit
identity, as it becomes more difficult to distinguish themselves from their for-profit
counterparts (Salamon, 2012). In the case that private fees for a service are highly
rewarding, it is still not appropriate for a nonprofit to make 100% investment in sales of
the service due to its nonprofit status. In fact, because nonprofits are exempt from
corporate income tax, there have been concerns about the “unfair” competition between
for-profits and nonprofits that rely heavily on commercial income (Weisbrod, 1998). In
the case that a nonprofit suffers from negative returns from a mission-fulfilling program
service, the organization could not withdraw from providing the service due to its mission
constraint. Rather, the nonprofit should maximize the return from other revenue sources
and use the income to cross-subsidize its mission-related programs (James, 1983). In a
for-profit setting, there are little reasons for investors to pursue an investment with
negative returns. This is also a reason that I left out the program service revenue from the
portfolio analysis.

79
Applying MPT to Nonprofit Finance: Caveats, Challenges and Future Research
Criticisms of MPT in Corporate Finance
Despite the theoretical and practical importance of MPT, we need to be aware of
the criticisms of MPT in corporate finance as well as the additional complications when
applying MPT to nonprofit finance. As a mathematical approximation based on a series
of assumptions, MPT has been criticized for not being able to really model the market.
For example, MPT assumes that returns on assets are normally distributed, while some
empirical evidence shows that markets more than often experience large swings, which
are 3 to 6 standard deviations from the mean (Mandelbrot & Hudson, 2004). Unlike what
MPT assumes, correlations between asset returns are not fixed over time. In fact, many
investments tend to become more positively correlated and move downward together
during financial crisis (Fustey, 2011). Some studies also provide counterexamples to the
tradeoff between risk and return (Murphy, 1977). Moreover, MPT has been criticized for
relying on historical data to predict future market performance. These criticisms are
relevant in a nonprofit setting. Due to data availability, the current study examined a
particular time period for the U.S. stock market and economy. The results show that
securities are not a desirable revenue source for nonprofit revenue mix optimization.
However, it would be interesting to examine the same revenue sources in other time
periods and test if their return and risk characteristics vary over time. It would also allow
us to determine with more confidence to what degree the nonprofit historical data can
predict future performance.
MPT has also received criticisms from behavioral finance. MPT assumes
investors are always rational, risk-averse, and seek to maximize their economic utility

80
without any other considerations (e.g., emotions). It also assumes investors always have
accurate projections of returns, and are interested in solving the mean-variance
optimization problem. However, behavioral finance has refuted these assumptions.
Instead of rational calculations, plenty of studies find that people often use heuristics
(rules of thumb) when making decisions under uncertainty, which can cause cognitive
biases and market inefficiency (e.g., Tversky and Kahneman, 1973; 1974; Thaler, 1992;
1999). In fact, investors may act overconfidently (e.g., Odean, 1998; 1999), underreact or
overreact to new market information (e.g., De Bondt and Thaler, 1985; Daniel,
Hirshleifer, & Subrahmanyam, 1998). Similarly, rather than being always risk averse,
prospect theory suggests that people’s attitudes toward risks may vary, depending on how
a problem is framed. Specifically, people tend to be risk-averse facing choices concerning
gains but risk-seeking facing choices involving losses (Kahneman and Tversky, 1979). In
general, behavioral finance describes how decisions under uncertainty are actually made.
On the other hand, MPT is a normative theory about how decisions under uncertainty
should be made. For this reason, MPT is still a valuable theoretical approach.
Challenges of MPT in Nonprofit Finance
There are differences between corporate and nonprofit finance and therefore
additional complications when applying a corporate finance concept to nonprofit finance.
First of all, when different for-profits purchase an asset from the market, they face the
same expected return and risk properties associated with that asset. However, when
different nonprofits pursuing a revenue source, such as donations from individuals, the
return on the source is determined by both the “asset-specific” factors common to all

81
organizations in a subsector and the “investor-specific” factors that are unique to an
organization’s characteristics in generating the revenue (e.g. the donor pool unique to an
organization). To illustrate, suppose the Art Institute of Chicago and Indianapolis
Museum of Art both conduct the same fundraising activities to obtain member donations
every year. Over time, they may observe different expected return and risk of member
donations due to their different member pools.
Conceptually, the risk of a nonprofit revenue source has three components
(Greenlee & Tuckman, 2007). In addition to the organization-specific risk that I have
discussed above, nonprofits also face a market risk that affects all nonprofits (e.g.,
economic recessions, changes in tax laws) and an industry risk that affects nonprofits in a
particular subsector (e.g., the industry-specific supply and demand for services or
government regulations). In this paper, I examined the correlations between the returns of
individual revenue sources for a specific time period without exploring the affecting
factors behind them. For example, what are the forces driving the co-movement of the
returns of contributions and securities? Do internal forces account for a bigger role in the
observed patterns of correlations than external forces? It would be meaningful for future
studies to decompose the three types of risk, examine what drives the movement of
returns, and how diversification influences each of the risk components.
Second, while MPT assumes linear rates of return on investments, nonprofits face
a changing marginal rate of return on fundraising, which may vary across different
nonprofits or different life stages of a nonprofit (Steinberg, 1986; Tinkelman, 2006). This
paper uses average return on fundraising, assuming that nonprofit organizations generally
realize the return on fundraising within a year and the marginal rate of return is constant

82
for the years observed. Future studies on nonprofit portfolio analysis need to model the
non-linear rate of return on fundraising.
Third, the Form 990 data provide a basis for this study to compare the results with
previous research. However, the data have many limitations. In the analysis of corporate
finance, each day represents a data point. In the digitized data, there are only six years’
data points, which may not be sufficient for observing the expected return and risk
properties of nonprofit revenue sources. More data points would also allow us to observe
if the correlations between revenue sources change over time. In addition, there are only
five revenue sources with complete information for analysis in this dataset. In reality,
nonprofit revenue sources are more granulated. My results show that the risk of
contributions and grants varies by different subsectors, which may be due to the different
compositions. For example, contributions include those directly from the general public,
those from members or loyal donors, those from United Way and other federated
campaigns, grants from foundations, or in-kind donations from corporates, among others.
Even government grants can come from different levels of government. Third, the sample
used in this study is abnormal in terms of the size of organizations. For the results to be
more practically meaningful, future studies should examine the expected return and risk
properties of more granulated revenue sources, possibly using a different dataset.
Conclusion
This paper applies modern portfolio theory to nonprofit revenue management and
challenges the predominant use of Herfindahl-Hirschman Index in studying revenue
diversification. HHI indicates that revenue diversification is achieved by increasing the

83
number of revenue sources and/or the equality of the shares of revenue in total revenue.
Contrary to HHI, MPT suggests that a portfolio (i.e. revenue mix) with 100 revenue
sources, which however move in the same direction, is not less risky than a portfolio with
only one source. In fact, according to MPT, a well-diversified portfolio is a combination
of assets whose returns do not move together all the time, that is, do not put all your eggs
in one basket. Just like an investor in the for-profit world, the objective of a nonprofit
manager is to deliberately choose a portfolio of revenue sources that can minimize the
risk of the portfolio for a given level of expected return (program services), or maximize
the expected return for a given level of risk. The expected return of a portfolio is
computed as the weighted average of the expected returns on individual revenue sources
which comprise the portfolio. The weights are the proportion of the investment/expenses
of individual revenue sources in total portfolio value. The risk (standard deviation) of a
portfolio depends on not only the variances of individual revenue sources in the portfolio
but also how the returns on the revenue sources vary together (covariance).
By analyzing the NCCS-GuideStar Digitized Data from 1998 to 2003, this paper
demonstrates how to find an optimal portfolio for a nonprofit using the MPT approach.
Due to the data limitations, the results on the properties of the five revenue sources are
more theoretically than practically suggestive. By subsector of nonprofits and in the
whole sample, I analyzed five revenue sources—contributions and grants; land, buildings,
and equipment for investment (rental properties); saving and temporary cash investments;
securities; and sales from special events. The results vary by subsectors but similar
patterns hold for all. Overall, among the five revenue sources, contributions and grants
are the revenue source with the highest expected return and risk, followed by sales from

84
special events. The other three revenue sources are comparatively less rewarding and less
risky. Note that securities generally do not have a desirable return and risk package. It
may be largely due to the observed time period (1998-2033) that covers the Dot Com
Bubble Burst in the late 1990s and the economic recession in the early 2000s during
which the U.S. stock market and economy experienced unusual ups and downs. In
general, special events and rental properties have low correlations with contributions and
grants (but insignificant) and therefore could be helpful in portfolio diversification and in
mitigating some of the high risk associated with contributions and grants. In contrast,
saving and temporary cash investments, securities, and contributions and grants present
significant and high correlations with each other across subsectors, meaning that they
tend to move together and may not be good candidates for revenue diversification. For
the four subsectors—arts, culture, and humanities; education; health; and human
services—and the whole sample, I also identified the efficient frontier, which is a
collection of efficient portfolios.
More importantly, I compared the HHI with the MPT risk of efficient portfolios
and find a non-monotonic relationship between the two. For a certain level of HHI, there
could be more than two corresponding levels of portfolio risk. For very low levels of
portfolio risk, HHI can be as high as 1. It suggests that revenue concentration, as
indicated by HHI, may not always cause high portfolio risk. In general, the efficient
portfolios in my analysis have HHI ranging from around 0.5 to 1, which indicates the
efficient portfolios are concentrated. On the other hand, the portfolios with lower levels
of HHI, although more “diversified,” are not efficient portfolios. If using HHI to
approximate risk and to guide portfolio selections, nonprofits will always end up

85
choosing sub-optimal portfolios, that is, assuming greater risk for a certain level of return.
The findings cast cautions to future studies using HHI as a measure for revenue
diversification to predict nonprofit financial health.
This paper is among the first to properly apply modern portfolio theory to
nonprofit revenue management. It addresses two common misbeliefs in previous
literature. First, portfolio analysis is based on net return rather than the change in gross
revenue; second, revenue diversification involves evaluating the covariances of revenue
sources rather than naively adding more revenue sources to a portfolio of revenue
combination. My findings pose a challenge to the predominant approach in previous
studies and suggest that HHI is unreliable in guiding revenue mix selections. I propose
that MPT can be theoretically and practically more helpful in guiding nonprofit revenue
management as it offers a more sophisticated guidance to what is the optimal revenue
combination rather than a rough categorization of revenue diversification or
concentration.

86
Table I-1. Data Cleaning Original sample size
1,388,480
Less: private foundations
14,645 Less: organizations filing 990-EZ
282,032
Less: group returns
2,880 Less: organizations not reporting on the accrual basis
435,748
Less: organizations with reporting errors in revenue items1 2,240 Less: organizations with reporting errors in expenses2
337,416
Less: organizations with negative or 0 assets
6,715 Less: organizations with unknown NTEE code
686
Less: organizations reporting 0 or negative functional expenses 1,279 Less: organizations with missing years
169,167
Final sample size
135,672 Notes: 1. Organizations reporting negative gross revenue items
2. Organizations reporting negative expenses, 0 program services or management or total expenses; Organizations reporting 0 fundraising expenses but with positive private donations or grants.

87
Table I-2. Summary Statistics: Original Sample vs. Cleaned Sample Original Sample Total Revenue ($) Total Expenses ($) Ending Total Assets ($) Mean 3,587,624 14,100,000 7,442,082 SD 50,200,000 12,700,000,000 943,000,000 Median 175,203 155,416 194,050 Min (348,000,000) (147,000,000) (34,700,000) Max 20,000,000,000 14,900,000,000,000 798,000,000,000 N 1,388,480 1,388,480 1,388,480 Cleaned Sample Total Revenue ($) Total Expenses ($) Ending Total Assets ($) Mean 9,675,159 8,662,796 34,800,000 SD 73,300,000 61,300,000 3,230,000,000 Median 1,222,203 1,116,984 1,636,269 Min (356,000,000) 849 60 Max 6,380,000,000 3,620,000,000 882,000,000,000 N 135,672 135,672 135,672

88
Table I-3. Cleaning Organizational Annual Returns on Revenue Sources in Subsectors and Whole Sample Arts, Culture, Humanities Org Annual Returns Missing >= 3 IQR * > 100% or <100% # of Obs # of Orgs Contributions 449 1214 N/A 12096 2016 Rents 13882 N/A 102 660 110 Interest 4036 N/A 204 9282 1547 Securities 9042 N/A 129 4734 789 Special events 8872 257 N/A 4422 737 * The 3IQR thresholds for contributions range from 45.47 to 67.10, depending on year. * The 3IQR thresholds for special events range from 6.71 to 7.56, depending on year. Education
Org Annual Return Missing >= 3 IQR* > 100% or <100% # of Obs # of Orgs Contributions 2482 1379 N/A 13410 2235 Program services 909 50 N/A 18402 3007 Rents 15714 N/A 165 2010 335 Interest 4451 N/A 385 11850 1975 Securities 7432 N/A 148 9822 1637 Special events 13713 184 N/A 3552 592 * The 3IQR thresholds for contributions range from 54.58 to 70.09, depending on year. * The 3IQR thresholds for special events range from 7.23 to 8.22, depending on year. Health
Org Annual Return Missing >= 3 IQR* > 100% or <100% # of Obs # of Orgs Contributions 5198 1488 N/A 14478 2413 Program services 1084 95 N/A 21570 3595 Rents 20644 N/A 106 1002 167 Interest 6714 N/A 351 12768 2128 Securities 13035 N/A 175 7338 1223 Special events 14661 320 N/A 5772 962 * The 3IQR thresholds for contributions range from 72.94 to 82.77, depending on year. * The 3IQR thresholds for special events range from 8.07 to 10.37, depending on year. Human Services

89
Org Annual Return Missing >= 3 IQR > 100% or <100% # of Obs # of Orgs Contributions 10795 3472 N/A 32040 5340 Program services 564 187 N/A 49476 8246 Rents 44849 N/A 150 2316 386 Interest 13741 N/A 982 28926 4821 Securities 32760 N/A 326 12090 2015 Special events 33738 610 N/A 10836 1806 * The 3IQR thresholds for contributions range from 106.94 to 132.02, depending on year. * The 3IQR thresholds for special events range from 8.77 to 9.65, depending on year. Whole Sample
Org Annual Return Missing >= 3 IQR > 100% or <100% # of Obs # of Orgs Contributions 21554 9729 N/A 91,416 15236 Program services 4457 452 N/A 128,772 21462 Rents 118446 N/A 539 7,296 1216 Interest 35132 N/A 2,283 79,092 13182 Securities 77011 N/A 1,037 42,450 7075 Special events 90670 1653 N/A 28572 4762 * The 3IQR thresholds for contributions range from 75.14 to 94.63, depending on year. * The 3IQR thresholds for special events range from 8.06 to 9.08, depending on year.
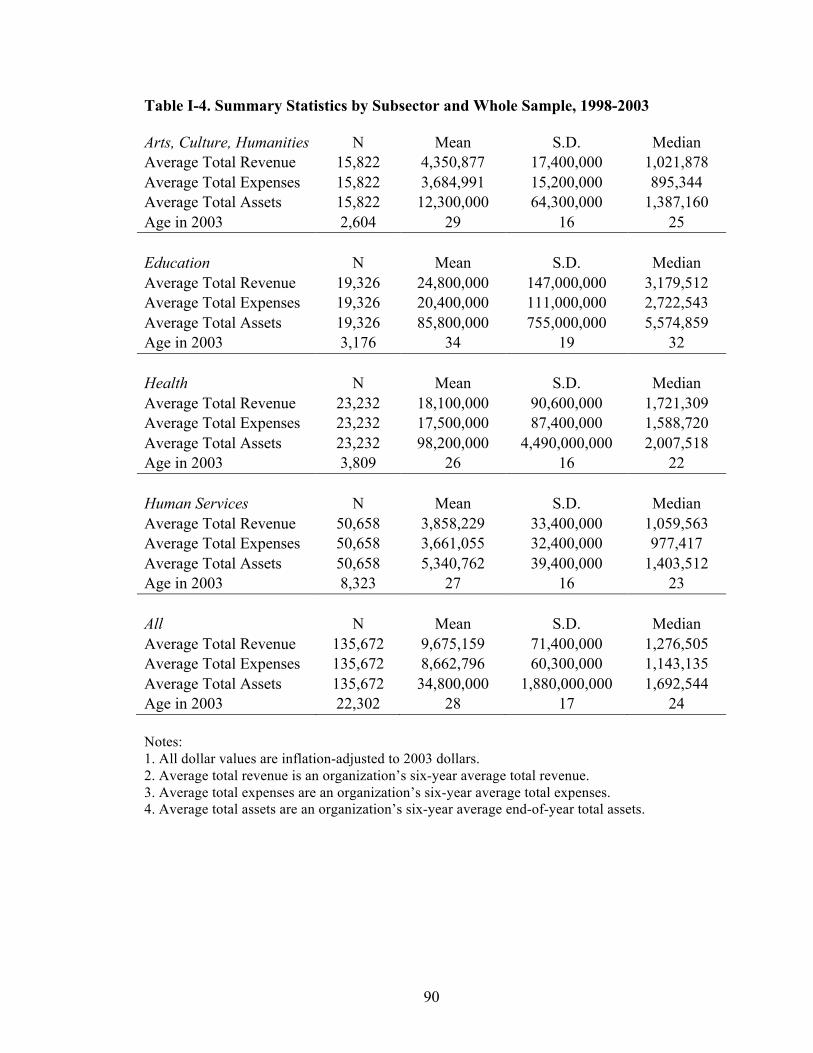
90
Table I-4. Summary Statistics by Subsector and Whole Sample, 1998-2003 Arts, Culture, Humanities N Mean S.D. Median Average Total Revenue 15,822 4,350,877 17,400,000 1,021,878 Average Total Expenses 15,822 3,684,991 15,200,000 895,344 Average Total Assets 15,822 12,300,000 64,300,000 1,387,160 Age in 2003 2,604 29 16 25 Education N Mean S.D. Median Average Total Revenue 19,326 24,800,000 147,000,000 3,179,512 Average Total Expenses 19,326 20,400,000 111,000,000 2,722,543 Average Total Assets 19,326 85,800,000 755,000,000 5,574,859 Age in 2003 3,176 34 19 32 Health N Mean S.D. Median Average Total Revenue 23,232 18,100,000 90,600,000 1,721,309 Average Total Expenses 23,232 17,500,000 87,400,000 1,588,720 Average Total Assets 23,232 98,200,000 4,490,000,000 2,007,518 Age in 2003 3,809 26 16 22 Human Services N Mean S.D. Median Average Total Revenue 50,658 3,858,229 33,400,000 1,059,563 Average Total Expenses 50,658 3,661,055 32,400,000 977,417 Average Total Assets 50,658 5,340,762 39,400,000 1,403,512 Age in 2003 8,323 27 16 23 All N Mean S.D. Median Average Total Revenue 135,672 9,675,159 71,400,000 1,276,505 Average Total Expenses 135,672 8,662,796 60,300,000 1,143,135 Average Total Assets 135,672 34,800,000 1,880,000,000 1,692,544 Age in 2003 22,302 28 17 24 Notes: 1. All dollar values are inflation-adjusted to 2003 dollars. 2. Average total revenue is an organization’s six-year average total revenue. 3. Average total expenses are an organization’s six-year average total expenses. 4. Average total assets are an organization’s six-year average end-of-year total assets.
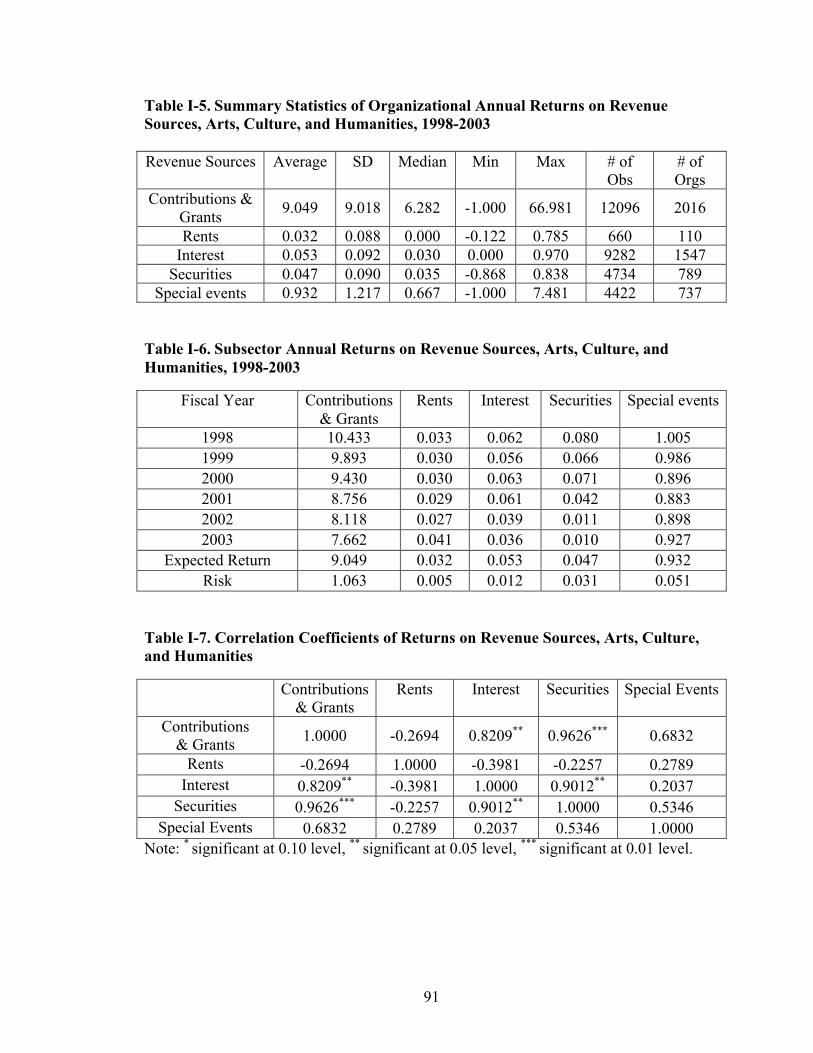
91
Table I-5. Summary Statistics of Organizational Annual Returns on Revenue Sources, Arts, Culture, and Humanities, 1998-2003 Revenue Sources Average SD Median Min Max # of
Obs # of Orgs
Contributions & Grants 9.049 9.018 6.282 -1.000 66.981 12096 2016
Rents 0.032 0.088 0.000 -0.122 0.785 660 110 Interest 0.053 0.092 0.030 0.000 0.970 9282 1547
Securities 0.047 0.090 0.035 -0.868 0.838 4734 789 Special events 0.932 1.217 0.667 -1.000 7.481 4422 737
Table I-6. Subsector Annual Returns on Revenue Sources, Arts, Culture, and Humanities, 1998-2003
Fiscal Year Contributions & Grants
Rents Interest Securities Special events
1998 10.433 0.033 0.062 0.080 1.005 1999 9.893 0.030 0.056 0.066 0.986 2000 9.430 0.030 0.063 0.071 0.896 2001 8.756 0.029 0.061 0.042 0.883 2002 8.118 0.027 0.039 0.011 0.898 2003 7.662 0.041 0.036 0.010 0.927
Expected Return 9.049 0.032 0.053 0.047 0.932 Risk 1.063 0.005 0.012 0.031 0.051
Table I-7. Correlation Coefficients of Returns on Revenue Sources, Arts, Culture, and Humanities
Contributions & Grants
Rents Interest Securities Special Events
Contributions & Grants 1.0000 -0.2694 0.8209** 0.9626*** 0.6832
Rents -0.2694 1.0000 -0.3981 -0.2257 0.2789 Interest 0.8209** -0.3981 1.0000 0.9012** 0.2037
Securities 0.9626*** -0.2257 0.9012** 1.0000 0.5346 Special Events 0.6832 0.2789 0.2037 0.5346 1.0000
Note: * significant at 0.10 level, ** significant at 0.05 level, *** significant at 0.01 level.

92
Table I-8. Efficient Portfolios, Arts, Culture, and Humanities: Expected Return, Risk, Weights, and HHI Expected Return
Risk %Contributions & Grants
% Rents
% Interest
% Securities
%Special Events
HHI
0.036 0.004 0% 79% 21% 0% 0% 0.67 0.220 0.012 0% 63% 17% 0% 21% 0.41 0.404 0.022 0% 47% 12% 0% 41% 0.44 0.588 0.032 0% 30% 8% 0% 62% 0.60 0.772 0.042 0% 14% 3% 0% 82% 0.81 0.956 0.053 0% 0% 0% 0% 100% 0.97 1.140 0.071 3% 0% 0% 0% 97% 0.79 1.324 0.092 5% 0% 0% 0% 95% 0.67 1.508 0.113 7% 0% 0% 0% 93% 0.59 1.692 0.135 9% 0% 0% 0% 91% 0.55 1.875 0.158 12% 0% 0% 0% 88% 0.52 2.059 0.181 14% 0% 0% 0% 86% 0.50 2.243 0.203 16% 0% 0% 0% 84% 0.50 2.427 0.226 18% 0% 0% 0% 82% 0.50 2.611 0.249 21% 0% 0% 0% 79% 0.51 5.370 0.597 55% 0% 0% 0% 45% 0.76 5.554 0.620 57% 0% 0% 0% 43% 0.78 5.738 0.644 59% 0% 0% 0% 41% 0.79 5.922 0.667 61% 0% 0% 0% 39% 0.81 6.106 0.690 64% 0% 0% 0% 36% 0.82 6.290 0.714 66% 0% 0% 0% 34% 0.84 6.474 0.737 68% 0% 0% 0% 32% 0.85 6.658 0.760 71% 0% 0% 0% 29% 0.86 6.842 0.783 73% 0% 0% 0% 27% 0.87 7.025 0.807 75% 0% 0% 0% 25% 0.89 7.209 0.830 77% 0% 0% 0% 23% 0.90 7.393 0.853 80% 0% 0% 0% 20% 0.91 7.577 0.877 82% 0% 0% 0% 18% 0.92 7.761 0.900 84% 0% 0% 0% 16% 0.93 7.945 0.923 86% 0% 0% 0% 14% 0.94 8.129 0.946 89% 0% 0% 0% 11% 0.95 8.313 0.970 91% 0% 0% 0% 9% 0.96 8.497 0.993 93% 0% 0% 0% 7% 0.97 8.681 1.016 95% 0% 0% 0% 5% 0.98 8.865 1.040 98% 0% 0% 0% 2% 0.99 9.049 1.063 100% 0% 0% 0% 0% 1.00

93
Table I-9. Summary Statistics of Organizational Annual Returns on Revenue Sources, Education, 1998-2003 Revenue Sources Average SD Median Min Max # of
Obs # of Orgs
Contributions & Grants 9.320 10.040 5.989 -1.000 69.980 13410 2235
Rents 0.041 0.120 0.000 -0.634 0.968 2010 335 Interest 0.058 0.101 0.031 -0.164 0.998 11850 1975
Securities 0.052 0.082 0.039 -0.676 0.941 9822 1637 Special events 1.133 1.345 0.864 -1.455 7.867 3552 592
Table I-10. Subsector Annual Returns on Revenue Sources, Education, 1998-2003
Fiscal Year Contributions & Grants Rents Interest Securities Special events 1998 10.212 0.045 0.071 0.089 1.149 1999 9.863 0.045 0.064 0.073 1.149 2000 9.911 0.041 0.066 0.078 1.104 2001 9.322 0.040 0.068 0.052 1.089 2002 8.485 0.040 0.044 0.012 1.149 2003 8.125 0.038 0.036 0.008 1.162
Expected Return 9.320 0.041 0.058 0.052 1.133 Risk 0.845 0.003 0.014 0.035 0.030
Table I-11. Correlation Coefficients of Returns on Revenue Sources, Education
Contributions & Grants
Rents Interest Securities Special Events
Contributions & Grants
1.0000 0.8445** 0.9466*** 0.9951*** -0.3442
Rents 0.8445** 1.0000 0.7196 0.8157** 0.1327 Interest 0.9466*** 0.7196 1.0000 0.9386*** -0.5647
Securities 0.9951*** 0.8157** 0.9386*** 1.0000 -0.3501 Special Events -0.3442 0.1327 -0.5647 -0.3501 1.0000
Note: * significant at 0.10 level, ** significant at 0.05 level, *** significant at 0.01 level
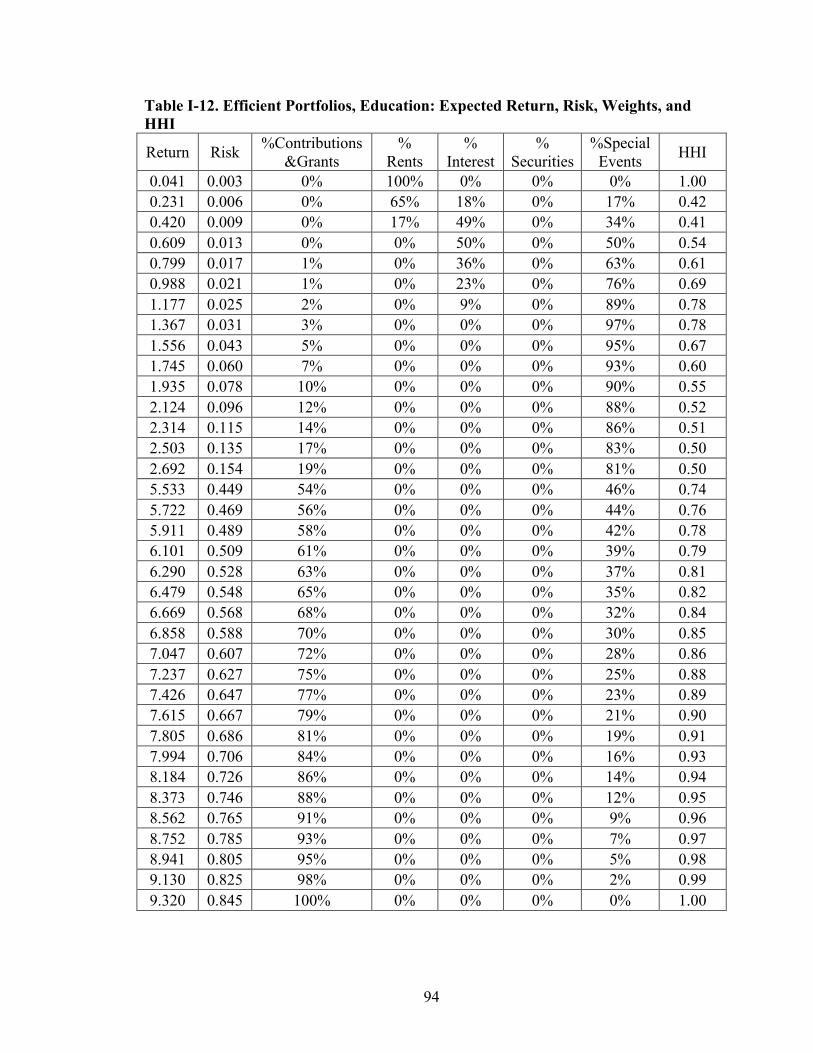
94
Table I-12. Efficient Portfolios, Education: Expected Return, Risk, Weights, and HHI
Return Risk %Contributions &Grants
% Rents
% Interest
% Securities
%Special Events HHI
0.041 0.003 0% 100% 0% 0% 0% 1.00 0.231 0.006 0% 65% 18% 0% 17% 0.42 0.420 0.009 0% 17% 49% 0% 34% 0.41 0.609 0.013 0% 0% 50% 0% 50% 0.54 0.799 0.017 1% 0% 36% 0% 63% 0.61 0.988 0.021 1% 0% 23% 0% 76% 0.69 1.177 0.025 2% 0% 9% 0% 89% 0.78 1.367 0.031 3% 0% 0% 0% 97% 0.78 1.556 0.043 5% 0% 0% 0% 95% 0.67 1.745 0.060 7% 0% 0% 0% 93% 0.60 1.935 0.078 10% 0% 0% 0% 90% 0.55 2.124 0.096 12% 0% 0% 0% 88% 0.52 2.314 0.115 14% 0% 0% 0% 86% 0.51 2.503 0.135 17% 0% 0% 0% 83% 0.50 2.692 0.154 19% 0% 0% 0% 81% 0.50 5.533 0.449 54% 0% 0% 0% 46% 0.74 5.722 0.469 56% 0% 0% 0% 44% 0.76 5.911 0.489 58% 0% 0% 0% 42% 0.78 6.101 0.509 61% 0% 0% 0% 39% 0.79 6.290 0.528 63% 0% 0% 0% 37% 0.81 6.479 0.548 65% 0% 0% 0% 35% 0.82 6.669 0.568 68% 0% 0% 0% 32% 0.84 6.858 0.588 70% 0% 0% 0% 30% 0.85 7.047 0.607 72% 0% 0% 0% 28% 0.86 7.237 0.627 75% 0% 0% 0% 25% 0.88 7.426 0.647 77% 0% 0% 0% 23% 0.89 7.615 0.667 79% 0% 0% 0% 21% 0.90 7.805 0.686 81% 0% 0% 0% 19% 0.91 7.994 0.706 84% 0% 0% 0% 16% 0.93 8.184 0.726 86% 0% 0% 0% 14% 0.94 8.373 0.746 88% 0% 0% 0% 12% 0.95 8.562 0.765 91% 0% 0% 0% 9% 0.96 8.752 0.785 93% 0% 0% 0% 7% 0.97 8.941 0.805 95% 0% 0% 0% 5% 0.98 9.130 0.825 98% 0% 0% 0% 2% 0.99 9.320 0.845 100% 0% 0% 0% 0% 1.00

95
Table I-13. Summary Statistics of Organizational Annual Returns on Revenue Sources, Health, 1998-2003 Revenue Sources Average SD Median Min Max # of
Obs # of Orgs
Contributions & Grants 11.437 12.849 7.116 -1.000 82.634 14478 2413
Rents 0.015 0.083 0.000 -0.511 0.996 1002 167 Interest 0.052 0.090 0.029 -0.851 0.970 12768 2128
Securities 0.049 0.090 0.036 -0.904 0.949 7338 1223 Special events 1.389 1.593 1.055 -1.000 10.362 5772 962
Table I-14. Subsector Annual Returns on Revenue Sources, Health, 1998-2003
Fiscal Year Contributions & Grants Rents Interest Securities Special events 1998 11.961 0.016 0.064 0.081 1.425 1999 11.823 0.008 0.059 0.071 1.322 2000 11.704 0.007 0.064 0.075 1.406 2001 11.302 0.014 0.058 0.041 1.386 2002 11.108 0.018 0.039 0.009 1.361 2003 10.728 0.027 0.030 0.018 1.434
Expected Return 11.437 0.015 0.052 0.049 1.389 Risk 0.474 0.007 0.014 0.031 0.042
Table I-15. Correlation Coefficients of Returns on Revenue Sources, Health
Contributions & Grants
Rents Interest Securities Special Events
Contributions & Grants 1.0000 -0.7769* 0.9153** 0.9311*** -0.25
Rents -0.7769* 1.0000 -0.8267** -0.7028 0.56 Interest 0.9153** -0.8267** 1.0000 0.9046** -0.16
Securities 0.9311*** -0.7028 0.9046** 1.0000 -0.02 Special Events -0.2484 0.5612 -0.1582 -0.0207 1.00 Note: * significant at 0.10 level, ** significant at 0.05 level, *** significant at 0.01 level

96
Table I-16. Efficient Portfolios, Health: Expected Return, Risk, Weights, and HHI
Return Risk %Contributions &Grants
% Rents
% Interest
% Securities %Special Events HHI
0.027 0.003 0% 67% 33% 0% 0% 0.55 0.260 0.006 2% 95% 0% 0% 4% 0.62 0.493 0.010 2% 83% 0% 0% 15% 0.41 0.726 0.015 3% 71% 0% 0% 26% 0.35 0.959 0.020 4% 58% 0% 0% 38% 0.36 1.192 0.025 4% 46% 0% 0% 49% 0.40 1.424 0.030 5% 34% 0% 0% 61% 0.45 1.657 0.035 6% 22% 0% 0% 72% 0.50 1.890 0.040 6% 10% 0% 0% 84% 0.55 2.123 0.045 7% 0% 0% 0% 93% 0.59 2.356 0.052 10% 0% 0% 0% 90% 0.54 2.589 0.059 12% 0% 0% 0% 88% 0.51 2.822 0.068 14% 0% 0% 0% 86% 0.50 3.054 0.078 17% 0% 0% 0% 83% 0.50 3.287 0.088 19% 0% 0% 0% 81% 0.50 7.013 0.261 56% 0% 0% 0% 44% 0.77 7.246 0.273 58% 0% 0% 0% 42% 0.79 7.479 0.284 61% 0% 0% 0% 39% 0.80 7.712 0.295 63% 0% 0% 0% 37% 0.82 7.945 0.306 65% 0% 0% 0% 35% 0.83 8.177 0.317 68% 0% 0% 0% 32% 0.85 8.410 0.329 70% 0% 0% 0% 30% 0.86 8.643 0.340 72% 0% 0% 0% 28% 0.87 8.876 0.351 75% 0% 0% 0% 25% 0.88 9.109 0.362 77% 0% 0% 0% 23% 0.90 9.342 0.373 79% 0% 0% 0% 21% 0.91 9.575 0.385 81% 0% 0% 0% 19% 0.92 9.807 0.396 84% 0% 0% 0% 16% 0.93 10.040 0.407 86% 0% 0% 0% 14% 0.94 10.273 0.418 88% 0% 0% 0% 12% 0.95 10.506 0.429 91% 0% 0% 0% 9% 0.96 10.739 0.441 93% 0% 0% 0% 7% 0.97 10.972 0.452 95% 0% 0% 0% 5% 0.98 11.205 0.463 98% 0% 0% 0% 2% 0.99 11.437 0.474 100% 0% 0% 0% 0% 1.00

97
Table I-17. Summary Statistics of Organizational Annual Returns on Revenue Sources, Human Services, 1998-2003 Revenue Sources Average SD Median Min Max # of
Obs # of Orgs
Contributions & Grants 16.019 18.770 9.406 -1.000 131.505 32040 5340
Rents 0.026 0.105 0.000 -0.307 0.999 2316 386 Interest 0.057 0.099 0.031 -0.192 0.986 28926 4821
Securities 0.043 0.090 0.027 -0.910 0.958 12090 2015 Special events 1.507 1.579 1.148 -1.000 9.565 10836 1806
Table I-18. Subsector Annual Returns on Revenue Sources, Human Services, 1998-2003
Fiscal Year Contributions & Grants Rents Interest Securities Special events 1998 17.573 0.025 0.071 0.068 1.494 1999 16.973 0.021 0.062 0.060 1.508 2000 16.441 0.026 0.067 0.063 1.563 2001 15.594 0.029 0.066 0.039 1.471 2002 15.031 0.028 0.042 0.009 1.488 2003 14.502 0.030 0.036 0.017 1.520
Expected Return 16.019 0.026 0.057 0.043 1.507 Risk 1.180 0.003 0.015 0.025 0.032
Table I-19. Correlation Coefficients of Returns on Revenue Sources, Human Services
Contributions & Grants
Rents Interest Securities Special Events
Contributions & Grants 1.0000 -0.7643* 0.8526** 0.9293*** 0.1085
Rents -0.7643* 1.0000 -0.4910 -0.6771 -0.2261 Interest 0.8526** -0.4910 1.0000 0.8978** 0.0326
Securities 0.9293*** -0.6771 0.8978** 1.0000 0.3237 Special Events 0.1085 -0.2261 0.0326 0.3237 1.0000 Note: * significant at 0.10 level, ** significant at 0.05 level, *** significant at 0.01 level
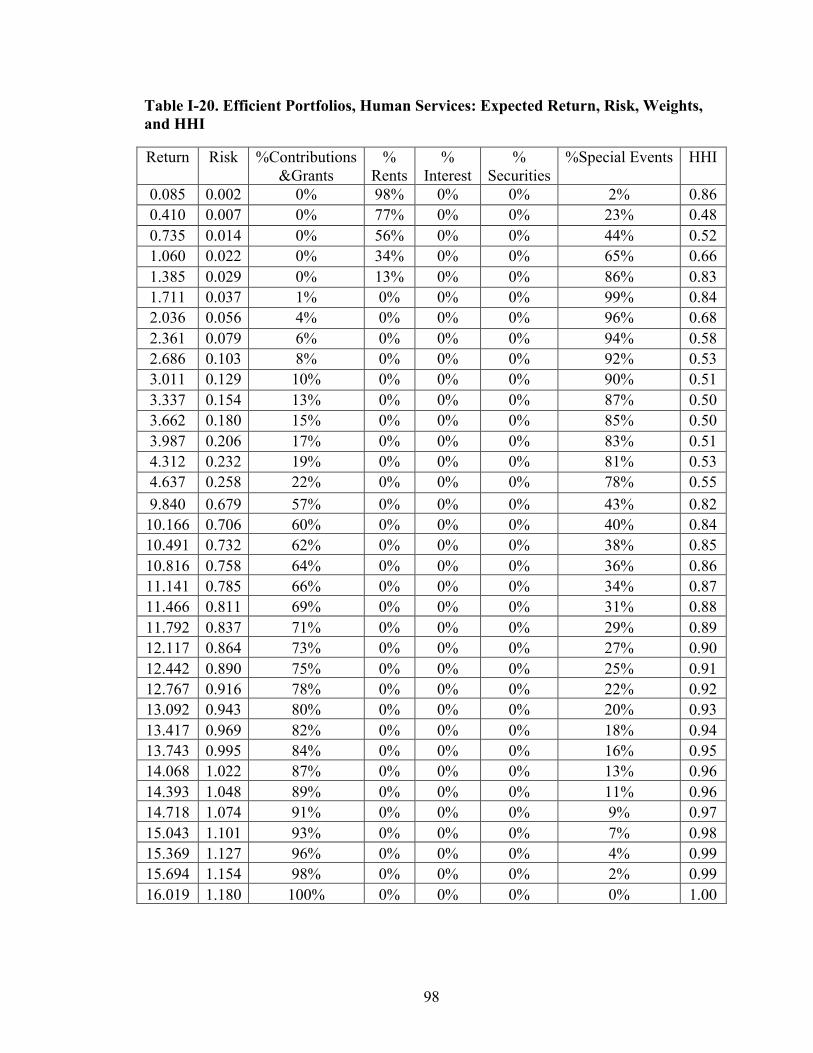
98
Table I-20. Efficient Portfolios, Human Services: Expected Return, Risk, Weights, and HHI Return Risk %Contributions
&Grants %
Rents %
Interest %
Securities %Special Events HHI
0.085 0.002 0% 98% 0% 0% 2% 0.86 0.410 0.007 0% 77% 0% 0% 23% 0.48 0.735 0.014 0% 56% 0% 0% 44% 0.52 1.060 0.022 0% 34% 0% 0% 65% 0.66 1.385 0.029 0% 13% 0% 0% 86% 0.83 1.711 0.037 1% 0% 0% 0% 99% 0.84 2.036 0.056 4% 0% 0% 0% 96% 0.68 2.361 0.079 6% 0% 0% 0% 94% 0.58 2.686 0.103 8% 0% 0% 0% 92% 0.53 3.011 0.129 10% 0% 0% 0% 90% 0.51 3.337 0.154 13% 0% 0% 0% 87% 0.50 3.662 0.180 15% 0% 0% 0% 85% 0.50 3.987 0.206 17% 0% 0% 0% 83% 0.51 4.312 0.232 19% 0% 0% 0% 81% 0.53 4.637 0.258 22% 0% 0% 0% 78% 0.55 9.840 0.679 57% 0% 0% 0% 43% 0.82 10.166 0.706 60% 0% 0% 0% 40% 0.84 10.491 0.732 62% 0% 0% 0% 38% 0.85 10.816 0.758 64% 0% 0% 0% 36% 0.86 11.141 0.785 66% 0% 0% 0% 34% 0.87 11.466 0.811 69% 0% 0% 0% 31% 0.88 11.792 0.837 71% 0% 0% 0% 29% 0.89 12.117 0.864 73% 0% 0% 0% 27% 0.90 12.442 0.890 75% 0% 0% 0% 25% 0.91 12.767 0.916 78% 0% 0% 0% 22% 0.92 13.092 0.943 80% 0% 0% 0% 20% 0.93 13.417 0.969 82% 0% 0% 0% 18% 0.94 13.743 0.995 84% 0% 0% 0% 16% 0.95 14.068 1.022 87% 0% 0% 0% 13% 0.96 14.393 1.048 89% 0% 0% 0% 11% 0.96 14.718 1.074 91% 0% 0% 0% 9% 0.97 15.043 1.101 93% 0% 0% 0% 7% 0.98 15.369 1.127 96% 0% 0% 0% 4% 0.99 15.694 1.154 98% 0% 0% 0% 2% 0.99 16.019 1.180 100% 0% 0% 0% 0% 1.00

99
Table I-21. Summary Statistics of Organizational Annual Returns on Revenue Sources, Whole Sample, 1998-2003 Revenue Sources Average SD Median Min Max # of
Obs # of Orgs
Contributions & Grants 12.356 13.638 7.833 -1.000 94.624 91416 15236
Rents 0.028 0.101 0.000 -0.650 0.999 7296 1216 Interest 0.054 0.094 0.030 -0.851 0.998 79092 13182
Securities 0.047 0.090 0.034 -0.922 0.997 42450 7075 Special events 1.264 1.467 0.932 -1.455 9.041 28572 4762
Table I-22. Subsector Annual Returns on Revenue Sources, Whole Sample, 1998-2003
Fiscal Year Contributions & Grants Rents Interest Securities Special events 1998 13.565 0.029 0.066 0.078 1.284 1999 13.026 0.026 0.060 0.067 1.261 2000 12.760 0.027 0.064 0.071 1.285 2001 12.069 0.028 0.062 0.043 1.236 2002 11.614 0.027 0.040 0.009 1.244 2003 11.100 0.029 0.033 0.014 1.273
Expected Return 12.356 0.028 0.054 0.047 1.264 Risk 0.925 0.001 0.014 0.030 0.021
Table I-23. Correlation Coefficients of Returns on Revenue Sources, Whole Sample
Contributions & Grants
Rents Interest Securities Special Events
Contributions & Grants 1.0000 -0.2578 0.8810** 0.9464*** 0.4499
Rents -0.2578 1.0000 -0.2096 -0.2257 0.1255 Interest 0.8810** -0.2096 1.0000 0.9234*** 0.2267
Securities 0.9464*** -0.2257 0.9234*** 1.0000 0.5371 Special Events 0.4499 0.1255 0.2267 0.5371 1.0000 Note: * significant at 0.10 level, ** significant at 0.05 level, *** significant at 0.01 level

100
Table I-24. Efficient Portfolios, Whole Sample: Expected Return, Risk, Weights, and HHI Return Risk %Contributions
&Grants %
Rents %
Interest %
Securities %Special Events HHI
0.029 0.001 0% 98% 2% 0% 0% 0.96 0.280 0.004 0% 80% 0% 0% 20% 0.54 0.532 0.009 0% 59% 0% 0% 41% 0.52 0.784 0.013 0% 39% 0% 0% 61% 0.65 1.035 0.017 0% 19% 0% 0% 81% 0.83 1.287 0.022 0% 0% 0% 0% 100% 0.98 1.538 0.037 2% 0% 0% 0% 98% 0.77 1.790 0.056 5% 0% 0% 0% 95% 0.65 2.041 0.076 7% 0% 0% 0% 93% 0.57 2.293 0.096 9% 0% 0% 0% 91% 0.53 2.545 0.116 12% 0% 0% 0% 88% 0.51 2.796 0.137 14% 0% 0% 0% 86% 0.50 3.048 0.157 16% 0% 0% 0% 84% 0.50 3.299 0.178 18% 0% 0% 0% 82% 0.51 3.551 0.199 21% 0% 0% 0% 79% 0.52 7.576 0.531 57% 0% 0% 0% 43% 0.80 7.827 0.551 59% 0% 0% 0% 41% 0.81 8.079 0.572 61% 0% 0% 0% 39% 0.83 8.331 0.593 64% 0% 0% 0% 36% 0.84 8.582 0.614 66% 0% 0% 0% 34% 0.85 8.834 0.635 68% 0% 0% 0% 32% 0.86 9.085 0.655 71% 0% 0% 0% 29% 0.88 9.337 0.676 73% 0% 0% 0% 27% 0.89 9.588 0.697 75% 0% 0% 0% 25% 0.90 9.840 0.718 77% 0% 0% 0% 23% 0.91 10.091 0.738 80% 0% 0% 0% 20% 0.92 10.343 0.759 82% 0% 0% 0% 18% 0.93 10.595 0.780 84% 0% 0% 0% 16% 0.94 10.846 0.801 86% 0% 0% 0% 14% 0.95 11.098 0.821 89% 0% 0% 0% 11% 0.96 11.349 0.842 91% 0% 0% 0% 9% 0.97 11.601 0.863 93% 0% 0% 0% 7% 0.98 11.852 0.884 95% 0% 0% 0% 5% 0.98 12.104 0.905 98% 0% 0% 0% 2% 0.99 12.356 0.925 100% 0% 0% 0% 0% 1.00
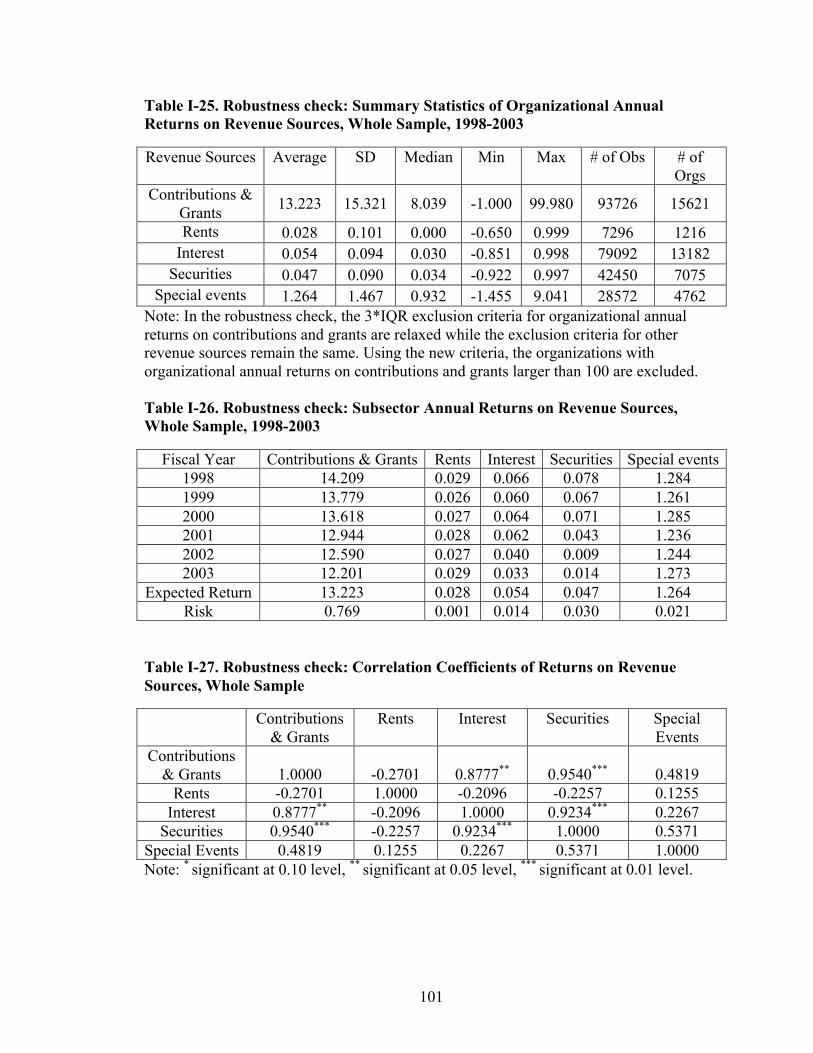
101
Table I-25. Robustness check: Summary Statistics of Organizational Annual Returns on Revenue Sources, Whole Sample, 1998-2003 Revenue Sources Average SD Median Min Max # of Obs # of
Orgs Contributions &
Grants 13.223 15.321 8.039 -1.000 99.980 93726 15621
Rents 0.028 0.101 0.000 -0.650 0.999 7296 1216 Interest 0.054 0.094 0.030 -0.851 0.998 79092 13182
Securities 0.047 0.090 0.034 -0.922 0.997 42450 7075 Special events 1.264 1.467 0.932 -1.455 9.041 28572 4762
Note: In the robustness check, the 3*IQR exclusion criteria for organizational annual returns on contributions and grants are relaxed while the exclusion criteria for other revenue sources remain the same. Using the new criteria, the organizations with organizational annual returns on contributions and grants larger than 100 are excluded. Table I-26. Robustness check: Subsector Annual Returns on Revenue Sources, Whole Sample, 1998-2003
Fiscal Year Contributions & Grants Rents Interest Securities Special events 1998 14.209 0.029 0.066 0.078 1.284 1999 13.779 0.026 0.060 0.067 1.261 2000 13.618 0.027 0.064 0.071 1.285 2001 12.944 0.028 0.062 0.043 1.236 2002 12.590 0.027 0.040 0.009 1.244 2003 12.201 0.029 0.033 0.014 1.273
Expected Return 13.223 0.028 0.054 0.047 1.264 Risk 0.769 0.001 0.014 0.030 0.021
Table I-27. Robustness check: Correlation Coefficients of Returns on Revenue Sources, Whole Sample
Contributions & Grants
Rents Interest Securities Special Events
Contributions & Grants 1.0000 -0.2701 0.8777** 0.9540*** 0.4819
Rents -0.2701 1.0000 -0.2096 -0.2257 0.1255 Interest 0.8777** -0.2096 1.0000 0.9234*** 0.2267
Securities 0.9540*** -0.2257 0.9234*** 1.0000 0.5371 Special Events 0.4819 0.1255 0.2267 0.5371 1.0000 Note: * significant at 0.10 level, ** significant at 0.05 level, *** significant at 0.01 level.

102
Figure I-1. The Efficient Frontier of Risky Assets
Source: Chen, W.-P., Chung, H., Ho, K.-Y., & Hsu, T.-L. (2010). Portfolio Optimization Models
and Mean-Variance Spanning Tests. In C.-F. Lee, A. C. Lee, & J. Lee (Eds.), Handbook of Quantitative Finance and Risk Management (Vol. I, pp. 165-184). New York, NY: Springer.
0
Efficient frontier of risky assets
Standard Deviation
Expected Return
Individual assets
Minimum variance portfolio

103
Figure I-2. Efficient Frontier and HHI, Arts, Culture, and Humanities
0.000
1.000
2.000
3.000
4.000
5.000
6.000
7.000
8.000
9.000
10.000
0.000 0.100 0.200 0.300 0.400 0.500 0.600 0.700 0.800 0.900 1.000 1.100 1.200
Exp
ecte
d R
etur
n
Risk/HHI
Efficient Frontier HHI/Return of Efficient Portfolios Risk/Return of Revenue Sources

104
Figure I-3. HHI vs. MPT Risk of Efficient Portfolios, Arts, Culture, and Humanities
0.00
0.10
0.20
0.30
0.40
0.50
0.60
0.70
0.80
0.90
1.00
1.10
0.000 0.100 0.200 0.300 0.400 0.500 0.600 0.700 0.800 0.900 1.000 1.100
HH
I
MPT Risk

105
Figure I-4. Efficient Frontier and HHI, Education
0.000
1.000
2.000
3.000
4.000
5.000
6.000
7.000
8.000
9.000
10.000
0.000 0.100 0.200 0.300 0.400 0.500 0.600 0.700 0.800 0.900 1.000 1.100
Exp
ecte
d R
etur
n
Risk/HHI
Efficient Frontier HHI/Return of Efficient Portfolios Risk/Return of Revenue Sources

106
Figure I-5. HHI vs. MPT Risk of Efficient Portfolios, Education
0.000
0.100
0.200
0.300
0.400
0.500
0.600
0.700
0.800
0.900
1.000
1.100
0.000 0.100 0.200 0.300 0.400 0.500 0.600 0.700 0.800 0.900
HH
I
MPT Risk

107
Figure I-6. Efficient Frontier and HHI, Health
0.000
1.000
2.000
3.000
4.000
5.000
6.000
7.000
8.000
9.000
10.000
11.000
12.000
13.000
0.000 0.100 0.200 0.300 0.400 0.500 0.600 0.700 0.800 0.900 1.000 1.100
Exp
ecte
d R
etur
n
Risk/HHI
Efficient Frontier HHI/Return of Efficient Portfolios Risk/Return of Revenue Sources

108
Figure I-7. HHI vs. MPT Risk of Efficient Portfolios, Health
0.000
0.100
0.200
0.300
0.400
0.500
0.600
0.700
0.800
0.900
1.000
1.100
0.000 0.050 0.100 0.150 0.200 0.250 0.300 0.350 0.400 0.450 0.500
HH
I
MPT Risk

109
Figure I-8. Efficient Frontier and HHI, Human Services
0.000 1.000 2.000 3.000 4.000 5.000 6.000 7.000 8.000 9.000 10.000 11.000 12.000 13.000 14.000 15.000 16.000 17.000
0.000 0.100 0.200 0.300 0.400 0.500 0.600 0.700 0.800 0.900 1.000 1.100 1.200 1.300
Exp
ecte
d R
etur
n
Risk/HHI
Efficient Frontier HHI/Return of Efficient Portfolios Risk/Return of Revenue Sources
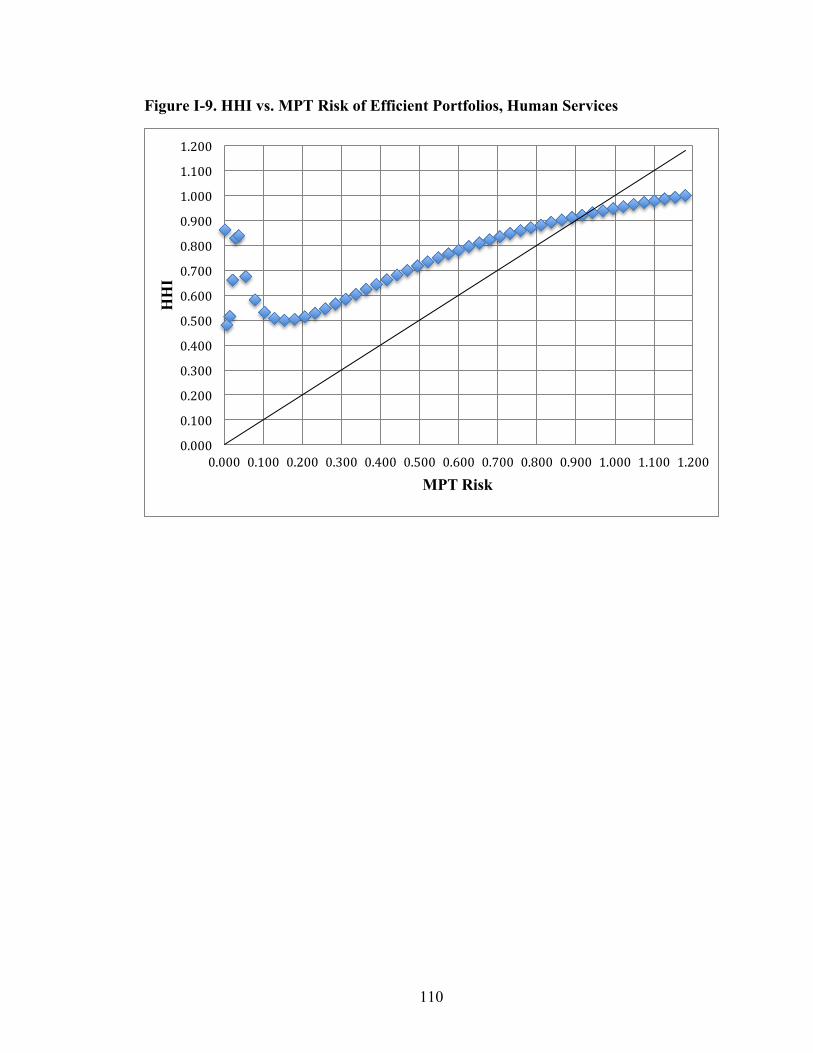
110
Figure I-9. HHI vs. MPT Risk of Efficient Portfolios, Human Services
0.000
0.100
0.200
0.300
0.400
0.500
0.600
0.700
0.800
0.900
1.000
1.100
1.200
0.000 0.100 0.200 0.300 0.400 0.500 0.600 0.700 0.800 0.900 1.000 1.100 1.200
HH
I
MPT Risk

111
Figure I-10. Efficient Frontier and HHI, Whole Sample
0.000
1.000
2.000
3.000
4.000
5.000
6.000
7.000
8.000
9.000
10.000
11.000
12.000
13.000
0.000 0.100 0.200 0.300 0.400 0.500 0.600 0.700 0.800 0.900 1.000 1.100
Exp
ecte
d R
etur
n
Risk/HHI
EfCicient Frontier HHI/Return of EfCicient Portfolios Risk/Return of Revenue Sources
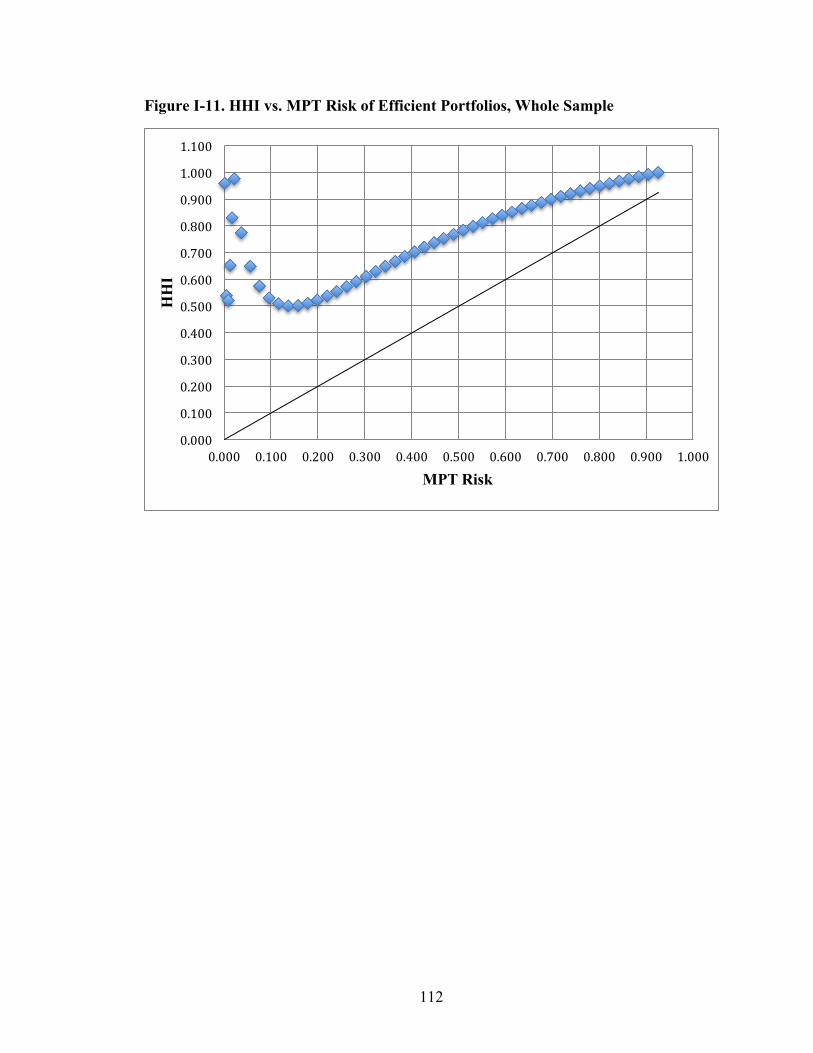
112
Figure I-11. HHI vs. MPT Risk of Efficient Portfolios, Whole Sample
0.000
0.100
0.200
0.300
0.400
0.500
0.600
0.700
0.800
0.900
1.000
1.100
0.000 0.100 0.200 0.300 0.400 0.500 0.600 0.700 0.800 0.900 1.000
HH
I
MPT Risk

113
References Anke, L. (2010, May 1). Correlation – “The Basis of Risk Management”. Retrieved
March 25, 2016, from Prudent Investors Network: http://www.prudentnetwork.com/prudent-perspective/correlation-and-risk-management/
Bielefeld, W. (1992). Non-Profit Funding Environment Relations. Voluntas, 3 (1), 48-70. Bowman, W. (2011). Finance Fundamentals for Nonprofits: Building Capacity and
Sustainability. Hoboken, New Jersey: John Wiley & Sons. Bowman, W., Tuckman, H. P., & Young, D. R. (2012). Issues in Nonprofit Finance
Research Surplus, Endowment, and Endowment Portfolios. Nonprofit and Voluntary Sector Quarterly, 41 (4), 560-579.
Calabrese, T. (2013). Running on Empty: The Operating Reserves of U.S. Nonprofit Organizations. Nonprofit Management and Leadership, 23 (3), 281-302.
Carroll, D. A., & Stater, K. J. (2009). Revenue Diversification in Nonprofit Organizations: Does it Lead to Financial Stability? Journal of Public Administration Research and Theory, 19 (4), 947-966.
Chang, C. F., & Tuckman, H. P. (1991). Financial Vulnerability and Attrition As Measures of Nonprofit Performance. Annals of Public and Cooperative Economics, 62 (4), 655-672.
Chang, C. F., & Tuckman, H. P. (1994). Revenue Diversification Among Non-profits. Voluntas, 5 (3), 273-390.
Chen, W.-P., Chung, H., Ho, K.-Y., & Hsu, T.-L. (2010). Portfolio Optimization Models and Mean-Variance Spanning Tests. In C.-F. Lee, A. C. Lee, & J. Lee (Eds.), Handbook of Quantitative Finance and Risk Management (Vol. I, pp. 165-184). New York, NY: Springer.
Chikoto, G. L., & Neely, D. G. (2014). Building Nonprofit Financial Capacity: The Impact of Revenue Concentration and Overhead Costs. Nonprofit and Voluntary Sector Quarterly, 43 (3), 570-588.
Fischer, R. L., Wilsker, A., & Young, D. R. (2011). Exploring the Revenue Mix of Nonprofit Organizations: Does It Relate to Publicness? Nonprofit and Voluntary Sector Quarterly, 40 (4), 662-681.
Foster, W. L., Kim, P., & Christiansen, B. (2009, Spring). Ten Nonprofit Funding Models. Stanford Social Innovation Review, 32-39.
Froelich, K. A. (1999). Diversification of Revenue Strategies: Evolving Resource Dependence in Nonprofit Organizations. Nonprofit and Voluntary Sector Quarterly, 28 (3), 246-268.
Froelich, K. A., & Knoepfle, T. W. (1996). Internal Revenue Service 990 Data: Fact or Fiction? Nonprofit and Voluntary Sector Quarterly, 25 (1), 40-52.
Froelich, K. A., Knoepfle, T. W., & Pollak, T. H. (2000). Financial Measures in Nonprofit Organization Research: Comparing IRS 990 Return and Audited Financial Statement Data. Nonprofit and Voluntary Sector Quarterly, 29 (2), 232-254.
Frumkin, P., & Keating, E. K. (2011). Diversification Reconsidered: The Risks and Rewards of Revenue Concentration. Journal of Social Entrepreneurship, 2 (2), 151-164.

114
Fustey, A. A. (2011). Risk Financial Markets & You: Your Guide to Making Better Investment Decisions. CreateSpace Independent Publishing Platform.
Galaskiewicz, J., & Bielefeld, W. (1998). Nonprofit Organizations in an Age of Uncertainty: A Study of Organizational Change. Hawthorne, NY: Aldine de Gruyter.
Grasse, N. J., Whaley, K. M., & Ihrke, D. M. (2015). Modern Portfolio Theory and Nonprofit Arts Organizations. Nonprofit and Voluntary Sector Quarterly. (Published online before printdoi: 10.1177/0899764015603204).
Greenlee, J. S., & Trussel, J. M. (2000). Predicting the Financial Vulnerability of Charitable Organizations. Nonprofit Management and Leadership, 11 (2), 199-210.
Grønbjerg, K. A. (1992). Nonprofit Human Service Organizations Funding Strategies and Patterns of Adaptation. In Y. Hasenfeld (Ed.), Human Services as Complex Organizations. Newbury Park, CA: Sage.
Daniel, K., Hirshleifer, D., & Subrahmanyam, A. (1998). Investor Psychology and Security Market Under- and Overreactions. The Journal of Finance, 53 (6), 1839-1885.
De Bondt, W. F., & Thaler, R. (1985). Does the Stock Market Overreact? The Journal of Finance, 40 (3), 793-805.
Hager, M. A. (2001). Financial Vulnerability Among Arts Organizations: A Test of the Tuckman-Chang Measures. Nonprofit and Voluntary Sector Quarterly, 30 (2), 376-392.
Hansmann, H. (1987). Economic Theories of Nonprofit Organization. In W. Powell (Ed.), The Nonprofit Sector. New Haven, Connecticut: Yale University Press.
Hubbert, S. (2012). Essential Mathematics for Market Risk Management. Chichester, West Sussex, UK: John Wiley & Sons, Ltd.
Investopedia. (n.d.). Correlation. Retrieved March 25, 2015, from Investopedia: http://www.investopedia.com/terms/c/correlation.asp
IRS. (2000). Instructions for Form 990 and Form 990-EZ. Department of Treasury Internal Revenue Service.
James, E. (1983). How Nonprofits Grow: A Model. Journal of Policy Analysis and Management, 350-365.
Jegers, M. (1997). Portfolio Theory and Nonprofit Financial Stability: A Comment and Extension. Nonprofit and Voluntary Sector Quarterly, 26 (1), 65-72.
Jones, C. L., & Roberts, A. A. (2006). Management of Financial Information in Charitable Organizations: The Case of Joint-Cost Allocations. The Accounting Review, 81 (1), 159-178.
Kahneman, D., & Tversky, A. (1979). Prospect Theory: An Analysis of Decision under Risk. Econometrica, 47 (2), 263-292
Kearns, K. (2007). Income Portfolios. In D. Young (Ed.), Financing Nonprofits: Putting Theory into Practice (pp. 291-314). Lanham, MD: AltaMira Press.
Keating, E. K., & Frumkin, P. (2003). Reengineering Nonprofit Financial Accountability: Toward a More Reliable Foundation for Regulation. Public Administration Review, 63 (1), 3-15.
Keating, E. K., Fischer, M., Gordon, T. P., & Greenlee, J. S. (2005, January). Assessing Financial Vulnerability in the Nonprofit Sector. Retrieved from KSG Working

115
Paper No. RWP05-002; Hauser Center for Nonprofit Organizations Paper No. 27. : http://ssrn.com/abstract=647662 or http://dx.doi.org/10.2139/ssrn.647662
Keating, E. K., Parsons, L. M., & Roberts, A. A. (2008). Misreporting Fundraising: How Do Nonprofit Organizations Account for Telemarketing Campaigns?. The Accounting Review, 83 (2), 417-446.
Kingma, B. R. (1993). Portfolio Theory and Nonprofit Financial Stability. Nonprofit and Voluntary Sector Quarterly, 22 (2), 105-119.
Krishnan, R., & Yetman, M. H. (2011). Institutional Drivers of Reporting Decisions in Nonprofit Hospitals. Journal of Accounting Research, 49 (4), 1001-1039.
Krishnan, R., Yetman, M. H., & Yetman, R. J. (2006). Expense Misreporting in Nonprofit Organizations. The Accounting Review, 81 (2), 399-420.
Mandelbrot, B., & Hudson, R. L. (2004). The (Mis)Behaviour of Markets: A Fractal View of Risk, Ruin, and Reward. London: Profile Books.
Markowitz, H. M. (1959). Portfolio Selection: Efficient Diversification of Investments. New York: John Wiley & Sons.
Markowitz, H. M. (1952). Portfolio Selection. The Journal of Finance, 7 (1), 77-91. Mayer, W., Wang, H.-c., Egginton, J. F., & Flint, H. S. (2014). The Impact of Revenue
Diversification on Expected Revenue and Volatility for Nonprofit Organizations. Nonprofit and Voluntary Sector Quarterly, 43 (2), 374-392.
McKeever, B. S. (2015). The Nonprofit Sector in Brief 2015. Urban Institute. Washington, DC: Urban Institute.
Murphy, J. M. (1977). Efficient Markets, Index Funds, Illusion, and Reality. Journal of Portfolio Management , 4 (1), 5-20.
NCCS. (n.d.). Overview of NCCS Data Files. Retrieved March 25, 2016, from National Center for Charitable Statistics: http://nccs.urban.org/database/overview.cfm
NTEE. (n.d.). National Taxonomy of Exempt Entities. Retrieved March 25, 2016, from National Center for Charitable Statistics: http://nccsweb.urban.org/PubApps/nteeSearch.php?gQry=allMajor&codeType=NTEE
Odean, T. (1999). Do Investors Trade Too Much? The American Economic Review, 89 (5), 1279-1298.
Odean, T. (1998). Are Investors Reluctant to Realize Their Losses?. The Journal of Finance, 53 (5), 1775-1798.
Omer, T., & Yetman, R. (2007). Tax Misreporting and Avoidance by Nonprofit Organizations. Journal of the American Taxation Association, 29 (1), 61-86.
Omer, T., & Yetman, R. (2003). Near Zero Taxable Income Reporting by Nonprofit Organizations. Journal of the American Taxation Association, 25 (2), 19-24.
Roeger, K. L., Blackwood, A. S., & Pettijohn, S. L. (2012). The Nonprofit Almanac 2012. Urban Institute. Washington, DC: The Urban Institute Press.
Ross, S. A., Westerfield, R. W., & Jordan, B. D. (2008). Fundamentals of Corporate Finance (8th Edition ed.). New York, NY: McGraw-Hill Irwin.
Steinberg, R. (2006). Membership Income. In Financing Nonprofits: Putting Theory into Practice (pp. 121-155). Lanham: AltaMira Press.
Steinberg, R. (1991). The Economics of Fundraising. In Taking Fundraising Seriously: Advancing the Profession and Practice of Raising Money (pp. 238-256). San Francisco: Jossey Bass.

116
Steinberg, R. (1986). Should Donors Care About Fund-Raising? . In S. Rose-Ackerman (Ed.), The Economics of Nonprofit Institutions: Studies in Structure and Policy. New York: Oxford University Press.
Thaler, R. H. (1999). Mental Accounting Matters. Journal of Behavioral Decision Making , 12 (3), 183-206.
Thaler, R. H. (1992). The Winner's Curse: Paradoxes and Anomalies of Economic Life. Princeton: Princeton University Press.
Tinkelman, D. (2006). The Decision-Usefulness of Nonprofit Fundraising Ratios: Some Contrary Evidence. Journal of Accounting, Auditing & Finance, 21 (4), 441-462.
Tinkelman, D., & Neely, D. G. (2010). Some Econometric Issues in Studying Nonprofit Revenue Interactions Using NCCS Data. Nonprofit and Voluntary Sector Quarterly, 40 (4), 751-761.
Tversky, A., & Kahneman, D. (1974). Judgment Under Uncertainty: Heuristics and Biases. Science, 185 (4157), 1124-1131.
Tversky, A., & Kahneman, D. (1973). Availability: A Heuristic for Judging Frequency and Probability. Cognitive Psychology, 5 (2), 207-232.
Trussel, J. (2003). Assessing Potential Accounting Manipulation: The Financial Characteristics of Charitable Organizations With Higher Than Expected Program-Spending Ratios. Nonprofit and Voluntary Sector Quarterly, 32 (4), 616-634.
Trussel, J. (2002). Revisiting the Prediction of Financial Vulnerability. Nonprofit Management and Leadership, 13 (1), 17-31.
Tuckman, H. P., & Chang, C. F. (1991). A Methodology for Measuring the Financial Vulnerability of Charitable Nonprofit Organizations. Nonprofit and Voluntary Sector Quarterly, 20 (4), 445-460.
Urban Institute and Center on Philanthropy at Indiana University. (2004). Nonprofit Overhead Cost Study. Retrieved March 25, 2015, from https://philanthropy.iupui.edu/files/research/nonprofit_overhead_brief_3.pdf.
Weisbrod, B. A. (1998). The Nonprofit Mission and Its Financing: Growing Links Between Nonprofits and the Rest of the Economy. In B. A. Weisbrod (Ed.), To Profit or Not to Profit: The Commercial Transformation of the Nonprofit Sector (pp. 1-22). Cambridge, UK: Cambridge University Press.
Weisbrod, B. A. (1988). The Nonprofit Economy. Cambridge, Massachusetts: Harvard University Press.
Wicker, P., Feiler, S., & Breuer, C. (2013). Organizational Mission and Revenue Diversification among Non-profit Sports Clubs. International Journal of Financial Studies, 1 (4), 119-136.
Wicker, P., Longley, N., & Breuer, C. (2015). Revenue Volatility in German Nonprofit Sports Clubs. Nonprofit and Voluntary Sector Quarterly. 44 (1), 5-24.
Wing, K., Gordon, T., Hager, M., Pollak, T., & Ronney, P. (2006, August). Functional Expense Reporting for Nonprofits: The Accounting Profession's Next Scandal? The CPA Journal, 14-18.
Yetman, M. H., & Yetman, R. J. (2013). Do Donors Discount Low-Quality Accounting Information? The Accounting Review, 88 (3), 1041–1067.
Young, D. R. (Ed.). (2007). Financing Nonprofits: Putting Theory Into Practice. Lanham, MD: AltaMira Press.

117
Young, D. R. (2007). Toward a Normative Theory of Nonprofit Finance. In D. R. Young (Ed.), Financing Nonprofits: Putting Theory into Practice (pp. 339-372). Lanham, MD: AltaMira.

118
Essay II Charitable Giving in Nonprofit Service Associations: Identities, Incentives, and
Gender Differences
Heng Qu and Richard Steinberg
Abstract
Service clubs, like the Lions Clubs, Rotaries, and Kiwanis, provide collective goods.
Membership in a service club involves by two essential elements: members’ shared
interest in the club’s charitable mission; and private benefits stemming from social
interactions with other members, such as networking, fellowship, and fun. We report
results from a laboratory experiment designed to test whether membership in a service
club makes a person more generous. We find that female individuals are the least
generous when they are reminded of the socializing aspect of service-club membership.
Male individuals in the social treatment donated more than those in the mission treatment
mathematically, although the difference is not statistically significant. Results are
consistent with a variant of social identity theory we develop, as well as motivational
crowding-out from psychology and economics.
Keywords: service clubs, nonprofit membership associations, motivation for charitable
giving, social identity, motivational crowding-out, gender differences in charitable giving

119
Introduction
Service clubs, such as Lions Clubs, Rotary, and Kiwanis, provide a space where
members get together to satisfy their self-interest and social needs, as well as to solve
their community concerns (Charles, 1993). Giving circles, where groups of individuals
donate their time and money to a pooled fund and collectively allocate their funds to
other charities and community projects, are similar (Eikenberry, 2006). This paper is
concerned with the effectiveness of service clubs and other similar types of organizations
in fostering members’ generosity and support for collective goods. A common belief is
that the higher the level of member commitment, the more successfully a service club can
pursue its mission. We argue that this analysis is too simple, that the way in which
member commitment is built matters. Indeed, we find that one approach to building
commitment is counterproductive, that member donations decline relative to other
approaches. We explain this by noting two broad categories of benefits to members. First,
“service benefits”—members benefit from their association with an organization that
helps nonmembers and from their personal role in helping the club to do so. Members
may want that association to enhance their charitable reputation or meet psychological
needs, but the intended effect is the provision of a charitable service to nonmembers.
Second, “socializing benefits”—members benefit from their interactions with other
members, such as gaining networking opportunities, making friends, or having fun.
The dual goals of providing service and socializing benefits may have conflicting
effects on members’ charitable behavior. On the one hand, service clubs assemble like-
minded individuals to support the provision of collective goods. This reduces free riding
through self-selection, repeated interactions with other members, and community

120
enforcement (Kandori, 1992). Joiners also develop identities with their service clubs and
behave according to the social norms associated with the identities (e.g., Akerlof &
Kranton, 2000). Regular participation in club meetings and service projects fosters
heightened levels of member identification with the club, resulting in greater member
support for club mission attainment. On the other hand, service clubs are complex
institutions satisfying both self-regarding and other-regarding member motivations. The
theory of motivational crowding-out argues that the provision of extrinsic incentives
undermines member’s intrinsic motivation for charitable behaviors under certain
circumstances (e.g., Frey & Jegen, 2001; Deci, Koestner, & Ryan, 1999). To the extent
that socializing benefits are framed and perceived as extrinsic, intrinsic generosity may
decline.
This paper reports a laboratory experiment that examines the effect of service club
membership—stressing either the service or socializing aspects—on individual support
for collective goods. We were motivated by the then surprising results of a pilot
experiment, which found that a treatment designed to increase members’ identity with the
service club reduced donations. That led us to this experiment, in which we provide
alternative treatments designed to activate either the service or socializing aspect of
membership. We find that emphasizing the social benefits reduces donations.
In the next section, we summarize relevant literature from economics and social
psychology, and present our model, a variant of the economic model of social identity.
We also discuss other theories that make predictions consistent with our results. Next, we
describe our experiment in detail and report the results, followed by a concluding
discussion.

121
Theory
Background
Before presenting our model, we first discuss the two strands of literature from
economics and social psychology that provide insights to our model: the theory of
collective goods and social identity theory.
Collective Goods. Collective goods are defined as nonrival in consumption – that
is, it costs nothing to let an additional person enjoy them once they are provided
(Samuelson, 1954). Like many nonprofits, service clubs provide collective goods and
such provision is enshrined in their mission statements. For example, Lions Club
International lists its mission as “To empower volunteers to serve their communities,
meet humanitarian needs, encourage peace and promote international understanding
through Lions clubs.” (Lions Clubs International, 2015). An additional member, as well
as nonmembers, can benefit from the fact that Lions provide these services to others
without diminishing existing members’ enjoyment of the same benefits. The service club
in our experiment provides access to higher education, which is collectively enjoyed by
people valuing others’ access to education.
A well-known problem with voluntary support for collective goods is free riding,
enjoying service provision without personally contributing. This leads to under-provision
of collective goods relative to the social optimum. Andreoni’s (1988, 1989) impure
altruism model provides a framework that predicts the observed distribution of charitable
giving and free riding. In his model, potential donors care about both the level of
collective good provision (labeled “altruism”) and their personal contribution to the
122
collective good (“warm glow”), Variation in the relative importance of these two
motivations explains why some people free ride, others do not, and still others take an
easy ride (less extreme free-riding).
Social Identity. We model the mutability of individual preferences for collective
goods using social identity theory. This theory was originally developed by social
psychologists (Tajfel and Turner, 1979), and was modified by economists Akerlof and
Kranton (2000) to explain economic behavior. Social identity theory highlights the
importance of social contexts to decisionmaking, explaining why the same person makes
different decisions from otherwise identical choice sets. In the original formulation,
Tajfel and Turner (1979) define social identity as a person’s sense of who she is based on
the groups to which she belongs. People divide the world into the in-group (us) and out-
group (them) in order to enhance self-image and achieve a positive social identity.
Following this categorization, people adopt the identity and conform to the norms of the
in-group, and also compare with and discriminate against the out-group to achieve
superiority (Tajfel and Turner, 1979).
Many studies in social psychology and behavioral economics use experimental
methods and find significant effects of group membership and identity on individual
behavior. Some experiments use “priming”—reminding subjects of their natural social
identities (e.g. gender, ethnicity, race), and find that people behave in accord with the
stereotypes associated with the salient identity. For example, Shih, Pittinsky, and
Ambady (1999) report that Asian-American women scored higher on a math test when
their Asian identity is salient than when female identity is salient. Other experiments find
that inducing artificial group identities in labs triggers a favorable bias to the in-group.

123
This was first observed in “minimal groups:” group memberships are ostensibly
established based on trivial tasks (e.g. preferences for paintings), but participants actually
are assigned randomly and anonymously to complete seemingly irrelevant tasks when no
direct self-interest or interactions with others are involved (Tajfel et al., 1971). Early
social psychology studies using the minimal group paradigm generally found that even
“trivial, ad hoc intergroup categorization leads to ingroup favoritism and discrimination
against the outgroup.” (Tajfel & Turner, 1979, p.39).
Economics experiments are particularly concerned with the effects of group
identities when there is a tradeoff between self-interest and collective interest, breaking
one condition of the minimal group paradigm. Chen and Li (2009) show that the ingroup
favoritism persists even when minimal groups include a link between subject decisions
and self-interest. Eckel and Grossman (2005) find that just being identified with a group
alone is insufficient to solve the conflicts between self- and collective interest; only
higher levels of identity can restrain self-interest and lead to higher degrees of group
cooperation.
In our experiment, we attempt to induce group identities in a fictitious service
club using various treatments. Members and nonmembers donate to an education fund
that advances the organization’s mission, so the design presents subjects with a potential
tradeoff between self- and collective interest.
The Model
Our model shows how context effects can be introduced into an economics model
that incorporates the theories of impure altruism and social identity. It provides a way to
124
interpret empirical results, although as we shall discuss, there are other theories allowing
interpretation. The starting point is the economic model of social identity developed by
economists Akerlof and Kranton (2000). In their model, individuals define themselves as
members of certain social categories that constitute their social identities. Each social
identity comes with exogenously determined expectations and norms of behavior, labeled
“prescriptions.” The saliency of each identity depends on the perceived context in which
decisions are made. When an identity is made salient, individuals increase utility by
following closely to that identity’s prescription.
We adapted the economic model of social identity by adding explicit terms for
altruism and warm glow as in the impure altruism model. In our model, individuals
(indexed by i) choose an amount to donate (di) in support of the collective good “access
to education,” and retain the rest of their endowment (ei) for private consumption (xi). We
assume that the collective good is produced with constant returns to scale and measure
the quantity of the collective good in units such that $1 donated produces 1 unit of
educational access. In treatments where membership is not an option, a nonprofit
organization simply collects the donations (costlessly) and provides 𝐷 = 𝑑!!!!! units of
the collective good. In treatments where membership is mandated, we assume that
member services are costless. Then a nonprofit service club costlessly collects donations
and provides 𝐷 units of the collective good.
We assume that there are two distinct member identities – socializing (subscript
S) and collective service providing (subscript C) to capture the two features of service
clubs. The socializing identity is salient when the club provides a setting for hobnobbing
and mingling, and the collective service identity is salient when the club organizes

125
members to provide charitable service. Member’s utility depends on the salience of each
member identity times “prescription functions,” denoted PS (PC), and on the difference
between i’s donation and the prescribed donation for members in each category.
Akerlof and Kranton (2000) assume that prescriptions arise from shared cultural
norms and appropriate behavior for various social roles. Here, we assume that there is an
exogenously specified prescribed donation for the collective service identity (socializing
identity) denoted DC (DS). We assume that DC is greater than the amount that each
individual would give if neither identity is made salient, but we do not make the same
assumption about DS. We also assume DC is greater than DS.
Following Akerlof and Kranton (2000), departures in either direction from
prescribed donations reduce utility stemming from the socializing identity. It is clear why
giving less than the prescribed amount lowers utility, less clear why giving more than the
prescribed amount does so. Giving too much may be as alienating as giving too little
because the generous donor will lose some identification with other club members. We
therefore speculate that the overly generous will face a bigger penalty in the socializing
identity term than in the service identity term. We note that there is no need for the
prescription functions to be symmetric about the prescribed amount.
The importance of each identity is a function of exogenous personal preferences
and the level of specific induction applied to each. We denote the level of induction by
𝜎! 𝜖 0, 1 , 𝑗 = 𝑆,𝐶. The salience of the induced socializing identity, 𝑎(𝜎!) takes values 𝑎
when 𝜎! = 0 and 𝑎 when 𝜎! = 1, with 0 ≤ 𝑎 < 𝑎. Similarly, the salience of the induced
collective service identity is 𝑏(𝜎!) which takes values 𝑏 and 𝑏 respectively. The
combined identity function, 𝐼! 𝑑! ,𝜎!,𝜎! , takes the form:

126
𝐼! = −𝑎 𝜎! 𝑃! 𝑑! − 𝑑! − 𝑏(𝜎!)𝑃!(𝑑! − 𝑑!)
Where: 𝑃!′ > 0 and 𝑃!′′ < 0 𝑖𝑓 𝑑! < 𝑑! 𝑜𝑟 𝑑!; 𝑃!′ ≤ 0 and 𝑃!′′ ≤
0 otherwise,
𝑃! 0 = 0; for 𝑗 = 𝑆,𝐶,
and 𝑑! 𝑎𝑛𝑑 𝑑! are the prescribed donations for each identity, with
𝑑! > 𝑑! .
Putting this all together, utility takes the following form:
𝑈! = 𝑈 𝑑! , 𝑥! ,𝐷, 𝐼! 𝑑! ,𝜎!,𝜎!
Where: 𝐷 = 𝑑!!!!! .
U is assumed concave and increasing in all its arguments. When i becomes a
member, she maximizes utility by choosing a level of donations and private consumption
subject to a budget constraint and non-negativity constraints. One non-negativity
constraint recognizes that D is mostly outside the control of i, and that di can add to, but
not subtract from the gifts of others. The individual is also constrained by 𝜎! 𝑎𝑛𝑑 𝜎! ,
which are chosen by the experimenters for each subject. The solution to this problem
gives i’s best response function, and the solutions to the system of best response
functions gives the Nash equilibria to the simultaneous moves game for each combination
of induction levels. We restrict attention to symmetric Nash equilibria.
Our model is identical to the impure altruism model (Andreoni, 1989; 1990) with
two twists. First, agents receive utility from their membership identities. This does not
change the nature of individual equilibrium because identities are exogenously activated.1
Second, we add norm prescriptions to the impure altruism model, and introduce a way to
manipulate the salience of alternative preference elements in an impure altruism

127
framework. This change is a restriction on the functional form of impurely altruistic
utility, and so results that hold for the general case also hold for our particularization.
Our model produces three predictions cast as the following hypotheses:
H1: Many people will make positive donations when they are asked to, regardless of
whether they are members.
Existing proofs suffice for this proposition (Cornes and Sandler, 1985). This is mainly
due to the warm-glow term in donor utility, which seems to be a naturally present
intrinsic motivation in a variety of other experiments (Andreoni & Payne, 2013).
H2: Members whose collective-service identity is salient will make larger contributions
than nonmembers, who receive only basic information about the charitable cause.
This comes from our assumption that the prescribed amount of donations exceeds the
nonmember-identity equilibrium for each person. If the induction of service identity
is successful, each individual will find that their marginal benefit of donating
increases at each level of donations whereas marginal costs remain the same. This
induces a rightward shift in each member’s reaction function, which shows optimal
individual donations at each level of giving by others. Because these reaction
functions are downward sloping (Andreoni, 1989), this implies that individual and
collective donations increase for a pool of members with salient collective-service
identity in symmetric Nash equilibrium.
H3: Service club members donate less when their socializing identity is salient than when
their collective service identity is salient.
We believe that the norm prescribed by the socializing identity is to be an active
participant in the club’s social activities, whereas the norm for the service identity is

128
to be an altruistic member who support the club’s charitable. Hence, focusing
subjects’ attention on the socializing aspect would frame the context of giving
decisions as a social club rather than an altruistic service club. Members with salient
service identity would gain utility by making appropriate amount of donations, while
those with salient socializing identity would not gain utility by making donations.
Alternative Theory
Our model is not the only way to rationalize the behavior observed in our
experiment. According to Clark and Wilson (1961), organizations generally provide three
broad categories of incentives – material, solidary, and purposive – in order to increase
donations. Material incentives are tangible benefits with a monetary value, like savings
on car rentals. Solidary incentives are intangible rewards “derived from the act of
associating” (p.134), including socializing, having fun, providing a sense of belonging,
and sometimes obtaining elite status. Purposive incentives are intangible rewards
associated with the goals and values of organizations. Although service clubs offer all the
three types of incentives, they primarily rely on solidary incentives (Clark & Wilson,
1961). This attracts members more responsive to solidary than purposive and material
benefits. In contrast, nonprofit organizations without members rely more on purposive
incentives, attracting donors who are more motivated by mission attainment. So we can
interpret results as answering “Which organizational form collects more donations:
contributor- or membership-based? A purposive or a solidary group?
The theory of motivational crowding-out provides another way to interpret our
results (Deci, 1971; Ryan & Deci, 2000; Bénabou and Tirole, 2006). This literature
129
distinguishes between two types of motivation for behavior: extrinsic incentives
(externally-supplied rewards) and intrinsic incentives (naturally-present; doing something
for the inherent satisfaction and enjoyment of the activity itself (Deci, 1971; Ryan &
Deci, 2000). Many studies find that the provision of extrinsic incentives at any level
crowds out intrinsic motivations, so that sometimes providing extrinsic incentives is
counterproductive to promoting pro-social behavior (e.g., Deci, Koestner, & Ryan, 1999;
Frey & Goette, 1999; Gneezy & Rustichini, 2000). Other studies find that monetary
rewards differ from other extrinsic incentives. Noncash incentives, like lottery tickets or
T-shirts, increased blood donations (Goette & Stutzer, 2008; Lacetera, Macis, & Slonim,
2012), but cash incentives significantly decreased blood donations among female donors
(Mellström & Johannesson, 2008). Diverse theories explain motivational crowding-out.
Extrinsic incentives can be perceived as controlling, offending psychological needs for
autonomy and competence (Deci & Ryan, 1985). When people are rewarded for
performing an intrinsically motivating activity, they no longer attribute their behavior as
representing desirable traits but to the external rewards (Lepper, Greene, & Nisbett,
1973).
People have intrinsic motives for charitable giving, that is, they give anyway
without extrinsic incentives. Some extrinsic incentives are providing through tax breaks
and other sources when people give regardless of membership status, but membership in
a service club might alter the balance. The socializing benefits of membership may
provide a reason to increase donations while crowding out intrinsic generosity. On
balance, either effect could dominate so that the sign of the membership effect becomes
an empirical question. This leads to our last hypothesis:

130
H4: Members focusing on the socializing benefits give less than those focusing on
collective service provision—members or nonmembers.
It is reasonable to conjecture that a service club member has a combination of
both intrinsic (altruistic) and extrinsic motivations for giving. When focusing on
the socializing aspect, a member is made to focus on the extrinsic incentives (e.g.
networking, fellowship, fun) that may crowd out her altruistic motivation and thus
becomes more generous. In either case, we would expect people focusing on
socializing benefits give less than those who are not made to focus on any
external rewards, whether they are members of a service club or contributors of a
nonprofit organization.
Experiment
Design and Participants Assignment
We used a between-subject design, consisting of one control (no club membership)
and two treatments with club membership (salience of service vs. socializing identity)
(Table 1). 113 students at a midwestern university participated in our experiment and
received an average compensation of $7.60. Our final sample includes 93 good
observations (35% men, 65% women). Subjects were assigned to 18 single-treatment
sessions based on their availability, and each participated in the experiment only once.2
Subjects did not know in advance which treatment they would receive, so there is no self-
selection into treatment. Moreover, each treatment had multiple sessions, on different
days and times, so that selection based on unobservable attributes correlated with time
should not be a problem.

131
[Table II-1]
Procedure
Subjects proceeded through five stages. First, they chose an organization they
would like to be associated with from a list of two options. Second, subjects participated
in a practice round, practicing a neutrally framed decisionmaking task. Third, subjects in
the treatment groups were welcomed to membership in the fictitious Education Service
Club (ESC), and then completed a task intended to make either the service or socializing
member identity salient. Subjects in the control group skipped this step. Fourth, subjects
in all groups were read a fundraising message and asked to allocate their tokens. Fifth,
subjects designated a real-world charity to receive their donations and filled out
questionnaires. Subjects were privately compensated in cash before leaving. During the
whole time, subjects were instructed to finish their tasks independently without
interacting with others during the experiment—they sat behind black paper shields
without seeing others’ activities and were not allowed to talk with others.
Membership Manipulation. We used the following procedure to prevent
subjects from framing themselves as forced into membership. Upon arrival, subjects were
asked to choose an organization they would “like to get involved with” from a list of two
organizations, with a one-sentence vague mission statement for each. One of the
organizations was always the fictitious Education Service Club (ESC) (or Education
Service Association (ESA) in the control group). The other was a fictitious organization,
either the Society of Accounting Standards (SAS) or the Society of Warehousing
Standards (SWS) depending on the session, which we intentionally described in a way

132
that led very few subjects to make this choice. Those subjects picking the ESC (ESA)
continued with the experiment. Those choosing the SAS/SWS were taken to another
room and completed the questionnaires. Because they did not experience the rest of the
experiment, they were omitted from the analysis sample.3
Following the practice round, subjects in the treatment groups were told: “You
have chosen the Education Service Club, and are now being granted the membership in
the Education Service Club.” The experimenter then read a new member welcome letter
orally while subjects read the printed version. Those in the control group heard nothing
about membership. They were told instead: “You have chosen the Education Service
Association and here is more information about it.”
Club Identity Induction. The welcome letter was also used to induce the two
club identities and make them salient. It included not only the welcoming message, but
also basic information about the ESC’s mission, service projects and social activities, and
membership obligations. Immediately after reading the welcome letter, subjects in the
mission treatment were asked to highlight in the letter “at least 3 phrases that are directly
related to the ESC’s charitable mission,” in order to raise the salience of the service
identity. In contrast, subjects in the social treatment were asked to highlight “at least 3
phrases that are directly related to the ESC’s social activities,” in an effort to raise the
salience of the socializing identity.
Decision Task. All subjects received a short and neutral fundraising message
from the ESC (or ESA in the control group). For the control group, the fundraising
message, which was only four sentences long, introduced the charity’s mission and its
scholarship fund, and then requested donations by asking “please make a donation to the
133
ESA Scholarship Fund.” The message also stated “100% of your donation will benefit
students because an anonymous donor is covering all of the administration and
fundraising costs associated with this campaign” in an effort to remove heterogeneity
resulting from subjects making diverse assumptions about these matters. The message for
the treatment groups was identical, except that the organization was called ESC and the
charity’s mission statement was omitted (as it was presented already in the new member
welcome letter). The message was read aloud to subjects by the experimenters.
After reading the fundraising message, subjects were asked to complete the
allocation task, that is, to divide their 600-token endowment between a personal account
and the scholarship fund. They were told: “At the end of each session, tokens are
converted to real money at the rate of 100 tokens to $1. Your token donations will
become real donations to a scholarship fund you will choose from a list of real-world
charities.” 4 The money that a subject kept for herself was added to her $5 show-up fee to
determine her monetary compensation. Subjects were presented with multiple examples
and the opportunity to ask questions in an effort to minimize misunderstandings and
miscalculations. Then subjects were told to “place the tokens you wish to keep for
yourself in the envelope labeled ‘Personal Account,’ and place the tokens you wish to
donate in the envelope labeled ‘Charity.’” The envelopes were sealed by subjects and
then processed by an assistant in another room to preserve the anonymity of subject
decisions.
Questionnaires. Subjects completed questionnaires post-treatment. The first was
a psychometric scale designed to check whether those in the treatment group identified as
ESC members, adopted from Ellemers, Spears, and Doosje (1997).5 The second

134
contained 14 questions used to construct the Empathic Concern (EC) and Perspective
Taking (PT) scales (Davis, 1983). The EC and PT scales respectively allow us to control
for individual differences in the level of empathy with unfortunate others and tendency to
spontaneously adopt others’ psychological point of view.
Then, subjects completed the Unlikely Virtues (UV) scale (Patrick et al., 2002),
which allowed us to control for social desirability bias. Although anonymity is
guaranteed and explained to subjects, this scale serves as an additional check for any
subjects who do not understand or trust the anonymity procedure. The UV scale is the
sum of “true” responses to 14 true-false items that describe socially desirable behaviors
that are rarely true, such as “My opinions are always completely reasonable,” or “I have
never felt that I was better than someone else.”
Finally, a socio-demographic questionnaire asks about subjects’ basic socio-
demographic characteristics, including gender, age, ethnicity and race, educational level,
academic major, marital and parental status, and frequency of religious activities. In
addition, subjects were asked if they had made donations to any charities before, and if
they have/had membership in any public service clubs. Table II-2 provides summary
statistics.
[Table II-2]
Results
Our final sample includes 93 observations: 30 for the control group, 32 for
mission treatment, and 31 for social treatment.6 We report treatment effects in panel A of
Table II-3. Average token donations were 353.33 out of 600 in the control group.

135
Subjects in the mission treatment donated the largest average amount of tokens (365.63),
while those in the social treatments made the least (275.81). The corresponding median
tokens are 300, 400, and 200, showing similar patterns. Another measure of the treatment
effect is by the share of subjects who donated all their 600 tokens. 27% of participants in
the control group donated all, 38% in the mission treatment, and only 19% in the social
treatment.
[Table II-3]
Panel C of Table II-3 reports the nonparametric Wilcoxon–Mann–Whitney tests
to examine whether the amounts of donations between each pair of treatments come from
the same population.7 Results from independent sample t-tests, not displayed, are quite
similar. The difference between the two treatments is marginally significant at the 10%
level. However, the differences between mission and control and between social and
control are not statistically significant. While statistical difference tells whether the
results are likely to be due to chance, effect size helps understand the magnitude of the
difference between groups. Panel D of Table II-3 reports the effect size (Cohen’s d) of
the differences between conditions. Cohen (1988) interprets the effect size as small
(d = 0.2), medium (d = 0.5), and large (d ≥ 0.8). The Cohen’s d effect size suggests a
small practical difference between mission and social (d = 0.426) and between social and
control (d = 0.386). There is no effect for the difference between mission and control (d =
0.059).
Panel B of Table II-3 reports results for gender subsamples. Women in the control
group donated an average amount of 372.73 (median = 300). The average amount of

136
tokens donated increased to 423.68 (median = 500) in the mission treatment and
decreased to 268.42 (median=200) in the social treatment. The difference between the
mission and social treatments is significant at the 5% level, and the difference between
the social treatment and control group is marginally significant at the 10% level.
According to Panel D of Table II-3, there is a medium effect for the difference between
mission and social (d = 0.726) and that between social and control (d = 0.506). The effect
size is small for the difference between mission and control (d = 0.255). The pattern for
men was starkly different, with the largest mean donations for the social treatment
(309.09), followed by the control group (300). Those in the mission treatment donated the
lowest amount (280.77). There are no statistically significant or practical differences
between the groups.
Although random assignment obviates the need for covariates, we estimated
regressions to control for sampling variations that lead to departures from “all else held
equal” and report results in Table II-4. We used Tobit to account for the censoring of the
dependent variable at 0 and 600 tokens. The baseline specification includes treatment
dummies for social and control (mission was the omitted category), a female dummy, and
empathy measured as the sum of the empathic concern and perspective taking scores.8
Columns 1 and 2 of Table II-4 report the raw coefficients and unconditional average
marginal effects in the baseline specification. Compared with the mission treatment, the
social treatment has a negative average marginal effect on donations (-88.5 tokens),
which is statistically significant at the .10 level. This suggests that emphasizing personal
benefits leads to lower donations than stressing charitable missions. The difference in
donations between the control and mission treatments was not significant. The sum of
137
empathic concern and perspective taking scores has a small positive effect: a one
standard deviation increase in the combined score increases tokens donated by 37.90
(significant at the .10 level).9 This indicates that people with higher level of empathic
concern and perspective taking scores tend to be more generous. The gender effect is not
statistically significant in the baseline model.
Next, we allow treatment effects to vary with gender by adding interaction terms,
reporting results in columns 3 and 4 of Table II-4. A likelihood ratio test does not reject
the nested baseline model, but results of the less parsimonious specification are
sufficiently interesting to warrant their display. The social treatment, compared with the
mission treatment, still has a negative average marginal effect (-97.45 tokens) and is now
significant at the .05 level. The treatment effects between the control and mission
treatments are still not significantly different. Although the total effect of Female is not
significant, the partial effect of gender being female is large and positive (201.32 tokens)
and significant at the .10 level, whereas the interaction effect between Female and social
treatment is large and negative (-266.6 tokens) and significant at the .10 level. We can
interpret this as saying that females are more generous than males in the mission and
control groups, but have such a large negative reaction to the social treatment that they
become less generous than males in this group. The sum of the empathic concern and
perspective taking scores is not significant in this specification.10
We also conducted corresponding OLS and median regressions as robustness
checks and find similar patterns. Social treatment was equally significant in all
three estimations. However, the point estimate for the effect of the social treatment on
mean (median) donations ranges from -97.45 in tobit to -162.87 in OLS to -195 in

138
median regression. And the total effect of gender is significant for OLS, but not the other
two.
[Table II-4]
Although there are no significant difference of empathic concern and perspective
taking scores across conditions, we find that men (M = 38.16, SD = 7.60) and women (M
= 43.08, SD= 6.27) in our sample are significantly different in their empathic concern and
perspective taking scores (t = -3.1365, p = 0.0028). This leads us to examine donations
separately for the female and male subsamples respectively (Table II-5). For women, the
social treatment, compared with the mission treatment, has a large negative average
marginal effect on donations (-157.44 tokens), which is statistically significant at the .05
level. There is still no significant difference between the control and mission treatment.
The sum of the empathic concern and perspective taking scores is not significant. For
men, the treatment effects are not significant. Although the size of the subsamples is
small, the results further signify plausible gender differences in our experiment.
[Table II-5]
Discussion
Our results show that the way a person identifies with her club matters. Our two
treatments represent different ways of building members’ identity with the club –
focusing on the club’s charitable mission or private membership benefits. Consistent with
our hypothesis, subjects receiving the mission treatment gave significantly more than the
social treatment. Our model rationalizes this result in terms of context activating distinct
139
identities with different norm prescriptions. A service club setting where charitable
purposes are emphasized frames a contextual norm of altruism. When personal benefits
are emphasized, selfish behavior becomes more acceptable.
Our results are also consistent with motivational crowding-out theory. Donations
in the control and mission treatments were costly and fully anonymous, reinforcing the
conclusion of hundreds of studies that giving is, in part, intrinsically motivated. The
social treatment leads subjects to anticipate extrinsic rewards, such as having fun,
makings friends, and building professional networks and career opportunities. Hence,
motivational crowding-out is the greatest under the social treatment. As explained by
attribution theory, when extrinsic rewards are introduced to an intrinsically motivated
task, people are likely to attribute their behavior to extrinsic rewards and discount their
intrinsic motivation (Lepper, Greene, & Nisbett, 1973). In our social treatment, subjects
might think that making donations is in exchange for those benefits and hence decrease
their donations.
On the other hand, we did not find that those in the mission treatment gave
significantly more than the control group, although average donations were 38.83 tokens
higher in the mission treatment. This could be due to insufficiently strong induction of
new club members, and strong induction of group identification has been found necessary
when self-interest is added to the minimal group paradigm (Eckel and Grossman, 2005).
Or the fundraising letter given post-induction to the mission group may have interacted
with or superseded the induction of service identity. It may also because the subjects in
the control group were mission-primed by a simple reminder of the mission of the
association. In any case, we suggest future researchers experiment with alternative

140
induction tasks that manipulate the strength of identity and a more sophisticated
manipulation check to test the mechanisms.
An unexpected result from our experiment is the gender difference in donations.
We find that women have a significantly higher level of empathic concern and
perspective taking than men in our sample. Women in the social treatment donated
significantly less than those in the mission treatment. We did not find statistically
significant treatment effects for a small sample of men in our study. However, men in the
social treatment donated a larger amount than those in the mission treatment. The
findings are consistent with a recent study reporting that men are less willing to give to
poverty relief because of their low levels of empathic concern. When giving is framed as
consistent with self-interest, women are generally less motivated to give whereas men are
the opposite (Willer, Wimer, & Owens, 2015). It would be interesting for future research
to further explore the gender differences in charitable giving.
Conclusion
Service clubs support the private provision of collective goods, yet we know little
about their effectiveness in securing donations relative to non-membership based
nonprofit organizations. We find no evidence that soliciting donations from new
members offers advantage over soliciting donations from the general public. Our most
compelling finding is that focusing members’ attention on private membership benefits is
counterproductive, particularly for female members. Service club members build
connections with the club in different settings, which may lead to distinct club identities
and norm prescriptions. Reminding members of the networking opportunities and social

141
events may help build initial buy-in and attachment, but this may come at the cost of
identification with the club’s charitable mission. In contrast, although it may be difficult
in the short run, emphasizing mission-related projects may foster and certainly does not
hinder the altruistic mindset that leads to increased donations. Along this line, research is
needed to see whether social events and private membership benefits have large positive
impacts on the recruitment and retention of members. If so, lower donations per member
can be overcome by the resulting increase in the number of members.
The complex mixture of member benefits is behind our differing treatment
effects, that some aspects of membership oppose other aspects in determining member
generosity. We develop an identity-theory-based model that is consistent with our
findings, but point out that other theories are also consistent with results – motivational
crowdout, or the simple focusing of attention. Our model is testably distinct from these
other theories, providing an opportunity for further research on the mechanism behind
member generosity. Finally, future researchers can use this approach to study more
complicated funding structures. For example, when a service club structures campaigns
specific to members as well as seeking donations from the general public, how do the two
revenue streams interact? Do identity theory and/or motivational crowdout help us to
understand these interactions? How does gender affect charitable giving in service clubs?
Acknowledgements We thank the Science of Philanthropy Initiative and its funder, the John Templeton Foundation, for funding and helpful suggestions. Sara Konrath and Daniel Jones have been especially helpful. We have also received helpful remarks from Barbara J. Duffy, Ruth K. Hansen, Kevin Snapp, Xiaonan Kou, and Kathryn S. Steinberg.
142
Notes 1. In the full Nash Equilibrium, it matters whether we increase the salience of each
identity for one member or for all members, but aside from this, the twist has no impact on the nature of equilibrium.
2. The sessions were conducted in the summer and fall semesters of 2014. For each week of experiments, students could sign up for morning, noon, or afternoon sessions. Students were asked to list all their available times, and we later blindly assigned them to certain sessions based on their availability and session capacity. Sessions were cancelled if only one subject arrived as scheduled. That person was assigned to another session upon her agreement.
3. Only 12 out of 113 participants chose SAS or SWS, a reasonably low ratio. The majority of them were male actuarial science or accounting or economics students, with only one female participant choosing SAS/SWS. The combined empathic concern and perspective taking score on average (31.3) were lower than that in the full sample (41.3) and male subsample of our experiment (38.2).
4. Subjects did not see the list of real-world charities until they completed their allocation tasks. This order ensures that subjects’ allocation decisions are not influenced by their feelings about the real-world charities on the list.
5. The average identity score is 4.88 (SD = 1.93) in the mission treatment and 5.68 in the social treatment (SD = 2.17). There was not a significant difference in the scores between the two treatments (t = -1.56, p = 0.13). The scale is reliable (Cronbach’s α = .96) in measuring subjects’ identity with the club in each setting, but it lacks construct validity for comparing our treatments and inapplicable to our control group.
6. The 12 participants who did not choose to get involved with the ESC/ESA and were filtered out in the initial membership manipulation process, as well as 8 additional participants who did not complete or misunderstood the identity-induction task. The final sample was further adjusted because there were subjects who did not highlight the letter appropriately according to the instructions. For example, some highlighted both mission-aspect phrases and friends (or fun) in the mission treatment. Others highlighted fundraising and peer mentoring in the social treatment without highlighting anything regarding social events. It could because: 1) they did not pay attention to the instructions; or 2) they had different ideas about mission/social aspects. Either way, these cases may suffer from induction failure so we need to deal with these observations carefully. We first exclude 3 subjects because they did not complete the identity-induction task. We then excluded 4 subjects in the mission treatment because they highlighted social aspects of membership. Another subject highlighted the entire paragraphs concerning both mission and social aspects and so was excluded. 4 subjects in the social treatment highlighted all the mission aspects and none of the social aspects of membership. Hence, contrary to directions, they actually experienced the mission treatment. We re-assigned these subjects to the mission treatment in our main analysis, but also check robustness by excluding them from the analysis.
7. Without adjusting problematic observations, average donations in the social treatment are still lower than the mission treatment (297.14 vs. 313.64), but this difference is not statistically significant (p=0.76) in t-tests. The mission treatment has a lower mean (313.64) than the control group (353.33), but this difference is not significant

143
(p=0.46). The social treatment mean is still lower but not significantly different from the control group (p=0.27). If the problematic observations are dropped instead of being re-categorized, the mission and social treatment means are 351.79 and 275.81 (the difference is only significant at p=0.18). The control mean is not significantly different from the mission mean (p=0.98), although it is nearly significantly higher than the social mean (p=0.14). Nonparametric tests (the Mann-Whitney rank-sum test and Kruskal-Wallis equality-of-populations rank test) provide similar patterns.
8. We ran a variety of alternative specifications, not reported here, with additional controls including the Unlikely Virtue score (as a level or as a dummy equaling 1 when the score was very high), a dummy equaling 1 for the majors of philanthropic studies, social work, and nursing, and a dummy representing membership experience in any real-life service clubs. We also ran variants with interaction terms between these additional variables and the treatment variables. None of these additional variables were robustly significant, and inclusion of these variables had small effects on our baseline coefficients, although the p values for the treatment effects sometimes varied by a percentage point or two.
9. We also ran a regression with empathic-concern and perspective-taking scores as two separate independent variables, and found that the latter was positive and significant at the 10% level.
10. Similarly, we find that neither empathic concern nor perspective taking scores were significant when entered separately.
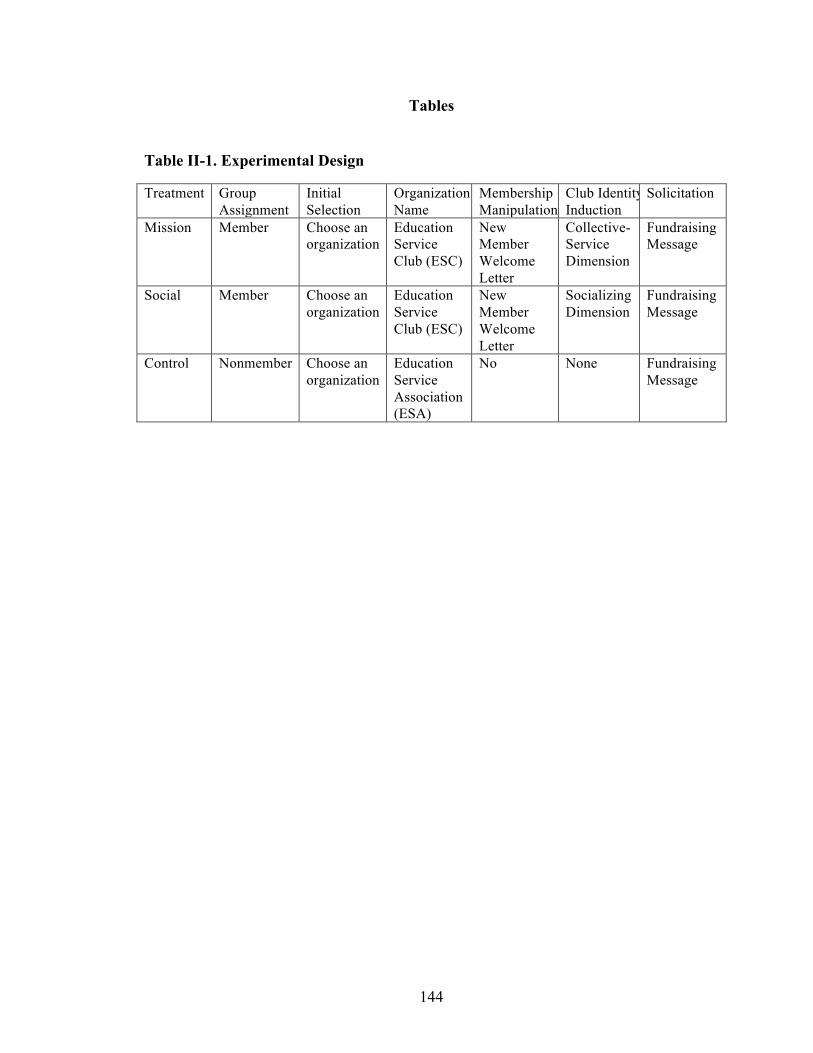
144
Tables Table II-1. Experimental Design Treatment Group
Assignment Initial Selection
Organization Name
Membership Manipulation
Club Identity Induction
Solicitation
Mission Member Choose an organization
Education Service Club (ESC)
New Member Welcome Letter
Collective-Service Dimension
Fundraising Message
Social Member Choose an organization
Education Service Club (ESC)
New Member Welcome Letter
Socializing Dimension
Fundraising Message
Control Nonmember Choose an organization
Education Service Association (ESA)
No None Fundraising Message
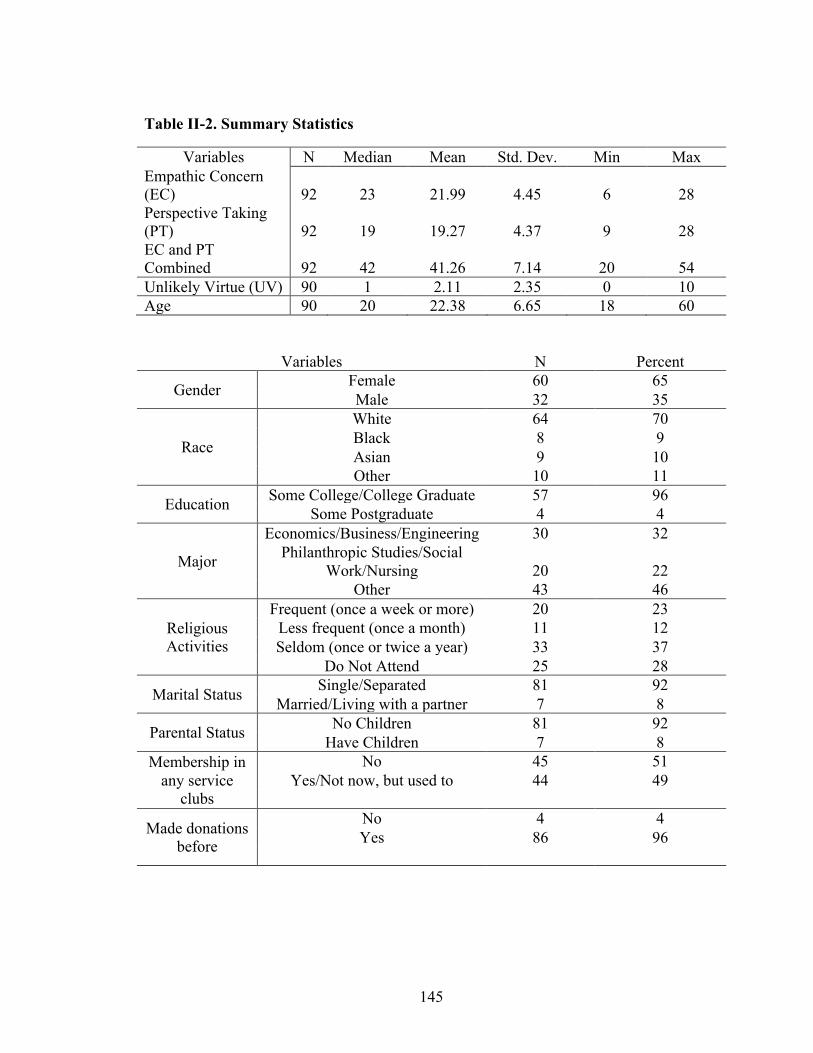
145
Table II-2. Summary Statistics
Variables N Median Mean Std. Dev. Min Max Empathic Concern (EC) 92 23 21.99 4.45 6 28 Perspective Taking (PT) 92 19 19.27 4.37 9 28 EC and PT Combined 92 42 41.26 7.14 20 54 Unlikely Virtue (UV) 90 1 2.11 2.35 0 10 Age 90 20 22.38 6.65 18 60
Variables N Percent
Gender Female 60 65 Male 32 35
Race
White 64 70 Black 8 9 Asian 9 10 Other 10 11
Education Some College/College Graduate 57 96 Some Postgraduate 4 4
Major
Economics/Business/Engineering 30 32 Philanthropic Studies/Social
Work/Nursing 20 22 Other 43 46
Religious Activities
Frequent (once a week or more) 20 23 Less frequent (once a month) 11 12 Seldom (once or twice a year) 33 37
Do Not Attend 25 28
Marital Status Single/Separated 81 92 Married/Living with a partner 7 8
Parental Status No Children 81 92 Have Children 7 8
Membership in any service
clubs
No 45 51 Yes/Not now, but used to 44 49
Made donations before
No 4 4 Yes 86 96

146
Table II-3. Treatment Effects Panel A Whole Sample Control Mission Social Average donations 353.33 365.63 275.81 Std.Dev 199.54 218.29 202.43 Median 300 400 200 Bottom 25% 200 125 100 Top 25% 600 600 450 Number of 0 donations 1 2 2 Number of 600-token donations 8 12 6 Number of subjects 30 32 31 Panel B Gender Difference
Treatment All Women Men Mean Median N Mean Median N Mean Median N
Control 353.33 300 30 372.73 300 22 300 300 8 Mission 365.63 400 32 423.68 500 19 280.77 300 13 Social 275.81 200 31 268.42 200 19 309.09 300 11 Panel C Wilcoxon-Mann-Whitney tests (p values) Treatment All Women Men Mission vs. Social 0.0982 0.0349 0.5928
Mission vs. Control 0.7295 0.3723 0.941
Social vs. Control 0.1315 0.0844 0.8658 Panel D Effect Size
All Effect Size (Cohen’s d) 95% Confidence Interval
Mission vs. Social 0.426 -0.073 0.926 Mission vs. Control 0.059 -0.44 0.557 Social vs. Control 0.386 -0.892 0.121 Women Mission vs. Social 0.726 0.069 1.382 Mission vs. Control 0.255 -0.361 0.871 Social vs. Control 0.506 -0.118 1.129 Men Mission vs. Social 0.145 -0.659 0.949 Mission vs. Control 0.089 -0.792 0.97 Social vs. Control 0.047 -0.958 0.864

147
Table II-4. Tobit Regressions on Donations, Full Sample (1) (2) Coefficients Unconditional
Average Marginal Effects
Coefficients Unconditional Average Marginal Effects
Social -128.537* -88.502* 28.099 -97.452** (74.620) (50.821) (113.604) (49.768) Control -38.829 -25.930 27.022 -33.401 (76.550) (51.067) (126.373) (50.029) Empathic Concern & Perspective Taking
7.823* 5.316* 6.565 4.468 (4.624) (3.070) (4.612) (3.087)
Female 65.579 45.154 201.319* 47.608 (67.584) (46.824) (108.404) (46.975) Female×Social -266.605* (149.541) Female×Control -125.962 (155.010) N 91 91 91 91 pseudo R2 0.010 0.013 Regressions estimated by double tobit with truncation at 0 and 600 tokens. Standard errors in parentheses * p < 0.10, ** p < 0.05, *** p < 0.01

148
Table II-5. Tobit Regressions on Donations, Female vs. Male Female Male Coefficients Unconditional
Average Marginal Effects
Coefficients Unconditional Average Marginal Effects
Social -241.672** -157.441** 28.256 21.787 (103.992) (65.264) (103.196) (79.546) Control -99.600 -60.310 24.811 19.135 (99.997) (59.722) (116.536) (89.774) Empathic Concern & Perspective Taking
7.327 4.635 5.460 4.208 (6.526) (4.071) (6.302) (4.767)
N 59 59 32 32 pseudo R2 0.014 0.002 Regressions estimated by double tobit with truncation at 0 and 600 tokens. Standard errors in parentheses * p < 0.10, ** p < 0.05, *** p < 0.01
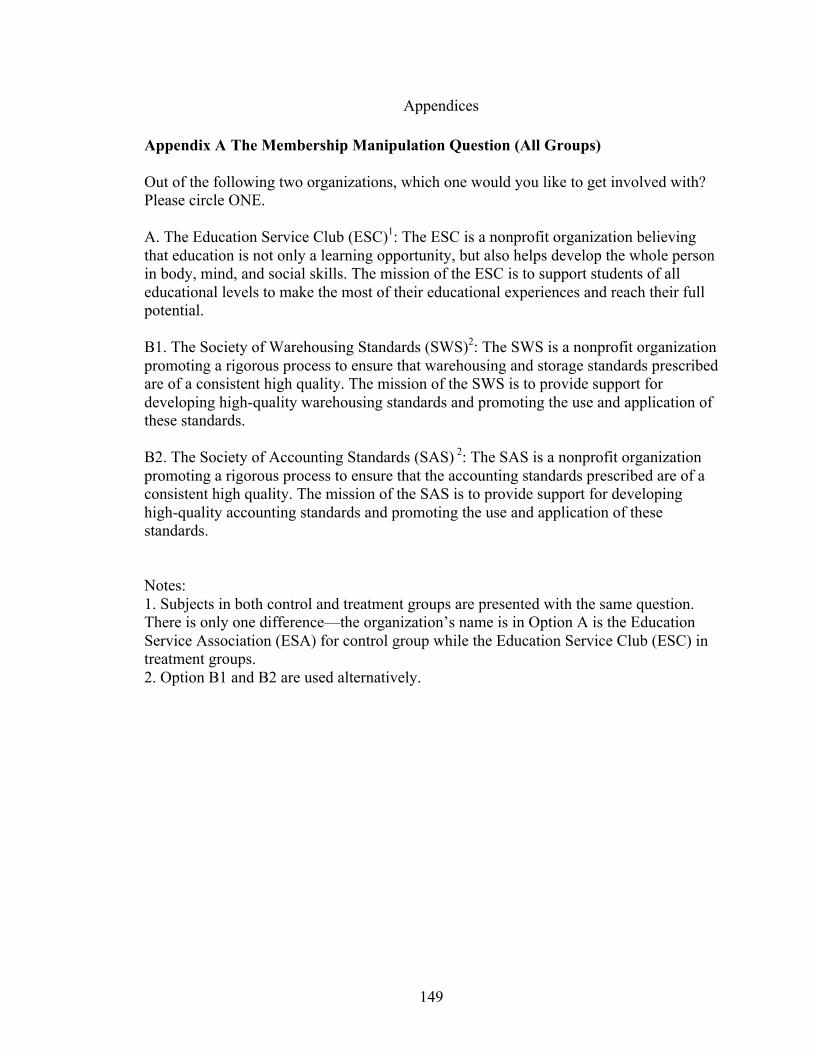
149
Appendices
Appendix A The Membership Manipulation Question (All Groups) Out of the following two organizations, which one would you like to get involved with? Please circle ONE. A. The Education Service Club (ESC)1: The ESC is a nonprofit organization believing that education is not only a learning opportunity, but also helps develop the whole person in body, mind, and social skills. The mission of the ESC is to support students of all educational levels to make the most of their educational experiences and reach their full potential. B1. The Society of Warehousing Standards (SWS)2: The SWS is a nonprofit organization promoting a rigorous process to ensure that warehousing and storage standards prescribed are of a consistent high quality. The mission of the SWS is to provide support for developing high-quality warehousing standards and promoting the use and application of these standards. B2. The Society of Accounting Standards (SAS) 2: The SAS is a nonprofit organization promoting a rigorous process to ensure that the accounting standards prescribed are of a consistent high quality. The mission of the SAS is to provide support for developing high-quality accounting standards and promoting the use and application of these standards. Notes: 1. Subjects in both control and treatment groups are presented with the same question. There is only one difference—the organization’s name is in Option A is the Education Service Association (ESA) for control group while the Education Service Club (ESC) in treatment groups. 2. Option B1 and B2 are used alternatively.

150
Appendix B . Instructions for Practice Decision (All Groups) You are asked to participate in a study of individual decision-making. This study has been designed to maintain the anonymity of each participant’s decision. To preserve this anonymity, we ask that from this point on, there be NO TALKING among the participants and that all participants take precautions to maintain the confidentiality of their materials. The instructions are simple and please follow them carefully. You will be paid in cash in private at the end of the session. We will first explain the allocation problem, and conduct a practice decision round to familiarize you with the process. Then we will proceed to the actual decision round. Your Packet for Practice Decision Round. Before we begin, please verify that you have the following items before you on your desk.
• Instructions sheets • 600 tokens • An empty envelope named “Charity for Practice” • An empty envelope named “Personal Account for Practice”
Do you have any questions about your packet? The Allocation Problem. You have been given 600 tokens to use in this study in place of money. You can keep any share of these tokens for yourself or donate any share of these tokens to a charity named ABC. At the end of the study, tokens will be converted to real money at the rate of 100 tokens to $1. Your token donations will become real donations to a charitable organization that you will choose from a list of real-world charities. For example, if you keep 250 tokens for yourself and donate 350 tokens to ABC in this study, you will receive $2.50 in addition to your $5 show-up fee, and a real scholarship fund will receive $3.50. More examples are specified in the following table, please take a minute to read the table: Tokens to
Yourself Your
Additional Cash Payment
Tokens to ABC
Donations to a Real-World
Charity Example 1 0 0 600 $6 Example 2 100 $1 500 $5 Example 3 200 $2 400 $4 Example 4 300 $3 300 $3 Example 5 400 $4 200 $2 Example 6 500 $5 100 $1 Example 7 550 $5.5 50 $0.5 Example 8 600 $6 0 0

151
These are only examples. You may allocate any amount of your tokens to yourself and to charity. The only restriction is that the sum of your allocation to yourself plus your allocation to charity must equal to 600 tokens; you must allocate all 600 tokens between yourself and charity. Do you have any questions about the allocation problem? Practice Round. To illustrate your decision tasks, we will go through a practice round of the allocation problem. We will not practice choosing a real-world charity in this round. Nothing you do in this practice round will affect your payment in this study. Now decide how many tokens you how many you wish to keep for yourself, and how many you want to donate. You must allocate all 600 tokens. Use the tokens and envelopes for practice: 1. Please place the tokens you wish to keep for yourself in the envelope labeled “Personal Account for Practice,” and 2. Place the tokens you wish to donate to the charity ABC in the envelope labeled “Charity for Practice.” (In the actual decision round, you will seal the envelopes. However, you are not asked to seal them in this practice round, because we want to save some envelopes for future use. ) Do you have any questions about the decision making process? (Now put your packet aside. Our assistant will collect the used packet except for the instructions, and give you a new packet for actual decision round. Please DO NOT open the new packet until I ask you to. While our assistant is working on your packets, let us observe the anonymity procedure together.) Anonymity. This study has been designed to maintain the anonymity of each participant’s decision. The researchers and assistants will not know how many tokens you donate and how many you keep for yourself. We keep track of your payments without knowing your identity by the following procedure. 1. Nobody in the room will see how many tokens you place in your Personal Account
envelope or your Charity envelope. Both will be sealed by yourself.
2. Your envelopes will be brought by our first assistant to our second assistant in another room. The second assistant will see your Claim Check Number, but does not meet you or see your name (you will receive your Claim Check Number shortly). After the first assistant leaves the room, the second assistant will open the envelopes and process them. The second assistant will count the tokens in your Personal Account envelope, calculate your payment, and place the appropriate amount of money in an envelope labeled with your Claim Check Number, but not your name.

152
This envelope is sealed before the first assistant returns to pick up the envelopes and bring them back to your room.
3. You claim your payment envelope by matching your Claim Check Number with that
on the payment envelopes delivered to your room. 4. In the actual decision round, if you decide to donate, you will be asked to choose a
real-world charity from a list, and sign a Delegation of Authority form. The former contains a Claim Check Number, while the latter does not. The researchers will record donations to each charity on the list by matching your Claim Check Number, and see confirmation that someone with your Number has signed a Delegation of Authority form. The Delegation of Authority form is prepared for IUPUI’s Finance and Administration. The researchers will not open the Delegation of Authority form until finishing all recording, so not be able to match your Number on the charity list with your signature on the Delegation of Authority form.
5. After receiving your payment, you will also be asked to sign a payment receipt. The
payment receipt is for accounting purpose only. No one else except for the accountant will open the sealed envelope.
In short, no one will be able to tie your name with your decision made in this study. Do you have any questions about the anonymity procedure? Your Packet for Actual Decision Round. Now please verify that you have the following items before you on your desk. Please DO NOT open any envelopes until I ask you to.
• A small envelope named “Charity” • A small envelope named “Personal Account” • A small envelope named “Real-World Charity” • A small envelope named “Delegation” • A small envelope named “For Accountant Only” • A big envelope named “Questionnaires” • A big envelope named “Instructions” • 600 tokens attached to the “Instructions” envelope
Your Claim Check # is tagged on top of your “Questionnaires” envelope, also at the back of your “Charity” and “Personal Account” envelope. Please check if the Claim Check # is the same for all these three envelopes. If not, raise your hand. Please take the tokens from your “Instructions” envelope, and count if there are 600 tokens in total. If not, raise your hand. Do you have any other questions about your packet?

153
Appendix C . Instructions for Actual Decision (Control Group) Now we are ready to begin the actual decision round, in which you will apply what you just learned in the practice round. The only difference between the practice and actual decision round is that you will be asked to fill out some forms and questionnaires in addition to the allocation task. Now, open the Instructions envelope in your new packet. Please DO NOT open any other envelopes at this point. About the Education Service Association (ESA). You have chosen the Education Service Association and here is more information about it. The Education Service Association is a charity whose mission is to enhance the educational experiences of students from elementary school to college. In particular, the ESA Scholarship Fund provides support for minority, disabled, as well as first-generation college students. Please make a donation to the ESA Scholarship Fund. 100% of your donation will benefit students because an anonymous donor is covering all of the administration and fundraising costs associated with this campaign. The Allocation Problem. As in the practice round, you have been given 600 tokens to use in place of money. You can keep any share of these tokens for yourself or donate any share of the tokens to the ESA Scholarship Fund. At the end of the study, tokens will be converted to real money at the rate of 100 tokens to $1. Your token donations will become real donations to a scholarship fund you will choose from a list of real-world charities. For example, if you keep 350 tokens for yourself and donate 250 tokens to the ESA Scholarship Fund, you will receive $3.50 in addition to your $5 show-up fee, and a real scholarship fund will receive $2.50. More examples are specified in the following table: Tokens to
Yourself Your Additional Cash Payment
Tokens to the ESA
Scholarship Fund
Donations to a Real-World
Charity
Example 1 0 0 600 $6 Example 2 100 $1 500 $5 Example 3 200 $2 400 $4 Example 4 300 $3 300 $3 Example 5 400 $4 200 $2 Example 6 500 $5 100 $1 Example 7 550 $5.50 50 $0.50 Example 8 600 $6 0 0
These are only examples. You may allocate any amount of the tokens between yourself and the ESA Scholarship Fund. The only restriction is that the sum of the allocation to yourself plus the allocation to the ESA Scholarship Fund must equal to 600 tokens.

154
Decision Making. Now decide how many tokens you wish to keep for yourself, and how many tokens you want to donate to the ESA Scholarship Fund. The illustration chart attached is to guide you through all the steps. Please follow my instructions step by step. Step 1: Please place the tokens you wish to keep for yourself in the envelope labeled “Personal Account,” and place the tokens you wish to donate in the envelope labeled “Charity.” Make sure you have put all 600 tokens into these two envelopes, and then seal the envelopes. Our first assistant is collecting all your sealed envelopes and bring them to our second assistant who is waiting in another room. The second assistant will calculate your payment according to the tokens in your envelopes. Everyone will receive a payment envelope, whether or not they designate tokens for themselves. Step 2: Please open the envelope named “Real-World Charity.” There is a form labeled “Make a Donation on My Behalf to this Charity.” Use this form to choose a real-world charity if you put tokens in your Charity envelope. Be sure to check the box on the bottom of the page confirming your willingness to delegate authority to make this donation. If you don’t, we cannot make a donation for you. Also, please double check if the Claim Check Number on top of the form is right; if not, please let us know. Then place the completed form back in the Real-World Charity envelope and seal it. Step 3: Please open the envelope labeled “Delegation.” There is a form named “Delegation of Authority to Donate” in the envelope. Please sign the form if you put tokens in your Charity envelope (you are the person authorizing). Then put the completed form back to the Delegation envelope and seal it. Step 4: Please open the envelope labeled “Questionnaires.” There are four short questionnaires in the envelope. Please fill out the questionnaires. Three out of the four questionnaires are double-sided, so please turn over to complete the questionnaires. After completing all the questionnaires, put them back to the Questionnaires envelope and seal it. Step 5: Our first assistant comes back with payment envelopes. You can claim your payment by matching your Claim Check Number with that on the payment envelope. Please check if the payment amount is right. If not, let us know. Step 6: Now, please open the envelope labeled “For Accountant Only.” There is a form named “Payment Receipt” in the envelope. After confirming that your payment amount is correct, sign the form and put it back in the For Accountant Only envelope. The sealed envelope will then be brought to the accountant. No one else except for the accountant will see your receipt. This ends the experiment, please leave on the desk all your materials except for your payment envelope, and you are free to leave. Please do not discuss what you did in this experiment with your classmates who have not participated. Let them make their decisions independently in their sessions. Thank you very much for your participation!

155
Appendix D . Instructions for Actual Decision (Treatment Groups) Now we are ready to begin the actual decision round, in which you will apply what you just learned in the practice round. The only difference between the practice and actual decision round is that you will be asked to fill out some forms and questionnaires in addition to the allocation task. Now, open the Instructions envelope in your new packet. Please DO NOT open any other envelopes at this point. About the Education Service Club (ESC). You have chosen the Education Service Club, and are now being granted the membership in the Education Service Club. In your Instructions envelope, there is a letter from the Education Service Club. Let us read the letter together. Mission treatment: In the letter, there is a section subtitled “Projects and Activities” (the third and fourth paragraphs). It provides detailed information about both the ESC’s service projects and social activities. In this section, please find and highlight at least 3 phrases that are directly related to the ESC’s charitable mission. Social treatment: In the letter, there is a section subtitled “Projects and Activities” (the third and fourth paragraphs). It provides detailed information about both the ESC’s service projects and social activities. In this section, please find and highlight at least 3 phrases that are directly related to the ESC’s social activities. About the ESC Scholarship Fund. It provides support for minority, disabled, as well as first-generation college students. Please make a donation to the ESC scholarship fund. 100% of your donation will benefit students because an anonymous donor is covering all of the administration and fundraising costs associated with this campaign. The Allocation Problem. As in the practice round, you have been given 600 tokens to use in place of money. You can keep any share of these tokens for yourself or donate any share of the tokens to the ESC Scholarship Fund. At the end of the study, tokens will be converted to real money at the rate of 100 tokens to $1. Your token donations will become real donations to a scholarship fund you will choose from a list of real-world charities. For example, if you keep 350 tokens for yourself and donate 250 tokens to the ESC Scholarship Fund in this study, you will receive $3.50 in addition to your $5 show-up fee, and a real scholarship fund will receive $2.50. More examples are specified in the following table:

156
Tokens to Yourself
Your Additional Cash Payment
Tokens to the ESC Scholarship Fund
Donations to a Real-World
Charity Example 1 0 0 600 $6 Example 2 100 $1 500 $5 Example 3 200 $2 400 $4 Example 4 300 $3 300 $3 Example 5 400 $4 200 $2 Example 6 500 $5 100 $1 Example 7 550 $5.5 50 $0.5 Example 8 600 $6 0 0
These are only examples. You may allocate any amount of the tokens between yourself and the ESC Scholarship Fund. The only restriction is that the sum of the allocation to yourself plus the allocation to the ESC Scholarship Fund must equal to 600 tokens. Decision Making. Now decide, as an ESC member, how many tokens you wish to keep for yourself, and how many tokens you want to donate to the ESC Scholarship Fund. The illustration chart attached is to guide you through all the steps. Please follow my instructions step by step. Step 1: Please place the tokens you wish to keep for yourself in the envelope labeled “Personal Account,” and place the tokens you wish to donate in the envelope labeled “Charity.” Make sure you have put all 600 tokens into these two envelopes, and then seal the envelopes. Our first assistant is collecting all your sealed envelopes and bring them to our second assistant who is waiting in another room. The second assistant will calculate your payment according to the tokens in your envelopes. Everyone will receive a payment envelope, whether or not they designate tokens for themselves. Step 2: Please open the envelope named “Real-World Charity.” There is a form labeled “Make a Donation on My Behalf to this Charity.” Use this form to choose a real-world charity if you put tokens in your Charity envelope. Be sure to check the box on the bottom of the page confirming your willingness to delegate authority to make this donation. If you don’t, we cannot make a donation for you. Also, please double check if the Claim Check Number on top of the form is right; if not, please let us know. Then place the completed form back in the Real-World Charity envelope and seal it. Step 3: Please open the envelope labeled “Delegation.” There is a form named “Delegation of Authority to Donate” in the envelope. Please sign the form if you put tokens in your Charity envelope (you are the person authorizing). Then put the completed form back to the Delegation envelope and seal it.

157
Step 4: Please open the envelope labeled “Questionnaires.” There are four short questionnaires in the envelope. Please fill out the questionnaires. Three out of the four questionnaires are double-sided, so please turn over to complete the questionnaires. After completing all the four questionnaires, put them back to the Questionnaires envelope and seal it. Step 5: Our first assistant comes back with payment envelopes. You can claim your payment by matching your Claim Check Number with that on the payment envelope. Please check if the payment amount is right. If not, let us know. Step 6: Now, please open the envelope labeled “For Accountant Only.” There is a form named “Payment Receipt” in the envelope. After confirming that your payment amount is correct, sign the form and put it back in the For Accountant Only envelope. The sealed envelope will then be brought to the accountant. No one else except for the accountant will see your receipt. This ends the experiment, please leave on the desk all your materials except for your payment envelope, and you are free to leave. Please do not discuss what you did in this experiment with your classmates who have not participated. Let them make their decisions independently in their sessions. Thank you very much for your participation!

158
Appendix E . Welcome Letter to New Members (Treatment Groups)
Ladies and Gentlemen, On behalf of the officers and members of the Education Service Club (ESC), I want to express our sincere pleasure at your presence here. You have been invited to become members and it is my privilege and honor today to welcome you into membership in the ESC. You are now uniting with other ESC members who share a dedication to our common mission. Mission: The mission of the ESC is to enhance the educational experiences of students from elementary school to college. Your membership in the ESC will help us carry on this legacy and share in this effort. Projects and Activities: Becoming an ESC member gives you the opportunity to help improve education by participating in a variety of projects. For example, you can assist students in need by making contributions to our scholarship fund, providing adult or peer mentoring, and organizing and attending fundraising activities to solicit support from other people in the community. Being an ESC member is also fun. There are numerous social activities for our members and guests, through which you will make new friends and build professional connections. In recent years, activities have included monthly luncheons and dinner gatherings, annual picnic and holiday party, outings to the Shakespeare Festival, and college sporting events. Membership Obligations: By holding membership in the ESC, you agree to accept the obligations of membership to:
• Promote the mission of the ESC; • Participate in club service projects and meetings; • Attend social activities.
Welcome to the Education Service Club! We are all extremely proud and happy to have you as a fellow ESC member!

159
Appendix F . Forms and Questionnaires
Claim Check Number__________________
Make a Donation on My Behalf to this Charity (All Groups)
The following is a list of real world charities with scholarship funds. First, please choose ONE charity you wish to donate. Next, check the box to confirm you willingness to delegate the Principal Investigators authority to donate. After completing this form, put it into the Real-World Charity envelope and seal it. In order to maintain your anonymity, you will not receive individual receipts for donations so your donations today may not be deductible.
1. Indiana University Foundation The IU Foundation was established in 1936 “to fulfill a dream of educational opportunity for all.” You can donate to a student scholarship fund by specifying a school, unit, or program on the Indianapolis campus that you wish to support __________________________________________________________________
2. Central Indiana Community Foundation Scholarship Funds
“Central Indiana Community Foundation (CICF) is committed to college success for students through the power of scholarships.” CICF’s Indianapolis Foundation Community Scholarship Fund and the Legacy Fund Community Scholarship Fund were established to support students from Marion County and Hamilton County pursuing higher education respectively.
3. Rotary International Rotary International is an international public service club with a commitment to “service, fellowship, diversity, integrity, and leadership.” Education is one of its areas of focus. Rotary clubs support “basic education and literacy, reduce gender disparity in education, and increase adult literacy.”
4. Scholarship America Scholarships
Scholarship America’s mission is to “mobilize America, through scholarships and educational support, to make postsecondary success possible for all students.”
☐I am willing to delegate the Principal Investigators of this study the authority to donate on my behalf to the charity that I choose above. The amount I authorize for donation is determined by my decisions in the study, as specified in the instructions.
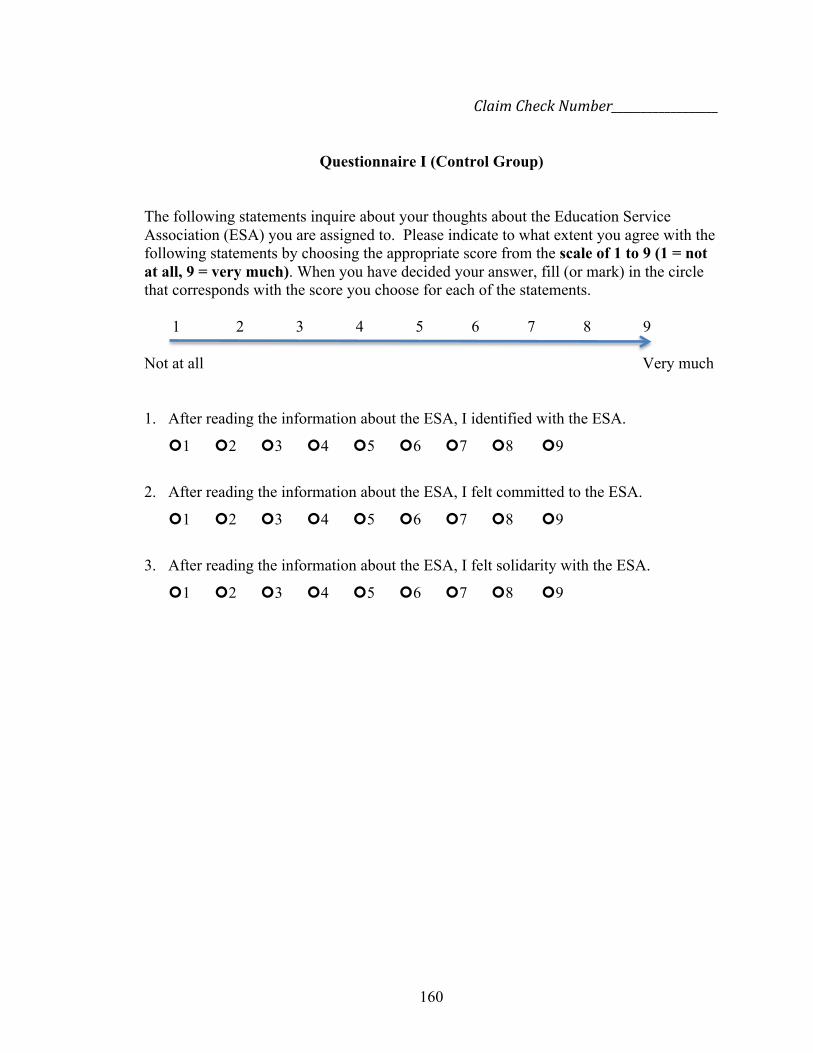
160
Claim Check Number__________________
Questionnaire I (Control Group)
The following statements inquire about your thoughts about the Education Service Association (ESA) you are assigned to. Please indicate to what extent you agree with the following statements by choosing the appropriate score from the scale of 1 to 9 (1 = not at all, 9 = very much). When you have decided your answer, fill (or mark) in the circle that corresponds with the score you choose for each of the statements.
1 2 3 4 5 6 7 8 9
Not at all Very much 1. After reading the information about the ESA, I identified with the ESA.
¢1 ¢2 ¢3 ¢4 ¢5 ¢6 ¢7 ¢8 ¢9
2. After reading the information about the ESA, I felt committed to the ESA.
¢1 ¢2 ¢3 ¢4 ¢5 ¢6 ¢7 ¢8 ¢9
3. After reading the information about the ESA, I felt solidarity with the ESA.
¢1 ¢2 ¢3 ¢4 ¢5 ¢6 ¢7 ¢8 ¢9

161
Claim Check Number__________________
Questionnaire I (Treatment Groups) The following statements inquire about your thoughts about the Education Service Club (ESC) you are assigned to. Please indicate to what extent you agree with the following seven statements by choosing the appropriate score from the scale of 1 to 9 (1 = not at all, 9 = very much). When you have decided your answer, fill (or mark) in the circle that corresponds with the score you choose for each of the statements.
1 2 3 4 5 6 7 8 9
Not at all Very much 1. After reading the letter from the ESC, I identified with the ESC.
¢1 ¢2 ¢3 ¢4 ¢5 ¢6 ¢7 ¢8 ¢9
2. After reading the letter from the ESC, I saw myself as an ESC member.
¢1 ¢2 ¢3 ¢4 ¢5 ¢6 ¢7 ¢8 ¢9
3. After reading the letter from the ESC, I was happy to belong to the ESC.
¢1 ¢2 ¢3 ¢4 ¢5 ¢6 ¢7 ¢8 ¢9
4. After reading the letter from the ESC, I felt committed to the ESC.
¢1 ¢2 ¢3 ¢4 ¢5 ¢6 ¢7 ¢8 ¢9
5. After reading the letter from the ESC, I felt solidarity with the ESC.
¢1 ¢2 ¢3 ¢4 ¢5 ¢6 ¢7 ¢8 ¢9
6. After reading the letter from the ESC, I felt I fit into the ESC.
¢1 ¢2 ¢3 ¢4 ¢5 ¢6 ¢7 ¢8 ¢9
7. After reading the letter from the ESC, I felt I was similar to other ESC members.
¢1 ¢2 ¢3 ¢4 ¢5 ¢6 ¢7 ¢8 ¢9

162
Claim Check Number__________________
Questionnaire II (All Groups)
The following statements inquire about your thoughts and feelings in a variety of situations. For each item, indicate how well it describes you by choosing the appropriate letter on the scale: A, B, C, D, or E (A = does not describe me at all, E = describes me very well). When you have decided your answer, fill (or mark) in the circle that corresponds with the letter you choose for each statements. Please read each item carefully before responding. Answer as honestly as you can. Thank you. ANSWER SCALE: A B C D E DOES NOT DESCRIBES ME DESCRIBE ME VERY AT ALL WELL
1. I often have tender, concerned feelings for people less fortunate than me.
¢A ¢B ¢C ¢D ¢E
2. I sometimes find it difficult to see things from the "other guy's" point of view. ¢A ¢B ¢C ¢D ¢E
3. Sometimes I don't feel very sorry for other people when they are having
problems. ¢A ¢B ¢C ¢D ¢E
4. I try to look at everybody's side of a disagreement before I make a decision.
¢A ¢B ¢C ¢D ¢E
5. When I see someone being taken advantage of, I feel kind of protective towards
them. ¢A ¢B ¢C ¢D ¢E
PLEASE TURN OVER AND COMPLETE THE OTHER SIDE.

163
ANSWER SCALE: A B C D E DOES NOT DESCRIBES ME DESCRIBE ME VERY AT ALL WELL
6. I sometimes try to understand my friends better by imagining how things look from their perspective. ¢A ¢B ¢C ¢D ¢E
7. Other people's misfortunes do not usually disturb me a great deal.
¢A ¢B ¢C ¢D ¢E
8. If I'm sure I'm right about something, I don't waste much time listening to other
people's arguments. ¢A ¢B ¢C ¢D ¢E
9. When I see someone being treated unfairly, I sometimes don't feel very much pity
for them.
¢A ¢B ¢C ¢D ¢E
10. I am often quite touched by things that I see happen. ¢A ¢B ¢C ¢D ¢E
11. I believe that there are two sides to every question and try to look at them both.
¢A ¢B ¢C ¢D ¢E
12. I would describe myself as a pretty soft-hearted person.
¢A ¢B ¢C ¢D ¢E
13. When I'm upset at someone, I usually try to "put myself in his shoes" for a while. ¢A ¢B ¢C ¢D ¢E
14. Before criticizing somebody, I try to imagine how I would feel if I were in their
place. ¢A ¢B ¢C ¢D ¢E

164
Claim Check Number__________________
Questionnaire III (All Groups)
For each of the following statements, please indicate if it describes you accurately. If the statement is true, circle a) on your answer sheet; if the statement is false, circle b) on your answer sheet. Please read each item carefully before responding. Answer as honestly as you can. Thank you.
1. I have occasionally felt discouraged about something. a) True b) False
2. My table manners are not always perfect.
a) True b) False
3. I have always been extremely courageous in facing difficult situations.
a) True b) False
4. At times I have been envious of someone.
a) True b) False
5. My opinions are always completely reasonable.
a) True b) False
6. I have at times eaten too much.
a) True b) False
7. I have always been completely fair to others.
a) True b) False
8. I have at times been angry with someone.
a) True b) False
9. I always tell the entire truth.
a) True b) False
PLEASE TURN OVER AND COMPLETE THE OTHER SIDE.

165
10. Sometimes I’m a bit lazy. a) True b) False
11. Never in my whole life have I taken advantage of anyone.
a) True b) False
12. I have sometimes felt slightly hesitant about helping someone who asked me to.
a) True b) False
13. I have never felt that I was better than someone else.
a) True b) False
14. Never in my whole life have I wished for something that I was not entitled to.
a) True b) False

166
Claim Check Number__________________
Questionnaire IV (All Groups)
The questionnaire asks questions about you. We are asking these questions because we wish to understand the correlations between demographic characteristics (e.g. gender or education) and decision making. We will not be able to match these characteristics to your name. All the information is reported in aggregate form only, and no personally identifiable information is released. When you have decided your answer, fill (or mark) in the circle that corresponds with the choice (or write down the answer directly for some questions). 1. Are you:
¢Male ¢Female
2. In what year you were born? _____
3. Do you identify yourself as Hispanic or Latino?
¢Yes ¢No
4. Are you:
¢White ¢Black or African American ¢American Indian or Alaska Native ¢Native Hawaiian or Other Pacific Islander ¢Asian ¢Other
5. What is the highest level of education you have completed?
¢Some high school or high school graduate or passed the GED tests ¢Some college ¢Trade/technical/vocational training ¢College graduate ¢Some postgraduate work ¢Post graduate degree
6. What is your major?
¢Economics/Business ¢Philanthropic Studies/Social Work/Nursing ¢Other (please specify)________________ ¢Haven’t decided
PLEASE TURN OVER AND COMPLETE THE OTHER SIDE.

167
7. How often do you attend religious activities/services?
¢Do not attend ¢About once every year ¢About once every six months ¢About once every month ¢Once a week ¢More than once a week
8. What is your marital status?
¢Single/Never been married ¢Married/Living with a partner in long-term committed relationship ¢Separated/Divorced/Widowed ¢I prefer not to say
9. Do you have children?
¢Yes ¢No ¢I prefer not to say
10. Are you a member of any public-service clubs (e.g. Lions Clubs, Rotary Clubs,
Kiwanis, BEAN, DoSomething. org., etc.)? ¢Yes ¢Not now, but I used to be ¢No, I never was
11. Have you made donations to any charities before? ¢Yes ¢No

168
References
Akerlof, G. A., & Kranton, R. E. (2000). Economics and Identity. Quarterly Journal of
Economics , 115 (3), 715-753. Andreoni, J. (1988). Privately Provided Public Goods in a Large Economy: The Limits of
Altruism. Journal of Public Economics , 35, 57-73. Andreoni, J. (1989). Giving with Impure Altruism: Applications to Charity and Ricardian
Equivalence. Journal of Political Economy , 97, 1447-1458. Andreoni, J., & Payne, S. A. (2013). Charitable Giving. In A. J. Auerbach, R. Chetty, M.
Feldstein, & E. Saez (Eds.), Handbook of Public Economics, Vol. 5 (pp. 1-50). North Holland.
Bénabou, R., & Tirole, J. (2006). Incentives and Prosocial Behavior. American Economic Review, 96 (5), 1652-1678.
Charles, J. A. (1993). Service Clubs in American Society: Rotary, Kiwanis, and Lions. Urbana and Chicago: University of Illinois Press.
Chen, Y., & Li, S. (2009). Group Identity and Social Preferences . The American Economic Review , 99 (1), 431-457.
Clark, P. B., & Wilson, J. Q. (1961). Incentive Systems: A Theory of Organizations. Administrative Science Quarterly , 6 (2), 129-166.
Cohen, J. (1988). Statistical Power Analysis for the Behavioral Sciences (2. Auflage). Hillsdale, NJ: Erlbaum.
Cornes, R., & Sandler, T. (1985). “The Simple Analytics of Public Good Provision. Economica , 52, 103–116.
Davis, M. H. 1983. “Measuring Individual Differences in Empathy: Evidence for a Multidimensional Approach. “Journal of Personality and Social Psychology, 44, 113–126.
Deci, E. L. (1971). Effects of Externally Mediated Rewards on Intrinsic Motivation. Journal of Personality and Social Psychology , 18 (1), 105-115.
Deci, E. L., & Ryan, R. M. (1985). Intrinsic Motivation and Selfdetermination in Human Behavior. New York: Plenum.
Deci, E. L., Koestner, R., & Ryan, R. M. (1999). A Meta-Analytic Review of Experiments Examining the Effects of Extrinsic Rewards on Intrinsic Motivation. Psychological Bulletin , 125 (6), 627-668.
Eckel, C. C., & Grossman, P. P. (2005). Managing Diversity by Creating Team Identity. Journal of Economic Behavior and Organization , 58 (3), 371-392.
Eikenberry, A. M. (2006). Giving Circles: Growing Grassroots Philanthropy. Nonprofit and Voluntary Sector Quarterly , 35, 517-532.
Ellemers, N., Spears, R., & & Doosje, B. (1997). Sticking Together or Falling Apart: In-group Identification as a Psychological Determinant of Group Commitment versus Individual Mobility. Journal of Personality and Social Psychology, 72, 617–626.
Frey, B. S., & Goette, L. (1999). Does Pay Motivate Volunteers? Mimeo. Frey, Bruno S., & Jegen, Reto. (2000). Motivation Crowding Theory. Journal of
Economic Surveys, 15(5), 589-611.

169
Gneezy, U., & Rustichini, A. (2000). Pay Enough or Don't Pay at All . The Quarterly Journal of Economics , 115 (3), 791-810 .
Goette, L., & Stutzer, A. (2008). Blood Donations and Incentives: Evidence from a Field Experiment. IZA Working Paper , No. 3580.
Kandori, M. (1992). Social Norms and Community Enforcement. Review of Economic Studies , 59, 63-80.
Lacetera, N., Macis, M., & Slonim, R. (2012). Will There Be Blood? Incentives and Displacement Effects in Pro-Social Behavior . American Economic Journal: Economic Policy , 4 (1), 186-223 .
Lepper, M. R., Greene, D., & Nisbett, R. E. (1973). Undermining Children's Intrinsic Interest with Extrinsic Rewards: A Test of the "Overjustification" Hypothesis. Journal of Personality and Social Psychology , 129-137.
Lions Clubs International. (n.d.). Mission and History. Retrieved August 22, 2015, from Lions Clubs International: http://www.lionsclubs.org/EN/who-we-are/mission-and-history/index.php
Mellström, C., & Johannesson, M. (2008). Crowding out in Blood Donation: Was Titmuss Right? . Journal of the European Economic Association , 6 (4), 845-863 .
Patrick, C. J.; Curtin, J. J., Tellegen, A. 2002. “Development and Validation of a Brief Form of the Multidimensional Personality Questionnaire.” Psychological Assessment, 14, 150-164.
Ryan, R. M., & Deci, E. L. (2000). Intrinsic and Extrinsic Motivations: Classic Definitions and New Directions. Contemporary Educational Psychology , 25, 54-67.
Samuelson, P. A. (1954). The Pure Theory of Public Expenditure. The Review of Economics and Statistics , 36 (4), 387-389.
Shih, Margaret, Todd L. Pittinsky, and Nalini Ambady. 1999, “Stereotype Susceptibility: Identity Salience and Shifts in Quantitative Performance.” Psychological Science, 10: 80-83.
Tajfel, H., & Turner, J. (1979). An Integrative Theory of Intergroup Conflict. In W. Austin, & S. Worchel (Eds.), The Social Psychology of Intergroup Relations (pp. 33-47). Monterey, CA: Brooks/Cole.
Tajfel, H., Billig, M. G., Bundy, R. P., & Flament, C. (1971). Social Categorization and Intergroup Behaviour. European Journal of Social Psychology , 1 (2), 149-178
Willer, R., Wimer, C., Owens, L.A.. (2015). What Drives the Gender Gap in Charitable Giving? Lower Empathy Leads Men to Give Less to Poverty Relief, Social Science Research. doi: http://dx.doi.org/10.1016/j.ssresearch.2014.12.014.

Curriculum Vitae
Heng Qu Education
Ph.D. in Philanthropy Studies Indiana University
July 2016 Indianapolis, IN
Minor: Nonprofit Finance and Economics
M.A. in Political Science School of Government, Sun Yat-Sen University
June 2009 Guangzhou, China
Concentrations: Public Policy and Non-Governmental Organizations
B.A. in Political Science School of Government, Sun Yat-Sen University
June 2006 Guangzhou, China
Research Interests
⋅ Nonprofit finance and organizational capacity ⋅ Motivations for individual charitable giving and nonprofit resource development ⋅ Social innovation and impact investing/mission investing/program-related
investments ⋅ Effects of pro-social behavior on psychological well-being ⋅ Nonprofit financial reporting and accountability
Awards and Honors
Science of Philanthropy Initiative Ph.D. Grant Award ($5,000) The University of Chicago, University of Wisconsin-Madison, and John Templeton Foundation
2013-14
Doctoral Fellow 2015 Association for Research on Nonprofit Organizations and Voluntary Action (ARNOVA)
Diversity Scholars and Leaders Award Association for Research on Nonprofit Organizations and Voluntary Action (ARNOVA)
2014
Doctoral Fellow 2014 International Society for Third-Sector Research (ISTR) Emerging Scholars Award Association for Research on Nonprofit Organizations and Voluntary Action (ARNOVA)
2013
Awards and Honors, cont’d Distinction on Ph.D. Qualifying Exams Indiana University Lilly Family School of Philanthropy
2013
The Anne Donchin Graduate Research Award Indiana University-Purdue University Indianapolis Women’s Studies Program
2012
National Fellowship for Distinguished Graduate Students Sun Yat-Sen University
2006-08
Distinguished Graduate Honor Sun Yat-Sen University
2006
Outstanding Undergraduate Thesis Award Sun Yat-Sen University
2006
First-Class Scholarship Award for Distinguished Students (Top 5%) Sun Yat-Sen University
2003-05
Grants and Scholarships
Graduate Assistantships and Scholarships Indiana University Lilly Family School of Philanthropy
2009-16
Grant for Workshop in Multidisciplinary Philanthropic Studies 2014-15 USA Funds
Graduate Student Research Fund Indiana University Lilly Family School of Philanthropy
2015
Travel Grant Association for Research on Nonprofit Organizations and Voluntary Action (ARNOVA)
2014
Travel Fellowship Indiana University Purdue University Indianapolis
2014
Travel Grants Indiana University Lilly Family School of Philanthropy
2014
Summer Internship Grant Indiana University Lilly Family School of Philanthropy
2013
Publications
Manuscripts Qu, Heng, & Osili, Una. (2016). Beyond Grantmaking: An Investigation of Program-Related Investments by U.S. Foundations. Accepted in Nonprofit and Voluntary Sector Quarterly. Manuscripts Under Review Qu, Heng, & Steinberg, Richard. (2015). Charitable Giving in Nonprofit Service Associations: Identities, Incentives, and Gender Differences. Revise for Resubmission to Nonprofit and Voluntary Sector Quarterly. Practitioner-Oriented Writing Qu, Heng. (2013). Giving by Foundations. In Giving USA 2013: The Annual Report on Philanthropy for the Year 2012 (pp. 81-90). A publication of Giving USA Foundation™, researched and written by the Indiana University Lilly Family School of Philanthropy. Qu, Heng. (2013). Giving to Foundations. In Giving USA 2013: The Annual Report on Philanthropy for the Year 2012 (pp. 165-170). A publication of Giving USA Foundation™, researched and written by the Indiana University Lilly Family School of Philanthropy. Indiana University Lilly Family School of Philanthropy. (2013). Leveraging the Power of Foundations: An Analysis of Program-Related Investing. Work in Progress Qu, Heng. Modern Portfolio Theory and the Optimization of Nonprofit Revenue Mix. Duffy, B., Qu, Heng, & Gupta, S. The Impact of Charitable Giving on Donors’ Psychological Well-being.
Conference Presentations and Guest Lectures
Panel Organized Qu, Heng & Burger, Ronelle. (2016). “Detecting Nonprofit Fraud in Three Continents.” The 12th International Conference of the International Society for Third-Sector Research (ISTR). June 28-July 1, 2016. Stockholm, Sweden. Qu, Heng & Duffy, B. (2015). “Joy of Giving and Volunteering.” The Annual Conference of Association for Research on Nonprofit Organizations and Voluntary Action (ARNOVA). November 19-21, 2015. Chicago, IL.

Papers Presented Qu, Heng; Steinberg, Richard; & Burger, Ronelle. (2016). “Dirty data, done dirt cheap? Nonprofit financial reporting in the U.S.” The 12th International Conference of the International Society for Third-Sector Research (ISTR). June 28-July 1, 2016. Stockholm, Sweden. Qu, Heng. (2015). “Which is a Better Approach to Nonprofit Revenue Diversification: Modern Portfolio Theory or Herfindahl-Hirschman Index?” Paper to be presented at the Annual Conference of Association for Research on Nonprofit Organizations and Voluntary Action (ARNOVA). November 19-21, 2015. Chicago, IL. Duffy, B. & Qu, Heng. (2015). “Does Charitable Giving Have Mental Health Benefits for Donors?” Paper to be presented at the Annual Conference of Association for Research on Nonprofit Organizations and Voluntary Action (ARNOVA). November 19-21, 2015. Chicago, IL. Qu, Heng. (2014). “Revenue Diversification and Portfolio Optimization of Nonprofit Organizations.” Paper presented at the Annual Conference of Association for Research on Nonprofit Organizations and Voluntary Action (ARNOVA). November 20-22, 2014. Denver, CO. Steinberg, Richard, & Qu, Heng. (2014). “Does Membership in a Public-Service Club Make a Person More Generous?” Paper presented at the 11th International Conference of the International Society for Third-Sector Research (ISTR). July 22-25, 2014. Muenster, Germany. Qu, Heng. (2014). Financing Nonprofit Membership Associations. The Second Ph.D. Seminar of the International Society for Third-Sector Research (ISTR). July 20-22, 2014. Muenster, Germany. Qu, Heng, & Richard Steinberg. (2013). “Does Membership in a Public-Service Club Make a Person More Generous?” Paper presented at the Annual Conference of Association for Research on Nonprofit Organizations and Voluntary Action (ARNOVA). November 21-23, 2013. Harford, CT. Kou, X., Kim, S., & Qu, Heng. (2013). “It Matters to Ask Where the Dollars Come From: Source of Household Financial Resources and High Net Worth Philanthropy.” Paper presented at the Annual Conference of Association for Research on Nonprofit Organizations and Voluntary Action (ARNOVA). November 21-23, 2013. Harford, CT. Osili, U., & Qu, Heng. (2013). “Private Aid for International Issues: Evidence from Million Dollar Donations.” Paper presented at the Annual Conference of Association for Research on Nonprofit Organizations and Voluntary Action (ARNOVA). November 21-23, 2013. Harford, CT.

Qu, Heng. (2013). “The Framing Effects of Public-Service Club Membership.” The Science of Philanthropy Initiative (SPI) Annual Summit Subaward Recipients Presentation. October 18-19, 2013. Chicago, IL. Qu, Heng. (2013). “International Players and China’s Nonprofit and Philanthropic Development.” Paper presented at the Doctoral Student Research Seminar of the Framing the Global Conference. September 26-28, 2013. Bloomington, IN. Osili, U., Qu, Heng, & McKitrick, M. A. (2012). “Leveraging the Power of Foundations: Program- and Mission-Related Investments.” Paper presented at the Annual Conference of Association for Research on Nonprofit Organizations and Voluntary Action (ARNOVA). November15-17, 2012. Indianapolis, IN. Qu, Heng. (2012). “The Membership Development of Kiwanis International.” Poster presentation at the Annual Conference of Association for Research on Nonprofit Organizations and Voluntary Action (ARNOVA). November15-17, 2012. Indianapolis, IN. Guest Lectures “Nonprofits and Philanthropy in China” in Introduction to Philanthropic Studies (Undergraduate). Indiana University Lilly Family School of Philanthropy. 2012-2015. “NGOs, Philanthropy, and Civil Society in China” in Civil Society and Philanthropy (Graduate). Indiana University Lilly Family School of Philanthropy. 2015. Teaching Experience
Instructor
Giving and Volunteering in America (Undergraduate) Indiana University Lilly Family School of Philanthropy
Fall 2014; Spring 2015
Mentor IUPUI Service Learning Assistant Scholarship Program Fall 2014; Spring 2015
Research Experience
The Research Department, IU Lilly Family School of Philanthropy Research Assistant
Indianapolis, IN Feb 12 – July 14
Researched and coordinated multiple research projects on philanthropy and nonprofits organizations, including: Program-Related Investments; High Net Worth Philanthropy; Giving USA; Global Giving by U.S. Corporations; Million Dollar Gifts; and Giving in Chicago.

International Programs, Center on Philanthropy at IU Indianapolis, IN
Research Assistant Jan 11 – May 11
Researched and composed a report on the practice of fiscal sponsorship by U.S. universities and form recommendations to nonprofit development in China.
Women’s Philanthropy Institute, Center on Philanthropy at IU Indianapolis, IN
Research Assistant Sep 10 – Dec 10
Completed an awarding-winning research project on women’s philanthropy in China.
School of Public and Environmental Affairs, IUPUI Indianapolis, IN
Research Assistant Aug 09 – May 10 Worked for the Performance Measurement and Citizen Engagement Project for Indianapolis.
School of Government, Sun Yat-Sen University Guangzhou, China
Project Coordinator Dec 07 – Dec 08 Led Grassroots NGOs in Guangzhou research project.
Institute for Civil Society, Sun Yat-Sen University Guangzhou, China
Research Assistant Sep 05 – Dec 07 Researched on two research projects, including: Grassroots NGOs and the Provision of Public Service for Migrant Workers, and the Status of NGOs in Southern China.
Professional Experience
Academic Programs, IU Lilly Family School of Philanthropy Indianapolis, IN Research Assistant Aug 15 – Present Facilitate undergraduate internship program and Undergraduate Faculty
Learning Community.
Global Philanthropy, Council on Foundations Arlington, VA Summer Associate May 13 – Aug 13 Composed an Introductory Guide to Grantmaking and Social Investing in China;
assisted in the Impact Investing Toolkit for Community Foundations project; and helped build a database of the Council’s about 200 U.S.-based members with global activities.
The Fundraising School, Center on Philanthropy at IU Indianapolis, IN Research Assistant Jan 11 – May 11 Facilitated course participant database management and course evaluation
reports.
Indianapolis Mayor’s Office Indianapolis, IN Research Assistant May 10 – Aug 10 Performed research to form the City’s performance measurement and citizen
engagement strategies.

Service Co-director, Workshop in Multidisciplinary Philanthropic Studies Indiana University Lilly Family School of Philanthropy
2015-2016
Member, Undergraduate Faculty Learning Community Indiana University Lilly Family School of Philanthropy
2013-2016
Member, Philanthropic Studies Academic Program Committee Indiana University Lilly Family School of Philanthropy
2013-2015
Professional Affiliations
Association for Research on Nonprofit Organizations and Voluntary Action (ARNOVA)
2012-present
International Society for Third-Sector Research (ISTR) 2014-present
Skills
Language: English, Mandarin Chinese Statistical software: Stata