two-stage data driven filtering for local damage detection...
TRANSCRIPT
Two-Stage Data Driven Filtering for LocalDamage Detection in Presence of TimeVarying Signal to Noise Ratio
Jakub Obuchowski, Agnieszka Wylomanska and Radoslaw Zimroz
Abstract Local damage detection in rotating machinery can become a very diffi-cult issue due to time-varying load or presence of another damage reflected inamplitude modulation of the raw vibration signal. In this paper a two-stage filteringmethod is presented to deal with this problem. The first stage is based on autore-gressive (AR) modeling. It is incorporated to suppress high-energy components thatmask an informative signal. High-energy amplitudes of mesh harmonics modulatedby other damage or load variation can affect selectors of optimal frequency band aswell, so they have to be suppressed. The second stage relies on filtering the AR-residual signal using a linear filter based on an informative frequency band selector.Here as a selector we propose to use the average horizontal distance on quantile-quantile plot. We compare the result of the second stage with the spectral kurtosis.The procedure is illustrated by real data analysis of a two-stage gearbox used in abelt conveyor drive system in an open-pit mine.
Keywords Local damage � Time varying conditions � Autoregression � Frequencyband selector
J. Obuchowski (&) � R. ZimrozDiagnostics and Vibro-Acoustics Science Laboratory, Wroclaw University of Technology,Na Grobli 15, 50-421 Wroclaw, Polande-mail: [email protected]
R. Zimroze-mail: [email protected]
A. WylomanskaHugo Steinhaus Center, Institute of Mathematics and Computer Science, Wroclaw Universityof Technology, Janiszewskiego 14a, 50-370 Wroclaw, Polande-mail: [email protected]
R. ZimrozResearch and Development Centre, KGHM Cuprum Ltd, Sikorskiego 2-8,53-659 Wroclaw, Poland
© Springer International Publishing Switzerland 2015J.K. Sinha (ed.), Vibration Engineering and Technology of Machinery,Mechanisms and Machine Science 23, DOI 10.1007/978-3-319-09918-7_36
401
1 Introduction
Local damage detection in rotating machinery operating in industrial conditions is achallenging problem. Inconveniences might be related to uncontrolled load andspeed changes, unknown condition of a diagnosed machine, transmission ofvibrations from other machines, acquisition of vibrations not related to operation ofthe machine, lack of data due to temporary failure of a signal acquisition system,etc. On the other hand, such problems lead to development of novel signal pro-cessing methods that substitute those which do not work properly in case ofdiagnostics in industrial conditions. In the paper we present a data driven methodinspired by a vibration signal acquired during operation of a two stage gearboxoperating in an open-pit mine. Both stages of the gearbox are damaged, thus thesignal contains modulations related to two shaft frequencies. In this case, the signalof interest (SOI) related to the local damage of the first stage gear-pair is mixed withamplitude modulated signal due to the damage of the second stage. Thus, a timevarying signal to noise ratio occurs which makes diagnostics more difficult. Theapproach proposed in this paper is an extension of the method presented in [1–3].The method presented therein incorporates the idea of both decreasing power ofnarrowband spectral components by an autoregressive (AR) model and selection ofan informative frequency band using the spectral kurtosis. We propose to extendthis method by using another criterion of AR model goodness-of-fit and anothermeasure of impulsiveness. It is worth mentioning that the AR model with constantcoefficients might be used only in the case of constant speed of the machine. Inother cases the model should be extended, e.g. for cyclic changes of rotationalspeed a periodic autoregressive model (PAR) might be used [4, 5]. If the speed ischanging not in a cyclic way one can benefit from application of an adaptive ARfilter (i.e. filter with coefficients varying in time) [6–8]. The second step of themethod is designed especially for industrial conditions. Instead of classical kurtosis,we propose to use another measure which is as good as the kurtosis in the standardcase and more effective in the case of a single excitation occurred during signalacquisition. Such excitation might not be related to operation of the machine. Sincethe kurtosis is very sensitive to such single artifacts, one can benefit from othermeasures of impulsiveness, especially those based on quantiles or empiricalcumulative distribution function [9–12].
2 Methodology
The proposed two-stage procedure is based on signal filtering. Here we use bothautoregressive modeling and optimal frequency band selection. Sometimes, the rawvibration signal contains a strong deterministic contamination which is highlyamplitude modulated. In such case of time varying signal-to-noise ratio the signal ofinterest is invisible in both time series and envelope spectrum. Then, signal filtering
402 J. Obuchowski et al.
based on measures of dispersion (e.g. the spectral kurtosis) may indicate a wrongfrequency band as informative. We propose to filter out the deterministic signalusing autoregressive filtering. The next step is based on linear filtering using fre-quency characteristics of the filter obtained by measures of impulsiveness. Wecompare filters driven by the spectral kurtosis [13] and one of informative fre-quency band selectors presented in [9–12].
As it was mentioned, we use the autoregressive model to filter out highlyamplitude modulated mesh harmonics. The AR model of order p is defined asfollows:
Xp
i¼0
/ ið ÞX t � ið Þ ¼ e tð Þ ð1Þ
where /ð0Þ ¼ 1 and e tð Þf g t[ 0ð Þ stands for noise.It is known, that the AR time series model is able to model noisy sinusoidal
pattern if its characteristic polynomial has complex roots. In the case of a largenumber of harmonics a high-order AR model is expected with at least two complexroots corresponding to one mesh harmonic. As the optimal order indicator we usethe highest Kolmogorov-Smirnov criterion, i.e. AR(p) is said to be optimal if theKolmogorov-Smirnov (KS) test statistic of residuals is the highest [14]. Accordingto the fact that the residual signal in case of local damage should be impulsive, it isexpected that the distance between empirical distribution and Gaussian one is high—the higher KS statistic, the more impulsive signal. Recall the KS statistic forsignal X(t) is defined as follows [15]:
KS ¼ supx F̂ xð Þ � FðxÞ�� ��; ð2Þ
where F̂ xð Þ is the empirical cumulative distribution function for given signal whileFðxÞ is the cumulative distribution function of Gaussian distribution with param-eters estimated form the signal.
Moreover, the results of AR filtering are also checked by comparing time-frequency maps of the residual signal with the raw signal. Parameters of the ARmodel are obtained by using Yule-Walker method [16].
Once mesh harmonics are suppressed during the previous step of the procedure,the residual signal might be still noisy, e.g. when the SOI is relatively narrowband.We propose to select the informative frequency band using the average horizontaldistance on quantile-quantile plot (QQplot) [9–12]. Namely, we quantify theaverage distance between markers and reference line on the QQplot. The QQplotwe use here is a graphical goodness-of-fit tool which compares quantiles ofempirical distribution of the sample with the Gaussian distribution. The referenceline connects first and third quartiles of both distributions. We compare it to thewell-known spectral kurtosis. Both of them are based on analysis of narrowbandslices of a time-frequency map. In this paper we design the filter using not only thecharacteristic given by a selector but we also enhance the characteristic by using
Two-Stage Data Driven Filtering... 403
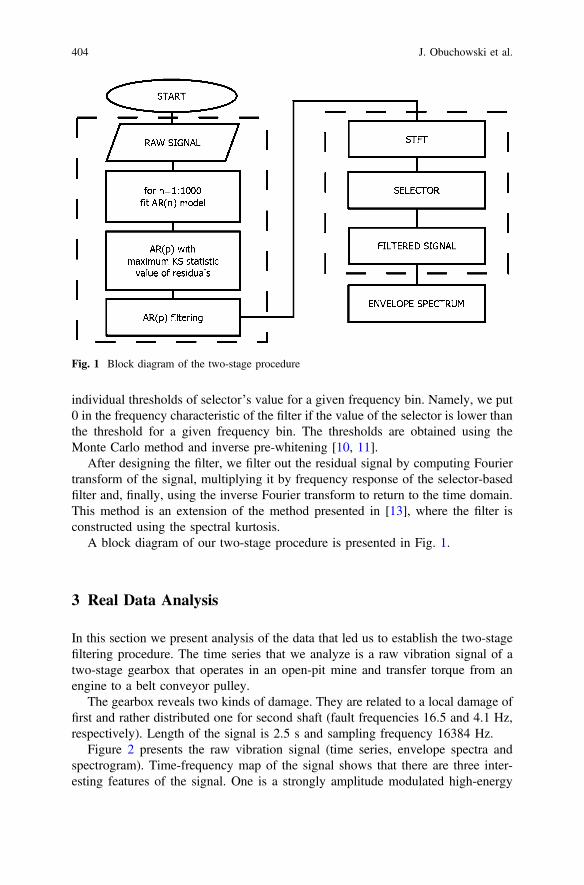
individual thresholds of selector’s value for a given frequency bin. Namely, we put0 in the frequency characteristic of the filter if the value of the selector is lower thanthe threshold for a given frequency bin. The thresholds are obtained using theMonte Carlo method and inverse pre-whitening [10, 11].
After designing the filter, we filter out the residual signal by computing Fouriertransform of the signal, multiplying it by frequency response of the selector-basedfilter and, finally, using the inverse Fourier transform to return to the time domain.This method is an extension of the method presented in [13], where the filter isconstructed using the spectral kurtosis.
A block diagram of our two-stage procedure is presented in Fig. 1.
3 Real Data Analysis
In this section we present analysis of the data that led us to establish the two-stagefiltering procedure. The time series that we analyze is a raw vibration signal of atwo-stage gearbox that operates in an open-pit mine and transfer torque from anengine to a belt conveyor pulley.
The gearbox reveals two kinds of damage. They are related to a local damage offirst and rather distributed one for second shaft (fault frequencies 16.5 and 4.1 Hz,respectively). Length of the signal is 2.5 s and sampling frequency 16384 Hz.
Figure 2 presents the raw vibration signal (time series, envelope spectra andspectrogram). Time-frequency map of the signal shows that there are three inter-esting features of the signal. One is a strongly amplitude modulated high-energy
Fig. 1 Block diagram of the two-stage procedure
404 J. Obuchowski et al.
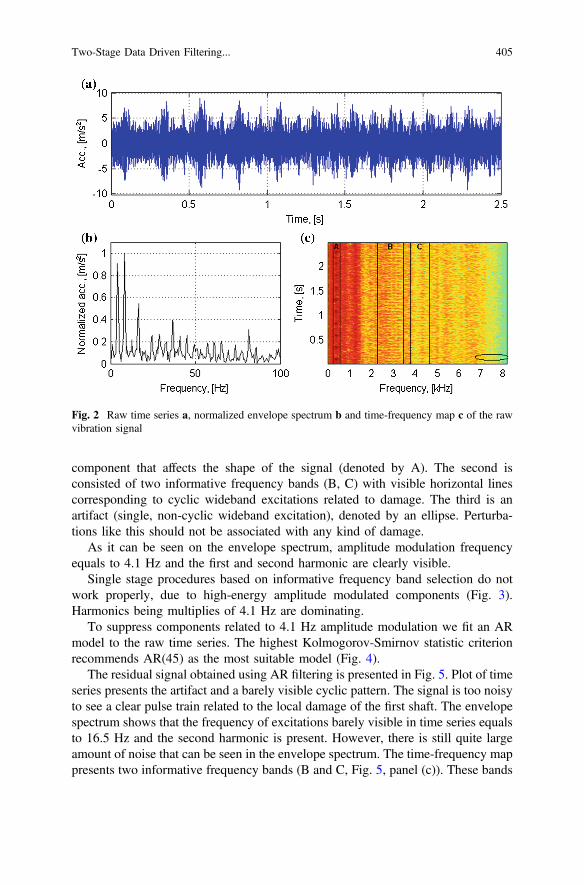
component that affects the shape of the signal (denoted by A). The second isconsisted of two informative frequency bands (B, C) with visible horizontal linescorresponding to cyclic wideband excitations related to damage. The third is anartifact (single, non-cyclic wideband excitation), denoted by an ellipse. Perturba-tions like this should not be associated with any kind of damage.
As it can be seen on the envelope spectrum, amplitude modulation frequencyequals to 4.1 Hz and the first and second harmonic are clearly visible.
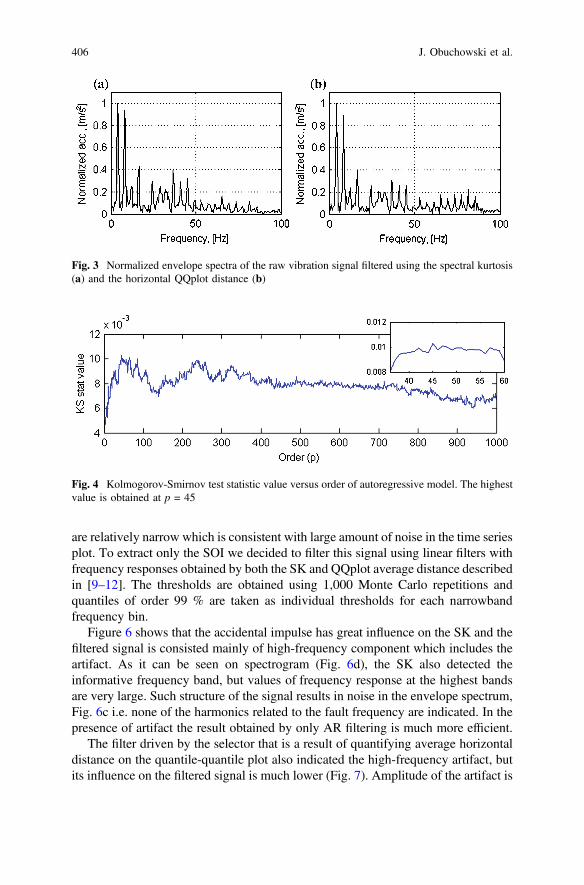
Single stage procedures based on informative frequency band selection do notwork properly, due to high-energy amplitude modulated components (Fig. 3).Harmonics being multiplies of 4.1 Hz are dominating.
To suppress components related to 4.1 Hz amplitude modulation we fit an ARmodel to the raw time series. The highest Kolmogorov-Smirnov statistic criterionrecommends AR(45) as the most suitable model (Fig. 4).
The residual signal obtained using AR filtering is presented in Fig. 5. Plot of timeseries presents the artifact and a barely visible cyclic pattern. The signal is too noisyto see a clear pulse train related to the local damage of the first shaft. The envelopespectrum shows that the frequency of excitations barely visible in time series equalsto 16.5 Hz and the second harmonic is present. However, there is still quite largeamount of noise that can be seen in the envelope spectrum. The time-frequency mappresents two informative frequency bands (B and C, Fig. 5, panel (c)). These bands
Fig. 2 Raw time series a, normalized envelope spectrum b and time-frequency map c of the rawvibration signal
Two-Stage Data Driven Filtering... 405
are relatively narrow which is consistent with large amount of noise in the time seriesplot. To extract only the SOI we decided to filter this signal using linear filters withfrequency responses obtained by both the SK and QQplot average distance describedin [9–12]. The thresholds are obtained using 1,000 Monte Carlo repetitions andquantiles of order 99 % are taken as individual thresholds for each narrowbandfrequency bin.
Figure 6 shows that the accidental impulse has great influence on the SK and thefiltered signal is consisted mainly of high-frequency component which includes theartifact. As it can be seen on spectrogram (Fig. 6d), the SK also detected theinformative frequency band, but values of frequency response at the highest bandsare very large. Such structure of the signal results in noise in the envelope spectrum,Fig. 6c i.e. none of the harmonics related to the fault frequency are indicated. In thepresence of artifact the result obtained by only AR filtering is much more efficient.
The filter driven by the selector that is a result of quantifying average horizontaldistance on the quantile-quantile plot also indicated the high-frequency artifact, butits influence on the filtered signal is much lower (Fig. 7). Amplitude of the artifact is
Fig. 3 Normalized envelope spectra of the raw vibration signal filtered using the spectral kurtosis(a) and the horizontal QQplot distance (b)
Fig. 4 Kolmogorov-Smirnov test statistic value versus order of autoregressive model. The highestvalue is obtained at p = 45
406 J. Obuchowski et al.
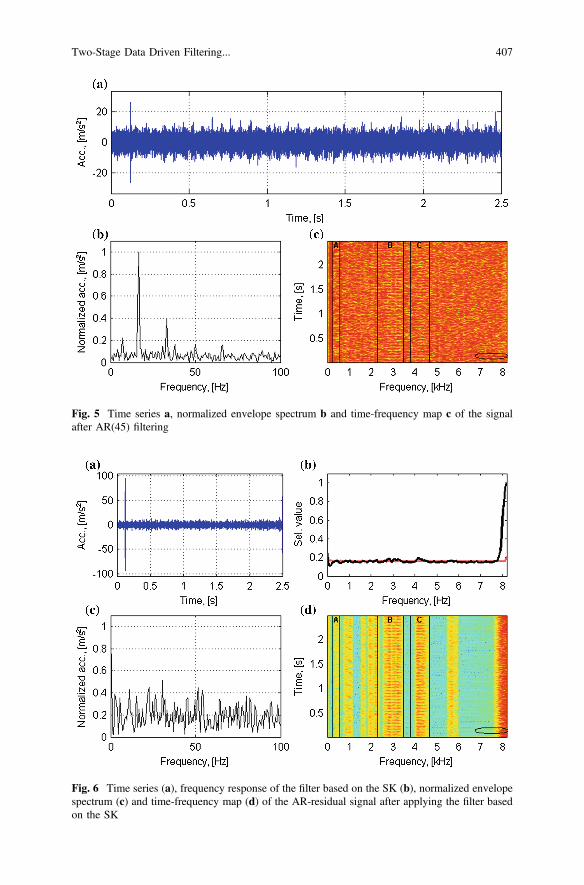
Fig. 5 Time series a, normalized envelope spectrum b and time-frequency map c of the signalafter AR(45) filtering
Fig. 6 Time series (a), frequency response of the filter based on the SK (b), normalized envelopespectrum (c) and time-frequency map (d) of the AR-residual signal after applying the filter basedon the SK
Two-Stage Data Driven Filtering... 407
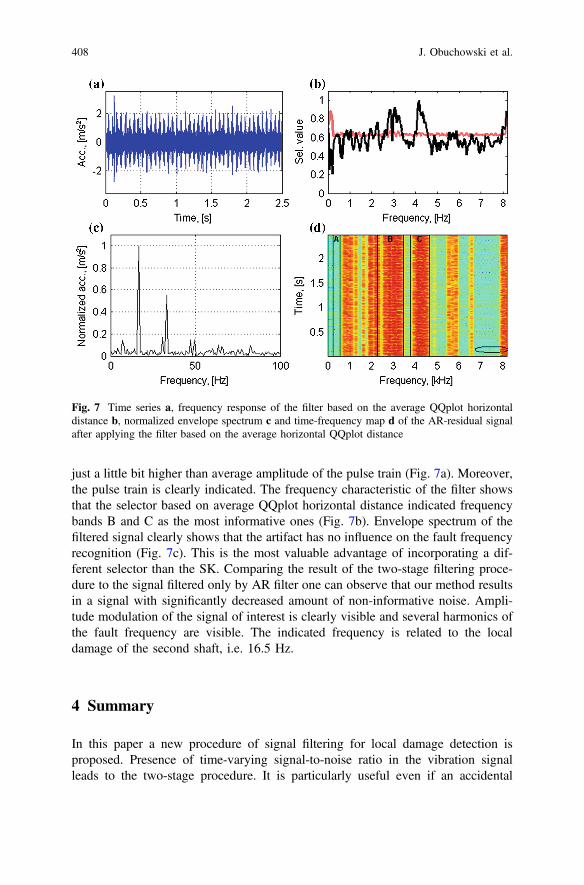
just a little bit higher than average amplitude of the pulse train (Fig. 7a). Moreover,the pulse train is clearly indicated. The frequency characteristic of the filter showsthat the selector based on average QQplot horizontal distance indicated frequencybands B and C as the most informative ones (Fig. 7b). Envelope spectrum of thefiltered signal clearly shows that the artifact has no influence on the fault frequencyrecognition (Fig. 7c). This is the most valuable advantage of incorporating a dif-ferent selector than the SK. Comparing the result of the two-stage filtering proce-dure to the signal filtered only by AR filter one can observe that our method resultsin a signal with significantly decreased amount of non-informative noise. Ampli-tude modulation of the signal of interest is clearly visible and several harmonics ofthe fault frequency are visible. The indicated frequency is related to the localdamage of the second shaft, i.e. 16.5 Hz.
4 Summary
In this paper a new procedure of signal filtering for local damage detection isproposed. Presence of time-varying signal-to-noise ratio in the vibration signalleads to the two-stage procedure. It is particularly useful even if an accidental
Fig. 7 Time series a, frequency response of the filter based on the average QQplot horizontaldistance b, normalized envelope spectrum c and time-frequency map d of the AR-residual signalafter applying the filter based on the average horizontal QQplot distance
408 J. Obuchowski et al.
impulse (not related to damage) is present in the time domain. Such artifact affectsfrequency characteristic of a filter based on the spectral kurtosis, thus one canbenefit from using another measure of impulsiveness, e.g. average horizontal dis-tance on quantile-quantile plot. Such measure might indicate informative frequencyband as well as kurtosis, but it is less sensitive to a single excitation that mightoccur during signal acquisition in industrial conditions.
Acknowledgement This work is partially supported by the statutory grant No. S30073 (J.Obuchowski).
References
1. Sawalhi N, Randall RB (2005) Spectral kurtosis enhancement using autoregressive models. In:4th Australasian congress on applied mechanics, pp 231–236
2. Sawalhi N, Randall RB (2011) Signal Pre-whitening for fault detection enhancement andsurveillance in rolling element bearings. In: Paper presented at the eighth internationalconference on condition monitoring and machinery failure prevention technologies, St David’sHotel, 20–22 June, Cardiff, UK
3. Sawalhi N, Randall RB (2011) Vibration response of spalled rolling element bearings:Observations, simulations and signal processing techniques to track the spall size. Mech SystSignal Process 25(3):846–870
4. Wyłomańska A, Obuchowski J, Zimroz R, Hurd H (2014) Periodic autoregressive modeling ofvibration time series from planetary gearbox used in bucket wheel excavator. In:Cyclostationarity: Theory and Methods, Lecture Notes in Mechanical Engineering, Chaari Fet al (eds), pp 171–186
5. Broszkiewicz-Suwaj E, Makagon A, Weron R, Wyłomańska A (2004) On detecting andmodeling periodic correlation in financial data. Phys A 336:196–205
6. Makowski R, Zimroz R (2014) New techniques of local damage detection in machinery basedon stochastic modelling using adaptive Schur filter. Appl Acoust 77:130–137
7. Makowski RA, Zimroz R (2011) Adaptive bearings vibration modelling for diagnosis, lecturenotes in computer science (including subseries lecture notes in artificial intelligence andlecture notes in bioinformatics) 6943 LNAI, pp 248–259
8. Makowski R, Zimroz R (2013) A procedure for weighted summation of the derivatives ofreflection coefficients in adaptive Schur filter with application to fault detection in rollingelement bearings. Mech Syst Signal Process 38(1):65–77
9. Obuchowski J, Wylomanska A, Zimroz R (2013) Stochastic modelling of time series withapplication to local damage detection in rotating machinery. Key Eng Mater 569–570:441–449
10. Obuchowski J, Wylomanska A, Zimroz R (2013) Novel enhancement techniques for noisyvibration signals applied to local damage detection in rotating machines. In: Proceedings ofInternational conference surveillance 7, Oct 29–31, Chartres, France
11. Obuchowski J, Wylomanska A, Zimroz R (2014) Adaptation of Spectral Kurtosis basedfiltering procedure using novel criteria of impulsiveness, Manuscript submitted for publication
12. Obuchowski J, Wylomanska A, Zimroz R (2014) Selection of informative frequency band inlocal damage detection in rotating machinery. Mech Syst Signal Process, Advance onlinepublication. doi:10.1016/j.ymssp.2014.03.011. 48(1–2):138–152
13. Combet F, Gelman L (2009) Optimal filtering of gear signals for early damage detection basedon the spectral kurtosis. Mech Syst Signal Process 23(3):652–668
Two-Stage Data Driven Filtering... 409

14. Zhan Y, Mechefske CK (2007) Robust detection of gearbox deterioration using compromisedautoregressive modeling and kolmogorov-smirnov test statistic—Part I: compromisedautoregressive modeling with the aid of hypothesis tests and simulation analysis. Mech SystSignal Process 21(5):1953–1982
15. Justel A, Pen D, Zamar R (1997) A multivariate Kolmogorov-Smirnov test of goodness of fit.Stat Probab Lett 35(3):251–259
16. Brockwell PJ, Davis RA (2006) Time Series: theory and methods. Springer Series in Statistics,Springer, New York, ISBN: 978-1-4419-0320-4
410 J. Obuchowski et al.