type 2 diabetes and its association with lifestyle factors
TRANSCRIPT
TYPE 2 DIABETES AND ITS ASSOCIATION WITH LIFESTYLE FACTORS
Mbanya Vivian Nchanchou
Supervisor
Prof Akhtar Hussain
University of Oslo, Faculty of Medicine Institute of General Practice and Community Medicine
Section for International Health June 2008
Thesis submitted as a part of the Master of Philosophy Degree in International Community Health
Table of contents
2
Table of contents ........................................................................................................................... 2
ACKNOWLEDGEMENTS ......................................................................................................... 6
Abbreviations ................................................................................................................................ 7
1. INTRODUCTION................................................................................................................ 9
A brief country profile............................................................................................................................... 9
1.1 Geography:...................................................................................................................................... 9
1. 2 Politics ............................................................................................................................................ 9
1.3 Population....................................................................................................................................... 9
1.4 Ethnicity/ race ............................................................................................................................... 10
1.5 Religion..........................................................................................................................................10
1.6 Economy........................................................................................................................................10
1.7 Lifestyle .........................................................................................................................................11
1.8 Health care system ........................................................................................................................11
1.9 Global burden of diseases .................................................................................................................12
1.9.1 Communicable and Non‐communicable diseases .....................................................................12
1.9.2 Diabetes Mellitus .......................................................................................................................13
1.9.3 Global trend of diabetes mellitus ..............................................................................................13
1. 9.4 Situations of Type 2 diabetes in Sub‐ Saharan‐ Africa/ Cameroon...........................................14
1.10 Classification of Diabetes mellitus ..............................................................................................15
1.10.1 Type 1 diabetes (ß‐cell destruction, leading to insulin deficiency)..........................................15
1.10.2 Type 2 diabetes (it range from predominantly insulin resistance with relative insulin deficiency to predominantly an insulin secretory defect with insulin resistance) .............................16
1.10.3 Gestational diabetes (GDM) ....................................................................................................16

3
1.10.4 Other specific types of diabetes ..............................................................................................16
1.10.5 Diagnostic criteria for diabetes mellitus ..................................................................................17
1.10.6 Associated risk factors of type 2 diabetes ...............................................................................18
1.10.7 Diabetes and HIV AIDs .............................................................................................................18
1.10.8 Rational of the study................................................................................................................19
2. Research objectives................................................................................................................. 20
2.1 Research Question ........................................................................................................................20
2.2 Broad objectives............................................................................................................................20
2.3 Specific objectives:........................................................................................................................20
3. Methodology and Study Design ............................................................................................. 21
3.1 Study type .....................................................................................................................................21
3.2 Study setting .................................................................................................................................21
3.3 Study Population...........................................................................................................................21
3.4 Selection Criteria of Health District ..............................................................................................21
3.5 Inclusion criteria............................................................................................................................21
3.6 Exclusion criteria ...........................................................................................................................22
3.7 Sample size calculation .................................................................................................................22
3.8 Sampling Technique......................................................................................................................22
3.9 Definition of Household ................................................................................................................23
3.10 Piloting of tools ...........................................................................................................................23
3.11 Data collection Procedures (field work) .....................................................................................23
3.11.1 Questionnaire ..........................................................................................................................23
3.11.2 Anthropometrical measurements ...........................................................................................24
3.11 3 Data on blood pressure............................................................................................................24
4
3.11.4 Data on Obesity........................................................................................................................25
3.11.5 Biochemical measurements (data on diabetes) ......................................................................25
3.11.6 Data handling ...........................................................................................................................26
3.11.7 Quality Assurance ....................................................................................................................26
3.11.8 Statistical methods...................................................................................................................26
3.11.9 Ethical issues ............................................................................................................................27
4. Results ...................................................................................................................................... 28
4.1 Description of the study population .............................................................................................28
4.2.1 Mean glucose concentration in subgroups................................................................................31
4.2.2 Underweight, Overweight and Obesity .....................................................................................33
4.2.3: ...................................................................................................................................................34
4.2.4: Correlation between anthropometric measurements .............................................................36
Figure 3 ...............................................................................................................................................39
Figure 4 ...............................................................................................................................................39
4.2.7: Prevalence of diabetes among hypertensive subjects .............................................................40
Table 9: Mean difference and standard deviation of diabetes among hypertensive subjects ..........40
4.2.8: Diabetes and lifestyles factors ..................................................................................................41
Table 10: Relationship between diabetes and lifestyle factors ..........................................................41
Table 11: Prevalence of diabetes by socio‐economic class ................................................................42
5. Discussion................................................................................................................................. 45
5.1 Discussion of main findings...........................................................................................................45
5.2 Intervention suggestions...............................................................................................................49
5.3 Methodological discussion............................................................................................................49
6. Conclusion .............................................................................................................................. 52

5
APPENDICES............................................................................................................................. 60

6
ACKNOWLEDGEMENTS
Firstly, I would like to thank my God Almighty for his Guidance and Protection through out this
course. I say may his name be Glorified. I will like to express my appreciation to my supervisor,
Professor Akhtar Hussein for his guidance, valuable support and encouragement through out my
study period and research process. His encouragement and guidance made this work a success.
Special thanks go to Prof Gunnar Bjune, Prof. Johanne Sundby and all the Professors who
contributed immensely to the master programme. Thanks to Vibeke Christie and Line Løw, the
supporting body (administrative staffs) of the institution. Your passionate support and care
during my course of study will be of memory. Thanks to all the Professors in the diabetic group
(Gevd Holmboe-OHsen, BjØrgult Claussen, Per Nafstad etc) for their contribution to knowledge
in the diabetic field. I will forget my classmate for their love and genuine friendship (BRAVO).
I am indebted to my love ones back at home and in abroad (my parent, brother and sisters) for
their spiritual and moral support. I thank baby Britney and Luther for their patients and
understanding during the write-up.
Exclusive thanks also go to the director and head of CAMBoD/HOPiT project, and his entire
staff. I embrace and appreciate the participation of the participants in this project, and the entire
Biyem-Assi community as a whole.
I am very grateful to my parents here in Norway (Lannakassen and the staffs of the international
office) for their financial support. The memory of your kindness will never be forgotten.
May God bless you all!
7
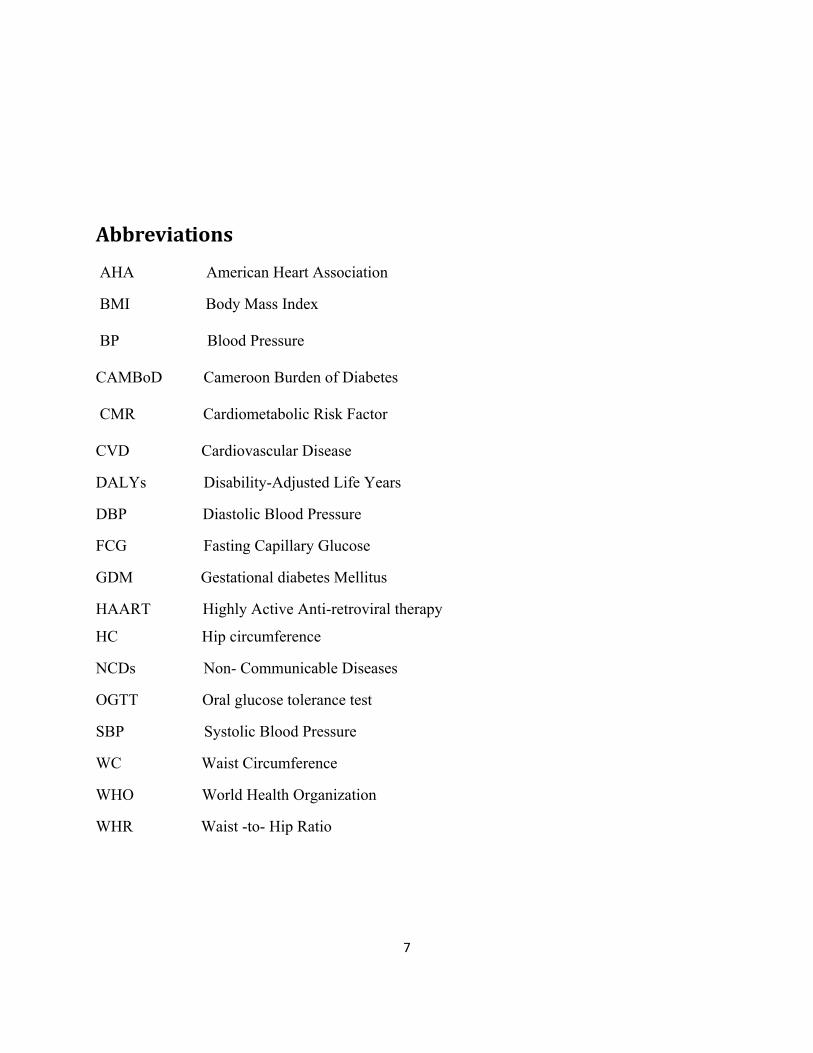
Abbreviations
AHA American Heart Association
BMI Body Mass Index BP Blood Pressure CAMBoD Cameroon Burden of Diabetes CMR Cardiometabolic Risk Factor CVD Cardiovascular Disease
DALYs Disability-Adjusted Life Years
DBP Diastolic Blood Pressure
FCG Fasting Capillary Glucose
GDM Gestational diabetes Mellitus
HAART Highly Active Anti-retroviral therapy
HC Hip circumference
NCDs Non- Communicable Diseases
OGTT Oral glucose tolerance test
SBP Systolic Blood Pressure
WC Waist Circumference
WHO World Health Organization
WHR Waist -to- Hip Ratio
ABSRACT
TYPE 2 DIABETES AND ITS ASSOCIATION WITH LIFESTYLE FACTORS
A project of the University of Oslo, Faculty of Medicine Institute of General Practice and Community Medicine
Section for International Health
Student: Vivian N. Mbanya Supervisor: Prof. Akhtar Hussain
BACKGROUND: The increase of communicable and non- communicable diseases in Africa and the world today have been attributed to changes in human behaviour and lifestyles in generally susceptible individuals. Cameroonian lifestyle results in extreme risk of type 2 diabetes. The prevalence of type 2 diabetes is predicted to increase extensively in sub- Saharan Africa, and predict to double in Cameroon, especially in the urban area, due to changes in human behaviour.
OBJECTIVE: To provide baseline data that will contribute to the surveillance of diabetes in Cameroon and develop policies to prevent the occurrence of type 2 diabetes
RESEARCH DESIGN AND METHODS: It was a population based, cross sectional study of 1279 people. Data was collected using steps 1, 2 and 3 of the WHO STEPS instrument (Version 1.3) for NCDs and their risk factor surveillance that was adapted for the Cameroon Burden of Diabetes (CAMBoD) project with respect to local specifications. The prevalence of diabetes and lifestyle factors was assessed according to standardized methods.
RESULTS: The age standardized prevalence rate of diabetes and IFG was 9.0% and 6.8%, respectively. Generally, worsening glycaemic status was associated with increasing age, body mass index, systolic blood pressure and diastolic blood pressure. Overweight and obesity emerged as a strong independent risk factor for diabetes, irrespective of the measure used. Diabetes was more common in the female than the male p<0.005). The older age groups (46-55 and 56+) had twice and thrice the risk of having diabetes, than the younger and the normal population (adjusted OR=3.1, p<0.001). Diabetes was found more in those who ate more servings of fruits and vegetables. Other lifestyles factors like physical activity and smoking was not a predictor of diabetes in this study, though revealing that smoker and those who are physically inactive has a higher risk of having diabetes.
CONCLUSION: With the increasing associated lifestyle factors to diabetes mellitus in Cameroon, diabetes was found to be highly prevalent in middle and elderly Cameroonians. Our findings therefore highlight the need to adopt policies to reduce the burden of diabetes mellitus and obesity through health care services; special focus should be projected to women and special care should be taken for those who are in transition of lifestyle.

9
21. INTRODUCTION
A brief country profile
1.1 Geography:
Cameroon is a Central African nation on the Gulf of Guinea, bordered by Nigeria, Chad, the
Central African Republic, the Republic of Congo, Equatorial Guinea, and Gabon. It is nearly
twice the size of Oregon. Mount Cameroon (13,350 ft; 4,069 m), near the coast, is the highest
elevation in the country. The main rivers are the Benue, Nyong, and Sanaga. She has both the
sahelian and equatorial types of climate. Temperatures range between 15 and 40 degrees
centigrade. The rainfall averages between 900 and 4 000mm. It has a land area of 469,440 km2
and a total area of 475,440 km2. One third of the country is covered by forest (the south region),
with savannah in the North.
1. 2 Politics
After a 1972 plebiscite, a unitary republic was formed out of East and West Cameroon to replace
the former federal republic. Cameroon has the multiparty system of government with a
Presidential politic system. The other powers are Legislative with National Assembly and
Judiciary. The president appoints the Prime Minister and Head of Government who in
consultation with the latter appoints the ministers. There are about 30 ministries including the
ministry of public health.
1.3 Population
Cameroon's population was estimated at 18,060,382 million in 2007, growing by 2.2 % per year,
with a literacy rate estimated to be 79% in 2003. The Official languages in Cameroon are French
and English, though with 24 major Africa language group. Yaoundé is the capital city and
10
Douala the economic capital. The Yaoundé metropolitan area has one of the largest urban
populations.
1.4 Ethnicity/ race
There are over 200 ethnic groups in Cameroon, categorized into a smaller number of tribes. Like
nationalities, each tribe has stereotypical traits associated with it. Some are known to be tight
with money, others like to party, and others are thought to be lazy. The ethnic groups are
classified as; Cameroon Highlanders 31%, Equatorial Bantu 19%, Kirdi 11%, Fulani 10%,
Northwest Bantu 8%, Eastern Nigritic 7%, other African 13% and non-African less than 1%.
1.5 Religion
Cameroonians are generally religious (Catholic, Protestant or Muslim) but most follow a
traditional religion as well. Belief in black magic is common (especially in cases of illness or bad
luck). The Christians are 40%, Islam 20% and indigenous beliefs 40%.
1.6 Economy
Offshore oil deposits exploited since the early 1970s have made Cameroon one of the most
prosperous nations in tropical Africa. Oil refining and the production of crude oil products lead
the nation's industries. Before the advent of the petroleum business, agriculture was the country's
economic mainstay, and it still contributes nearly a third of the country's gross domestic product.
In the north, where cattle’s raising is the chief occupation, is the least economically developed
part of Cameroon, whose regional disparities pose a major problem for the government.
Cameroon remains one of the world's leading cocoa producers; coffee, bananas, palm products,
tobacco, peanuts, and rubber. GDP/PPP $42.2 billion i.e. 2006 estimate; per capita income of
$2,400. Real growth rate: 4.1%. Inflation: 2.4%. Unemployment: 30% (2001 estimate).
11
1.7 Lifestyle
Lifestyle change is the most common cause of development of type 2 diabetes in the developing
countries. Comparing with other developing countries, who suffer from under nutrition,
Cameroon suffers from over nutrition having a diet consisting of palm oil, corn flower products
and red meat (1). Food intake in Cameroon is based on three meals daily. The diet in rural areas
is based on traditional staple foods, while that of the urban population incorporates more modern
foods (2-4). A meals composition often depends on the economic situation of the household (3).
Some of the staple foods in Cameroon includes white rice, plantains, corn in ground form called
fufu, cassava, yams, cocoyam, banana and sweet potatoes. High fat intake in Cameroonian diet is
due to the frequent use of palm oil. Many of the traditional sauces and dishes contain large
amount of palm oil, which is the basic fat used in Cameroonian kitchen (5). Cultural tradition in
Cameroon must also be blamed for the prevention of diabetes caused by obesity. Fattening your
family is seen as taking good care of them. Having a fat wife is a prestige among friend and
family.
The rate of alcohol consumption in Cameroon is alarming and (alcohol marital sex) is the most
common form of substance abuse in Cameroon. An existing data shows, the habitual diet in rural
Cameroon contained more alcohol than the diet in urban Cameroon. There are situations, where
individuals forsake paying children’s school fees because their money is spent on beer. The
unrecorded alcohol consumption in Cameroon is estimated to be 2.6 litres pure alcohol per capita
for population older than 15 for the years after 1995 (estimated by a group of key alcohol
experts). WHO 2004
1.8 Health care system The health services are centralized within the ministry of health. It has the overall responsibility
for health sector policy and planning.
12
1.9 Global burden of diseases
1.9.1 Communicable and Noncommunicable diseases
Communicable and Non- communicable diseases are the most considered cause of morbidity and
mortality worldwide. The increase of communicable and non- communicable diseases in Africa
and the world today have been attributed to changes in human behaviour and lifestyles in
generally susceptible individuals. It is clear that NCDs will continue to increase. This is driven
by a combination of demographic change, increasing urbanization and associated changes in risk
factor levels, like tobacco smoking, obesity and physical inactivity (6). The burden of non-
communicable diseases have equally being noted to likely increase hugely over the coming
decades and has been estimated will outstrips communicable diseases as a major cause of deaths
in the year 2020s within the sub- Saharan Africa and most part of the world (7). The growing
burden of cardiovascular risk factors led by diabetes mellitus and hypertension is the driving
force of this disease pattern. In Cameroon, age-adjusted rates of blood pressure in urban areas
has been showed to be greater than or equal to 160 mmHg systolic or 95 mmHg diastolic, and
treatment of hypertension has risen from 5 percent in rural areas to 17 percent in urban ones (8)
The weight of cardiovascular disease (CVD) on the world is enormous and growing, and most of
the people affected are in developing countries (9). Reports in 2002 estimated that 29 percent of
deaths worldwide (16.7 million deaths) were due to CVD and that 43 percent of global morbidity
and mortality, measured in disability-adjusted life years (DALYs), was caused by CVD (10).
Furthermore, 78 percent of global mortality and 86 percent of mortality and morbidity from
CVD occurs in developing countries. By 2020 CVD will become the leading cause of the global
health burden, accounting for 73 percent of total global mortality and 56 percent of total
morbidity (10-12). Africa has not been spared of this global tide of CVD. In most African
countries CVD is now the second most common cause of death after infectious disease,
accounting for 11 percent of total deaths (13). CVD is a major cause of chronic illness and
disability. Projections from the Global Burden of Disease Project suggested that from 1990 to
2020, the burden of CVD faced by African countries will double. Developing countries are
13
undergoing an epidemiological transition with rising prevalence of cardiovascular diseases and
risk factors. It is therefore, important to understand the association of modifiable and non-
modifiable exposure variables with risk factors for chronic diseases in order to design
appropriate intervention strategies.
1.9.2 Diabetes Mellitus
Diabetes mellitus is a group of metabolic disorder of multiple aetiology characterized by chronic
hyperglycaemia with disturbances of carbohydrate, fat and protein metabolism, resulting from
insulin secretion, insulin action or both (14). Diabetes mellitus, commonly referred to as
diabetes, means "sweet urine." Elevated levels of blood glucose (hyperglycemia) lead to spillage
of glucose into the urine, hence the term sweet urine. Normally, blood glucose levels are tightly
controlled by insulin, a hormone produced by the pancreas. Insulin lowers the blood glucose
level. When the blood glucose elevates (for example, after eating food), insulin is released from
the pancreas to normalize the glucose level. In patients with diabetes mellitus, the absence or
insufficient production of insulin causes hyperglycemia. Diabetes mellitus is also an important
factor in accelerating the hardening and narrowing of the arteries (atherosclerosis), leading to
strokes, coronary heart diseases, and other blood vessel diseases. Diabetes mellitus is a chronic
medical condition, meaning it can last a lifetime.
1.9.3 Global trend of diabetes mellitus
Diabetes is now a worldwide epidemic and the rate of increase in its prevalence in developing
and industrialized countries is alarming. It has been showed to be a well-established risk factor
for CVD (15). The estimated prevalence of diabetes for all age- group worldwide was 2.8% in
2000 and will be 4.4% in 2030, and is estimated in adults worldwide to be 4.0% in 1995 and to
rise to 5.4% by the year 2025 (16). The prevalence is higher in men than women, but there are
more women with diabetes than men. According to the recent global estimates of the World
Health Organization, there will be 300 million people with diabetes by the year 2025 (17), with
more than three-quarters of the persons with diabetes residing in developing countries. Globally,
14
type 2 diabetes accounts for approximately 90% of all diabetes cases (18). It is known that
physical inactivity, poor diet, family history, over weight and obesity, alcohol consumption,
smoking are all associated risk factors to type 2 diabetes.
In Sub- Saharan Africa, communicable diseases continue to have the greatest disease burden and
it is estimated that by 2020 NCDs will outstrips communicable diseases as a cause of death (19).
The prevalence of diabetes in African communities is increasing with ageing of the population
and lifestyle changes associated with rapid urbanization and westernization. In conjunction with
genetic susceptibility particularly in certain ethnic groups, type 2 diabetes is brought on by
environmental and behavioural factors such as a sedentary lifestyle, overly rich nutrition and
obesity (20-22). However, type 2 diabetes mellitus, hypertension, obesity, deficiencies and
anaemia are partly related to food habits.
The total number of people with diabetes is projected to rise from 170 million from 2000 to 366
million to 2030 worldwide, in Africa from 7.020.000 to 18.234.000 and in Cameroon from
70.000 to 171.000.
1. 9.4 Situations of Type 2 diabetes in Sub Saharan Africa/ Cameroon
Over the past century, diabetes mellitus has been considered a rare medical condition in Africa,
according to Dr Cook in his note in 1901, as being uncommon and very fatal. However,
epidemiological studies carried out in the 20th century, have provided a different picture, which
has shown a global trend in the incidence and prevalence of diabetes mellitus in Africa
population (23). The global epidemic of type 2 diabetes has not spared Sub- Saharan African
countries, and its economic burden on the patients, family, community and nation is enormous
(24). It is estimated that non-communicable diseases will contribute about 50% to the total
disease burden in sub- Saharan Africa by 2020. Changes in lifestyle due to rapid urbanization,
changes in food habits and physical activity levels and patterns may at least explain in part the
ongoing transition (25-27). Cameroonian lifestyle results in extreme risk of type 2 diabetes,
which as of today, 80% of diabetes cases in Cameroon are undetected (28). Once diabetes
develops, the cost of caring for patients is exorbitant, and finally it may leads to several
15
complications (renal failure, blindness, amputation and heart disease) that many developing
countries are ill equipped to deal with. Modifying lifestyle is the best approach in the prevention
of diabetes, than getting expensive medications. This is because lifestyle modification can be
implemented locally, medications are often bought at high cost (29), sometimes drugs are not
available and again inconsistency in drug administration.
The prevalence of type 2 diabetes in Africa is about 2.5 percent, ranging from 0.8 percent in rural
Cameroon (30) to 13.5 percent in Mauritius (31). It is more frequent in South Africa and North
Africa than in Central and West Africa, and it increases from rural to urban areas (32).
1.10 Classification of Diabetes mellitus
The type of diabetes assign to individual depends on the circumstances present at the time of
diagnosis. Some diabetic individuals do not fit into single class. For example a person with
Gestational diabetes may continue to be hyperglycemic after delivery and may be determined to
have type 2 diabetes. Again a person who acquires diabetes because of large doses of exogenous
steroids may become normoglycemic, once the glucocorticoids are discontinued, but then may
develop diabetes later after recurrent episodes of pancreatitis.
1.10.1 Type 1 diabetes (ßcell destruction, leading to insulin deficiency)
This is immune mediated diabetes. This type of diabetes, account for 5- 10% of those with
diabetes. This was previously called insulin dependent diabetes or juvenile onset diabetes. It
result from the autoimmune destruction of the ß-cell of the pancreas, which has multiple genetic
predisposition and has also been said to be related to environmental factors, though still poorly
defined. Idiopathic diabetes is a form of type 1 diabetes, and minority of patients being affected
is mostly from African and Asian ancestry.
16
1.10.2 Type 2 diabetes (it range from predominantly insulin resistance with relative insulin deficiency to predominantly an insulin secretory defect with insulin resistance)
This type of diabetes, account for approximately 90-95% of those with diabetes. Was also called
non- insulin dependent diabetes and adult onset diabetes. Those that fall here have insulin
resistance and usually have relative rather than absolute insulin deficiency initially and
throughout their lifetime. They don’t need insulin treatment to survive. There are probably many
causes of this form of diabetes.
Individuals with type 2 diabetes are also at a significantly higher risk for coronary heart disease,
peripheral vascular disease, and stroke, and they have a greater likelihood of having
hypertension, dyslipidemia and obesity.
1.10.3 Gestational diabetes (GDM)
This is defined as any degree of glucose intolerance with onset or first recognition during
pregnancy. In united state, GDM affects 4% of all pregnancy, resulting to 135 thousand cases
yearly. GDM represents nearly 90% of all pregnancies complicated by diabetes.
1.10.4 Other specific types of diabetes
Genetic defect of the ß-cell; Genetic defect in insulin secretion; Disease of the exocrine pancreas;
Endocrinopathies; Drug or chemical induced diabetes; Infection; Uncommon forms of immune
mediated diabetes; genetic syndromes.
17
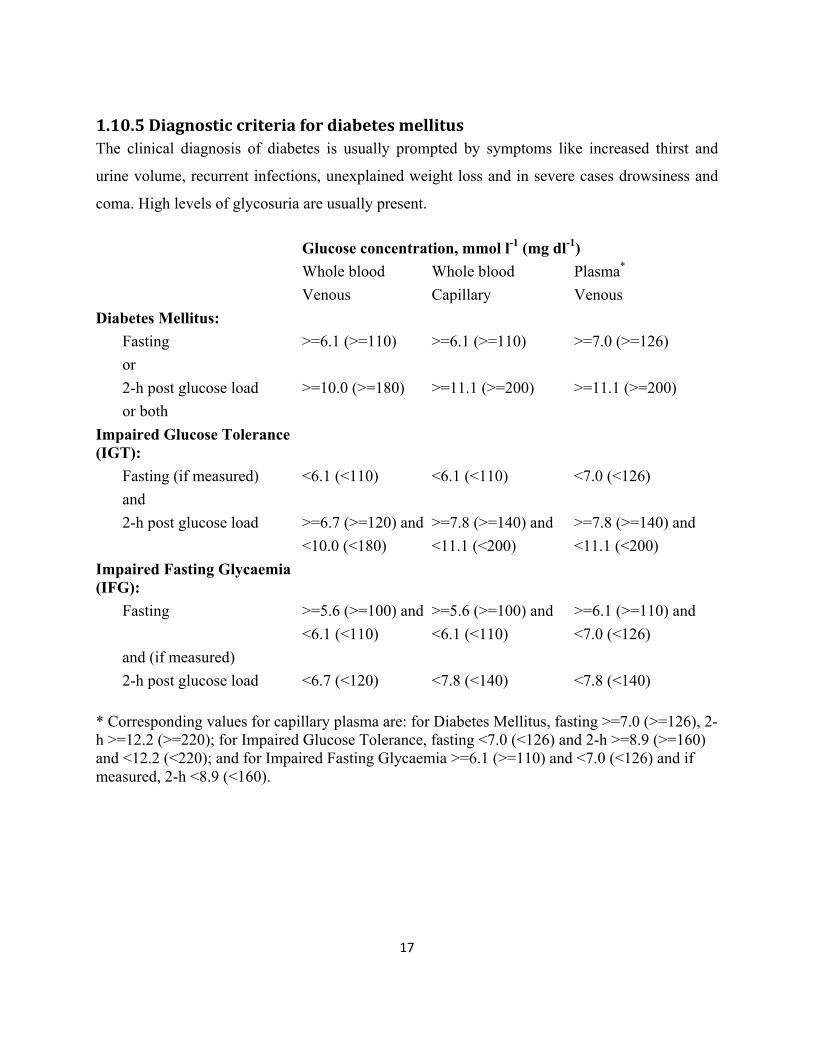
1.10.5 Diagnostic criteria for diabetes mellitus The clinical diagnosis of diabetes is usually prompted by symptoms like increased thirst and
urine volume, recurrent infections, unexplained weight loss and in severe cases drowsiness and
coma. High levels of glycosuria are usually present.
Glucose concentration, mmol l-1 (mg dl-1) Whole blood Whole blood Plasma* Venous Capillary Venous Diabetes Mellitus: Fasting >=6.1 (>=110) >=6.1 (>=110) >=7.0 (>=126) or 2-h post glucose load >=10.0 (>=180) >=11.1 (>=200) >=11.1 (>=200) or both Impaired Glucose Tolerance (IGT):
Fasting (if measured) <6.1 (<110) <6.1 (<110) <7.0 (<126) and 2-h post glucose load >=6.7 (>=120) and >=7.8 (>=140) and >=7.8 (>=140) and <10.0 (<180) <11.1 (<200) <11.1 (<200) Impaired Fasting Glycaemia (IFG):
Fasting >=5.6 (>=100) and >=5.6 (>=100) and >=6.1 (>=110) and <6.1 (<110) <6.1 (<110) <7.0 (<126) and (if measured) 2-h post glucose load <6.7 (<120) <7.8 (<140) <7.8 (<140)
* Corresponding values for capillary plasma are: for Diabetes Mellitus, fasting >=7.0 (>=126), 2-h >=12.2 (>=220); for Impaired Glucose Tolerance, fasting <7.0 (<126) and 2-h >=8.9 (>=160) and <12.2 (<220); and for Impaired Fasting Glycaemia >=6.1 (>=110) and <7.0 (<126) and if measured, 2-h <8.9 (<160).
18
1.10.6 Associated risk factors of type 2 diabetes
Recently, researches have clearly shown that lifestyle intervention can reduce the risk of diabetes
in those with impaired glucose tolerance; with weight reduction which appears to be the primary
determinant of this effect. Weight loss can also improve glycemic control and cardiovascular risk
factors in those with diabetes; however, the long-term impact of weight loss on cardiovascular
morbidity and mortality is still under investigation (14;33-37). The increased of obesity has also
contributed significantly to the prevalence of type 2 diabetes (38). Diabetes spending increases
substantially in the presence of various Cardiometabolic risk factors (CMR) factors (e.g., obesity,
hypertension, and dyslipidemia), independent of the presence of other chronic complications(39)
1.10.7 Diabetes and HIV AIDs
Recent studies have found type 2 diabetes in HIV positive patents. Fasting hyperglycaemia is
associated with HIV protease inhibitors (PI) therapy. The pathogenesis of HIV-PI- associated
diabetes, involves peripheral insulin resistance with insulin deficiency relative to
hyperglucogonemia and body mass index (40). Metabolic alteration, including insulin resistance
and diabetes mellitus has been found to be associated with antiretroviral (ART) therapy. Diabetes
has been reported in 2 to 10% of people taking anti-HIV therapy, with prevalence growing as
time on therapy increases. Recent studies have found that the risk of diabetes is four to five times
greater in HIV-positive men on HAART (Highly Active Anti-retroviral therapy) compared with
HIV-negative men, three times greater in HIV-positive women on HAART compared with HIV-
negative women, and that co-infection with hepatitis C appears to further increase the risk of
diabetes in HIV-positive people (41;42).
19
1.10.8 Rational of the study
The prevalence of type 2 diabetes is predicted to increase extensively in sub- Saharan Africa, and
predict to double in Cameroon, especially in the urban area, due to changes in human behaviour.
Cameroonian lifestyle results in extreme risk of type 2 diabetes, which as of today, 80% of
diabetes cases in Cameroon are undetected (43). We therefore judge it necessary to conduct this
study in view to provide baseline information and reference data, to policy makers in the
prevention and control of type 2 diabetes and to develop policies for early intervention of type 2
diabetes.
20
2. Research objectives
2.1 Research Question Do lifestyle factors like food habits, smoking, physical activity contributes to the development of
diabetes mellitus?
2.2 Broad objectives
The objective here is to provide baseline data that will contribute to the surveillance of diabetes
in Cameroon and develop policies to prevent the occurrence of type 2 diabetes.
2.3 Specific objectives:
• To observe the prevalence of diabetes by gender and age group
• To observe the association between lifestyle factors and the occurrence of diabetes mellitus
• To analyze the association between measures of obesity
• To study the prevalence of hypertension in Cameroonian adult population
• To provide reference data on the prevalence and distribution of type 2 diabetes among
different social class in Cameroon
21
3. Methodology and Study Design
3.1 Study type
Cross sectional study
3.2 Study setting
The study was conducted in the urban health District of Biyem-Assi, Yaoundé. This health
district is currently being used as one of the site of the Cameroon Burden of Diabetes projects.
This district is in Yaoundé, the capital city of Cameroon and its inhabitants are mostly office
workers, commercial agents or students. It has a population of 422 522 inhabitants.
3.3 Study Population
The study population is Cameroonian men and women aged 25 years and above, who live in
urban communities. They were recruited on the basis of a random sampling of households
following a preliminary census of households in the study area. Home visits were organized for
the collection of data by the researcher and certified field workers for data collection.
3.4 Selection Criteria of Health District
Criteria for selection of Health District for study site included: belonging to one of the ecological
zones of the country, geographical accessibility, being the most urbanized area of the ecological
zone where the population density is highest and area where profound lifestyle changes have
occured. The Biyem-Assi health district with specific characteristics was selected from one of
the ecological zone for the study.
3.5 Inclusion criteria
Those included in the study were 25 years and above, and those who were willing to participant
and comply with instruction of the study e.g. overnight fasting. It was voluntary participation and
only those who were residents of Biyem-Assi health District were accepted to participate.
22
3.6 Exclusion criteria
Pregnant women, individuals suffering from psychotic illness and those who were unable to walk
unaided were not included in the study.
3.7 Sample size calculation
Using Epitable calculator in the Epi Info software, the sample size was calculated to achieve a
precision of +/-1.5% within the study area, for an expected prevalence of diabetes of 4% and
allowing a design effect of not more than 3.75 for a household clustered survey. This gave a
required sample size of 2460. Assuming a non-response rate of about 10%, a sample of 2706
individuals was therefore needed. However, owing to limited time and resources a sample size of
1279 subjects was collected. Due to cost involved, research materials were insufficient for all the
subjects, especially for the biochemical test.
3.8 Sampling Technique
The sampling scheme employed, was a multistage systematic sampling stratified by age group.
Each sentinel site constituted a cluster and the health area within which the district hospital was
implanted constituted the area frame. The households of the selected health area were considered
the final sampling unit. A census had been conducted in the entire selected health area. All the
households in the study site had been enlisted and all the adults aged 25 years and above
registered. The total number of subjects within each age group was determined. This has been
used to calculate the percentage contribution of each age group to the total population. This
population percentage for each age group was then used to determine the number of households
which was needed to achieve the desired sample size for each age group. The number of
households obtained for each age group was then divided by the number of subjects in each
group to obtain the sampling interval. The first household was selected randomly and individual
23
age group sampling intervals was then used to obtain the households from which all the subjects
were obtained.
3.9 Definition of Household
Household was defined as a group of people who share a common residence (live together) and
partake in common meals.
3.10 Piloting of tools
All the operational data collection tools were duly piloted in the site, the Biyem-Assi health
district, and amended accordingly. Evaluation indicators, in accordance with the STEPS
instrument, included understanding of wordings of questions; clarity of questions;
embarrassments provided by questions and proposed additives.
3.11 Data collection Procedures (field work)
Data was collected using steps 1, 2 and 3 of the WHO steps instrument (Version 1.3) for NCDs
and their risk factor surveillance that was adapted for the Cameroon Burden of Diabetes
(CAMBoD) project with respect to local specifications. It is made up of three main sections: a
self reported information questionnaire (step1), anthropometrical measurements (step2) and the
biochemical measurements (step 3)(44).
3.11.1 Questionnaire: Basic core, expanded and optional variables with regards to socio-
economic and demographic data, diabetes and its risk factors (tobacco, dietary habits and
physical activity) were self-reported by the subjects.
24
Education: The type of last educational institution attended was used, assigning four categories:
none (attended no educational institution), primary (1–7 years of education), secondary (8–14
years of education), and university (>14 years of education).
Smoking: The classification used was non-smoker (has never smoked + ex-smoker) and smokers
(current smokers).
3.11.2 Anthropometrical measurements: The clinical and anthropometrical
measurements included weight, height, waist and hip girth and blood pressure (BP). These
measurements were done using standardized methods (44-47). Body weight in light clothes was
measured to the nearest 0.1 kg using a Sohenle mechanical weighing scale (Soehnle-Waagen
GmbH & Co. KG, Wilhelm-Soehnle-Strabe 2, D-71540 Murrhardt/Germany) and the height to
the nearest 0.5 cm using a portable, locally manufactured, stadiometer, with subjects, standing
upright on a flat surface without shoes, the back of the heels and the occiput on the stadiometer.
Waist circumference (WC), taken midway between the lowest rib and the iliac crest and hip
circumference (HC) at the level of the greater trochanters was measured to the nearest mm using
a flexible tape.
3.11. 2.1 Data on blood pressure
Three readings of blood pressure, at 5 minutes interval were taken from each participant.
Measurements were taken on a sitting position after 10 minutes rest, by the researcher and
certified field workers according to a predefined protocol following American Heart Association
(AHA) procedures, using electronic AND 0 78 Model UA-767 fully automatic, clinically
validated digital BP monitor (A & D Company Limited Tokyo, Japan), with a suitable sized cuff
(Small 9x18 cm, medium 12x23 cm and large 15×33 cm) at the forearm. Hypertension was
defined as systolic BP (SBP) ≥ 140 mmHg and/or diastolic BP (DBP) ≥90 mmHg according to
criteria of the seventh Joint National Committee on Prevention, Detection, Evaluation and
25
Treatment of high blood pressure (Ref JNC VII). Subjects with values of SBP and DBP under
the defined limits but who reported taking antihypertensive treatment for at least two weeks
before the survey onset were classified as hypertensives.
3.11.2.2 Data on Obesity
Body Mass Index (BMI), was calculated as the ratio of weight in kilograms over height in meters
squared, [weight (kg)/height (m2)]. Four categories of BMI (≤ 20, 20-24.9, 25-29.9, and
≥30kg/m2) were identified. Individuals with BMI≤ 20kg/m2 classified as underweight, healthy
weight (BMI 20-25), overweight (BMI 25-29.9) and obese (BMI ≥30 kg/m2), respectively (48)
WHO, 2003). Men with WC of < 94 were classified as normal weight, 94-101.9 overweight and
≥102cm obese. Women were also classified in same categories of <80, 80- 87.9 and ≥88cm for
normal weight, overweight and obese, respectively. Abdominal obesity was evaluated by the
waist/hip ratio, by dividing WC by HC. Men with WHR <0.90, 0.90-0.99 and ≥1.0 were
classified as normal weight, overweight and obese respectively, while for women, WHR were
classified as <0.80, 0.80-0.84 and ≥0.85 (49).
3.11.3 Biochemical measurements (data on diabetes)
Every subject was visited at home between 5:30 a.m. and 9:00 a.m. on the day of appointment
for the measurement of fasting capillary blood glucose using the HemoCue® B-Glucose data
management analyser [HemoCue® B-Glucose photometer (photometer, 1995 #168)].
HemoCue®, is a diagnostic tool for measuring blood glucose. We used fasting capillary glucose
with an abnormal FCG ≥ 110 mg/dl or 6.1 mmol/l FCG, to defined diabetes, together with ≥5.6
and <6.0 mmol/l to define impaired fasting capillary glycemia, as recommended by WHO
(50;44;51).
26
3.11.4 Data handling
Data entering took place, after the field work. The data was entered into EpiData version 3.1 and
later imported into SPSS 15.0. In Norway, the data set was screened and cleared before being
analysed.
3.11.5 Quality Assurance
Quality assurance within the survey started with the recruitment of qualified field data collection
staff. The pre-testing of the tools was secured.
The appropriate training was provided to the field data collection staff in order to secure the
quality of the data collected. Emphasis was laid on the anthropometrical measurements, BP
taking and fasting capillary glucose procedures. Repeatability was assessed during the training.
Refresher trainings were provided twice in the field to assure that the standards were up to date.
The rigorous cold chain was maintained during the movement of the Microcuvet Haemocues,
which is actually wet chemistry for obtaining fasting blood glucose, was a major quality measure
for authentic data. Rigorous data management (crosschecking and validating forms and data
entry) was conducted as a quality measure.
3.11.6 Statistical methods
Data are expressed as mean±2SD. Comparison was done by student t-test for continuous
variables and χ2 –test for categorical variables. Logistic regression analyses were conducted to
control the effects of potential confounding factors. All diabetic risk factors presented in table 1,
were entered into regression model, with diabetes (0 =no, 1 =yes) as the dependent variables.
Categorical data were expressed as frequency and percentages and compared by Chi-square test
and non-parametric test in different subgroups or proportion in case of the violation of normal
distribution. Correlation among anthropometric measurements were analysed by partial
27
correlation coefficient, and adjusted for age. The analysis was done, using SPSS version 15. The
statistical significance was set at P<0.05. All test performed was two tailed.
3.11.9 Ethical issues
All necessary ethical and administrative approval was obtained from the appropriate authorities
before commencement of the study. Ethical clearance was obtained from Norwegian Ethical
committee and National ethical committee of the Cameroon Ministry of public Health.
Administrative clearance was obtained from the District Medical Officers and the Divisional
Officer of the health districts.
It was a project of free participation. All volunteers were provided with detailed information by
letter about the study procedures and the risk and benefits involved. They had an opportunity to
discuss with the researcher, if they require further informations and clarifications. All volunteers
selected to participate in the study read and sign the informed consent form prior to commencing
the study procedure. The volunteers had the right to withdraw at any stage of the study without
giving any notification. The anthropometric and biochemical assessments were performed with
care to avoid or limit possible uncomfortable and exhausting feelings. The reason for carrying
out the tests was explained, in order to secure any unexpected events. Data’s were handled
confidentially without any personal identity. The project was carried out in accordance with the
guidelines in the Helsinki Declaration, on biomedical research involving human subjects.
28
4. Results
4.1 Description of the study population
In this cross sectional study, a total of 1279 people aged 25 years and older from 595 households,
participated in the study. One person withdrew from the study, because she changed her job and
left the town.
There were 530 (41.4%) males and 749 (58.6%) females. The mean age was 41.40± 13.2 years.
In the study population 58% of the participants were married, 29.1% singles, 1.6% divorced,
8.4% widow/widower, 0.6% separated, 1.5% cohabiting and the remaining 0.4% were those who
were windows/widowers and divorcé(e) who remarried.
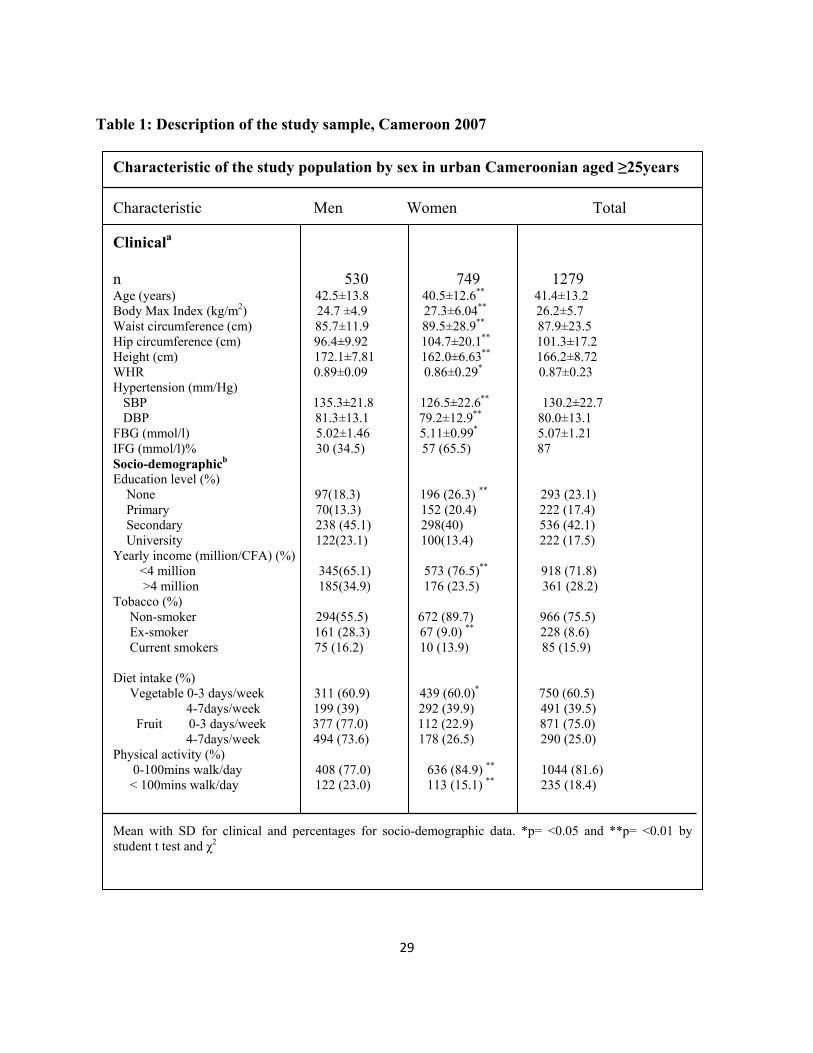
Table 1 depicts the general characteristic of the study population. The mean ages were 42.5 and
40.5 in men and women, respectively. The age range was in ten years interval. Among the 1279
participants, 114 subjects were diagnosed to have type 2 diabetes during this study, with age
standardized prevalence rate of 9.0% and impaired fasting glycaemia 6.8%. The overall
prevalence of hypertension was 36.2% and obesity 23.9% (men 13.4% and women 31.4%). BMI,
waist circumference, Hip circumference and fasting blood glucose were significantly higher in
women than in men (p<0.05). Overweight and obesity was a common factor in the older age
groups. Whereas the mean difference of systolic blood pressure and diastolic blood pressure
were lower in women than men. Men were in general taller than the women. Mean levels of the
anthropometric measurements, except for height and WHR were higher among women than the
men (p<0.05). Men smoked more and was physically active than the women (p<0.001). There
was a significant difference in educational levels and yearly income in men and women
(p<0.001).
29
Table 1: Description of the study sample, Cameroon 2007
Characteristic of the study population by sex in urban Cameroonian aged ≥25years
Characteristic Men Women Total
Clinicala
n 530 749 1279 Age (years) 42.5±13.8 40.5±12.6** 41.4±13.2
Body Max Index (kg/m2) 24.7 ±4.9 27.3±6.04** 26.2±5.7 Waist circumference (cm) 85.7±11.9 89.5±28.9** 87.9±23.5
Hip circumference (cm) 96.4±9.92 104.7±20.1** 101.3±17.2 Height (cm) 172.1±7.81 162.0±6.63** 166.2±8.72 WHR 0.89±0.09 0.86±0.29* 0.87±0.23 Hypertension (mm/Hg) SBP 135.3±21.8 126.5±22.6** 130.2±22.7
DBP 81.3±13.1 79.2±12.9** 80.0±13.1 FBG (mmol/l) 5.02±1.46 5.11±0.99* 5.07±1.21 IFG (mmol/l)% 30 (34.5) 57 (65.5) 87 Socio-demographicb Education level (%)
None 97(18.3) 196 (26.3) ** 293 (23.1) Primary 70(13.3) 152 (20.4) 222 (17.4) Secondary 238 (45.1) 298(40) 536 (42.1) University 122(23.1) 100(13.4) 222 (17.5) Yearly income (million/CFA) (%)
<4 million 345(65.1) 573 (76.5)** 918 (71.8) >4 million 185(34.9) 176 (23.5) 361 (28.2) Tobacco (%) Non-smoker 294(55.5) 672 (89.7) 966 (75.5) Ex-smoker 161 (28.3) 67 (9.0) ** 228 (8.6) Current smokers 75 (16.2) 10 (13.9) 85 (15.9) Diet intake (%)
Vegetable 0-3 days/week 311 (60.9) 439 (60.0)* 750 (60.5) 4-7days/week 199 (39) 292 (39.9) 491 (39.5) Fruit 0-3 days/week 377 (77.0) 112 (22.9) 871 (75.0) 4-7days/week 494 (73.6) 178 (26.5) 290 (25.0)
Physical activity (%) 0-100mins walk/day 408 (77.0) 636 (84.9) ** 1044 (81.6) < 100mins walk/day 122 (23.0) 113 (15.1) ** 235 (18.4) Mean with SD for clinical and percentages for socio-demographic data. *p= <0.05 and **p= <0.01 by student t test and χ2
30
4.2: Disease/ Risk factor prevalence
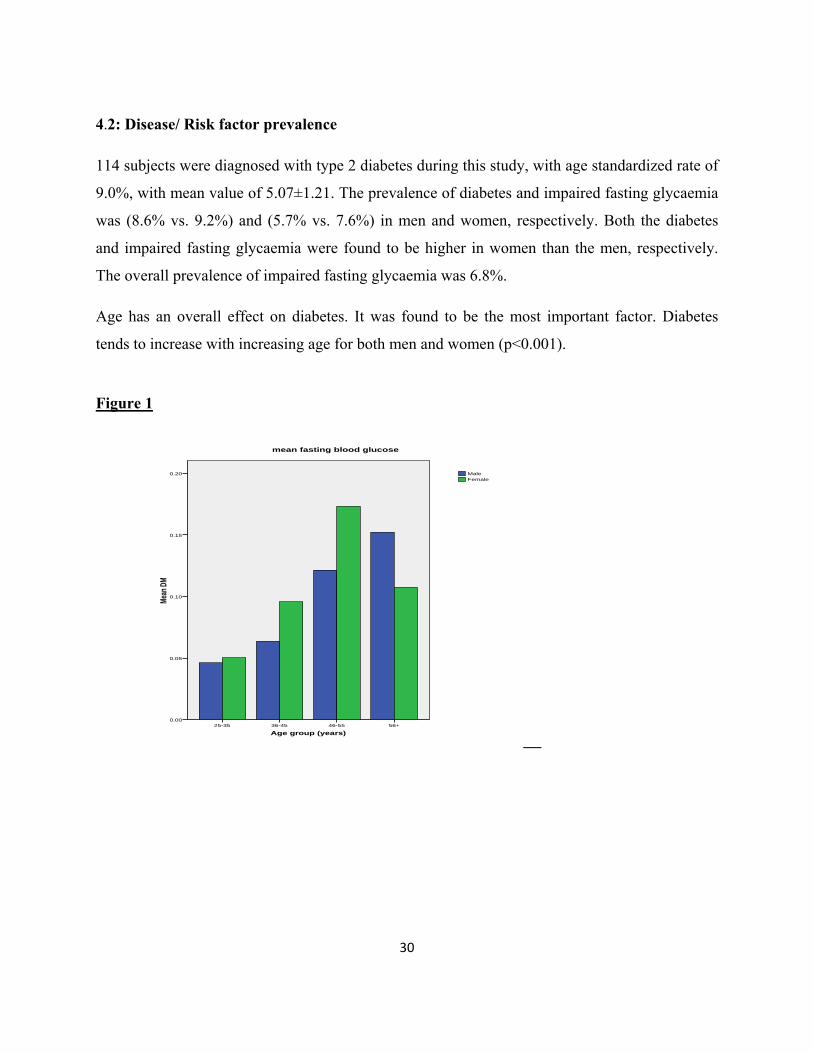
114 subjects were diagnosed with type 2 diabetes during this study, with age standardized rate of
9.0%, with mean value of 5.07±1.21. The prevalence of diabetes and impaired fasting glycaemia
was (8.6% vs. 9.2%) and (5.7% vs. 7.6%) in men and women, respectively. Both the diabetes
and impaired fasting glycaemia were found to be higher in women than the men, respectively.
The overall prevalence of impaired fasting glycaemia was 6.8%.
Age has an overall effect on diabetes. It was found to be the most important factor. Diabetes
tends to increase with increasing age for both men and women (p<0.001).
Figure 1
Age group (years)56+46-5536-4525-35
Mean
DM
0.20
0.15
0.10
0.05
0.00
FemaleMale
mean fasting blood glucose
__
31
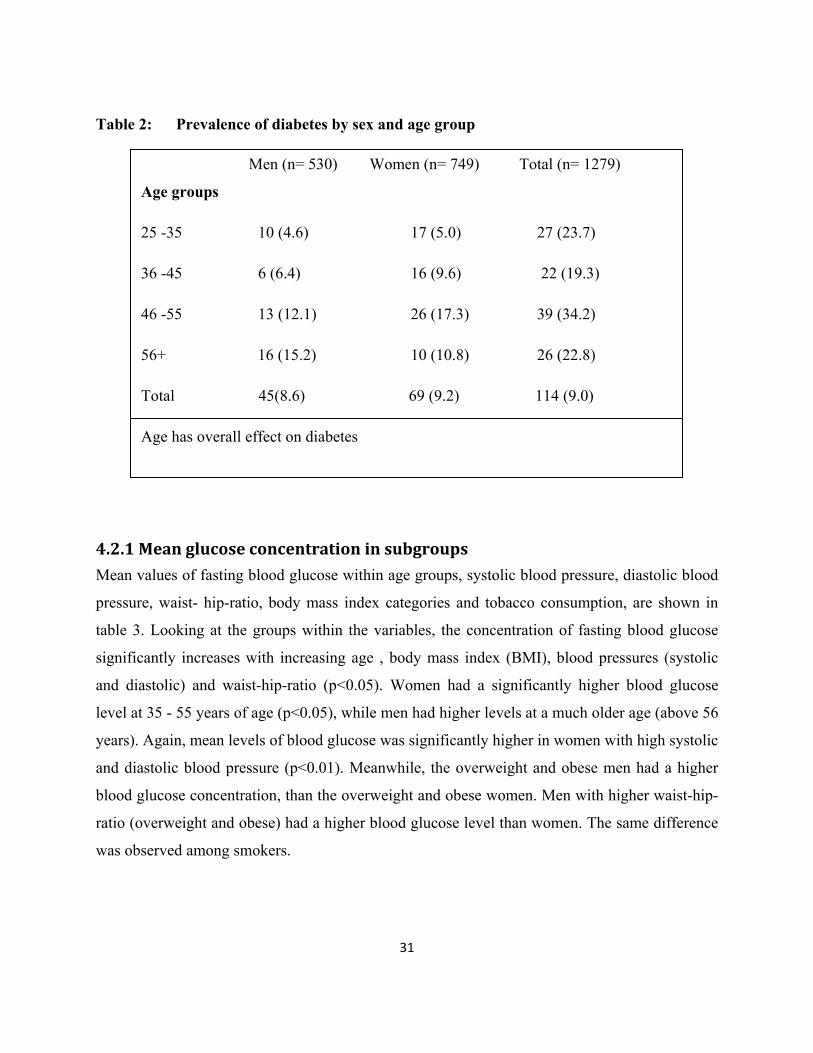
Table 2: Prevalence of diabetes by sex and age group Men (n= 530) Women (n= 749) Total (n= 1279)
Age groups
25 -35 10 (4.6) 17 (5.0) 27 (23.7)
36 -45 6 (6.4) 16 (9.6) 22 (19.3)
46 -55 13 (12.1) 26 (17.3) 39 (34.2)
56+ 16 (15.2) 10 (10.8) 26 (22.8)
Total 45(8.6) 69 (9.2) 114 (9.0)
Age has overall effect on diabetes
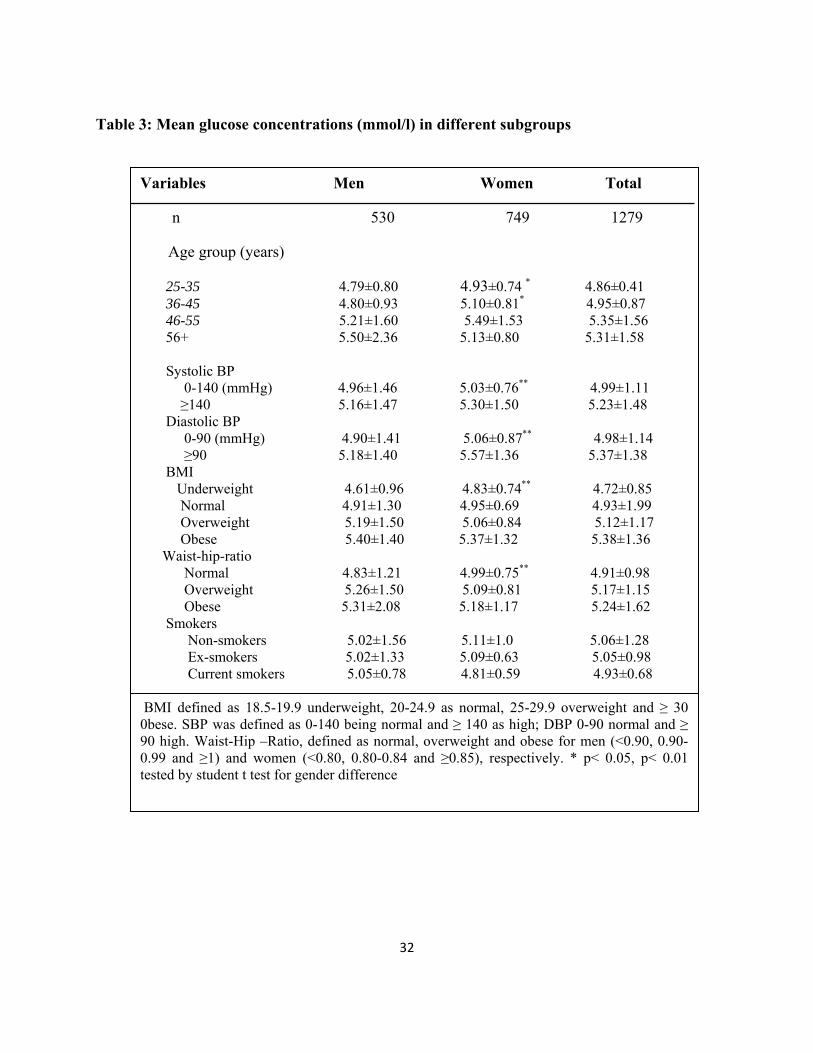
4.2.1 Mean glucose concentration in subgroups
Mean values of fasting blood glucose within age groups, systolic blood pressure, diastolic blood
pressure, waist- hip-ratio, body mass index categories and tobacco consumption, are shown in
table 3. Looking at the groups within the variables, the concentration of fasting blood glucose
significantly increases with increasing age , body mass index (BMI), blood pressures (systolic
and diastolic) and waist-hip-ratio (p<0.05). Women had a significantly higher blood glucose
level at 35 - 55 years of age (p<0.05), while men had higher levels at a much older age (above 56
years). Again, mean levels of blood glucose was significantly higher in women with high systolic
and diastolic blood pressure (p<0.01). Meanwhile, the overweight and obese men had a higher
blood glucose concentration, than the overweight and obese women. Men with higher waist-hip-
ratio (overweight and obese) had a higher blood glucose level than women. The same difference
was observed among smokers.
32
Table 3: Mean glucose concentrations (mmol/l) in different subgroups
Variables Men Women Total
n 530 749 1279 Age group (years) 25-35 4.79±0.80 4.93±0.74 * 4.86±0.41
36-45 4.80±0.93 5.10±0.81* 4.95±0.87 46-55 5.21±1.60 5.49±1.53 5.35±1.56 56+ 5.50±2.36 5.13±0.80 5.31±1.58 Systolic BP 0-140 (mmHg) 4.96±1.46 5.03±0.76** 4.99±1.11 ≥140 5.16±1.47 5.30±1.50 5.23±1.48 Diastolic BP 0-90 (mmHg) 4.90±1.41 5.06±0.87** 4.98±1.14
≥90 5.18±1.40 5.57±1.36 5.37±1.38 BMI
Underweight 4.61±0.96 4.83±0.74** 4.72±0.85 Normal 4.91±1.30 4.95±0.69 4.93±1.99
Overweight 5.19±1.50 5.06±0.84 5.12±1.17 Obese 5.40±1.40 5.37±1.32 5.38±1.36
Waist-hip-ratio Normal 4.83±1.21 4.99±0.75** 4.91±0.98
Overweight 5.26±1.50 5.09±0.81 5.17±1.15 Obese 5.31±2.08 5.18±1.17 5.24±1.62
Smokers Non-smokers 5.02±1.56 5.11±1.0 5.06±1.28
Ex-smokers 5.02±1.33 5.09±0.63 5.05±0.98 Current smokers 5.05±0.78 4.81±0.59 4.93±0.68
BMI defined as 18.5-19.9 underweight, 20-24.9 as normal, 25-29.9 overweight and ≥ 30 0bese. SBP was defined as 0-140 being normal and ≥ 140 as high; DBP 0-90 normal and ≥ 90 high. Waist-Hip –Ratio, defined as normal, overweight and obese for men (<0.90, 0.90-0.99 and ≥1) and women (<0.80, 0.80-0.84 and ≥0.85), respectively. * p< 0.05, p< 0.01 tested by student t test for gender difference
33
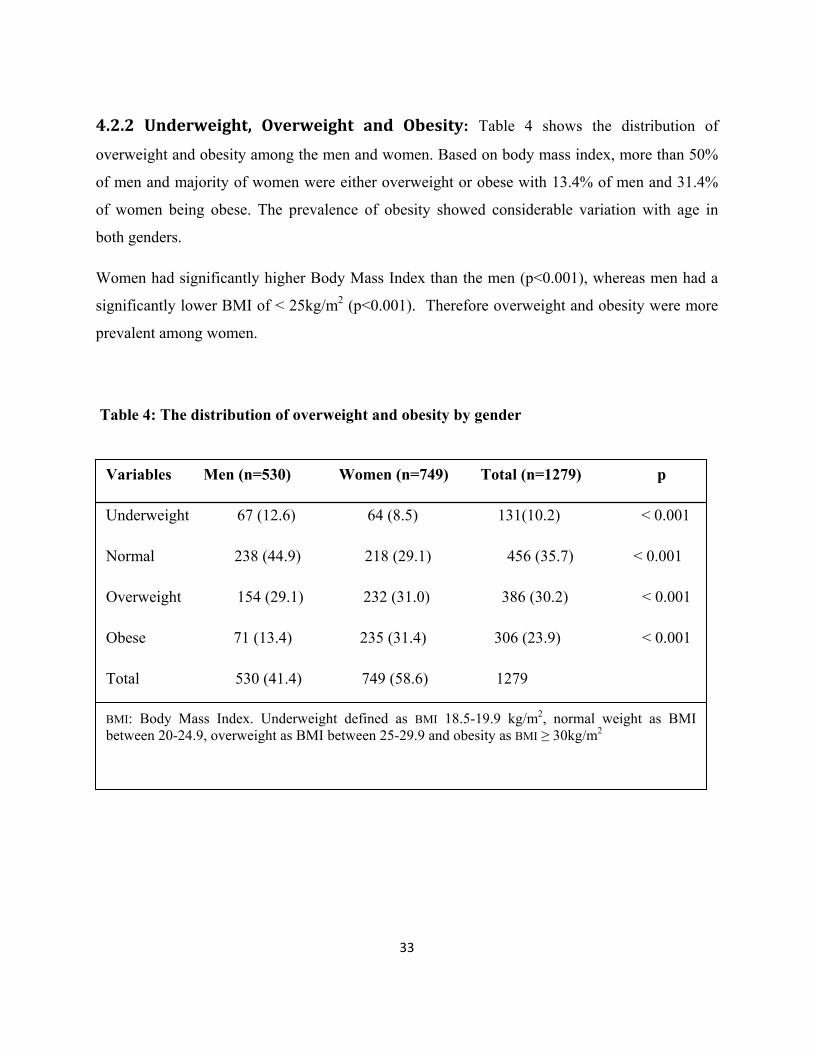
4.2.2 Underweight, Overweight and Obesity: Table 4 shows the distribution of
overweight and obesity among the men and women. Based on body mass index, more than 50%
of men and majority of women were either overweight or obese with 13.4% of men and 31.4%
of women being obese. The prevalence of obesity showed considerable variation with age in
both genders.
Women had significantly higher Body Mass Index than the men (p<0.001), whereas men had a
significantly lower BMI of < 25kg/m2 (p<0.001). Therefore overweight and obesity were more
prevalent among women.
Table 4: The distribution of overweight and obesity by gender
Variables Men (n=530) Women (n=749) Total (n=1279) p
Underweight 67 (12.6) 64 (8.5) 131(10.2) < 0.001
Normal 238 (44.9) 218 (29.1) 456 (35.7) < 0.001
Overweight 154 (29.1) 232 (31.0) 386 (30.2) < 0.001
Obese 71 (13.4) 235 (31.4) 306 (23.9) < 0.001
Total 530 (41.4) 749 (58.6) 1279
BMI: Body Mass Index. Underweight defined as BMI 18.5-19.9 kg/m2, normal weight as BMI between 20-24.9, overweight as BMI between 25-29.9 and obesity as BMI ≥ 30kg/m2
34
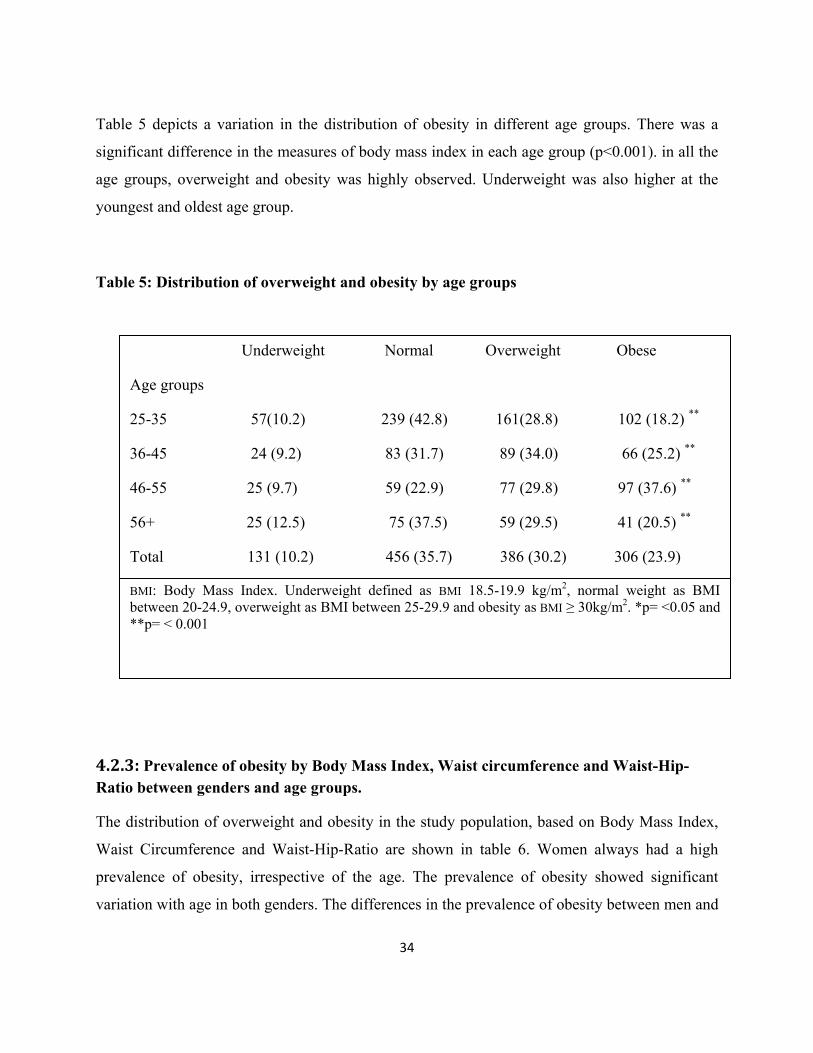
Table 5 depicts a variation in the distribution of obesity in different age groups. There was a
significant difference in the measures of body mass index in each age group (p<0.001). in all the
age groups, overweight and obesity was highly observed. Underweight was also higher at the
youngest and oldest age group.
Table 5: Distribution of overweight and obesity by age groups
Underweight Normal Overweight Obese Age groups
25-35 57(10.2) 239 (42.8) 161(28.8) 102 (18.2) **
36-45 24 (9.2) 83 (31.7) 89 (34.0) 66 (25.2) **
46-55 25 (9.7) 59 (22.9) 77 (29.8) 97 (37.6) **
56+ 25 (12.5) 75 (37.5) 59 (29.5) 41 (20.5) **
Total 131 (10.2) 456 (35.7) 386 (30.2) 306 (23.9)
BMI: Body Mass Index. Underweight defined as BMI 18.5-19.9 kg/m2, normal weight as BMI between 20-24.9, overweight as BMI between 25-29.9 and obesity as BMI ≥ 30kg/m2. *p= <0.05 and **p= < 0.001
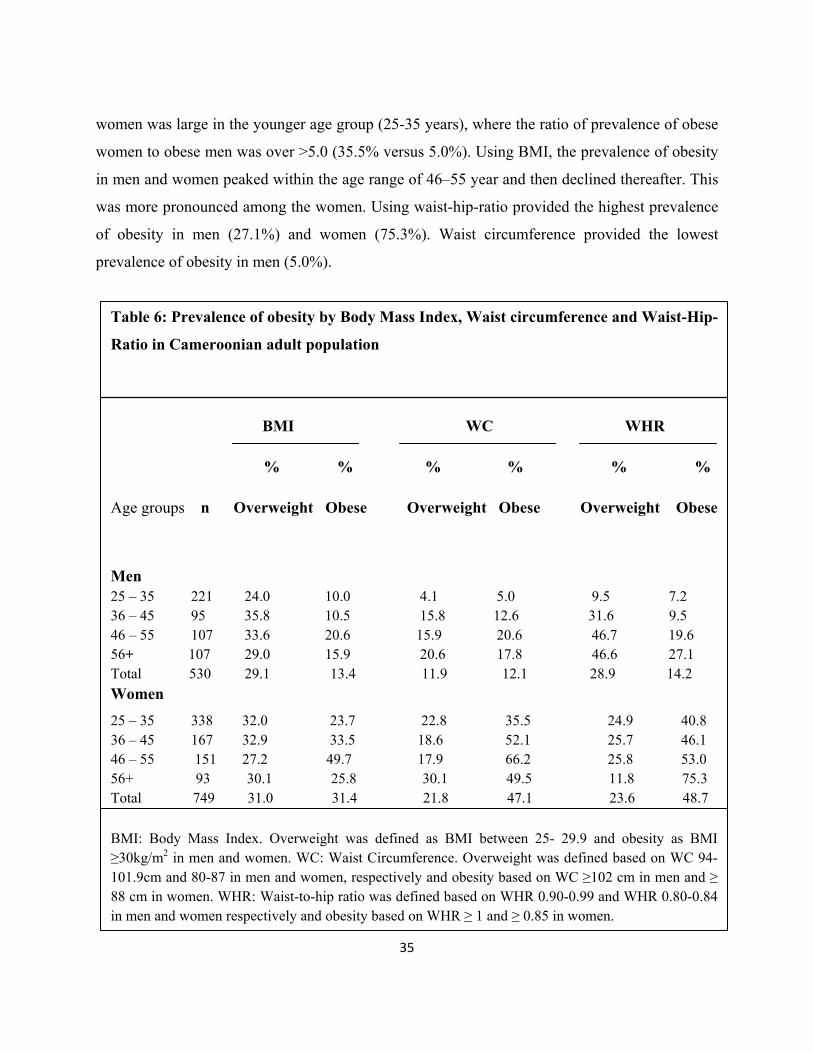
4.2.3: Prevalence of obesity by Body Mass Index, Waist circumference and Waist-Hip-Ratio between genders and age groups.
The distribution of overweight and obesity in the study population, based on Body Mass Index,
Waist Circumference and Waist-Hip-Ratio are shown in table 6. Women always had a high
prevalence of obesity, irrespective of the age. The prevalence of obesity showed significant
variation with age in both genders. The differences in the prevalence of obesity between men and
35
women was large in the younger age group (25-35 years), where the ratio of prevalence of obese
women to obese men was over >5.0 (35.5% versus 5.0%). Using BMI, the prevalence of obesity
in men and women peaked within the age range of 46–55 year and then declined thereafter. This
was more pronounced among the women. Using waist-hip-ratio provided the highest prevalence
of obesity in men (27.1%) and women (75.3%). Waist circumference provided the lowest
prevalence of obesity in men (5.0%).
Table 6: Prevalence of obesity by Body Mass Index, Waist circumference and Waist-Hip-
Ratio in Cameroonian adult population
BMI WC WHR
% % % % % %
Age groups n Overweight Obese Overweight Obese Overweight Obese
Men 25 – 35 221 24.0 10.0 4.1 5.0 9.5 7.2 36 – 45 95 35.8 10.5 15.8 12.6 31.6 9.5 46 – 55 107 33.6 20.6 15.9 20.6 46.7 19.656+ 107 29.0 15.9 20.6 17.8 46.6 27.1 Total 530 29.1 13.4 11.9 12.1 28.9 14.2 Women 25 – 35 338 32.0 23.7 22.8 35.5 24.9 40.8 36 – 45 167 32.9 33.5 18.6 52.1 25.7 46.1 46 – 55 151 27.2 49.7 17.9 66.2 25.8 53.0 56+ 93 30.1 25.8 30.1 49.5 11.8 75.3 Total 749 31.0 31.4 21.8 47.1 23.6 48.7 BMI: Body Mass Index. Overweight was defined as BMI between 25- 29.9 and obesity as BMI ≥30kg/m2 in men and women. WC: Waist Circumference. Overweight was defined based on WC 94- 101.9cm and 80-87 in men and women, respectively and obesity based on WC ≥102 cm in men and ≥ 88 cm in women. WHR: Waist-to-hip ratio was defined based on WHR 0.90-0.99 and WHR 0.80-0.84 in men and women respectively and obesity based on WHR ≥ 1 and ≥ 0.85 in women.
36
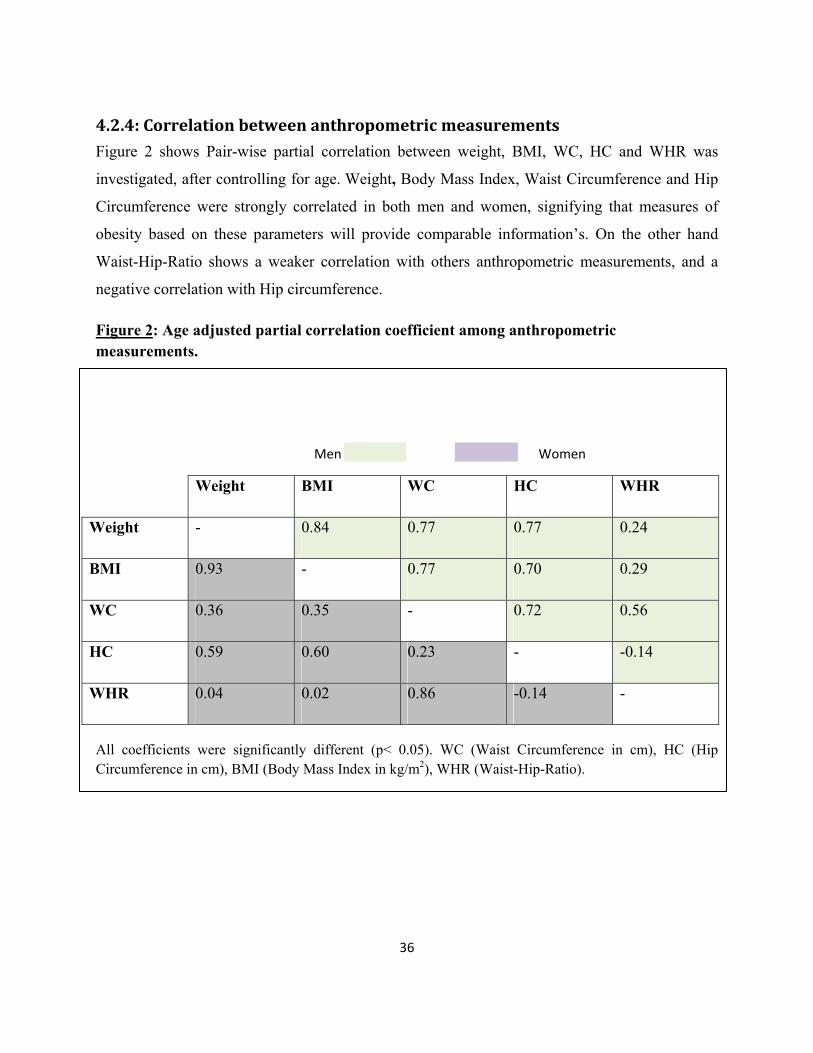
4.2.4: Correlation between anthropometric measurements Figure 2 shows Pair-wise partial correlation between weight, BMI, WC, HC and WHR was
investigated, after controlling for age. Weight, Body Mass Index, Waist Circumference and Hip
Circumference were strongly correlated in both men and women, signifying that measures of
obesity based on these parameters will provide comparable information’s. On the other hand
Waist-Hip-Ratio shows a weaker correlation with others anthropometric measurements, and a
negative correlation with Hip circumference.
Figure 2: Age adjusted partial correlation coefficient among anthropometric measurements.
Men Women
Weight BMI WC HC WHR
Weight - 0.84 0.77 0.77 0.24
BMI 0.93 - 0.77 0.70 0.29
WC 0.36 0.35 - 0.72 0.56
HC 0.59 0.60 0.23 - -0.14
WHR 0.04 0.02 0.86 -0.14 -
All coefficients were significantly different (p< 0.05). WC (Waist Circumference in cm), HC (Hip Circumference in cm), BMI (Body Mass Index in kg/m2), WHR (Waist-Hip-Ratio).
37
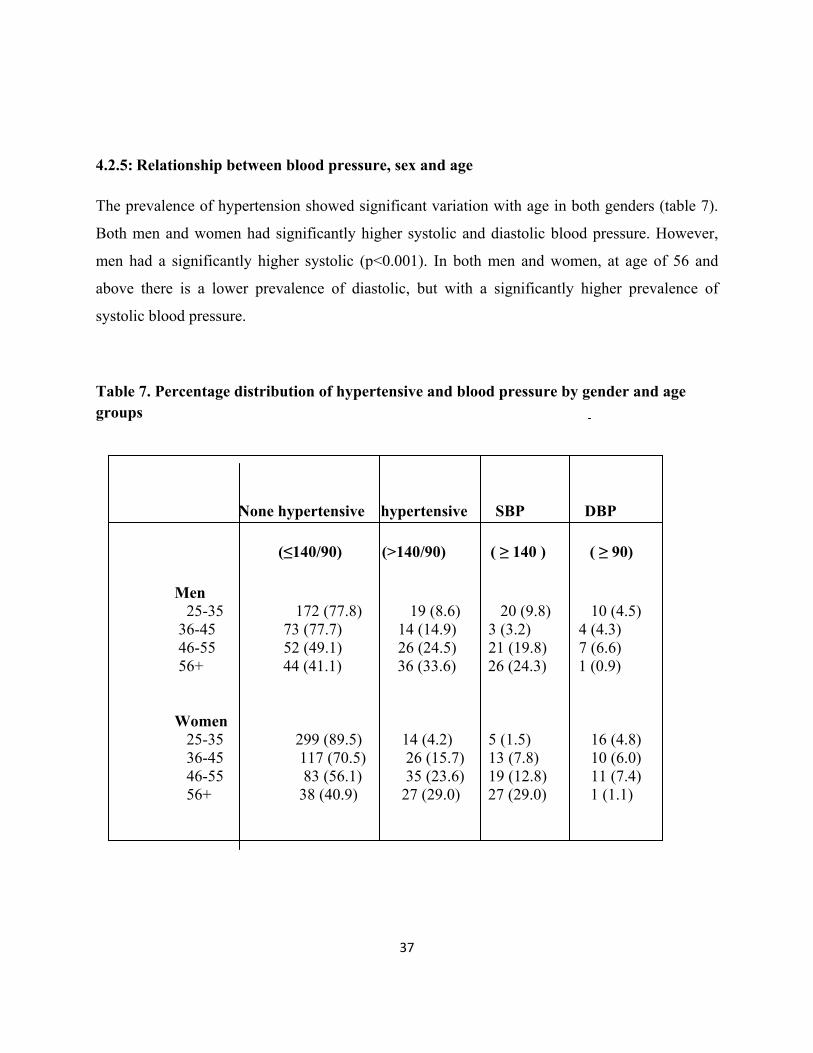
4.2.5: Relationship between blood pressure, sex and age
The prevalence of hypertension showed significant variation with age in both genders (table 7).
Both men and women had significantly higher systolic and diastolic blood pressure. However,
men had a significantly higher systolic (p<0.001). In both men and women, at age of 56 and
above there is a lower prevalence of diastolic, but with a significantly higher prevalence of
systolic blood pressure.
Table 7. Percentage distribution of hypertensive and blood pressure by gender and age groups
None hypertensive hypertensive SBP DBP
(≤140/90) (>140/90) ( ≥ 140 ) ( ≥ 90)
Men 25-35 172 (77.8) 19 (8.6) 20 (9.8) 10 (4.5) 36-45 73 (77.7) 14 (14.9) 3 (3.2) 4 (4.3) 46-55 52 (49.1) 26 (24.5) 21 (19.8) 7 (6.6)
56+ 44 (41.1) 36 (33.6) 26 (24.3) 1 (0.9)
Women
25-35 299 (89.5) 14 (4.2) 5 (1.5) 16 (4.8) 36-45 117 (70.5) 26 (15.7) 13 (7.8) 10 (6.0) 46-55 83 (56.1) 35 (23.6) 19 (12.8) 11 (7.4) 56+ 38 (40.9) 27 (29.0) 27 (29.0) 1 (1.1)
38
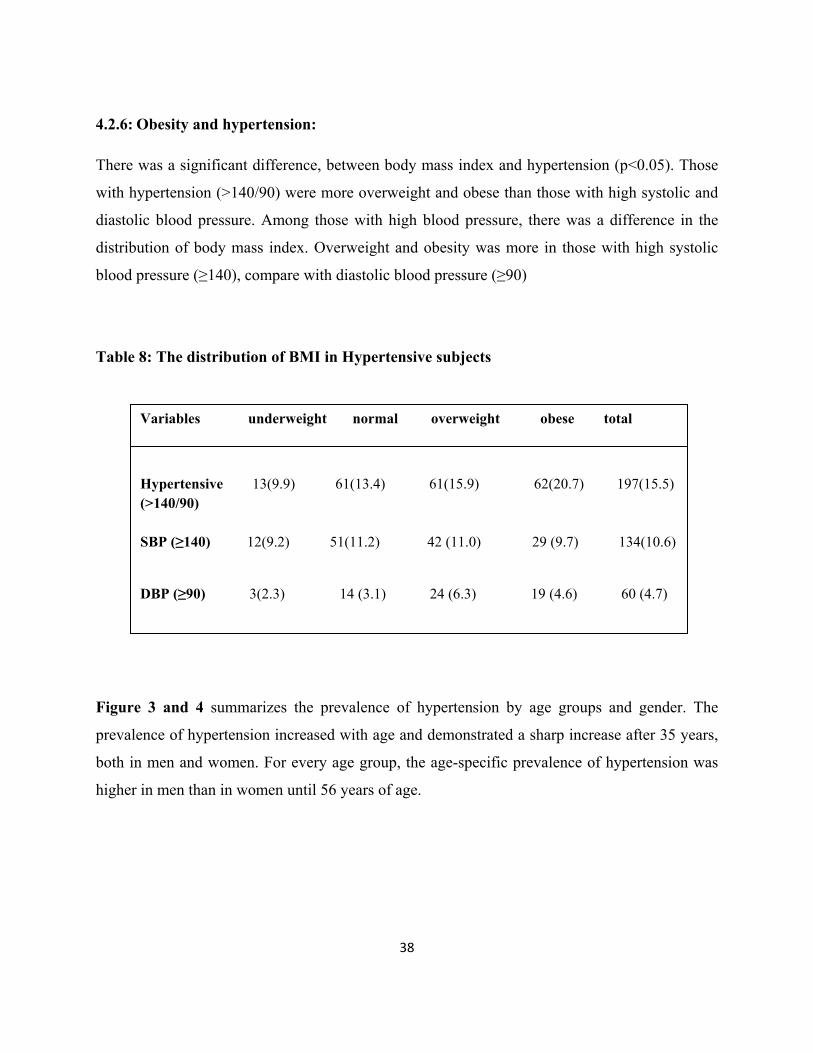
4.2.6: Obesity and hypertension:
There was a significant difference, between body mass index and hypertension (p<0.05). Those
with hypertension (>140/90) were more overweight and obese than those with high systolic and
diastolic blood pressure. Among those with high blood pressure, there was a difference in the
distribution of body mass index. Overweight and obesity was more in those with high systolic
blood pressure (≥140), compare with diastolic blood pressure (≥90)
Table 8: The distribution of BMI in Hypertensive subjects
Variables underweight normal overweight obese total
Hypertensive 13(9.9) 61(13.4) 61(15.9) 62(20.7) 197(15.5) (>140/90)
SBP (≥140) 12(9.2) 51(11.2) 42 (11.0) 29 (9.7) 134(10.6)
DBP (≥90) 3(2.3) 14 (3.1) 24 (6.3) 19 (4.6) 60 (4.7)
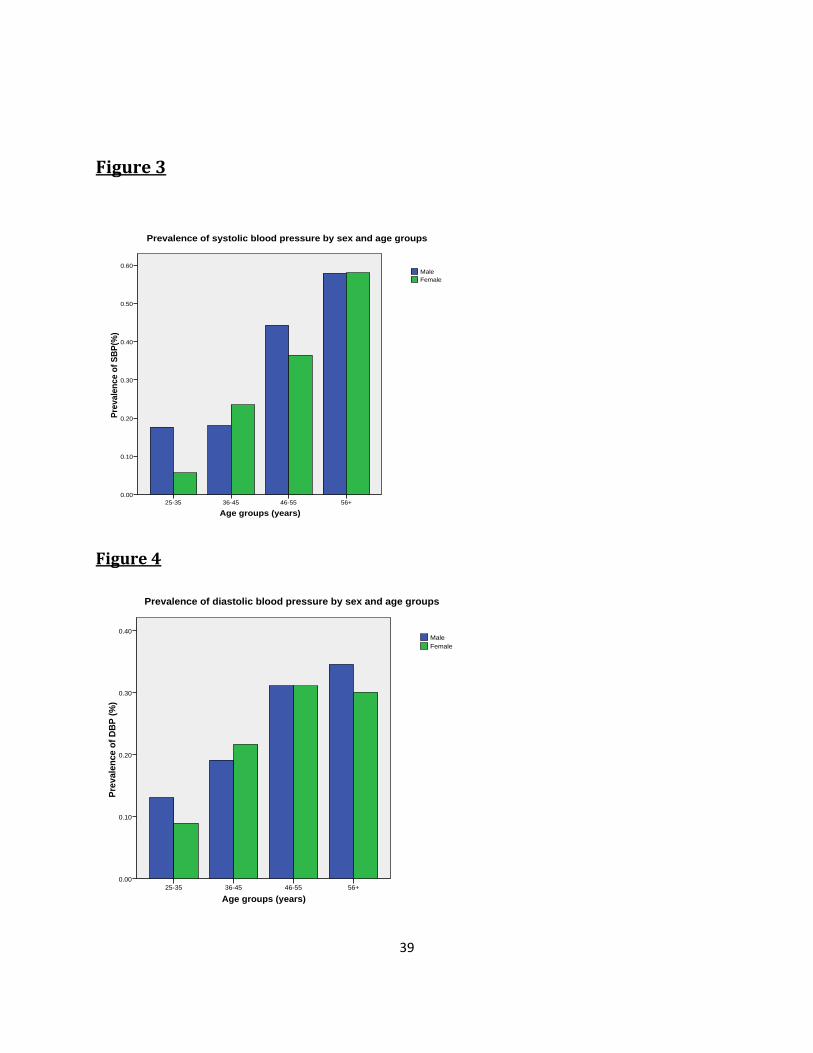
Figure 3 and 4 summarizes the prevalence of hypertension by age groups and gender. The
prevalence of hypertension increased with age and demonstrated a sharp increase after 35 years,
both in men and women. For every age group, the age-specific prevalence of hypertension was
higher in men than in women until 56 years of age.
39
Figure 3
Age groups (years)
56+46-5536-4525-35
Prev
alen
ce o
f SBP
(%)
0.60
0.50
0.40
0.30
0.20
0.10
0.00
FemaleMale
Prevalence of systolic blood pressure by sex and age groups
Figure 4
Age groups (years)56+46-5536-4525-35
Prev
alen
ce o
f DB
P (%
)
0.40
0.30
0.20
0.10
0.00
FemaleMale
Prevalence of diastolic blood pressure by sex and age groups
40
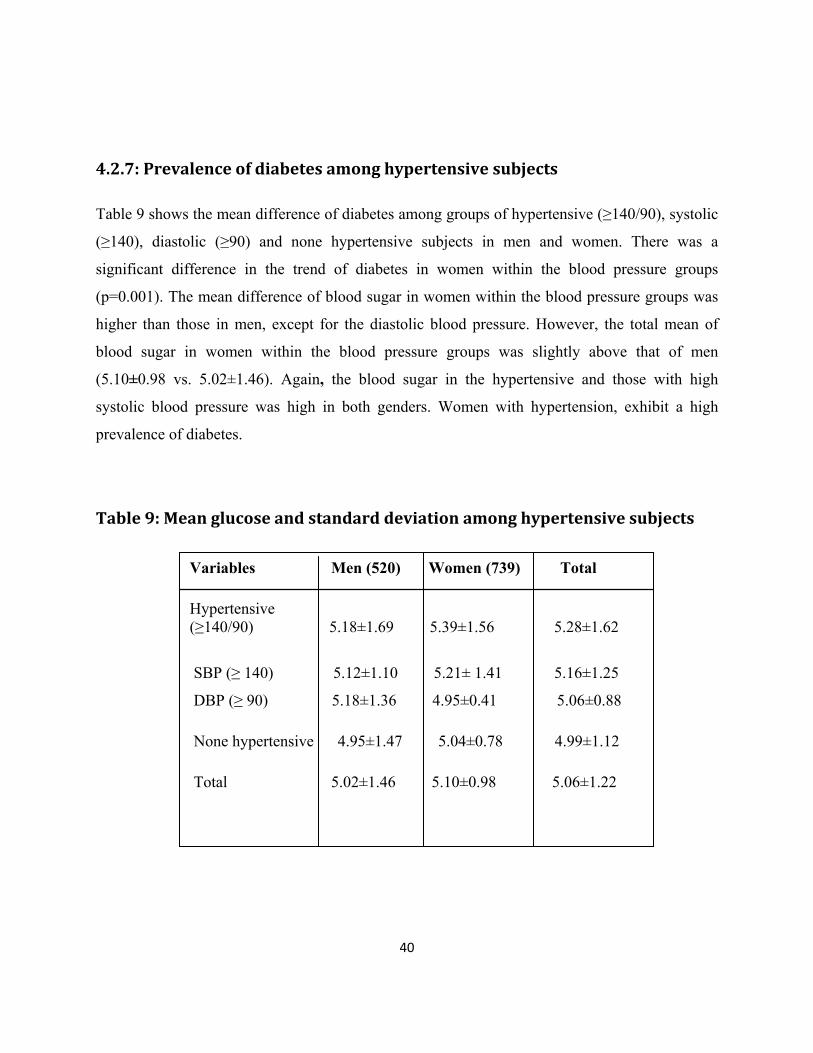
4.2.7: Prevalence of diabetes among hypertensive subjects
Table 9 shows the mean difference of diabetes among groups of hypertensive (≥140/90), systolic
(≥140), diastolic (≥90) and none hypertensive subjects in men and women. There was a
significant difference in the trend of diabetes in women within the blood pressure groups
(p=0.001). The mean difference of blood sugar in women within the blood pressure groups was
higher than those in men, except for the diastolic blood pressure. However, the total mean of
blood sugar in women within the blood pressure groups was slightly above that of men
(5.10±0.98 vs. 5.02±1.46). Again, the blood sugar in the hypertensive and those with high
systolic blood pressure was high in both genders. Women with hypertension, exhibit a high
prevalence of diabetes.
Table 9: Mean glucose and standard deviation among hypertensive subjects
20 cases missing
Variables Men (520) Women (739) Total
Hypertensive (≥140/90) 5.18±1.69 5.39±1.56 5.28±1.62
SBP (≥ 140) 5.12±1.10 5.21± 1.41 5.16±1.25
DBP (≥ 90) 5.18±1.36 4.95±0.41 5.06±0.88
None hypertensive 4.95±1.47 5.04±0.78 4.99±1.12
Total 5.02±1.46 5.10±0.98 5.06±1.22
41
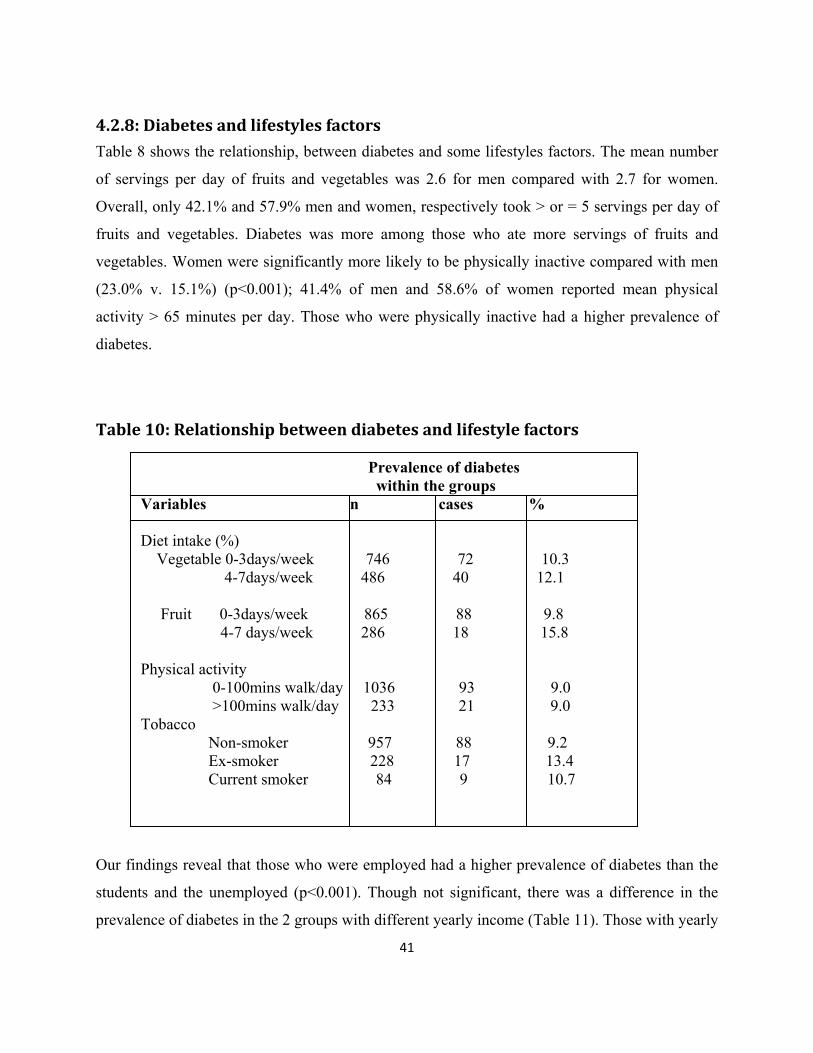
4.2.8: Diabetes and lifestyles factors
Table 8 shows the relationship, between diabetes and some lifestyles factors. The mean number
of servings per day of fruits and vegetables was 2.6 for men compared with 2.7 for women.
Overall, only 42.1% and 57.9% men and women, respectively took > or = 5 servings per day of
fruits and vegetables. Diabetes was more among those who ate more servings of fruits and
vegetables. Women were significantly more likely to be physically inactive compared with men
(23.0% v. 15.1%) (p<0.001); 41.4% of men and 58.6% of women reported mean physical
activity > 65 minutes per day. Those who were physically inactive had a higher prevalence of
diabetes.
Table 10: Relationship between diabetes and lifestyle factors
Prevalence of diabetes within the groups Variables n cases % Diet intake (%) Vegetable 0-3days/week 746 72 10.3 4-7days/week 486 40 12.1
Fruit 0-3days/week 865 88 9.8 4-7 days/week 286 18 15.8 Physical activity 0-100mins walk/day 1036 93 9.0 >100mins walk/day 233 21 9.0 Tobacco Non-smoker 957 88 9.2 Ex-smoker 228 17 13.4 Current smoker 84 9 10.7
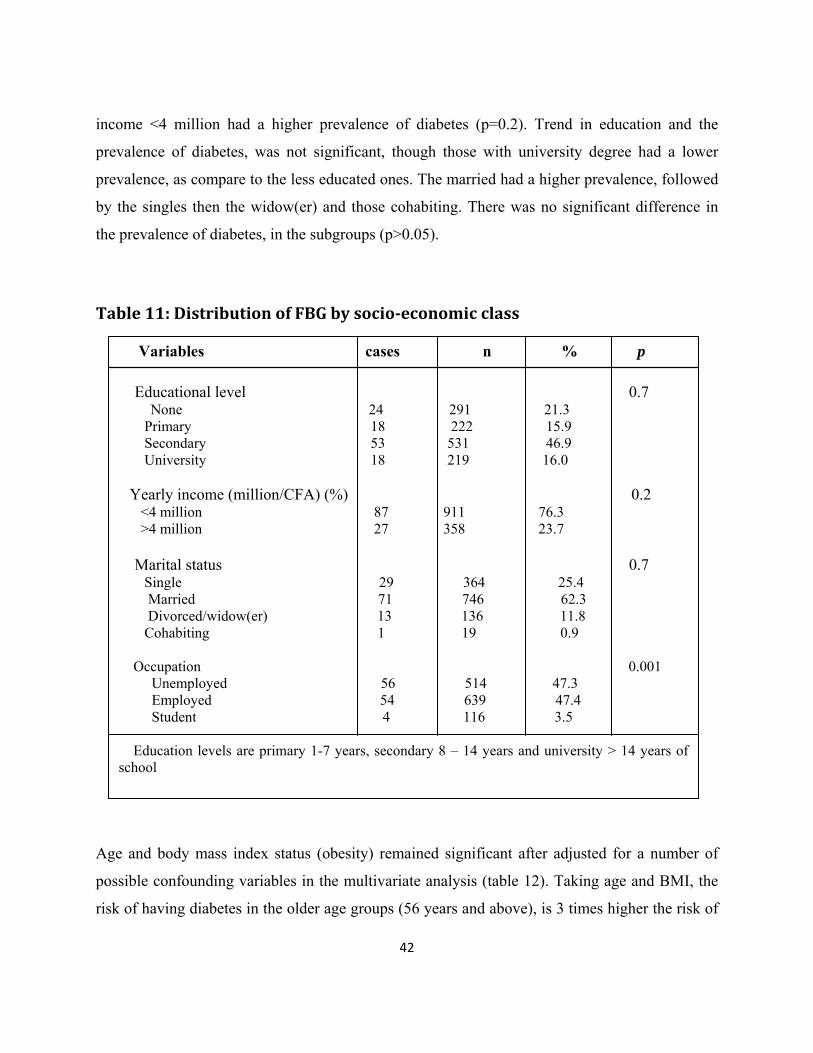
Our findings reveal that those who were employed had a higher prevalence of diabetes than the
students and the unemployed (p<0.001). Though not significant, there was a difference in the
prevalence of diabetes in the 2 groups with different yearly income (Table 11). Those with yearly
42
income <4 million had a higher prevalence of diabetes (p=0.2). Trend in education and the
prevalence of diabetes, was not significant, though those with university degree had a lower
prevalence, as compare to the less educated ones. The married had a higher prevalence, followed
by the singles then the widow(er) and those cohabiting. There was no significant difference in
the prevalence of diabetes, in the subgroups (p>0.05).
Table 11: Distribution of FBG by socioeconomic class
Variables cases n % p
Educational level 0.7 None 24 291 21.3
Primary 18 222 15.9 Secondary 53 531 46.9
University 18 219 16.0
Yearly income (million/CFA) (%) 0.2 <4 million 87 911 76.3
>4 million 27 358 23.7
Marital status 0.7 Single 29 364 25.4
Married 71 746 62.3 Divorced/widow(er) 13 136 11.8
Cohabiting 1 19 0.9
Occupation 0.001 Unemployed 56 514 47.3
Employed 54 639 47.4 Student 4 116 3.5
Education levels are primary 1-7 years, secondary 8 – 14 years and university > 14 years of
school
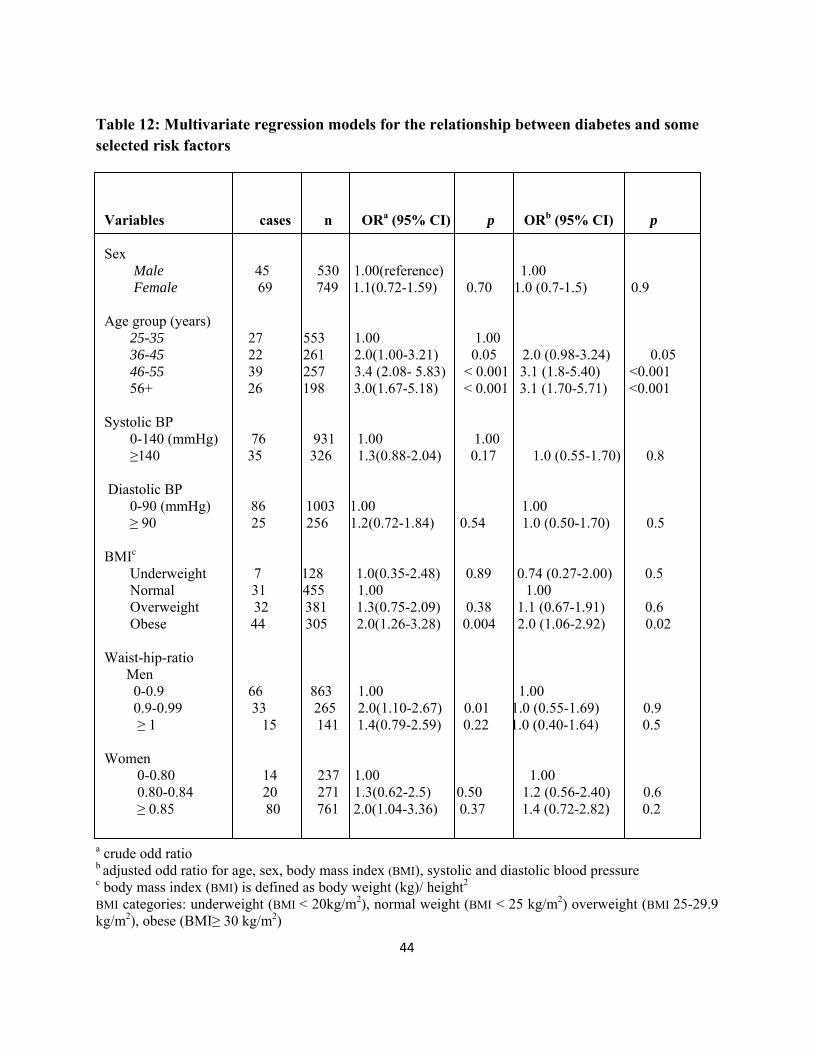
Age and body mass index status (obesity) remained significant after adjusted for a number of
possible confounding variables in the multivariate analysis (table 12). Taking age and BMI, the
risk of having diabetes in the older age groups (56 years and above), is 3 times higher the risk of

43
having diabetes at the younger age groups (25-35 years) (Table 12). The same thing goes with
BMI. Those who are obese, have 1.8 times risk of having diabetes than those who are overweight
and normal in weight. Women have a higher risk of having diabetes than the men, and those
women with a higher waist-hip-ratio, has an additional risk to those with lower waist-hip-ratio.
44
Table 12: Multivariate regression models for the relationship between diabetes and some selected risk factors
Variables cases n ORa (95% CI) p ORb (95% CI) p Sex Male 45 530 1.00(reference) 1.00 Female 69 749 1.1(0.72-1.59) 0.70 1.0 (0.7-1.5) 0.9 Age group (years) 25-35 27 553 1.00 1.00 36-45 22 261 2.0(1.00-3.21) 0.05 2.0 (0.98-3.24) 0.05 46-55 39 257 3.4 (2.08- 5.83) < 0.001 3.1 (1.8-5.40) <0.001 56+ 26 198 3.0(1.67-5.18) < 0.001 3.1 (1.70-5.71) <0.001 Systolic BP 0-140 (mmHg) 76 931 1.00 1.00 ≥140 35 326 1.3(0.88-2.04) 0.17 1.0 (0.55-1.70) 0.8 Diastolic BP 0-90 (mmHg) 86 1003 1.00 1.00 ≥ 90 25 256 1.2(0.72-1.84) 0.54 1.0 (0.50-1.70) 0.5 BMIc Underweight 7 128 1.0(0.35-2.48) 0.89 0.74 (0.27-2.00) 0.5 Normal 31 455 1.00 1.00 Overweight 32 381 1.3(0.75-2.09) 0.38 1.1 (0.67-1.91) 0.6 Obese 44 305 2.0(1.26-3.28) 0.004 2.0 (1.06-2.92) 0.02 Waist-hip-ratio Men 0-0.9 66 863 1.00 1.00 0.9-0.99 33 265 2.0(1.10-2.67) 0.01 1.0 (0.55-1.69) 0.9 ≥ 1 15 141 1.4(0.79-2.59) 0.22 1.0 (0.40-1.64) 0.5 Women 0-0.80 14 237 1.00 1.00 0.80-0.84 20 271 1.3(0.62-2.5) 0.50 1.2 (0.56-2.40) 0.6 ≥ 0.85 80 761 2.0(1.04-3.36) 0.37 1.4 (0.72-2.82) 0.2
a crude odd ratio b adjusted odd ratio for age, sex, body mass index (BMI), systolic and diastolic blood pressure c body mass index (BMI) is defined as body weight (kg)/ height2
BMI categories: underweight (BMI < 20kg/m2), normal weight (BMI < 25 kg/m2) overweight (BMI 25-29.9 kg/m2), obese (BMI≥ 30 kg/m2)
45
5. Discussion
5.1 Discussion of main findings
Some proven and hypothesized risk factors were examined to evaluate their associations with
type 2 diabetes in Cameroon. Our study reveals that diabetes is uncommon in Cameroon. The
age- standardized prevalence rate of type 2 diabetes in the study was 9.0%. This is more than
some prevalent rates reported in some studies in sub-Saharan Africa (52). However, it is
noteworthy that other cities in Cameroon have a lower rate than in Biyem- Assi, Yaoundé. In the
current study, women had a significant higher prevalence of diabetes in all age groups (p<0.05).
Generally, worsening glycaemic status was associated with increasing age, body mass index,
systolic blood pressure and diastolic blood pressure. The prevalence of impaired fasting Glucose
in our subjects (6.8%) was similar to that reported in Accra, Ghana (53).
Documented facts, has well been established that excess body fat is a risk factor for numerous
chronic conditions such as diabetes, hypertension, hyperlipidaemia and cardiovascular diseases
(54). Body mass index [BMI, weight (kg)/height (m2)], a measure of relative weight, is a good
overall indicator of nutritional status and predictor of overall health.
Studies of anthropometric measures among adult populations of sub-Saharan Africa countries are
limited and weight, WC, WHR and BMI are the most common indicators which have been used
to assess overweight and obesity prevalence. As has been suggested (55), increases in the
prevalence of obesity within a population often precede a rise in the incidence of chronic
diseases, most notably diabetes and hypertension.
Body fat was the most important lifestyle indicator for being overweight and obese in both men
and women. The WHO definition of abdominal obesity and overweight was used, as there is not
yet a specific definition for Africa population. However, this study highlights the high
prevalence of overweight and obesity in Cameroon, whether measured by Body Mass Index,
Waist Circumference or Waist-Hip-Ratio. The prevalence of overweight and obesity estimated
from this study was particularly high in women, and increased markedly between the ages of 25-
35, 36-45 and >56years in women; and in men between 36-45 and 46-55years (p<0.05). Obesity
was more than 5 times higher in females aged 25-35 than the males.
46
However, the prevalence of obesity, estimated from this study is consistent with already
published results. Sobngwi et al in 2002 reported a prevalence of BMI obesity of 5.4% in men
and 17.1% in women among Cameroonian adult, which is lower than found in this study.
Nevertheless, lower prevalence’s have been reported in urban settings in Africa (56), and a much
higher prevalence 42% in women and a prevalence of 9.2% in men in Tanzania(57)
Obesity as estimated by BMI (measures of total body fat) and central obesity, as estimated by
WC and WHR was lower among men in younger age group (5.0-10.0) and high among women
(23.7-40.8). BMI defined obesity increased to 10.5 in 36-45 years old men and remain fairly
constant in the older age groups, while central obesity measures by WHR continue to increase to
a maximum of 27.1 in >56 years group. BMI defined obesity increased to a peak of 49.7 in the
46-55 years group in women and increased steadily across all age groups to a maximum of
75.3% in women greater than 56 years of age.
The findings of this study accords with what has been known about obesity and diabetes,
mentioning obesity as being so far the strongest modifiable risk factor for type 2 diabetes(58).
Independent of gender, in this study, subjects with BMI ≥25kg/m2 and WHR of ≥0.85 were at a
significant higher risk of having type 2 diabetes (p<0.05). Epidemiological studies, have
demonstrated this effect on diabetes. Overweight and obesity emerged as a strong independent
risk factor for diabetes, irrespective of the measure used.
The WHO definition uses a higher cutpoint for waist circumference for men and women, this is
probably not suitable in our population, where the mean waist circumference in women is greater
than that of men. This may explain the higher prevalence of abdominal obesity in women than
the men. Therefore results from this study indicate that weight gain is an important risk factor for
hyperglycemia. Therefore control of body weight is the most effective way to reduce the risk of
type 2 diabetes. The public usually do not recognize the connection between overweight or
obesity and diabetes(59). Thus education should be use as a strategy to create awareness.
In Cameroon, hypertension has been showed to be about 1.5-3 fold more prevalent in those with
diabetes compared to the general population, either in hospital or community- based. Our
findings however, have showed an association between diabetes and hypertension. Subjects with
47
high blood pressure, has a higher risk of having higher blood sugar level than the normal
population. The association in this study is probably associated with obesity. Study in Trinidad
(60) found that newly diagnosed type 2 diabetic patients have an increased risk of cardiovascular
diseases.
In the present study, the effects of non modifiable risk factors like age and sex on diabetes were
analyzed. Age was a significant risk factor for diabetes, even after adjusting for confounding
factors. The older age groups (46-55 and 56+) had twice and thrice the risk of having diabetes,
than the younger and the normal population (adjusted OR=3.1, p<0.001). Therefore our finding
shows that with an increase of ten years in age, you have a higher risk than a younger person.
Though sex was not significant, our findings found women having a higher risk of diabetes than
the men. This may be because women were obese than the men (p<0.001), and had a higher risk
of having diabetes than the men. Our findings reveal a correlation between the anthropometric
measurements, but not with WHR. WHR was negatively correlated with HC. There was a
correlation between body mass index and sex in this study (r=0.21, p<0.001). Numbers of studies
have repeatedly shown an association, between trends with age and gender difference with
diabetes (61). I very well know that we cannot stop the process of aging in our population, as
well as interchanging gender. Since these risk factors cannot be changed, screening of the
population especially at a much younger age and those at a higher risk of having diabetes will be
a good measure in the prevention and control of diabetes. (Emphasis should be more on those
with higher risk of diabetes).
Modifiable risk factors, like lifestyle factors affect the incidence of type 2 diabetes. Our findings
did not identify physical inactivity as the risk factor to type 2 diabetes, but shows that those who
were physically inactive had a higher prevalence and a higher risk of having diabetes than those
who were physically active (adjusted OR= 1.1, 95% CI (0.65-1.80). This was the same with
yearly income. Those with a higher yearly income had a higher prevalence of diabetes. We also
found that, they are at a higher risk (adjusted OR=1.3, 95% CI (0.84-2.10) compare to those who
had lesser income. However, both cross-sectional and longitudinal studies, have found physical
activity and socio-economic status as independent predictors for obesity and type 2 diabetes (62-
64). Undoubtedly frequent and excessive exercise should be recommended, as a preventive as
48
well as treatment for type 2 diabetes and other chronic non- communicable diseases. Smoking
and dietary factors were other risk factors analyzed in the current study. Prevalence of diabetes
was 15.8 vs. 9.8 in those who ate fruits 4-7 days/week and 0-3 days/week, respectively. For those
who ate vegetables, the prevalence of diabetes was (12.1 vs. 10.3), in the same order as those
who ate fruits, indicating that diabetes was more in those who ate more servings of fruits and
vegetables. Since a lot of palm oil is used in Cameroon cuisine, there is a probability that they
used a lot of palm oil in cooking their vegetables, which in effect will increase their weight,
therefore making them prone to diabetes. In the other hand, eating more fruits, means consuming
more sugar. This may in other sense, explain why those who ate more servings of fruits had
diabetes, as compare to those who ate lesser servings of fruits. Ex-smokers as compare to current
smokers had a higher prevalence of type 2 diabetes (13.4 vs. 10.7), but without an association
with diabetes.
However, looking at type 2 diabetes, our current study observed that obesity and weight gain
dramatically increase the risk, and physical inactivity further elevates the risk, independently of
obesity. Though our study did not unveil the association of physical activity and smoking to be
associated with diabetes, it has been clear from large number of epidemiological studies that
Cigarette smoking is associated with a small increase and moderate alcohol consumption with a
decrease in the risk of diabetes. Furthermore low-fiber diet with a high glycemic index has been
associated with an increased risk of diabetes and specific dietary fatty acids may differently
affect insulin resistance and the risk of diabetes(65-67). The probability of having type 2
diabetes in this study is strongly dependent on age.
Our findings may be compared with population based studies in rural and urban Africa. A study
in southern Sierra Leone found a 2.4% prevalence of diabetes (68), which was lower than what
we found in the current study. This study had a smaller sample size. Teuschera et al found no
cases of diabetes in a survey in West Africa (69), while Fisch et al found 0.9% in Mali (70).
None of these studies used official diagnostic criteria (WHO or ADA) for diagnosis. Again they
used reflectance meters in the field which always give inaccurate results, except proper quality
assurance system is introduced.
49
5.2 Intervention suggestions
Non-communicable diseases have modifiable risk factors, which are easy to measure and can
help in planning effective interventions. However, there is now substantial evidence that type 2
diabetes can be prevented or delayed. Individuals at high risk of developing diabetes can be
identified easily. It is not yet known whether successful interventions will cost-effectively reduce
the morbidity and mortality associated with diabetes. However, diabetes prevention policies that
focus on lifestyle modification, specifically modest weight loss and increased physical activity,
are very likely to have additional health benefits. Therefore, public health messages, health care
professionals, and health care systems should all encourage behavior changes to achieve a
healthy lifestyle. Further research is necessary to understand better on how to facilitate effective
and efficient programs for the primary prevention of type 2 diabetes. Nonetheless, it is possible
to recommend some prevention policies.
5.3 Methodological discussion
5.3.1 The strength of the study
In general, the main strength of the study started with the quality assurance during recruitment of
the quality field data collection staffs, piloting of the tools and quality assurance measures taken.
Accuracy of the anthropometric measurements by the quality staffs is likely to have increased
reliable data and results. Repeatability of the anthropometric measurements was emphasized
during training, therefore, three measurements were taken and the mean value of the three was
used for analysis. Refresher trainings were provided twice in the field to assure that the standards
were up to date. Crosschecking and validating forms and data entry was as well a quality
measure, which could have an influence on the reliability of the results.
50
The rigorous cold chain maintained during the movement of the Microcuvet Haemocues, which
is actually wet chemistry for obtaining fasting blood glucose, was a major quality measure for
authentic data.
The fact that the study was population base, the result of the current study may lay the
foundation to develop policies necessary to cope with the challenges of diabetes mellitus.
The large sample size (1279), though not up to the calculated sample size, however met the
requirement of the analysis. We detected a high prevalence of diabetes than presumed.
Most confounding factors were controlled for like sex, age, body mass index etc using
multivariate analysis (logistic regression) and partial correlation coefficient.
Not many study of this kind, has been done in Africa, so the result will be use as a reference
data, especially in Cameroon and sub- Saharan Africa in general.
In addition, I am well known in this population, so some local volunteer in this population help,
by making sure that the participants did not eat prior to testing for fasting blood glucose, thus
increasing the reliability of the data and result.
5.2 Limitation of the study
The cross sectional nature of this study, was a major limitation. The cross sectional nature limits
the causal interference between exposure and disease outcome.
Selection bias: bias in a sense is a systematic deviation from the truth, which has potential impact
on the quality of the data. Only one health district was selected in the study area.
Recall bias was again a limitation. We had none responses, because participants could not
remember the time they spend on physical activity and servings of fruits and vegetables eaten in
a day.
Interview challenges: observer bias may exist in our study. Self reported questionnaires, may
have some disadvantages, like the variability due to differences in the approach used by the

51
interviewer and in the interpretation of any reply. In our study, interviewers were train on how to
use field guidelines for presentation of materials in a similar manner.
Our results may reflect some problem of statistical power, because of small number of
participant in a category.
52
6. Conclusion
The study provides current data on diabetes mellitus, anthropometric measurements and obesity
in urban Cameroonian populations. We found high occurrence of diabetes mellitus and impaired
fasting glycaemia, high occurrence of obesity and that high proportion of women have diabetes
mellitus and obesity particularly over 35 years of age. Prevalence of obesity varied according to
the measures used. Our findings therefore highlight the need to adopt policies to reduce the
burden of diabetes mellitus and obesity through health care services; special focus should be
projected to women and special care should be taken for those who are in transition of lifestyle.
53
Reference List
(1) Mbanya JC. The Quarterly update from the World Diabetes Foundation. 2006. International Diabetes Foundation. Ref Type: Generic
(2) Mbanya JC, Minkoulou EM, Salah JN, Balkau B. The prevalence of hypertension in rural and urban Cameroon. Int J Epidemiol 1998 Apr;27(2):181-5.
(3) Mennen LI MJCJBBSSCSCJK. The habitual diet in rural and urban Cameroon. 54, 150-154. 2000. Eur J Clin Nutr. Ref Type: Generic
(4) Ministe`re de laSante´ Publique. Cameroun, Enqueˆte Nationale sur la Carence en Vitamine A et l'Ane´mie. Cameroon. 2001. Ref Type: Generic
(5) Mbanya JC. The Quarterly update from the World Diabetes Foundation. 2006. International Diabetes Foundation. Ref Type: Generic
(6) Choukem SP, Kengne AP, Dehayem YM, Simo NL, Mbanya JC. Hypertension in people with diabetes in sub-Saharan Africa: Revealing the hidden face of the iceberg. Diabetes Res Clin Pract 2007 Aug;77(2):293-9.
(7) Murray CJ, Lopez AD. Alternative projections of mortality and disability by cause 1990-2020: Global Burden of Disease Study. Lancet 1997 May 24;349(9064):1498-504.
(8) Mbanya JC, Cruickshank JK, Forrester T, Balkau B, Ngogang JY, Riste L, et al. Standardized comparison of glucose intolerance in west African-origin populations of rural and urban Cameroon, Jamaica, and Caribbean migrants to Britain. Diabetes Care 1999 Mar;22(3):434-40.
(9) Beaglehole R, Yach D. Globalisation and the prevention and control of non-communicable disease: the neglected chronic diseases of adults. Lancet 2003 Sep 13;362(9387):903-8.
54
(10) WHO, World Health Report. Reducing Risks, Promoting Healthy Life. 2002. Geneva: WHO. Ref Type: Generic
(11) Murray CJaAL. The Global Burden of Disease . 1996. Washington, DC: World Bank. Ref Type: Generic
(12) Reddy KS, Yusuf S. Emerging epidemic of cardiovascular disease in developing countries. Circulation 1998 Feb 17;97(6):596-601.
(13) WHO. The World Health Report 1999. Making a Difference. 1999. Geneva: WHO. Ref Type: Generic
(14) WHO, World Health Organization Department of Noncommunicable Disease Surveillance Geneva. Definition, Diagnosis and Classification of Diabetes Mellitus and its Complications. Part 1: Diagnosis and Classification of Diabetes Mellitus. 2008. Ref Type: Generic
(15) King H, Aubert RE, Herman WH. Global burden of diabetes, 1995-2025: prevalence, numerical estimates, and projections. Diabetes Care 1998 Sep;21(9):1414-31.
(16) King H, Aubert RE, Herman WH. Global burden of diabetes, 1995-2025: prevalence, numerical estimates, and projections. Diabetes Care 1998 Sep;21(9):1414-31.
(17) King H, Aubert RE, Herman WH. Global burden of diabetes, 1995-2025: prevalence, numerical estimates, and projections. Diabetes Care 1998 Sep;21(9):1414-31.
(18) Rob M.Van Dam. The epidemiology of lifestyle and risk for type 2 diabetes. 1115-1125. 2003. Ref Type: Generic
(19) Mbanya JC. The Quarterly update from the World Diabetes Foundation. 2006. International Diabetes Foundation. Ref Type: Generic
(20) Sobngwi E, Mbanya JC, Unwin NC, Kengne AP, Fezeu L, Minkoulou EM, et al. Physical activity and its relationship with obesity, hypertension and diabetes in urban and rural Cameroon. Int J Obes Relat Metab Disord 2002 Jul;26(7):1009-16.
(21) Sobngwi E, Mbanya JC, Unwin NC, Porcher R, Kengne AP, Fezeu L, et al. Exposure over the life course to an urban environment and its relation with obesity, diabetes, and hypertension in rural and urban Cameroon. Int J Epidemiol 2004 Aug;33(4):769-76.
55
(22) International Insulin Foundation. Fact Sheet on diabetes in sub-Saharan Africa. www.access2insulin.org. 2007. Ref Type: Generic
(23) E.SOBNGWI (1) FM-J1PV1JCM2JFG1. DIABETES IN AFRICANS. 27, 628-634. Ref Type: Generic
(24) Jean-Claude Mbanya. Diabetes Cost: Sub-Saharan Africa Perspective. International Textbook of Diabetes Mellitus. 2, 1873-1878. 2007. Ref Type: Generic
(25) Muna WF. Cardiovascular disorders in Africa. World Health Stat Q 1993;46(2):125-33.
(26) Sobngwi E, Mbanya JC, Unwin NC, Kengne AP, Fezeu L, Minkoulou EM, et al. Physical activity and its relationship with obesity, hypertension and diabetes in urban and rural Cameroon. Int J Obes Relat Metab Disord 2002 Jul;26(7):1009-16.
(27) Sobngwi E, Mbanya JC, Unwin NC, Porcher R, Kengne AP, Fezeu L, et al. Exposure over the life course to an urban environment and its relation with obesity, diabetes, and hypertension in rural and urban Cameroon. Int J Epidemiol 2004 Aug;33(4):769-76.
(28) Mbanya JC. The Quarterly update from the World Diabetes Foundation. 1-6-2006. International Diabetes Federation. Ref Type: Generic
(29) gogo-Jack S. Primary prevention of type-2 diabetes in developing countries. J Natl Med Assoc 2006 Mar;98(3):415-9.
(30) Mbanya JC, Ngogang J, Salah JN, Minkoulou E, Balkau B. Prevalence of NIDDM and impaired glucose tolerance in a rural and an urban population in Cameroon. Diabetologia 1997 Jul;40(7):824-9.
(31) Dowse GK, Humphrey AR, Collins VR, Plehwe W, Gareeboo H, Fareed D, et al. Prevalence and risk factors for diabetic retinopathy in the multiethnic population of Mauritius. Am J Epidemiol 1998 Mar 1;147(5):448-57.
(32) H.King and P.Zimmet.1988. Trends in the Prevalence and Incidence of Diabetes: Non-Insulin-Dependent Diabetes Mellitus. 41:3-1, 190-196. 1988. World Health Statistics Quarterly. Ref Type: Generic
(33) Wing RR, Venditti E, Jakicic JM, Polley BA, Lang W. Lifestyle intervention in overweight individuals with a family history of diabetes. Diabetes Care 1998 Mar;21(3):350-9.
56
(34) Wing RR, Venditti E, Jakicic JM, Polley BA, Lang W. Lifestyle intervention in overweight individuals with a family history of diabetes. Diabetes Care 1998 Mar;21(3):350-9.
(35) Wing RR, Venditti E, Jakicic JM, Polley BA, Lang W. Lifestyle intervention in overweight individuals with a family history of diabetes. Diabetes Care 1998 Mar;21(3):350-9.
(36) Wing RR, Venditti E, Jakicic JM, Polley BA, Lang W. Lifestyle intervention in overweight individuals with a family history of diabetes. Diabetes Care 1998 Mar;21(3):350-9.
(37) Wing RR, Venditti E, Jakicic JM, Polley BA, Lang W. Lifestyle intervention in overweight individuals with a family history of diabetes. Diabetes Care 1998 Mar;21(3):350-9.
(38) Cannon CP. Cardiovascular disease and modifiable cardiometabolic risk factors. Clin Cornerstone 2007;8(3):11-28.
(39) Hoerger TJ, Ahmann AJ. The impact of diabetes and associated cardiometabolic risk factors on members: strategies for optimizing outcomes. J Manag Care Pharm 2008 Feb;14(1 Suppl C):S2-14.
(40) Elmer C.C.Lee M, Sharon Walmsley M, I.George Fantus M. New-onset diabetes mellitus associated with protease inhibitor therapy in an HIV-positive patient: case report and review. 161, 161-164. 1999. CMAJ. Ref Type: Generic
(41) aidsmap(news). Information on hiv and aids. 2008. http://www.aidsmap.com/en/default.asp. Ref Type: Generic
(42) Pett SLM*, Milliken SFF. Current review of the metabolic and endocrine disturbances in human immunodeficiency virus infection. Multihormonal systems disorders. 7[2], 96-101. 2000. Current Opinion in Endocrinology & Diabetes. Ref Type: Generic
(43) Mbanya JC. The Quarterly update from the World Diabetes Foundation. 1-6-2006. International Diabetes Federation. Ref Type: Generic
(44) WHO/NMH/CCS/03.03 version. STEPwise approach to surveillance of non-communicable diseases (STEPS). 2003. Ref Type: Generic
57
(45) Aspray TJ, Mugusi F, Rashid S, Whiting D, Edwards R, Alberti KG, et al. Rural and urban differences in diabetes prevalence in Tanzania: the role of obesity, physical inactivity and urban living. Trans R Soc Trop Med Hyg 2000 Nov;94(6):637-44.
(46) Dowse GK, Humphrey AR, Collins VR, Plehwe W, Gareeboo H, Fareed D, et al. Prevalence and risk factors for diabetic retinopathy in the multiethnic population of Mauritius. Am J Epidemiol 1998 Mar 1;147(5):448-57.
(47) Dowse G.K.and Zimmet P. A model protocol for a diabetes and other non-communicable disease field survey. World health statistics quarterly 1, editor. 45, No 4, 360-369. 1992. Ref Type: Generic
(48) Aspray TJ, Mugusi F, Rashid S, Whiting D, Edwards R, Alberti KG, et al. Rural and urban differences in diabetes prevalence in Tanzania: the role of obesity, physical inactivity and urban living. Trans R Soc Trop Med Hyg 2000 Nov;94(6):637-44.
(49) WHO. Preventing and Managing the Global Epidemic. Geneva: WHO 1WeG, 2006., editors. Report of WHO Consultation on Obesity. Ref Type: Generic
(50) Mbanya JC, Minkoulou EM, Salah JN, Balkau B. The prevalence of hypertension in rural and urban Cameroon. Int J Epidemiol 1998 Apr;27(2):181-5.
(51) Alberti KG, Zimmet PZ. Definition, diagnosis and classification of diabetes mellitus and its complications. Part 1: diagnosis and classification of diabetes mellitus provisional report of a WHO consultation. Diabet Med 1998 Jul;15(7):539-53.
(52) Ebenezer A.Nyenwe OJO, AEIAOaSB. Type 2 diabetes in adult Nigerians: a study of its prevalence and risk factors in Port Harcourt, Nigeria. 62[3], 177-185. 3003. Diabetes Research and Clinical Practice. Ref Type: Generic
(53) Albert G.B.Amoah, Samuel K.Owusu, Samuel Adjei. Diabetes in Ghana: a community based prevalence study in greater Accra. 56, 197-205. 2002. Ref Type: Generic
(54) Han TS, Williams K, Sattar N, Hunt KJ, Lean ME, Haffner SM. Analysis of obesity and hyperinsulinemia in the development of metabolic syndrome: San Antonio Heart Study. Obes Res 2002 Sep;10(9):923-31.
(55) Poulter NKKHBMMPWSPea. Determinants of blood pressure changes due to urbanization: a longitudinal study. 3, 5375-5377. 2008. J Hypertens 1985. Ref Type: Generic
58
(56) Pasquet P, Temgoua LS, Melaman-Sego F, Froment A, Rikong-Adie H. Prevalence of overweight and obesity for urban adults in Cameroon. Ann Hum Biol 2003 Sep;30(5):551-62.
(57) Aspray TJ, Mugusi F, Rashid S, Whiting D, Edwards R, Alberti KG, et al. Rural and urban differences in diabetes prevalence in Tanzania: the role of obesity, physical inactivity and urban living. Trans R Soc Trop Med Hyg 2000 Nov;94(6):637-44.
(58) Rimm EB, Manson JE, Stampfer MJ, Colditz GA, Willett WC, Rosner B, et al. Cigarette smoking and the risk of diabetes in women. Am J Public Health 1993 Feb;83(2):211-4.
(59) Manning A. Americans ignore risk of weight and diabetes. 2001. Ref Type: Generic
(60) Ezenwaka CE, Davis G. Increased risk of cardiovascular disease in newly diagnosed type 2 diabetic patients in a primary health care center in Trinidad. Diabetes Res Clin Pract 2000 Oct;50(2):137-45.
(61) Juutilainen A, Kortelainen S, Lehto S, Ronnemaa T, Pyorala K, Laakso M. Gender difference in the impact of type 2 diabetes on coronary heart disease risk. Diabetes Care 2004 Dec;27(12):2898-904.
(62) Fezeu L, Minkoulou E, Balkau B, Kengne AP, Awah P, Unwin N, et al. Association between socioeconomic status and adiposity in urban Cameroon. Int J Epidemiol 2006 Feb;35(1):105-11.
(63) Sobngwi E, Mbanya JC, Unwin NC, Kengne AP, Fezeu L, Minkoulou EM, et al. Physical activity and its relationship with obesity, hypertension and diabetes in urban and rural Cameroon. Int J Obes Relat Metab Disord 2002 Jul;26(7):1009-16.
(64) K.G.M.M.Alberti PZaJS. International Diabetes Federation: a consensus on Type 2 diabetes prevention. 24[5], 451-463. 2007. Diabetic Medicine. Ref Type: Generic
(65) Carole Willi M, Patrick Bodenmann MM, William A.Ghali MM, Peter D.Faris P, Jacques Cornuz MM. Active Smoking and the Risk of Type 2 Diabetes. A Systematic Review and Meta-analysis . 298[22], 2654-2664. 2008. JAMA. Ref Type: Generic
(66) Mbanya JC, Ngogang J, Salah JN, Minkoulou E, Balkau B. Prevalence of NIDDM and impaired glucose tolerance in a rural and an urban population in Cameroon. Diabetologia 1997 Jul;40(7):824-9.
59
(67) MG Priebe JvBRdVRV. Whole grain foods for the prevention of type 2 diabetes mellitus. CD006061.pub2[2]. 2008. Cochrane Database of Systematic Reviews. Ref Type: Generic
(68) M.M.Ceesay MWMMOKVRW&DRL. Prevalence of diabetes in rural and urban populations in southern Sierra Leone: a preliminary survey. 2[3], 272-277. 1997. Tropical Medicine & International Health. Ref Type: Generic
(69) T.Teuschera 1JBRPBaAT. ABSENCE OF DIABETES IN A RURAL WEST AFRICAN POPULATION WITH A HIGH CARBOHYDRATE/CASSAVA DIET. 329[8536], 765-768. 1987. Ref Type: Generic
(70) A.Fisch EPTPHLYSaGB. Prevalence and risk factors for diabetes mellitus in the rural region of Mali (West Africa): a practical approach. 30, 859-862. 1987. Diabetologia. Ref Type: Generic

60
APPENDICES
61
1: Study on type 2 Diabetes and its association with lifestyles factors
1Consent form
Good day Sir/Madame/Ms.,
We are working for the Cameroon Burden of Diabetes (CAMBoD) Project. This project is carried out in
collaboration with the Ministry of Public Health. The purpose of the project is to set up a programme to monitor,
prevent and control diabetes in Cameroon. To do this, we have to collect information from people and also
conduct some examinations, which will help us to plan and realise the project. With your permission therefore, we
will like to ask you some questions and also to conduct some examinations to know what your health status is like
with regards to diabetes. We will begin by asking you the questions today and then, tomorrow morning we will
come back and conduct the examinations. The reason is that some of these examinations give correct results only
if conducted when you have not eaten. These examinations will include your weight, height, BP, and your blood
sample. If these examinations suggest that you have or you are about to have diabetes, we will inform you and will
refer you to the hospital for treatment and follow up. You are free to choose either to participate or not to
participate. Choosing to participate will be advantageous to you for three reasons:
1. You will know whether or not you have diabetes,
2. You will know whether or not you are about to have diabetes, and
3. Knowing your health (diabetic) status will help you take appropriate decisions regarding your health.
You can trust that any information you will give us, including the results of your examinations, will all be treated
very confidentially. For that reason, it is important that the information you give be as correct and truthful as
possible. Do you freely choose to participate in the project?
YES Continue
NO End
Signature or thump print: _______
1 According to law No. 91/023 of December 1991, information from surveys and census data is strictly confidential and can, therefore, not be used in any way recriminating.
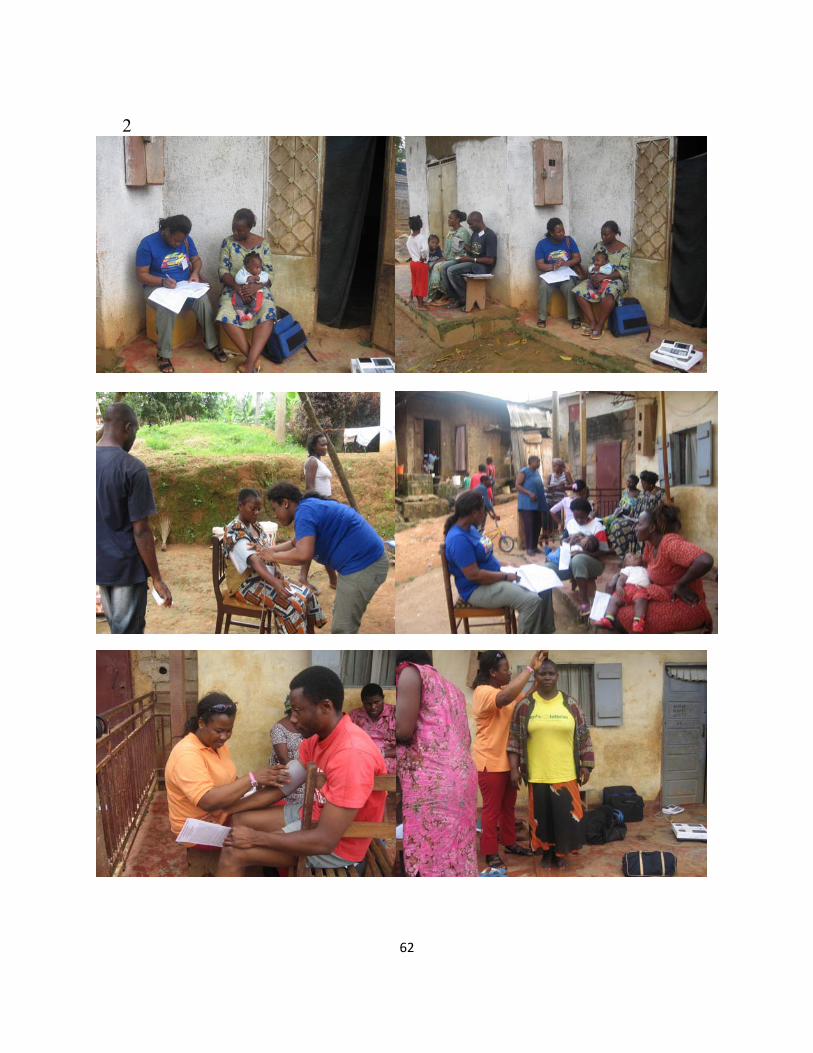
62
2
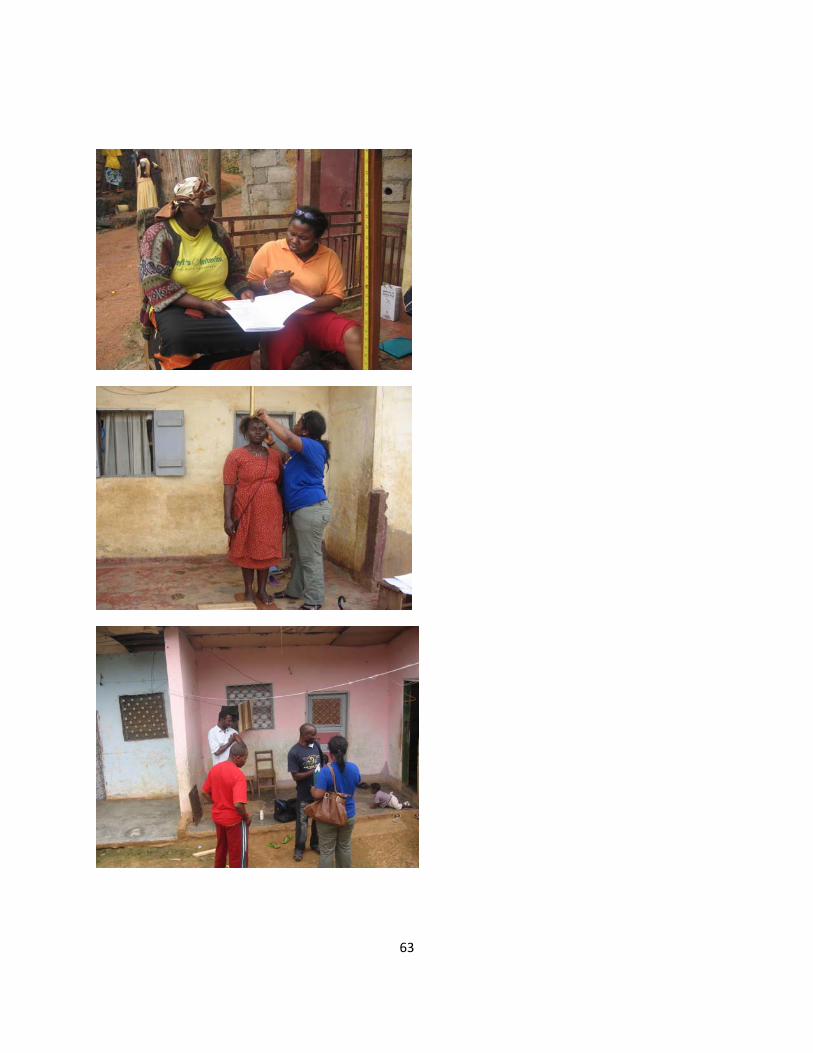
63