type i insulin-like growth factor receptor tyrosine …
TRANSCRIPT
The Texas Medical Center Library The Texas Medical Center Library
DigitalCommons@TMC DigitalCommons@TMC
The University of Texas MD Anderson Cancer Center UTHealth Graduate School of Biomedical Sciences Dissertations and Theses (Open Access)
The University of Texas MD Anderson Cancer Center UTHealth Graduate School of
Biomedical Sciences
5-2010
TYPE I INSULIN-LIKE GROWTH FACTOR RECEPTOR TYROSINE TYPE I INSULIN-LIKE GROWTH FACTOR RECEPTOR TYROSINE
KINASE AS A MOLECULAR TARGET IN MANTLE CELL KINASE AS A MOLECULAR TARGET IN MANTLE CELL
LYMPHOMA LYMPHOMA
Deeksha Vishwamitra
Follow this and additional works at: https://digitalcommons.library.tmc.edu/utgsbs_dissertations
Part of the Medical Pathology Commons
Recommended Citation Recommended Citation Vishwamitra, Deeksha, "TYPE I INSULIN-LIKE GROWTH FACTOR RECEPTOR TYROSINE KINASE AS A MOLECULAR TARGET IN MANTLE CELL LYMPHOMA" (2010). The University of Texas MD Anderson Cancer Center UTHealth Graduate School of Biomedical Sciences Dissertations and Theses (Open Access). 21. https://digitalcommons.library.tmc.edu/utgsbs_dissertations/21
This Thesis (MS) is brought to you for free and open access by the The University of Texas MD Anderson Cancer Center UTHealth Graduate School of Biomedical Sciences at DigitalCommons@TMC. It has been accepted for inclusion in The University of Texas MD Anderson Cancer Center UTHealth Graduate School of Biomedical Sciences Dissertations and Theses (Open Access) by an authorized administrator of DigitalCommons@TMC. For more information, please contact [email protected].

TYPE I INSULIN-LIKE GROWTH FACTOR RECEPTOR TYROSINE KINASE AS A
MOLECULAR TARGET IN MANTLE CELL LYMPHOMA
A
THESIS
Presented to the Faculty of The University of Texas
Health Science Center at Houston and
The University of Texas M. D. Anderson Cancer Center
Graduate School of Biomedical Sciences
in Partial Fulfillment
of the Requirements
for the Degree of
MASTER OF SCIENCE
by
Deeksha Vishwamitra, B.S. Houston, Texas
May 2010

iii
Dedications
To my amazing parents, thank you for always
exemplifying the true embodiment of unconditional
greatness
I love you forever and always

iv
Acknowledgements
Firstly, I would like to sincerely thank my supervisor and mentor, Dr. Hesham Amin, who took the
time to guide, teach, and lead me through the first years of my career. Thank you for your
encouragement, patience, and belief in my abilities as a scientist. I have learned many things
working in your lab and have gained the confidence to endure the scientific world through your
lessons.
Next, I would like to thank the members of the lab: Ping Shi, Yong Li, and Bin Shi, who are
all talented postdoctoral fellows. Thank you for answering my numerous questions about science
every day. I have learned how to be an independent scientific thinker by watching you.
I would like to truly thank the members of my supervisory committee: Dr. Russell Broaddus,
Dr. Joya Chandra, Dr. Joseph Ludwig, and Dr. Patrick Zweidler-McKay. You have been with me
since the beginning and I owe my progress to your advice and encouragement.
I could not accomplish my scientific dreams without the Graduate School of Biomedical
Sciences. Thank you for giving me the opportunity to work in an atmosphere where I can learn
everyday by being around the best mentors and thank you for making my graduate school
experience wonderful.
Lastly, I would like to thank my family for all their love, support, and understanding through
all my endeavors. I could not have done this without you.
v
Type I Insulin-Like Growth Factor Receptor Tyrosine Kinase as a Molecular Target in Mantle Cell Lymphoma
Deeksha Vishwamitra, B.S.
Supervisory Advisor: Hesham M. Amin, M.D.
Mantle cell lymphoma (MCL) is an aggressive B-cell lymphoid malignancy representing 5-
10% of all non-Hodgkin’s lymphomas. It is distinguished by the t(11;14)(q13;q32) chromosomal
translocation that juxtaposes the proto-oncogene CCND1, which encodes cyclin D1 at 11q13 to the
IgH gene at 14q32. MCL patients represent about 6% of all new cases of Non-Hodgkin’s
lymphomas per year or about 3,500 new cases per year. MCL occurs more frequently in older
adults – the average age at diagnosis is the mid-60s with a male-to-female ratio of 2-3:1. It is
typically characterized by the proliferation of neoplastic B-lymphocytes in the mantle zone of the
lymph node follicle that have a prominent inclination to disseminate to other lymphoid tissues, bone
marrow, peripheral blood and other organs. MCL patients have a poor prognosis because they
develop resistance/relapse to current non-specific therapeutic regimens. It is of note that the exact
molecular mechanisms underlying the pathogenesis of MCL are not completely known. It is
reasonable to anticipate that better characterization of these mechanisms could lead to the
development of specific and likely more effective therapeutics to treat this aggressive disease. The
type I insulin-like growth factor receptor (IGF-IR) is thought to be a key player in several different
solid malignancies such as those of the prostate, breast, lung, ovary, skin and soft tissue. In
addition, recent studies in our lab showed evidence to support a pathogenic role of IGF-IR in some
types of T-cell lymphomas and chronic myeloid leukemia. Constitutively active IGF-IR induces its
oncogenic effects through the inhibition of apoptosis and induction of transformation, metastasis,
and angiogenesis. Previous studies have shown that signaling through IGF-IR leads to the
vi
activation of multiple signaling transduction pathways mediated by the receptor-associated tyrosine
kinase domain. These pathways include PI3K/Akt, MAP kinase, and Jak/Stat. In the present study,
we tested the possible role of IGF-IR in MCL. Our results demonstrate that IGF-IR is over-
expressed in mantle cell lymphoma cell lines compared with normal peripheral blood B-
lymphocytes. Furthermore, inhibition of IGF-IR by the cyclolignan picropodophyllin (PPP)
decreased cell viability and cell proliferation in addition to induction of apoptosis and G2/M cell cycle
arrest. Screening of downstream oncogenes and apoptotic proteins that are involved in both IGF-
IR and MCL signaling after treatment with PPP or IGF-IR siRNA showed significant alterations that
are consistent with the cellular changes observed after PPP treatment. Therefore, our findings
suggest that IGF-IR signaling contributes to the survival of MCL and thus may prove to be a
legitimate therapeutic target in the future.
vii
Table of Contents
Approval Sheet..................................................................................................... i
Title Page ............................................................................................................. ii
Dedications ........................................................................................................ iii
Aknowledgements ............................................................................................. iv
Abstract ............................................................................................................... v
Table of Contents .............................................................................................. vii
List of Illustrations ............................................................................................. ix
Chapter I: Introduction and Background .......................................................... 1
1.1 Mantle Cell Lymphoma…………………………………………………...2
1.2 Overview of the insulin-like growth factor system………….……….…..8
1.3 IGF-I……………………………………………...…………………….........9
1.4 IGF-IR………………………………...……………………………............11
1.5 a. Regulation of IGF-IR gene expression.....……………………11
1.5 b. IGF-IR structure and signaling....………….……………...…...11
1.5 c. Physiological and pathological roles of IGF-IR.....…………...15
1.6 Role of IGF-IR in cell cycle progression and apoptosis…..…....………18
1.7 Current approaches to target IGF-IR………………………......………...21
Rationale ............................................................................................................ 24
viii
Chapter II: Analysis of the expression of IGF-IR and its activation in Mantle Cell
Lymphoma ......................................................................................................... 26
2.1 IGF-IR expression in MCL …………………………………………..……27
2.2 IGF-I expression in MCL……………………………………………..……37
Chapter III: Effects of inhibition of IGF-IR in MCL .......................................... 42
3.1 Inhibition of IGF-IR by PPP in MCL 43
3.2 Effects of inhibition of IGF-IR by PPP in MCL......…..…...…………..…45
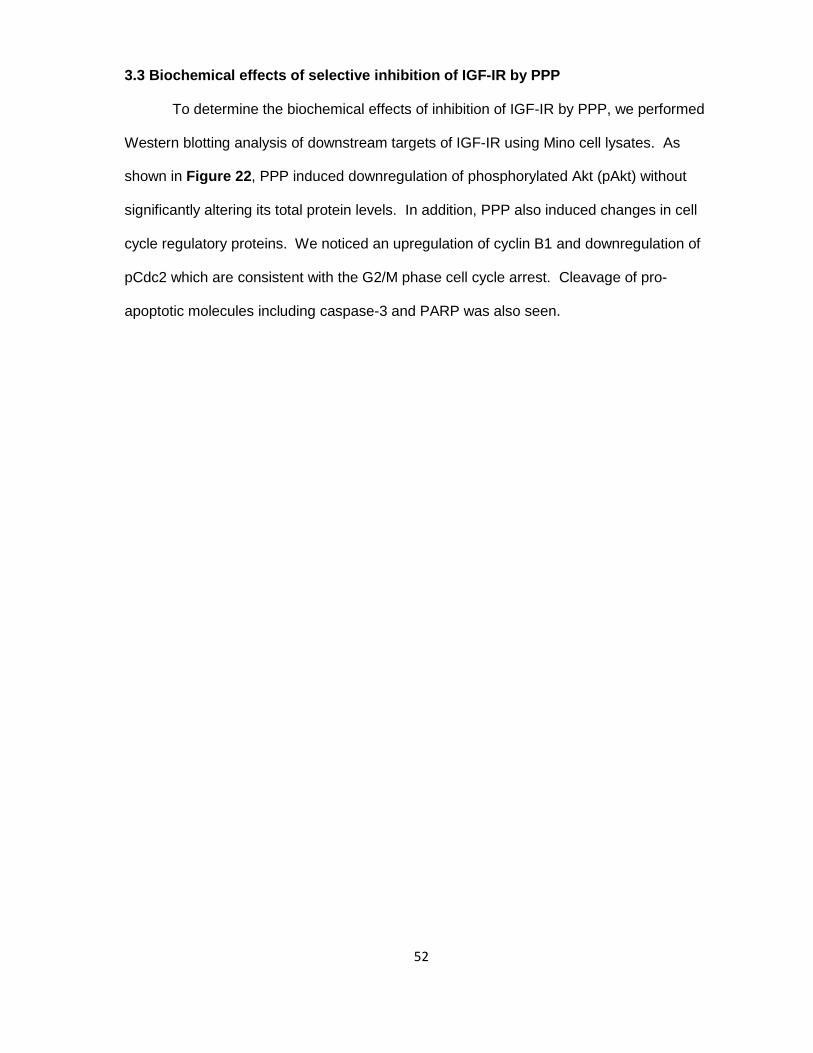
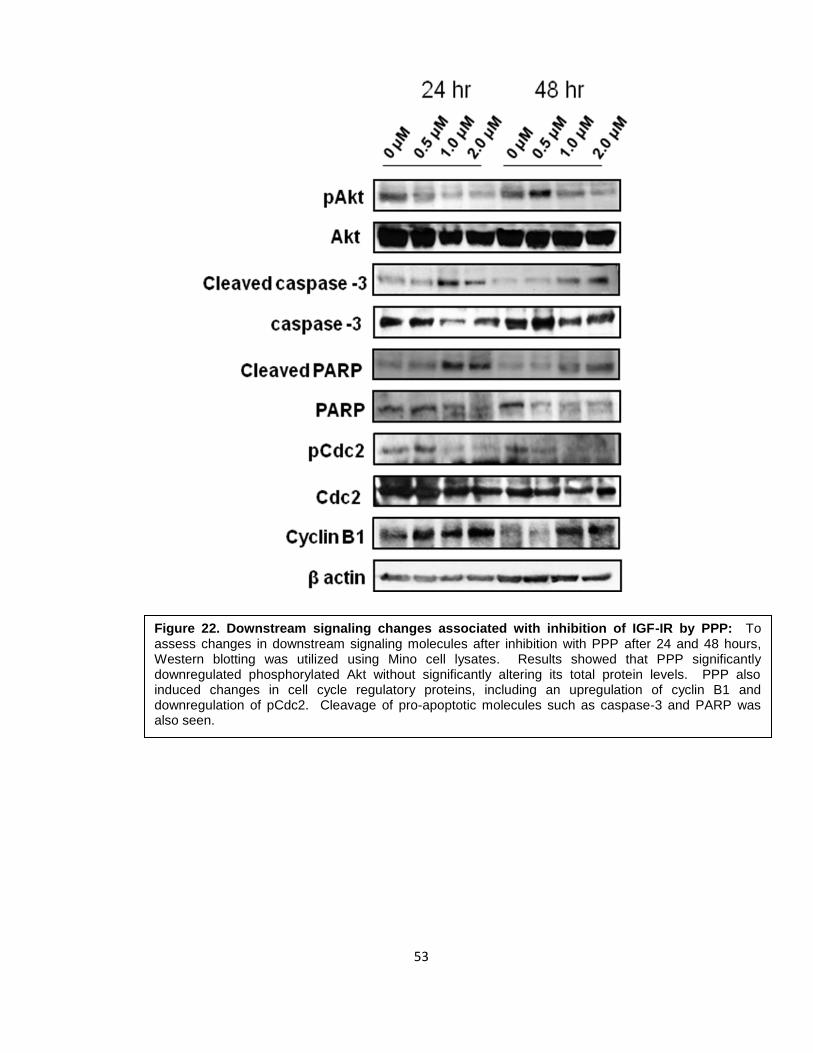
3.3 Biochemical effects of selective inhibition of IGF-IR by PPP….……...52
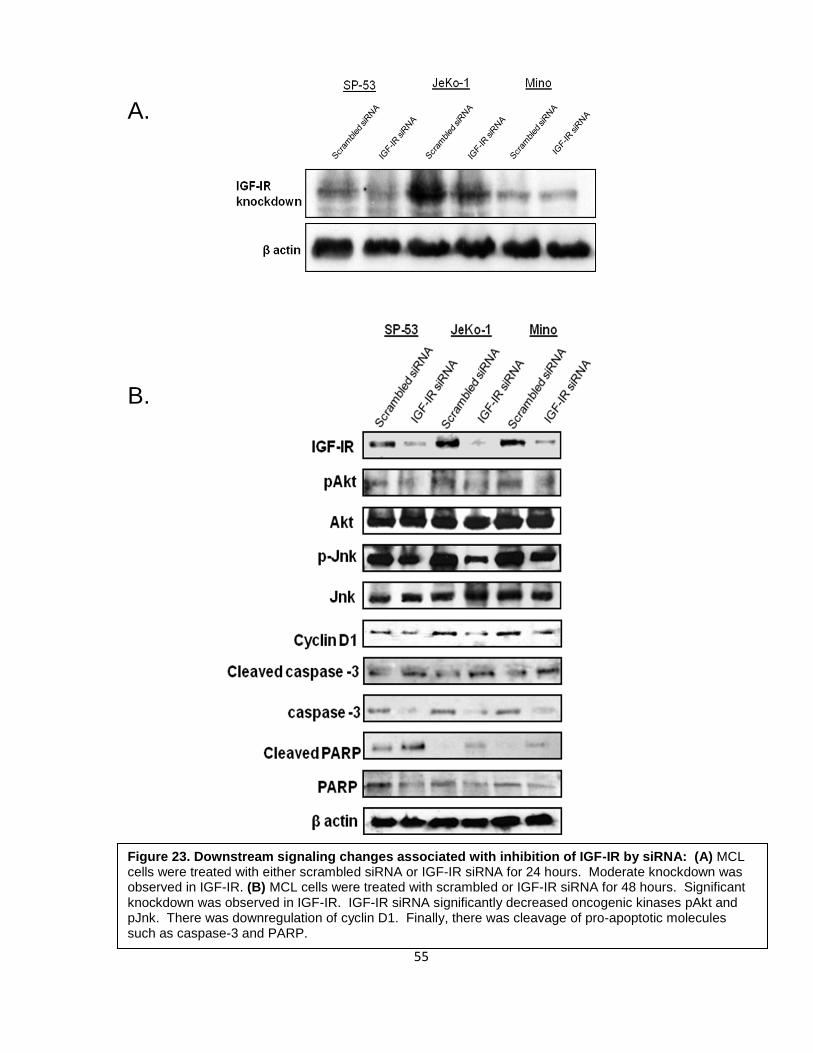
3.4 Biochemical effects of specific inhibition of IGF-IR by siRNA...............54
Chapter IV: Discussion ............................................................................................... 56
Chapter V: Materials and Methods .................................................................. 66
Chapter VI: References .................................................................................... 77
Vita ..................................................................................................................... 93
ix
List of Illustrations
Figure 1: Mantle cell lymphoma translocation ....................................................... 2
Figure 2: Current treatment approaches for MCL ................................................. 7
Figure 3: Overview of IGF system ......................................................................... 8
Figure 4: Structure of IGF-IR .............................................................................. 13
Figure 5: IGF-IR signaling ................................................................................... 14
Figure 6: Current approaches to target IGF-IR ................................................... 23
Figure 7: Expression of IGF-IR mRNA in MCL ................................................... 28
Figure 8: Expression of IGF-IR protein in MCL ................................................... 30
Figure 9: Expression of IGF-IR protein in MCL by immunohistochemistry and
immunofluorescence ........................................................................................... 32
Figure 10: Quantitative analysis of IGF-IR expression ........................................ 34
Figure 11: Expression of pIGF-IR in MCL ........................................................... 36
Figure 12: Expression of IGF-I mRNA in MCL cell lines by RT-PCR .................. 38
Figure 13: Expression of IGF-I mRNA in MCL cell lines
by quantitative real-time PCR ............................................................................. 39
Figure 14: Apoptosis analysis after treatment with IGF-I .................................... 41
x
Figure 15: Downregulation of pIGF-IR in MCL by PPP ....................................... 43
Figure 16: Downregulation of tyrosine kinase activity in MCL by PPP ................ 44
Figure 17: Cell viability after treatment with PPP ................................................ 47
Figure 18: Induction of apoptosis in MCL by PPP ............................................... 48
Figure 19: Analysis of cell cycle after treatment with PPP .................................. 49
Figure 20: Morphological changes after treatment with PPP .............................. 50
Figure 21: MTS assay after treatment with PPP ................................................. 51
Figure 22: Downstream signaling changes associated with inhibition of IGF-IR by
PPP ..................................................................................................................... 53
Figure 23: Downstream signaling changes associated with inhibition of IGF-IR by
siRNA .................................................................................................................. 55

1
Chapter I: Introduction and Background
2
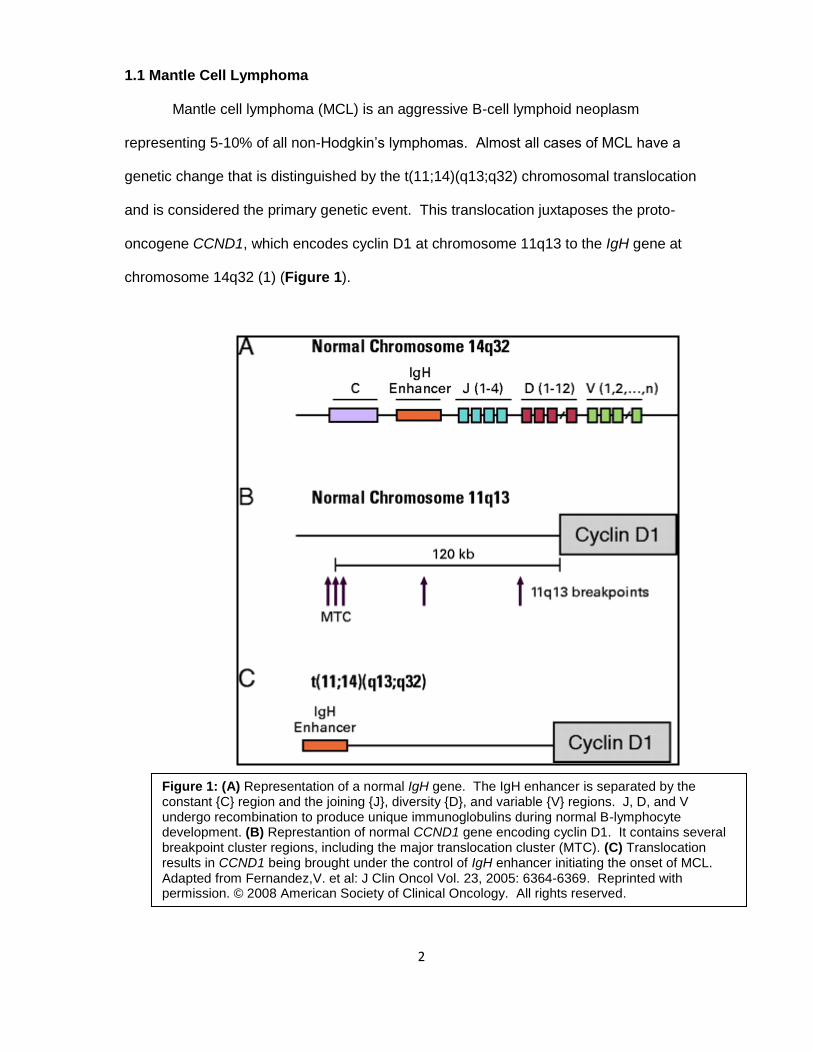
1.1 Mantle Cell Lymphoma
Mantle cell lymphoma (MCL) is an aggressive B-cell lymphoid neoplasm
representing 5-10% of all non-Hodgkin’s lymphomas. Almost all cases of MCL have a
genetic change that is distinguished by the t(11;14)(q13;q32) chromosomal translocation
and is considered the primary genetic event. This translocation juxtaposes the proto-
oncogene CCND1, which encodes cyclin D1 at chromosome 11q13 to the IgH gene at
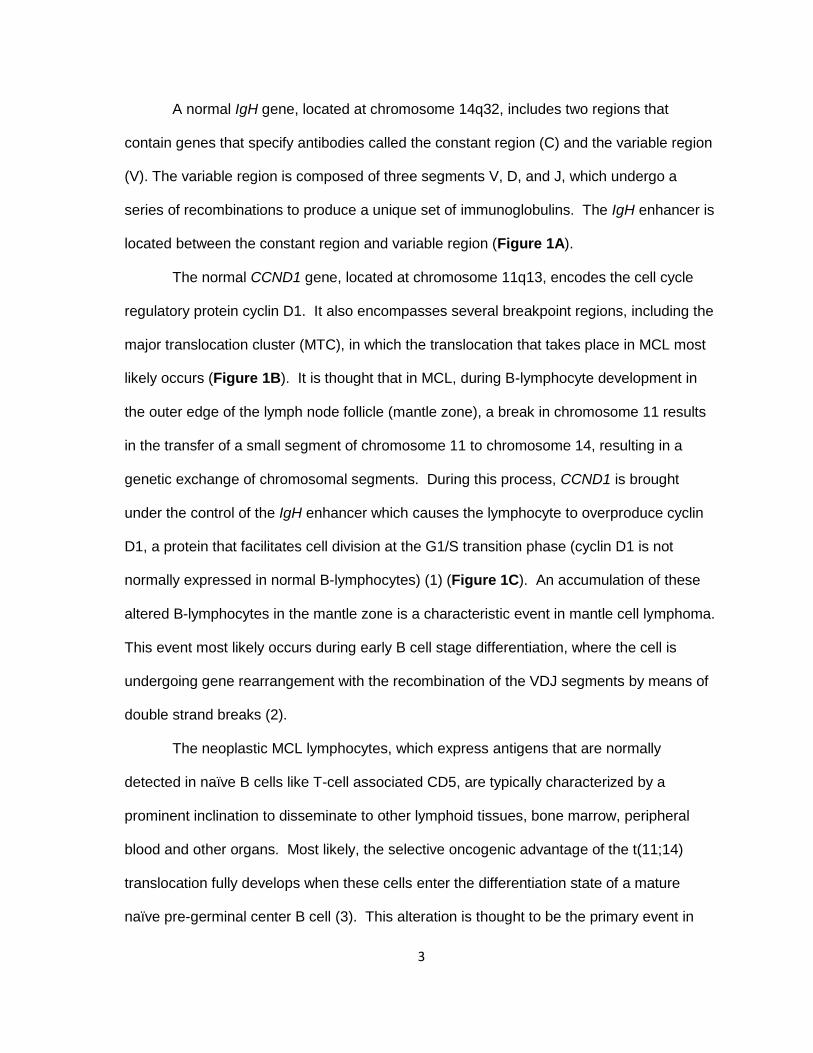
chromosome 14q32 (1) (Figure 1).
Figure 1: (A) Representation of a normal IgH gene. The IgH enhancer is separated by the constant {C} region and the joining {J}, diversity {D}, and variable {V} regions. J, D, and V undergo recombination to produce unique immunoglobulins during normal B-lymphocyte development. (B) Represtantion of normal CCND1 gene encoding cyclin D1. It contains several breakpoint cluster regions, including the major translocation cluster (MTC). (C) Translocation results in CCND1 being brought under the control of IgH enhancer initiating the onset of MCL. Adapted from Fernandez,V. et al: J Clin Oncol Vol. 23, 2005: 6364-6369. Reprinted with permission. © 2008 American Society of Clinical Oncology. All rights reserved.
3
A normal IgH gene, located at chromosome 14q32, includes two regions that
contain genes that specify antibodies called the constant region (C) and the variable region
(V). The variable region is composed of three segments V, D, and J, which undergo a
series of recombinations to produce a unique set of immunoglobulins. The IgH enhancer is
located between the constant region and variable region (Figure 1A).
The normal CCND1 gene, located at chromosome 11q13, encodes the cell cycle
regulatory protein cyclin D1. It also encompasses several breakpoint regions, including the
major translocation cluster (MTC), in which the translocation that takes place in MCL most
likely occurs (Figure 1B). It is thought that in MCL, during B-lymphocyte development in
the outer edge of the lymph node follicle (mantle zone), a break in chromosome 11 results
in the transfer of a small segment of chromosome 11 to chromosome 14, resulting in a
genetic exchange of chromosomal segments. During this process, CCND1 is brought
under the control of the IgH enhancer which causes the lymphocyte to overproduce cyclin
D1, a protein that facilitates cell division at the G1/S transition phase (cyclin D1 is not
normally expressed in normal B-lymphocytes) (1) (Figure 1C). An accumulation of these
altered B-lymphocytes in the mantle zone is a characteristic event in mantle cell lymphoma.
This event most likely occurs during early B cell stage differentiation, where the cell is
undergoing gene rearrangement with the recombination of the VDJ segments by means of
double strand breaks (2).
The neoplastic MCL lymphocytes, which express antigens that are normally
detected in naïve B cells like T-cell associated CD5, are typically characterized by a
prominent inclination to disseminate to other lymphoid tissues, bone marrow, peripheral
blood and other organs. Most likely, the selective oncogenic advantage of the t(11;14)
translocation fully develops when these cells enter the differentiation state of a mature
naïve pre-germinal center B cell (3). This alteration is thought to be the primary event in
4
MCL pathogenesis, perhaps leading to deregulation of the cell cycle at the G1/S phase
transition (1, 3).
The alteration in the G1/S phase transition results in the hyperphosphorylation of the
retinoblastoma 1 (Rb1) protein by cyclinD1/CDK4 and cyclin D1/CDK6 complexes, causing
the E2F transcription factors to be released and allowing for entry into the S phase of the
cell cycle (1, 3).
In addition to Rb1 hyperphosphorylation, cyclin D1 also plays a role in the late G1/S
transition by deregulating the cyclin E/CDK2 complex and the CDK inhibitor p27 (1). MCL
cells degrade p27 by the proteosome pathway, thereby inhibiting the protein from inducing
cell cycle arrest (1, 3). This, in turn, would result in an overactive cyclin E-CDK2 complex to
also assist in p27 degradation.
The overexpression of cyclin D1 is the distinguishing feature of MCL, however, it is
not exclusive since it has been less frequently seen in other hematological malignancies
such as hairy cell leukemia and plasma cell myeloma as well as in breast, small cell lung,
renal carcinomas, and soft tissue sarcoma (1, 4-8).
When the disease progresses into more advanced stages, MCL tumor cells acquire
a high number of secondary chromosomal and molecular alterations in proteins that
normally function in regulating the cell cycle and growth arrest (BMI1, INK4a, ARF/P53,
CDK4/cyclin E and RB1). Additionally, gain of function or loss of function mutations
interfere in normal activity of DNA damage response proteins [ataxia telangiectasia
mutated gene (ATM), checkpoint homolog kinase 2 (CHK2) and p53] as well as cell survival
pathways (1). The CDKN2A locus on chromosome 9p21 encodes for the CDK4 inhibitor
INK4a and the p53 regulator ARF (3). In normal cells, CDK4 and CDK6 are inhibited by
INK4a, causing Rb1 protein to be in its anti-proliferative state. Homozygous deletions for
this locus have been detected in some MCL cases, thereby causing Rb1 to become
hyperphosphorylated. This, in combination with the overexpression of cyclin D1, might
5
further assist the transition of the tumorigenic cells into the next phase of the cell cycle (3).
A deletion at this locus also affects ADP ribosylation factor (ARF) protein, which stabilizes
p53 by preventing degradation by MDM2. ARF instability causes deregulation of p53,
allowing entry into the S phase of the cell cycle.
The most frequent alteration that occurs in DNA damage response pathways is the
deletion in the chromosomal region 11q22-23, which includes ATM (1). ATM mutations
have been detected in 40-75% of MCL cases. Normally, ATM functions to assist cells in
recognizing broken DNA strands that are damaged by harmful agents such as toxic
chemicals, radiation, or the natural exchange of genetic material during cell division (9). The
ATM protein coordinates efficient DNA repair by activating enzymes that fix the broken
strands, thereby maintaining the stability of DNA.
Lastly, mutations in other DNA damage response pathways, such as CHK1 and
CHK2 checkpoint kinases also allow unguarded entry into the next phase of the cell cycle.
MCL also shows amplification of anti-apoptotic protein Bcl-2 and deletions of pro-apoptotic
protein BIM, although this aspect is not well studied (3). A constitutively active PI3K/Akt
pathway also contributes to the pathogenesis of MCL and preferentially occurs in blastoid
variants. The presence of phosphorylated/active Akt in primary MCL cases was associated
with the inactivation of p27 (CDK inhibitor) and phosphorylation of forkhead box O3a
(FOXO3a), MDM2, Bad, mammalian target of rapamycin (mTOR), and p70S6K. Inhibiting
this pathway in MCL cell lines upregulated p27 and reduced the phosphorylation of Akt,
FOXO3a, MDM2, Bad, and mTOR. These observations were found through the loss of
PTEN expression. PTEN normally functions to inhibit the activation of phosphatidylinositol
(3,4,5)-trisphosphate (PIP3), an activator of the PI3K/Akt pathway (10).
Although a definite model for the pathogenesis of MCL has not been elucidated, a
proposed model shows the progression from the occurrence of the initial translocation in
6
the early stages, then the accumulation of several secondary alterations in the later stages,
which ultimately lead into the final advanced phase of the disease (3).
Almost all cases of MCL carry the t(11;14) translocation, except for a small subset of
MCL tumors that are negative for cyclin D1. In these tumors, it was found that there was an
overexpression of cyclin D2 or cyclin D3 in addition to another chromosomal translocation
t(2;12)(p11;p13), which juxtaposes cyclin D2 and the kappa immunoglobulin light chain (3) .
However, these mechanisms are not well understood.
Clinically, MCL patients represent about 3,500 new cases per year (11, 12). MCL
occurs more frequently in older adults , the average age at diagnosis is the mid-60s and is
more prevalent in males. MCL patients have a poor prognosis because they develop
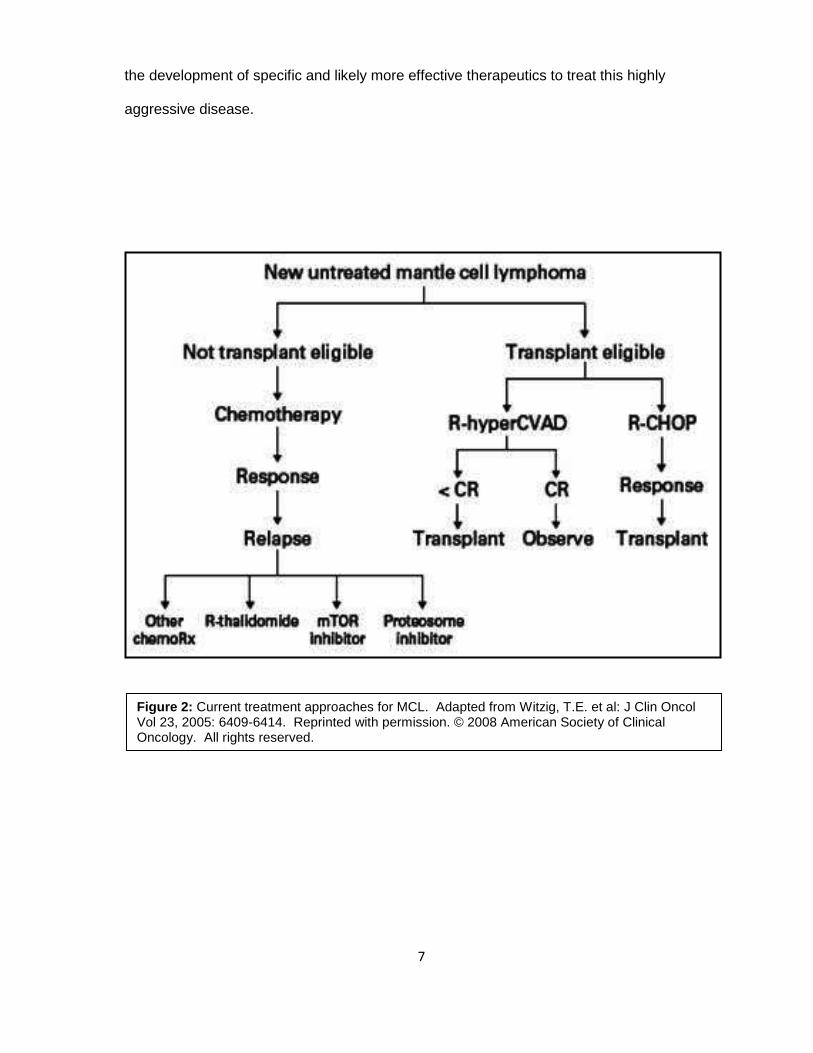
resistance/relapse to current non-specific therapeutic regimens. Current treatments include
chemotherapy combinations plus rituximab (R), a monoclonal antibody that specifically
targets the CD20 antigen which is present on the surface of B-lymphocytes (11-13). These
combinations include R-CHOP [Cyclophosphamide (also called Cytoxan/Neosar),
Doxorubicin (Adriamycin), Vincristine (Oncovin) and Prednisolone] and more aggressive
treatments such as R-HyperCVAD (Cyclophosphamide, Vincristine, Doxorubicin,
Dexamethasone), and R-FCM (Fludarabine, Cyclophosphamide, Mitoxantrone) (11-13).
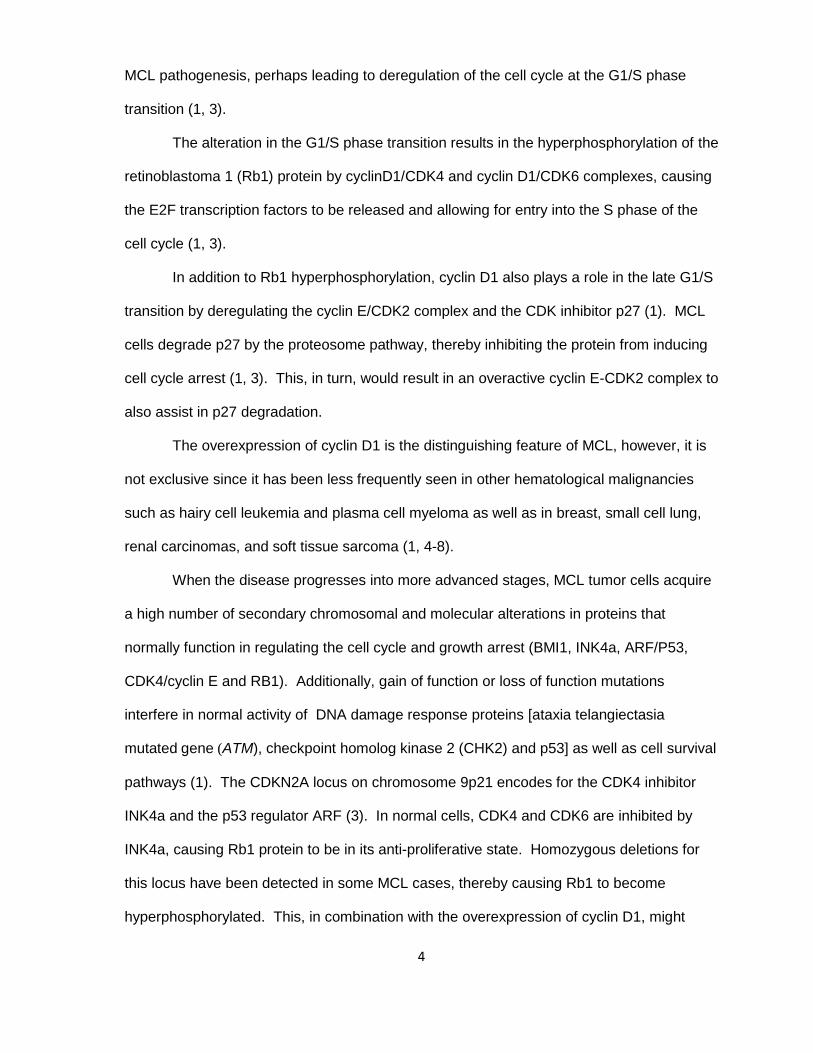
Other approaches include radioimmunotherapy combinations with rituximab, proteosome
inhibitors such as Velcade, and stem cell transplantations (Figure 2).
In spite of all the recent efforts made to better understand the molecular
mechanisms underlying MCL, deciphering the exact pathogenesis of this disease still
proves to be extremely challenging, and therefore is still not completely known. Current
treatment approaches are non-curative and the corresponding survival curves are
characterized by a delayed, but continuous decline and a median survival of 4 to 6 years. It
is reasonable to anticipate that better characterization of these mechanisms could lead to
7
the development of specific and likely more effective therapeutics to treat this highly
aggressive disease.
Figure 2: Current treatment approaches for MCL. Adapted from Witzig, T.E. et al: J Clin Oncol Vol 23, 2005: 6409-6414. Reprinted with permission. © 2008 American Society of Clinical Oncology. All rights reserved.
8
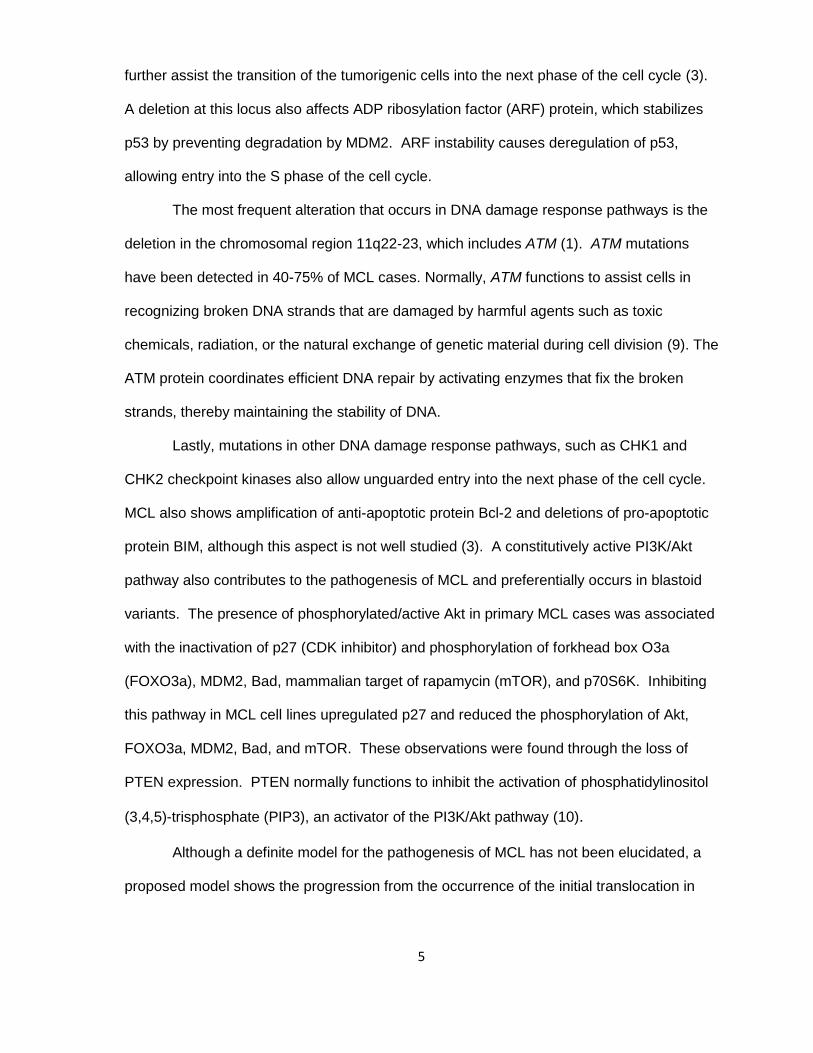
1.3 Overview of the insulin-like growth factor system
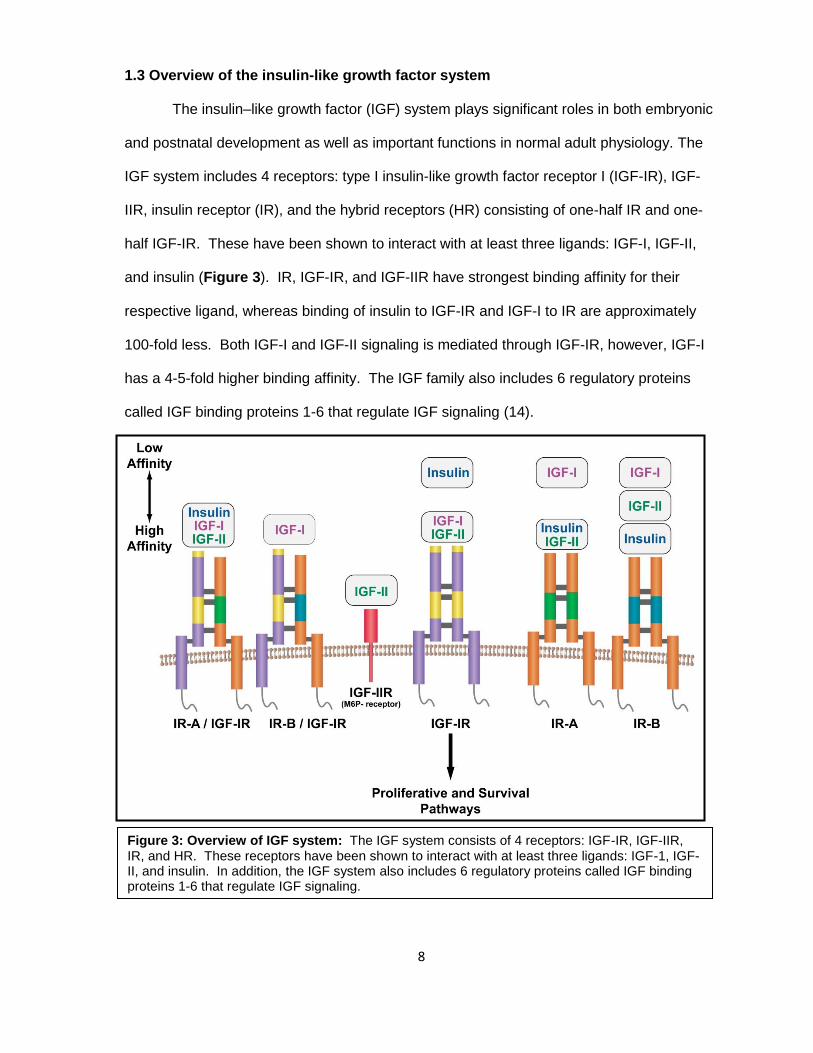
The insulin–like growth factor (IGF) system plays significant roles in both embryonic
and postnatal development as well as important functions in normal adult physiology. The
IGF system includes 4 receptors: type I insulin-like growth factor receptor I (IGF-IR), IGF-
IIR, insulin receptor (IR), and the hybrid receptors (HR) consisting of one-half IR and one-
half IGF-IR. These have been shown to interact with at least three ligands: IGF-I, IGF-II,
and insulin (Figure 3). IR, IGF-IR, and IGF-IIR have strongest binding affinity for their
respective ligand, whereas binding of insulin to IGF-IR and IGF-I to IR are approximately
100-fold less. Both IGF-I and IGF-II signaling is mediated through IGF-IR, however, IGF-I
has a 4-5-fold higher binding affinity. The IGF family also includes 6 regulatory proteins
called IGF binding proteins 1-6 that regulate IGF signaling (14).
Figure 3: Overview of IGF system: The IGF system consists of 4 receptors: IGF-IR, IGF-IIR, IR, and HR. These receptors have been shown to interact with at least three ligands: IGF-1, IGF-II, and insulin. In addition, the IGF system also includes 6 regulatory proteins called IGF binding proteins 1-6 that regulate IGF signaling.
9
1.4 IGF-I
IGF-I is a single chain peptide that has 62% homology with each IGF-II and 40%
homology with proinsulin (14). Evidence shows that IGF-I is synthesized in a variety of
tissues and cultured cell types, suggesting that the protein may have autocrine or paracrine
effector functions, unlike insulin which is stored within cells of a particular tissue (pancreas)
and has mainly autocrine effects (15-19). Liver secretion of IGF-I is regulated by growth
hormone (GH) which signals peripheral tissues to grow, whereas insulin is tightly regulated
by glucose uptake (18, 20, 21). Therefore, insulin is primarily associated with inducing
metabolic effects, whereas the IGF-I is essential a growth factor and an anabolic agent.
IGF-I is the primary ligand for IGF-IR. There is increasing evidence that IGF-I might
provide a major link between IGF-IR and the development of cancers through its influence
on the regulation of normal cell proliferation, differentiation and apoptosis. Although most
cancers do not secrete IGF-I, high concentrations of circulating IGF-I in serum appear to
contribute to the growth, maintenance and progression of the most common cancers,
including cancers of the breast, lung and colon (22-26). For example, previous studies
have demonstrated that colonic epithelium in acromegalic patients is characterized by
increased proliferation which is proportional to serum IGF-I levels (27). Also, there is a
large amount of evidence from both in vitro and in vivo experiments that prostate cancer is
mitogenically responsive to IGF-I (23). Several mouse models have shown reduced
proliferation of androgen-dependent prostate cancer cells in IGF-I deficient hosts relative to
control hosts, testifying to the strong mitogenic properties of IGF-I.
IGF-I appears to tightly control both positive and negative regulators of the cell cycle
primarily through the interaction with IGF-IR. It has been previously documented that IGF-I
increases cell proliferation by amplifying DNA synthesis and upregulating cyclin D1 mRNA
expression, which allows entry into the S phase of the cell cycle. In a study using skeletal
myoblasts, it was demonstrated that the early effects of IGF-I during cell cycle progression
10
are associated with the stabilization of Rb1 phosphorylation that is typical of proliferating
cells. It then upregulates CDK4 and cyclin D1 gene expression which further maintain Rb1
phosphorylation (22). In another study using neocortical neural progenitor cells, in vitro
addition of IGF-I induced rapid increase in cyclin D1 and cyclin D3 . This led to a further
increase in cyclin E, which also assists in the G1/S phase transition. Simultaneously,
observed decrease in CDK inhibitors p27 and p57 suggested that downregulation of
negative regulators of cell cycle also contributes to the mitogenesis induced by IGF-I.
These effects were further demonstrated in vivo, where injection of IGF-I led to increased
DNA synthesis and number of S phase cells, with simultaneous increase in
phosphorylated/activated Akt, cyclin D1 and cyclin E (28). Endogenous blockade of IGF-I
with an anti-IGF-I antibody led to decreased DNA synthesis, upregulation of p27 and p57,
as well as prevention of cyclin E mRNA expression. Interestingly, it has been demonstrated
that the effects exerted by IGF-I are primarily induced through the PI3K/Akt pathway.
Blocking this pathway, but not the MAPK/Erk pathway, inhibited the mitogenic potential of
IGF-I (28). This data suggests strong mitogenic potential of IGF-I, acting essentially
through IGF-IR.
11
1.5 IGF-IR
1.5 a. Regulation of IGF-IR gene expression
IGF-IR gene is located at chromosome 15q25-15q26 and is regulated by several
different stimuli including hormones, growth factors, and nutritional status (29). For
example, in addition to its stimulatory effects on IGF-IR, it has also been shown that high
IGF-I levels result in a decrease of receptor number, suggesting that IGFs may act as
negative regulators of a positive feedback mechanism (18, 29, 30). Furthermore, it has
been shown that other growth factors, hormones, and transcription factors such as AP-1,
SP-1, fibroblast growth factor (FGF), platelet-derived growth factor (PDGF), epidermal
growth factor (EGF), estrogens, glucocorticoids, and GH stimulate IGF-IR expression,
whereas WT1 (Wilms tumor 1 protein) and STAT1 inhibit the expression of IGF-IR (30-34).
Additionally, wild type p53 inhibits IGF-IR expression, in contrast to mutated p53 which has
stimulatory effects on IGF-IR activity without binding to its promoter. The transcriptional
role of WT1 appears to depend on the cellular status of p53. WT1 can inhibit IGF-IR only in
the presence of wild type p53. It has been illustrated previously that several colorectal and
breast cancer specimens with elevated IGF-IR levels demonstrated coexpression of WT1
and mutated p53, suggesting a possible sequestration of WT1 by mutated p53 (22, 34).
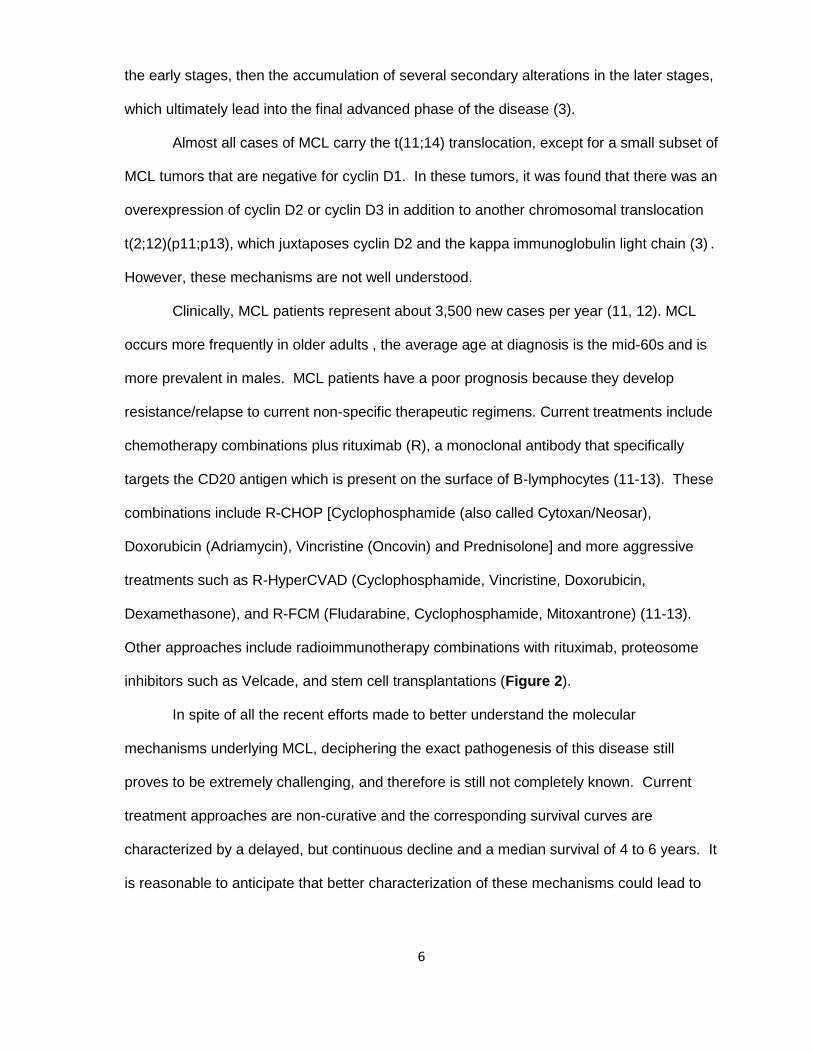
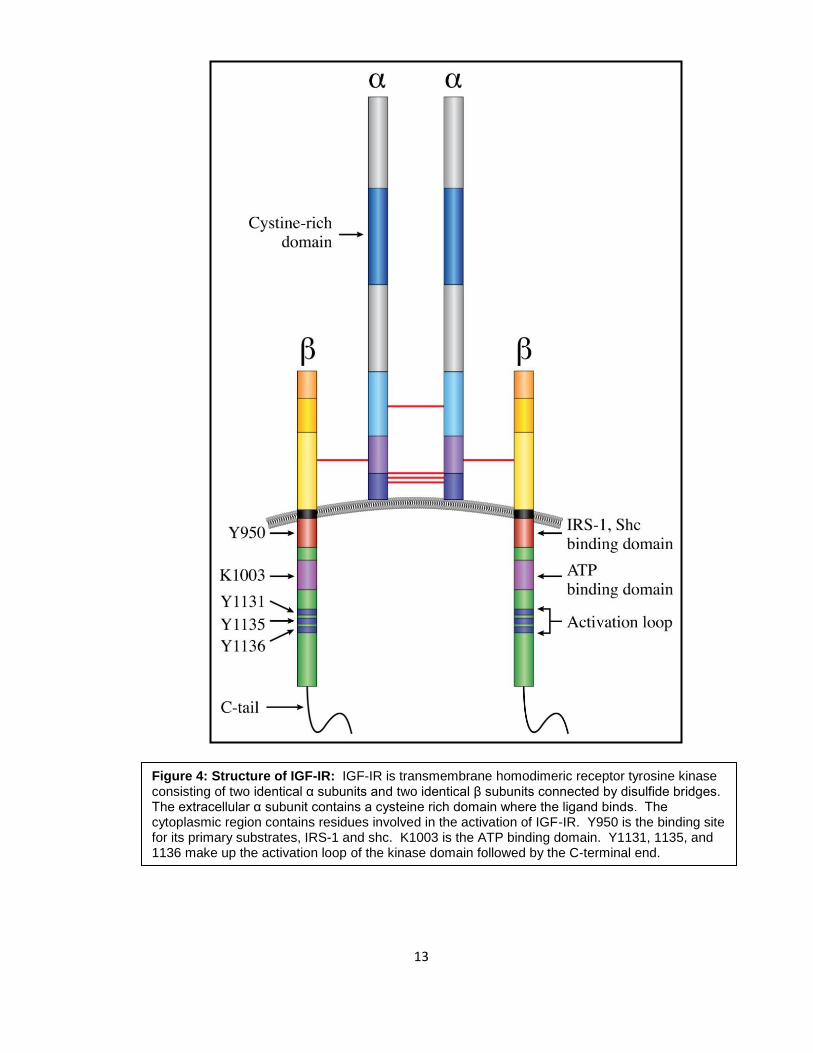
1.5 b. IGF-IR structure and signaling
IGF-IR is a receptor tyrosine kinase consisting of two identical subunits and two
identical β subunits that are connected by disulfide bridges to form the functional
homodimeric receptor complex. The subunit is entirely extracellular and contains a
cysteine rich domain that forms the primary binding site for its ligands IGF-I and, to a lesser
affinity, IGF-II and insulin. The β subunit includes an extracellular domain, a 24-residue
hydrophobic transmembrane domain, and a larger cytoplasmic region which shares 84%
homology to the insulin receptor (30, 35). Tyrosine 950 is the binding site for its substrates,
12
insulin receptor substrates 1-4 (IRS-1-4) and src homology and collagen (shc) domain
protein, among others. The intracellular region of the β subunit contains an ATP binding
site at lysine 1003. It also contains a kinase domain encompassing the activation loop
made up of three critical tyrosines at positions 1131, 1135, and 1136, which become
phosphorylated upon ligand binding. Residue 1136 is particularily important in that it
maintains the conformational stability of the β chain. The C- terminal domain contains
several tyrosines and serines, that are phosphorylated and have mitogenic roles, but how
they actually contribute to normal and malignant IGF-IR signaling is still not fully understood
(35) (Figure 4).
Binding of IGF-IR to its ligands causes the phosphorylation of tyrosines on the
intracellular portion of its β subunit. Once phosphorylated, tyrosine 950 provides a docking
site for its substrates, IRS 1-4 and shc domain protein. Upon substrate binding,
downstream signaling is activated through PI3K/Akt , MAPK, or JAK/STAT pathways and
may stimulate cancer cell growth in an autocrine/paracrine manner (36, 37) (Figure 5).
13
Figure 4: Structure of IGF-IR: IGF-IR is transmembrane homodimeric receptor tyrosine kinase consisting of two identical α subunits and two identical β subunits connected by disulfide bridges. The extracellular α subunit contains a cysteine rich domain where the ligand binds. The cytoplasmic region contains residues involved in the activation of IGF-IR. Y950 is the binding site for its primary substrates, IRS-1 and shc. K1003 is the ATP binding domain. Y1131, 1135, and 1136 make up the activation loop of the kinase domain followed by the C-terminal end.

14
Figure 5: IGF-IR signaling: Binding of IGF-IR to its ligands causes the phosphorylation of tyrosines on the intracellular portion of its β subunit. Once phosphorylated, tyrosine 950 provides a docking site for its substrates, IRS 1-4 and shc domain protein. Upon substrate binding, downstream signaling is activated through PI3K/Akt, MAPK, or JAK/STAT pathways. Adapted from Kojima, S. et al: International Journal of urology Vol. 16, 2009:161-167. Copyright 2008 by JOHN WILEY AND SONS. Reproduced with permission of JOHN WILEY AND SONS in the format Dissertation via Copyright Clearance Center.
15
1.5 c. Physiological and pathological roles of IGF-IR
Mouse models have confirmed the importance of IGF-IR in prenatal and postnatal
growth, especially in regards to genetic imprinting. The result of activation of IGF-IR during
these stages is survival and proliferation in mitosis-competent cells resulting in growth of
tissues such as skeletal muscle and cardiac muscle (15, 19, 38-41). It also plays a critical
role during development of mammary gland tissue during pregnancy and lactation. It has
been previously shown that Igf1r null mice develop generalized organ hypoplasia, including
developmental delays in bone ossification, and abnormalities in the central nervous system
(15, 19, 42-45). During embryonic development, the IGF-IR pathway is also involved in the
development of limb buds. Mice lacking the entire Igf1r gene die early in development
(invariably at birth) due to severe respiratory failure and also exhibit a dramatic reduction in
body mass, testifying to the strong growth-promoting effect of this receptor (42). Mice
carrying only one functional copy of Igf1r are normal, but exhibit a ~45% decrease in body
mass (42).
The IGF-IR pathway is also strongly associated with initiating cancer growth (25, 36, 38,
46-57). Evidence in the last 20 years has emerged to support that IGF-IR overexpression
plays a significant role in the development and progression of tumors, metastatic potential,
and resistance to new therapies. Studies have shown that IGF-IR induces its oncogenic
effects through the inhibition of apoptosis and induction of transformation, metastasis, and
angiogenesis. Recent studies have claimed that a constitutively active IGF-IR can induce
ligand-independent tumor cell progression and more importantly, may be critically
necessary in mediating certain oncogenes during their transforming processes. For
example, treatment of RM11A cells (murine breast cancer cell line) with high levels of IGF-
IR with exogenous IGF-I, IGF-II, or serum did not enhance the proliferative/survival
advantage (58). On the other hand, the ability of RM11A cells expressing low levels of IGF-
IR to respond to IGF stimulation was found most likely to be due to activation of the
16
endogenous murine IGF-IR. Therefore, it was concluded that it is possible that IGF-IR
overexpression results in constitutive activation of the IGF-IR independent of the presence
of ligands (58). In addition, autoactivation of IGF-IR, when expressed at sufficient levels,
has previously been shown in cells lacking IGF-IR that have been transfected with different
levels of IGF-IR (59). Furthermore, IGF-IR regulates properties that cause the malignant
cells to overcome anchorage-dependent growth, allowing them to acquire characteristics
involved in enduring detachment and migration that are essential attributes for metastasis
(60).
It has been shown that the number of IGF-IR molecules present in cells plays a key role
in its transforming properties (59, 61). In fibroblasts, IGF-IR number needs to be greater
than 20,000 receptors per cell to enable mitogenesis after stimulation with IGF-I. Similarly,
in a pancreatic cell line model, the observed increase in receptor number from 40,000
receptors/cell to 100,000 receptors/cell is in the range required to enable IGF-I-stimulated
growth and therefore may be of central importance for pancreatic tumor growth control.
Based on these findings, it is concluded that only a small increment in the number of
receptors per cell can induce the transforming properties of IGF-IR in different types of
tumors (59, 61).
In solid tumors, some studies for the role of the IGF system have been performed using
breast cancer cell lines, and was found that one of the mechanisms that IGF-IR was
activated both in vitro and in vivo was through IGF-I: 1) serum IGF-I may act as a
stimulatory molecule to induce the proliferation of breast cancer cells in an endocrine
manner and/or 2) stromal cells that surround the tumorigenic cells serve as a paracrine
stimulator of the mitogenic signal (52, 62-65). It has been shown that there is hindrance of
cell proliferation by cancer cells when IGF-IR activation is inhibited. One possible
mechanism is the lack of interaction of IGFs with IGF-IR or interrupting the signaling
pathway. In prostate cancer, IGFs have been shown to directly stimulate the androgen
17
receptor (AR) via crosstalk with IGF-IR on prostatic epithelial cells to induce its
pathogenesis, progression, and metastisis (66). Similarly, the oncogenic effects of IGF-IR
are also seen in colon cancer. IGF-IR is overexpressed in colon cancer, compared to
normal colonic mucosa and IGFs in colonic malignant mucosa are shown to exert their
effects via the IGF-IR only (27, 56).
In contrast to the widely studied solid tumors, not many studies have been performed to
examine the role of IGF-IR in hematological neoplasms and, most of the studies have
focused primarily on plasma cell myeloma (67, 68).
18
1.6 Role of IGF-IR in cell cycle progression and apoptosis
The strong mitogenic properties of IGF-IR are evident through its ability to positively
and negatively regulate cell cycle progression and inhibit apoptosis. It has been previously
shown that IGF-IR can regulate cell-cycle progression through control of several cell cycle
checkpoints. At the G0/G1 phase of the cell cycle, it activates the p70S6K (a kinase that is
responsible for site-specific phosphorylation of Bad, which inactivates this pro-apoptotic
molecule), leading to phosphorylation of the S6 ribosomal protein and a subsequent
increase in the ribosomal pool necessary for entry into the cell cycle (69). However, its
most notable contribution to the cell cycle occurs during the G1/S phase transition.
At the G1/S transition, IGF-IR increases synthesis of cyclin E mRNA, which normally
complexes with CDK2 to allow for entry from the G1 phase to the S phase of the cell cycle
(69). However, the most significant contribution of IGF-IR to this phase of the cell cycle is
through the regulation of cyclin D1. IGF-IR increases cyclin D1 and CDK4 gene
expression, leading to phosphorylation of Rb1, and release of the E2F transcription factor
(69, 70). Cyclin D1 expression can be mediated through several IGF-IR induced
mechanisms. For example, it can be transcriptionally regulated through the
ras/raf1/MEK/ERK pathway or it may be mediated through increased translation of its
mRNA in a PI3K/Akt-dependent manner (71). One study has shown that IGF-IR-axis-
induced expression of activated Ras is associated with the increased transcription of cyclin
D1 mRNA in IGF-I stimulated human osteocarcinoma cells (72). It was observed that in
these cells IGF-IR stimulates the CDKs through Ras activation, and that stimulation is
associated with an increase in cyclin D1 mRNA and protein expression, most likely due at
least in part to an increase in the rate of transcription initiation of the gene. It was also
found that the increase in cyclin D1 most likely occurs in early G1, which corresponds to the
portion of the cell cycle in which IGF-IR acts on these cells.
19
Another study has shown that exongenous addition of IGF-I to a breast cancer cell
line activated IGF-IR, with a simultaneous nuclear accumulation of cyclin D1 and activation
of the PI3K pathway, but not the MAP/Erk pathway (70) . It was observed that IGF-IR
dose-dependently raised cyclin D1 levels in serum-starved cells with exogenous addition of
IGF-I. Subsequent activation of the cyclin E/CDK2 complex, hyperphosphorylation of pRb1,
and DNA synthesis were detected only in cells treated with mitogenic concentrations of
IGF-I. Also, using specific inhibitors, this study showed activation of the PI3K pathway by
IGF-IR to be essential for cell cycle progression. The PI3K inhibitor LY294002 completely
abolished nuclear accumulation of cyclin D1 protein in late G1 phase, but the MEK inhibitor
PD098059 did not significantly block translocation of cyclin D1 to the nucleus, suggesting
that the ERK pathway is not critically involved in induction of nuclear accumulation. More
importantly, this effect on cyclin D1 was found to be due to an increase in the translation of
its mRNA. Therefore, these experiments may suggest that one mechanism of cyclin D1
regulation by IGF-IR is by increasing transcription of cyclin D1 mRNA through the
raf/ras/MAPK/Erk pathway or by increasing translation of cyclin D1 mRNA into protein
through the PI3K/Akt pathway.
Another mechanism of cyclin D1 upregulation is by downregulating the transcription
of the CDK inhibitor p27 by altering its processing and nuclear localization through a PTEN-
dependent mechanism (73). A study analyzing the effects of loss of both p21and p27 in
mouse embryo fibroblasts after IGF-I treatment demonstrated not only an increase of cyclin
D/CDK activity but also markedly increased cyclin D1 protein levels. The loss of p27
resulted in its translocation to the nucleus through the downregulation of PTEN, which
normally functions to dephosphorylate PIP3 (thereby rendering it inactive), an activator of
the PI3K/Akt pathway. Therefore, this effect induced cell cycle progression from the G1 to
the S phase of the cell cycle.
20
Finally, at the G2/M phase of the cell cycle, IGF-IR increases the mRNA expression
of cyclin A and B and Cdc2 synthesis (69). Thus, IGF-IR can positively regulate cell cycle
progression at several phases.
IGF-IR has previously been shown to inhibit apoptosis by inhibiting release of
cytochrome C through the activation of the PI3K/Akt pathway. Activated Akt can
phosphorylate the pro-apoptotic protein Bad. Upon phosphorylation, Bad is dissociated
from anti-apoptotic Bcl-2, and becomes temporarily controlled by the adaptor protein 14-3-
3. If Bad is not phosphorylated, other pro-apoptotic proteins, such as Bak and Bax, become
activated and cause cytochrome C release from mitochondria. In turn, caspase-9 and then
caspase-3 become activated. Activated caspase-3 can cleave and inactivate, for example,
the poly(ADP-ribose) polymerase (PARP), which normally functions in DNA repair and
programmed cell death and this results in extensive degradation of DNA at the final steps
in the apoptotic process (74, 75).
21
1.7 Current approaches to target IGF-IR
Currently there are several approaches to target IGF-IR including antisense
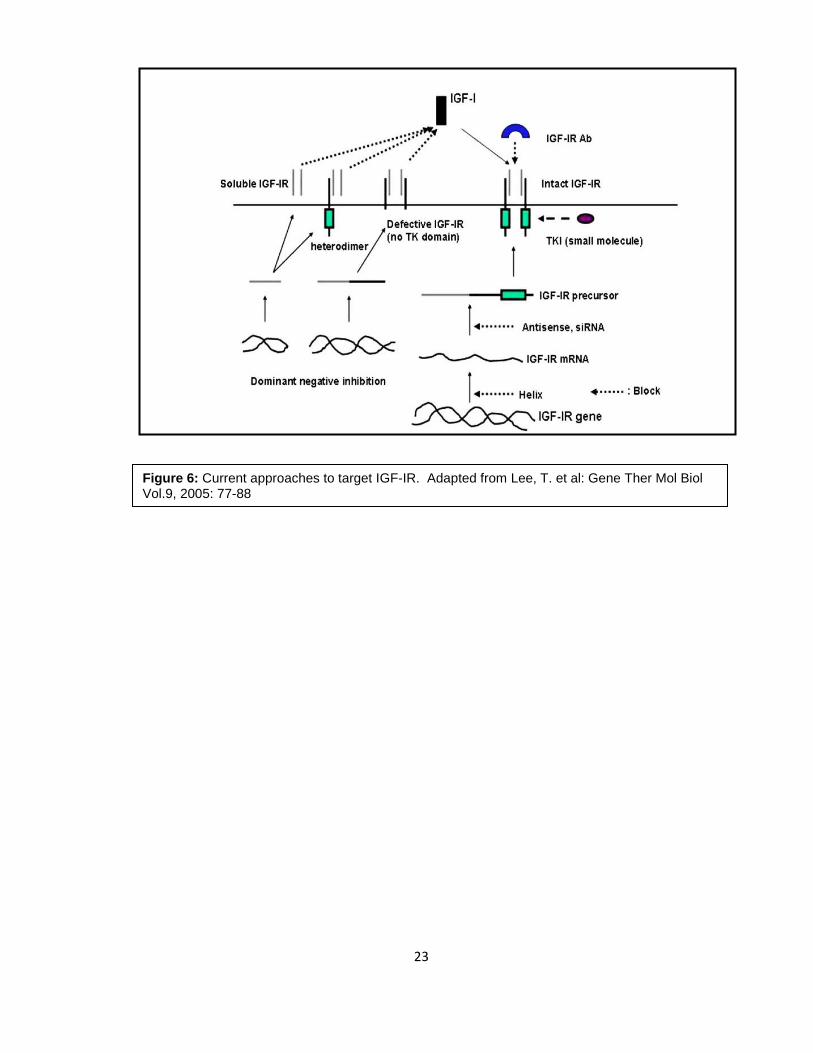
plasmids, dominant negative strategies, and siRNA (50, 76-82) (Figure 6). However, the
most notable approaches have been the recent development of anti-IGF-IR antibodies and
small molecule inhibitors of IGF-IR. Recently, at least 8 human monoclonal antibodies
have been tested in clinical trials (83). However, using monoclonal antibodies as treatment
has induced hyperglycemia in some patients, as these antibodies can also target the insulin
receptor (83). Therefore, a need for developing more specific approaches to targeting IGF-
IR is the focus of many studies. IGF-IR and IR are both tyrosine kinases with identical ATP
binding sites, therefore, the best approach for designing small molecule inhibitors is to
target receptor autophosphorylation at the substrate level. An example of such small
molecule inhibitors includes the family of cyclolignans (84). These have been shown to
mimic the three dimensional structure of the IGF-IR tyrosine kinase domain, preventing
substrate binding, and inducing apoptosis and cell cycle arrest in several solid tumors (84-
88).
One particular member of the cyclolignan family is picropodophyllin (PPP). PPP has
been shown to be an activation-loop small molecule inhibitor of IGF-IR and currently is in
pre-clinical development (84, 89, 90). In a very recent study, PPP was found to be the most
efficient compared to other antitumor agents (imatinib mesylate and 3 other cytostatic
agents) in killing uveal melanoma cells after oral administration in a SCID mouse model
(91). PPP was well tolerated by the animals and also decreased VEGF expression in the
tumors. It was demonstrated previously that PPP is an inhibitor of the IGF-IR tyrosine
phosphorylation and importantly that it did not interfere with the highly homologous insulin
receptor (IR) (84, 90). PPP did not selectively inhibit the IGF-IR tyrosine kinase at the level
of ATP binding, since the ATP domain is structurally similar to the one found in the IR. This
suggests that it acted through suppression of other components, such as at the level of
22
receptor substrate. Normally, IGF-IR, in its inactive state, contains the activation loop which
houses the critical tyrosine residues 1131, 1135, and 1136. Y1135 (being the first tyrosine
to be phosphorylated) in the activation loop is bound in a cis position and therefore prevents
any access by the substrates or ATP. After ligand binding, the three tyrosines of the
activation loop are phosphorylated to a trans position in the β subunit. Phosphorylation of
Y1135 and Y1131 destabilizes the autoinhibitory conformation of the activation loop, while
phosphorylation of Y1136 residue stabilizes the active conformation of IGF-IR (92). These
changes in the activation loop conformation allow for substrate and ATP binding and
subsequent activation of downstream signaling of IGF-IR. PPP is said to selectively inhibit
phosphorylation of Y1136 of the activation loop while refraining from Y1131 and Y1135,
thereby preventing the stabilization of IGF-IR. This approach is considered more selective
and less cytotoxic, therefore, targeting the IGF signaling pathway with small molecule
inhibitors such as PPP represents a promising strategy in the development of novel anti-
cancer therapeutics.
23
Figure 6: Current approaches to target IGF-IR. Adapted from Lee, T. et al: Gene Ther Mol Biol Vol.9, 2005: 77-88
24
Rationale
The rationale behind our study is that:
1) MCL is an aggressive, incurable type of malignant lymphoma that currently has no
target-based therapeutic approach. As previously mentioned, current treatments for
MCL include chemotherapy combinations plus rituximab such as R-CHOP and more
aggressive treatments such as R-HyperCVAD. Other approaches include
radioimmunotherapy combinations with rituximab, proteosome inhibitors such as Velcade,
and stem cell transplantations. Although these treatments prove to be initially effective, the
patient almost always develops resistance/relapse due to the highly aggressive nature of
the disease. Therefore, targeting specific signaling pathways deregulated in MCL,
particularly those regulating cell proliferation and cell death is opening new doors for
therapeutic intervention.
2) IGF-IR appears to be a promising molecular target in aggressive solid tumors and
is currently being tested in clinical trials. As a drug target, the IGF system has a
number of key features that proves itself to being appealing. The expression of IGF-IR, the
major signal transducing receptor of the pathway, appears to be necessary for malignant
transformation in preclinical models. IGF-IR overexpression has been well documented in
a number of aggressive solid tumors. Several IGF-IR inhibitors are in the clinical or pre-
clinical stages of development, including a member of the cyclolignan family of inhibitors
called picropodophyllin, PPP.
3) Overlap exists between pathogenetic molecular mechanisms in MCL and IGF-IR
signaling system. The main signaling pathways involved in both the pathogenesis of MCL
as well as IGF-IR signaling include PI3K/Akt, MAPK, and JAK/STAT pathways. More
specifically, both MCL and IGF-IR signaling systems regulate common key molecules that
are involved in cell cycle progression and apoptosis in which the three main signaling
systems contribute. For example, MCL is characterized by the genetic translocation
25
t(11;14)(q13;q32) resulting in the overproduction of cyclin D1, a cell cycle regulatory
molecule that functions at the G1/S transition phase. Recent studies have shown that
cyclin D1 may be mediated through increased translation in a PI3K/Akt-dependent manner
or it can be transcriptionally regulated through the ERK pathway by IGF-IR. In addition,
common pro-apoptotic molecules and anti-apoptotic molecules have been shown to be
deregulated in both systems. Therefore, targeting IGF-IR may possibily induce cell cycle
arrest and apoptosis through these shared molecules in MCL cells.
We hypothesize that IGF-IR signaling contributes to the survival of MCL and thus
may prove to be a legitimate therapeutic target in the future. In order to test our
hypothesis, we proposed the following set of aims:
Aim 1: To analyze the expression of IGF-IR and its activation in MCL.
Aim 2: To test the effects of inhibition of IGF-IR in MCL.
26
Chapter II: Analysis of the Expression of
IGF-IR and Its Activation in Mantle Cell
Lymphoma
27
2.1 IGF-IR expression in MCL
To examine the expression of IGF-IR mRNA in MCL, 4 established MCL cell lines
(SP-53, JeKo-1, Mino, and Granta) were used to perform RT- PCR using IGF-IRα and IGF-
IRβ primers. Normal human peripheral blood CD19+ B-lymphocytes were used to analyze
the physiological level of expression of IGF-IR. Karpas 299 and P6 cell lines were used as
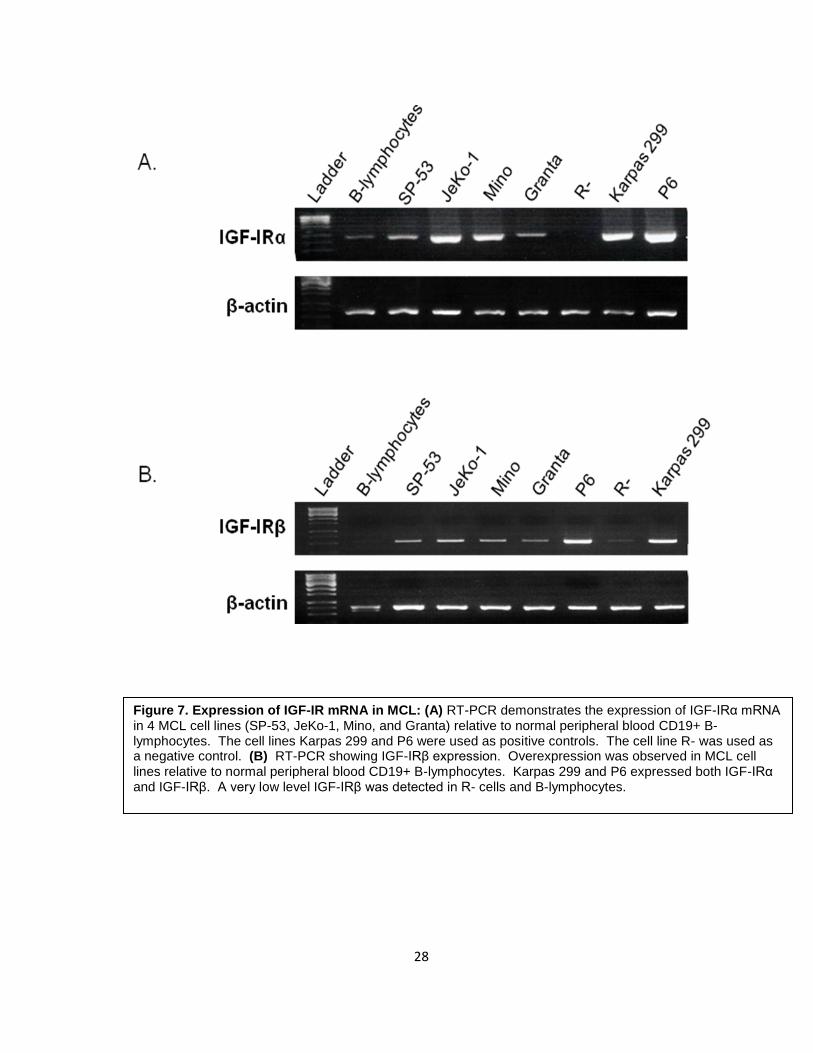
positive controls. The R- cell line was used as a negative control. As shown in Figure 7,
all MCL cell lines showed overexpression of IGF-IRα as well as IGF-IRβ mRNA compared
to normal B-lymphocytes. SP-53 and Granta displayed lower levels of expression relative
to JeKo-1 and Mino. Karpas 299 and P6 expressed IGF-IRα and IGF-IRβ, whereas R- was
completely negative for IGF-IRα, but displayed a very low level of expression of the IGF-IRβ
subunit.
28
Figure 7. Expression of IGF-IR mRNA in MCL: (A) RT-PCR demonstrates the expression of IGF-IRα mRNA in 4 MCL cell lines (SP-53, JeKo-1, Mino, and Granta) relative to normal peripheral blood CD19+ B- lymphocytes. The cell lines Karpas 299 and P6 were used as positive controls. The cell line R- was used as a negative control. (B) RT-PCR showing IGF-IRβ expression. Overexpression was observed in MCL cell lines relative to normal peripheral blood CD19+ B-lymphocytes. Karpas 299 and P6 expressed both IGF-IRα and IGF-IRβ. A very low level IGF-IRβ was detected in R- cells and B-lymphocytes.
29
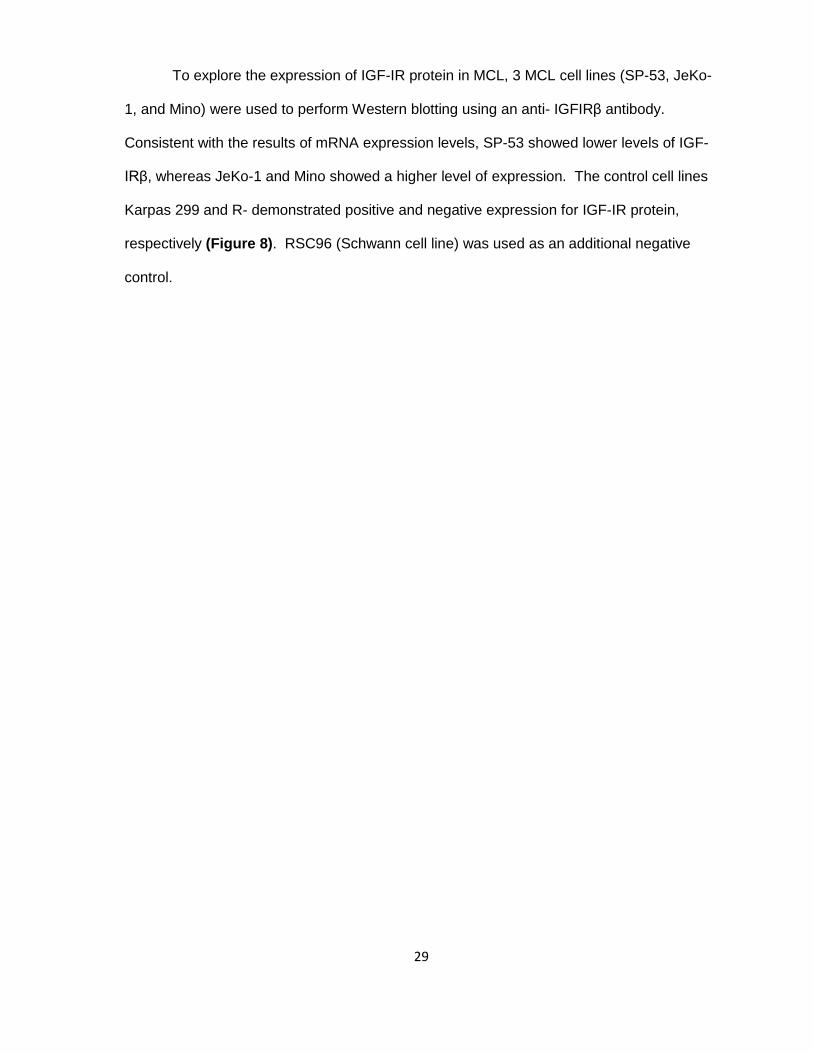
To explore the expression of IGF-IR protein in MCL, 3 MCL cell lines (SP-53, JeKo-
1, and Mino) were used to perform Western blotting using an anti- IGFIRβ antibody.
Consistent with the results of mRNA expression levels, SP-53 showed lower levels of IGF-
IRβ, whereas JeKo-1 and Mino showed a higher level of expression. The control cell lines
Karpas 299 and R- demonstrated positive and negative expression for IGF-IR protein,
respectively (Figure 8). RSC96 (Schwann cell line) was used as an additional negative
control.
30
Figure 8. Expression of IGF-IR protein in MCL: Western blotting demonstrates the expression of IGF-IRβ protein in 3 MCL cell lines (SP-53, JeKo-1, and Mino). The cell lines R- and RSC96 were used as negative controls and Karpas 299 was used as a positive control. SP-53 showed lower level of expression of IGF-IRβ compared with JeKo-1 and Mino.
31
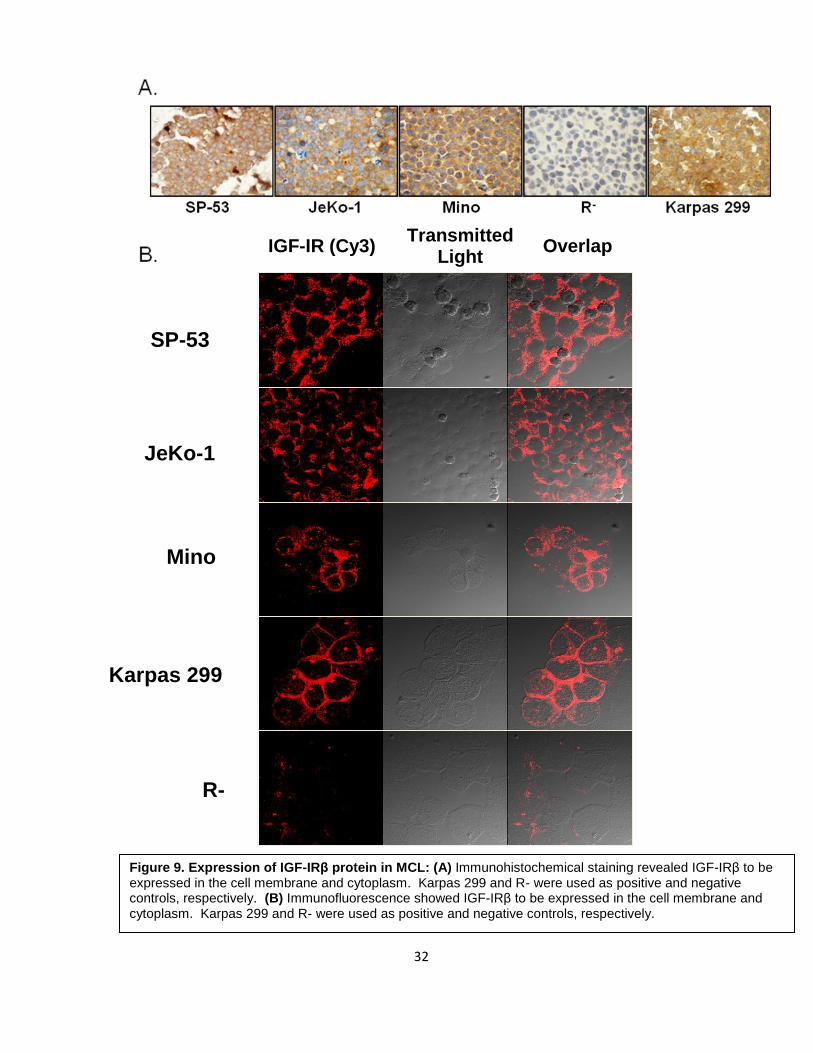
To demonstrate the localization of IGF-IR in MCL cells, we performed
immunohistochemical and immunofluorescence staining of 3 MCL cell lines and Karpas 299
(positive control) and R- (negative control). As shown in Figure 9, all 3 cell lines and the
positive control showed significant expression of IGF-IR protein in the membrane and
cytoplasm of the cells, whereas R- was completely negative for the receptor.
32
Figure 9. Expression of IGF-IRβ protein in MCL: (A) Immunohistochemical staining revealed IGF-IRβ to be expressed in the cell membrane and cytoplasm. Karpas 299 and R- were used as positive and negative controls, respectively. (B) Immunofluorescence showed IGF-IRβ to be expressed in the cell membrane and cytoplasm. Karpas 299 and R- were used as positive and negative controls, respectively.
JeKo-1
SP-53
Mino
Karpas 299
R-
IGF-IR (Cy3) Overlap Transmitted
Light
33
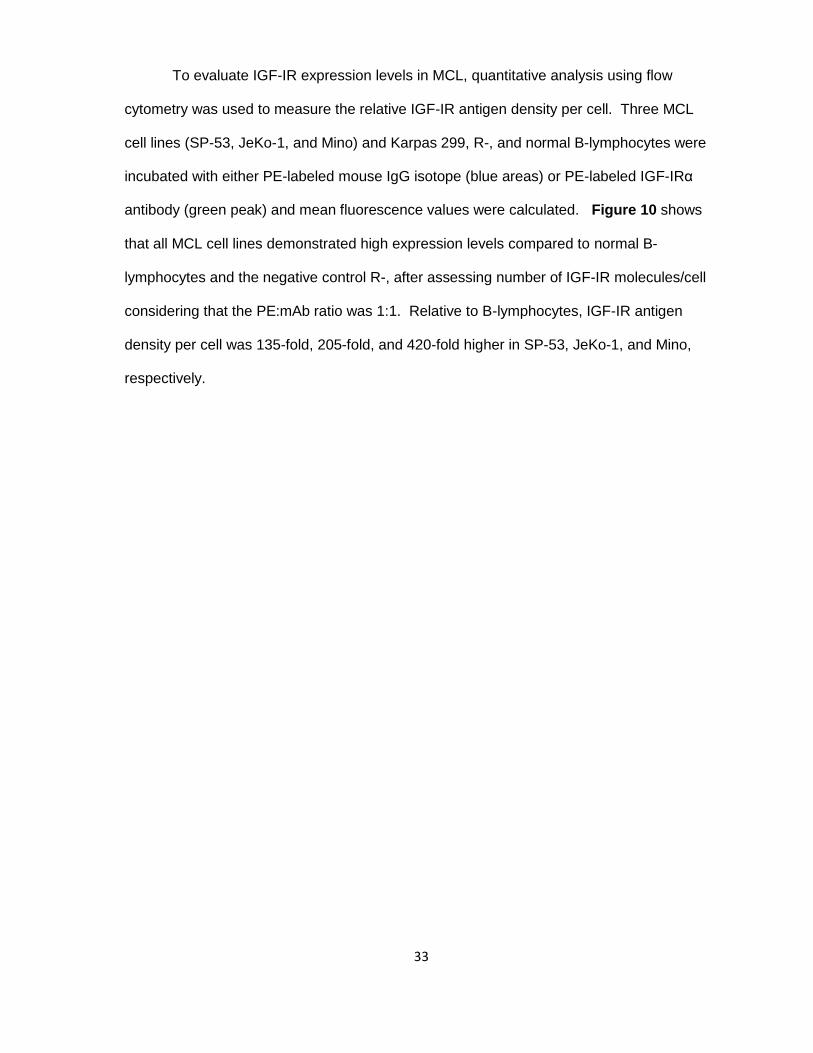
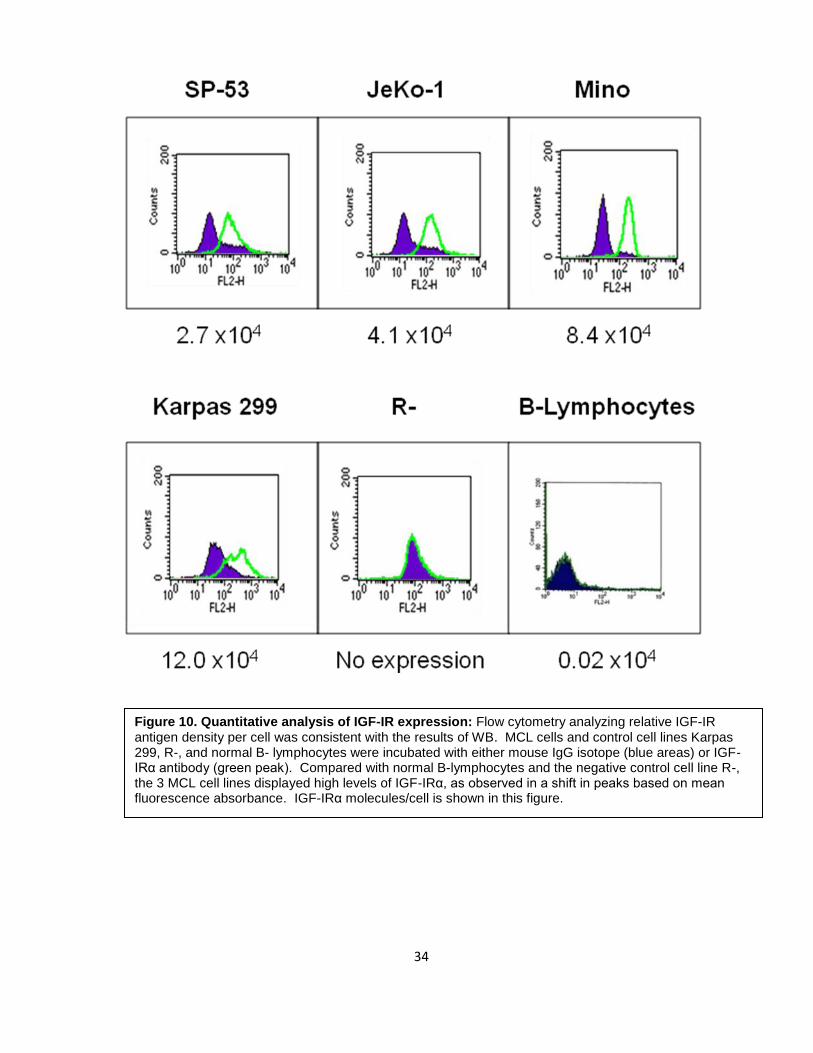
To evaluate IGF-IR expression levels in MCL, quantitative analysis using flow
cytometry was used to measure the relative IGF-IR antigen density per cell. Three MCL
cell lines (SP-53, JeKo-1, and Mino) and Karpas 299, R-, and normal B-lymphocytes were
incubated with either PE-labeled mouse IgG isotope (blue areas) or PE-labeled IGF-IRα
antibody (green peak) and mean fluorescence values were calculated. Figure 10 shows
that all MCL cell lines demonstrated high expression levels compared to normal B-
lymphocytes and the negative control R-, after assessing number of IGF-IR molecules/cell
considering that the PE:mAb ratio was 1:1. Relative to B-lymphocytes, IGF-IR antigen
density per cell was 135-fold, 205-fold, and 420-fold higher in SP-53, JeKo-1, and Mino,
respectively.
34
Figure 10. Quantitative analysis of IGF-IR expression: Flow cytometry analyzing relative IGF-IR antigen density per cell was consistent with the results of WB. MCL cells and control cell lines Karpas 299, R-, and normal B- lymphocytes were incubated with either mouse IgG isotope (blue areas) or IGF-IRα antibody (green peak). Compared with normal B-lymphocytes and the negative control cell line R-, the 3 MCL cell lines displayed high levels of IGF-IRα, as observed in a shift in peaks based on mean fluorescence absorbance. IGF-IRα molecules/cell is shown in this figure.
35
Because we found the expression of IGF-IR in SP-53, JeKo-1, and Mino, we sought
to determine whether the activated/phosphorylated form of IGF-IR (pIGF-IR) is present in
these cells. In order to do so, immunoprecipitation and Western blotting techniques were
used. IGF-IRβ was immunoprecipitated using an anti-IGF-IRβ antibody by adding total
protein extracts (800 µg) to agarose beads conjugated with A/G. Proteins were then
subjected to Western blotting and subsequently stained with anti-p-Tyr antibody or IGF-IR
antibody (Figure 11). pIGF-IR was expressed in MCL cells. SP-53 showed lower level of
phosphorylation relative to JeKo-1 and Mino. Beads only was used as a reagent control.
Cell lysate immunoprecipitated with mouse IgG was used to distinguish IGF-IRβ protein
from nonspecific bands.
36
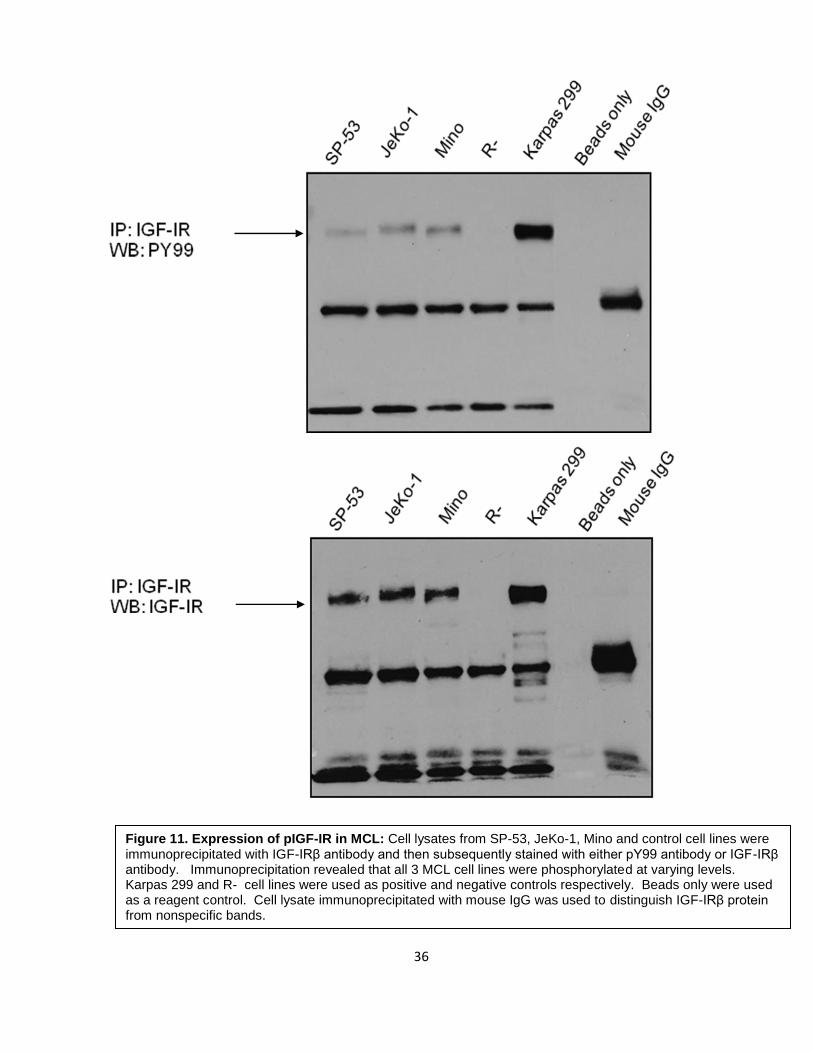
Figure 11. Expression of pIGF-IR in MCL: Cell lysates from SP-53, JeKo-1, Mino and control cell lines were immunoprecipitated with IGF-IRβ antibody and then subsequently stained with either pY99 antibody or IGF-IRβ antibody. Immunoprecipitation revealed that all 3 MCL cell lines were phosphorylated at varying levels. Karpas 299 and R- cell lines were used as positive and negative controls respectively. Beads only were used as a reagent control. Cell lysate immunoprecipitated with mouse IgG was used to distinguish IGF-IRβ protein from nonspecific bands.
37
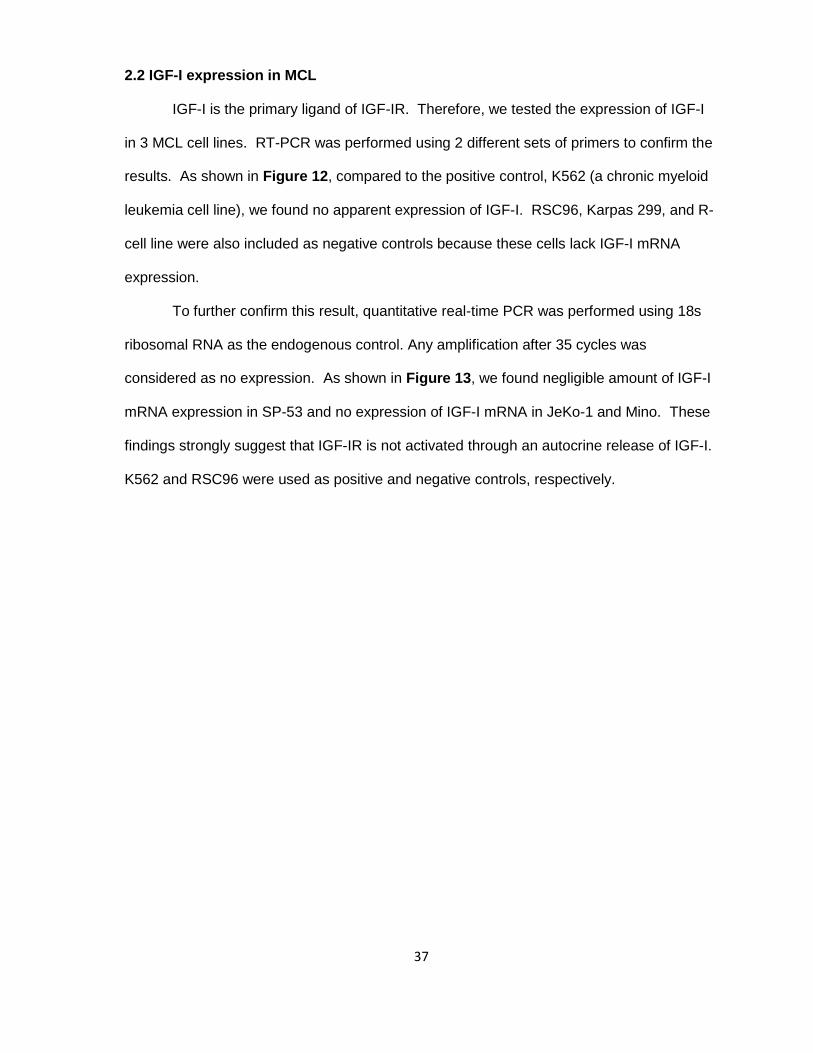
2.2 IGF-I expression in MCL
IGF-I is the primary ligand of IGF-IR. Therefore, we tested the expression of IGF-I
in 3 MCL cell lines. RT-PCR was performed using 2 different sets of primers to confirm the
results. As shown in Figure 12, compared to the positive control, K562 (a chronic myeloid
leukemia cell line), we found no apparent expression of IGF-I. RSC96, Karpas 299, and R-
cell line were also included as negative controls because these cells lack IGF-I mRNA
expression.
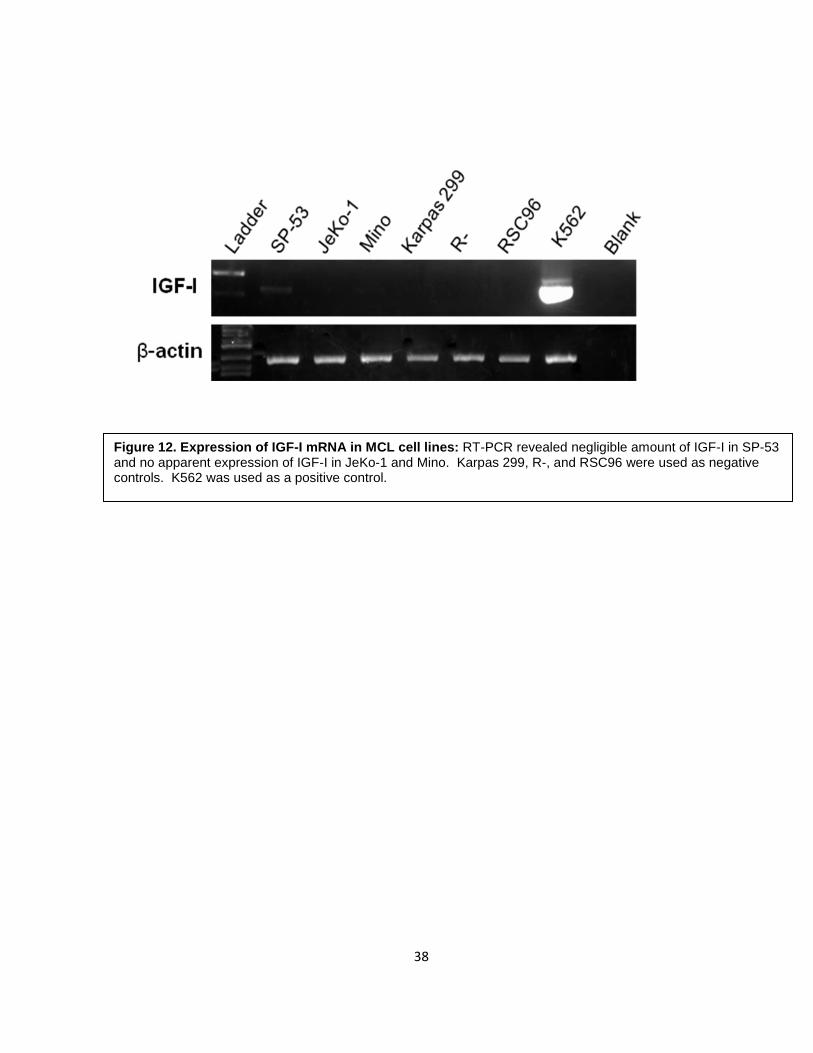
To further confirm this result, quantitative real-time PCR was performed using 18s
ribosomal RNA as the endogenous control. Any amplification after 35 cycles was
considered as no expression. As shown in Figure 13, we found negligible amount of IGF-I
mRNA expression in SP-53 and no expression of IGF-I mRNA in JeKo-1 and Mino. These
findings strongly suggest that IGF-IR is not activated through an autocrine release of IGF-I.
K562 and RSC96 were used as positive and negative controls, respectively.
38
Figure 12. Expression of IGF-I mRNA in MCL cell lines: RT-PCR revealed negligible amount of IGF-I in SP-53 and no apparent expression of IGF-I in JeKo-1 and Mino. Karpas 299, R-, and RSC96 were used as negative controls. K562 was used as a positive control.
39
18s
Sample Count 1 Count 2 Average Count
SP-53 19.916 19.272 19.594
JeKo-1 20.589 19.91 20.2495
Mino 21.466 21.55 21.508
RSC96 21.186 20.692 20.939
K562 17.397 17.153 17.275
Blank Undetermined Undetermined
IGF-I
Sample Count 1 Count 2 Average Count
SP-53 36.112 36.993 36.5525
JeKo-1 Undetermined Undetermined
Mino Undetermined Undetermined
RSC96 Undetermined Undetermined
K562 23.858 22.42 23.139
Blank Undetermined Undetermined
Figure 13. Expression of IGF-I mRNA in MCL cell lines: To further evaluate the expression of IGF-I mRNA in SP-53, JeKo-1, and Mino, quantitative real-time PCR was performed using 18s ribosomal RNA as the endogenous control. K562 and RSC96 were used as the positive and negative controls, respectively. Experiments were performed in duplicates and averaged. Amplification plot shown represents amount of fluorescence (Rn) measured at each thermal cycle, and is proportional to amount of PCR product generated at that point. Relative quantitation is expressed in terms of cycle threshold (Ct), the cycle at which fluorescence crosses a threshold value. Amplification after 35 cycles was considered as no expression. All cell lines exhibited high expression of 18S ribosomal RNA ranging from 17.275 (most abundant) cycles to 21.508 (least abundant). We found possible negligible amount of IGF-I mRNA expression in SP-53 (36.5525 cycles) and no expression of IGF-I mRNA in JeKo-1 and Mino (undetermined). K562 showed high expression of IGF-I (23.139 cycles) and RSC96 showed no expression (undetermined).
40
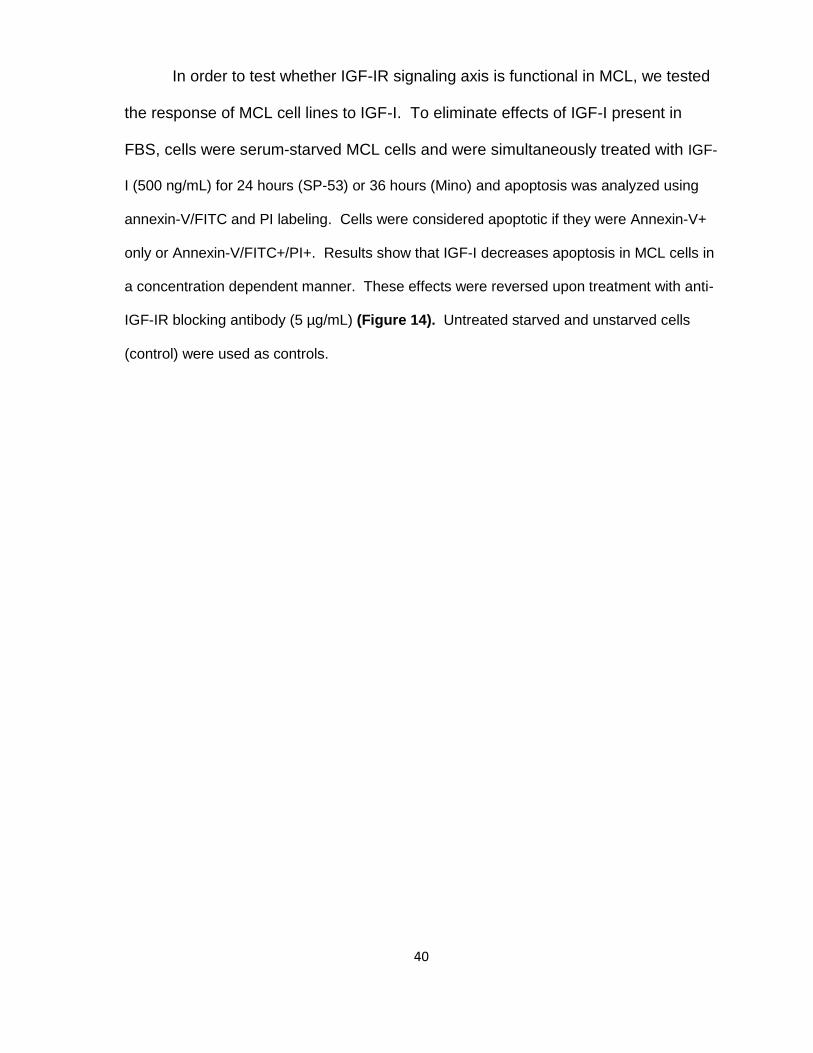
In order to test whether IGF-IR signaling axis is functional in MCL, we tested
the response of MCL cell lines to IGF-I. To eliminate effects of IGF-I present in
FBS, cells were serum-starved MCL cells and were simultaneously treated with IGF-
I (500 ng/mL) for 24 hours (SP-53) or 36 hours (Mino) and apoptosis was analyzed using
annexin-V/FITC and PI labeling. Cells were considered apoptotic if they were Annexin-V+
only or Annexin-V/FITC+/PI+. Results show that IGF-I decreases apoptosis in MCL cells in
a concentration dependent manner. These effects were reversed upon treatment with anti-
IGF-IR blocking antibody (5 µg/mL) (Figure 14). Untreated starved and unstarved cells
(control) were used as controls.
41
Figure 14. Apoptosis analysis after treatment with IGF-I: MCL cell lines were starved to exclude any effect of IGF-I present in FBS. MCL cells were treated with IGF-I (500 ng/mL) alone or with an IGF-IR blocking antibody (5 µg/mL) for 24 hours (SP-53) or 36 hours (JeKo-1 and Mino) and apoptosis was measured using Annexin-V/FITC and PI labeling. MCL cells showed decrease in apoptosis. Effects of IGF-I on MCL cells were reversed when treated with IGF-IR blocking antibody. Untreated starved and unstarved cells (control) were used as controls. Results are shown as means ± SD.
42
Chapter III: Effects of inhibition of IGF-IR in
MCL
43
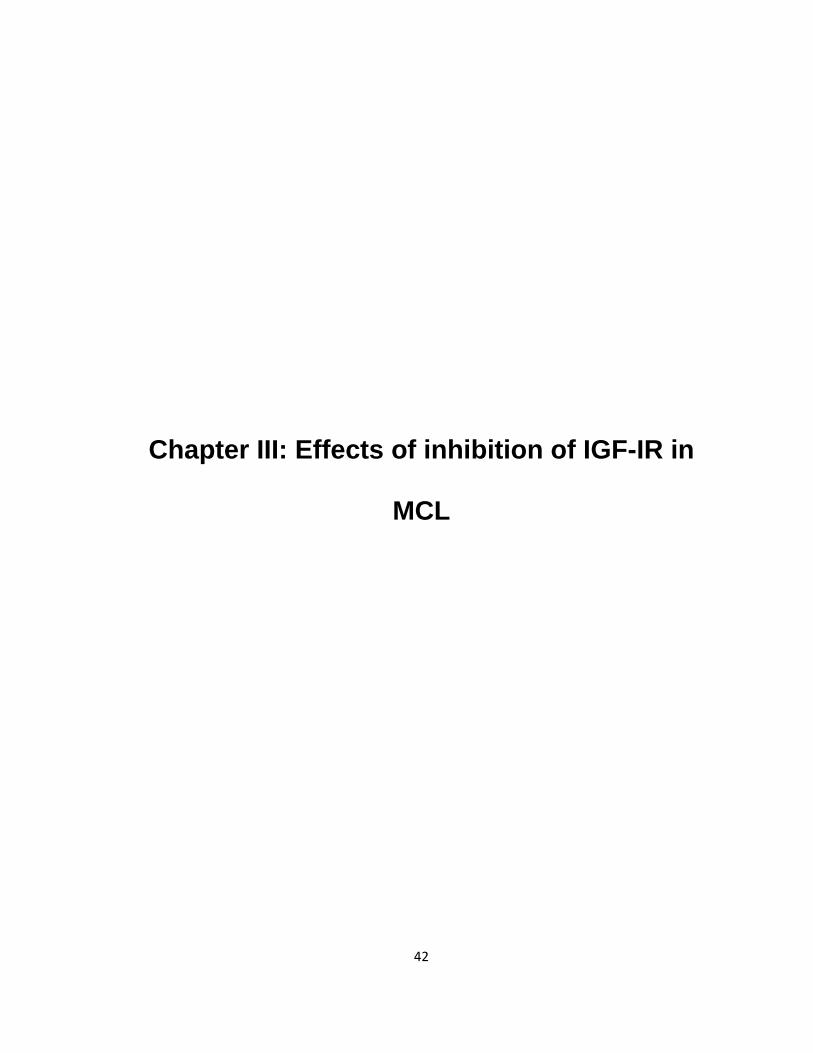
3.1 Inhibition of IGF-IR by PPP in MCL
To test whether IGF-IR is important for the survival of MCL cells, PPP, a selective
inhibitor of IGF-IR, was used. MCL cell line Mino was treated with 4 different
concentrations of PPP for 24 hours and 48 hours. Protein lysates were collected and
analyzed by Western blotting. PPP downregulated pIGF-IR in a concentration-dependent
manner at both time points without altering baseline IGF-IR expression levels and Mino is
shown as an example (Figure 15). Furthermore, tyrosine kinase activity also decreased in
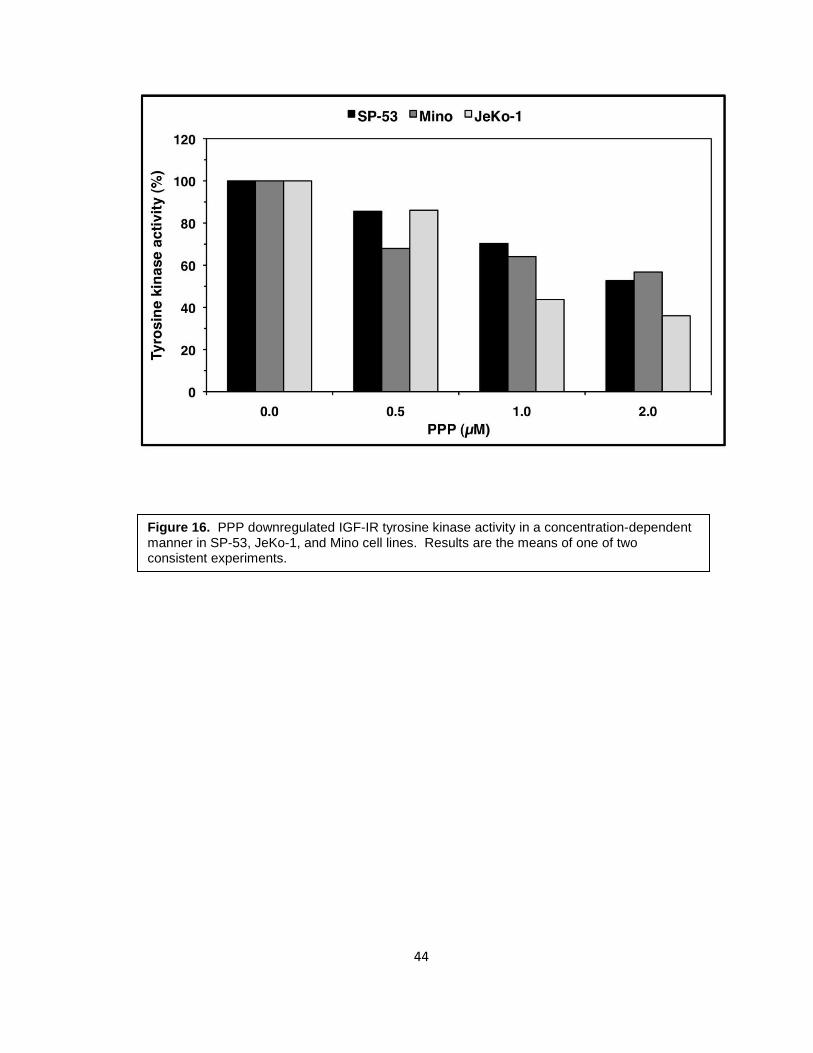
SP-53, JeKo-1, and Mino in a concentration-dependent manner (Figure 16).
Figure 15. PPP downregulated the activated form of IGF-IR (pIGF-IR) in a concentration-dependent manner at both 24 hours and 48 hours without altering baseline IGF-IR expression levels in Mino cells.
44
Figure 16. PPP downregulated IGF-IR tyrosine kinase activity in a concentration-dependent manner in SP-53, JeKo-1, and Mino cell lines. Results are the means of one of two consistent experiments.
45
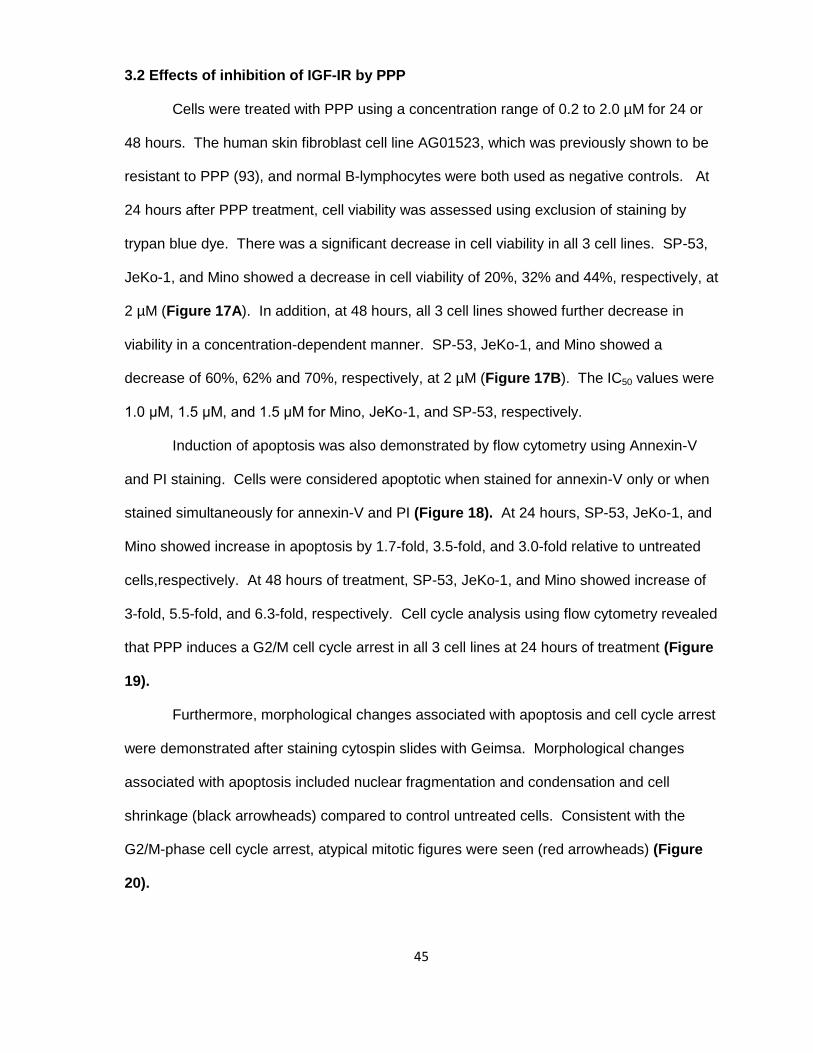
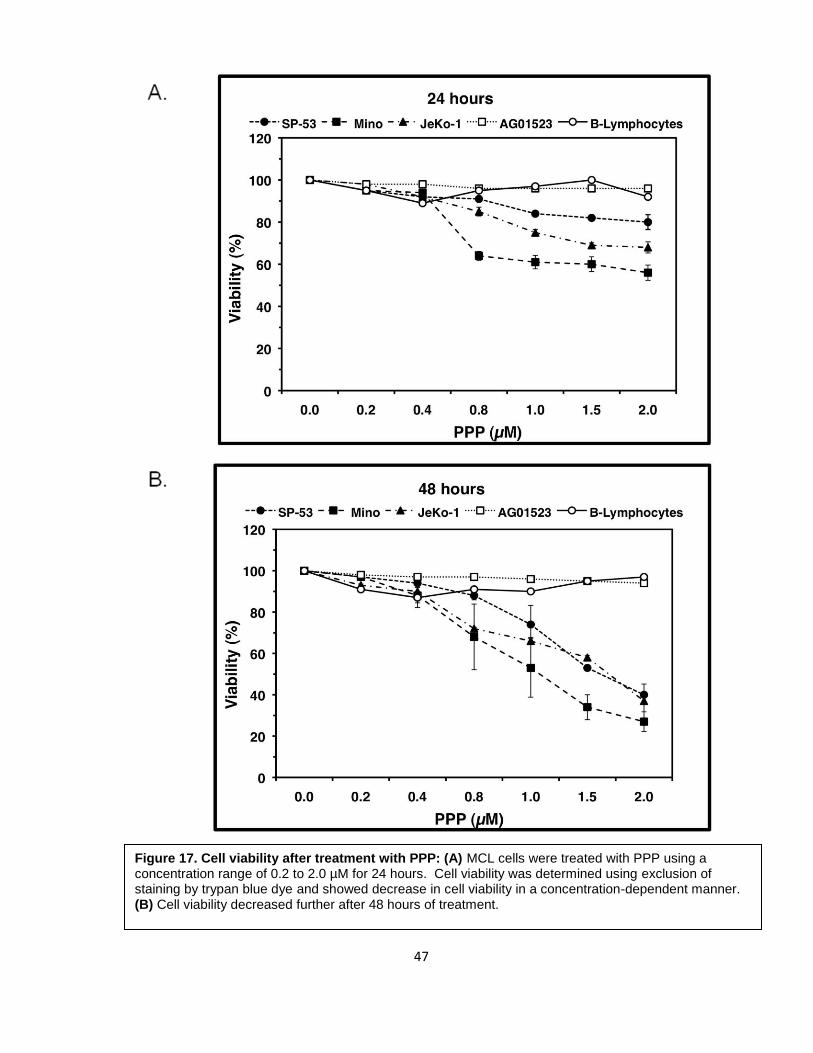
3.2 Effects of inhibition of IGF-IR by PPP
Cells were treated with PPP using a concentration range of 0.2 to 2.0 µM for 24 or
48 hours. The human skin fibroblast cell line AG01523, which was previously shown to be
resistant to PPP (93), and normal B-lymphocytes were both used as negative controls. At
24 hours after PPP treatment, cell viability was assessed using exclusion of staining by
trypan blue dye. There was a significant decrease in cell viability in all 3 cell lines. SP-53,
JeKo-1, and Mino showed a decrease in cell viability of 20%, 32% and 44%, respectively, at
2 µM (Figure 17A). In addition, at 48 hours, all 3 cell lines showed further decrease in
viability in a concentration-dependent manner. SP-53, JeKo-1, and Mino showed a
decrease of 60%, 62% and 70%, respectively, at 2 µM (Figure 17B). The IC50 values were
1.0 μM, 1.5 μM, and 1.5 μM for Mino, JeKo-1, and SP-53, respectively.
Induction of apoptosis was also demonstrated by flow cytometry using Annexin-V
and PI staining. Cells were considered apoptotic when stained for annexin-V only or when
stained simultaneously for annexin-V and PI (Figure 18). At 24 hours, SP-53, JeKo-1, and
Mino showed increase in apoptosis by 1.7-fold, 3.5-fold, and 3.0-fold relative to untreated
cells,respectively. At 48 hours of treatment, SP-53, JeKo-1, and Mino showed increase of
3-fold, 5.5-fold, and 6.3-fold, respectively. Cell cycle analysis using flow cytometry revealed
that PPP induces a G2/M cell cycle arrest in all 3 cell lines at 24 hours of treatment (Figure
19).
Furthermore, morphological changes associated with apoptosis and cell cycle arrest
were demonstrated after staining cytospin slides with Geimsa. Morphological changes
associated with apoptosis included nuclear fragmentation and condensation and cell
shrinkage (black arrowheads) compared to control untreated cells. Consistent with the
G2/M-phase cell cycle arrest, atypical mitotic figures were seen (red arrowheads) (Figure
20).
46
Cell proliferation was assessed using an MTS assay after PPP treatment for both 24
and 48 hours. After 24 hours, cell proliferation was significantly decreased by 66%, 37%,
and 54% for SP-53, JeKo-1, and Mino, respectively (Figure 21A). After 48 hours of
treatment, cell proliferation decreased further to 76%, 52%, and 62% of the control level, for
SP-53, JeKo-1, and Mino, respectively (Figure 21B).
47
Figure 17. Cell viability after treatment with PPP: (A) MCL cells were treated with PPP using a concentration range of 0.2 to 2.0 µM for 24 hours. Cell viability was determined using exclusion of staining by trypan blue dye and showed decrease in cell viability in a concentration-dependent manner. (B) Cell viability decreased further after 48 hours of treatment.
48
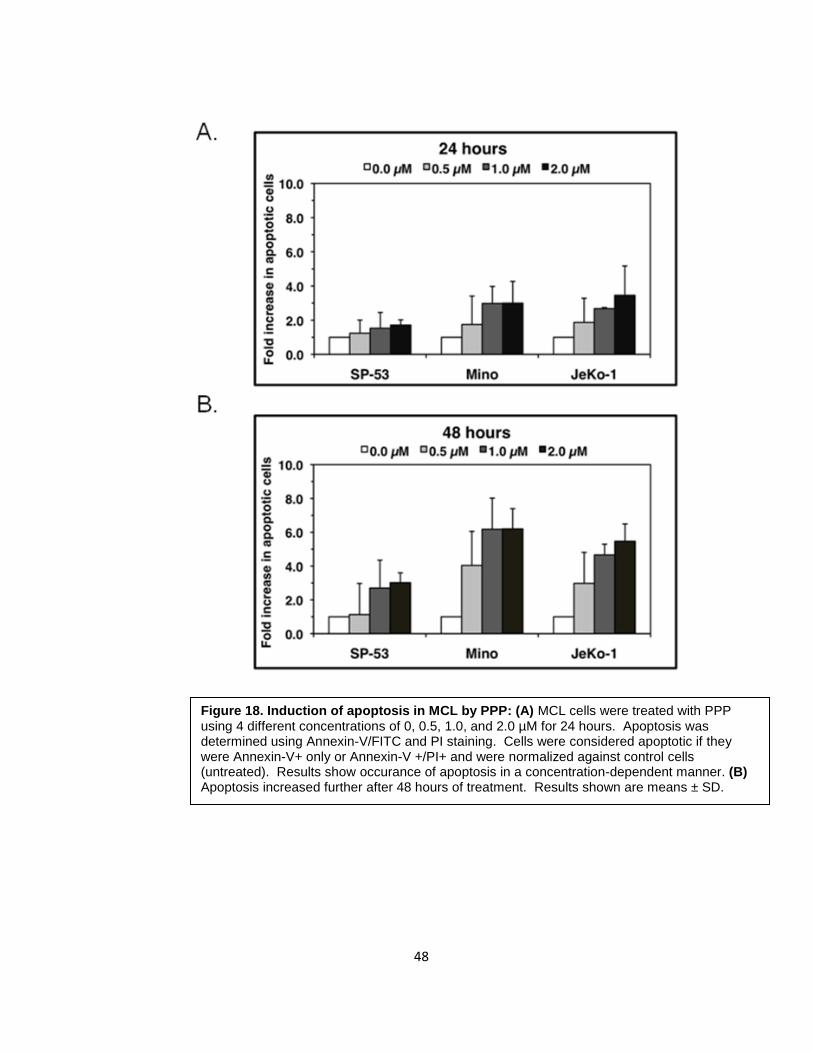
Figure 18. Induction of apoptosis in MCL by PPP: (A) MCL cells were treated with PPP using 4 different concentrations of 0, 0.5, 1.0, and 2.0 µM for 24 hours. Apoptosis was determined using Annexin-V/FITC and PI staining. Cells were considered apoptotic if they were Annexin-V+ only or Annexin-V +/PI+ and were normalized against control cells (untreated). Results show occurance of apoptosis in a concentration-dependent manner. (B) Apoptosis increased further after 48 hours of treatment. Results shown are means ± SD.
49
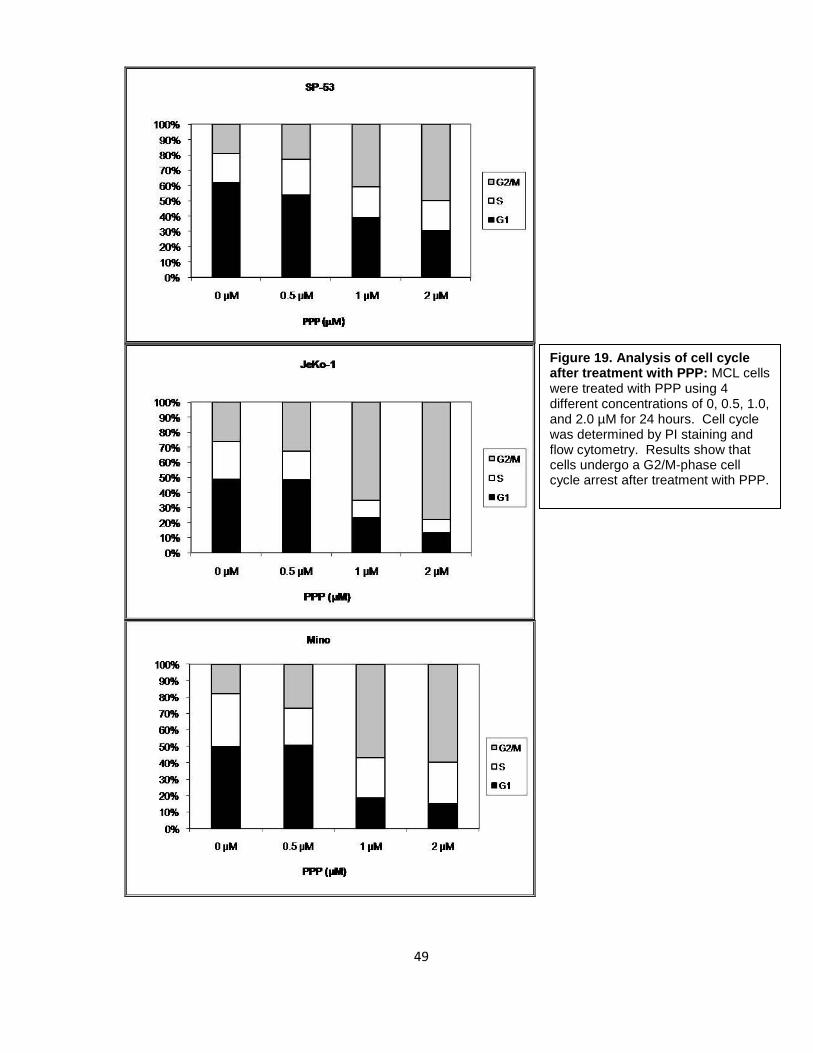
Figure 19. Analysis of cell cycle after treatment with PPP: MCL cells were treated with PPP using 4 different concentrations of 0, 0.5, 1.0, and 2.0 µM for 24 hours. Cell cycle was determined by PI staining and flow cytometry. Results show that cells undergo a G2/M-phase cell cycle arrest after treatment with PPP.
50
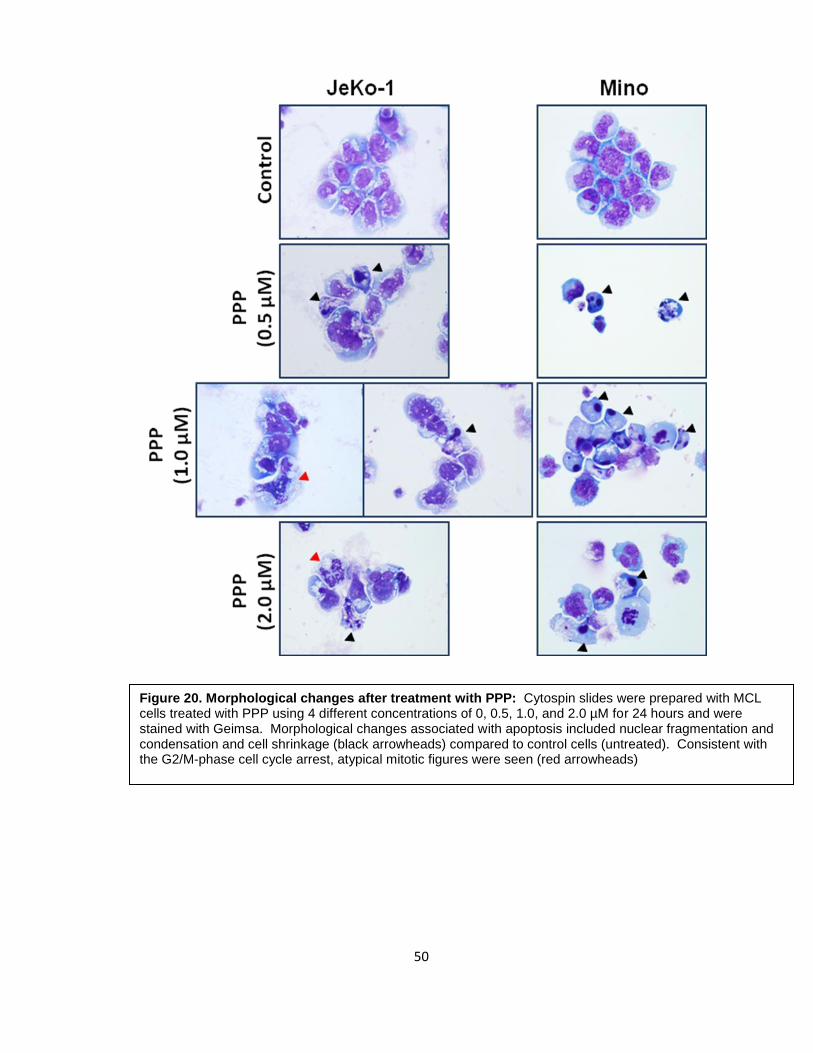
Figure 20. Morphological changes after treatment with PPP: Cytospin slides were prepared with MCL cells treated with PPP using 4 different concentrations of 0, 0.5, 1.0, and 2.0 µM for 24 hours and were stained with Geimsa. Morphological changes associated with apoptosis included nuclear fragmentation and condensation and cell shrinkage (black arrowheads) compared to control cells (untreated). Consistent with the G2/M-phase cell cycle arrest, atypical mitotic figures were seen (red arrowheads)
51
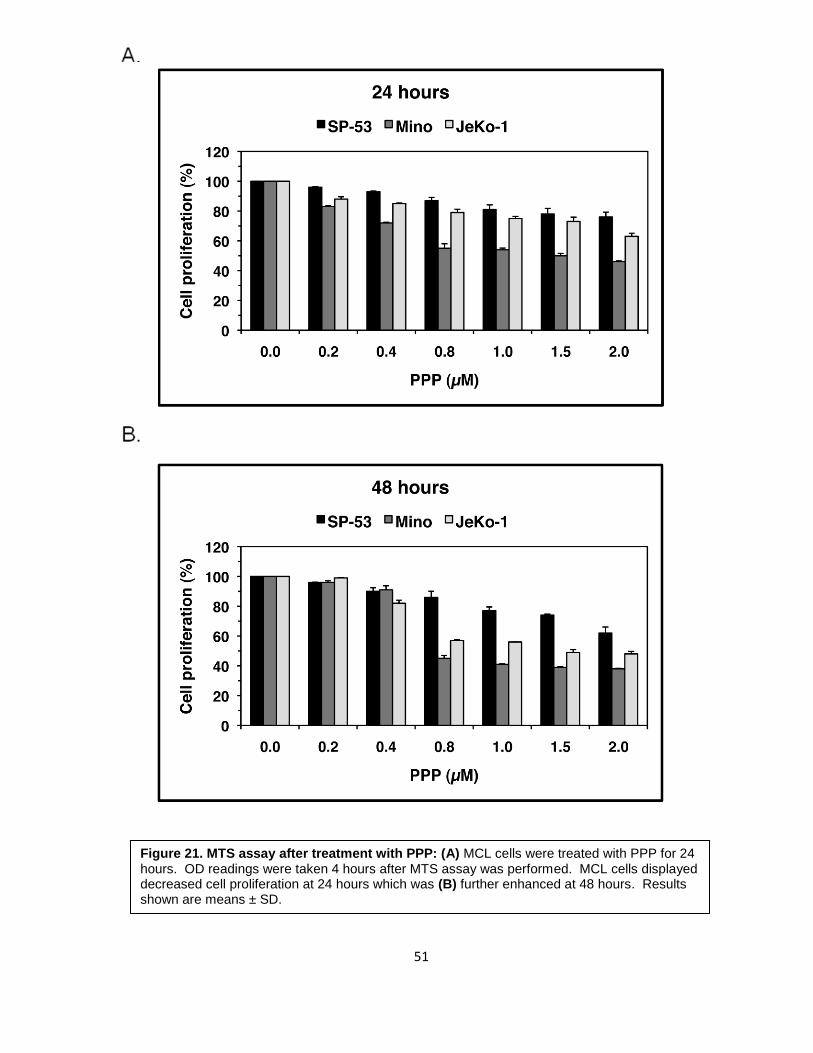
Figure 21. MTS assay after treatment with PPP: (A) MCL cells were treated with PPP for 24 hours. OD readings were taken 4 hours after MTS assay was performed. MCL cells displayed decreased cell proliferation at 24 hours which was (B) further enhanced at 48 hours. Results shown are means ± SD.
52
3.3 Biochemical effects of selective inhibition of IGF-IR by PPP
To determine the biochemical effects of inhibition of IGF-IR by PPP, we performed
Western blotting analysis of downstream targets of IGF-IR using Mino cell lysates. As
shown in Figure 22, PPP induced downregulation of phosphorylated Akt (pAkt) without
significantly altering its total protein levels. In addition, PPP also induced changes in cell
cycle regulatory proteins. We noticed an upregulation of cyclin B1 and downregulation of
pCdc2 which are consistent with the G2/M phase cell cycle arrest. Cleavage of pro-
apoptotic molecules including caspase-3 and PARP was also seen.
53
Figure 22. Downstream signaling changes associated with inhibition of IGF-IR by PPP: To assess changes in downstream signaling molecules after inhibition with PPP after 24 and 48 hours, Western blotting was utilized using Mino cell lysates. Results showed that PPP significantly downregulated phosphorylated Akt without significantly altering its total protein levels. PPP also induced changes in cell cycle regulatory proteins, including an upregulation of cyclin B1 and downregulation of pCdc2. Cleavage of pro-apoptotic molecules such as caspase-3 and PARP was also seen.
54
3.4 Biochemical effects of specific inhibition of IGF-IR by siRNA
Selective targeting using a small molecule inhibitor such as PPP can induce
nonspecific effects, therefore, experiments based on specific approaches to further confirm
the role of IGF-IR in MCL were performed using siRNA. Cells were treated with either
scrambled or IGF-IR siRNA for 24 and 48 hours. At 24 hours, there was considerable
knockdown of IGF-IR expression (Figure 23A). However, at 48 hours, there was significant
knockdown of IGF-IR (Figure 23B). IGF-IR siRNA significantly decreased pAkt and pJnk
protein kinases. There was significant downregulation of cyclin D1. Finally, there was
cleavage of pro-apoptotic molecules caspase-3 and PARP.
55
Figure 23. Downstream signaling changes associated with inhibition of IGF-IR by siRNA: (A) MCL cells were treated with either scrambled siRNA or IGF-IR siRNA for 24 hours. Moderate knockdown was observed in IGF-IR. (B) MCL cells were treated with scrambled or IGF-IR siRNA for 48 hours. Significant knockdown was observed in IGF-IR. IGF-IR siRNA significantly decreased oncogenic kinases pAkt and pJnk. There was downregulation of cyclin D1. Finally, there was cleavage of pro-apoptotic molecules such as caspase-3 and PARP.
A.
B.

56
Chapter IV: Discussion
57
IGF-IR and its primary ligand IGF-I have been shown to play a key role in the
establishment and progression of tumors. It has been well described that overexpression of
IGF-IR induces aberrant cell proliferation and malignant transformation in several cancers
such as those of the prostate, breast, lung, ovaries, and soft tissue (25, 48, 49, 55, 57).
Overexpressed IGF-IR can also protect cells from apoptosis in addition to promoting
metastasis and upregulating proteins involved in angiogenesis, such as VEGF (60, 86, 94,
95). Investigations conducted on IGF-IR in hematological malignancies (plasma cell
myeloma, leukemia, and lymphoma) are limited. To the best of our knowledge, most of the
work to date has been performed on plasma cell myeloma (68, 93, 94, 96-100). As
previously demonstrated in our lab, IGF-IR has shown oncogenic potential in chronic
myeloid leukemia and NPM-ALK expressing T-cell lymphoma (101, 102).
In the present study, we have attempted to provide evidence that IGF-IR has an
important role in maintaining the survival of mantle cell lymphoma (MCL) cells. We found
that IGF-IR is overexpressed in MCL cell lines (SP-53, JeKo-1, Mino, and Granta) when
compared to its expression in normal human CD19+ B-lymphocytes at both the mRNA and
protein levels. All these cell lines have been previously characterized (103). SP-53
seemed to display lower levels of expression compared to JeKo-1 and Mino. In these
experiments, the mouse fibroblast cell lines P6 and R- were used as positive and negative
controls, respectively. The P6 cell line is derived from BALB/c3T3 cells expressing a
human IGF-IR sequence (Cvn-IGF-lR) under the control of the simian virus 40 (SV40) large
T antigen promoter and therefore, is induced to overexpress IGF-IR (104, 105). R- is
another cell line derived from BALB/c3T3 cells that were originally developed in mice after
targeted ablation of IGF-IR (104, 105). R- was first discovered to be incapable of being
transformed by the SV40 large T antigen virus (105). While the R- cell line displayed no
IGF-IRα mRNA, it displayed very low expression of the IGF-IRβ subunit. Previous studies
conducted in our lab, as well as in others (59, 101, 102), have shown that some R-
58
subclones exhibit low levels of IGF-IRβ subunit; however, since it lacks the IGF-IRα
subunit, this low level of IGF-IRβ expression most likely has no functional implication.
Moreover, R- did not display any IGF-IR protein expression. Immunohistochemistry and
immunofluorescence revealed IGF-IR to be mostly localized in the cell membrane, with
some cytoplasmic staining in all 3 cell lines.
Although a mechanism of overexpression of IGF-IR in tumor cells has yet to be
elucidated, it has been previously shown that the number of IGF-IR molecules per cell plays
a key role in the transforming properties of IGF-IR. In fibroblasts, an IGF-IR number greater
than 20,000 per cell is needed to induce mitosis after stimulation with IGF-I (59). Similarly,
in MCF-7, the breast carcinoma cell line, IGF-I acquires mitogenic properties after the
number of IGF-IR has been increased by treatment with estrogen (106). It has also been
reported that in a pancreatic cell line model, an increase in receptor number from 40,000
receptors/cell to 100,000 receptors/cell is in the range required to enable IGF-I dependent
mitogenisis and therefore may be of central importance for pancreatic tumor growth control
(61). Based on these findings, it is concluded that only a small increment in the number of
IGF-IR molecules per cell can induce transformation of different types of tumor cells. In this
study, we analyzed relative antigen density of IGF-IR receptors per cell in MCL cell lines
without any exogenous stimulation by IGF-I (except IGF-I present in FBS). All 3 cell lines
displayed up to 400-fold higher number of IGF-IR molecules/cell relative to normal human
B-lymphoctyes. Consistent with our results showing mRNA and protein expression, SP-53
showed a lower number of receptors/cell compared to JeKo-1 and Mino.
Although overexpression of IGF-IR is an important feature for the transformation of
cells, it is not necessarily the sole contributor. Another important aspect is the status of
phosphorylation/activation in the receptors. Because we found overexpression of IGF-IR in
SP-53, JeKo-1, and Mino, we explored whether the receptor was phosphorylated/activated
in these cells. Immunoprecipitation revealed all 3 cell lines being phosphorylated; SP-53
59
having lower levels of phosphorylation relative to JeKo-1 and Mino. Since both
phosphorylation status and number of receptors/cell play important roles in maintaining the
transforming properties of IGF-IR, the interesting observation of SP-53 having lower
number of receptors/cell as well as lower phosphorylation status could possibly suggest
that the IGF-I-axis is not as functional as it may be in the other two MCL cell lines, JeKo-1
and Mino.
IGF-I is the primary ligand to IGF-IR. Previous studies have proposed both IGF-I-
dependent mechanisms through ligand-receptor interaction as well as IGF-I-independent
mechanisms through a constitutively active receptor (58, 107). In the IGF-I-dependent
mechanism, ligand binding results in the autophosphorylation of tyrosine residues in the β
subunit and activation of the kinase domain of IGF-IR, allowing for its substrates IRS-I or
Shc protein (among others) to bind. Binding of its substrates induces downstream signaling
cascades via PI3K/Akt and MAPK pathways (36). Therefore, we wanted to determine
whether the activation of IGF-IR in MCL cells was at least partially due to the release of
IGF-I. We tested the expression of IGF-I mRNA using RT-PCR and quantitative real time
PCR and found no apparent expression by either method. Therefore, paracrine stimulation,
for example through release of IGF-I from stromal cells, likely accounts for stimulation of
IGF-IR in MCL cells (107). Similarly, a high concentration of circulating IGF-I may facilitate
growth of MCL cells via IGF-IR as it has been previously documented in other types of
cancer (107). At this point, the status of circulating IGF-I levels in MCL patients is not
known.
Although MCL cells seem to lack autocrine release of IGF-I, we wanted to next
determine whether the cells would respond to exogenous addition of IGF-I and determine if
the IGF-IR signaling axis is indeed functional. When serum starved MCL cells were treated
with increasing concentrations of exogenous IGF-I, apoptosis decreased in comparison to
untreated starved and unstarved cells perhaps by IGF-I rescuing the MCL cells. This
60
suggests that IGF-IR can respond to IGF-I and that IGF-IR signaling axis is functional in
MCL. Importantly, the effects exerted by IGF-I were diminished upon addition of an IGF-IR
blocking antibody. This is especially important in ruling out the effects seen upon treatment
with IGF-I are being induced through the insulin receptor (IR). We also observed that cells
treated with IGF-I and anti-IGF-IR blocking antibody together exhibited more apoptosis than
that of the starved cells control. This may imply that the IGF-IR blocking antibody induces
some cytotoxic effects; however, these effects were less than 5% and therefore can be
considered negligible.
The significance of whether the functionality of IGF-IR is important for the survival of
MCL was demonstrated through experiments showing selective inhibition of the receptor
using the cyclolignan picropodophyllin, PPP. PPP has been shown to be an activation-loop
small molecule inhibitor of IGF-IR. In a very recent study, PPP was also found to be the
most efficient in killing uveal melanoma cells after oral administration in a SCID mouse
model (91). PPP was well tolerated by the animals and also decreased VEGF expression
in the tumors. It was demonstrated previously that PPP is an inhibitor of the IGF-IR
tyrosine phosphorylation and importantly it did not interfere with the highly homologous IR
(84, 90). It was shown that PPP did not selectively inhibit the IGF-IR tyrosine kinase at the
level of ATP binding. This suggests that it acted through suppression of other components,
such as at the level of receptor substrate. Although the effects of PPP on other kinases are
not completely known, our lab recently demonstrated that PPP does not affect BCR-ABL
phosphorylation level or tyrosine kinase activity (101) .
After treatment of MCL cells using an increasing concentration range of PPP, we
found reduced phosphorylated levels of IGF-IR in a concentration-dependent manner.
Furthermore, IGF-IR tyrosine kinase activity also decreased in a similar fashion. As
mentioned earlier, PPP has been shown to be an activation-loop small molecule inhibitor of
IGF-IR. IGF-IR, in its inactive state, contains the activation loop which houses the critical
61
tyrosine residues 1131, 1135, and 1136. Y1135 (being the first tyrosine to be
phosphorylated) in the activation loop is bound in a cis position and therefore prevents any
access by the substrates or ATP. After ligand binding, the three tyrosines of the activation
loop are phosphorylated to a trans position in the β subunit. Phosphorylation of Y1135 and
Y1131 destabilizes the autoinhibitory conformation of the activation loop, while
phosphorylation of Y1136 residue stabilizes the active conformation of IGF-IR (92). These
changes in the activation loop conformation allow for substrate and ATP binding and
subsequent activation of downstream signaling of IGF-IR. PPP is said to selectively inhibit
phosphorylation of Y1136 of the activation loop while refraining from Y1131 and Y1135.
Although there is a possibility that inhibition of Y1136 phosphorylation is insufficient to
completely eliminate total tyrosine activity of IGF-IR, the important feature to note is that the
lack of Y1136 itself may decrease the overall kinase activity of IGF-IR since Y1136
stabilizes IGF-IR and is therefore a necessity in obtaining full kinase activity (92).
When we sought to determine the effects of downregulation of IGF-IR signaling by
PPP, we found a decrease in cell viability, a decrease cell proliferation, induction of
apoptosis, and G2/M-phase cell cycle arrest in a concentration- dependent manner.
Additionally, we observed changes in downstream signaling proteins after PPP treatment.
To rule out the possibly of nonspecific effects of PPP, we also explored specific targeting of
IGF-IR using siRNA. Knockdown with IGF-IR siRNA confirmed the results obtained by PPP
inhibition regarding the changes to several key downstream signaling proteins that are
essential for MCL pathogenesis. In our study, MCL cells revealed downregulation of pAkt
after targeting IGF-IR, without significantly altering baseline expression or total protein.
Previous studies have shown that a single mutation in Y1136 of IGF-IR (Y1136F) almost
completely terminated the Akt phosphorylation and that Y1136F also reduced
phosphorylation of IRS-1, the IGF-IR substrate that induces the PI3K/Akt pathway. This
suggests that this residue is especially important for the PI3K/Akt pathway and that another
62
mode of downregulation of IGF-IR is through downregulation of pIRS-I after blockade of
Y1136 (87). Since IGF-IR also induces its effects through the MAPK pathway, we studied
proteins involved in this pathway. We observed decrease in pJnk, a member of the MAPK
group that is activated by phosphorylation on both threonine and tyrosine residues. Jnk
signaling pathway is said to be structurally similar to the Erk pathway and is activated by
the GTP binding protein Ras via Raf and MEK1 protein kinase cascade (108, 109).
Along with downregulation of activated forms of oncogenic kinases, there were
changes in apoptotic molecules as well. IGF-IR has previously been shown to inhibit
apoptosis by inhibiting release of cytochrome C through the activation of the PI3K/Akt
pathway (74, 75). Activated Akt can phosphorylate the pro-apoptotic protein Bad (74).
Upon phosphorylation, Bad is dissociated from anti-apoptotic Bcl-2, and becomes
temporarily controlled by the adaptor protein 14-3-3. If Bad is not phosphorylated, other pro-
apoptotic proteins, such as Bak and Bax, become activated and cause cytochrome C
release from mitochondria. In turn, caspase-9 and then caspase-3 become activated (75).
Activated caspase-3 can cleave and inactivate, for example, the poly(ADP-ribose)
polymerase (PARP), which normally functions in DNA repair and programmed cell death
(75) and this results in extensive degradation of DNA at the final steps in the apoptotic
process. Although we saw a downregulation of pAkt, we did not see any changes in anti-
apoptotic molecules Bcl-2 and Bcl-xL (data not shown). However, we did see cleavage of
caspase-3 and PARP. In addition, siRNA confirmed the activation of the pro-apoptotic
molecules that was observed with PPP treatment.
Finally, we detected changes in cell cycle regulatory molecules, including those
involved in the G2/M-phase cell cycle arrest. It has previously been shown that PPP exerts
cell cycle arrest at this stage (93, 101, 102). IGF-IR can regulate cell cycle progression at
several phases, but its major direct role is seen at the earlier stages of the cell cycle. It can
exert its effects at the G0/G1 phase through the activation of p70 S6K, a protein Ser-Thr
63
kinase that phosphorylates the S6 ribosomal subunit necessary for entry into the next
phase of the cell cycle (69). In the G1/S phase, IGF-IR can increase cyclin D1 and CDK4
gene expression primarily through the PI3K/Akt and/or ERK pathways, leading to
inactivation of Rb1 protein, allowing E2F transcription factors to be released (69) . Finally
at the G2/M-phase, it has been shown that IGF-IR can regulate cyclins A and B as well as
promote synthesis of Cdc2 (69) . In our study, we found downregulation of pCdc2 and a
simultaneous upregulation of cyclin B1. In a normal cell, cyclin B1 is a regulatory protein
having roles in mitosis. It complexes with p34(cdc2) to form the maturation-promoting factor
(MPF) that induces entry into the G2/M phase of the cell cycle. Throughout the cell cycle,
cyclin B1 accumulates but is only activated after dephosphorylation by the phosphotase
Cdc25. It is degraded at the end of mitosis and accumulates again during the next cell
cycle (110). The changes in these proteins we observed in our study might imply an
interference between cyclin B1 and pCdc2. Effects of inhibition of IGF-IR by PPP probably
induces dephosphorylation of Cdc2 and in turn prevents cyclin B1 from forming the MPF
complex, causing it to accumulate and render G2/M phase cell cycle arrest.
A recent study showed the differential effects of A12, an anti-IGF-IR antibody, on cell cycle
in androgen-dependent (AD) and androgen-independent (AI) prostate cancer (111). It was
demonstrated that A12 induced a G1-phase cell cycle arrest in AD tumors and a G2/M-
phase cell cycle arrest in AI prostate tumors, testifying to the fact that IGF-IR inhibition can
result in cell cycle arrest at any phase of the cell cycle. Previously in our lab, we also
demonstrated decrease in cyclin E, another G1/S-phase regulator, after treating chronic
myeloid leukemia cell lines with PPP (101). In spite of evidence to support regulation of the
early stages of the cell cycle by IGF-IR, it was interesting to find only a G2/M-phase cell
cycle arrest after inhibition with PPP in our study. One explanation might be the possibility
of PPP inducing a G2/M-phase cell cycle arrest independent of IGF-IR through
mechanisms that are still not fully understood. Another explanation may be that proteins
64
involved in regulating the early and later stages of the cell cycle maintain a specific balance
in activity that is required for proper cell cycle progression. In our study, after inhibiting IGF-
IR we saw downregulation of cyclin D1, the key cell cycle regulatory molecule that is
upregulated in MCL due to the t(11;14)(q13;q32) translocation. This data might suggest
that a decrease in expression of proteins involved in earlier phases of the cell cycle might
disrupt the normal balance, resulting in the accumulation of G2/M-phase regulatory
proteins. In addition, the loss in interaction between G2/M-phase regulatory proteins, such
as cyclin B1 and Cdc2, may also contribute to the final arrest at the later phase of the cell
cycle. As previously mentioned, IGF-IR regulates the G2/M-phase by promoting synthesis
of Cdc2. The effects of apoptosis and cell cycle arrest were consistent with the
morphological changes observed by Geimsa staining of MCL cells after treatment with
PPP, showing nuclear fragmentation, cell shrinkage, and increase in abnormal mitotic
figures.
In conclusion, we provide evidence to show that IGF-IR plays an important role in
maintaining the survival of MCL. Interestingly, the experiments showed SP-53 to be
generally the more resistant cell line and JeKo-1 and Mino to be the more sensitive cell
lines to the inhibition of IGF-IR. This could perhaps be linked to the lower expression and
phosphorylation of IGF-IR in SP-53. The lower expression levels may not be sufficient to
fully utilize the IGF-IR axis and therefore, SP-53 cells do not respond as prominently as the
other two cell lines, JeKo-1 and Mino to inhibition of IGF-IR. We found that inhibition of
IGF-IR induces cell death in MCL cell lines possibly through downregulation of
phosphorylation of Akt, Jnk, and cyclin D1 and disrupting the interactions between cell cycle
regulating complex cyclin B1/Cdc2 to result in a G2/M-phase cell cycle arrest. In addition,
inhibition of IGF-IR facilitates the cleavage, and thus the activation of pro-apoptotic
molecules such as caspase -3 and PARP. Taken together, our studies suggest that IGF-IR

65
plays a role in the pathogenesis of MCL and therefore, it might represent a potential
therapeutic target that could be utilized in treating MCL in the future.

66
Chapter V: Methods and Materials
67
Cell lines:
Four characterized MCL cell lines were used in this study including SP-53, Mino, JeKo-1,
and Granta 519 (103). The P6 (mouse BALB/c3T3 fibroblasts overexpressing human IGF-
IR) and R- (mouse 3T3-like fibroblasts with targeted ablation of Igf1r) cell lines were a
generous gift from Dr. R. Baserga (Thomas Jefferson University, Philadelphia, PA) and
were used as positive and negative controls for experiments showing expression of IGF-IR,
respectively (101, 102, 104, 105). In some experiments, the ALK+ ALCL cell line Karpas
299 was used additionally as a positive control for the expression of IGF-IR (102). The
normal human skin fibroblast cell line AG01523 (Coriell Institute for Medical Research,
Camden, NJ) was used as a negative control for PPP treatment experiments (93). MCL
cell lines were maintained in Roswell Park Memorial Institute 1640 (RPMI 1640) medium
(HyClone, South Logan, Utah) supplemented with 15% fetal bovine serum (FBS; Sigma, St.
Louis, MO), glutamine (2 mM), penicillin (100 U/ml), and streptomycin (100 µg/ml) at 37°C
in a humidified 5% CO2 in air chamber. Dulbecco’s Modified Eagle Medium (DMEM) (P6
and R-), RPMI (Karpas 299), or Minimum Essential Medium (Eagle) in Earle BSS (EEMEM)
(AG01523) supplemented with 10% FBS were used to culture the cells under the same
above conditions.
Antibodies:
Antibodies used from Santa Cruz Biotechnology (Santa Cruz, CA) included cyclin B1 (sc-
7393), Cdc2 (sc-52316), pCdc2 (Thr14/Tyr15;sc-12340-R), and p-Tyr (PY99; sc-7020);
from Cell Signaling Technology (Danvers, MA) were Akt (9272), and pAkt (Ser473; 9271S),
caspase-3 (total) (9668), caspase-3 (cleaved) (9661), pJnk (9255), and Jnk (9252); from
Zymed Laboratories (South San Francisco, CA) was IGF-IRβ (39-6700); from Sigma (St.
Louis, MO) was β-actin (A-2228); from BD Biosciences (San Jose, California) were PARP
(total) (556362), PARP (cleaved) (552596).
68
Treatments:
The cyclolignan picropodophyllin (PPP) was purchased from Calbiochem (Gibbstown, NJ,
catalog # 407247). PPP was prepared and dissolved in ethanol to a final concentration of
0.5 mM (amount of ethanol was less than 0.4% by volume and therefore had no affect on
treated cells).
For treatment of MCL cell lines with PPP, cells were incubated at 37°C in 5% CO2 in
humidified air. Cells were collected, centrifuged at 300x g, washed twice in sterile 1x PBS,
and seeded at concentrations appropriate for experiment. PPP was added at
concentrations ranging from 0.2-2 µM for 24 hours or 48 hours. As a negative control,
untreated cells were seeded for each concentration simultaneously.
For IGF-IR knockdown experiments with siRNA, specific targeting of IGF-IR was achieved
by transient transfection with SMARTpool designed siRNA (mixture of 4 different
constructs) (Dharmacon, Lafayette, CO, M-003012-04). The siCONTROL Non-Targeting
siRNA was used as a negative control (Dharmacon, Lafayette, CO, D-001206-13-20).
Transfection of the cells by siRNA was performed using the Nucleofector “R” solution for
JeKo-1 or “T” solution for Mino and SP-53 as recommended by the manufacturer (Amaxa
Biosystems; A-023 program for JeKo-1, T-001 for Mino, and O-017 for SP-53). Briefly, 2 x
106 cells per nucleofection sample was resuspended in appropriate nucleofector solution at
a final concentration of 2 x 10⁶ cells/100 µl. 20 µM IGF-IR siRNA or 20 µM scramble siRNA
were added to the mixture. The mixture was placed in a cuvette and electroporation was
performed using an Amaxa electroporation system (Basel, Switzerland, catalog #AAD-
1001). Once electroporation was complete, the mixture was transferred into a 6-well plate
containing 500 µl of pre-warmed RPMI 1640 supplemented with 15% FBS. Cells were
69
incubated for 24 hours or 48 hours after transfection at 37°C in a humidified 5% CO2 in air
chamber.
The response of MCL cells to IGF-I was detected by cell viability. Because IGF-I is present
in FBS, 4.0 × 10⁵ cells/mL were collected by centrifugation, washed once with 1x sterile
PBS, and maintained in serum-free medium. Simultaneously, cells were treated with 500
ng/mL of IGF-I (291-G1-050; R&D systems) with or without an anti-IGF-IR blocking
antibody at a concentration of 5 µg/mLfor 24 hours. Immediately thereafter, cell viability
was analyzed using exclusion of staining by trypan blue dye.
Exclusion of staining by trypan blue dye assay:
Cell viability was measured using exclusion of staining by trypan blue dye. Approximately,
100 µl of cells were mixed with equal volume trypan blue and resuspended. 10 µl of
resuspended cells were analyzed using a hemocytometer.
Reverse transcriptase polymerase chain reaction (RT-PCR):
RT-PCR was used to determine the expression of IGF-IR mRNA. Total RNA was isolated
and purified using RNAeasy Mini Kit (Qiagen, Valencia, CA). Briefly, 1 x10⁶ cells were
collected by centrifugation at 300x g for 5 minutes, washed twice in sterile 1x PBS, and
subjected to lysis and homogenization by RLT buffer (RNA Lysis Buffer). Homogenized
cells were passed through provided spin columns and washed once with 70% ethanol. Two
additional washing steps were performed with appropriate buffers. Total RNA was
collected upon elution with RNAse-free water. Optical density readings were read using
DNA/Protein Analyzer (Beckman Coulter, Fullerton, CA)
70
Reverse transcription was performed through a two-step procedure using ThermoScript RT
protocol (Invitrogen, Carlsbad, CA). Approximately 0.3 µg total RNA was used for reverse
transcription. First, total RNA, oligo (dT), and dNTP mix were added to a mixture that was
adjusted to a final volume of 12 µl with DEPC-treated water. RNA mixture and primer was
denatured by incubating at 65°C for 5 min and then placed on ice. Second, a master
reaction mix consisting of 5x cDNA synthesis buffer, 0.1 DTT, RNaseOUT, Thermoscript
RT, and DEPC-treated water was prepared on ice and vortexed gently. Approximately 8 µl
of reaction mix was pipeted into each reaction tube on ice bringing final volume to 20 µl.
The samples were then transferred to a thermal cycler preheated to the appropriate cDNA
synthesis temperature and incubated for 60 minutes at 50°C, then terminated at 85°C for 5
minutes. 1 μl of RNase H was added and incubated at 37°C for 20 min. 20 µl PCR
reactions were performed using HotStar Master Mix kit (Qiagen).
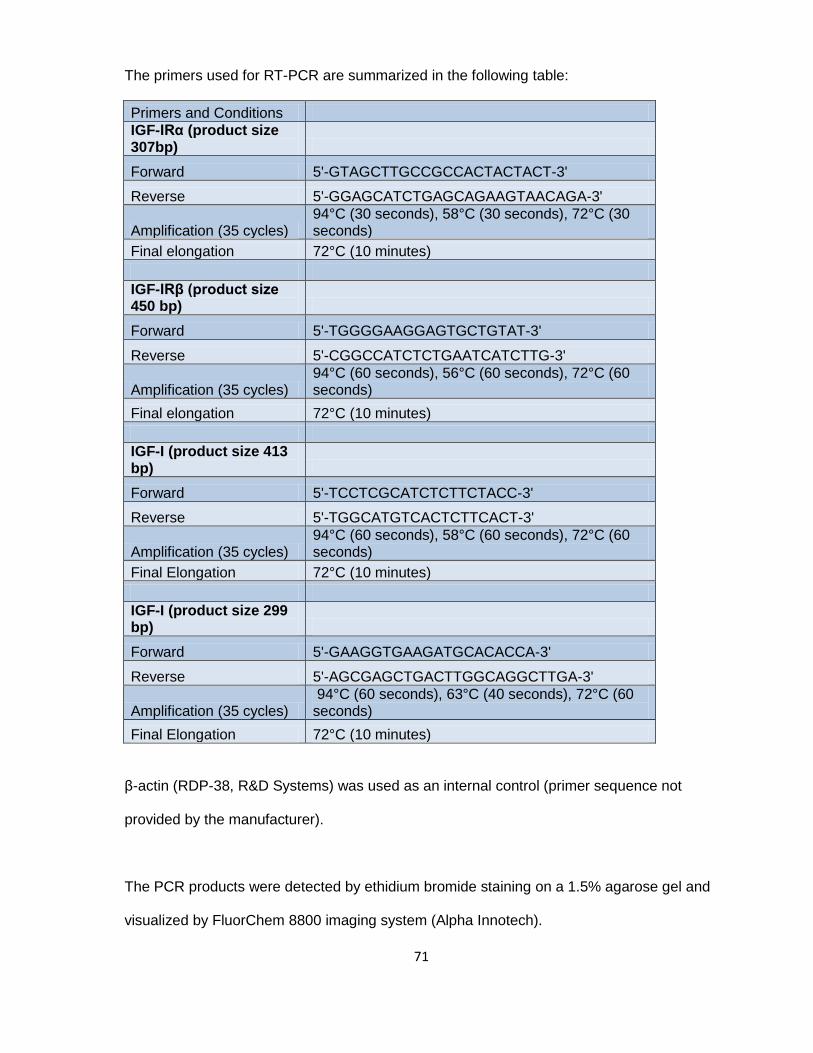
71
The primers used for RT-PCR are summarized in the following table:
Primers and Conditions
IGF-IRα (product size 307bp)
Forward 5'-GTAGCTTGCCGCCACTACTACT-3'
Reverse 5'-GGAGCATCTGAGCAGAAGTAACAGA-3'
Amplification (35 cycles) 94°C (30 seconds), 58°C (30 seconds), 72°C (30 seconds)
Final elongation 72°C (10 minutes)
IGF-IRβ (product size 450 bp)
Forward 5'-TGGGGAAGGAGTGCTGTAT-3'
Reverse 5'-CGGCCATCTCTGAATCATCTTG-3'
Amplification (35 cycles) 94°C (60 seconds), 56°C (60 seconds), 72°C (60 seconds)
Final elongation 72°C (10 minutes)
IGF-I (product size 413 bp)
Forward 5'-TCCTCGCATCTCTTCTACC-3'
Reverse 5'-TGGCATGTCACTCTTCACT-3'
Amplification (35 cycles) 94°C (60 seconds), 58°C (60 seconds), 72°C (60 seconds)
Final Elongation 72°C (10 minutes)
IGF-I (product size 299 bp)
Forward 5'-GAAGGTGAAGATGCACACCA-3'
Reverse 5'-AGCGAGCTGACTTGGCAGGCTTGA-3'
Amplification (35 cycles) 94°C (60 seconds), 63°C (40 seconds), 72°C (60 seconds)
Final Elongation 72°C (10 minutes)
β-actin (RDP-38, R&D Systems) was used as an internal control (primer sequence not
provided by the manufacturer).
The PCR products were detected by ethidium bromide staining on a 1.5% agarose gel and
visualized by FluorChem 8800 imaging system (Alpha Innotech).
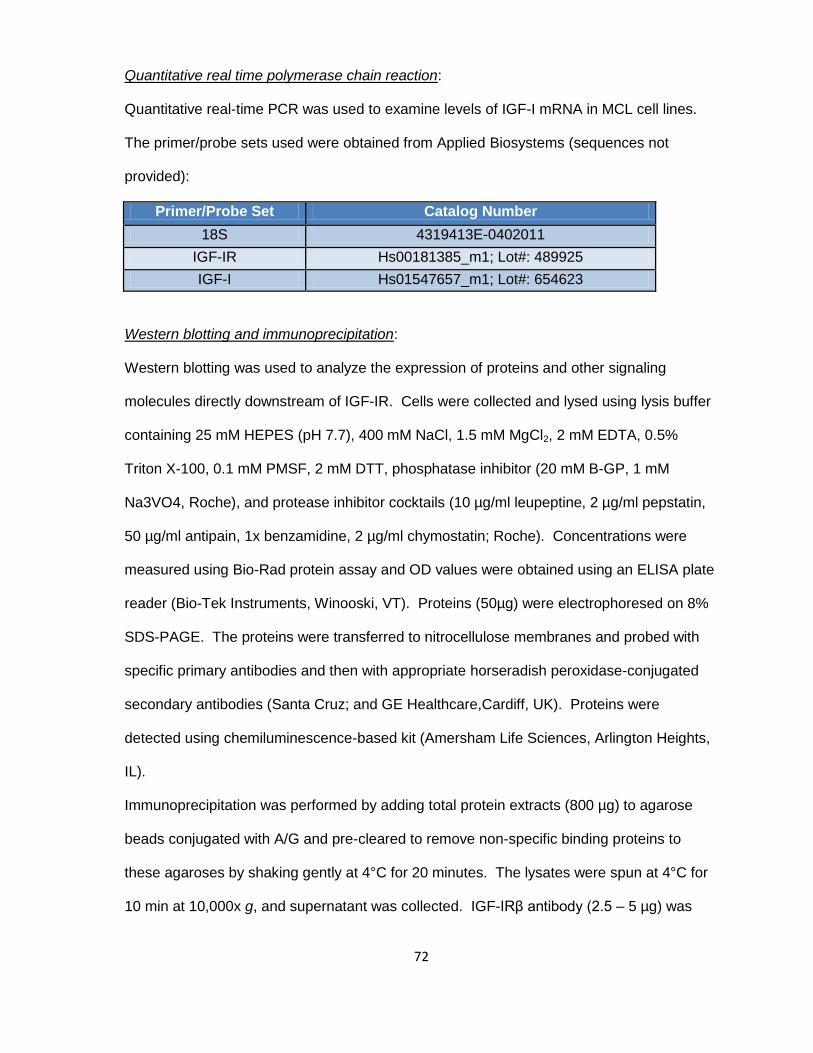
72
Quantitative real time polymerase chain reaction:
Quantitative real-time PCR was used to examine levels of IGF-I mRNA in MCL cell lines.
The primer/probe sets used were obtained from Applied Biosystems (sequences not
provided):
Primer/Probe Set Catalog Number
18S 4319413E-0402011
IGF-IR Hs00181385_m1; Lot#: 489925
IGF-I Hs01547657_m1; Lot#: 654623
Western blotting and immunoprecipitation:
Western blotting was used to analyze the expression of proteins and other signaling
molecules directly downstream of IGF-IR. Cells were collected and lysed using lysis buffer
containing 25 mM HEPES (pH 7.7), 400 mM NaCl, 1.5 mM MgCl2, 2 mM EDTA, 0.5%
Triton X-100, 0.1 mM PMSF, 2 mM DTT, phosphatase inhibitor (20 mM B-GP, 1 mM
Na3VO4, Roche), and protease inhibitor cocktails (10 µg/ml leupeptine, 2 µg/ml pepstatin,
50 µg/ml antipain, 1x benzamidine, 2 µg/ml chymostatin; Roche). Concentrations were
measured using Bio-Rad protein assay and OD values were obtained using an ELISA plate
reader (Bio-Tek Instruments, Winooski, VT). Proteins (50µg) were electrophoresed on 8%
SDS-PAGE. The proteins were transferred to nitrocellulose membranes and probed with
specific primary antibodies and then with appropriate horseradish peroxidase-conjugated
secondary antibodies (Santa Cruz; and GE Healthcare,Cardiff, UK). Proteins were
detected using chemiluminescence-based kit (Amersham Life Sciences, Arlington Heights,
IL).
Immunoprecipitation was performed by adding total protein extracts (800 µg) to agarose
beads conjugated with A/G and pre-cleared to remove non-specific binding proteins to
these agaroses by shaking gently at 4°C for 20 minutes. The lysates were spun at 4°C for
10 min at 10,000x g, and supernatant was collected. IGF-IRβ antibody (2.5 – 5 µg) was
73
added to supernatant and incubated overnight at 4°C. Agarose beads conjugated with A/G
were then added to the supernatant and incubated additionally for 4 hours at 4°C. The
lysates were spun at 4°C for 1 minute at 10,000x g and supernatant was removed. The
beads were washed 3 times with cold 1x PBS and once with lysis buffer, and then
subjected to SDS-PAGE. The membrane was subsequently stained with anti-p-Tyr
antibody or IGF-IR antibody.
Flow Cytometry:
Quantitative analysis of IGF-IR expression by assessing relative antigen density of IGF-IR
(FACscan, BD Pharmingen, San Jose, CA) was performed using flow cytometry and the
QuantiBrite PE kit (BD Biosciences, Franklin Lakes, NJ). Briefly, 1x10⁶ cells were
collected, washed once 1x PBS, and incubated for 30 minutes at room temperature in the
dark with either PE-labeled anti-human IGF-IR antibody (555999; BD Biosciences, San
Jose, CA) or PE-labeled anti-mouse IgG1 isotype control (555749; BD Biosciences). Cells
were then washed twice with ice cold 1x PBS and subjected to immediate analysis by
CELLQuest™ software (BD Immunocytometry Systems, Oakville, Ontario, Canada).
Calibration beads were first reconstituted using 0.5 mL PBS with 0.5% BSA and vortexed.
Calibration and regression analysis were performed using the QuantiBrite beads and the
parameters were adjusted appropriately for cellular assay. Data acquisition was performed
using these same settings. PE-conjugated IGF-IR molecules per cell were manually
calculated considering that the PE: mAb ratio was 1:1 using Excel according to the
manufacturer’s instructions.
Apoptosis was determined using flow cytometry analysis (FACscan, BD Pharmingen, San
Jose, CA) after staining the cells with annexin V-FITC and propidium iodide (PI) (BD
74
Pharmingen) and cell cycle analysis was examined using CycleTEST PLUS DNA reagent
kit (BD, Pharmingen).
Immunohistochemistry:
Immunohistochemical techniques using DakoCytomation kit (DakoCytomation, Carpinteria,
CA) were performed on formalin-fixed paraffin embedded sections obtained from cell blocks
of cell lines. Briefly, sections were deparaffinized by incubating the slides in:
1. Xylene (2 x 5 min)
2. 100% Ethanol (3 x 5 min)
3. 95% Ethanol (3 x 5 min)
4. 80% Ethanol (3 x 5 min)
After washing in 1x PBS twice, slides were placed in pre-warmed retrieval solution
(provided in kit) in a steamer for 45 minutes. Tissue was incubated with hydrogen peroxide
for 15 minutes at room temperature, and then subjected to washing three times with PBS
for 5 minutes each. Slides were then blocked with blocking buffer for 30 minutes and
incubated overnight at 4°C with IGF-IRβ antibody at a dilution of 1:30 diluted in same
blocking buffer. Sequentially, slides were washed 3 times for 10 minutes and incubated
with secondary antibody LINK and then with secondary antibody Streptavidin each for 30
minutes. Slides were then developed with 3,3´-diaminodbenzidine tetrahydrochloride
substrate kit (DAB) that includes horseradish peroxidase enzyme (HRP) for 4 minutes and
hematoxylin was used for counter staining. Photomicrographs were obtained using a Nikon
Microphot FXA microscope (Nikon Instruments, Melville, NY) and an Olympus DP70
camera (Olympus America, Melville, NY).
75
Microscopy:
Cytospins for morphological studies were prepared using approximately 100,000 cells
loaded into cytospin machine (Shannon Cytospin, Medway, MA). Slides were further
stained with Giemsa and examined by light microscopy (Olympus, Center Valley, PA) to
confirm morphological changes correlating with apoptosis and cell cycle arrest.
For confocal laser-scanning electron microscopy, cytospin slides (MCL cells, R- and
Karpas 299) were washed once with PBS and subjected to a fixation-permeabilization step
in 4% paraformaldehyde for 20 minutes, followed by 20 minutes in 0.1% Triton X-100 at
room temperature. After blocking with 10% FBS in PBS for 45 minutes, cells were
incubated with a rabbit anti–IGF-IRβ antibody (1:100) overnight at 4°C and stained for 90
min with secondary Cy3-conjµgated anti-rabbit IgG (1:800) (Jackson ImmunoResearch
Laboratories, West Grove, PA). Images were visualized by confocal laser-scanning
microscopy (LSM 510; Carl Zeiss MicroImaging, Thornwood, NY).
Tyrosine Kinase Activity:
Tyrosine kinase activity was measured using Universal Tyrosine Kinase Assay Kit (Takara
Bio Inc, Pittsburg, PA). First, samples were prepared by collecting approximately 3 x 10⁶
cells by centrifugation, washing once with PBS for 5 minutes at 300x g to recover as a
pellet. 1 ml of extraction buffer (provided in the kit) was used to resuspend the pellet. The
mixture was spun for 10 minutes at 4°C at 10,000x g, and the recovered supernatant was
used as the sample. Using prepared cell lysates, the specific antibody for IGF-IRβ was
used for the following immunoprecipitation steps. Agarose beads conjugated with protein
A/G were added and immunoprecipitated. 150 µl of Kinase reaction solution including 2-
mercaptoethanol was added and resuspended. This suspension was used as the samples
for the measurement of PTK activity at 50 µl/ well. In order to start the phosphorylation
process of tyrosine, approximately 10 µl of 40 mM ATP-2Na solution was added to 40 µl of
76
sample in a 96 well plate and incubated for 30 minutes at 37°C. The wells were washed 4
times with washing buffer provided in kit. Sequentially, the samples were blocked with
blocking buffer for 30 minutes at 37°C. Immediately following, the anti-p-Tyr (PY20)-HRP
antibody (provided with the kit) was added to the well and incubated at 37°C for 30 minutes.
Upon washing the wells 4 times with wash buffer, 100µl of HRP substrate solution
Tetramethylbenzidine (TMBZ ) was added for 15 minutes at 37°C. The reaction was then
stopped with stop solution (1N H2SO4 ) and OD readings were measured at 450 nm
wavelength using an ELISA plate reader.
MTS assay:
Cell proliferation was evaluated by CellTiter 96® AQueous One Solution Cell Proliferation
Assay (MTS) kit (Promega). MCL cells were seeded in 96 well plates at a concentration of
10,000 cells/well in 100 µl of RPMI supplemented with 20% FBS. 20 µl of MTS reagent
was added and then incubated at 37°C in a humidified 5% CO2 in-air chamber for
approximately 4 hours. OD measurements were obtained using an ELISA plate reader.

77
Chapter VI: References
78
1. Fernandez, V., E. Hartmann, G. Ott, E. Campo, and A. Rosenwald. 2005.
Pathogenesis of mantle-cell lymphoma: all oncogenic roads lead to dysregulation of
cell cycle and DNA damage response pathways. J Clin Oncol 23:6364-6369.
2. Johnson, K., K. L. Reddy, and H. Singh. 2009. Molecular pathways and
mechanisms regulating the recombination of immunoglobulin genes during B-
lymphocyte development. Adv Exp Med Biol 650:133-147.
3. Jares, P., D. Colomer, and E. Campo. 2007. Genetic and molecular pathogenesis of
mantle cell lymphoma: perspectives for new targeted therapeutics. Nat Rev Cancer
7:750-762.
4. Zvara, A., L. Hackler, Jr., Z. B. Nagy, T. Micsik, and L. G. Puskas. 2002. New
molecular methods for classification, diagnosis and therapy prediction of
hematological malignancies. Pathol Oncol Res 8:231-240.
5. Simpson, J. F., D. E. Quan, F. O'Malley, T. Odom-Maryon, and P. E. Clarke. 1997.
Amplification of CCND1 and expression of its protein product, cyclin D1, in ductal
carcinoma in situ of the breast. Am J Pathol 151:161-168.
6. Betticher, D. C., J. Heighway, P. S. Hasleton, H. J. Altermatt, W. D. Ryder, T. Cerny,
and N. Thatcher. 1996. Prognostic significance of CCND1 (cyclin D1)
overexpression in primary resected non-small-cell lung cancer. Br J Cancer 73:294-
300.
7. Sukov, W. R., R. P. Ketterling, D. J. Lager, A. W. Carlson, J. P. Sinnwell, G. K.
Chow, R. B. Jenkins, and J. C. Cheville. 2009. CCND1 rearrangements and cyclin
D1 overexpression in renal oncocytomas: frequency, clinicopathologic features, and
utility in differentiation from chromophobe renal cell carcinoma. Hum Pathol
40:1296-1303.
79
8. Kim, S. H., J. J. Lewis, M. F. Brennan, J. M. Woodruff, M. Dudas, and C. Cordon-
Cardo. 1998. Overexpression of cyclin D1 is associated with poor prognosis in
extremity soft-tissue sarcomas. Clin Cancer Res 4:2377-2382.
9. Garner, E., and V. Costanzo. 2009. Studying the DNA damage response using in
vitro model systems. DNA Repair (Amst) 8:1025-1037.
10. Rudelius, M., S. Pittaluga, S. Nishizuka, T. H. Pham, F. Fend, E. S. Jaffe, L.
Quintanilla-Martinez, and M. Raffeld. 2006. Constitutive activation of Akt contributes
to the pathogenesis and survival of mantle cell lymphoma. Blood 108:1668-1676.
11. Martin, P., and J. P. Leonard. 2007. Novel therapeutic targets in mantle cell
lymphoma. Expert Opin Ther Targets 11:929-940.
12. Witzig, T. E. 2005. Current treatment approaches for mantle-cell lymphoma. J Clin
Oncol 23:6409-6414.
13. Krause, J. R., and M. Shahidi-Asl. 2003. Molecular pathology in the diagnosis and
treatment of non-Hodgkin's lymphomas. J Cell Mol Med 7:494-512.
14. Lelbach, A., G. Muzes, and J. Feher. 2005. The insulin-like growth factor system:
IGFs, IGF-binding proteins and IGFBP-proteases. Acta Physiol Hung 92:97-107.
15. He, J., C. J. Rosen, D. J. Adams, and B. E. Kream. 2006. Postnatal growth and
bone mass in mice with IGF-I haploinsufficiency. Bone 38:826-835.
16. Rosen, C. J., and M. Pollak. 1999. Circulating IGF-I: New Perspectives for a New
Century. Trends Endocrinol Metab 10:136-141.
17. Rubin, J., X. Fan, J. Rahnert, B. Sen, C. L. Hsieh, T. C. Murphy, M. S. Nanes, L. G.
Horton, W. G. Beamer, and C. J. Rosen. 2006. IGF-I secretion by prostate
carcinoma cells does not alter tumor-bone cell interactions in vitro or in vivo.
Prostate 66:789-800.
18. Yakar, S., Y. Wu, J. Setser, and C. J. Rosen. 2002. The role of circulating IGF-I:
lessons from human and animal models. Endocrine 19:239-248.
80
19. Yao, W., J. Zhong, C. J. Rosen, J. M. Hock, and W. H. Lee. 2005. Igf-I and
postnatal growth of weaver mutant mice. Endocrine 26:117-125.
20. Bing-You, R. G., M. C. Denis, and C. J. Rosen. 1993. Low bone mineral density in
adults with previous hypothalamic-pituitary tumors: correlations with serum growth
hormone responses to GH-releasing hormone, insulin-like growth factor I, and IGF
binding protein 3. Calcif Tissue Int 52:183-187.
21. Wang, J., J. Zhou, C. M. Cheng, J. J. Kopchick, and C. A. Bondy. 2004. Evidence
supporting dual, IGF-I-independent and IGF-I-dependent, roles for GH in promoting
longitudinal bone growth. J Endocrinol 180:247-255.
22. Jenkins, P. J., and S. A. Bustin. 2004. Evidence for a link between IGF-I and cancer.
Eur J Endocrinol 151 Suppl 1:S17-22.
23. Borugian, M. J., J. J. Spinelli, Z. Sun, L. N. Kolonel, I. Oakley-Girvan, M. D. Pollak,
A. S. Whittemore, A. H. Wu, and R. P. Gallagher. 2008. Prostate cancer risk in
relation to insulin-like growth factor (IGF)-I and IGF-binding protein-3: a prospective
multiethnic study. Cancer Epidemiol Biomarkers Prev 17:252-254.
24. Chen, T., A. Lukanova, K. Grankvist, A. Zeleniuch-Jacquotte, M. Wulff, R.
Johansson, H. Schock, P. Lenner, G. Hallmans, G. Wadell, P. Toniolo, and E.
Lundin. 2009. IGF-I during primiparous pregnancy and maternal risk of breast
cancer. Breast Cancer Res Treat.
25. LeRoith, D., and C. T. Roberts, Jr. 2003. The insulin-like growth factor system and
cancer. Cancer Lett 195:127-137.
26. Wu, Y., S. Yakar, L. Zhao, L. Hennighausen, and D. LeRoith. 2002. Circulating
insulin-like growth factor-I levels regulate colon cancer growth and metastasis.
Cancer Res 62:1030-1035.
27. Peters, G., S. Gongoll, C. Langner, M. Mengel, P. Piso, J. Klempnauer, J. Ruschoff,
H. Kreipe, and R. von Wasielewski. 2003. IGF-1R, IGF-1 and IGF-2 expression as
81
potential prognostic and predictive markers in colorectal-cancer. Virchows Arch
443:139-145.
28. Mairet-Coello, G., A. Tury, and E. DiCicco-Bloom. 2009. Insulin-like growth factor-1
promotes G(1)/S cell cycle progression through bidirectional regulation of cyclins
and cyclin-dependent kinase inhibitors via the phosphatidylinositol 3-kinase/Akt
pathway in developing rat cerebral cortex. J Neurosci 29:775-788.
29. Rother, K. I., and D. Accili. 2000. Role of insulin receptors and IGF receptors in
growth and development. Pediatr Nephrol 14:558-561.
30. Werner, H., C. Hernandez-Sanchez, E. Karnieli, and D. Leroith. 1995. The
regulation of IGF-I receptor gene expression. Int J Biochem Cell Biol 27:987-994.
31. Shalita-Chesner, M., T. Glaser, and H. Werner. 2004. Signal transducer and
activator of transcription-1 (STAT1), but not STAT5b, regulates IGF-I receptor gene
expression in an osteosarcoma cell line. J Pediatr Endocrinol Metab 17:211-218.
32. Yu, L., K. Saile, C. D. Swartz, H. He, X. Zheng, G. E. Kissling, X. Di, S. Lucas, S. J.
Robboy, and D. Dixon. 2008. Differential expression of receptor tyrosine kinases
(RTKs) and IGF-I pathway activation in human uterine leiomyomas. Mol Med
14:264-275.
33. Kim, H., E. Barton, N. Muja, S. Yakar, P. Pennisi, and D. Leroith. 2005. Intact insulin
and insulin-like growth factor-I receptor signaling is required for growth hormone
effects on skeletal muscle growth and function in vivo. Endocrinology 146:1772-
1779.
34. Bentov, I., D. LeRoith, and H. Werner. 2003. The WT1 Wilms' tumor suppressor
gene: a novel target for insulin-like growth factor-I action. Endocrinology 144:4276-
4279.
82
35. Adams, T. E., V. C. Epa, T. P. Garrett, and C. W. Ward. 2000. Structure and
function of the type 1 insulin-like growth factor receptor. Cell Mol Life Sci 57:1050-
1093.
36. Chitnis, M. M., J. S. Yuen, A. S. Protheroe, M. Pollak, and V. M. Macaulay. 2008.
The type 1 insulin-like growth factor receptor pathway. Clin Cancer Res 14:6364-
6370.
37. Bertrand, F. E., L. S. Steelman, W. H. Chappell, S. L. Abrams, J. G. Shelton, E. R.
White, D. L. Ludwig, and J. A. McCubrey. 2006. Synergy between an IGF-1R
antibody and Raf/MEK/ERK and PI3K/Akt/mTOR pathway inhibitors in suppressing
IGF-1R-mediated growth in hematopoietic cells. Leukemia 20:1254-1260.
38. Foulstone, E., S. Prince, O. Zaccheo, J. L. Burns, J. Harper, C. Jacobs, D. Church,
and A. B. Hassan. 2005. Insulin-like growth factor ligands, receptors, and binding
proteins in cancer. J Pathol 205:145-153.
39. Inagaki, K., A. Tiulpakov, P. Rubtsov, P. Sverdlova, V. Peterkova, S. Yakar, S.
Terekhov, and D. LeRoith. 2007. A familial insulin-like growth factor-I receptor
mutant leads to short stature: clinical and biochemical characterization. J Clin
Endocrinol Metab 92:1542-1548.
40. Sadagurski, M., S. Yakar, G. Weingarten, M. Holzenberger, C. J. Rhodes, D.
Breitkreutz, D. Leroith, and E. Wertheimer. 2006. Insulin-like growth factor 1
receptor signaling regulates skin development and inhibits skin keratinocyte
differentiation. Mol Cell Biol 26:2675-2687.
41. Scavo, L. M., M. Karas, M. Murray, and D. Leroith. 2004. Insulin-like growth factor-I
stimulates both cell growth and lipogenesis during differentiation of human
mesenchymal stem cells into adipocytes. J Clin Endocrinol Metab 89:3543-3553.
83
42. Liu, J. P., J. Baker, A. S. Perkins, E. J. Robertson, and A. Efstratiadis. 1993. Mice
carrying null mutations of the genes encoding insulin-like growth factor I (Igf-1) and
type 1 IGF receptor (Igf1r). Cell 75:59-72.
43. Rosen, C. J., C. L. Ackert-Bicknell, M. L. Adamo, K. L. Shultz, J. Rubin, L. R.
Donahue, L. G. Horton, K. M. Delahunty, W. G. Beamer, J. Sipos, D. Clemmons, T.
Nelson, M. L. Bouxsein, and M. Horowitz. 2004. Congenic mice with low serum IGF-
I have increased body fat, reduced bone mineral density, and an altered osteoblast
differentiation program. Bone 35:1046-1058.
44. Rosen, C. J., H. P. Dimai, D. Vereault, L. R. Donahue, W. G. Beamer, J. Farley, S.
Linkhart, T. Linkhart, S. Mohan, and D. J. Baylink. 1997. Circulating and skeletal
insulin-like growth factor-I (IGF-I) concentrations in two inbred strains of mice with
different bone mineral densities. Bone 21:217-223.
45. Wu, Y., H. Sun, S. Yakar, and D. LeRoith. 2009. Elevated levels of insulin-like
growth factor (IGF)-I in serum rescue the severe growth retardation of IGF-I null
mice. Endocrinology 150:4395-4403.
46. Gualberto, A., and M. Pollak. 2009. Clinical Development of Inhibitors of the Insulin-
like Growth Factor Receptor in Oncology. Curr Drug Targets.
47. Gualco, E., J. Y. Wang, L. Del Valle, K. Urbanska, F. Peruzzi, K. Khalili, S. Amini,
and K. Reiss. 2009. IGF-IR in neuroprotection and brain tumors. Front Biosci
14:352-375.
48. LeRoith, D., R. Baserga, L. Helman, and C. T. Roberts, Jr. 1995. Insulin-like growth
factors and cancer. Ann Intern Med 122:54-59.
49. Macaulay, V. M. 1992. Insulin-like growth factors and cancer. Br J Cancer 65:311-
320.
84
50. Mitsiades, C. S., and N. Mitsiades. 2005. Treatment of hematologic malignancies
and solid tumors by inhibiting IGF receptor signaling. Expert Rev Anticancer Ther
5:487-499.
51. Moore, T., S. Carbajal, L. Beltran, S. N. Perkins, S. Yakar, D. Leroith, S. D.
Hursting, and J. Digiovanni. 2008. Reduced susceptibility to two-stage skin
carcinogenesis in mice with low circulating insulin-like growth factor I levels. Cancer
Res 68:3680-3688.
52. Pandini, G., R. Vigneri, A. Costantino, F. Frasca, A. Ippolito, Y. Fujita-Yamaguchi, K.
Siddle, I. D. Goldfine, and A. Belfiore. 1999. Insulin and insulin-like growth factor-I
(IGF-I) receptor overexpression in breast cancers leads to insulin/IGF-I hybrid
receptor overexpression: evidence for a second mechanism of IGF-I signaling. Clin
Cancer Res 5:1935-1944.
53. Pollak, M. 2008. Insulin and insulin-like growth factor signalling in neoplasia. Nat
Rev Cancer 8:915-928.
54. Pollak, M. 2008. Targeting insulin and insulin-like growth factor signalling in
oncology. Curr Opin Pharmacol 8:384-392.
55. Samani, A. A., S. Yakar, D. LeRoith, and P. Brodt. 2007. The role of the IGF system
in cancer growth and metastasis: overview and recent insights. Endocr Rev 28:20-
47.
56. Wolpin, B. M., J. A. Meyerhardt, A. T. Chan, K. Ng, J. A. Chan, K. Wu, M. N. Pollak,
E. L. Giovannucci, and C. S. Fuchs. 2009. Insulin, the insulin-like growth factor axis,
and mortality in patients with nonmetastatic colorectal cancer. J Clin Oncol 27:176-
185.
57. Yu, H., and T. Rohan. 2000. Role of the insulin-like growth factor family in cancer
development and progression. J Natl Cancer Inst 92:1472-1489.
85
58. Jones, R. A., C. I. Campbell, J. J. Petrik, and R. A. Moorehead. 2008.
Characterization of a novel primary mammary tumor cell line reveals that cyclin D1
is regulated by the type I insulin-like growth factor receptor. Mol Cancer Res 6:819-
828.
59. Rubini, M., A. Hongo, C. D'Ambrosio, and R. Baserga. 1997. The IGF-I receptor in
mitogenesis and transformation of mouse embryo cells: role of receptor number.
Exp Cell Res 230:284-292.
60. Zhang, D., A. A. Samani, and P. Brodt. 2003. The role of the IGF-I receptor in the
regulation of matrix metalloproteinases, tumor invasion and metastasis. Horm Metab
Res 35:802-808.
61. Flossmann-Kast, B. B., P. M. Jehle, A. Hoeflich, G. Adler, and M. P. Lutz. 1998. Src
stimulates insulin-like growth factor I (IGF-I)-dependent cell proliferation by
increasing IGF-I receptor number in human pancreatic carcinoma cells. Cancer Res
58:3551-3554.
62. Dupont, J., M. Karas, and D. LeRoith. 2000. The potentiation of estrogen on insulin-
like growth factor I action in MCF-7 human breast cancer cells includes cell cycle
components. J Biol Chem 275:35893-35901.
63. Lann, D., and D. LeRoith. 2008. The role of endocrine insulin-like growth factor-I
and insulin in breast cancer. J Mammary Gland Biol Neoplasia 13:371-379.
64. Sciacca, L., A. Costantino, G. Pandini, R. Mineo, F. Frasca, P. Scalia, P. Sbraccia, I.
D. Goldfine, R. Vigneri, and A. Belfiore. 1999. Insulin receptor activation by IGF-II in
breast cancers: evidence for a new autocrine/paracrine mechanism. Oncogene
18:2471-2479.
65. Shukla, V., X. Coumoul, L. Cao, R. H. Wang, C. Xiao, X. Xu, S. Ando, S. Yakar, D.
Leroith, and C. Deng. 2006. Absence of the full-length breast cancer-associated
86
gene-1 leads to increased expression of insulin-like growth factor signaling axis
members. Cancer Res 66:7151-7157.
66. Monti, S., L. Proietti-Pannunzi, A. Sciarra, F. Lolli, P. Falasca, M. Poggi, F. S. Celi,
and V. Toscano. 2007. The IGF axis in prostate cancer. Curr Pharm Des 13:719-
727.
67. Mitsiades, C. S., N. S. Mitsiades, C. J. McMullan, V. Poulaki, R. Shringarpure, M.
Akiyama, T. Hideshima, D. Chauhan, M. Joseph, T. A. Libermann, C. Garcia-
Echeverria, M. A. Pearson, F. Hofmann, K. C. Anderson, and A. L. Kung. 2004.
Inhibition of the insulin-like growth factor receptor-1 tyrosine kinase activity as a
therapeutic strategy for multiple myeloma, other hematologic malignancies, and
solid tumors. Cancer Cell 5:221-230.
68. Chng, W. J., A. Gualberto, and R. Fonseca. 2006. IGF-1R is overexpressed in poor-
prognostic subtypes of multiple myeloma. Leukemia 20:174-176.
69. Dupont, J., A. Pierre, P. Froment, and C. Moreau. 2003. The insulin-like growth
factor axis in cell cycle progression. Horm Metab Res 35:740-750.
70. Hamelers, I. H., R. F. van Schaik, J. Sipkema, J. S. Sussenbach, and P. H.
Steenbergh. 2002. Insulin-like growth factor I triggers nuclear accumulation of cyclin
D1 in MCF-7S breast cancer cells. J Biol Chem 277:47645-47652.
71. Muise-Helmericks, R. C., H. L. Grimes, A. Bellacosa, S. E. Malstrom, P. N. Tsichlis,
and N. Rosen. 1998. Cyclin D expression is controlled post-transcriptionally via a
phosphatidylinositol 3-kinase/Akt-dependent pathway. J Biol Chem 273:29864-
29872.
72. Furlanetto, R. W., S. E. Harwell, and K. K. Frick. 1994. Insulin-like growth factor-I
induces cyclin-D1 expression in MG63 human osteosarcoma cells in vitro. Mol
Endocrinol 8:510-517.
87
73. Coats, S., W. M. Flanagan, J. Nourse, and J. M. Roberts. 1996. Requirement of
p27Kip1 for restriction point control of the fibroblast cell cycle. Science 272:877-880.
74. Datta, S. R., H. Dudek, X. Tao, S. Masters, H. Fu, Y. Gotoh, and M. E. Greenberg.
1997. Akt phosphorylation of BAD couples survival signals to the cell-intrinsic death
machinery. Cell 91:231-241.
75. Hanahan, D., and R. A. Weinberg. 2000. The hallmarks of cancer. Cell 100:57-70.
76. Adachi, Y., C. T. Lee, K. Coffee, N. Yamagata, J. E. Ohm, K. H. Park, M. M. Dikov,
S. R. Nadaf, C. L. Arteaga, and D. P. Carbone. 2002. Effects of genetic blockade of
the insulin-like growth factor receptor in human colon cancer cell lines.
Gastroenterology 123:1191-1204.
77. Burfeind, P., C. L. Chernicky, F. Rininsland, and J. Ilan. 1996. Antisense RNA to the
type I insulin-like growth factor receptor suppresses tumor growth and prevents
invasion by rat prostate cancer cells in vivo. Proc Natl Acad Sci U S A 93:7263-
7268.
78. Cohen, B. D., D. A. Baker, C. Soderstrom, G. Tkalcevic, A. M. Rossi, P. E. Miller, M.
W. Tengowski, F. Wang, A. Gualberto, J. S. Beebe, and J. D. Moyer. 2005.
Combination therapy enhances the inhibition of tumor growth with the fully human
anti-type 1 insulin-like growth factor receptor monoclonal antibody CP-751,871. Clin
Cancer Res 11:2063-2073.
79. Dunn, S. E., M. Ehrlich, N. J. Sharp, K. Reiss, G. Solomon, R. Hawkins, R. Baserga,
and J. C. Barrett. 1998. A dominant negative mutant of the insulin-like growth factor-
I receptor inhibits the adhesion, invasion, and metastasis of breast cancer. Cancer
Res 58:3353-3361.
80. Gualberto, A., and M. Pollak. 2009. Emerging role of insulin-like growth factor
receptor inhibitors in oncology: early clinical trial results and future directions.
Oncogene 28:3009-3021.
88
81. Lee, C. T., K. H. Park, Y. Adachi, J. Y. Seol, C. G. Yoo, Y. W. Kim, S. K. Han, Y. S.
Shim, K. Coffee, M. M. Dikov, and D. P. Carbone. 2003. Recombinant adenoviruses
expressing dominant negative insulin-like growth factor-I receptor demonstrate
antitumor effects on lung cancer. Cancer Gene Ther 10:57-63.
82. Moschos, S. J., and C. S. Mantzoros. 2002. The role of the IGF system in cancer:
from basic to clinical studies and clinical applications. Oncology 63:317-332.
83. Feng, Y., and D. S. Dimitrov. 2008. Monoclonal antibodies against components of
the IGF system for cancer treatment. Curr Opin Drug Discov Devel 11:178-185.
84. Girnita, A., L. Girnita, F. del Prete, A. Bartolazzi, O. Larsson, and M. Axelson. 2004.
Cyclolignans as inhibitors of the insulin-like growth factor-1 receptor and malignant
cell growth. Cancer Res 64:236-242.
85. Economou, M. A., S. Andersson, D. Vasilcanu, C. All-Ericsson, E. Menu, A. Girnita,
L. Girnita, M. Axelson, S. Seregard, and O. Larsson. 2008. Oral picropodophyllin
(PPP) is well tolerated in vivo and inhibits IGF-1R expression and growth of uveal
melanoma. Invest Ophthalmol Vis Sci 49:2337-2342.
86. Economou, M. A., J. Wu, D. Vasilcanu, L. Rosengren, C. All-Ericsson, I. van der
Ploeg, E. Menu, L. Girnita, M. Axelson, O. Larsson, S. Seregard, and A. Kvanta.
2008. Inhibition of VEGF secretion and experimental choroidal neovascularization
by picropodophyllin (PPP), an inhibitor of the insulin-like growth factor-1 receptor.
Acta Ophthalmol 86 Thesis 4:42-49.
87. Menu, E., H. Jernberg-Wiklund, T. Stromberg, H. De Raeve, L. Girnita, O. Larsson,
M. Axelson, K. Asosingh, K. Nilsson, B. Van Camp, and K. Vanderkerken. 2006.
Inhibiting the IGF-1 receptor tyrosine kinase with the cyclolignan PPP: an in vitro
and in vivo study in the 5T33MM mouse model. Blood 107:655-660.
88. Vasilcanu, R., D. Vasilcanu, L. Rosengren, N. Natalishvili, B. Sehat, S. Yin, A.
Girnita, M. Axelson, L. Girnita, and O. Larsson. 2008. Picropodophyllin induces
89
downregulation of the insulin-like growth factor 1 receptor: potential mechanistic
involvement of Mdm2 and beta-arrestin1. Oncogene 27:1629-1638.
89. Rodon, J., V. DeSantos, R. J. Ferry, Jr., and R. Kurzrock. 2008. Early drug
development of inhibitors of the insulin-like growth factor-I receptor pathway:
lessons from the first clinical trials. Mol Cancer Ther 7:2575-2588.
90. Vasilcanu, D., A. Girnita, L. Girnita, R. Vasilcanu, M. Axelson, and O. Larsson.
2004. The cyclolignan PPP induces activation loop-specific inhibition of tyrosine
phosphorylation of the insulin-like growth factor-1 receptor. Link to the phosphatidyl
inositol-3 kinase/Akt apoptotic pathway. Oncogene 23:7854-7862.
91. Economou, M. A., S. Andersson, D. Vasilcanu, C. All-Ericsson, E. Menu, A. Girnita,
L. Girnita, M. Axelson, S. Seregard, and O. Larsson. 2008. Oral picropodophyllin
(PPP) is well tolerated in vivo and inhibits IGF-1R expression and growth of uveal
melanoma. Acta Ophthalmol 86 Thesis 4:35-41.
92. Favelyukis, S., J. H. Till, S. R. Hubbard, and W. T. Miller. 2001. Structure and
autoregulation of the insulin-like growth factor 1 receptor kinase. Nat Struct Biol
8:1058-1063.
93. Stromberg, T., S. Ekman, L. Girnita, L. Y. Dimberg, O. Larsson, M. Axelson, J.
Lennartsson, U. Hellman, K. Carlson, A. Osterborg, K. Vanderkerken, K. Nilsson,
and H. Jernberg-Wiklund. 2006. IGF-1 receptor tyrosine kinase inhibition by the
cyclolignan PPP induces G2/M-phase accumulation and apoptosis in multiple
myeloma cells. Blood 107:669-678.
94. Guo, Y. Q., and S. L. Chen. 2006. [The significance of IGF-1, VEGF, IL-6 in multiple
myeloma progression]. Zhonghua Xue Ye Xue Za Zhi 27:231-234.
95. Tonra, J. R., E. Corcoran, D. S. Deevi, P. Steiner, J. Kearney, H. Li, D. L. Ludwig, Z.
Zhu, L. Witte, D. Surguladze, and D. J. Hicklin. 2009. Prioritization of EGFR/IGF-
90
IR/VEGFR2 combination targeted therapies utilizing cancer models. Anticancer Res
29:1999-2007.
96. Bataille, R., N. Robillard, H. Avet-Loiseau, J. L. Harousseau, and P. Moreau. 2005.
CD221 (IGF-1R) is aberrantly expressed in multiple myeloma, in relation to disease
severity. Haematologica 90:706-707.
97. Freund, G. G., D. T. Kulas, and R. A. Mooney. 1993. Insulin and IGF-1 increase
mitogenesis and glucose metabolism in the multiple myeloma cell line, RPMI 8226.
J Immunol 151:1811-1820.
98. Jernberg-Wiklund, H., and K. Nilsson. 2007. Control of apoptosis in human multiple
myeloma by insulin-like growth factor I (IGF-I). Adv Cancer Res 97:139-165.
99. Menu, E., H. Jernberg-Wiklund, H. De Raeve, E. De Leenheer, L. Coulton, O.
Gallagher, E. Van Valckenborgh, O. Larsson, M. Axelson, K. Nilsson, B. Van Camp,
P. Croucher, and K. Vanderkerken. 2007. Targeting the IGF-1R using
picropodophyllin in the therapeutical 5T2MM mouse model of multiple myeloma:
beneficial effects on tumor growth, angiogenesis, bone disease and survival. Int J
Cancer 121:1857-1861.
100. Mitsiades, C. S., N. Mitsiades, V. Poulaki, R. Schlossman, M. Akiyama, D.
Chauhan, T. Hideshima, S. P. Treon, N. C. Munshi, P. G. Richardson, and K. C.
Anderson. 2002. Activation of NF-kappaB and upregulation of intracellular anti-
apoptotic proteins via the IGF-1/Akt signaling in human multiple myeloma cells:
therapeutic implications. Oncogene 21:5673-5683.
101. Shi, P., J. Chandra, X. Sun, M. Gergely, J. E. Cortes, G. Garcia-Manero, R. B.
Arlinghaus, R. Lai, and H. M. Amin. 2009. Inhibition of IGF-IR tyrosine kinase
induces apoptosis and cell cycle arrest in imatinib-resistant chronic myeloid
leukemia cells. J Cell Mol Med.
91
102. Shi, P., R. Lai, Q. Lin, A. S. Iqbal, L. C. Young, L. W. Kwak, R. J. Ford, and H. M.
Amin. 2009. IGF-IR tyrosine kinase interacts with NPM-ALK oncogene to induce
survival of T-cell ALK+ anaplastic large-cell lymphoma cells. Blood 114:360-370.
103. Amin, H. M., T. J. McDonnell, L. J. Medeiros, G. Z. Rassidakis, V. Leventaki, S. L.
O'Connor, M. J. Keating, and R. Lai. 2003. Characterization of 4 mantle cell
lymphoma cell lines. Arch Pathol Lab Med 127:424-431.
104. Pietrzkowski, Z., C. Sell, R. Lammers, A. Ullrich, and R. Baserga. 1992. Roles of
insulinlike growth factor 1 (IGF-1) and the IGF-1 receptor in epidermal growth factor-
stimulated growth of 3T3 cells. Mol Cell Biol 12:3883-3889.
105. Sell, C., M. Rubini, R. Rubin, J. P. Liu, A. Efstratiadis, and R. Baserga. 1993. Simian
virus 40 large tumor antigen is unable to transform mouse embryonic fibroblasts
lacking type 1 insulin-like growth factor receptor. Proc Natl Acad Sci U S A
90:11217-11221.
106. Stewart, A. J., M. D. Johnson, F. E. May, and B. R. Westley. 1990. Role of insulin-
like growth factors and the type I insulin-like growth factor receptor in the estrogen-
stimulated proliferation of human breast cancer cells. J Biol Chem 265:21172-
21178.
107. Bergmann, U., H. Funatomi, M. Yokoyama, H. G. Beger, and M. Korc. 1995. Insulin-
like growth factor I overexpression in human pancreatic cancer: evidence for
autocrine and paracrine roles. Cancer Res 55:2007-2011.
108. Gupta, S., T. Barrett, A. J. Whitmarsh, J. Cavanagh, H. K. Sluss, B. Derijard, and R.
J. Davis. 1996. Selective interaction of JNK protein kinase isoforms with
transcription factors. EMBO J 15:2760-2770.
109. Walsh, P. T., L. M. Smith, and R. O'Connor. 2002. Insulin-like growth factor-1
activates Akt and Jun N-terminal kinases (JNKs) in promoting the survival of T
lymphocytes. Immunology 107:461-471.
92
110. Miyazaki, T., and S. Arai. 2007. Two distinct controls of mitotic cdk1/cyclin B1
activity requisite for cell growth prior to cell division. Cell Cycle 6:1419-1425.
111. Wu, J. D., A. Odman, L. M. Higgins, K. Haugk, R. Vessella, D. L. Ludwig, and S. R.
Plymate. 2005. In vivo effects of the human type I insulin-like growth factor receptor
antibody A12 on androgen-dependent and androgen-independent xenograft human
prostate tumors. Clin Cancer Res 11:3065-3074.

93
Vita
Deeksha Vishwamitra was raised in Cincinnati, OH, the Daughter of Nimi Vishwamitra and Teju Vishwamitra. After completing her work at Indian Hill High School, Cincinnati, OH in 2003, she entered Ohio State University in Columbus, OH. She received the degree of Bachelor of Science with a major in Molecular Genetics from OSU in June 2007. In August of 2007 she entered The University of Texas Health Science Center at Houston Graduate School of Biomedical Sciences. Permanent address: 4605 N. Braeswood, Apt. 216 Houston, Texas 77096