types of inventory - pages persos...
TRANSCRIPT
INVENTORIES MEASUREMENT
OverviewThe next two chapters continue our study of assets by investigating the measurement and
reporting issues involving inventories and the related expense—cost of goods sold. Inventory refers to the assets a company (1) intends to sell in the normal course of business, (2) has in production for future sale, or (3) uses currently in the production of goods to be sold.
Learning ObjectivesLO8-1 Explain the difference between a perpetual inventory system and a periodic inventory
system.LO8-2 Explain which physical quantities of goods should be included in inventory.LO8-3 Determine the expenditures that should be included in the cost of inventory.LO8-4 Differentiate between the specific identification, FIFO, LIFO, and average cost methods
used to determine the cost of ending inventory and cost of goods sold.LO8-5 Discuss the factors affecting a company’s choice of inventory method.LO8-6 Understand supplemental LIFO disclosures and the effect of LIFO liquidations on net
income.LO8-7 Calculate the key ratios used by analysts to monitor a company’s investment in inventories.LO8-8 Determine ending inventory using the dollar-value LIFO inventory method.LO8-9 Discuss the primary difference between U.S. GAAP and IFRS with respect to determining
the cost of inventory.
Lecture Outline
Part A: Recording and Measuring Inventory
I. Types of InventoryA. Inventory for a wholesale or retail company consists of goods purchased in finished form
for resale. Inventory for a manufacturing company includes raw materials, work in process, and finished goods. (T8-1)
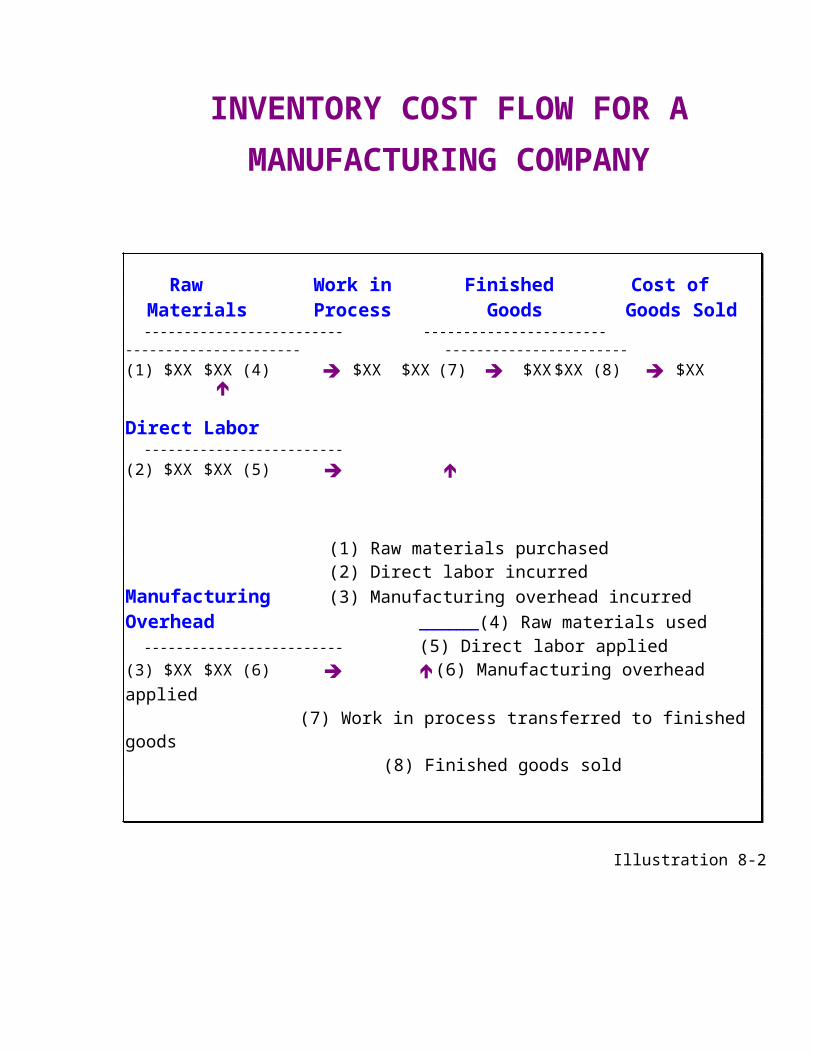
B. For a manufacturing company, the costs of raw materials, direct labor, and manufacturing overhead flow into work in process, then to finished goods when the manufacturing process is completed, and finally to cost of goods sold when goods are sold. (T8-2)
II. Perpetual Inventory System (T8-3)A. A perpetual inventory system continuously tracks both changes in inventory quantity and
inventory cost.B. Inventory is debited when merchandise is purchased or returned by a customer, and
credited when merchandise is sold or returned to a supplier. C. An important control feature of a perpetual system is that it is designed to track inventory
quantities from their acquisition to their sale.
III. Periodic Inventory System (T8-4)A. A periodic inventory system adjusts inventory and records cost of goods sold only at the
end of each reporting period.
© The McGraw-Hill Companies, Inc. 2013Instructors Resource Manual 8-1
B. Merchandise purchases, purchase returns, purchase discounts, and freight-in are recorded in temporary accounts.
C. Purchases plus freight-in less returns and discounts equals net purchases.D. The period's cost of goods sold is determined at the end of the period by combining the
temporary accounts with the inventory account:
Beginning inventory + Net purchases - Ending inventory = Cost of goods sold
IV. A Comparison of the Perpetual and Periodic Inventory SystemsA. The impact on the financial statements of choosing one system over the other generally is
not significant.B. The perpetual system provides more timely information but is more costly to implement.C. The periodic inventory system is less costly to implement during the period but usually
requires a physical count before ending inventory and cost of goods sold can be determined.
V. What Is Included in Inventory?A. Generally, physical quantities included in inventory consist of items in the possession of
the company. (T8-5)1. For goods in transit, ownership depends on whether the merchandise is shipped f.o.b.
shipping point, or f.o.b. destination.2. Goods held on consignment are included in the inventory of the consignor until sold
by the consignee.3. A company includes in inventory the cost of merchandise it anticipates will be
returned.B. Expenditures necessary to bring inventory to its condition and location for sale (or use for
raw materials) are included in inventory cost. (T8-6)1. Freight-in paid by the purchaser is included in inventory cost.2. Shipping charges on outgoing goods are not included in the cost of inventory. They
are reported in the income statement either as part of cost of goods sold or as an operating expense, usually among selling expenses.
3. Purchase returns represent reductions in net purchases.4. Purchase discounts represent reductions in the amount to be paid if remittance is made
within a designated period of time. The purchaser can record purchase discounts using either the gross method or the net method (T8-7)
C. Comprehensive example comparing perpetual and periodic systems. (T8-8)
VI. Inventory Cost Flow AssumptionsA. Regardless of the system used, it's necessary to assign dollar amounts to physical
quantities of goods sold and goods remaining in ending inventory. (T8-9)1. The specific identification method matches each unit sold or each unit on hand at the
end of the period with its actual cost. The method is not feasible for most inventories.2. Most companies use cost flow assumptions to determine cost of goods sold and ending
inventory. (T8-10)a. The average cost method assumes that items sold and items in ending inventory
come from a mixture of all the goods available for sale. (T8-11)b. The first-in, first-out (FIFO) method assumes that items sold are those that were
acquired first. Ending inventory consists of the most recently acquired items. (T8-12)
c. The last-in, first-out (LIFO) method assumes that items sold are those that were most recently acquired. Ending inventory consists of the items acquired first. (T8-13)
B. The financial statement effect of using the different methods depends on the direction of any change in the unit cost of goods. (T8-14)
C. There are a number of factors that motivate company management to choose one method over another.1. A company is not required to choose an inventory method that approximates actual
physical flow.2. Many companies choose LIFO to reduce income taxes in periods when prices are
rising.a. The IRS LIFO conformity rule requires that if a company uses LIFO to measure
its taxable income, LIFO also must be used to measure income reported to investors and creditors.
b. The LIFO conformity rule permits LIFO users to present designated supplemental disclosures that report in a note the effect of using another method on inventory valuation rather than LIFO. (T8-15)
3. Proponents of LIFO argue that it results in a better match of revenues and expenses.a. However, the use of LIFO could result in an unrealistic ending inventory balance.b. A decline in inventory quantity results in LIFO liquidation profit in periods of
rising costs. (T8-16)4. International Financial Reporting Standards do not permit the use of LIFO. (T8-17)
Decision Makers’ Perspective—Financial AnalysisA. A company should maintain sufficient inventory quantities to meet customer demand
while at the same time minimizing inventory ordering and carrying costs.B. Analysts should make adjustments when evaluating companies that use different inventory
methods. Supplemental LIFO disclosures can be used to convert LIFO inventory and cost of goods sold amounts. (T8-18)
C. Two important ratios used by analysts in assessing profitability are: (T8-19)1. The gross profit or gross margin ratio, computed by dividing gross profit (sales less
cost of goods sold) by net sales, indicates the percentage of each sales dollar available to cover expenses other than cost of goods sold and to provide a profit.
2. The inventory turnover ratio, computed by dividing cost of goods sold by average inventory, is designed to evaluate a company's effectiveness in managing its investment in inventory.
Part B: Methods of Simplifying LIFO
I. LIFO Inventory PoolsA. Unit LIFO can be costly to implement and can lead to LIFO liquidations.B. The objectives of using LIFO inventory pools is to (1) simplify recordkeeping by grouping
inventory units into pools based on physical similarities and (2) to reduce the risk of LIFO layer liquidation.
C. The average cost for all of the pool purchases during the period is applied to the current year's LIFO layer.
II. Dollar-Value LIFOA. The dollar-value LIFO (DVL) method extends the concept of inventory pools by
allowing a company to combine a large variety of goods into one pool. Most LIFO applications are based on this approach. (T8-20)
B. Inventory is viewed as a quantity of value instead of a physical quantity of goods. Instead of layers of units from different purchases, the DVL inventory pool is viewed as comprising layers of dollar value from different years.
C. A DVL pool is made up of items that are likely to face the same price change pressures, not items with physical similarities.
D. Under DVL, we determine whether a new LIFO layer was added by comparing the ending dollar amount with the beginning dollar amount after deflating inventory amounts to base year with the aid of a cost index. (T8-21)
E. The starting point in DVL is determining the current year's ending inventory valued at year-end costs. The DVL estimation technique then employs three steps: (T8-22)1. Step 1 converts ending inventory valued at year-end cost to base year cost.2. Step 2 identifies the layers of ending inventory and the years they were created.3. Step 3 converts each layer's base year cost to layer year cost using the cost index for
the year it was acquired.
PowerPoint SlidesA PowerPoint presentation of the chapter is available at the textbook website.
Teaching Transparency Masters
The following can be reproduced on transparency film as they appear here, or you can use the disk version of this manual and first modify them to suit your particular needs or preferences.
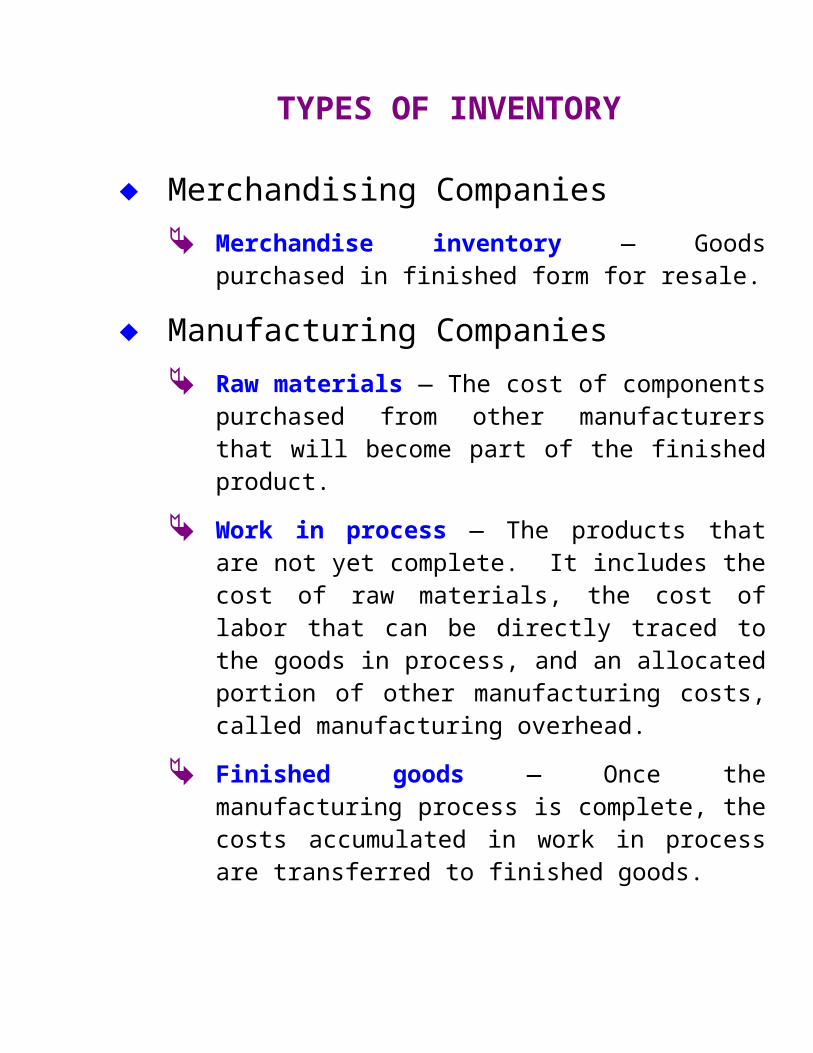
Merchandising Companies Merchandise inventory — Goods purchased in finished
form for resale.
Manufacturing Companies Raw materials — The cost of components purchased
from other manufacturers that will become part of the finished product.
Work in process — The products that are not yet complete. It includes the cost of raw materials, the cost of labor that can be directly traced to the goods in process, and an allocated portion of other manufacturing costs, called manufacturing overhead.
Finished goods — Once the manufacturing process is complete, the costs accumulated in work in process are transferred to finished goods.
T8-1
TYPES OF INVENTORY
Raw Work in Finished Cost of Materials Process Goods Goods Sold
------------------------- ----------------------- ---------------------- -----------------------(1) $XX $XX (4) $XX $XX (7) $XX $XX (8) $XX
Direct Labor-------------------------
(2) $XX $XX (5)
(1) Raw materials purchased(2) Direct labor incurred
Manufacturing (3) Manufacturing overhead incurredOverhead __ (4) Raw materials used------------------------- (5) Direct labor applied
(3) $XX $XX (6) (6) Manufacturing overhead applied(7) Work in process transferred to finished goods
(8) Finished goods sold
Illustration 8-2
T8-2
INVENTORY COST FLOW FOR A MANUFACTURING COMPANY

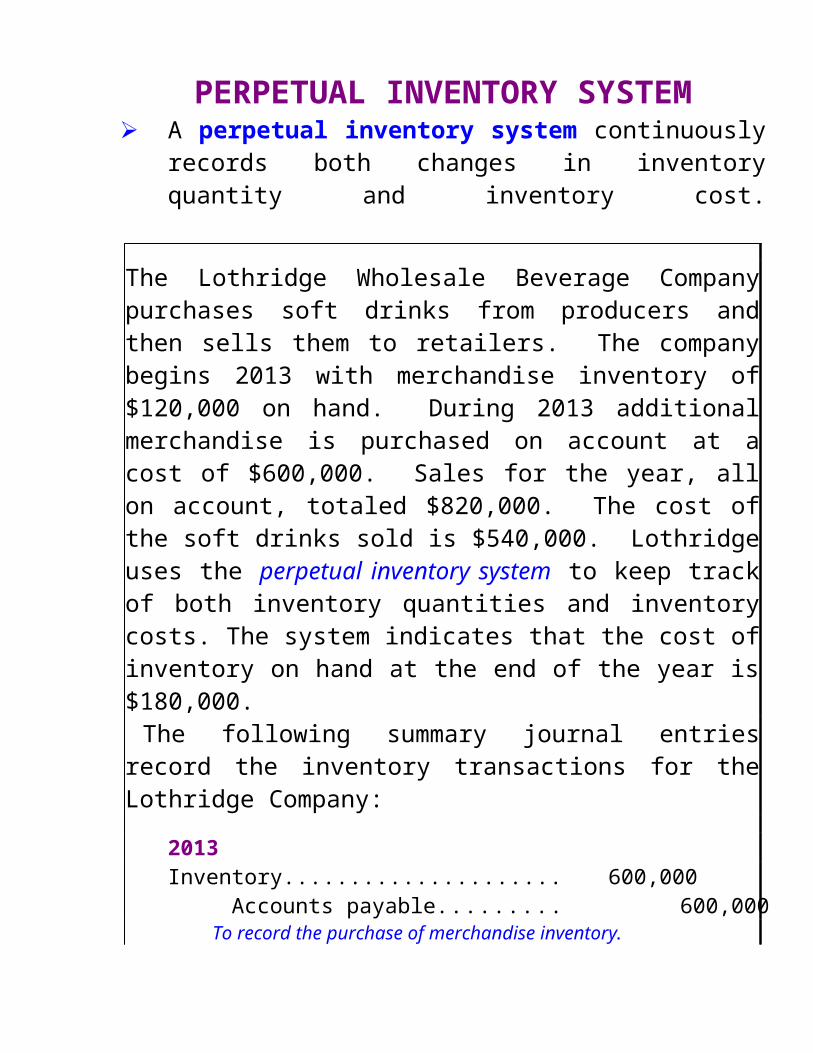
PERPETUAL INVENTORY SYSTEM A perpetual inventory system continuously records both
changes in inventory quantity and inventory cost.
The Lothridge Wholesale Beverage Company purchases soft drinks from producers and then sells them to retailers. The company begins 2013 with merchandise inventory of $120,000 on hand. During 2013 additional merchandise is purchased on account at a cost of $600,000. Sales for the year, all on account, totaled $820,000. The cost of the soft drinks sold is $540,000. Lothridge uses the perpetual inventory system to keep track of both inventory quantities and inventory costs. The system indicates that the cost of inventory on hand at the end of the year is $180,000.
The following summary journal entries record the inventory transactions for the Lothridge Company:
2013Inventory.......................................................... 600,000 Accounts payable........................................ 600,000 To record the purchase of merchandise inventory.
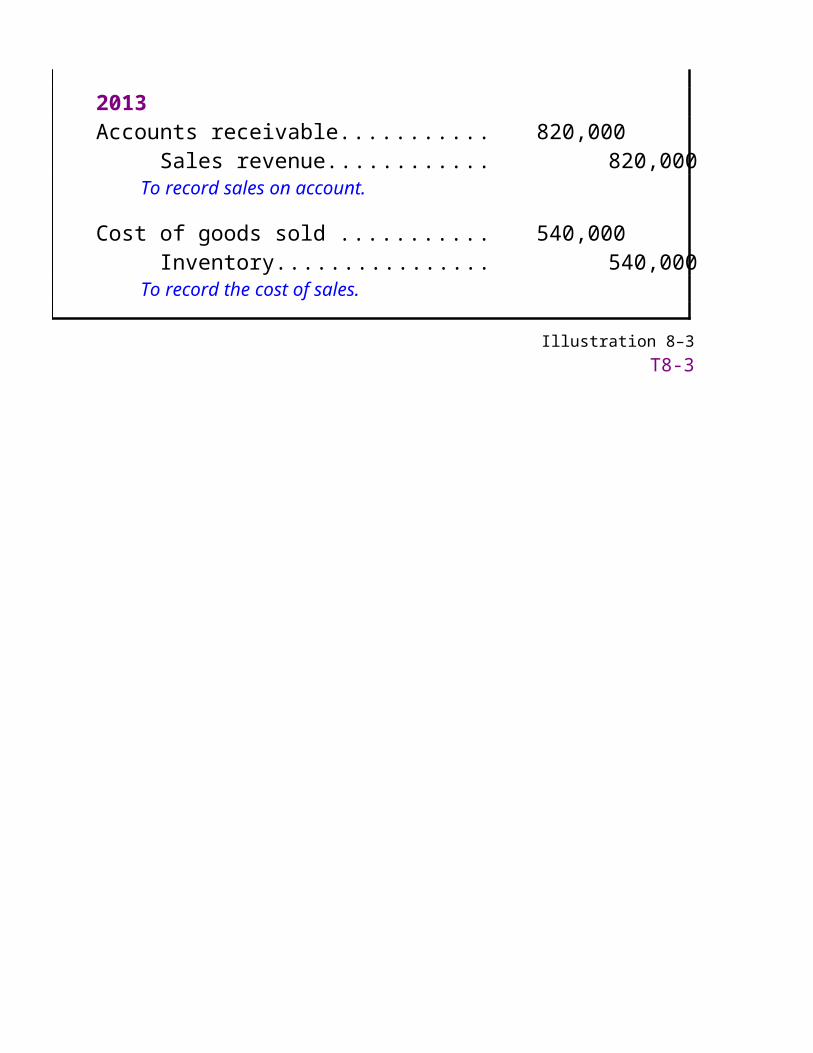
2013 Accounts receivable......................................... 820,000 Sales revenue............................................... 820,000 To record sales on account.
Cost of goods sold ........................................... 540,000 Inventory..................................................... 540,000 To record the cost of sales.
Illustration 8–3T8-3
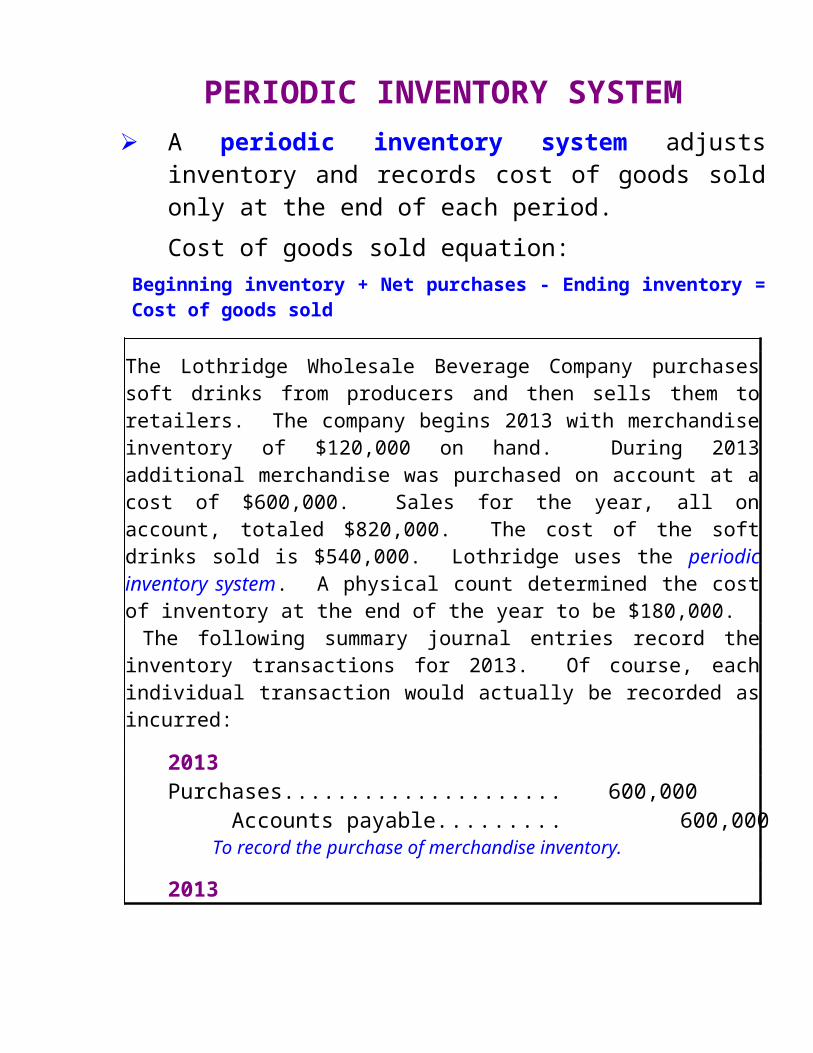
PERIODIC INVENTORY SYSTEM A periodic inventory system adjusts inventory and records
cost of goods sold only at the end of each period.
Cost of goods sold equation:Beginning inventory + Net purchases - Ending inventory = Cost of goods sold
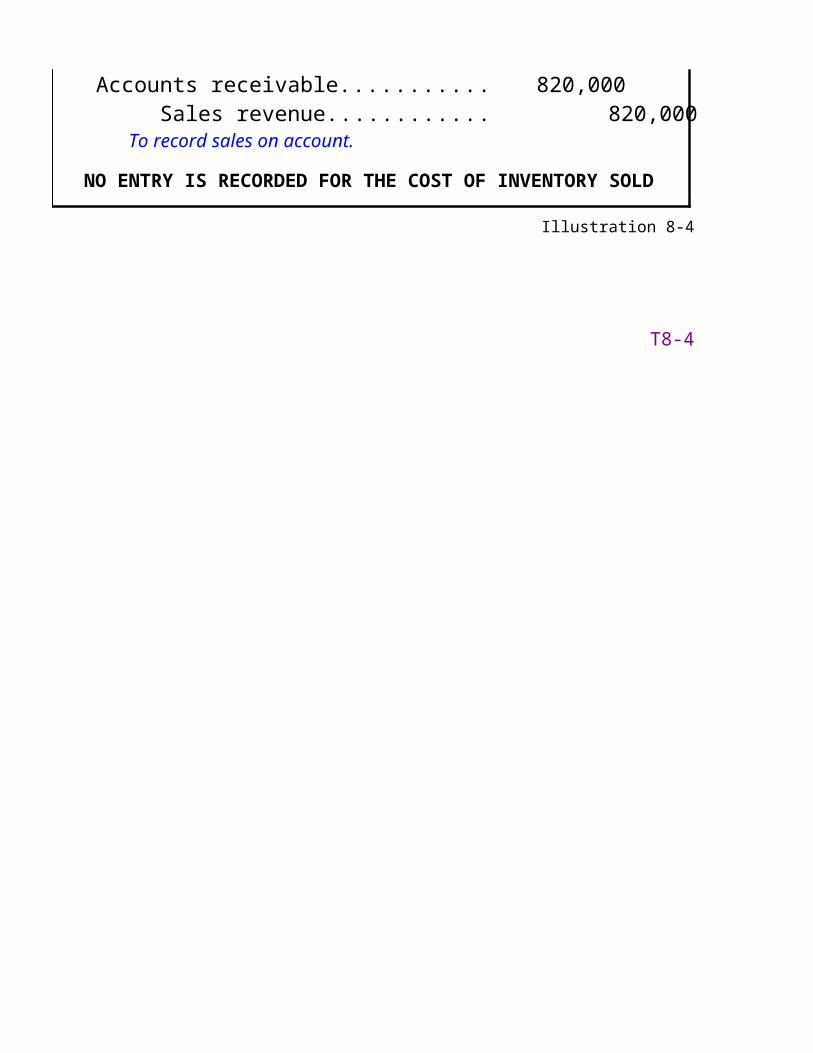
The Lothridge Wholesale Beverage Company purchases soft drinks from producers and then sells them to retailers. The company begins 2013 with merchandise inventory of $120,000 on hand. During 2013 additional merchandise was purchased on account at a cost of $600,000. Sales for the year, all on account, totaled $820,000. The cost of the soft drinks sold is $540,000. Lothridge uses the periodic inventory system. A physical count determined the cost of inventory at the end of the year to be $180,000.
The following summary journal entries record the inventory transactions for 2013. Of course, each individual transaction would actually be recorded as incurred:
2013Purchases.......................................................... 600,000 Accounts payable........................................ 600,000 To record the purchase of merchandise inventory.
2013Accounts receivable......................................... 820,000 Sales revenue............................................... 820,000
To record sales on account.
NO ENTRY IS RECORDED FOR THE COST OF INVENTORY SOLD
Illustration 8-4
T8-4

PERIODIC INVENTORY SYSTEM(continued)
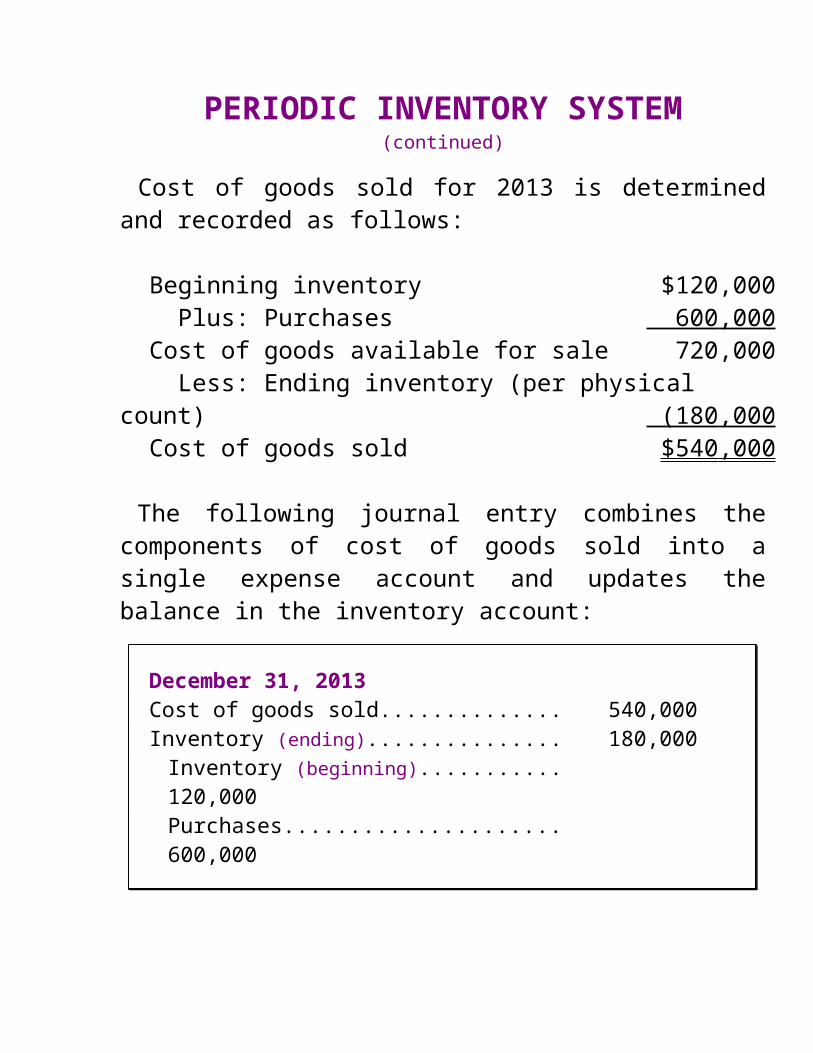
Cost of goods sold for 2013 is determined and recorded as follows:
Beginning inventory $120,000 Plus: Purchases 600,000Cost of goods available for sale 720,000 Less: Ending inventory (per physical count) (180,000)Cost of goods sold $540,000
The following journal entry combines the components of cost of goods sold into a single expense account and updates the balance in the inventory account:
December 31, 2013Cost of goods sold............................................... 540,000Inventory (ending)................................................. 180,000
Inventory (beginning)......................................... 120,000Purchases.......................................................... 600,000
This entry adjusts the inventory account to the correct period-end amount, closes the temporary purchases account, and records the residual as cost of goods sold.
T8-4 (continued)
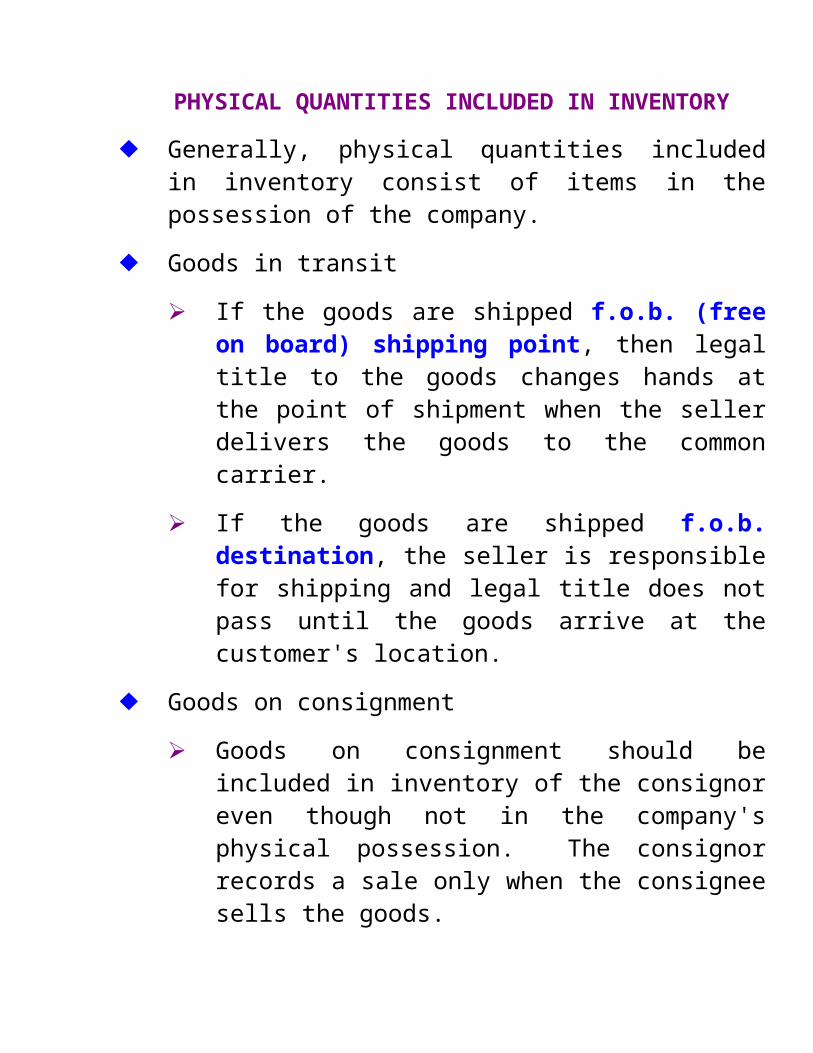
PHYSICAL QUANTITIES INCLUDED IN INVENTORY
Generally, physical quantities included in inventory consist of items in the possession of the company.
Goods in transit
If the goods are shipped f.o.b. (free on board) shipping point, then legal title to the goods changes hands at the point of shipment when the seller delivers the goods to the common carrier.
If the goods are shipped f.o.b. destination, the seller is responsible for shipping and legal title does not pass until the goods arrive at the customer's location.
Goods on consignment
Goods on consignment should be included in inventory of the consignor even though not in the company's physical possession. The consignor records a sale only when the consignee sells the goods.
Sales Returns
A company includes in inventory the cost of merchandise it anticipates will be returned.
T8-5

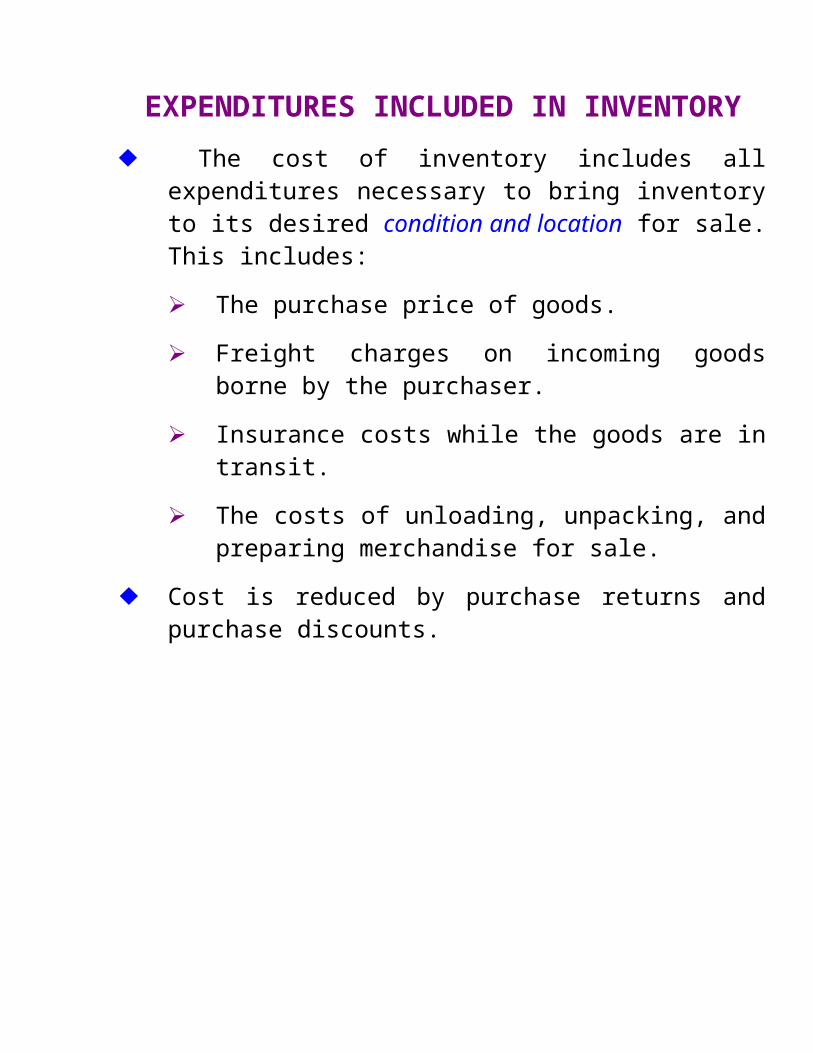
EXPENDITURES INCLUDED IN INVENTORY The cost of inventory includes all expenditures necessary to
bring inventory to its desired condition and location for sale. This includes:
The purchase price of goods.
Freight charges on incoming goods borne by the purchaser.
Insurance costs while the goods are in transit.
The costs of unloading, unpacking, and preparing merchandise for sale.
Cost is reduced by purchase returns and purchase discounts.
T8-6
PURCHASE DISCOUNTS
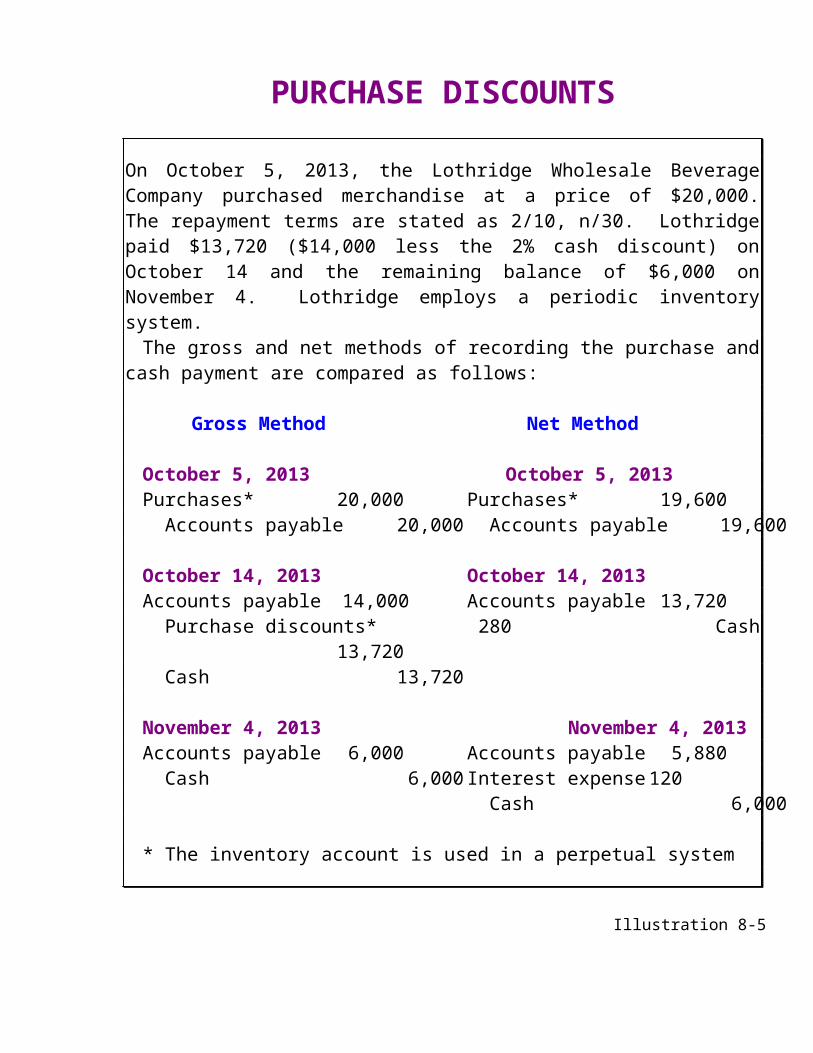
On October 5, 2013, the Lothridge Wholesale Beverage Company purchased merchandise at a price of $20,000. The repayment terms are stated as 2/10, n/30. Lothridge paid $13,720 ($14,000 less the 2% cash discount) on October 14 and the remaining balance of $6,000 on November 4. Lothridge employs a periodic inventory system.
The gross and net methods of recording the purchase and cash payment are compared as follows:
Gross Method Net Method
October 5, 2013 October 5, 2013Purchases* 20,000 Purchases* 19,600 Accounts payable 20,000 Accounts payable 19,600
October 14, 2013 October 14, 2013Accounts payable 14,000 Accounts payable 13,720 Purchase discounts* 280 Cash 13,720 Cash 13,720
November 4, 2013 November 4, 2013Accounts payable 6,000 Accounts payable 5,880 Cash 6,000 Interest expense 120
Cash 6,000
* The inventory account is used in a perpetual system
Illustration 8-5
The gross method views discounts not taken as part of inventory cost.
The net method views discounts not taken as interest expense.
T8-7
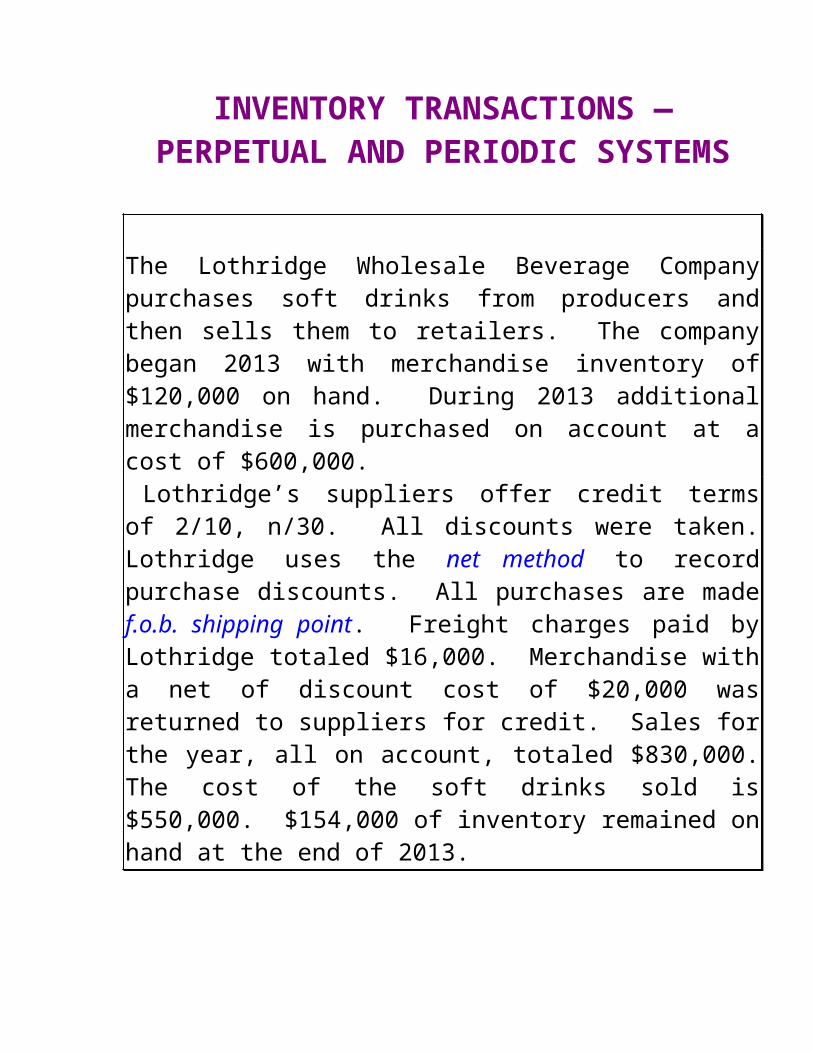
INVENTORY TRANSACTIONS — PERPETUAL AND PERIODIC SYSTEMS
The Lothridge Wholesale Beverage Company purchases soft drinks from producers and then sells them to retailers. The company began 2013 with merchandise inventory of $120,000 on hand. During 2013 additional merchandise is purchased on account at a cost of $600,000.
Lothridge’s suppliers offer credit terms of 2/10, n/30. All discounts were taken. Lothridge uses the net method to record purchase discounts. All purchases are made f.o.b. shipping point. Freight charges paid by Lothridge totaled $16,000. Merchandise with a net of discount cost of $20,000 was returned to suppliers for credit. Sales for the year, all on account, totaled $830,000. The cost of the soft drinks sold is $550,000. $154,000 of inventory remained on hand at the end of 2013.
The above transactions are recorded in summary form according to both the perpetual and period inventory systems as follows:
T8-8
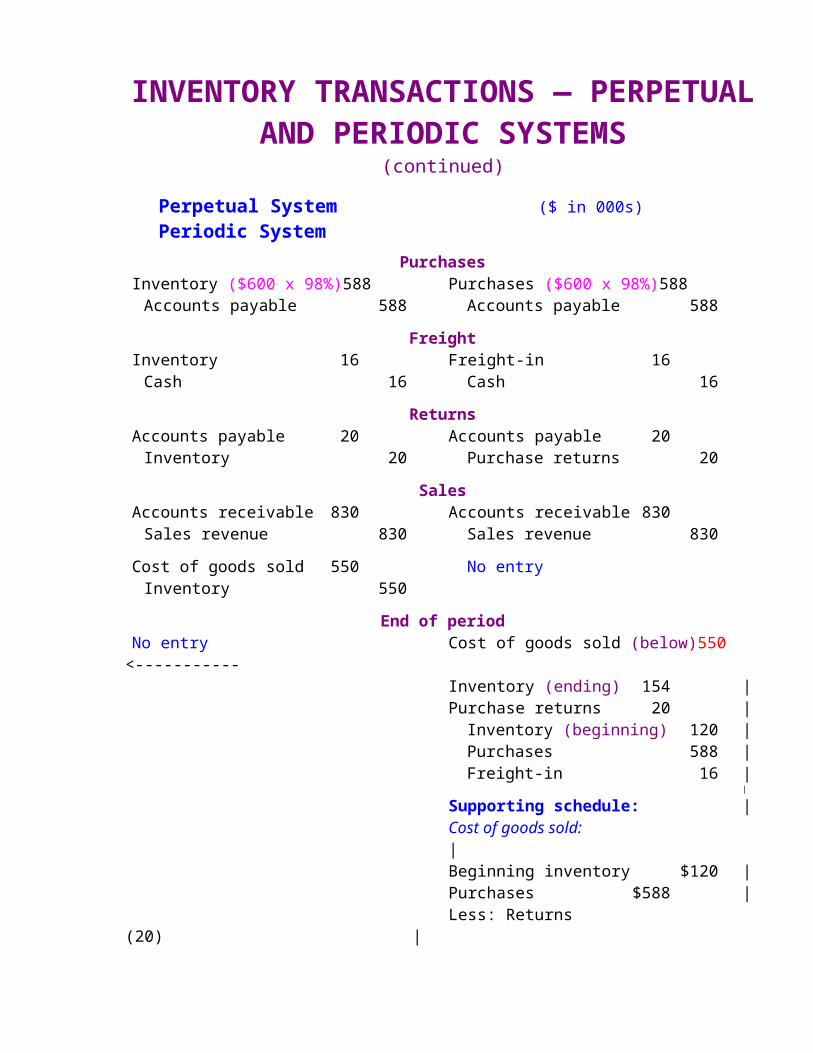
INVENTORY TRANSACTIONS — PERPETUAL AND PERIODIC SYSTEMS
(continued)
Perpetual System ($ in 000s) Periodic SystemPurchases
Inventory ($600 x 98%) 588 Purchases ($600 x 98%) 588Accounts payable 588 Accounts payable 588
FreightInventory 16 Freight-in 16
Cash 16 Cash 16
ReturnsAccounts payable 20 Accounts payable 20
Inventory 20 Purchase returns 20
SalesAccounts receivable 830 Accounts receivable 830
Sales revenue 830 Sales revenue 830
Cost of goods sold 550 No entryInventory 550
End of periodNo entry Cost of goods sold (below) 550 <-----------
Inventory (ending) 154 |Purchase returns 20 |
Inventory (beginning) 120 |Purchases 588 |Freight-in 16 |
|
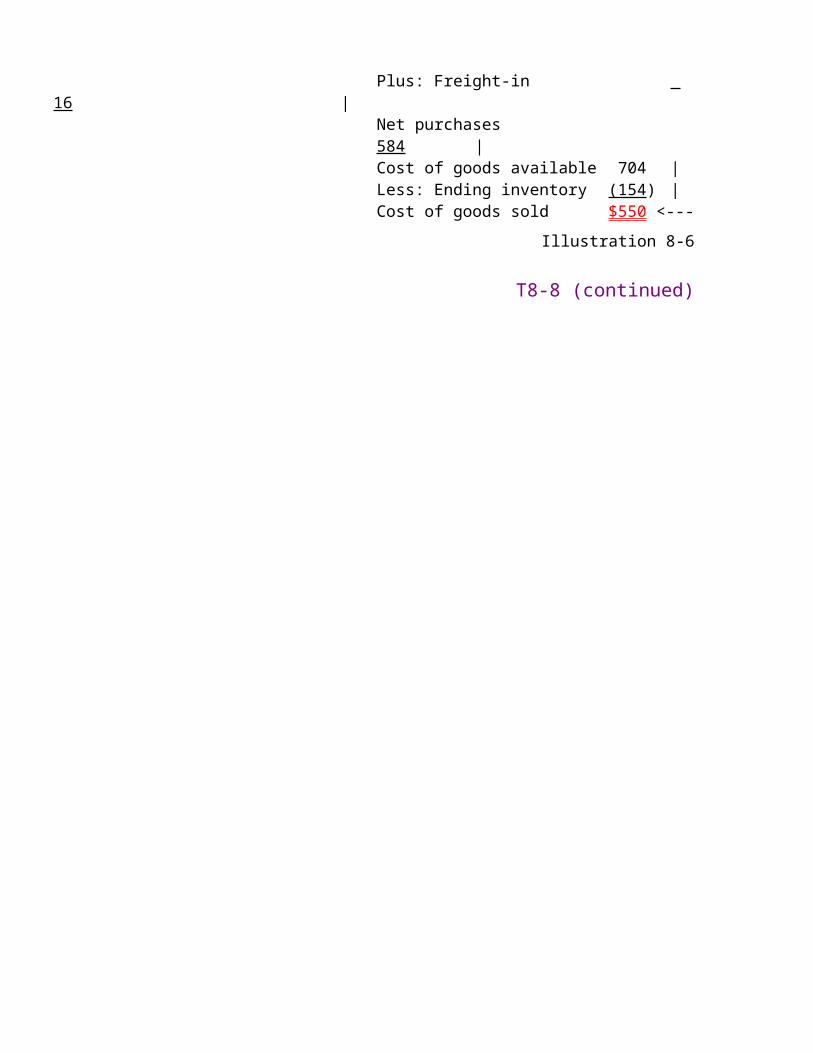
Supporting schedule: |Cost of goods sold: |Beginning inventory $120 |Purchases $588 |Less: Returns (20) |Plus: Freight-in 16 |Net purchases 584 |Cost of goods available 704 |Less: Ending inventory (154) |Cost of goods sold $550 <---
Illustration 8-6
T8-8 (continued)
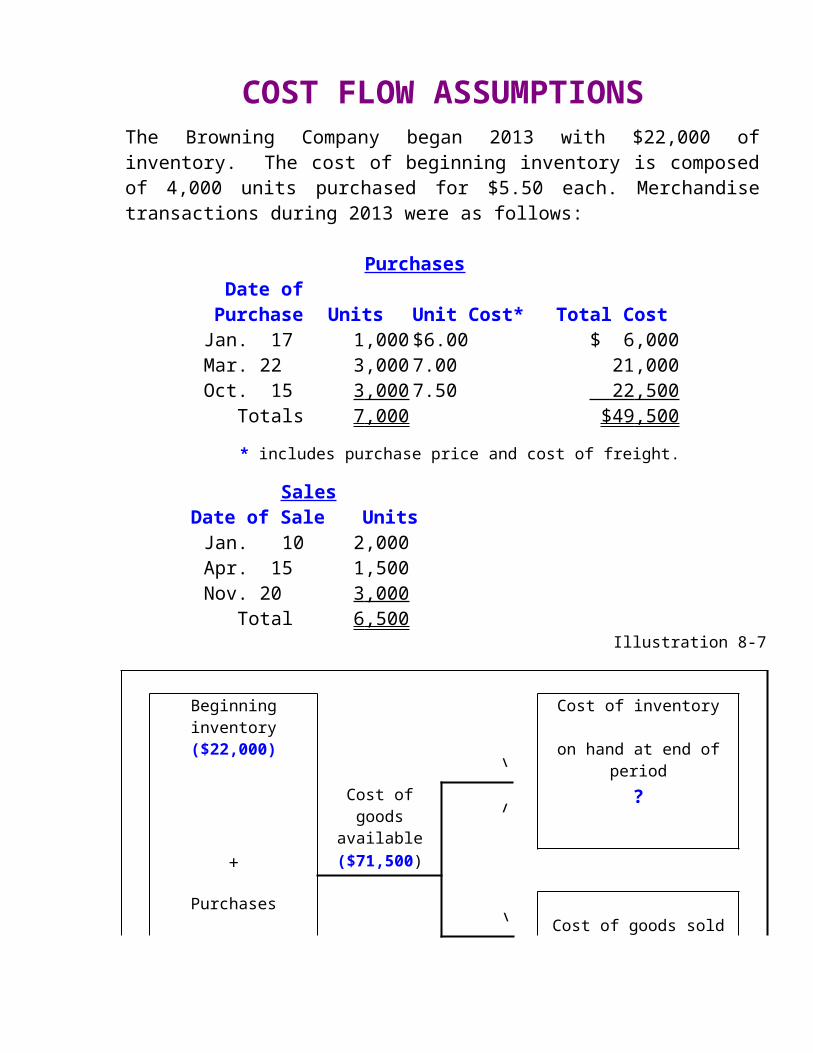
COST FLOW ASSUMPTIONSThe Browning Company began 2013 with $22,000 of inventory. The cost of beginning inventory is composed of 4,000 units purchased for $5.50 each. Merchandise transactions during 2013 were as follows:
Purchases Date of Purchase Units Unit Cost* Total Cost
Jan. 17 1,000 $6.00 $ 6,000Mar. 22 3,000 7.00 21,000Oct. 15 3,000 7.50 22,500 Totals 7,000 $49,500
* includes purchase price and cost of freight.
Sales Date of Sale Units
Jan. 10 2,000Apr. 15 1,500Nov. 20 3,000 Total 6,500
Illustration 8-7
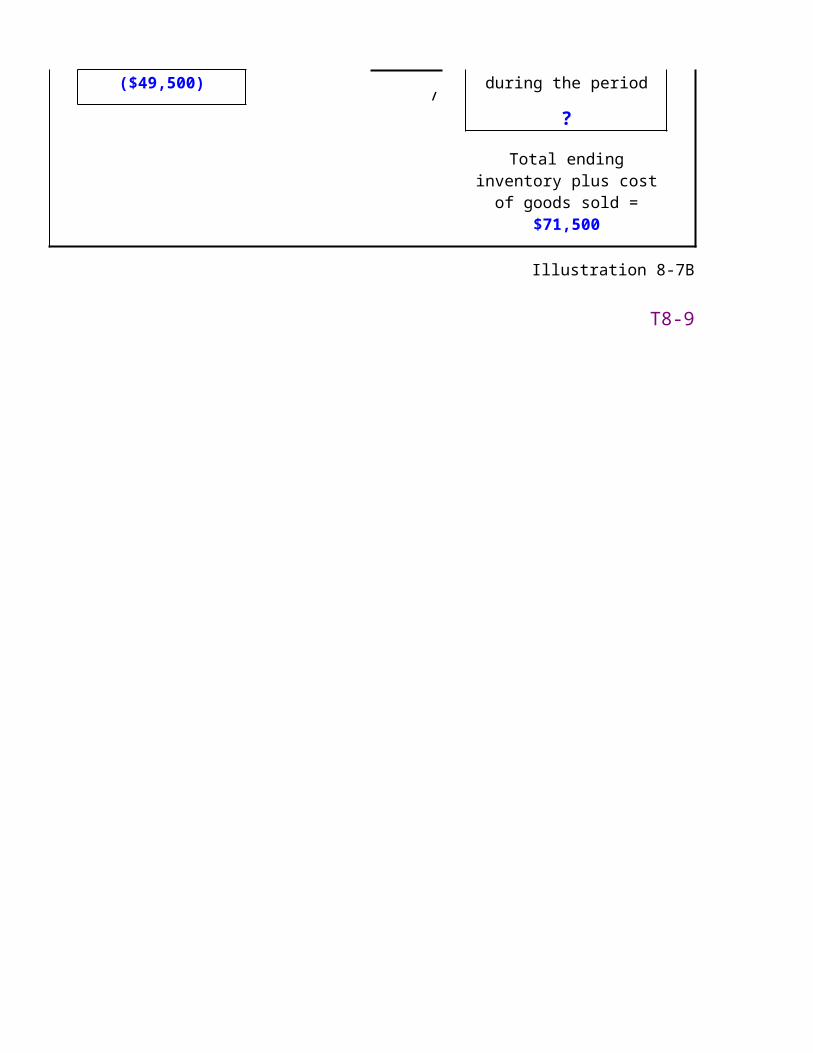
Beginning inventory Cost of inventory($22,000)
\ on hand at end of period
Cost of goodsavailable
/ ?
+ ($71,500)
Purchases \ Cost of goods sold
($49,500) / during the period?
Total ending inventory plus cost of goods sold = $71,500
Illustration 8-7B
T8-9
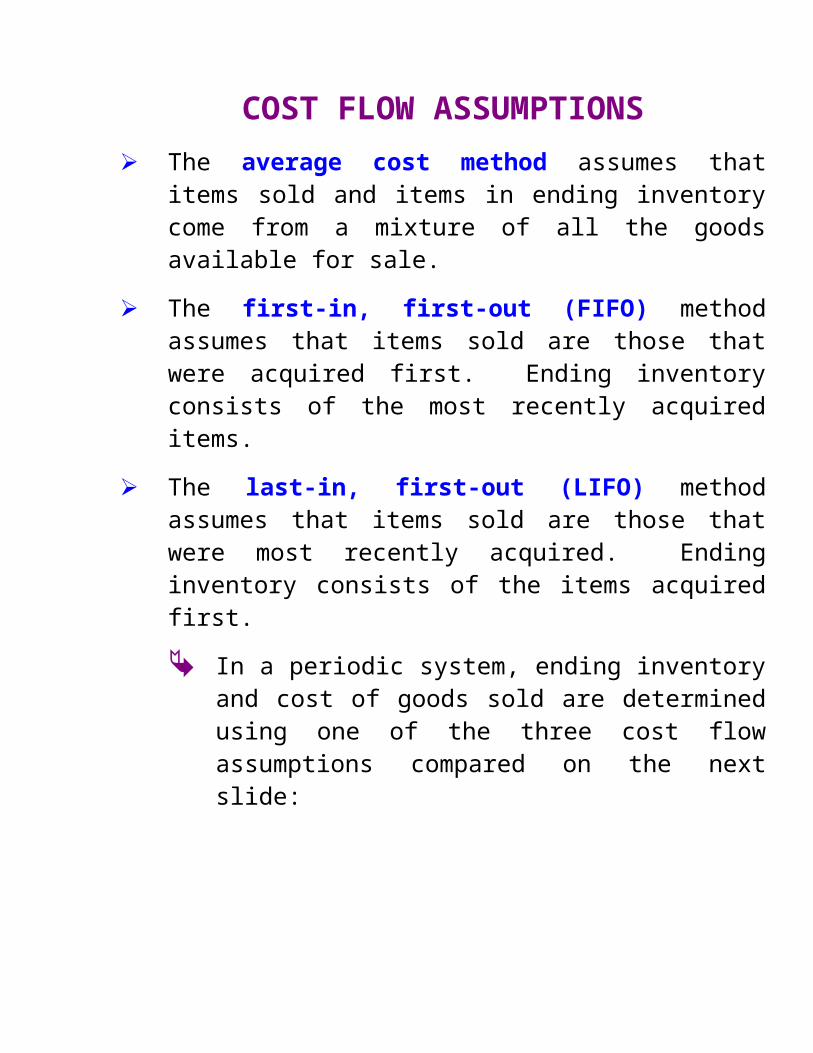
COST FLOW ASSUMPTIONS The average cost method assumes that items sold and items
in ending inventory come from a mixture of all the goods available for sale.
The first-in, first-out (FIFO) method assumes that items sold are those that were acquired first. Ending inventory consists of the most recently acquired items.
The last-in, first-out (LIFO) method assumes that items sold are those that were most recently acquired. Ending inventory consists of the items acquired first.
In a periodic system, ending inventory and cost of goods sold are determined using one of the three cost flow assumptions compared on the next slide:
T8-10
COST FLOW ASSUMPTIONS(continued)
AVERAGE COSTCost of goods available for sale (11,000 units) $71,500 Less: Ending inventory (determined below) (29,250)Cost of goods sold (difference) $42,250Cost of ending inventory:
$71,500Weighted-average unit cost = = $6.50
11,000 units
4,500 units x $6.50 = $29,250
FIFOCost of goods available for sale (11,000 units) $71,500 Less: Ending inventory (determined below) (33,000)Cost of goods sold (difference) $38,500
Cost of ending inventory:Date of Purchase Units Unit Cost Total CostMar. 22 1,500 $7.00 $10,500Oct. 15 3,000 7.50 22,500 Total 4,500 $33,000
LIFOCost of goods available for sale (11,000 units) $71,500 Less: Ending inventory (determined below) (25,000)Cost of goods sold (difference) $46,500
Cost of ending inventory:Date of Purchase Units Unit Cost Total CostBeg. inventory 4,000 $5.50 $22,000January 17 500 6.00 3,000 Total 4,500 $25,000
Illustrations 8-7C, E, and G
T8-10 (continued)
AVERAGE COST — PERPETUAL INVENTORY SYSTEM
Date Purchased Sold Balance
Beginning inventory
4,000 @$5.50 = $22,000 4,000 @ $5.50 $22,000
Jan. 10 2,000 @$5.50 = $11,000 2,000 @ $5.50 $11,000
Jan. 17 1,000 @ $6.00 = $6,000
$17,000 = $5.667/unit3,000 units
$11,000+$6,000 = $17,000 2,000+ 1,000 = 3,000 units
Mar. 22 3,000 @ $7.00 = $21,000
$38,000 = $6.333/unit6,000 units
$17,000+$21,000 = $38,000 3,000+ 3,000 = 6,000 units
Apr. 15 1,500 @$6.333 = $9,500 4,500 @ $6.333 = $28,500
Oct. 15 3,000 @ $7.50 = $22,500
$51,000 = $6.80/unit7,500 units
$28,500+$22,500 = $51,000 4,500+ 3,000 = 7,500 units
Nov. 20 3,000 @$6.80 = $20,400 4,500 @ $6.80 = $30,600
Total cost of goods sold = $40,900
Illustration 8-7D
T8-11
FIFO — PERPETUAL INVENTORY SYSTEM
The same ending inventory and cost of goods sold amounts are always produced in a perpetual system as in a periodic system when FIFO is used.
Date Purchased Sold Balance
Beginning inventory
4,000 @ $5.50 = $22,000 4,000 @ $5.50 $22,000
Jan. 10 2,000 @ $5.50 = $11,000 2,000 @ $5.50 $11,000
Jan. 17 1,000 @ $6.00 = $6,000 2,000 @ $5.501,000 @ $6.00 $17,000
Mar. 22 3,000 @ $7.00 = $21,000 2,000 @ $5.501,000 @ $6.00 $38,0003,000 @ $7.00
Apr. 15 1,500 @ $5.50 = $8,250 500 @ $5.501,000 @ $6.00 $29,7503,000 @ $7.00
Oct. 15 3,000 @ $7.50 = $22,500 500 @ $5.501,000 @ $6.003,000 @ $7.00 $52,2503,000 @ $7.50
Nov. 20 500 @ $5.50 +1,000 @ $6.00 +1,500 @ $7.00 = $19,250
1,500 @ $7.003,000 @ $7.50 $33,000
Total cost of goods sold = $38,500
Illustration 8-7F
T8-12
LIFO — PERPETUAL INVENTORY SYSTEM
Date Purchased Sold Balance
Beginning inventory
4,000 @ $5.50 = $22,000 4,000 @ $5.50 $22,000
Jan. 10 2,000 @ $5.50 = $11,000 2,000 @ $5.50 $11,000
Jan. 17 1,000 @ $6.00 = $6,000 2,000 @ $5.501,000 @ $6.00 $17,000
Mar. 22 3,000 @ $7.00 = $21,000 2,000 @ $5.501,000 @ $6.00 $38,0003,000 @ $7.00
Apr. 15 1,500 @ $7.00 = $10,500 2,000 @ $5.501,000 @ $6.00 $27,5001,500 @ $7.00
Oct. 15 3,000 @ $7.50 = $22,500 2,000 @ $5.501,000 @ $6.001,500 @ $7.00 $50,0003,000 @ $7.50
Nov. 20 3,000 @ $7.50 = $22,500 2,000 @ $5.501,000 @ $6.00 $27,5001,500 @ $7.00
Total cost of goods sold = $44,000
Illustration 8-7H
T8-13

COMPARISON OF COST FLOW METHODS
The three cost flow methods are compared below assuming a periodic inventory system.
AVERAGE FIFO LIFO
Cost of goods sold $42,250 $38,500 $46,500
Ending inventory 29,250 33,000 25,000
Total $71,500 $71,500 $71,500
During periods of generally rising costs FIFO cost of goods sold results in a lower cost of goods sold than LIFO.
LIFO cost of goods sold will include the more recent higher unit cost purchases.
FIFO ending inventory includes the most recent higher cost purchases which results in a higher ending inventory than LIFO.
T8-14
LIFO CONFORMITY RULE If a company uses LIFO to measure its taxable income, IRS
regulations require that LIFO also be used to measure income reported to investors and creditors.
The LIFO conformity rule permits LIFO users to present designated supplemental disclosures that report in a note the effect of using another method on inventory valuation rather than LIFO.
Inventories Disclosure — Rite Aid Corporation.
Summary of Significant Accounting Policies(in part)Inventories
Inventories are stated at the lower of cost or market. The Company uses the Last-in, first-out (LIFO) method of accounting for substantially all of its inventories. At February 26, 2011 and February 27, 2010, inventories were $875 million and $831 million, respectively, lower than the amounts that would have been reported using the first-in, first-out (FIFO) method.
Illustration 8-9
T8-15
LIFO LIQUIDATION PROFIT A decline in inventory quantity results in LIFO liquidation
profit in periods of rising costs.
National Distributors, Inc., uses the LIFO inventory method. The company began 2013 with inventory of 10,000 units that cost $20 per unit. During 2013 30,000 units were purchased for $25 each and 35,000 units were sold.
National’s LIFO cost of goods sold for 2013 consists of:
30,000 units @ $25 per unit = $750,000 5,000 units @ $20 per unit = 100,00035,000 $850,000
Included in cost of goods sold are 5,000 units from beginning inventory purchased at $20 that have now been liquidated.
If the company had purchased at least 35,000 units, no liquidation would have occurred. Then cost of goods sold would have been $875,000 (35,000 units x $25 per unit) instead of $850,000. The difference between these two cost of goods sold figures of $25,000 ($875,000 - 850,000) is the before tax LIFO liquidation profit.
Assuming a 40% income tax rate, the net effect of the liquidation is to increase net income by $15,000 [$25,000 x (1 - .40)].
A material effect on net income of LIFO layer liquidation must be disclosed in a note.
Illustration 8-11
T8-16INTERNATIONAL FINANCIAL REPORTING STANDARDS
Inventory Cost Flow Assumptions. IAS NO. 2 does not permit the use of LIFO. Because of this restriction, many U.S. multinational companies employ the use of LIFO only for all or most of their domestic inventories and FIFO or average cost for their foreign subsidiaries. General Mills provides an example with a disclosure note included in a recent annual report:
Inventories (in part)All inventories in the United States other than grain are valued at the lower of cost,
using the last-in, first-out (LIFO method, or market… Inventories outside of the United States are valued at the lower of cost, using the first-in, first-out (FIFO) method, or market.
This difference could prove to be a significant impediment to U.S. convergence to international standards. Unless the U.S. Congress repeals the LIFO conformity rule, convergence would cause many corporations to lose a valuable tax shelter, the use of LIFO for tax purposes. If these companies were immediately taxed on the difference between LIFO inventories and inventories valued using another method, it would cost companies billions of dollars. Some industries would be particularly hard hit. Most oil companies and auto manufacturers, for instance, use LIFO. The government estimates that the repeal of the LIFO method would increase federal tax revenues by $59 billion over a ten-year period. The companies affected most certainly will lobby heavily to retain the use of LIFO for tax purposes.
T8-17
DECISION MAKERS’ PERSPECTIVE —SUPPLEMENTAL LIFO DISCLOSURES
Supplemental LIFO disclosures can be used to convert LIFO inventory and cost of goods sold amounts.
Rite Aid Corporation
For the Year Ended February 26, February 27,
($ in millions) 2011 2010 Balance sheets: Inventories $474 $505
Income statements: Net sales 9,516 6,401 Cost of goods sold 6,613 4,431
Rite Aid Corporation uses the LIFO method to value its inventory. We can convert Rite Aid's inventory and cost of goods sold to a FIFO basis before comparing to a competitor by using the information provided in Illustration 8-11 (Slide T8-15).
($ in millions) 2011 2010Inventories (as reported) $3,158 $3,239Add: Conversion to FIFO 875 831Inventories (100% FIFO) $4,033 $4,070
Cost of goods sold for 2011 would have been $44 million lower had Rite Aid used FIFO instead of LIFO for its LIFO inventories. While beginning inventory would have been 831 million higher, ending inventory also would have been higher by $875 million. An increase in beginning inventory causes an increase in cost of goods sold, but an increase in ending inventory causes a decrease in cost of goods sold.
T8-18
DECISION MAKERS’ PERSPECTIVE —FINANCIAL ANALYSIS
The gross profit ratio indicates the percentage of each sales dollar available to cover other expenses and provide a profit.
The inventory turnover ratio helps to evaluate a company's effectiveness in managing its investment in inventory.
Gross profit ratio = Gross profit Net sales
Inventory turnover ratio = Cost of goods sold Average Inventory
T8-19
DOLLAR-VALUE LIFO (DVL)
Many LIFO applications are based on this approach.
Inventory is viewed as a quantity of value instead of a physical quantity of goods.
The DVL inventory pool is viewed as comprising layers of dollar value from different years.
An inventory pool is identified in terms of economic similarity rather than physical similarity (subject to the same cost change pressures).
DVL simplifies the recordkeeping procedures because no information is needed about unit flows.
DVL minimizes the probability of the liquidation of LIFO inventory layers, through the aggregation of many types of inventory into larger pools.
T8-20
COST INDEXES Under unit LIFO we determine whether a new LIFO layer
was added by comparing the ending quantity with the beginning quantity.
Under DVL we determine whether a new LIFO layer was added by comparing the ending dollar amount with the beginning dollar amount.
However, if the cost level has changed, we need a way to determine whether an increase observed is a real increase or one caused by an increase in costs.
So before we compare the beginning and ending inventory amounts, we need to deflate the ending inventory amount by any increase in costs so that both the beginning and ending amounts are based on the same level of costs.
We accomplish this by using cost indexes. A cost index for a particular layer year is determined as follows:
Cost in layer yearCost index in layer year =
Cost in base year
The cost index for the base year (the year DVL is initially adopted) is set at 100.
T8-21
DVL ILLUSTRATIONHanes Company adopted the dollar-value LIFO method on January 1, 2013, when the inventory value was $400,000. The 2013 ending inventory valued at year-end costs is $441,000, and the cost index for the year is 105.
Step 1: Convert ending inventory valued at year-end cost to base year cost.
$441,000Ending inventory at base year cost = = $420,000
1.05
Step 2: Identify the layers of ending inventory.
$420,000 Ending inventory at base year cost 400,000 Beginning inventory, also at base year cost $ 20,000 Real increase in inventory quantity (new layer)
Step 3: Convert each layer’s base year cost to layer year cost using the cost index for the year it was acquired.
Ending Inventory Cost Ending Inventory Date at Base Year Cost x Index = at DVL Cost1/1/13 $400,000 1.00 $400,00012/31/13 20,000 1.05 21,000 Totals $420,000 $421,000
T8-22
Suggestions for Class Activities
1. Research Activity
Costco Wholesale Corporation (formerly Price/Costco) operates membership warehouses in 36 states, Puerto Rico, nine Canadian provinces, the United Kingdom, Korea, Japan, and Taiwan. It offers very low prices on a limited selection of nationally branded and selected private label products in a wide range of merchandise categories in no-frills, self-service warehouse facilities. Wal-Mart Stores, Inc., the largest retailer in the U.S., is engaged in the operation of mass merchandising stores located in all 50 states and a number of other countries. Have students, individually or in groups:
A. Access Walmart's most recent annual report using Edgar which can be located at www.sec.gov.
1. Determine the company's primary products and activities.
2. Using the data provided in the income statement and balance sheet, determine what the company' cost of goods sold (cost of sales) for the most recent year would have been if the company had used FIFO instead of LIFO to value its inventories.
B. Access Costco's most recent annual report using Edgar.
1. Determine the company's primary products and activities.
2. Predict which company, Walmart or Costco, has the higher gross profit ratio and the higher inventory turnover ratio.
3. Using the data provided in the income statements and balance sheets for the most recent fiscal year, confirm their predictions in 2 above.
Points to note:Students should predict a higher gross profit ratio and lower turnover ratio for Walmart. For the
2011 fiscal year:
Walmart CostcoGross profit ratio 25% 11%Inventory turnover ratio 9.13 11.9
Be sure to point out the different strategies employed by the two companies. Walmart marks up its product much more than Costco, but Costco turns its inventory much faster.
2. Real World Activity

Deere & Company provides products and services primarily for agriculture and forestry. The following disclosure notes appeared in the company’s financial statements for the six months ended April 30, 2011:
Inventories:
Most inventories owned by Deere & Company and its U.S. equipment subsidiaries are valued at cost, on the “last-in, first-out” (LIFO) basis. If all inventories had been valued on a “first-in, first-out” (FIFO) basis, estimated inventories by major classification at October 31 in millions of dollars would have been as follows:
April 30, Oct. 31, 2011 2010
Raw materials and supplies $ 1,445 $ 1,201Work-in-process 625 483Finished machines and parts 4,050 2,777
Total FIFO value 6,120 4,461Less adjustment to LIFO value 1,433 1,398Inventories $ 4,687 $ 3,063
The company reported cost of goods sold of $10,201 million in its income statement for the six months ended April 30, 2011.
Suggestions:Have the class answer the following questions:1. What would cost of goods sold for the six months ended April 30, 2011 have been if Deere
had used FIFO to value its entire inventory?2. Using the reported numbers, what was Deere’s average days in inventory for the six months
ended April 30, 2011?
Points to note:Cost of goods sold for the six months ended April 30, 2011 would have been lower by $35
million ($1,433 - $1,398) if Deere had used FIFO to value its entire inventory.

3. Professional Skills Development Activities
The following are suggested assignments from the end-of-chapter material that will help your students develop their communication, research, analysis and judgment skills.
Communication Skills. In addition to Communication Case 8-4, Communication Case 8-5 can be adapted to ask students to write a memo to the "intern," and Communication Case 8-10 can be adapted to ask students to write a memo to the "chief financial officer." Ethics Case 8-7 does well as a group assignment. Judgment Case 8-1 and Real World Case 8-8 create good class discussions. Real World Case 8-8, Research Case 8-11, and Analysis Case 8-12 are suitable for student presentation(s).
Research Skills. In their careers, our graduates will be required to locate and extract relevant information from available resource material to determine the correct accounting practice, perhaps identifying the appropriate authoritative literature to support a decision. Research Case 8-11 and Exercises 8-12 and 8-20 provide excellent opportunities to help students develop this skill. In addition, Real World Case 8-8 can be adapted to require students to research the authoritative literature on the presentation of supplemental LIFO disclosures.
Analysis Skills. The “Broaden Your Perspective” section includes Analysis Cases that direct students to gather, assemble, organize, process, or interpret data to provide options for making business and investment decisions. In addition to Analysis Case 8-12, Exercise 8-21, Problems 8-6, and 8-9; Judgment Case 8-1 and Real World Case 8-9 also provide opportunities to develop and sharpen analytical skills.
Judgment Skills. The “Broaden Your Perspective” section includes Judgment Cases that require students to critically analyze issues to apply concepts learned to business situations in order to evaluate options for decision-making and provide an appropriate conclusion. In addition to Judgment Cases 8-1, 8-3, and 8-6, Ethics Case 8-7 also requires students to exercise judgment.
CPA Simulation. Students can test their knowledge of the concepts discussed in this chapter and at the same time practice critical professional skills necessary for career success and preparation for the computer-based CPA Exam. The simulation for this chapter, Johnson Company, tests students’ knowledge of the physical quantities and costs that should be included in inventory. Access the simulations at the text website: www.mhhe.com/spiceland7e.