tyrosine phosphorylation of the insulin receptor during ... · the journal of biological chemistry...
TRANSCRIPT

THE JOURNAL OF BIOLOGICAL CHEMISTRY 0 1989 by The American Society for Biochemistry and Molecular Biology, Inc
Vol 264, No. 3, Issue of January 25, pp. 1694-1701,1989 Printed in U.S.A.
Tyrosine Phosphorylation of the Insulin Receptor during Insulin- stimulated Internalization in Rat Hepatoma Cells*
(Received for publication, June 14, 1988)
Jonathan M. Backer$, C. Ronald Kahn& and Morris F. Whiten From the Research Division, Joslin Diabetes Center. Deoartment of Medicine, Brigham and Women’s Hospital and Harvard Medical School, Boston, Massachusetts 02215 .
We have studied the phosphorylation state of the insulin receptor during receptor-mediated endocytosis in the well-differentiated rat hepatoma cell line Fao. Insulin induced the rapid internalization of surface- iodinated insulin receptors into a trypsin-resistant compartment, with a 3-fold increase in the internali- zation rate over that seen in the absence of insuln. Within 20 min of insulin stimulation, 30-35% of sur- face receptors were located inside the cell. This redis- tribution was half-maximal by 10.5 min. Similar re- sults were obtained when the loss of surface receptors was measured by ‘2SI-insulin binding. Tyrosyl phos- phorylation of internalized insulin receptors was meas- ured by immunoprecipitation with antiphosphotyro- sine antibody. Immediately after insulin stimulation, 70-80% of internalized receptors were tyrosine phos- phorylated. Internalized receptors persisted in a phos- phorylated state after the dissociation of insulin but were dephosphorylated prior to their return to the plasma membrane. After 45-60 min of insulin stimu- lation, the tyrosine phosphorylation of the internal receptor pool decreased by 45%, whereas the phospho- rylation of surface receptors was unchanged. These data suggest that insulin induces the internalization of phosphorylated insulin receptors into the cell and that the phosphorylation state of the internal receptor pool may be regulated by insulin.
Insulin alters cellular growth and metabolism by interacting with specific receptors present on the surface of most cells (1, 2). The specific binding of insulin to the a-subunit of the insulin receptor immediately stimulates the tyrosyl autophos- phorylation of the p-subunit (3). Autophosphorylation in- creases the phosphotransferase activity of the receptor toward other substrates (4 ,5) . Recent studies using in vitro mutagen- esis of the human insulin receptor and antibodies to the kinase domain have suggested that the tyrosine kinase activity of the insulin receptor is necessary for the transmission of the insulin signal (6-9).
The tyrosine kinase activity of the insulin receptor differ- entiates it from receptors such as those for transferrin or low
Grants DK31036, DK33201 (C. R. K.), DK38712 (M. F. W.), and * This work was supported in part by National Institutes of Health
Josh’s Diabetes Endocrinology Research Center Grant DK 36836. The costs of publication of this article were defrayed in part by the payment of page charges. This article must therefore be hereby marked “advertisement” in accordance with 18 U.S.C. Section 1734 solely to indicate this fact.
$ To whom correspondence should be addressed Research Divi- sion, Joslin Diabetes Center, One J o s h Place, Boston, MA 02215.
§ Recipient of the Pfizer Biomedical Research Award. ll Scholar of the PEW Foundation, Philadelphia.
density lipoprotein, whose primary function is transport. It nonetheless shares with these receptors the ability to be internalized with its ligand and to be recycled to the cell surface after discharging its ligand in an intracellular com- partment (10-16). The role of insulin-stimulated internaliza- tion of the insulin receptor in mediating insulin action is not clear. Internalization may be a mechanism for inactivating the receptor kinase through the dissociation and degradation of insulin (17, 18). Internalized receptors may, however, in- teract with cellular substrates which are not present or acces- sible in the plasma membrane (19). Internalized insulin recep- tors possess an inverted topological orientation necessary for interaction with intracellular substrates (13, 20). Further- more, insulin receptors present in light microsomal fractions from insulin-stimulated cells were found to be activated in subsequent in vitro kinase assays (21-23). Finally, when in- sulin receptors are trapped inside adipocytes by treatment with insulin and monensin, they retain stimulatory effects on glucose uptake (24). These studies suggest that the internal- ized insulin receptor may be biologically active. In addition, reports of defects in insulin receptor internalization in pa- tients with type I1 diabetes are consistent with a physiological role for endocytosis in insulin action (25, 26).
In the present work, we have studied the tyrosine phospho- rylation of the insulin receptor during insulin-stimulated in- ternalization in the rat hepatoma cell line Fao. Using cell- surface labeling and anti-phosphotyrosine antibody (a-PY)’ we have established the kinetics of receptor internalization and recycling in this cell line and determined the state of tyrosine phosphorylation of the internalized receptor, as well as the rate of its dephosphorylation inside the cell. Our data demonstrate in vivo the insulin-stimulated internalization of tyrosyl phosphorylated insulin receptors and suggest that the phosphorylation state of internalized receptors may be regu- lated by insulin.
EXPERIMENTAL PROCEDURES
Cell Culture-Fao cells are a well-differentiated cell line derived from the Reuber H35 rat hepatoma which possess a high concentra- tion of insulin receptors and many insulin-stimulated responses (27). The Fao cell cultures were maintained at 37 “C in a humidified atmosphere composed of 95% air and 5% COZ and grown in mono- layers on plastic tissue culture dishes (NUNC) containing RPMI- 1640 medium (GIBCO) supplemented with 10% fetal bovine serum (GIBCO). Cells were propagated by splitting 1:4 upon confluence using 0.05% trypsin. Cells were used for experiments on the first day of confluence, after an overnight incubation in serum-free media.
Surface Labeling of Fa0 Cells-Fao cells in 100-mm dishes were
The abbreviations used are: a-PY, anti-phosphotyrosine anti- body; SDS, sodium dodecyl sulfate; PAGE, polyacrylamide gel elec- trophoresis; HEPES, 4-(2-hydroxyethyl)-l-piperazineethanesulfonic acid; a-IR, anti-insulin receptor antibody; PBS, phosphate-buffered saline.
1694

Tyrosyl Phosphorylation of Internalized Insulin Receptors 1695
washed two times in ice-cold phosphate-buffered saline (PBS), pH 7.4, containing 2 mM CaC12 and 1 mM MgC12, pH 7.4. Cold PBS (3 ml) containing 10 mM glucose and 0.4 units/ml lactoperoxidase (Sigma) was added, and surface labeling was initiated by the addition of 1.25 mCi [1251]iodine (Amersham Corp., 350-600 Ci/ml) in 100 units/ml glucose oxidase (Sigma). The cells were incubated on ice for 30 min on a rocking platform, and the labeling was terminated by washing the cells five times with ice-cold PBS. Iodinated Fao cells were kept on ice until use.
Internalization of Iodinated Insulin Receptors-Internalization of insulin receptors was initiated by the incubation of Fao cells at 37 "C with "binding buffer" (RPMI-1640 containing 0.1% insulin-free bo- vine serum albumin (Arnell) and 25 mM HEPES, pH 7.4), and without or with 100 nM insulin. At various times, the medium was quickly removed and the cells immersed in "stopping solution" (ice-cold PBS containing Na3V04 (5 mM), ZnSO4 (100 pM) , and HEPES (50 mM, pH 7.4)). This solution was removed, and the cells were incubated on ice with 1 ml of stopping solution containing 0.5 mg/ml trypsin (Cooper) for 5 min. Trypsinization was terminated by the addition of 100 pl of 25 mg/ml soybeam trypsin inhibitor (Sigma), followed by two washes with stopping solution containing 2.5 mg/ml soybean trypsin inhibitor. After trypsinization, greater that 95% of cells were viable as assessed by exclusion of trypan blue.
The washed cells were solubilized in an ice-cold solution containing 50 mM HEPES, 1% Triton X-100, 10 mM sodium pyrophosphate, 100 mM NaF, 2 mM Na3V04, 2 mM phenylmethylsulfonyl fluoride, 2.5 mg/ml soybean trypsin inhibitor, and 0.1 mg/ml aprotinin. Insol- uble material was removed by centrifugation for 1 h at 50,000 rpm in a Beckman Ti-70.1 rotor. The insulin receptor was immunopurified from the supernatant with anti-insulin receptor antibody (a-IR) as previously described (28). Precipitated proteins were eluted by boiling for 3 min in Laemmli sample buffer (29) containing 100 mM dithio- threitol and separated by SDS-PAGE on 7.5% resolving polyacryl- amide gels. The gels were fixed with 5% trichloroacetic acid and dried, and the iodinated proteins were detected by autoradiography for 7- 10 days using Kodak X-Omat film with an intensifying screen. The a-subunit of the insulin receptor was quantified by scanning densi- tometry (Hoeffer) of the developed film. Control experiments estab- lished the linear response range of the film to a standard curve of surface-iodinated insulin receptors immunoprecipitated and sepa- rated as described above; film exposure times were chosen to keep the bands of interest within this range. Quantification of a-subunit intensities was normalized to the intensity of the @-subunit bands in each lane, since the @-subunit is not affected by cell-surface trypsin- ization (30) and correlates with the labeling efficiency of each plate (data not shown).
Internalization of the Insulin Receptor Measured by Surface Bind- ing-Fao cells were washed twice in PBS, then incubated for various time intervals in binding buffer containing 100 nM insulin. At each time point, the solution was rapidly removed and the cells washed with ice-cold PBS and subsequently kept on ice. The cells were then washed twice for 3 min in acidic PBS, pH 3.0, containing 0.1% bovine serum albumin and once in neutral PBS, pH 7.4. The number of insulin receptors remaining at the surface was estimated by the specific binding of 10"' M 1251-insulin (2000 Ci/mmol, Amersham Corp.) during 12 h in binding buffer at 4 "C. Nonspecific binding was measured in the presence of 1 p~ insulin. At the end of the incubation, free insulin was removed by washing the cells two times in PBS containing 0.1% bovine serum albumin and once in PBS. The cells were solubilized in 0.5 M NaOH, 0.1% SDS, and the radioactivity was determined by counting in a GammaTrac 1290 y-counter (TM Ana- lytic). Protein content was determined by the method of Bradford (Bio-Rad) or Redinbaugh and Turley (Pierce) (31, 32).
Kinetic Model-The analysis of kinetic data used here is a modi- fication of that used by Schwartz et al. (33) to study the internaliza- tion and recycling of the asialoglycoprotein receptor in Hep G2 hepatoma cells (Fig. 1). R, and Ri are the concentrations of unoccu- pied receptors at the cell surface and inside the cell, respectively. RL, and RLi are the concentrations of insulin-receptor complexes at the cell surface and inside the cell, respectively. To simplify the kinetic analysis, experiments were performed in the complete absence of insulin or at saturating levels of insulin (100 nM). This allows us to neglect the rate of receptor-ligand binding at the cell surface, since this is an extremely rapid event at high insulin concentrations. Moreover, under these conditions nearly 100% of the surface recep- tors are occupied with insulin and the concentration of free receptor at the cell surface is negligible. We do not consider the possibility of multiple occupancy of the receptor-binding sites by insulin. These
Ligand Stimulated Constitutive Internalization Internalization
Inaulln
R O
+ I Ri
100 nM Insulin No Insulin
FIG. 1. Kinetic model for internalization and recycling of the insulin receptor. R, and RL, represent unoccupied and occupied surface receptors, respectively. RLi and Ri represent unoccupied and occupied internal receptors. k; is the rate constant for internalization of receptors in the presence of insulin, and k,f is the rate constant for recycling of internalized receptors in the presence of insulin. ki, is the rate constant for the internalization of receptors in the absence of insulin, and k; is the rate constant for recycling of internalized receptors in the absence of insulin.
simplifications reduce the kinetic model of receptor internalization and recycling to a series of first order processes. The use of saturating levels of insulin, furthermore, allows us to neglect recently described pathways of internalization and recycling which operate at low levels of insulin (34). The rate constants for the internalization of the receptor in the absence of insulin or in the presence of saturating concentrations of insulin are ki, and k;, respectively. The rate of retroendocytosis of receptor-ligand complexes is negligible in Fao cells (data not shown). Thus, the return of internalized receptors to the cell surface depends only on the concentration of free intracellular receptors. In the absence of insulin, the rate constant for this process is k;. In the presence of insulin, the return of internalized receptors to the cell surface depends on the rate of insulin dissociation from its receptor inside the cell, as well as the rate of unoccupied receptor recycling. In the present analysis, however, we consider only the combined rate constant k:, which reflects the rate constants for both ligand uncoupling and for the recycling of unoccupied receptors.
Degradation of iodinated receptors during the periods of study is negligible (data not shown). The total number of receptors can therefore be defined arbitrarily as one. If the total amount of internal receptor is Ri, the number of unoccupied surface receptors is R, and the number of cell surface receptor-ligand complexes is RL,, then at equilibrium in the presence of 100 nM insulin:
dRi/dt = -(k:Ri) + k;R,, + k:RL.
This formulation assumes that the rate of retroendocytosis of receptor-ligand complexes is negligible in Fao cells. Since R, = 0 at saturating insulin concentrations, then
RL, + Ri = 1
and
dRi/dt = k: - [k: + k,+]R,.
Subject to the boundary values Y(0) = 0 and Y(60) = 0.35, the exact solution in the presence of saturating insulin is:
Internal receDtors
A similar expression can be derived in the absence of insulin, when RL, = 0 and
dRi/dt = -(k;R,) + k;R,.
= k; - [k; + k;]Ri.
This is an equation of the same general form which, subject to the boundary values Y(0) = 0 and Y(60) = 0.12, yields the solution in the absence of insulin:
1696 Tyrosyl Phosphorylation of Internalized Insulin Receptors Internal receptors
The rate constants k f , ki,, k: and k; can be determined directly by a numerical solution of Equations 1 and 2 using a least squares curve fit of the data shown in Fig. 3A.
Tyrosine Phosphorylation of Insulin Receptors in Fa0 Cells-Iodi- nated Fao cells were incubated with binding buffer containing 100 nM insulin a t 37 "C. At the indicated time intervals, the cells were rapidly washed with ice-cold stopping solution and solubilized, and the proteins immunoprecipitated with a-IR or a-PY and analyzed as above for the presence of immunopurified insulin receptor.
Tyrosine Phosphorylation of Internalized Insulin Receptors-Iodi- nated Fao cells were stimulated with insulin, trypsinized, and solu- bilized as described above for the measurement of receptor internal- ization. After the removal of insoluble material, the samples were divided into equal portions and immunoprecipitated with either a-IR or a-PY. Immunoprecipitates were then separated on SDS-PAGE and analyzed as described above.
Tyrosine Phosphorylation of Plasma Membrane Insulin Receptors- Unlabeled Fao cells were incubated with binding buffer in the absence or presence of 100 nM insulin at 37 "C. At the indicated time intervals, the cells were rapidly washed with ice-cold stopping solution and kept on ice. The cells were then surface-iodinated at 4 "C as described above, with the substitution of stopping solution for PBS in the glucose/lactoperoxidase and glucose oxidase solutions. After termi- nating the iodination by washing the cells five times in ice-cold stopping solution, the cells were solubilized, and the proteins immu- noprecipitated with a-IR or a-PY and analyzed as above for the presence of immunopurified insulin receptor. Control experiments, in which surface-labeled cells were stimulated with insulin a t 37 "C and then chilled and solubilized immediately or after incubation at 4 "C for 30 min, showed that the tyrosine phosphorylation of the insulin receptor did not change during the incubation at 4 "C (data not shown).
Insulin Receptor Tyrosine Phosphorylation during Recycling of In- ternalized Receptors to the Cell Surface-Iodinated Fao cells were incubated in binding buffer containing 100 nM insulin for 30 min at 37 "C. The cells were then washed with binding buffer containing anti-insulin antibody for 5 min at 37 "C, which removed >90% of surface-bound insulin (data not shown), and the cells were incubated in fresh binding buffer without insulin a t 37 "C. At the indicated time intervals, the cells were rapidly washed with ice-cold stopping solu- tion, trypsinized at 4 "C, solubilized, immunoprecipitated with a-IR or a-PY, and analyzed as above for the presence of trypsin-resistant a-subunit bands.
RESULTS
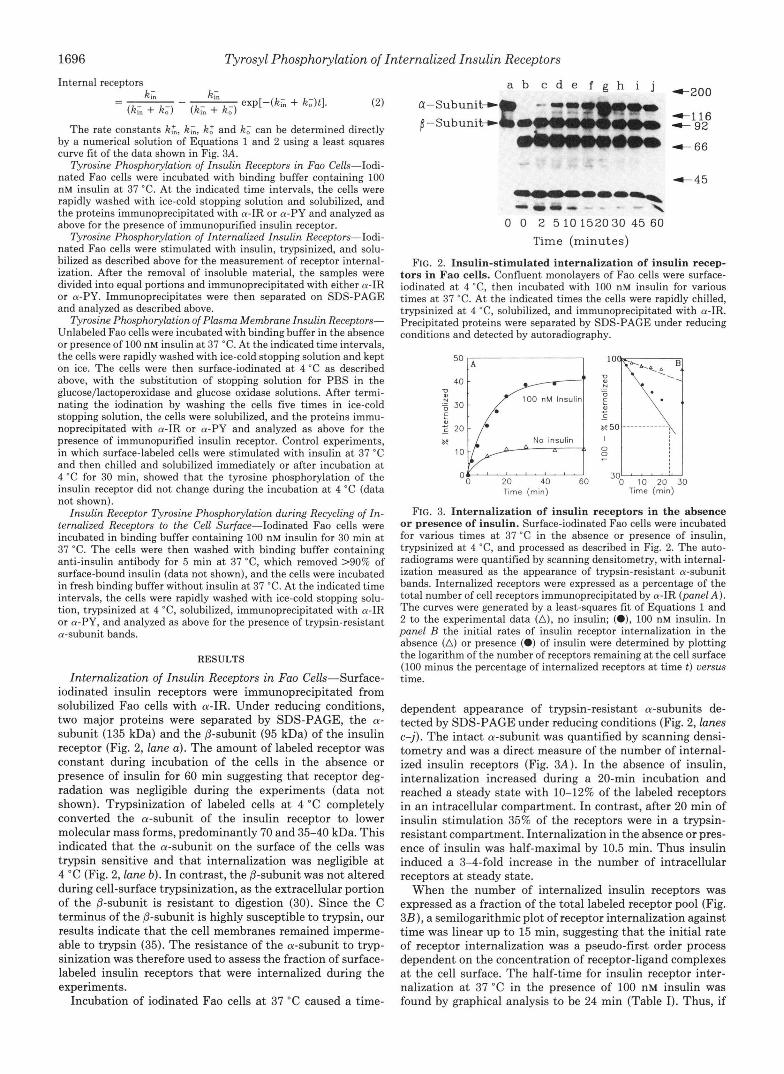
Internalization of Insulin Receptors in Fa0 Cells-Surface- iodinated insulin receptors were immunoprecipitated from solubilized Fao cells with a-IR. Under reducing conditions, two major proteins were separated by SDS-PAGE, the CY-
subunit (135 kDa) and the @-subunit (95 kDa) of the insulin receptor (Fig. 2, lane a). The amount of labeled receptor was constant during incubation of the cells in the absence or presence of insulin for 60 min suggesting that receptor deg- radation was negligible during the experiments (data not shown). Trypsinization of labeled cells at 4 "C completely converted the a-subunit of the insulin receptor to lower molecular mass forms, predominantly 70 and 35-40 kDa. This indicated that the a-subunit on the surface of the cells was trypsin sensitive and that internalization was negligible at 4 "C (Fig. 2, lane b) . In contrast, the @-subunit was not altered during cell-surface trypsinization, as the extracellular portion of the @-subunit is resistant to digestion (30). Since the C terminus of the @-subunit is highly susceptible to trypsin, our results indicate that the cell membranes remained imperme- able to trypsin (35). The resistance of the a-subunit to tryp- sinization was therefore used to assess the fraction of surface- labeled insulin receptors that were internalized during the experiments.
Incubation of iodinated Fao cells at 37 "C caused a time-
a-Subunit4 /-Subunit+
a b c d e f a h i i
f 92 e l 16
t 66
t 45
0 0 2 5 10 152030 45 60 Time (minutes)
FIG. 2. Insulin-stimulated internalization of insulin recep- tors in Fao cells. Confluent monolayers of Fao cells were surface- iodinated at 4 "C, then incubated with 100 nM insulin for various times at 37 "C. At the indicated times the cells were rapidly chilled, trypsinized at 4 "C, solubilized, and immunoprecipitated with a-IR. Precipitated proteins were separated by SDS-PAGE under reducing conditions and detected by autoradiography.
Time (rnin) Time (rnin)
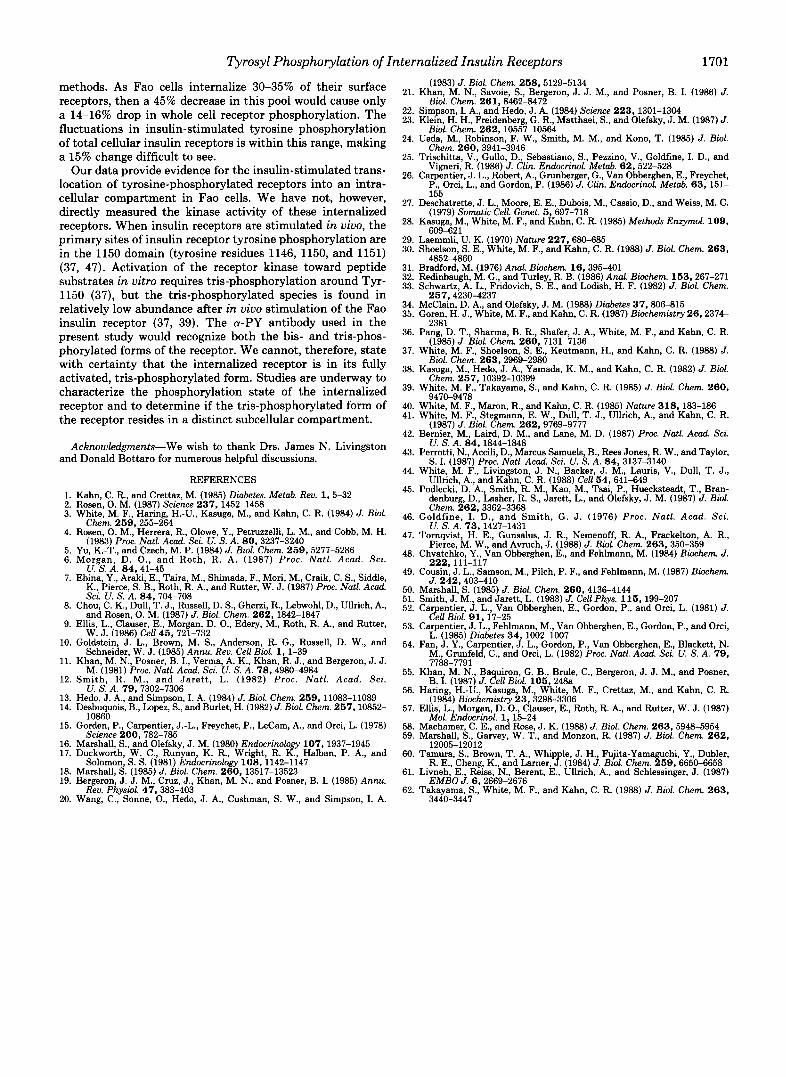
FIG. 3. Internalization of insulin receptors in the absence or presence of insulin. Surface-iodinated Fao cells were incubated for various times at 37 "C in the absence or presence of insulin, trypsinized at 4 "C, and processed as described in Fig. 2. The auto- radiograms were quantified by scanning densitometry, with internal- ization measured as the appearance of trypsin-resistant a-subunit bands. Internalized receptors were expressed as a percentage of the total number of cell receptors immunoprecipitated by a-IR (panel A ) . The curves were generated by a least-squares fit of Equations 1 and 2 to the experimental data (A), no insulin; (O), 100 nM insulin. In panel B the initial rates of insulin receptor internalization in the absence (A) or presence (0) of insulin were determined by plotting the logarithm of the number of receptors remaining at the cell surface (100 minus the percentage of internalized receptors a t time t) uersw time.
dependent appearance of trypsin-resistant a-subunits de- tected by SDS-PAGE under reducing conditions (Fig. 2, lanes c-j). The intact a-subunit was quantified by scanning densi- tometry and was a direct measure of the number of internal- ized insulin receptors (Fig. 3A). In the absence of insulin, internalization increased during a 20-min incubation and reached a steady state with 10-12% of the labeled receptors in an intracellular compartment. In contrast, after 20 min of insulin stimulation 35% of the receptors were in a trypsin- resistant compartment. Internalization in the absence or pres- ence of insulin was half-maximal by 10.5 min. Thus insulin induced a 3-4-fold increase in the number of intracellular receptors a t steady state.
When the number of internalized insulin receptors was expressed as a fraction of the total labeled receptor pool (Fig. 3B) , a semilogarithmic plot of receptor internalization against time was linear up to 15 min, suggesting that the initial rate of receptor internalization was a pseudo-first order process dependent on the concentration of receptor-ligand complexes at the cell surface. The half-time for insulin receptor inter- nalization at 37 "c in the presence of 100 nM insulin was found by graphical analysis to be 24 min (Table I). Thus, if

Tyrosyl Phosphorylation of Internalized Insulin Receptors 1697 TABLE I
Rate constants for the internalization and recycling of the insulin receptor in the absence and presence of insulin
The rate constants for insulin receptor internalization were deter- mined from an interative least-squares fit of Equations 1 and 2 to the data shown in Fig. 3A (numerical analysis). Alternatively, the initial rates of receptor internalization were derived from the semilogarith- mic plot of (100 minus the percentage of internalized receptors a t time t) versus time shown in Fig. 3B. (graphical analysis). k; and k: are the rate constants for internalization in the absence and presence of insulin, respectively. The rate constants for recycling in the absence or presence of insulin, k; and k:, were determined by a least-squares solution of Equations 1 and 2.
constant Half-time Rate
min Internalization, no insulin
Numerical analysis k; = 0.012 58 Graphical analysis k; = 0.010 70
Numerical analysis k: = 0.033 21 Graphical analysis k: = 0.029 24
Numerical analysis k , = 0.092 7.5
Numerical analysis k: = 0.048 14
Internalization, 100 nM insulin
Recycling, no insulin
Recycling, 100 nM insulin
0 10 20 30 40 50 60
Time (minutes)
FIG. 4. Insulin-stimulated loss of surface insulin binding. Confluent monolayers of Fao cells were incubated with 100 nM insulin a t 37 "C for various times. At the indicated times the cells were rapidly chilled and washed with acidic PBS to remove surface-bound insulin as described under "Experimental Procedures." Specific lZ5I- insulin binding during 16 h at 4 "C in binding buffer was then determined. The data represents the mean & S.E. of four replicates.
no recycling occurred, half of the surface receptors would be internalized during this time interval. In the absence of in- sulin, the half-time for internalization was 70 min. The entire progress curves of receptor internalization obtained in the absence and presence of insulin were analyzed using the model in Fig. 1; Equations 1 and 2 were solved numerically by a least-squares fit to the data shown in Fig. 3A. The derived half-times for the internalization of the insulin receptor in the absence and presence of insulin were 58 and 21 min, respectively (Table I) and were in good agreement with the values derived from Fig. 3B. Insulin increased the internali- zation rate constant, I&, about %fold relative to the value obtained for the unoccupied receptor, ki,. Our analysis also suggested that the apparent recycling rate was decreased 2- fold in the presence of insulin, thereby contributing to the size of the intracellular receptor pool.
The rate of insulin receptor internalization was confirmed by measuring the insulin-stimulated loss of surface insulin binding. After insulin stimulation, cells were acid washed to remove surface-bound insulin and surface receptors were measured by specific '2SI-insulin binding. Insulin induced a 30% decrease in surface insulin binding which reached steady- state after 20-30 min (Fig. 4). This change in surface binding
was half-maximal by 9-10 min, which is in good agreement with the time at which internalization of the iodinated recep- tor reached half-maximal levels (Fig. 3A). Thus, the behavior of the iodinated receptor approximated closely that of the native receptor in Fao cells.
Tyrosine Phosphorylation of Insulin Receptors from Insulin- stimulated Fa0 Cells-Tyrosine phosphorylation of the iodi- nated insulin receptor was studied by immunoprecipitation of solubilized cells with a-PY (36). In the absence of insulin stimulation, both the a- and p-subunits of the iodinated insulin receptor were detected with a-IR (Fig. 5, lane a). In contrast, no iodinated proteins were immunoprecipitated by a-PY, suggesting that the insulin receptor did not contain phosphotyrosyl residues under basal conditions (Fig. 5, lane b ) . After 2 min of insulin stimulation, however, a-PY detected the a- and P-subunits (Fig. 5, lane c). Although tyrosine phosphorylation of the receptor is confined to its p-subunit (37), both subunits were immunoprecipitated with a-PY since the azp2 form of the receptor remains intact after Triton X- 100 solubilization (38). The tyrosyl phosphorylation of the insulin receptor was maximal after 2-5 min and remained constant during 60 min of insulin stimulation (Fig. 5, lanes c-f ). These data are consistent with previous results in ["PI phosphate-labeled cells (39).
Tyrosine Phosphorylation of Internalized Insulin Recep- tors-Tyrosyl phosphorylation of the internalized receptor was analyzed by immunoprecipitation with a-PY of iodinated proteins from trypsinized Fao cells. In the absence of insulin stimulation or trypsinization, tyrosine phosphorylated recep- tor was not detectable (Fig. 6, lane a). Trypsinization of unstimulated cells at 4 "C caused some tyrosyl phosphoryla- tion of the insulin receptor because truncation of the a- subunit releases the tyrosine kinase in the @-subunit from inhibition, resulting in receptor autophosphorylation (30). Two iodinated proteins with molecular masses of 95 and 70 kDa were detected with a-PY, corresponding to the intact B- subunit and truncated a-subunit. Although trypsin activated the receptors remaining in the plasma membrane, they were easily distinguished from internalized tyrosyl phosphorylated receptors which possessed intact a-subunits. Thus, a-PY can be used to measure the tyrosyl phosphorylation of internal- ized, trypsin-resistant receptors.
The internalization of tyrosine-phosphorylated insulin receptors in insulin-stimulated cells was measured as the time-dependent appearance of intact, trypsin-resistant a-sub- unit bands (Fig. 6, lanes c-j). Insulin caused the internaliza-
a b c d e f g h i . ,"W. "I "1pI "W" D r-"e" 1- ?3"
4 200
4- 116 -Subunit+ 4- 92
4 66
a-Subunit-
#- 45
0 0 2 5 1020 3045 60
Time (min) FIG. 5. Tyrosine phosphorylation of insulin receptors in
Fao cells. Surface-iodinated Fao cells were stimulated with insulin a t 37 "C for various times. At the indicated times the cells were rapidly chilled, solubilized, and immunoprecipitated with a-IR ( l a n e a) or a-PY (lanes b-f ). Immunoprecipitates were separated by SDS- PAGE under reducing conditions and visualized by autoradiography.

1698 Tyrosyl Phosphorylation of Internalized Insulin Receptors
a-Subunit-, /-Subunit+
. . 200
4 116 4 92 4 66
4 45
0 0 2 5 10 15 20 30 45 60
Time (minutes)
FIG. 6. Internalization of tyrosyl-phosphorylated insulin receptors in Fao cells. Confluent monolayers of Fao cells were surface-iodinated at 4 "C and stimulated with 100 nM insulin a t 37 "C for various times. At the indicated times, the cells were rapidly chilled, trypsinized at 4 "C, solubilized, and immunoprecipitated with a-PY. Labeled proteins were separated by SDS-PAGE under reducing con- ditions and visualized by autoradiography.
tion of phosphotyrosine-containing insulin receptors within 5 min of insulin stimulation. The internalization of tyrosine phosphorylated receptors reached maximum levels within 20 min, a result similar to that seen with a-IR for the total receptor pool (Fig. 2).
After 20 min of insulin stimulation, the total number of internalized receptors detected with a-IR reached a steady state and remained constant for 60 min (Fig. 2). In contrast, during 30-60 min of insulin stimulation the number of recep- tors immunoprecipitated with a-PY decreased (Fig. 6, lanes i and j ) . When the number of internalized receptors immuno- precipitated with a-IR and a-PY were directly compared in another experiment, both antibodies precipitated equal amounts of receptor at early time points (Fig. 7A). This correspondence suggests that most internalized receptors con- tained phosphotyrosine during the first 20 min of insulin stimulation. Although the extent of internalization was some- what lower than that seen in Figs. 3 and 4, the number of internalized receptors immunoprecipitated with a-IR reached steady state levels by 20 min. Between 30 and 60 min, how- ever, fewer internalized receptors were immunoprecipitated with a-PY, indicating a decrease in the level of tyrosyl phos- phorylation of the intracellular receptor pool. In data derived from six separate experiments, tyrosyl phosphorylation was measured as the ratio of internalized receptors immunopre- cipitated from the same sample by a-PY uerszu a-IR and was normalized to the degree of whole cell phosphorylation ob- served in each experiment (Fig. 7B). Internalized receptors were predominantly phosphorylated on tyrosine residues dur- ing the first 20 min of insulin stimulation, with a mean from six experiments of 7040% of internalized receptors immu- noprecipitable with a-PY. However, after 45-60 min of insulin stimulation, the percentage of internalized receptors which were immunoprecipitable with a-PY decreased by 45%. This decrease was in marked contrast to the constant level of tyrosine phosphorylated receptor seen in whole cell extracts (Fig. 5 ) .
Tyrosine Phosphorylation of Cell-surface Receptors-To better compare the phosphorylation state of insulin receptors in the internal and cell surface pools, we measured the tyrosyl phosphorylation of insulin receptors remaining in the plasma membrane by surface-iodinating Fao cells at the end of vary- ing periods of insulin stimulation, followed by immunoprecip- itation with a-PY. In the absence of insulin stimulation, tyrosine-phosphorylated receptors were not detectable (Fig.
30
c '. -.
' 0 10 20 30 40 50 60 Time (minutes)
RL ' 0 10 20 30 40 50 60
Time (minutes)
FIG. 7. Tyrosyl phosphorylation of internalized insulin receptors in Fao cells. Surface-iodinated Fao cells were stimulated with insulin at 37 "C and trypsinized a t 4 "C as described in Fig. 6. The cells were solubilized and immunoprecipitated with a-IR or a- PY, and the proteins were separated by SDS-PAGE. Autoradiograms of the resultant gels were quantified by scanning densitometry. In panel A, the percentage of trypsin-resistant a-subunits immunopre- cipitated by a-IR (0) and a-PY (A) in a single experiment was plotted against time. In panel B, the ratio of trypsin-resistant a-subunits immunoprecipitated by a-PY uersus a-IR was plotted against time. These data represent the mean f S.E. from six separate experiments.
a b c - 200
C- 116 - 92
CI -Subunit - ,!? -Subunit - 66 - 45
Time (Min) 0 5 60 FIG. 8. Tyrosine phosphorylation of plasma membrane in-
sulin receptors in Fao cells. Confluent monolayers of Fao cells were stimulated with 100 nM insulin a t 37 "C. At the indicated times, the cells were rapidly chilled and surface-iodinated at 4 "C as de- scribed under "Experimental Procedures." The labeled cells were solubilized and immunoprecipitated with a-PY, separated by SDS- PAGE under reducing conditions, and visualized by autoradiography.
8, lane a). Tyrosyl phosphorylation of plasma membrane insulin receptors was evident within 5 min of insulin stimu- lation (Fig. 8, lane b); approximately 70-80% of the total number of cell-surface receptors immunoprecipitated with a- IR were recognized by a-PY (data not shown). The level of tyrosine phosphorylation of the plasma membrane receptor pool remained constant after 60 min of insulin stimulation (Fig. 8, lune c), a result similar to that seen for the total cellular receptor pool (Fig. 5). Thus, the decrease in tyrosyl phosphorylation of internalized insulin receptors (Figs. 6 and

Tyrosyl Phosphorylation of Internalized Insulin Receptors 1699
0 10 20 30 40 50
Time (minutes) FIG. 9. Dephosphorylation of internalized insulin receptors
during recycling in Fao cells. Confluent monolayers of Fao cells were surface-iodinated at 4 "C and stimulated with 100 nM insulin at 37 "C for 30 min. The cells were washed with anti-insulin antibody to remove surface-bound ligand and incubated in the absence of insulin at 37 "C for various additional times. At the indicated times, the cells were rapidly chilled, trypsinized at 4 "C, solubilized, and immunoprecipitated with or-IR (0) or a-PY (A). The labeled proteins were separated by SDS-PAGE under reducing conditions, visualized by autoradiography, and quantified by scanning densitometry. Tryp- sin resistant a-subunit bands were expressed as percentages of the total number of labeled receptors immunoprecipitated by each anti- body.
7) was specific to receptors in the intracellular pool. Tyrosine Phosphorylation of Internalized Insulin Receptors
during Recycling to the Plasma Membrane-To study the tyrosine phosphorylation of internalized insulin receptors during their return to the cell surface, surface-iodinated Fao cells were stimulated with insulin to induce insulin receptor internalization. The cells were then incubated without insulin for various times and the subsequent loss of trypsin-resistant, internalized receptors was detected using a-IR and a-PY antibodies (Fig. 9). The decrease in the total number of internalized receptors immunoprecipitated with a-IR reflects the time course for the recycling of internalized receptors to the cell surface and shows the return of the system from an insulin-stimulated to a basal level of internalization. The decrease in the number of internalized receptors detected by a-PY, on the other hand, reflects changes both in the number of internalized receptors and in their phosphorylation state. The decrease in intracellular tyrosine-phosphorylated recep- tors after insulin withdrawal is faster than the decrease in the total number of intracellular receptors. Thus, the internalized receptors are dephosphorylated prior to their return to the plasma membrane.
DISCUSSION
There is increasing evidence that transmission of the in- sulin signal inside cells is initiated by tyrosine autophospho- rylation of the /3-subunit of the insulin receptor kinase. One mechanism by which this signal could be propagated beyond the plasma membrane to intracellular sites is by the tyrosine phosphorylation of cytoplasmic substrates such as pp185 or other proteins (40-44). In addition to this putative signaling pathway, the insulin receptor is a mobile tyrosine kinase which undergoes an insulin-stimulated translocation into the cell (21, 23, 45, 46). This provides an additional route by which the activated insulin receptor can directly interact with
FIG. 10. Model of the tyrosine phosphorylation of the insu- lin receptor during insulin-stimulated endocytosis in Fao cells.
distant intracellular structures. The route of insulin receptor internalization and recycling
in Fao cells is shown in Fig. 10. Before insulin stimulation, approximately 90% of the receptors are located at the cell surface. Under these conditions the rate of internalization (tH = 58 min) is slow relative to the rate of recycling ( tlh = 7 min). Immediately after insulin binding, the insulin receptor under- goes autophosphorylation in at least two domains of the /3- subunit: the C terminus including Tyr-1316 and Tyr-1322, and the regulatory region including Tyr-1146, 1150, and 1151 (37,47). After 5 min of insulin stimulation, phosphotyrosine- containing receptors are detected inside Fao cells. Internali- zation of activated insulin receptors into Fao cells is therefore a relatively fast process, consistent with the hypothesis that internalization affords the activated receptor kinase access to intracellular substrates. The increase in the intracellular receptor pool is caused by a %fold acceleration in the rate of receptor internalization (tlh = 21 min) and a 2-fold decelera- tion in the rate of recycling (txh = 14 min).' A new steady state distribution is reached within 20 min with 35% of the insulin receptors inside of the cell; of these about 70-80% are tyrosine phosphorylated. The internalized receptors remain phospho- rylated even after the dissociation of insulin (see below), but undergo dephosphorylation before recycling to the plasma membrane.
Internalization of the insulin receptor is half-maximal by 10 min of insulin stimulation. This is somewhat slower than in adipocytes or Hep G2 cells, where half-times for internali- zation of 2-5 min hve been reported (49, 50). It is unlikely that the differences in internalization rates reflect the use of surface iodination in the present studies. Iodinated receptors in Fao cells internalize with rates similar to that of unlabeled receptors. Furthermore, 70-80% of the labeled receptors undergo insulin-stimulated autophosphorylation. These re- sults are consistent with previous studies on 32P-labeled cells and indicate that iodination does not inactivate the insulin receptor (36). The variation in internalization rates in these different cell lines may reflect the rate of movement of recep- tor-ligand complexes to plasma membrane domains from which internalization can be initiated or may reflect the
'These data are in disagreement with a previous report which could not detect insulin-stimulated internalization of insulin recep- tors in Fao cells (48). The reason for this discrepancy is unclear.

1700 Tyrosyl Phosphorylation of Internalized Insulin Receptors
number of these domains (51-54). Alternatively, they may reflect differences in the endocytotic machinery or the re- sponsiveness of this machinery to insulin. It should be noted that our analysis has treated internalization and recycling as single compartment models. The existence of two pathways of insulin receptor recycling which are distinguishable at different levels of receptor occupancy has been recently dem- onstrated in Hep G2 hepatoma cells (34). Our studies, per- formed at saturating levels of ligand, yield apparent rate constants which nonetheless accurately describe receptor movement.
The half-time for recycling of internalized receptors in the presence of insulin is 14 min, and the average intracellular residence time of the receptor is 20.1 min, that is tlh/ln 2 (33). Thus, progress curves for insulin receptor internalization reach steady state after 20 min of insulin stimulation, as internalized receptors return to the cell surface (Fig. 3A). Interestingly, the return of the internalized insulin receptor to the cell surface is affected by ligand, with a 2-fold reduction in the rate constant for recycling in the presence of insulin. Although the half-times for recycling in the absence and presence of insulin are not directly measured, they may reflect a difference in the intracellular routing of the receptor-ligand complex from that of the receptor alone. It is also possible that the tyrosine phosphorylation of the internalized receptor may influence its rate of passage through the cell (see below).
Insulin stimulation of Fao cells leads to the tyrosine phos- phorylation of 70-80% of surface-labeled insulin receptors. Maximal phosphorylation of both plasma membrane and total cell receptors is reached by 2 min and remains constant over 60 min of insulin stimulation. The finding that 70-80% of internalized receptors are tyrosyl-phosphorylated is consist- ent with studies showing a preferential internalization of activated receptors in adipocytes (23). Recent work in other laboratories has suggested that activation of the insulin recep- tor tyrosine kinase in liver may only occur after internaliza- tion into an endosomal compartment (55). While the present experiments do not directly measure kinase activity, they do demonstrate tyrosine phosphorylation of both plasma mem- brane and intracellular receptor pools within minutes of in- sulin stimulation.
The purified insulin receptor is devoid of intrinsic phos- phatase activity, and the purified receptor persists in a tyro- sine-phosphorylated state after the removal of insulin (4,56). The fate of the internalized tyrosine phosphorylated receptor after the dissociation of insulin inside the cell is therefore not clear (56). The half-time for recycling of the internalized receptor in Fao cells is 14 min (Table I) with an average intracellular residence of 20.1 min. The half-time for dissocia- tion of insulin from its intracellular receptor in Fao cells is 3 min.3 Thus, the internalized insulin receptors are free of ligand during much of their intracellular trafficking. None- theless, at 20 min, when internalization has reached steady state, 70-80% of internalized receptors are tyrosine phos- phorylated. Therefore the internalized insulin receptor appar- ently persists in a tyrosine-phosphorylated state after the dissociation of its ligand, with a lag of several minutes between insulin dissociation and the dephosphorylation of the inter- nalized receptor.
Internalized receptors do, however, dephosphorylate before returning to the cell surface; similar conclusions have been reached in adipocytes (23). It is not clear whether dephospho- rylation of the receptor is required for recycling to occur. The ability of a constitutively activated insulin receptor, such as that created by mild surface trypsinization, to internalize and
J. M. Backer, C. R. Kahn, and M. F. White, submitted.
recycle has not been studied. Interestingly, a constitutively activated receptor mutant containing a truncated a-subunit was not expressed in the plasma membrane of Chinese ham- ster ovary cells; carbohydrate analysis suggested retention in the endoplasmic reticulum or cis Golgi (57). While mutant membrane proteins with altered glycosylation sites are often deficient in transport to the cell surface (58), it is also possible that constitutive tyrosine phosphorylation of the insulin receptor (3-subunit prevents movement to the plasma mem- brane. Treatment of adipocytes with vanadate, which inhibits intracellular phosphatases, did not affect the size of the in- sulin-stimulated internal receptor pool (59, 60). It did, how- ever, alter the degradative processing of internalized insulin (59). Furthermore, epidermal growth factor receptor mutants which lack tyrosine kinase activity internalize normally yet do not undergo ligand-stimulated degradation (61). Thus, tyrosine phosphorylation may affect both receptor recycling and intracellular routing.
The phosphorylation state of the internalized insulin recep- tors changes markedly after long periods of insulin stimula- tion, with a 45% decrease in tyrosine phosphorylation after 60 min. The cause of this reduction in the net tyrosine phosphorylation of the internal receptor pool is not clear. A decrease in the kinase activity of internalized insulin receptors was reported in adipocytes and may reflect a similar process (23). In Fao cells the decrease in tyrosine phosphorylation of the internalized receptor occurs after the processes of inter- nalization and recycling have reached equilibrium. It is there- fore unlikely that this decrease is a result of deactivation of internalized receptors prior to their reinsertion in the plasma membrane during the normal course of receptor trafficking. This decrease may instead reflect an additional regulation of insulin receptor tyrosine phosphorylation during prolonged insulin stimulation.
Whereas the in vivo phosphorylation of the insulin receptor after insulin binding is initially on tyrosine residues, an increase in serine phosphorylation of the receptor is observed after 10 or more min of stimulation (36). Serine phosphoryl- ation of the insulin receptor has been shown to inhibit recep- tor kinase activity and autophosphorylation (62), and could provide a possible mechanism to explain our observations. Validation of this hypothesis will require the direct measure- ment of the serine phosphorylation of internalized insulin receptors after varying times of insulin stimulation. Alterna- tively, the decrease in intracellular receptor tyrosine phos- phorylation may be due to an increase in the activity of intracellular tyrosyl phosphatases. An activation of cellular phosphatases would preferentially decrease the tyrosine phos- phorylation of the internal receptors as these receptors would not be rephosphorylated until they recycled back to the cell surface.
In this regard, it is interesting to note that the tyrosine phosphorylation of a cytosolic substrate of the insulin recep- tor, pp185, begins to decrease after 30 min of insulin stimu- lation in Fao cells (41). The similar time courses of these changes in the level of tyrosine phosphorylation of these different phosphoproteins would be consistent with existence of an insulin-stimulated tyrosyl phosphatase. Alternatively, the changes in the tyrosine phosphorylation of pp185 may be secondary to a reduction in intracellular insulin receptor activation.
Although the observed decrease in tyrosine phosphorylation of internalized insulin receptors after 60 min of insulin stim- ulation is quite significant, we were unable to detect a signif- icant drop in receptor phosphorylation in the whole cell. This is most likely due to limitations in the sensitivity of our
Tyrosyl Phosphorylation of Internalized Insulin Receptors 1701
methods. As Fao cells internalize 30-35% of their surface receptors, then a 45% decrease in this pool would cause only a 14-16% drop in whole cell receptor phosphorylation. The fluctuations in insulin-stimulated tyrosine phosphorylation of total cellular insulin receptors is within this range, making a 15% change difficult to see.
Our data provide evidence for the insulin-stimulated trans- location of tyrosine-phosphorylated receptors into an intra- cellular compartment in Fao cells. We have not, however, directly measured the kinase activity of these internalized receptors. When insulin receptors are stimulated in uiuo, the primary sites of insulin receptor tyrosine phosphorylation are in the 1150 domain (tyrosine residues 1146, 1150, and 1151) (37, 47). Activation of the receptor kinase toward peptide substrates in uitro requires tris-phosphorylation around Tyr- 1150 (37), but the tris-phosphorylated species is found in relatively low abundance after in vivo stimulation of the Fao insulin receptor (37, 39). The a-PY antibody used in the present study would recognize both the bis- and tris-phos- phorylated forms of the receptor. We cannot, therefore, state with certainty that the internalized receptor is in its fully activated, tris-phosphorylated form. Studies are underway to characterize the phosphorylation state of the internalized receptor and to determine if the tris-phosphorylated form of the receptor resides in a distinct subcellular compartment.
Acknowledgments-We wish to thank Drs. James N. Livingston and Donald Bottaro for numerous helpful discussions.
REFERENCES 1. Kahn, C. R., and Crettaz, M. (1985) Diabetes. Metab. Reu. 1 , 5-32
3. White, M. F., Haring, H.-U., Kasuga, M., and Kahn, C. R. (1984) J. Biol. 2. Rosen, 0. M. (1987) Science 237,1452-1458
4. Rosen, 0. M., Herrera, R., Olowe, Y., Petruzzelli, L. M., and Cobb, M. H.
5. Yu, K.-T., and Czech, M. P. (1984) J. Biol. Chem. 259,5277-5286 6. Morcan. D. 0.. and Roth. R. A. (1987) Proc. Natl . Acad. Sci.
Chem. 269,255-264
(1983) Proc. Natl. A c d . Sci. U. S. A. 80,3237-3240
u.?~ A. 84,4i-45 . .
7. Ebina, Y., Araki, E., Taira, M., Shimada, F., Mori, M., Craik, C. S., Siddle, K., Pierce, S. B., Roth, R. A,, and Rutter, W. J. (1987) Proc. Natl. Acd.
8. Chou, C. K., Dull, T. J., Russell, D. S., Gherzi, R., Lebwohl, D., Ullrich, A,, Sci. U. S. A. 8 4 , 704-708
9. Ellis, L., Clauser, E., Morgan, D. 0.. Edery, M., Roth, R. A., and Rutter, and Rosen, 0. M. (1987) J. Biol. Chem. 2 6 2 , 1842-1847
W. J. (1986) Cell 46,721-732 10. Goldstein, J. L., Brown, M. S., Anderson, R. G., Russell, D. W., and
Schneider, W. J. (1985) Annu. Reu. Cell Biol. 1 , 1-39 11. Khan, M. N., Posner, B. I., Verma, A. K., Khan, R. J., and Bergeron, J. J.
M. (1981) Proc. Natl. A c d . Sci. U. S. A. 78,4980-4984 12. Smith, R. M., and Jaret t , L. (1982) Proc. Natl. Acad. Sci.
U. S. A. 79, 7302-7306 13. Hedo, J. A,, and Simpson, I. A. (1984) J. Biol. Chem. 2 5 9 , 11083-11089 14. Desbuquois, B., Lopez, S., and Burlet, H. (1982) J. Biol. Chem. 257,10852-
1 oxm 15. Goiden, P., Carpentier, J.-L., Freychet, P., LeCam, A,, and Orci, L. (1978)
16. Marshall, S., and Olefsky, J. M. (1980) Endocrinology 107 , 1937-1945 17. Duckworth, W. C., Runyan, K. R., Wright, R. K., Halban, P. A,, and
18. Marshall, S. (1985) J. Biol. Chem. 260,13517-13523 19. Bergeron, J. J. M., CNZ, J., Khan, M. N., and Posner, B. I. (1985) Annu.
20. Wang, C., Sonne, O., Hedo, J. A,, Cushman, S. W., and Simpson, I. A.
Science 200,782-785
Solomon, S. S. (1981) Endocrinology 108,1142-1147
Reu. Physiol. 47,383-403
(1983) J. Biol. Chem. 268.5129-5134 21. Khan, M. N., Savoie, S., Bergeron, J. J. M., and Posner, B. I. (1986) J.
22. Simpson, I. A., and Hedo, J. A. (1984) Science 223,1301-1304 23. Klein, H. H., Freidenberg, G. R., Matthaei, S., and Olefsky, J. M. (1987) J.
24. Ueda, M., Robinson, F. W., Smith, M. M., and Kono, T. (1985) J. Biol. Biol. Chem. 262,10557-10564
25. Trischitta, V., Gullo, D., Sebastiano, S., Pezzino, V., Goldflne, I. D., and Chem. 260,3941-3946
26. Carpentier, J. L., Robert, A., Grunberger, G., Van Obkrghen, E., Freychet, Vigneri, R. (1986) J. Clin. Endocrinol. Metab. 62,522-528
P., Orci, L., and Gordon, P. (1986) J. Clrn. Endocrrnol. Metab. 6 3 , 151- 155
Biol. Chem. 261,8462-8472
27. Deiihatrette, J. L., Moore, E. E., Dubois, M., Cassio, D., and Weiss, M. C.
28. Kasuga, M., White, M. F., and Kahn, C. R. (1985) Methods Enzymol. 109 ,
29. Laemmli, U. K. (1970) Nature 227,680-685 30. Shoelson, S. E., White, M. F., and Kahn, C. R. (1988) J. Biol. Chem. 2 6 3 ,
31. Bradford, M. (1976) Anal. Biuchem. 16,395-401 32. Redinbaugh, M. G., and Turley, R. B. (1986) Anal. Biochern. 153,267-271 33. Schwartz, A. L., Fridovich, S. E., and Lodish, H. F. (1982) J. Bid. Chem.
34. McClain, D. A., and Olefsky, J. M. (1988) Diabetes 37,806-815 35. Goren, H. J., White, M. F., and Kahn, C. R. (1987) Biochemistry 26,2374-
(1979) Somatic Cell. Genet. 6,697-718
609421
4852-4860
257,4230-4237
3Wl1 36. PaiiyD. T., Sharma, B. R., Shafer, J. A., White, M. F., and Kahn, C. R.
37. White, M. F., Shoelson, S. E., Keutmann, H., and Kahn, C. R. (1988) J.
38. Kasuga, M., Hedo, J. A,, Yamada, K. M., and Kahn, C. R. (1982) J. Biol.
39. White, M. F., Takayama, S., and Kahn, C. R. (1985) J. Biol. Chem. 2 6 0 ,
(1985) J. Bwl. Chem. 2 6 0 , 7131-7136
Biol. Chem. 263,2969-2980
Chem. 267,10392-10399
9A7n-RA7R 40. 41.
42.
43.
44.
45.
46.
White, M. F., Maron, R., and Kahn, C. R. (1985) Nature 318 , 183-186 White, M. F., Stegmann, E. W., Dull, T. J., Ullrich, A,, and Kahn, C. R.
(1987) J. Biol. Chem. 262,9769-9777 Bernler, M., Laird, D. M., and Lane, M. D. (1987) Proc. Natl. Acd. Sci.
U. S. A. 84,1844-1848 Perrotti, N., Accili, D., Marcus Samuels, B., Rees Jones, R. W., and Taylor,
S. I. (1987) Proc. Natl. A c d . Sci. U. S. A. 84,3137-3140 White, M. F., Livingston, J. N., Backer, J. M., Lauris, V., Dull, T. J.,
Ullrich, A,, and Kahn, C. R. (1988) Cell 64,641-649 Podlecki, D. A., Smith, R. M., Kao, M., Tsai, P., Huecksteadt, T., Bran-
denhurg, D., Lasher, R. s., Jarett, L., and Olefsky, J. M. (1987) J. Biol.
Goldfine, I. D., and Smith, G. J. (1976) Proc. Natl. Acad. Sci. Chem. 262,3362-3368
U. S. A. 73.1427-1431 47. Tornqvist, H..E., Gunsalus, J. R., Nemenoff, R. A., Frackelton, A. R.,
Pierce, M. W., and Avruch, J. (1988) J. Biol. Chern. 263,350-359 48. Chvatchko, Y., Van Ohberghen, E., and Fehlmann, M. (1984) Blochem. J.
222.111-117 49. Cousin, J. L., Samson, M., Pilch, P. F., and Fehlmann, M. (1987) Biochem.
50. Marshall, S. (1985) J. Biol. Chem. 260,4136-4144 51. Smith, J. M., and Jarett, L. (1983) J. CellPhys. 116 , 199-207 52. Carpentier, J. L., Van Obherghen, E., Gordon, P., and Orci, L. (1981) J.
53. Carpentier, J. L., Fehlmann, M., Van Obberghen, E., Gordon, P., and Orci, Cell Biol. 91,17-25
54. Fan, J. Y., Ca entier, J. L., Gordon, P., Van Obberghen, E., Blackett, N. L. (1985) Diabetes 34,1002-1007
M., Grunfelz C., and Orci, L. (1982) Proc. Natl. A c d . Sci. U. S. A. 79, 7788-7791
---, ---
J. 242,403-410
55. Khan, M. N., Ba uiron, G. B., Brule, C., Bergeron, J. J. M., and Posner,
56. Haring, H.-U., Kasuga, M., White, M. F., Crettaz, M., and Kahn, C. R.
57. Ellis, L., Morgan, D. O., Clauser, E., Roth, R. A., and Rutter, W. J. (1987)
58. Machamer, C. E., and Rose, J. K. (1988) J. Biol. Chem. 263,5948-5954 59. Marshall, S., Garvey, W. T., and Monzon, R. (1987) J. Biol. Chem. 2 6 2 ,
. . - - . . - - B. I. (1987) J. %ll Biol. 1 0 5 , 248a
(1984) Biochemistry 23,3298-3306
Mol. Endocrinol. 1,15-24
1 zoos-1 zm z 60. Tamura, S., Brown, T. A., Whipple, J. H., Fujita-Yamaguchi, Y., Dubler,
61. Livneh, E., h i s s , N., Berent, E., Ullrich, A,, and Schlessinger, J. (1987)
62. Takayama, S., White, M. F., and Kahn, C. R. (1988) J. Biol. Chern. 2 6 3 ,
- -. . . - -. - -
R. E., Cheng, K., and Larner, J. (1984) J. Biol. Chem. 259,6650-6658
EMBO J. 6,2669-2676
3440-3447