u s department of energyu.s. department of energy s’s ... · ev project firewall rules...
TRANSCRIPT

U S Department of Energy’sU.S. Department of Energy s Vehicle Technologies Program -
U.S./China 2011 Workshop – EV Project Results (Nationally and in theProject Results (Nationally and in the Los Angeles Metro Area)
Jim Francfort
- Los Angeles DWP / Mayor’s Office- U.S. China EV & Battery Workshop- August 2011g
This presentation does not contain any proprietary or sensitive information
Presentation OutlineId h N ti l L b t (INL) d U S D t t f• Idaho National Laboratory (INL) and U.S. Department of Energy’s (DOE) Advanced Vehicle Testing Activity (AVTA) participants and goals
• Vehicle testing experience• INL data handling methods• American Recovery and Reinvestment Act (ARRA) andAmerican Recovery and Reinvestment Act (ARRA) and
the Technology Acceleration and Demonstration Activity (TADA) data collection projects
• EV Project overviewEV Project overview• EV Project data collection parameters• EV Project results to date• Summary
2
AVTA Participants and GoalsP ti i t• Participants– The AVTA is part of DOE’s Vehicle Technologies
Program within the DOE Office of Energy Efficiency and Renewable Energy (EERE)
– INL conducts the AVTA per DOE guidance– 150+ fleets and organizations as testing partners150+ fleets and organizations as testing partners– Some of the ATVA’s vehicle testing activities are
conducted with ECOtality North American • Goal Petroleum reduction and energy security• Goal - Petroleum reduction and energy security
– Provide benchmark data to DOE, technology modelers, research and development programs, vehicle
f t d i t t d l ttmanufacturers, and various target and goal setters – Assist fleet managers in making informed vehicle and
infrastructure purchase, deployment and operating d i i
3
decisions

Vehicle Testing ExperiencePl i h b id l t i hi l 14 d l 430 PHEV 5• Plug-in hybrid electric vehicles: 14 models, 430 PHEVs, 5 million test miles
• Extended Range Electric Vehicles: 1 model, 150 EREVs, 400 000 t t il400,000 test miles
• Hybrid electric vehicles: 19 models, 50 HEVs, 6 million test miles
• Micro hybrid vehicles: 3 models, 7 MHVs, 200,000 test miles
• Neighborhood electric vehicles: 24 models, 372 NEVs, 200 000 t t il200,000 test miles
• Battery electric vehicles: 47 models, 1,900 BEVs, 5 million test miles (includes 500+ USPS BEVs)
• Urban electric vehicles: 3 models, 460 UEVs, 1 million test miles
• 18 million test miles accumulated on 2,900 electric drive
4
vehicles representing 110 models
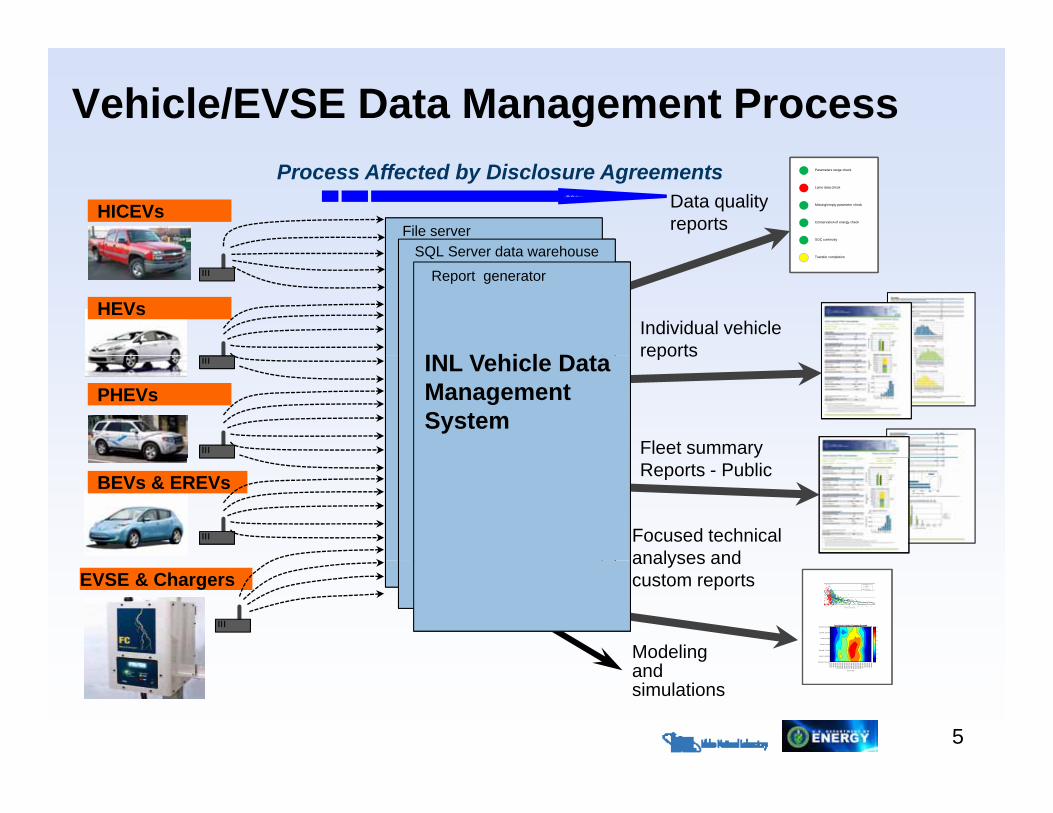
Vehicle/EVSE Data Management Process
File serverFile serverSQL Server data warehouseSQL Server data warehouse
File serverSQL Server data warehouse
HICEVs
Parameters range checkParameters range check
Lame data checkLame data check
Missing/empty parameter checkMissing/empty parameter check
Conservation of energy checkConservation of energy check
SOC continuitySOC continuity
Parameters range check
Lame data check
Missing/empty parameter check
Conservation of energy check
SOC continuity
Data qualityreports
Process Affected by Disclosure Agreements
INL Database
SQL Server data warehouseSQL Server data warehouse
Report generatorReport generator
SQL Server data warehouse
Report generator
HEVs
INL V hi l D t
Transfer completionTransfer completionTransfer completion
Individual vehicle reports
PHEVsINL Vehicle Data Management System
reports
Fleet summary
BEVs & EREVs Reports - Public
Focused technicalanalyses and
EVSE & Chargersanalyses and custom reports
25 50 75 100 125 150 175 200 225 250 275 30
Trip Fuel Economy (mpg)
p gg ( p p p )
CD trips
CD/CS trips
CS trips
Log. (CD trips)
Log. (CD/CS trips)
Avg Hourly Vehicle Charging Demand
9 9 9 9 9 9 9 9 9 9 9 9 9 9 9 9 9 9 9 9 9 9 9 9
Mon AM - Tues AM
Tue AM - Wed AM
Wed AM - Thu AM
Thu AM - Fri AM
Fri AM - Sat AM
Sat AM - Sun AM
Sun AM - Mon AM
0.1
0.2
0.3
0.4
0.5
0.6
0.7
0.8
Modeling
5
Time of Day
600-
659
700-
759
800-
859
900-
959
1000
-105
911
00-1
159
1200
-125
913
00-1
359
1400
-145
915
00-1
559
1600
-165
917
00-1
759
1800
-185
919
00-1
959
2000
-205
921
00-2
159
2200
-225
923
00-2
359
000
- 059
100-
159
200-
259
300-
359
400-
459
500-
559
Time of Day
600-
659
700-
759
800-
859
900-
959
1000
-105
911
00-1
159
1200
-125
913
00-1
359
1400
-145
915
00-1
559
1600
-165
917
00-1
759
1800
-185
919
00-1
959
2000
-205
921
00-2
159
2200
-225
923
00-2
359
000
- 059
100-
159
200-
259
300-
359
400-
459
500-
559
and simulations

Vehicle and Infrastructure Data SourcesHEV: 12 vehicle models 1 data logger
Vehicle time-history data
(second-by-
HEV: 12 vehicle models, 1 data loggerHICE: 1 vehicle model, 1 data loggerConversion PHEVs: 8 vehicle models, 3 data loggers
(second-by-second) Ford Escape PHEV, Ford wireless logger
Chrysler Ram PHEV, Chrysler wireless loggery y gg
Vehicle event data(key-on, key-off)
Nissan Leaf, Nissan telematics
Chevrolet Volt, OnStar telematics
Charger t d
ECOtality Blink networked level 2 EVSE, DC/fast hevent and
15 min time-history data
chargers
Coulomb ChargePoint networked level 2 EVSE
6Managing 26 different data models

INL Data Management System - Push(Nissan, GM, Chrysler, Coulomb)
Protected Data
EV Project Access restricted by fi ll l
Vehicle and
Charger Data
Parameters range checkParameters range check
Lame data checkLame data check
Missing/empty parameter checkMissing/empty parameter check
Parameters range check
Lame data check
Missing/empty parameter check
jTeam
EV Project
firewall rules
Conservation of energy checkConservation of energy check
SOC continuitySOC continuity
Transfer completionTransfer completion
Conservation of energy check
SOC continuity
Transfer completion
Internal data quality reports
Fleet summaryreports - public
OEM pushes using FTPS/
jFTPS/SFTP Server
INL pulls with encrypted transmission
OEM Data Manage-ment reports publicFTPS/
SFTP
INL transmits reports to DOE And OEMsReports posted on WWW
AVT.INL.GOV
Systems
INL Protect Enclave - EV Project member access only
AVT.INL.GOV
7
INL Internal firewall
INL DMZ Firewall – Public has access to AVT.INL.GOV

INL Data Management System - Pull(ECOtality, Ford, conversion PHEVs, HEVs, HICEs)
Protected DataVehicle and
Charger Data
EV Project Team
Parameters range checkParameters range check
Lame data checkLame data check
Missing/empty parameter checkMissing/empty parameter check
Parameters range check
Lame data check
Missing/empty parameter check
INL pulls with encrypted transmission
Conservation of energy checkConservation of energy check
SOC continuitySOC continuity
Transfer completionTransfer completion
Conservation of energy check
SOC continuity
Transfer completion
Internal data quality reports
Fleet summaryreports - public
OEM Data Manage-ment S t
Reports posted on WWWINL transmits reports to DOE And OEMs
reports public
AVT.INL.GOV
Systems
INL Protect Enclave - EV Project member access only
AVT.INL.GOV
8
INL Internal firewall
INL DMZ Firewall – Public has access to AVT.INL.GOV

Data Security and ProtectionAll hi l d EVSE d t d l i f ti• All raw vehicle and EVSE data, and personal information protected by NDAs (Non Disclosure Agreements) or a CRADA (Cooperative Research And Development Agreement) resulting in:Agreement), resulting in:– Limitations on how the proprietary data can be
distributed, stored, and usedNo ra data can or ill be distrib ted b INL– No raw data can or will be distributed by INL
– Raw data, in both electronic and printed formats, cannot be shared with DOE in order to avoid exposure to FOIAto FOIA
• Vehicle and EVSE data collection would not occur unless the above limitations are strictly adhered by participantsINL bi d t lt i t bl i f ti f t• INL can bin data results into usable information formats for analysis by EV Project participants
9

INL ARRA / TADA Data Collection SupportINL t k d ith d t ll ti l i d ti f• INL tasked with data collection, analysis and reporting for five light-duty vehicle and infrastructure deployment projects funded by DOE via the ARRA, and TADA:– EV Project: 8,300 Leaf EVs and Volt EREVs, and 14,000
ECOtality Blink Level 2 electric vehicle supply equipment (EVSE) and fast chargers. All 22,000 pieces
f i t i d ith d t l (DL )of equipment are equipped with data loggers (DLs)– 140 Chrysler Ram PHEV Pickups and additional
minivan PHEVs with DLs– 150 General Motors EREV Volts with DLs– 21 Ford Escape PHEV SUVs with DLs
4 000 L l 2 EVSE d l d b C l b ith DL– 4,000 Level 2 EVSE deployed by Coulomb with DLs– 100’s of EVSE deployments funded by Clean Cities
10

EV Project - OverviewL d b ECOt lit N th A i• Lead by ECOtality North America
• Approximately $230 million total project funding• Funded by a DOE ARRA grant ($115 million)Funded by a DOE ARRA grant ($115 million)• Partners cost share match greater than $115 million• Data being collected by INL via data streams from
ECOt lit ( h i i f t t ) d Ni dECOtality (charging infrastructure), and Nissan and General Motors/OnStar (vehicles)
• EV Project purpose is to build and study mature electric vehicle charging infrastructure in six states and the District of Columbia (18 cities) to enable the streamlined deployment of the next 5,000,000 EVs
11

EV Project Locations
12

EV Project Residential Infrastructure• Deploy 8,300 battery electric
vehicles– 5,700 Nissan Leaf battery EVs, y– 2,600 Chevrolet Volt
extended range EVs • Install 8 300 level 2 residential• Install 8,300 level 2 residential
EVSE
13

EV Project Commercial Infrastructure• Install ~5,300 level 2 EVSE
– Retail locations– Municipal locations– Municipal locations– Employer locations
• Deploy 200 Dual Port DC Fast Chargers
14

EV Project Data Collection & Reporting
Vehicle Data
EV & EREV
EVSE Data
EVSEEV & EREV
Nissan GDC
EVSE
ECOtality DataGM OnStar ECOtality Data Center
EV Project Participant Non EV Project EVSE
INL INLMATCH
EV Project Participant EV Project EVSE
Non EV Project Participant EV Project EVSE
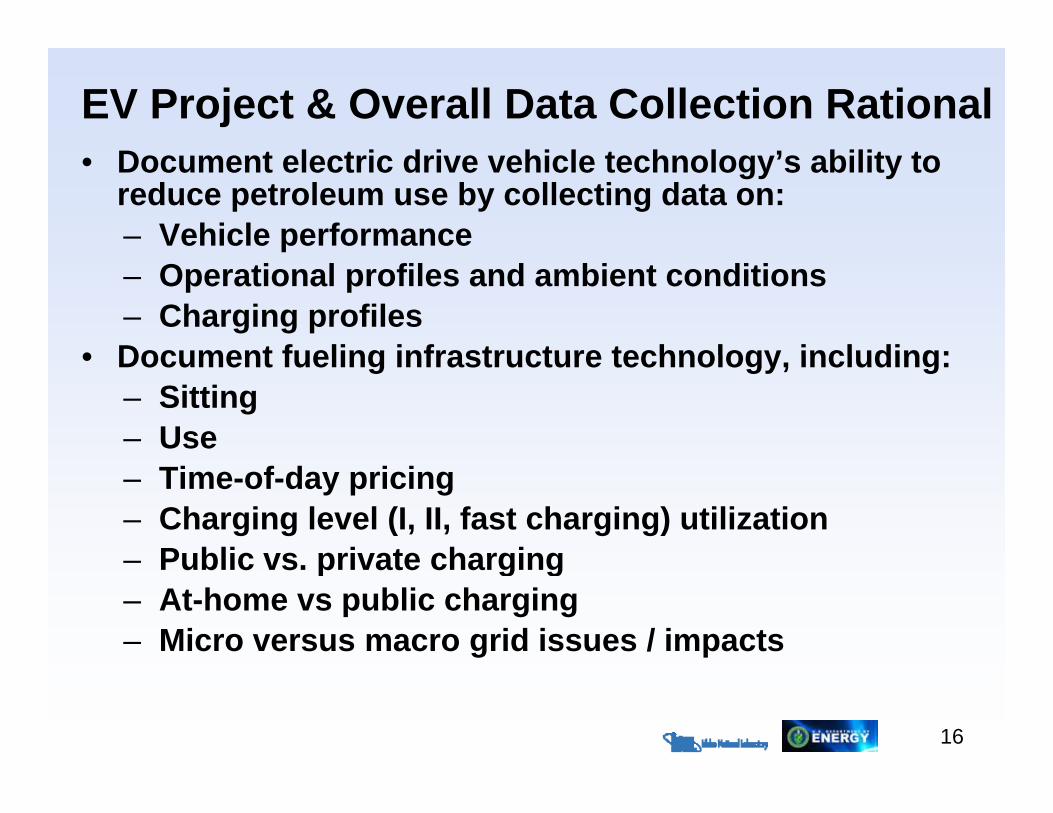
EV Project & Overall Data Collection RationalD t l t i d i hi l t h l ’ bilit t• Document electric drive vehicle technology’s ability to reduce petroleum use by collecting data on:– Vehicle performance – Operational profiles and ambient conditions– Charging profiles
• Document fueling infrastructure technology including:• Document fueling infrastructure technology, including:– Sitting– Use– Time-of-day pricing– Charging level (I, II, fast charging) utilization– Public vs private charging– Public vs. private charging– At-home vs public charging – Micro versus macro grid issues / impacts
16

EV Project – Infrastructure Data Parameters Collected per Charge EventCollected per Charge Event • Date and Time Stamp • Unique ID for Charging EventUnique ID for Charging Event • Unique ID Identifying the EVSE – may not change • Connect and Disconnect Times
St t d E d Ch Ti• Start and End Charge Times• Maximum Instantaneous Peak Power• Average Powerg• Total energy (kWh) per charging event• Rolling 15 Minute Average Peak Power
A d th d i EVSE i f ti (GPS ID t• And other non-dynamic EVSE information (GPS, ID, type, contact info, etc.)
17
EV Project – Vehicle Data Parameters Collected per Start/Stop EventCollected per Start/Stop Event• Date and Time Stamp • Vehicle IDVehicle ID• Event type (key on / key off) • Odometer
B tt t t f h• Battery state of charge • GPS (longitude and latitude)• Fuel consumption (some vehicles)p ( )• Recorded for each key-on and key-off event
18

EV Project –Overview ReportOverview Report• January thru June 2011
status reportstatus report• Charging infrastructure
– # units installed# h i t– # charging events
– AC MWh consumed• Vehicles
– # enrolled– # trips
Di t d i– Distance driven• Results provided by
EV Project region
19

EV Project Overview Report – cont’d• January thru June 2011
• Number EVSE installed
Nationally
1 338
L.A. Metro
130• Number EVSE installed• Number of charging events• AC MWh consumed
1,33842,128296.6
1304,24528.5AC MWh consumed
• Nissan Leafs enrolled• Total miles traveled
296.61,162
1,450,314
28.5139
150,416• Total number of trips
, ,189,582
,20,326
20
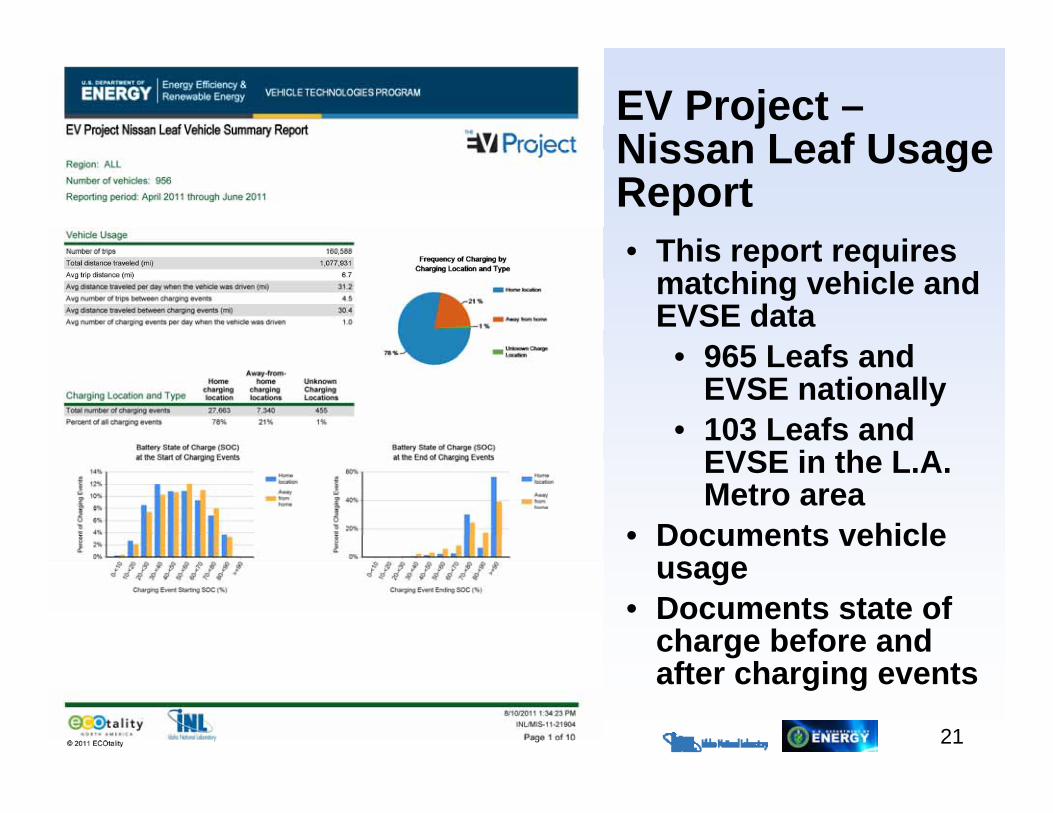
EV Project –Nissan Leaf UsageNissan Leaf Usage Report• This report requires• This report requires
matching vehicle and EVSE data
• 965 Leafs and• 965 Leafs and EVSE nationally
• 103 Leafs and EVSE in the L AEVSE in the L.A. Metro area
• Documents vehicle usage
• Documents state of charge before and ft h i t
21
after charging events

Nissan Leaf Usage Report – cont’d• April - June 2011
• Number of Trips
Nationally
160 588
L.A. Metro
16 846• Number of Trips• Total distance traveled (mi)• Ave trip distance (mi)
160,5881,077,931
6.7
16,846109,061
6.5Ave trip distance (mi)• Ave miles per day when driven• Ave # trips between charging events
6.731.24.5
6.529.24.6p g g
• Ave distance (mi) traveled between charging events
30.4 29.9
• Ave number charging events per day when a vehicle was driven
1.0 1.0
22

Nissan Leaf Usage Report – cont’dNationally L.A. Metro
23

Nissan Leaf Usage Report – cont’dNationally L.A. Metro
24
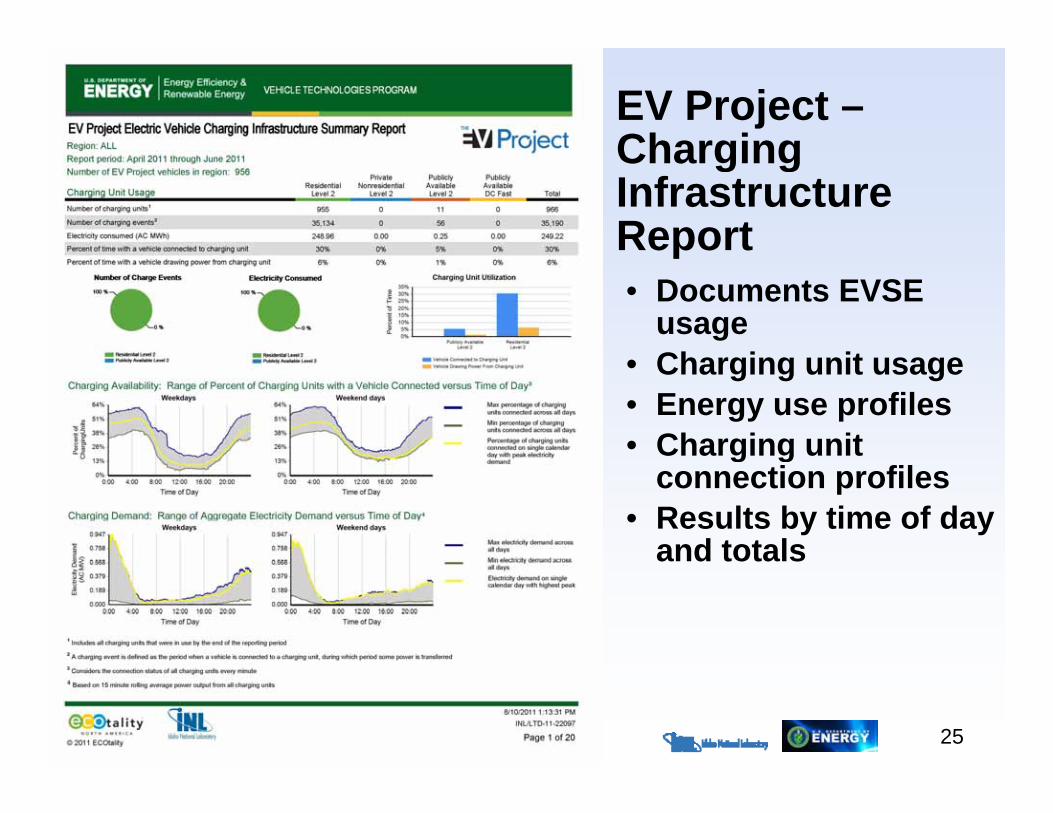
EV Project –ChargingCharging Infrastructure Reportp• Documents EVSE
usageCh i it• Charging unit usage
• Energy use profiles• Charging unit g g
connection profiles• Results by time of day
and totalsand totals
25

Charging Infrastructure Report – cont’d• April - June 2011
• Number of Residential EVSE
Nationally
955
L.A. Metro
102• Number of Residential EVSE • Number of charging events• Electricity consumed (AC MWh)
95535,134249.0
1023,36522.8Electricity consumed (AC MWh)
• Percent time vehicle connected• Percent time vehicle drawing power
249.030%6%
22.826%5%g p
• Ave hours connected per charge weekday• Ave hours connected per charge weekend
9.59.2
9.48.7g
• Ave weekday AC kWh per charge• Ave weekend AC kWh per charge
7.46.3
7.06.2
26

Charging Infrastructure Report – cont’dCharging Availability: percent residential charging units
Nationally L.A. Metro
Charging Availability: percent residential charging units with vehicle connected versus time of day
27*All graphs – Percent of Charging Units

Charging Infrastructure Report – cont’dCharging Demand: range of aggregate electricity demand
Nationally L.A. Metro
Charging Demand: range of aggregate electricity demand versus time of day
28*All graphs – AC MW electricity demand

Charging Infrastructure Report – cont’dNationally L A MetroNationally L.A. Metro
29

Charging Infrastructure Report – cont’dNationally L A MetroNationally L.A. Metro
30

SummaryOngoing INL/DOE data collection activities will provide• Ongoing INL/DOE data collection activities will provide 100 million miles of vehicle operations and charger use– Document private versus public charging behaviors– Document Level 2 versus fast charging behaviors– Document different revenue models potential impacts
on charging behaviorsg g– Document charging behaviors by time of day and day
of week– Document potential electric utility micro and macro– Document potential electric utility micro and macro
impacts from charging behaviors– Important to wait for data results before drawing
conclusions!!!conclusions!!!
31

Acknowledgement
This work is supported by the U.S. Department of E ’ EERE V hi l T h l i P
Acknowledgement
Energy’s EERE Vehicle Technologies Program
More Informationhttp://avt.inl.gov
32
INL/MIS-11-22836