u. s. fish and wildlife service service-wide eeoc md … 2015 eeo program status...u. s. fish and...
TRANSCRIPT

U. S. Fish and Wildlife Service
Service-wide EEOC MD 715 Plans
FY 2015
Federal Agency Annual EEO Program Status Updated Report FY 2015

THIS PAGE LEFT BLANK

iii
U.S. Fish and Wildlife Service 2015 EEO Program Status Report (MD-715)
Contents
PARTS A - D .............................................................................................................................................. 5 PART A Department or Agency Identifying Information .........................................................................................................5 PART B Total Employment ......................................................................................................................................................5 PART C Agency Official(s) Responsible For Oversight of EEO Program(s) ...........................................................................5 PART D List of Subordinate Components Covered in This Report ..........................................................................................6 EEOC FORMS and Documents Included With This Report ....................................................................................................6
PART E ....................................................................................................................................................... 7 EXECUTIVE SUMMARY .......................................................................................................................................................7
PART F ..................................................................................................................................................... 21 Certification of Establishment of Continuing Equal Employment Opportunity Programs ...................................................... 21
PART G: SELF-ASSESSMENT CHECKLIST Measuring Essential Elements ...................................... 23 ESSENTIAL ELEMENT A: DEMONSTRATED COMMITMENT FROM AGENCY LEADERSHIP .............................. 23 ESSENTIAL ELEMENT B: INTEGRATION OF EEO INTO THE AGENCY'S STRATEGIC MISSION ......................... 25 ESSENTIAL ELEMENT C: MANAGEMENT AND PROGRAM ACCOUNTABILITY .................................................... 29 ESSENTIAL ELEMENT D: PROACTIVE PREVENTION .................................................................................................. 31 ESSENTIAL ELEMENT E: EFFICIENCY ........................................................................................................................... 32 ESSENTIAL ELEMENT F: RESPONSIVENESS AND LEGAL COMPLIANCE ............................................................... 34
PART H (1 of 3): Plan for Attaining Essential Elements of a Model EEO Program ................................... 37 Essential Element B: Integration of EEO into the Agency’s Strategic Mission ..................................................................... 37
PART H (2 of 3): Plan for Attaining Essential Elements of a Model EEO Program ................................... 38 Essential Element E: Efficiency .............................................................................................................................................. 38
PART H (3 of 3): Plan for Attaining Essential Elements of a Model EEO Program ................................... 39 Essential Element E: Efficiency ............................................................................................................................................. 39
PART I (1 of 7): Plan to Eliminate Identified Barriers ...................................................................... 41 There is a low participation rate of Asians in the total FWS permanent workforce. ............................................................... 41
PART I (2 of 7): Plan to Eliminate Identified Barriers ...................................................................... 44 There is a low participation rate of Black employees in FWS total permanent workforce. .................................................... 44
PART I (3 of 7): Plan to Eliminate Identified Barriers ...................................................................... 47 There is a low participation rate of Blacks in the professional biology series. ........................................................................ 47
PART I (4 of 7): Plan to Eliminate Identified Barriers ...................................................................... 50 There is a low participation rate of Hispanic women in the professional biology series. ........................................................ 50
PART I (5 of 7): Plan to Eliminate Identified Barriers ...................................................................... 54 The participation rate of Asians in the professional biology series within FWS workforce is lower than expected. .............. 54
PART I (6 of 7): Plan to Eliminate Identified Barriers ...................................................................... 57 The participation rate of women Criminal Investigators (CI) in the FWS workforce is lower than expected. ........................ 57
PART I (7 of 7): Plan to Eliminate Identified Barriers ...................................................................... 59 There is a low participation rate of individuals with targeted disabilities in FWS. ................................................................. 59

PART J: Special Program Plan for the Recruitment, Hiring, and Advancement of Individuals with Targeted Disabilities ...................................................................................................................... 63
J: I Department or Agency Information ................................................................................................................. 63 J: II Employment Trend and Special Recruitment for Individuals with Targeted Disabilities ............ 63 J: III Participation Rates in Agency Employment Programs ........................................................................... 63 J: IV Identification and Elimination of Barriers ..................................................................................................................... 64 J: V Goals for Targeted Disabilities ....................................................................................................................................... 64
Workforce Tables A Section ..................................................................................................................... 67
Workforce Tables B Section ....................................................................................................................104
Organizational Charts.............................................................................................................................. 137
Annual Federal EEO Statistical (462) Report of Discrimination Complaints ........................................ 140
Examples of Projects Completed in FY15 with Significant Accessibility Components ........................ 162
Policy Memos ......................................................................................................................................... 163
THIS PAGE IS LEFT BLANK

5
EEOC FORM 715-01
PARTS A - D U.S. Equal Employment Opportunity Commission
FEDERAL AGENCY ANNUAL EEO PROGRAM STATUS REPORT
For period covering October 1, 2014, to September 30, 2015
PART A Department or Agency Identifying Information
1. Agency 1. U. S. Department of the Interior (DOI)
1.a. 2nd level reporting component 1.a. U. S. Fish and Wildlife Service
1.b. 3rd level reporting component
1.c. 4th level reporting component
2. Address 2. 1849 C Street, N. W.
3. City, State, Zip Code 3. Washington, DC 20240
4. CPDF Code 4. IN15
5. FIPS code(s) 5. 1448
PART B Total Employment
1. Enter total number of permanent full-time and part-time employees 1. 7814
2. Enter total number of temporary employees 2. 1131
3. Enter total number employees paid from non-appropriated funds 3. Not applicable
4. TOTAL EMPLOYMENT [add lines B 1 through 3] 4. 8945
PART C Agency Official(s) Responsible For Oversight of EEO Program(s)
1. Head of Agency Official Title
1. Daniel M. Ashe, Director
2. Agency Head Designee 2. James W. Kurth, Deputy Director
3. Principal EEO Director/Official Official Title/series/grade
3. Inez Uhl, EEO Director, GS- 0260-15
4. Title VII Affirmative EEO Program Official
4. Julia Bumbaca, Diversity Program Manager
5. Section 501 Affirmative Action Program Official
5. Lula Cole, Public Civil Rights and Accessibility Coordinator
6. Complaint Processing Program Manager
6. Ronald Niemann, Complaints and Compliance Program Manager
7. Other Responsible EEO Staff Matthew Costello, Acting Director, DOI Office of Collaborative Action and Dispute Resolution

6
EEOC FORM 715-01
PARTS A - D U.S. Equal Employment Opportunity Commission
FEDERAL AGENCY ANNUAL EEO PROGRAM STATUS REPORT
PART D List of Subordinate Components Covered in This Report
Subordinate Component and Location (City/State) CPDF and FIPS codes
Region 1, Portland, Oregon IN1501 1448
Region 2, Albuquerque, New Mexico IN1502 1448
Region 3, Bloomington, Minnesota IN1503 1448
Region 4, Atlanta, Georgia IN1504 1448
Region 5, Hadley, Massachusetts IN1505 1448
Region 6, Denver, Colorado IN1506 1448
Region 7, Anchorage, Alaska IN1507 1448
Region 8, Sacramento, California IN1508 1448
Headquarters, Falls Church, Virginia IN1509 1448
EEOC FORMS and Documents Included With This Report
Executive Summary [FORM 715-01 PART E], that includes:
X Optional Annual Self-Assessment Checklist Against Essential Elements [FORM 715-01PART G]
X
Brief paragraph describing the agency's mission and mission-related functions
X EEO Plan To Attain the Essential Elements of a Model EEO Program [FORM 715-01PART H] for each programmatic essential element requiring improvement
X
Summary of results of agency's annual self-assessment against MD-715 "Essential Elements"
X EEO Plan To Eliminate Identified Barrier [FORM 715-01 PART I] for each identified barrier
X
Summary of Analysis of Work Force Profiles including net change analysis and comparison to RCLF
X Special Program Plan for the Recruitment, Hiring, and Advancement of Individuals With Targeted Disabilities for agencies with 1,000 or more employees [FORM 715-01 PART J]
X
Summary of EEO Plan objectives planned to eliminate identified barriers or correct program deficiencies
X Copy of Workforce Data Tables as necessary to support Executive Summary and/or EEO Plans
X
Summary of EEO Plan action items implemented or accomplished
X Copy of data from 462 Report as necessary to support action items related to Complaint Processing Program deficiencies, ADR effectiveness, or other compliance issues
X
Statement of Establishment of Continuing Equal Employment Opportunity Programs [FORM 715-01 PART F]
X Copy of Facility Accessibility Survey results as necessary to support EEO Action Plan for building renovation projects
X
Copies of relevant EEO Policy Statement(s) and/or excerpts from revisions made to EEO Policy Statements
X Organizational Chart X
7
Daniel M. Ashe, Director U.S. Fish and Wildlife Service
EEOC FORM 715-01
PART E U.S. Equal Employment Opportunity Commission
FEDERAL AGENCY ANNUAL EEO PROGRAM STATUS REPORT
U.S. FISH AND WILDLIFE SERVICE For period covering October 1, 2014, to September 30, 2015
EXECUTIVE SUMMARY
“I want to reemphasize my personal commitment to provide the ongoing resources of time, money, and human resources needed to ensure that diversity, inclusion, and equal opportunity, become an integral part of the way we conduct our day-to-day activities. Therefore, I am pleased that in October 2014, the Service released its FY 2015-2019 Diversity and Inclusion Implementation Plan (Diversity Plan). The updated Diversity Plan provides clearer strategic activities and action items to guide our efforts in making the Service a leader in attaining and sustaining a high-performing inclusive workforce that embraces diversity and empowers all employees to achieve their full potential. Our people are our most important resource and having a diverse and inclusive workplace will enable us to be more innovative, engaged, and collaborative, resulting in better connections with the public we serve and increased conservation. The Service’s leadership is committed to working together to ensure that the performance outcomes contained in the Diversity Plan will lead to the desired result of having a diverse and inclusive workforce
that is prepared to meet our mission challenges of the future.” Mission: The U.S. Fish and Wildlife Service (FWS) is the principal Federal agency responsible for conserving, protecting, and enhancing fish, wildlife, and plants and their habitats for the continuing benefit of the American people. Here are a few of the ways we work to meet our mission:
o Enforce federal wildlife laws, o Protect endangered species, o Manage migratory birds, o Restore nationally significant fisheries, o Conserve and restore wildlife habitat such as wetlands, o Help foreign governments with their international conservation efforts, and o Distribute hundreds of millions of dollars, through our Wildlife Sport Fish and
Restoration program, in excise taxes on fishing and hunting equipment to State fish and wildlife agencies.
Model EEO Program Assessment The FWS Fiscal Year (FY) 2015 Summary to the Annual Equal Employment Opportunity (EEO) Program Status Report outlines progress; identifies program deficiencies and barriers to achieving a model EEO program; delineates the planned actions necessary to address and/or eliminate the program deficiencies and barriers; and outlines FWS accomplishments toward addressing the program deficiencies and barriers. An analysis of the FWS workforce for FY 2015 was conducted to complete this report.

8
Management Directive 715 divides the essential elements of model agency EEO programs into six broad categories. • Demonstrated Commitment from Agency Leadership • Integration of EEO into the Agency’s Strategic Mission • Management and Program Accountability • Proactive Prevention of Unlawful Discrimination • Efficiency • Responsiveness and Legal Compliance
FWS reviewed its EEO and personnel programs, policies, and performance in light of these elements to identify where the EEO program can become more effective. These six elements serve as the organizing principles by which FWS can assess and improve its program. The major initiatives that were implemented for FY 2015 are listed below. Demonstrated Commitment from Agency Leadership • Policies: The following statements were issued in FY 2015: Mandatory Equal Employment
Opportunity and Diversity Training for Managers, Supervisors and Employees; and Reasonable Accommodation Policy for Scheduled Events. The Anti-Harassment Policy and Procedures were updated in 2015, which complements the Zero Tolerance Harassment Policy, which remains unchanged. The Equal Employment Opportunity and Non-Discrimination Policy also remained unchanged.
• Executive Diversity Committee: The Executive Diversity Committee (EDC) consists of six
Senior Executive Service members, a Deputy Assistant Director, and a Deputy Regional Director. The FWS Deputy Director personally provides direction and articulates his expectations to the (EDC) members. The FWS EEO Director/Chief of Diversity and Inclusion and the Human Resources Senior Advisor serve as consultants.
• Diversity Change Agent Program: The Director supported the training and regular meetings of
diversity change agents at all levels of the FWS to address diversity and inclusiveness in the workforce. The FWS has enhanced and supports the large community of FWS diversity change agents that are located in regional and field offices throughout the country. A Deputy Assistant Director serves as the lead for organization and Directorate support of the Program, this includes hosting meetings throughout the year for the sharing of best practices, providing training, and presenting updates to the Directorate on the status of the program.
• Directorate Meetings: The Director and Deputy Directors emphasize the priority of issues related
to diversity and inclusion at quarterly meetings. The Directorate discusses the implementation strategies, objectives, and the results in executing the provisions in the FWS Diversity and Inclusion Implementation Plan.
• The Five-Year Diversity and Inclusion Implementation Plan (FY 2015-2019): The revised
Diversity and Inclusion Implementation Plan (DIIP) was officially released by the FWS Director to all employees in a Town Hall meeting that was delivered via webcast on October 27, 2014. The FWS Director required all supervisors to meet with their employees to ensure that each member of the FWS understands his/her role in developing and fostering a diverse and inclusive workforce. Members of the Directorate discussed progress towards action items in the Plan in meetings with

9
Project Leaders and at all-hands gatherings. The Directorate has made a commitment to accomplish the strategic activities defined in the DIIP, with each Deputy serving as the lead for their Region/Program to assist with implementation and progress.
• Climate Survey: The FWS is committed to assessing its organizational climate; therefore, the
Service will conduct Equal Opportunity climate surveys on a biennially basis to identify the strengths that can be leveraged and to determine areas where improvements are needed in order to obtain and maintain an inclusive work environment. In FY 2015, the Director funded and launched the FY2015 FWS Federal Organizational Climate Survey (FEOCS) which was administered by the Defense Equal Opportunity Management Institute. The Director released the results of the survey to all employees and subsequently initiated an effort to supplement the survey by scheduling Focus Groups in FY 2016. The results of the Focus Groups, the FEOCS, the Employee Viewpoint Survey, and other data will be used to identify and address challenges that may impede the FWS’s ability to obtain and foster a diverse and inclusive workforce.
• League of United Latin Americans Citizens (LULAC): The FWS participated in the LULAC
convention to engage with members of the Latino/Hispanic community and students from Hispanic Association of Colleges and Universities. The Director signed an MOU during the Convention to provide a framework for cooperation to promote conservation and natural resource management to Latinos/Hispanics and other diverse groups to encourage students and professionals to consider careers in the FWS. The FWS also participated in the third annual LULAC Federal Training Institute (FTI) Partnership Conference to educate federal employees and students about career opportunities and advancement in the federal government.
• Urban American Outdoors: The Urban American Outdoors (UAO) works to raise the visibility
of diverse stakeholders among outdoor recreational sports industries. The FWS Director, Deputy Director, and other members of the Directorate participated in the UAO’s 2015 Annual Kids Fishing Derby, co-sponsored the Urban Kids Fishing Derby on the Mall, and participated in the UAO’s Urban Outdoor Summit where the FWS’s new Atlanta Urban Wildlife Partnership was announced by a Deputy Regional Director. The summit provided FWS with the opportunity to discuss relevancy, youth, diversity and inclusion, conservation, environmental issues, and job and career opportunities.
• Funding: The Director continued to invest in the organization’s goals by allocating annual funds
to the Office of Diversity and Inclusive Workforce Management (ODIWM) which has the responsibility of carrying out the agency’s equal opportunity and diversity programs. In FY 2015, funds were allocated to support numerous diversity initiatives to include the following:
• Recruiters: FWS ensured that each region continued to receive funds to retain a full-time
permanent recruiter for a total of nine national recruiters to work with human resources specialists and hiring officials in executing strategies to increase applicant pools for low participation groups based on the Relevant Civilian Labor Force and other benchmarks.
• Directorate Resource Assistant Fellows Program (DFP): FWS sponsored the second year of the DFP in compliance with the Direct Hiring Authority authorized under DOI Personnel Bulletin No. 12-15. The program provides consideration to individuals who are enrolled in an institution of higher education with particular attention given to ensure full representation of women and participants from historically Black, Hispanic, Asian Pacific Islander and Native American schools or other schools with diverse student populations. It allows greater flexibility in hiring, which enhances the FWS’s ability to achieve a more diverse workforce through targeted recruitment. Minorities comprised of 29.5% of the 2015 cohort of 54 student interns.

10
• Summer Faculty Fellowship Program: This program expands recruitment partnerships with
faculty members from primarily minority-serving institutions and other institutions of higher education. FWS funded two faculty fellows this year who completed summer projects and who will be conducting campus conservation career awareness projects. One fellow is a wildlife biology professor from a Hispanic Serving Institution and one is a fish biology professor from an American Indian Alaska Native Serving Institution. FWS field stations hosted these faculty members and designed work assignments beneficial to both FWS and the faculty member.
• Student Conservation Careers Symposia: FWS conducted 10 symposia at targeted institutions of higher education (primarily minority-serving institutions) for undergraduate and graduate college students interested in public service careers in natural resources and wildlife management. The Symposia have been attended by approximately 60% minority students. Feedback from students has been very positive and recruiters stay in touch with students for future recruitment opportunities. Symposia were also held at conferences such as the annual Conference on Asian Pacific American Leadership (CAPAL).
• Career Discovery Internship Program: FWS leadership continued support of regional participation in the Student Conservation Association’s (SCA) Career Discovery Internship Program. FWS partners with SCA to provide internships for students in FWS Field Stations throughout the country. The students become a future source of recruitment. In FY 2015, approximately 79% of the 42 students who participated were minorities.
• Steve Harvey Mentoring Program. The FWS, in partnership with the Steve and Marjorie
Harvey Foundation, provided more than 100 inner-city teenage boys the opportunity to experience the outdoors and learn about the conservation values at the Inks Dam National Fish Hatchery in Burnet, Texas.
• Gates Millennium Scholars Program: The FWS collaborates with the GMS Program to
provide opportunities for high achieving minority students to reach their highest potential by sharing information on FWS careers in GMS’ annual leadership development training sessions and circulating job announcements with scholars throughout the year.
• Alaska Native Science and Engineering Program (ANSEP): FWS participates in the Science
component of the Alaska Native Science and Engineering Program. It provides students with a vision for a career in conservation-related fields through math and science courses, internships with professionals in federal and state government agencies, and study groups to ensure academic success. Participants are often offered Pathways appointments and ultimately hired as permanent employees.
• Other Outreach and Event Sponsorship: FWS’s leadership funded many other partnerships, events, training, and outreach efforts. Some examples are listed below: o Society for the Advancement of Chicanos and Native American’s in Science (SACNAS).
FWS participated in the 2015 SACNAS National Conference and Recruiters worked with SACNAS Chapters at colleges and universities.
11
o The FWS National Conservation Training Center (NCTC) hosted the Outdoor Afro Leadership Team (OALT) Training and Summit. This 40-member team trained its leaders alongside partners and friends in the specifics and value of connecting with nature through a curriculum that included trip planning, conservation, ethics, risk management, and effectiveness of social media’s engagement.
o National Organization for Mexican American Rights (NOMAR). NOMAR promotes the
civil rights of Americans of Hispanic origin. FWS participated in the national convention. FWS received the NOMAR Meritorious Service Award recognition, and made a presentation to over 100 Hispanic youth on FWS careers.
o Minorities in Agriculture, Natural Resources and Related Sciences (MANRRS). FWS
participated in the MANRRS Conference to network with minority students and professionals about FWS career opportunities. FWS established contact with over 50 MANRRS chapters at colleges and universities.
o Native Hawaiian and Pacific Islanders. FWS provided internships for ten students in
conservation-related programs throughout the Hawaiian Islands. FWS also conducted workshops on various conservation topics, shared information regarding restoration programs on National Wildlife Refuges, and engaged with students to provide information on employment opportunities in conservation.
o The FWS National Conservation Training Center (NCTC) hosted the Inter-Tribal Climate
Leadership Congress for 91 high school students and 23 adult chaperones representing 28 Native American, Alaskan Native, and Native Hawaiian communities from across the country.
o Tribal Trust Training. The FWS, NCTC developed and hosted Tribal Trust Training which
involved communicating across cultures, generations, and genders, and facilitating interactions with tribal members and elders.
o Soul River, Inc.. FWS partnered with Soul River on several events, and provided a grant to
promote conservation and outdoor education to inner city youth and veterans.
Integration of EEO into the Agency’s Strategic Mission
• Reporting Structure: The FWS’s EEO Director reports to the Deputy Director for Operations. In FY2015, the FWS revised its reporting structure so that all subordinate-level (Regional) EEO Managers report directly to their Regional/Deputy Regional Directors.
• Refuge Workforce Diversity Team: A cross-program team, led by the National Wildlife
Refuge System Program staff, developed recommendations to implement recruitment, succession, and retention strategies that will help to ensure that the National Wildlife Refuge System in the future is inclusive and reflects the diversity of America. The team forwarded its recommendations and priorities to FWS leadership (the Leadership Development Council of the National Wildlife Refuge System) in September 2014. FWS Regional team members continue to consult with their Diversity and Civil Rights Offices on diversity strategies from those recommendations.
• Nontraditional Stakeholders Engagement Platform: FWS continued to expand its
Nontraditional Stakeholders Engagement Platform which engages diverse communities as partners in civic and science-based initiatives associated with wildlife conservation.
12
The FWS signed a five-year MOU in April 2014 with the Phi Beta Sigma Fraternity, a national African American group, to provide a framework for cooperation to promote conservation and natural resource management among African Americans and other diverse groups. In FY 2015, FWS signed an additional MOU with the Zeta Phi Beta Sorority, Inc., which is affiliated with the Phi Beta Sigma fraternity. In January 2015, the FWS hosted the President of the Sigma Beta Club Foundation and past International President of Phi Beta Sigma Fraternity at Bayou Sauvage National Wildlife Refuge in New Orleans, Louisiana, with local chapter representatives, 10 Sigma Beta members, and the NFL’s Aaron Morgan. Additionally, at the Phi Beta SIGMA Fraternity’s Conclave in Little Rock, Arkansas, FWS discussed opportunities with 150 young men as well as networked with other professionals.
• Urban Wildlife Conservation Program: Provides new opportunities for residents of America’s cities to learn about and take part in wildlife habitat conservation. The NCTC sponsored the Urban Wildlife Conservation Program (UWCP) Evaluation Sub-team, - “moving the needle” toward building a broader and stronger conservation constituency in urban areas. New partnerships were funded in 2015 by the National Fish and Wildlife Foundation and local partners. o Urban Wildlife Refuge Partnerships: In 2015, three cities – Anchorage, AK; Atlanta, GA;
and Springfield, MA – now join 14 others in Urban Wildlife Refuge Partnerships. These partnerships are collaborative efforts to provide residents of demographically diverse cities with fresh opportunities to get outdoors and experience nature within the urban environment.
o Urban Conservation Treaty for Migratory Birds: Cities and partners work to conserve migratory birds through education, citizen science and conservation action in urban and suburban areas. In 2015, five cities – Atlanta, GA; Baltimore, MD; Pittsburgh, PA; New Haven, CT: and McAllen, TX – were designated Urban Bird Treaty cities, joining 21 other such partnerships nationwide.
Management and Program Accountability
• There were no findings of discrimination for FY 2015. The agency did ensure full and prompt compliance with the terms of settlement agreements that were reached during FY 2015. Once settlement agreements were finalized, the EEO Director issued execution and compliance letters to all responsible officials and tracked compliance.
• The Human Resource Office (HR) ensured that performance reviews and expectations for senior-level executives, managers, and supervisors include a performance element that supports the Agency’s EEO and Diversity mission.
• The Agency required all supervisors and managers to take a minimum of four hours of EEO training and four hours of Diversity training. The FWS also provided additional Diversity training opportunities, which were open to all employees, including training on topics such as “Championing Diversity”. In FY 2016, all employees will be required to take two hours of EEO training and two hours of Diversity training.
Proactive Prevention of Unlawful Discrimination
• On February 20, 2014, the Department of the Interior issued its Civil Rights Directive 2014-02, Personnel Bulletin 14-01, U.S. Department of the Interior (DOI) Policy and Procedures on Reasonable Accommodation for Individuals with Disabilities, which sets policy for all of
13
DOI’s Bureaus and Offices. FWS follows the Departmental Directive when responding to reasonable accommodation requests.
• EEO staff provided facilitated on-site and off-site training through webinars and teleconferencing to supervisors and managers. Training included Diversity Management, MD-715, EEO Laws and Regulations, Disability Awareness, Reasonable Accommodations, Prevention of Sexual Harassment, Alternative Dispute Resolution, the EEO Complaint Process (both formal and informal), Reprisal, and Communicating across Generations.
• The FWS has an Anti-Harassment Policy that: (1) informs employees as to what type of behavior is prohibited and the steps to take if faced with a harassment situation; (2) provides for multiple avenues of redress, not just the EEO complaint process; (3) provides for a prompt management inquiry and appropriate corrective and disciplinary action; and, (3) prohibits acts of retaliation against employees and witnesses.
Efficiency
• FWS has an efficient, fair, and impartial complaint resolution and adjudication process under the management of the EEO Director. When it is determined that there is a conflict of interest, the complaint is forwarded to the Departmental Office of Civil Rights for processing.
• The ODIWM is kept separate from the Office of the Solicitor or other agency offices having conflicting or competing interests.
• FWS has an effective ADR program that facilitates the early, effective, neutral, efficient, and
informal resolution of disputes. Managers and supervisors are required to participate in ADR when mediation is elected by a complainant.
• FWS has an effective complaint tracking system (iComplaints). FWS also manually tracks
complaints using a computerized complaint log to provide live updates of the status of complaints.
• FWS has sufficient staffing, funding, and authority to achieve the elimination of identified
barriers.
o FWS uses full-time permanent counselors and contract counselors, as needed. Work performed by the counselors is monitored for technical accuracy and to ensure timeframes are met. If the work by a contract counselor is not completed in the specified timeframes, the Agency negotiates costs to reflect a reduction due to the delay.
o FWS employs a full-time Public Civil Rights and Accessibility Coordinator to work with
members of the public and FWS employees, Regions, and Program offices to assist individuals with disabilities and management officials with processing requests for reasonable accommodations and addressing complaints brought by members of the public.
Responsiveness and Legal Compliance
• FWS has a system in place to ensure that agency officials comply promptly with any orders or
directives issued by EEOC, the Department of the Interior, and all other adjudicatory bodies with jurisdiction over EEO laws.
14
• All supervisors and managers have a critical element regarding EEO and Diversity in their performance standards. Supervisors and managers are evaluated on compliance with these standards. The EEO Director and her staff are also evaluated on ensuring compliance.
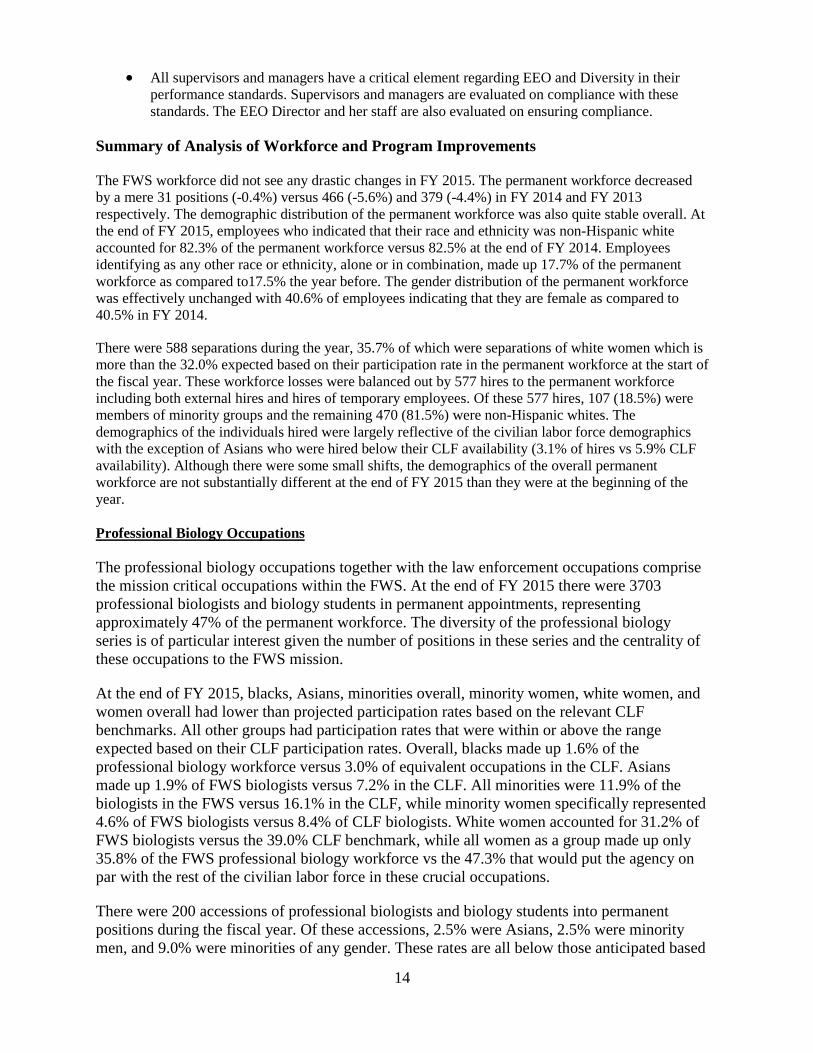
Summary of Analysis of Workforce and Program Improvements The FWS workforce did not see any drastic changes in FY 2015. The permanent workforce decreased by a mere 31 positions (-0.4%) versus 466 (-5.6%) and 379 (-4.4%) in FY 2014 and FY 2013 respectively. The demographic distribution of the permanent workforce was also quite stable overall. At the end of FY 2015, employees who indicated that their race and ethnicity was non-Hispanic white accounted for 82.3% of the permanent workforce versus 82.5% at the end of FY 2014. Employees identifying as any other race or ethnicity, alone or in combination, made up 17.7% of the permanent workforce as compared to17.5% the year before. The gender distribution of the permanent workforce was effectively unchanged with 40.6% of employees indicating that they are female as compared to 40.5% in FY 2014.
There were 588 separations during the year, 35.7% of which were separations of white women which is more than the 32.0% expected based on their participation rate in the permanent workforce at the start of the fiscal year. These workforce losses were balanced out by 577 hires to the permanent workforce including both external hires and hires of temporary employees. Of these 577 hires, 107 (18.5%) were members of minority groups and the remaining 470 (81.5%) were non-Hispanic whites. The demographics of the individuals hired were largely reflective of the civilian labor force demographics with the exception of Asians who were hired below their CLF availability (3.1% of hires vs 5.9% CLF availability). Although there were some small shifts, the demographics of the overall permanent workforce are not substantially different at the end of FY 2015 than they were at the beginning of the year. Professional Biology Occupations The professional biology occupations together with the law enforcement occupations comprise the mission critical occupations within the FWS. At the end of FY 2015 there were 3703 professional biologists and biology students in permanent appointments, representing approximately 47% of the permanent workforce. The diversity of the professional biology series is of particular interest given the number of positions in these series and the centrality of these occupations to the FWS mission.
At the end of FY 2015, blacks, Asians, minorities overall, minority women, white women, and women overall had lower than projected participation rates based on the relevant CLF benchmarks. All other groups had participation rates that were within or above the range expected based on their CLF participation rates. Overall, blacks made up 1.6% of the professional biology workforce versus 3.0% of equivalent occupations in the CLF. Asians made up 1.9% of FWS biologists versus 7.2% in the CLF. All minorities were 11.9% of the biologists in the FWS versus 16.1% in the CLF, while minority women specifically represented 4.6% of FWS biologists versus 8.4% of CLF biologists. White women accounted for 31.2% of FWS biologists versus the 39.0% CLF benchmark, while all women as a group made up only 35.8% of the FWS professional biology workforce vs the 47.3% that would put the agency on par with the rest of the civilian labor force in these crucial occupations.
There were 200 accessions of professional biologists and biology students into permanent positions during the fiscal year. Of these accessions, 2.5% were Asians, 2.5% were minority men, and 9.0% were minorities of any gender. These rates are all below those anticipated based

15
on the composition of the CLF, i.e., 7.2% for Asians, 7.7% for minority men, and 16.1% for minorities overall. All other groups were hired at rates that were consistent with their CLF participation rates.
There were no anomalies in separations; all demographic groups appear to have separated from the permanent biology workforce in proportion to their share of the permanent workforce.
Law Enforcement Officers Law enforcement officers consisted of 433 full-time permanent employees at the end of FY 2015. As a major programmatic area, the diversity of the law enforcement workforce is of interest. At the end of FY 2015, the proportions of women and all minorities were significantly below those predicted based on the relevant CLF. Women made up 10.4% of law enforcement officers versus 23.7% expected based on the relevant CLF benchmark. The participation rate for all minorities was 15.7% versus the expected 26.9%. All other groups participated in the law enforcement workforce at rates at or above their CLF participation rates. In FY 2015, there were nine accessions of law enforcement officers, the majority of whom were white men (88.9%). As a result of their high participation rate, white men also accounted for the majority of the 18 separations (83.3%). Although this is higher than the benchmark participation rate at the end of FY 2014 (76.2%), this difference is not significant given the overall participation rate of white men. Additionally, the accessions primarily served to counterbalance some of the separations, and overall, the shift in participation rates from FY 2014 to FY 2015 was minimal. Professional/Administrative Occupations (except Professional Biology and Law Enforcement Officers): There were 2109 permanent employees in professional and administrative occupations, excluding professional biology and law enforcement officer series, representing approximately 27.0% of the permanent workforce at the end of FY 2015. There were 169 accessions and 194 separations. Men, minority men, white men, and Asians made up smaller than expected percentages of the permanent professional and administrative workforce. All other groups had participation rates at or above those predicted by the CLF.
There were 169 accessions and 194 separations. Of the accessions, 43.8% were men compared to the 49.8% benchmark. Minority men made up 11.2% of the accessions which is essentially consistent with the 10.5% CLF benchmark. Overall, men made up 44.3% of separations compared to their benchmark participation rate of 42.7% and minority men accounted for 9.3% of separations compared to a starting participation rate of 9.0%. All minorities represented 26.6% of accessions in these occupations compared to the 23.9% benchmark. Further, minorities of all genders made up 20.6% of separations versus 23.8% participation at the start of FY 2015. Technical Biology and Wage Grade Occupations There were 876 employees in permanent technical biology and wage grade occupations at the end of FY 2015. During the year there were 97 accessions and 76 separations. Asians, Blacks, white women, minority women, minority men, as well as minorities overall and women overall ended out the year with lower than anticipated participation rates compared to the CLF benchmark. During the year women and
16
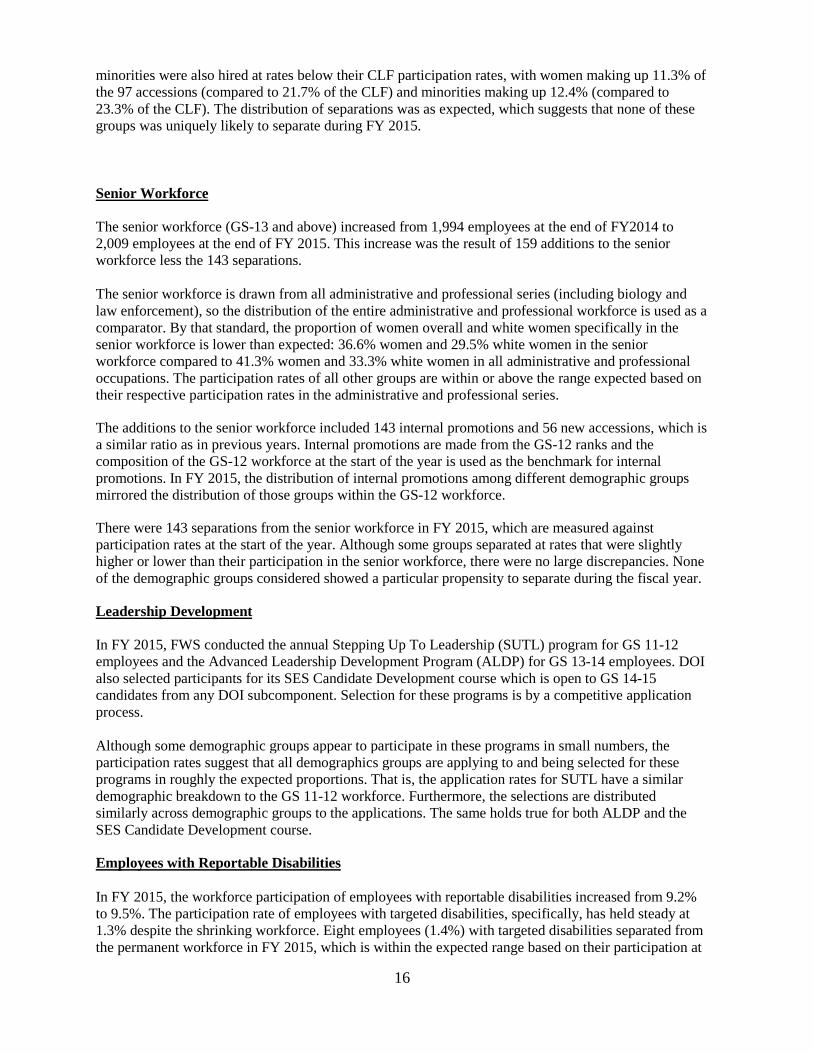
minorities were also hired at rates below their CLF participation rates, with women making up 11.3% of the 97 accessions (compared to 21.7% of the CLF) and minorities making up 12.4% (compared to 23.3% of the CLF). The distribution of separations was as expected, which suggests that none of these groups was uniquely likely to separate during FY 2015. Senior Workforce The senior workforce (GS-13 and above) increased from 1,994 employees at the end of FY2014 to 2,009 employees at the end of FY 2015. This increase was the result of 159 additions to the senior workforce less the 143 separations. The senior workforce is drawn from all administrative and professional series (including biology and law enforcement), so the distribution of the entire administrative and professional workforce is used as a comparator. By that standard, the proportion of women overall and white women specifically in the senior workforce is lower than expected: 36.6% women and 29.5% white women in the senior workforce compared to 41.3% women and 33.3% white women in all administrative and professional occupations. The participation rates of all other groups are within or above the range expected based on their respective participation rates in the administrative and professional series.
The additions to the senior workforce included 143 internal promotions and 56 new accessions, which is a similar ratio as in previous years. Internal promotions are made from the GS-12 ranks and the composition of the GS-12 workforce at the start of the year is used as the benchmark for internal promotions. In FY 2015, the distribution of internal promotions among different demographic groups mirrored the distribution of those groups within the GS-12 workforce.
There were 143 separations from the senior workforce in FY 2015, which are measured against participation rates at the start of the year. Although some groups separated at rates that were slightly higher or lower than their participation in the senior workforce, there were no large discrepancies. None of the demographic groups considered showed a particular propensity to separate during the fiscal year.
Leadership Development In FY 2015, FWS conducted the annual Stepping Up To Leadership (SUTL) program for GS 11-12 employees and the Advanced Leadership Development Program (ALDP) for GS 13-14 employees. DOI also selected participants for its SES Candidate Development course which is open to GS 14-15 candidates from any DOI subcomponent. Selection for these programs is by a competitive application process. Although some demographic groups appear to participate in these programs in small numbers, the participation rates suggest that all demographics groups are applying to and being selected for these programs in roughly the expected proportions. That is, the application rates for SUTL have a similar demographic breakdown to the GS 11-12 workforce. Furthermore, the selections are distributed similarly across demographic groups to the applications. The same holds true for both ALDP and the SES Candidate Development course.
Employees with Reportable Disabilities In FY 2015, the workforce participation of employees with reportable disabilities increased from 9.2% to 9.5%. The participation rate of employees with targeted disabilities, specifically, has held steady at 1.3% despite the shrinking workforce. Eight employees (1.4%) with targeted disabilities separated from the permanent workforce in FY 2015, which is within the expected range based on their participation at
17
the start of the year (1.3%).
Employees with reportable disabilities had a higher participation rate in the professional and administrative occupations (12.1%) as compared to their participation in the permanent workforce overall (9.5%). Employees with reportable disabilities had a lower participation rate in the professional biology series than in the workforce as a whole.
Employees with targeted disabilities represented 0.5% of the mission-critical biology occupations and employees with any reportable disability comprised 6.3% of the professional biology workforce. There were 200 accessions of professional biologists and biology students into permanent positions during the fiscal year, 13 (6.5%) of whom were individuals with disabilities.
There were several encouraging outcomes for employees with targeted disabilities. In FY 2015 employees with disabilities earned 2.7% of all promotions while making up 1.3% of permanent workforce. Employees with targeted disabilities also appear to apply for leadership development programs and participate in the senior workforce in proportion to their share of the workforce.
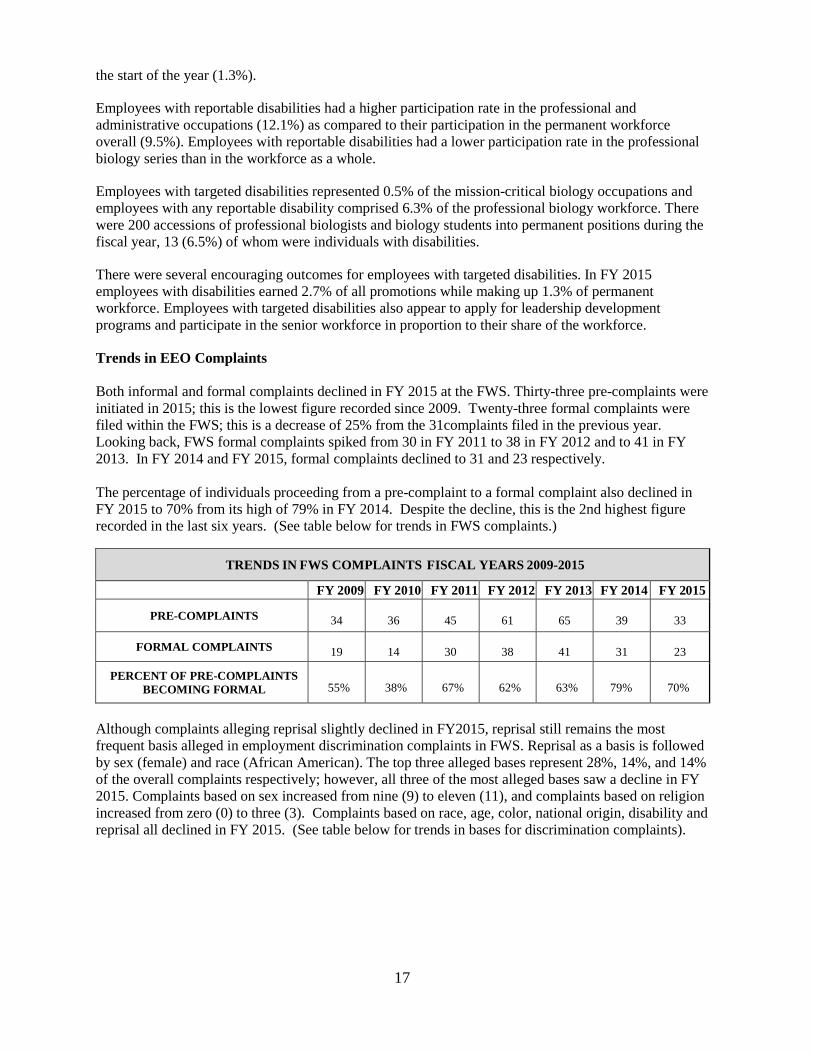
Trends in EEO Complaints Both informal and formal complaints declined in FY 2015 at the FWS. Thirty-three pre-complaints were initiated in 2015; this is the lowest figure recorded since 2009. Twenty-three formal complaints were filed within the FWS; this is a decrease of 25% from the 31complaints filed in the previous year. Looking back, FWS formal complaints spiked from 30 in FY 2011 to 38 in FY 2012 and to 41 in FY 2013. In FY 2014 and FY 2015, formal complaints declined to 31 and 23 respectively. The percentage of individuals proceeding from a pre-complaint to a formal complaint also declined in FY 2015 to 70% from its high of 79% in FY 2014. Despite the decline, this is the 2nd highest figure recorded in the last six years. (See table below for trends in FWS complaints.)
TRENDS IN FWS COMPLAINTS FISCAL YEARS 2009-2015
FY 2009 FY 2010 FY 2011 FY 2012 FY 2013 FY 2014 FY 2015 PRE-COMPLAINTS 34 36 45 61 65 39 33
FORMAL COMPLAINTS 19 14 30 38 41 31 23
PERCENT OF PRE-COMPLAINTS BECOMING FORMAL 55% 38% 67% 62% 63% 79% 70%
Although complaints alleging reprisal slightly declined in FY2015, reprisal still remains the most frequent basis alleged in employment discrimination complaints in FWS. Reprisal as a basis is followed by sex (female) and race (African American). The top three alleged bases represent 28%, 14%, and 14% of the overall complaints respectively; however, all three of the most alleged bases saw a decline in FY 2015. Complaints based on sex increased from nine (9) to eleven (11), and complaints based on religion increased from zero (0) to three (3). Complaints based on race, age, color, national origin, disability and reprisal all declined in FY 2015. (See table below for trends in bases for discrimination complaints).

18
TRENDS IN BASIS FOR DISCRIMINATION COMPLAINTS (Referenced from Part IV of the FY 2015 EEOC 462)
BASIS FY 2009 FY 2010 FY
FY 2012 FY 2013 FY 2014 FY 2015 Race 2 1 7 9 18 14 10 Sex 9 2 15 9 14 9 11 Age 5 4 11 12 10 8 7 Color 1 0 4 4 5 4 2 National Origin 1 0 2 5 4 4 1 Religion 1 0 0 0 2 0 3 Disability 2 13 15 15 13 13 8 Reprisal 10 6 17 18 23 18 16 Genetics n/a 0 0 0 0 0 0
Harassment (non-sexual) remains the number one issue in FWS complaints. (See chart below.) This is consistent across the government.
HARASMENT (NON-SEXUAL) COMPLAINT TRENDS (Referenced 4th Quarter FY 2015 No FEAR Report)
FY 2010 FY 2011 FY 2012 FY 2013 FY 2014 FY 2015 4 12 15 17 21 15
Assignment of duties and evaluation appraisals were the number two and three issues at FWS in FY 2015 with five (5) complaints and four (4) complaints respectively. Employees who enter the EEO process are given the choice of traditional EEO counseling or Alternative Dispute Resolution (ADR) when appropriate. FWS continues to bring awareness to its managers, supervisors, and employees regarding the benefits of the ADR process. Of the 33 pre-complaints filed in FY 2015, ADR was offered 32 times and elected 9 times or 27% of the time. This is consistent with FY 2014, in which ADR was also elected 27% of the time. FWS continues to offer ADR again in the formal process when complaints are accepted for investigation. However, no ADR activities occurred during the formal complaint stage in FY 2015. Nevertheless, complainants are reminded that ADR is available to them during all phases of the EEO process, including the hearing phase. Looking ahead, improving interest and participation in ADR across FWS could resolve more disputes and reduce processing time. Program Deficiencies Revealed by Self-Assessment: There were no deficiencies reported in FY 2015 for Part G, Agency Self-Assessment Checklist Measuring Essential Elements. Please see Part H for accomplishments pertaining to the previously submitted deficiencies for FY 2014. Action Items and Plans for FY 2016 Minorities in FWS represent 17.7% of the total workforce compared to the relevant CLF which is 20.6%. Although the 17.7% represents minute increases over the past few years, minority participation is still 2.9% below the CLF. The FWS recognizes that separations are normal and are expected to occur. Consistent with previous analyses, the data shows that, with the exception of white women, there are no anomalies in the separation rates for minorities and non-minorities. Therefore, the FWS developed a comprehensive statistical model which factors in projected separations, accessions, and fluctuations in the overall workforce. Using this statistical model, the FWS set a FY 2016 goal to increase the applicant pool with the intent of increasing the Service’s overall minority participation rate by 0.5% in FY 2016.

19
Each successive year, the FWS will set goals based on the previous year’s outcome and other factors that may impact the participation rates. Additionally, the FWS will continue to evaluate its existing partnerships to assess the return on investment; and, expand and develop new partnerships, outreach sources, and recruitment tools to increase the applicant pool of individuals from groups with low participation rates in the workforce. The FWS will continue to carryout existing programs that have promising potential such as the Conservation Career Symposia and other programs like it to promote careers in conservation and natural resources management; continue to use the Directorate Resource Assistant Fellows Program to target and recruit individuals who are enrolled in minority serving institutions; and, continue to implement the Director’s hiring goals for individuals with targeted disabilities. In addition to the mandatory four hours of EEO and four hours of Diversity annual training for all managers and supervisors, the Director made it mandatory for all non-supervisory employees to complete a minimum of two hours of EEO training and two hours of diversity/inclusion training for FY 2016. Finally, after receiving results from the FY 2015 Federal Organizational Climate Survey, FWS is conducting focus groups in FY 2016 to gather additional information on employees’ perceptions of the overall work environment. The FWS will analyze the information from the FEOCS, the Employee Viewpoint Survey, the focus groups, and other data to identify any barriers that may impede progress or impact the FWS’s diversity and inclusion goals. Any shortcomings will be addressed and course corrections will be made based on outcomes.

20
THIS PAGE IS LEFT BLANK

21
EEOC FORM 715-01
PART F U.S. Equal Employment Opportunity Commission
FEDERAL AGENCY ANNUAL EEO PROGRAM STATUS REPORT
Certification of Establishment of Continuing Equal Employment Opportunity Programs
I, Inez Uhl, GS-0260-15, am the Principal EEO Director for the U.S. Fish and Wildlife Service (FWS). The FWS has conducted an annual self-assessment of Section 717 and Section 501 programs against the essential elements as prescribed by EEO MD-715. If an essential element was not fully compliant with the standards of EEO MD-715, a further evaluation was conducted and, as appropriate, EEO Plans for Attaining the Essential Elements of a Model EEO Program, are included with this Federal Agency Annual EEO Program Status Report.
The FWS has also analyzed its work force profiles and conducted barrier analyses aimed at detecting whether any management or personnel policy, procedure or practice is operating to disadvantage any group based on race, national origin, gender or disability. EEO Plans to eliminate identified barriers, as appropriate, are included with this Federal Agency Annual EEO Program Status Report.
I certify that proper documentation of this assessment is in place and is being maintained for EEOC review upon request. s/ Inez Uhl, EEO Director December 10, 2015 Certifies that this Federal Agency Annual EEO Program Status Report is in compliance with EEOC MD-715. s/ Daniel M. Ashe, Director December 10, 2015

22
THIS PAGE LEFT BLANK

23
EEOC FORM 715-01
PART G: SELF-ASSESSMENT CHECKLIST Measuring Essential Elements
U.S. Equal Employment Opportunity Commission
FEDERAL AGENCY ANNUAL EEO PROGRAM STATUS REPORT
ESSENTIAL ELEMENT A: DEMONSTRATED COMMITMENT FROM AGENCY LEADERSHIP Requires the agency head to issue written policy statements ensuring a workplace free of discriminatory harassment and a commitment to equal employment opportunity. PART COMPLIANCE
INDICATOR MEASURES YES NO Brief explanation for
unmet measures below (or complete a section in Part H of this report).
A.1 EEO policy statements are up to date.
A.1.a.1 The Agency Head was installed on: Jun 30, 2011 A.1.a.2 The EEO policy statement was issued on: Nov 23, 2011 A.1.a.3 Was the EEO policy Statement issued within 6 - 9
months of the installation of the Agency Head? x
A.1.b During the current Agency Head's tenure, has the EEO policy statement been re-issued annually?
x The Director re-issues EEO Policy Statement annually.
A.1.c Are new employees provided a copy of the EEO policy statement during orientation?
x In addition, it is posted on FWS’s website and in prominent work areas for all employees to access.
A.1.d When an employee is promoted into the supervisory ranks, is s/he provided a copy of the EEO policy statement?
x The EEO Policy Statement is distributed to managers and supervisors when they take the mandatory new supervisor and EEO training sessions. It is also posted on FWS’s website.
A.2 EEO policy statements have been communicated to all employees.
A.2.a Have the heads of subordinate reporting components communicated support of all agency EEO policies through the ranks?
x
A.2.b Has the agency made written materials available to all employees and applicants, informing them of the variety of EEO programs and administrative and judicial remedial procedures available to them?
x Information on EEO programs and administrative and judicial remedial procedures are made available to employees on FWS’s intranet and are distributed periodically by email, e- bulletins and fact sheets.
A.2.c Has the agency prominently posted such written materials in all personnel offices, EEO offices, and on the agency's internal website? [see 29 CFR §1614.102(b)(5)]
x
A.3 Agency EEO policy is vigorously enforced by agency management.
A.3.a Are managers and supervisors evaluated on their commitment to agency EEO policies and principles, including their efforts to:
x
A.3.a.1 resolve problems/disagreements and other conflicts in their respective work environments as they arise?
x

24
ESSENTIAL ELEMENT A: DEMONSTRATED COMMITMENT FROM AGENCY LEADERSHIP Requires the agency head to issue written policy statements ensuring a workplace free of discriminatory harassment and a commitment to equal employment opportunity. PART COMPLIANCE
INDICATOR MEASURES YES NO Brief explanation for
unmet measures below (or complete a section in Part H of this report).
A.3.a.2 address concerns, whether perceived or real, raised by employees and following-up with appropriate action to correct or eliminate tension in the workplace?
x
A.3.a.3 support the agency's EEO program through allocation of mission personnel to participate in community out-reach and recruitment programs with private employers, public schools and universities?
x
A.3.a.4 ensure full cooperation of employees under his/her supervision with EEO office officials such as EEO Counselors, EEO Investigators, etc.?
x
A.3.a.5 ensure a workplace that is free from all forms of discrimination, harassment and retaliation?
x
A.3.a.6 ensure the subordinate supervisors have effective managerial, communication and interpersonal skills in order to supervise most effectively in a workplace with diverse employees and avoid disputes arising from ineffective communications?
x
A.3.a.7 ensure the provision of requested religious accommodations when such accommodations do not cause an undue hardship?
x
A.3.a.8 ensure the provision of requested disability accommodations to qualified individuals with disabilities when such accommodations do not cause an undue hardship?
x
A.3.b Have all employees been informed about what behaviors are inappropriate in the workplace and that this behavior may result in disciplinary action? Describe what means were utilized by the agency to inform its workforce about the penalties for unacceptable behavior.
x All employees are sent FWS Policy on Harassment and Zero Tolerance annually via email. Penalties for unacceptable behavior are referenced in the FWS Director’s Policy memorandum. Employees access the DOI Disciplinary Action Guide through the DOI website.
A.3.c Have the procedures for reasonable accommodation for individuals with disabilities been made readily available/accessible to all employees by disseminating such procedures during orientation of new employees and by making such procedures available on the World Wide Web or Internet?
x A link to the DOI Procedures for Reasonable Accommodation is provided in the FWS Manual.
A.3.d Have managers and supervisors been trained on their responsibilities under the procedures for reasonable accommodation?
x Information on reasonable accommodation is provided during supervisory training.

25
ESSENTIAL ELEMENT B: INTEGRATION OF EEO INTO THE AGENCY'S STRATEGIC MISSION Requires that the agency's EEO programs be organized and structured to maintain a workplace that is free from discrimination in any of the agency's policies, procedures or practices and supports the agency's strategic mission. PART COMPLIANCE
INDICATOR MEASURES YES NO Brief explanation for
unmet measures below (or complete a section in Part H of this report).
B.1 The reporting Structure for the EEO program provides the Principal EEO Official with appropriate authority and resources to effectively carry out a successful EEO program.
B.1.a Is the EEO Director under the direct supervision of the agency head? [see 29 CFR §1614.102(b)(4)] For subordinate level reporting components, is the EEO Director/Officer under the immediate supervision of the lower level component's head official? (For example, does the Regional EEO Officer report to the Regional Administrator?)
x The EEO Director is under the direct supervision of the agency head and reports to the Deputy Director for Operations. It is the policy of the FWS that the Regional Diversity and Civil Rights Chiefs either report to the Regional Director or the Deputy Regional Director. This policy became effective on September 30, 2015.
B.1.b Are the duties and responsibilities of EEO officials clearly defined?
x
B.1.c Do the EEO officials have the knowledge, skills, and abilities to carry out the duties and responsibilities of their positions?
x
B.1.d If the agency has 2nd level reporting components, are there organizational charts that clearly define the reporting structure for EEO programs?
x
B.1.e If the agency has 2nd level reporting components, does the agency-wide EEO Director have authority for the EEO programs within the subordinate reporting components? If not, please describe how EEO program authority is delegated to subordinate reporting components
x The EEO Director has complete technical oversight of the formal EEO process and delegates the pre-complaint process to the Regions except in the case of conflicts of interest. The EEO Director develops FWS-wide policies and procedures and provides general oversight and technical guidance to Regional EEO officials.
B.2 The EEO Director and other EEO professional staff responsible for EEO programs have regular and effective means of informing the agency head and senior management officials of the status of EEO programs and are involved in, and consulted on, management/personnel actions.
B.2.a Does the EEO Director/Officer have a regular and effective means of informing the agency head and other top management officials of the effectiveness, efficiency and legal compliance of the agency's EEO program?
x The EEO Director meets with the Deputy Director regularly to provide briefings on the EEO Program. The EEO Director also provides updates for the Executive Diversity Committee and the Directorate meetings.

26
ESSENTIAL ELEMENT B: INTEGRATION OF EEO INTO THE AGENCY'S STRATEGIC MISSION Requires that the agency's EEO programs be organized and structured to maintain a workplace that is free from discrimination in any of the agency's policies, procedures or practices and supports the agency's strategic mission. PART COMPLIANCE
INDICATOR MEASURES YES NO Brief explanation for
unmet measures below (or complete a section in Part H of this report).
B.2.b Following the submission of the immediately preceding FORM 715-01, did the EEO Director/Officer present to the head of the agency and other senior officials the "State of the Agency" briefing covering all components of the EEO report, including an assessment of the performance of the agency in each of the six elements of the Model EEO Program and a report on the progress of the agency in completing its barrier analysis including any barriers it identified and/or eliminated or reduced the impact of?
x The EEO Director provides a briefing to the Director and the Deputy Director on the “State of the Agency” covering all components of MD-715, including an assessment of the six elements of the Model EEO Program, a report of accomplishments, and plan of action to correct deficiencies.
B.2.c Are EEO program officials present during agency deliberations prior to decisions regarding recruitment strategies, vacancy projections, succession planning, selections for training/career development opportunities, and other workforce changes?
x The FWS employs nine recruiters to conduct targeted recruitment. The recruiters are assigned to the Headquarters ODIWM and the Regional DCR Offices. EEO and HR Officials routinely work in collaboration on recruitment strategies, vacancy projections, succession planning, selections for training/career development opportunities, and other workforce initiatives.
B.2.c.1 Does the agency consider whether any group of employees or applicants might be negatively impacted prior to making human resource decisions such as re-organizations and re-alignments?
x
B.2.c.2 Are management/personnel policies, procedures and practices examined at regular intervals to assess whether there are hidden impediments to the realization of equality of opportunity for any group(s) of employees or applicants? [see 29 C.F.R. § 1614.102(b)(3)]
x
B.2.d Is the EEO Director included in the agency's strategic planning, especially the agency's human capital plan, regarding succession planning, training, etc., to ensure that EEO concerns are integrated into the agency's strategic mission?
x The EEO Director has a strong working relationship with the Chief, Division of Human Resources and provides technical guidance to ensure that EEO concerns are integrated into the FWS strategic mission.

27
ESSENTIAL ELEMENT B: INTEGRATION OF EEO INTO THE AGENCY'S STRATEGIC MISSION Requires that the agency's EEO programs be organized and structured to maintain a workplace that is free from discrimination in any of the agency's policies, procedures or practices and supports the agency's strategic mission. PART COMPLIANCE
INDICATOR MEASURES YES NO Brief explanation for
unmet measures below (or complete a section in Part H of this report).
B.3 The agency has committed sufficient human resources and budget allocations to its EEO programs to ensure successful operation.
B.3.a Does the EEO Director have the authority and funding to ensure implementation of agency EEO action plans to improve EEO program efficiency and/or eliminate identified barriers to the realization of equality of opportunity?
x The EEO Director maintains an operating budget to ensure implementation of the agency EEO action plans.
B.3.b Are sufficient personnel resources allocated to the EEO Program to ensure that agency self-assessments and self-analyses prescribed by EEO MD-715 are conducted annually and to maintain an effective complaint processing system?
x
B.3.c Are statutory/regulatory EEO related Special Emphasis Programs sufficiently staffed?
x The FWS Diversity Program Manager serves as the Special Emphasis and Disability Program Manager who oversees all of FWS Special Emphasis Programs and the Disability and Veterans Employment Programs. FWS actively participates on the DOI Special Emphasis Committee. Recruiters for each Regional Diversity and Civil Rights Office support the Special Emphasis Programs.
B.3.c.1 Federal Women's Program - 5 U.S.C. 7201; 38 U.S.C. 4214; Title 5 CFR, Subpart B, 720.204
x In collaboration with the DOI.
B.3.c.2 Hispanic Employment Program - Title 5 CFR, Subpart B, 720.204
x In collaboration with the DOI.
B.3.c.3 People With Disabilities Program Manager; Selective Placement Program for Individuals With Disabilities - Section 501 of the Rehabilitation Act; Title 5 U.S.C. Subpart B, Chapter 31, Subchapter I-3102; 5 CFR 213.3102(t) and (u); 5 CFR 315.709
x The Diversity Program Manager manages the Disability and Veterans Programs.
B.3.d Are other agency special emphasis programs monitored by the EEO Office for coordination and compliance with EEO guidelines and principles, such as FEORP - 5 CFR 720; Veterans Employment Programs; and Black/African American; American Indian/Alaska Native, Asian American/Pacific Islander programs?
x

28
ESSENTIAL ELEMENT B: INTEGRATION OF EEO INTO THE AGENCY'S STRATEGIC MISSION Requires that the agency's EEO programs be organized and structured to maintain a workplace that is free from discrimination in any of the agency's policies, procedures or practices and supports the agency's strategic mission. PART COMPLIANCE
INDICATOR MEASURES YES NO Brief explanation for
unmet measures below (or complete a section in Part H of this report).
B.4 The agency has committed sufficient budget to support the success of its EEO programs.
B.4.a Are there sufficient resources to enable the agency to conduct a thorough barrier analysis of its workforce, including the provision of adequate data collection and tracking systems?
x The FWS Headquarters and Regional EEO staffs retrieve workforce employment data and conduct queries through the DOI, EEO data and tracking system - Datamart (Hyperion Software). The Datamart system is used to develop quarterly workforce statistics to report workforce trends and participation rates. Headquarters has two full-time permanent statisticians who assist all Regions with reports and analysis.
B.4.b Is there sufficient budget allocated to all employees to utilize, when desired, all EEO programs, including the complaint processing program and ADR, and to make a request for reasonable accommodation? (Including subordinate level reporting components?)
x
B.4.c Has funding been secured for publication and distribution of EEO materials (e.g. harassment policies, EEO posters, reasonable accommodations procedures, etc.)?
x
B.4.d Is there a central fund or other mechanism for funding supplies, equipment and services necessary to provide disability accommodations?
x FWS provides reasonable accommodations to persons with a disability, in accordance with DOI Policy. Regions and Headquarters Programs fund supplies, equipment, and other services, as necessary.
B.4.e Does the agency fund major renovation projects to ensure timely compliance with Uniform Federal Accessibility Standards?
x See Part H
B.4.f Is the EEO Program allocated sufficient resources to train all employees on EEO Programs, including administrative and judicial remedial procedures available to employees?
x
B.4.f.1 Is there sufficient funding to ensure the prominent posting of written materials in all personnel and EEO offices? [see 29 C.F.R. § 1614.102(b)(5)]
x
B.4.f.2 Is there sufficient funding to ensure that all employees have access to this training and information?
x
29
ESSENTIAL ELEMENT B: INTEGRATION OF EEO INTO THE AGENCY'S STRATEGIC MISSION Requires that the agency's EEO programs be organized and structured to maintain a workplace that is free from discrimination in any of the agency's policies, procedures or practices and supports the agency's strategic mission. PART COMPLIANCE
INDICATOR MEASURES YES NO Brief explanation for
unmet measures below (or complete a section in Part H of this report).
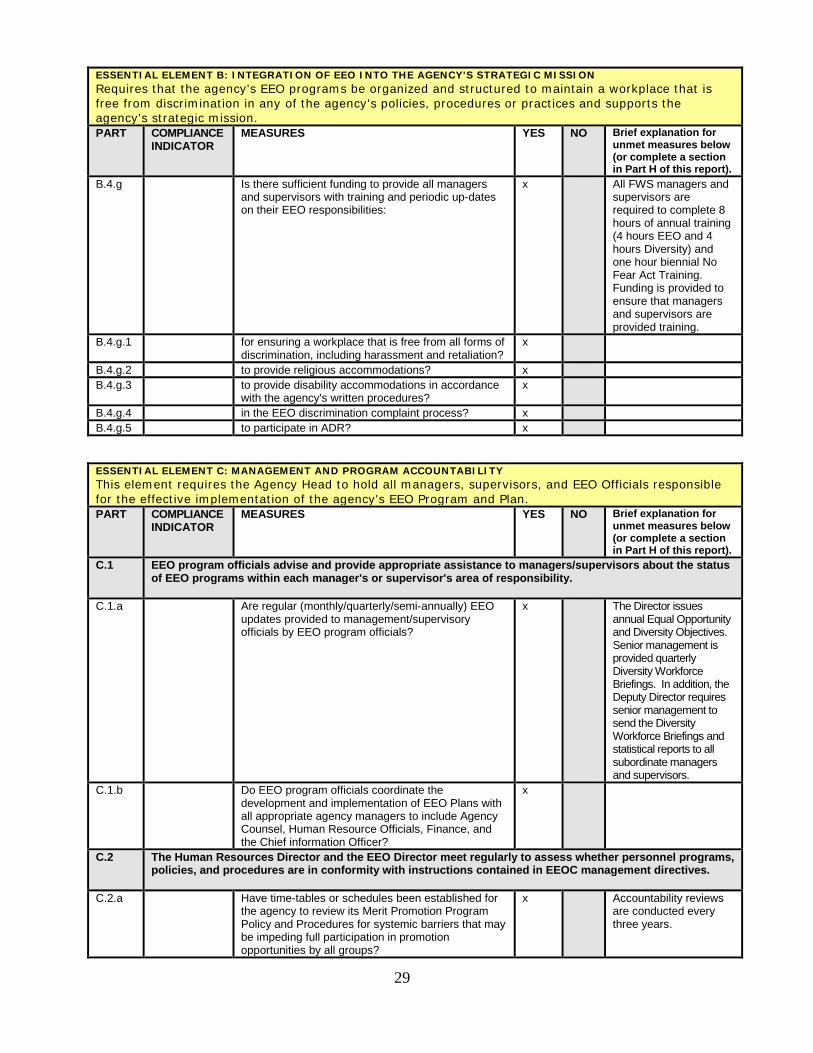
B.4.g Is there sufficient funding to provide all managers and supervisors with training and periodic up-dates on their EEO responsibilities:
x All FWS managers and supervisors are required to complete 8 hours of annual training (4 hours EEO and 4 hours Diversity) and one hour biennial No Fear Act Training. Funding is provided to ensure that managers and supervisors are provided training.
B.4.g.1 for ensuring a workplace that is free from all forms of discrimination, including harassment and retaliation?
x
B.4.g.2 to provide religious accommodations? x B.4.g.3 to provide disability accommodations in accordance
with the agency's written procedures? x
B.4.g.4 in the EEO discrimination complaint process? x B.4.g.5 to participate in ADR? x ESSENTIAL ELEMENT C: MANAGEMENT AND PROGRAM ACCOUNTABILITY This element requires the Agency Head to hold all managers, supervisors, and EEO Officials responsible for the effective implementation of the agency's EEO Program and Plan. PART COMPLIANCE
INDICATOR MEASURES YES NO Brief explanation for
unmet measures below (or complete a section in Part H of this report).
C.1 EEO program officials advise and provide appropriate assistance to managers/supervisors about the status of EEO programs within each manager's or supervisor's area of responsibility.
C.1.a Are regular (monthly/quarterly/semi-annually) EEO updates provided to management/supervisory officials by EEO program officials?
x The Director issues annual Equal Opportunity and Diversity Objectives. Senior management is provided quarterly Diversity Workforce Briefings. In addition, the Deputy Director requires senior management to send the Diversity Workforce Briefings and statistical reports to all subordinate managers and supervisors.
C.1.b Do EEO program officials coordinate the development and implementation of EEO Plans with all appropriate agency managers to include Agency Counsel, Human Resource Officials, Finance, and the Chief information Officer?
x
C.2 The Human Resources Director and the EEO Director meet regularly to assess whether personnel programs, policies, and procedures are in conformity with instructions contained in EEOC management directives.
C.2.a Have time-tables or schedules been established for the agency to review its Merit Promotion Program Policy and Procedures for systemic barriers that may be impeding full participation in promotion opportunities by all groups?
x Accountability reviews are conducted every three years.

30
ESSENTIAL ELEMENT C: MANAGEMENT AND PROGRAM ACCOUNTABILITY This element requires the Agency Head to hold all managers, supervisors, and EEO Officials responsible for the effective implementation of the agency's EEO Program and Plan. PART COMPLIANCE
INDICATOR MEASURES YES NO Brief explanation for
unmet measures below (or complete a section in Part H of this report).
C.2.b Have time-tables or schedules been established for the agency to review its Employee Recognition Awards Program and Procedures for systemic barriers that may be impeding full participation in the program by all groups?
x Statistical analysis is conducted during the preparation of the MD-715 Barrier Analysis.
C.2.c Have time-tables or schedules been established for the agency to review its Employee Development/Training Programs for systemic barriers that may be impeding full participation in training opportunities by all groups?
x Statistical analysis was conducted during the preparation of the MD-715 Barrier Analysis.
C.3 When findings of discrimination are made, the agency explores whether or not disciplinary actions should be taken.
C.3.a Does the agency have a disciplinary policy and/or a table of penalties that covers employees found to have committed discrimination?
x FWS refers to the DOI Table of Penalties to determine what appropriate disciplinary action should be taken if discrimination is committed. Policy guidance is provided by the Headquarters Human Resources Officer who makes recommendations to the Regional Directors regarding appropriate disciplinary actions to be taken when an employee has been found to have committed a discriminatory act.
C.3.b Have all employees, supervisors, and managers been informed as to the penalties for being found to perpetrate discriminatory behavior or for taking personnel actions based upon a prohibited basis?
x
C.3.c Has the agency, when appropriate, disciplined or sanctioned managers/supervisors or employees found to have discriminated over the past two years? If so, cite number found to have discriminated and list penalty /disciplinary action for each type of violation.
N/A In FY2014 and FY2015 there were no findings of discrimination.
C.3.d Does the agency promptly (within the established time frame) comply with EEOC, Merit Systems Protection Board, Federal Labor Relations Authority, labor arbitrators, and District Court orders?
x
C.3.e Does the agency review disability accommodation decisions/actions to ensure compliance with its written procedures and analyze the information tracked for trends, problems, etc.?
x

31
ESSENTIAL ELEMENT D: PROACTIVE PREVENTION Requires that the agency head ensure that there are effective systems in place for evaluating the impact and effectiveness of the agency's EEO programs as well as an efficient and fair dispute resolution process. PART COMPLIANCE
INDICATOR MEASURES YES NO Brief explanation for
unmet measures below (or complete a section in Part H of this report).
D.1 Analyses to identify and remove unnecessary barriers to employment are conducted throughout the year.
D.1.a Do senior managers meet with and assist the EEO Director and/or other EEO Program Officials in the identification of barriers that may be impeding the realization of equal employment opportunity?
x The EEO Director meets with the FWS Deputy Director regularly to discuss and address potential barriers. The EEO Director also meets and works with the Executive Diversity Committee—to identify barriers. During FY2015, the Director and Executive Diversity Committee issued an updated five-year, DIIP to address potential barriers and challenges to diversity and inclusion.
D.1.b When barriers are identified, do senior managers develop and implement, with the assistance of the agency EEO office, agency EEO Action Plans to eliminate said barriers?
x The FWS Directorate, Executive Diversity Committee, EEO Director, and HR Senior Advisor collaborated in developing the updated five-year DIIP Plan. FWS managers and supervisors are actively engaged in minimizing barriers to employment when they are brought to their attention.
D.1.c Do senior managers successfully implement EEO Action Plans and incorporate the EEO Action Plan Objectives into agency strategic plans?
x
D.1.d Are trend analyses of workforce profiles conducted by race, national origin, sex and disability?
x
D.1.e Are trend analyses of the workforce's major occupations conducted by race, national origin, sex and disability?
x
D.1.f Are trends analyses of the workforce's grade level distribution conducted by race, national origin, sex and disability?
x
D.1.g Are trend analyses of the workforce's compensation and reward system conducted by race, national origin, sex and disability?
x
D.1.h Are trend analyses of the effects of management/personnel policies, procedures and practices conducted by race, national origin, sex and disability?
x
D.2 The use of Alternative Dispute Resolution (ADR) is encouraged by senior management.
D.2.a Are all employees encouraged to use ADR? x D.2.b Is the participation of supervisors and managers in
the ADR process required? x

32
ESSENTIAL ELEMENT E: EFFICIENCY Requires that the agency head ensure that there are effective systems in place for evaluating the impact and effectiveness of the agency's EEO programs as well as an efficient and fair dispute resolution process. PART COMPLIANCE
INDICATOR MEASURES YES NO Brief explanation for
unmet measures below (or complete a section in Part H of this report).
E.1 The agency has sufficient staffing, funding, and authority to achieve the elimination of identified barriers.
E.1.a Does the EEO Office employ personnel with adequate training and experience to conduct the analyses required by MD-715 and these instructions?
x
E.1.b Has the agency implemented adequate data collection and analysis systems that permit tracking of the information required by MD-715 and these instructions?
x See Part H See Part H
E.1.c Have sufficient resources been provided to conduct effective audits of field facilities' efforts to achieve a model EEO program and eliminate discrimination under Title VII and the Rehabilitation Act?
x
E.1.d Is there a designated agency official or other mechanism in place to coordinate or assist with processing requests for disability accommodations in all major components of the agency?
x
E.1.e Are 90% of accommodation requests processed within the time frame set forth in the agency procedures for reasonable accommodation?
x
E.2 The agency has an effective complaint tracking and monitoring system in place to increase the effectiveness of the agency's EEO programs.
E.2.a Does the agency use a complaint tracking and monitoring system that allows identification of the location and status of complaints and length of time elapsed at each stage of the agency's complaint resolution process?
x
E.2.b Does the agency's tracking system identify the issues and bases of the complaints, the aggrieved individuals/complainants, the involved management officials and other information to analyze complaint activity and trends?
x
E.2.c Does the agency hold contractors accountable for delay in counseling and investigation processing times? If yes, briefly describe how in explanation cell:
x Prices are re-negotiated for firms that fail to produce timely products and/or the firm will not receive subsequent cases to counsel or investigate.
E.2.d Does the agency monitor and ensure that new investigators, counselors, including contract and collateral duty investigators, receive the 32 hours of training required in accordance with EEO Management Directive MD-110?
x
E.2.e Does the agency monitor and ensure that experienced counselors, investigators, including contract and collateral duty investigators, receive the 8 hours of refresher training required on an annual basis in accordance with EEO Management Directive MD-110?
x
E.3 The agency has sufficient staffing, funding and authority to comply with the time frames in accordance with the EEOC (29 C.F.R. Part 1614) regulations for processing EEO complaints of employment discrimination.
E.3.a Are benchmarks in place that compare the agency's discrimination complaint processes with 29 CFR Part 1614?
x

33
ESSENTIAL ELEMENT E: EFFICIENCY Requires that the agency head ensure that there are effective systems in place for evaluating the impact and effectiveness of the agency's EEO programs as well as an efficient and fair dispute resolution process. PART COMPLIANCE
INDICATOR MEASURES YES NO Brief explanation for
unmet measures below (or complete a section in Part H of this report).
E.3.a.1 Does the agency provide timely EEO counseling within 30 days of the initial request or within an agreed upon extension in writing, up to 60 days?
x
E.3.a.2 Does the agency provide an aggrieved person with written notification of his/her rights and responsibilities in the EEO process in a timely fashion?
x
E.3.a.3 Does the agency complete the investigations within the applicable prescribed time frame?
x
E.3.a.4 When a complainant requests a final agency decision, does the agency issue the decision within 60 days of the request?
N/A DOI has responsibility to issue the decision.
E.3.a.5 When a complainant requests a hearing, does the agency immediately upon receipt of the request from the EEOC AJ forward the investigative file to the EEOC Hearing Office?
x
E.3.a.6 When a settlement agreement is entered into, does the agency timely complete any obligations provided for in such agreements?
x
E.3.a.7 Does the agency ensure timely compliance with EEOC AJ decisions which are not the subject of an appeal by the agency?
x
E.4 There is an efficient and fair dispute resolution process and effective systems for evaluating the impact and effectiveness of the agency's EEO complaint processing programs.
E.4.a In accordance with 29 C.F.R. §1614.102(b), has the agency established an ADR Program during the pre-complaint and formal complaint stages of the EEO process?
x
E.4.b Does the agency require all managers and supervisors to receive ADR training in accordance with EEOC (29 C.F.R. Part 1614) regulations, with emphasis on the federal government's interest in encouraging mutual resolution of disputes and the benefits associated with utilizing ADR?
x ADR training is incorporated in supervisory training which is conducted at the National Conservation Training Center. ADR training is also offered throughout the year through the various EEO courses taught by the ODIWM and Regional Diversity and Civil Rights staff.
E.4.c After the agency has offered ADR and the complainant has elected to participate in ADR, are the managers required to participate?
x
E.4.d Does the responsible management official directly involved in the dispute have settlement authority?
x The FWS Regional Directors and Assistant Directors have settlement authority when a settlement involves material benefits or monetary value. Otherwise, the settlement authority is delegated.

34
ESSENTIAL ELEMENT E: EFFICIENCY Requires that the agency head ensure that there are effective systems in place for evaluating the impact and effectiveness of the agency's EEO programs as well as an efficient and fair dispute resolution process. PART COMPLIANCE
INDICATOR MEASURES YES NO Brief explanation for
unmet measures below (or complete a section in Part H of this report).
E.5 The agency has effective systems in place for maintaining and evaluating the impact and effectiveness of its EEO programs.
E.5.a Does the agency have a system of management controls in place to ensure the timely, accurate, complete and consistent reporting of EEO complaint data to the EEOC?
x
E.5.b Does the agency provide reasonable resources for the EEO complaint process to ensure efficient and successful operation in accordance with 29 C.F.R. § 1614.102(a)(1)?
x
E.5.c Does the agency EEO office have management controls in place to monitor and ensure that the data received from Human Resources is accurate, timely received, and contains all the required data elements for submitting annual reports to the EEOC?
x
E.5.d Do the agency's EEO programs address all of the laws enforced by the EEOC?
x
E.5.e Does the agency identify and monitor significant trends in complaint processing to determine whether the agency is meeting its obligations under Title VII and the Rehabilitation Act?
x
E.5.f Does the agency track recruitment efforts and analyze efforts to identify potential barriers in accordance with MD-715 standards?
x
E.5.g Does the agency consult with other agencies of similar size on the effectiveness of their EEO programs to identify best practices and share ideas?
x
E.6 The agency ensures that the investigation and adjudication function of its complaint resolution process are separate from its legal defense arm of agency or other offices with conflicting or competing interests.
E.6.a Are legal sufficiency reviews of EEO matters handled by a functional unit that is separate and apart from the unit which handles agency representation in EEO complaints?
N/A FWS does not request legal sufficiency reviews.
E.6.b Does the agency discrimination complaint process ensure a neutral adjudication function?
x
E.6.c If applicable, are processing time frames incorporated for the legal counsel's sufficiency review for timely processing of complaints?
N/A FWS does not request legal sufficiency reviews.
ESSENTIAL ELEMENT F: RESPONSIVENESS AND LEGAL COMPLIANCE This element requires that federal agencies are in full compliance with EEO statutes and EEOC regulations, policy guidance, and other written instructions. PART COMPLIANCE
INDICATOR MEASURES YES NO Brief explanation for
unmet measures below (or complete a section in Part H of this report).
F.1 Agency personnel are accountable for timely compliance with orders issued by EEOC Administrative Judges.
F.1.a Does the agency have a system of management control to ensure that agency officials timely comply with any orders or directives issued by EEOC Administrative Judges?
x

35
ESSENTIAL ELEMENT F: RESPONSIVENESS AND LEGAL COMPLIANCE This element requires that federal agencies are in full compliance with EEO statutes and EEOC regulations, policy guidance, and other written instructions. PART COMPLIANCE
INDICATOR MEASURES YES NO Brief explanation for
unmet measures below (or complete a section in Part H of this report).
F.2 The agency's system of management controls ensures that the agency timely completes all ordered corrective action and submits its compliance report to EEOC within 30 days of such completion.
F.2.a Does the agency have control over the payroll processing function of the agency? If Yes, answer the two questions below.
x
F.2.a.1 Are there steps in place to guarantee responsive, timely, and predictable processing of ordered monetary relief?
x
F.2.a.2 Are procedures in place to promptly process other forms of ordered relief?
x
F.3 Agency personnel are accountable for the timely completion of actions required to comply with orders of EEOC.
F.3.a Is compliance with EEOC orders encompassed in the performance standards of any agency employees?
x
F.3.a.1 If so, please identify the employees by title in the comments section, and state how performance is measured.
x All supervisors and managers have a critical element regarding EEO and Diversity in their performance standards. Supervisors and managers are evaluated on compliance with these standards. Diversity advocacy performance statement is included in all SES performance plans.
F.3.b Is the unit charged with the responsibility for compliance with EEOC orders located in the EEO office?
x
F.3.b.1 If not, please identify the unit in which it is located, the number of employees in the unit, and their grade levels in the comments section.
-
F.3.c Have the involved employees received any formal training in EEO compliance?
x
F.3.d Does the agency promptly provide to the EEOC the following documentation for completing compliance:
x
F.3.d.1 Attorney Fees: Copy of check issued for attorney fees and /or a narrative statement by an appropriate agency official, or agency payment order dating the dollar amount of attorney fees paid?
x
F.3.d.2 Awards: A narrative statement by an appropriate agency official stating the dollar amount and the criteria used to calculate the award?
x
F.3.d.3 Back Pay and Interest: Computer print-outs or payroll documents outlining gross back pay and interest, copy of any checks issued, narrative statement by an appropriate agency official of total monies paid?
x
F.3.d.4 Compensatory Damages: The final agency decision and evidence of payment, if made?
x

36
ESSENTIAL ELEMENT F: RESPONSIVENESS AND LEGAL COMPLIANCE This element requires that federal agencies are in full compliance with EEO statutes and EEOC regulations, policy guidance, and other written instructions. PART COMPLIANCE
INDICATOR MEASURES YES NO Brief explanation for
unmet measures below (or complete a section in Part H of this report).
F.3.d.5 Training: Attendance roster at training session(s) or a narrative statement by an appropriate agency official confirming that specific persons or groups of persons attended training on a date certain?
x
F.3.d.6 Personnel Actions (e.g., Reinstatement, Promotion, Hiring, Reassignment): Copies of SF-50s
x
F.3.d.7 Posting of Notice of Violation: Original signed and dated notice reflecting the dates that the notice was posted. A copy of the notice will suffice if the original is not available.
x
F.d.3.8 Supplemental Investigation: 1. Copy of letter to complainant acknowledging receipt from EEOC of remanded case. 2. Copy of letter to complainant transmitting the Report of Investigation (not the ROI itself unless specified). 3. Copy of request for a hearing (complainant's request or agency's transmittal letter).
x
F.d.3.9 Final Agency Decision (FAD): FAD or copy of the complainant's request for a hearing.
x
F.d.3.10 Restoration of Leave: Print-out or statement identifying the amount of leave restored, if applicable. If not, an explanation or statement.
x
F.3.d.11 Civil Actions: A complete copy of the civil action complaint demonstrating same issues raised as in compliance matter.
x
F.3.d.12 Settlement Agreements: Signed and dated agreement with specific dollar amounts, if applicable. Also, appropriate documentation of relief is provided.
x
Footnotes:
1. See 29 C.F.R. § 1614.102. 2. When an agency makes modifications to its procedures, the procedures must be resubmitted to the Commission. See EEOC Policy Guidance on Executive Order 13164: Establishing Procedures to Facilitate the Provision of Reasonable Accommodation (10/20/00), Question 28.
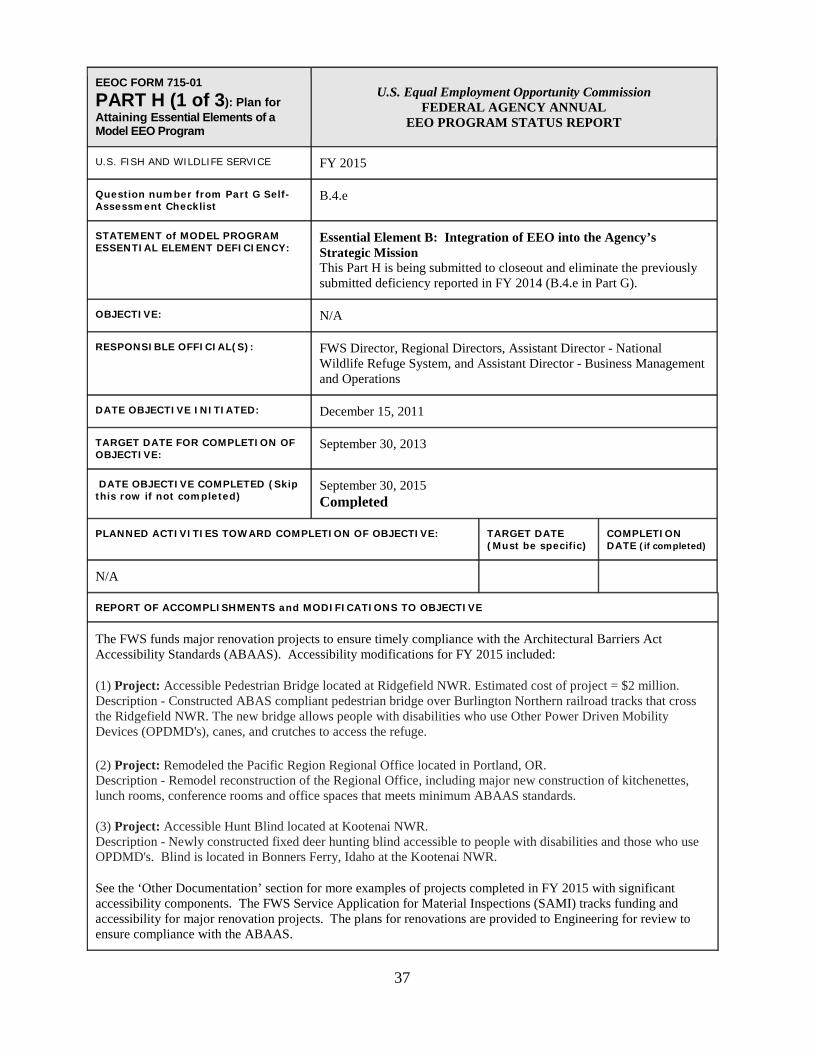
37
EEOC FORM 715-01
PART H (1 of 3): Plan for Attaining Essential Elements of a Model EEO Program
U.S. Equal Employment Opportunity Commission FEDERAL AGENCY ANNUAL
EEO PROGRAM STATUS REPORT
U.S. FISH AND WILDLIFE SERVICE FY 2015
Question number from Part G Self-Assessment Checklist
B.4.e
STATEMENT of MODEL PROGRAM ESSENTIAL ELEMENT DEFICIENCY:
Essential Element B: Integration of EEO into the Agency’s Strategic Mission This Part H is being submitted to closeout and eliminate the previously submitted deficiency reported in FY 2014 (B.4.e in Part G).
OBJECTIVE: N/A
RESPONSIBLE OFFICIAL(S): FWS Director, Regional Directors, Assistant Director - National Wildlife Refuge System, and Assistant Director - Business Management and Operations
DATE OBJECTIVE INITIATED: December 15, 2011
TARGET DATE FOR COMPLETION OF OBJECTIVE:
September 30, 2013
DATE OBJECTIVE COMPLETED (Skip this row if not completed)
September 30, 2015 Completed
PLANNED ACTIVITIES TOWARD COMPLETION OF OBJECTIVE: TARGET DATE (Must be specific)
COMPLETION DATE (if completed)
N/A
REPORT OF ACCOMPLISHMENTS and MODIFICATIONS TO OBJECTIVE
The FWS funds major renovation projects to ensure timely compliance with the Architectural Barriers Act Accessibility Standards (ABAAS). Accessibility modifications for FY 2015 included: (1) Project: Accessible Pedestrian Bridge located at Ridgefield NWR. Estimated cost of project = $2 million. Description - Constructed ABAS compliant pedestrian bridge over Burlington Northern railroad tracks that cross the Ridgefield NWR. The new bridge allows people with disabilities who use Other Power Driven Mobility Devices (OPDMD's), canes, and crutches to access the refuge. (2) Project: Remodeled the Pacific Region Regional Office located in Portland, OR. Description - Remodel reconstruction of the Regional Office, including major new construction of kitchenettes, lunch rooms, conference rooms and office spaces that meets minimum ABAAS standards. (3) Project: Accessible Hunt Blind located at Kootenai NWR. Description - Newly constructed fixed deer hunting blind accessible to people with disabilities and those who use OPDMD's. Blind is located in Bonners Ferry, Idaho at the Kootenai NWR. See the ‘Other Documentation’ section for more examples of projects completed in FY 2015 with significant accessibility components. The FWS Service Application for Material Inspections (SAMI) tracks funding and accessibility for major renovation projects. The plans for renovations are provided to Engineering for review to ensure compliance with the ABAAS.
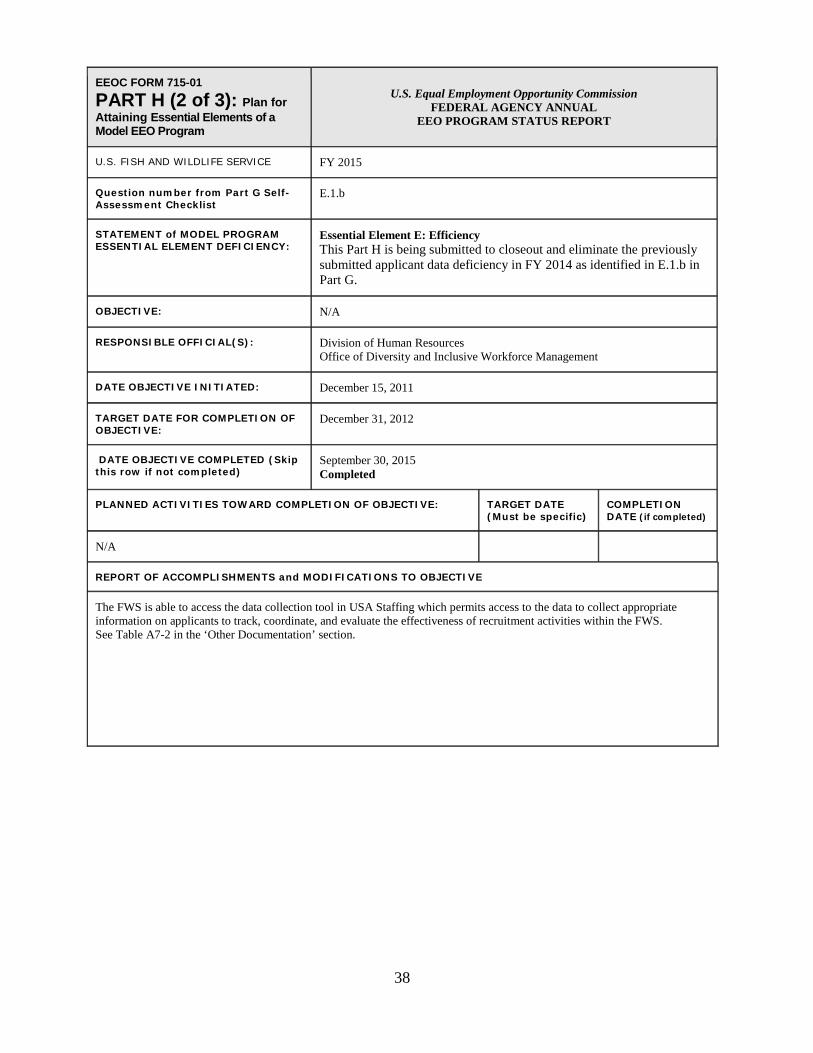
38
EEOC FORM 715-01
PART H (2 of 3): Plan for Attaining Essential Elements of a Model EEO Program
U.S. Equal Employment Opportunity Commission FEDERAL AGENCY ANNUAL
EEO PROGRAM STATUS REPORT
U.S. FISH AND WILDLIFE SERVICE FY 2015
Question number from Part G Self-Assessment Checklist
E.1.b
STATEMENT of MODEL PROGRAM ESSENTIAL ELEMENT DEFICIENCY:
Essential Element E: Efficiency This Part H is being submitted to closeout and eliminate the previously submitted applicant data deficiency in FY 2014 as identified in E.1.b in Part G.
OBJECTIVE: N/A
RESPONSIBLE OFFICIAL(S): Division of Human Resources Office of Diversity and Inclusive Workforce Management
DATE OBJECTIVE INITIATED: December 15, 2011
TARGET DATE FOR COMPLETION OF OBJECTIVE:
December 31, 2012
DATE OBJECTIVE COMPLETED (Skip this row if not completed)
September 30, 2015 Completed
PLANNED ACTIVITIES TOWARD COMPLETION OF OBJECTIVE: TARGET DATE (Must be specific)
COMPLETION DATE (if completed)
N/A
REPORT OF ACCOMPLISHMENTS and MODIFICATIONS TO OBJECTIVE
The FWS is able to access the data collection tool in USA Staffing which permits access to the data to collect appropriate information on applicants to track, coordinate, and evaluate the effectiveness of recruitment activities within the FWS. See Table A7-2 in the ‘Other Documentation’ section.

39
EEOC FORM 715-01
PART H (3 of 3): Plan for Attaining Essential Elements of a Model EEO Program
U.S. Equal Employment Opportunity Commission FEDERAL AGENCY ANNUAL
EEO PROGRAM STATUS REPORT
U.S. FISH AND WILDLIFE SERVICE FY 2015
Question number from Part G Self-Assessment Checklist
E.1.b
STATEMENT of MODEL PROGRAM ESSENTIAL ELEMENT DEFICIENCY:
Essential Element E: Efficiency This Part H is being submitted to closeout and eliminate the previously submitted exit survey data deficiency in FY 2014 as identified in E.1.b in Part G.
OBJECTIVE: N/A
RESPONSIBLE OFFICIAL(S): Exit Survey Administrator, Division of Human Resources Office of Diversity and Inclusive Workforce Management Regional Diversity and Civil Rights Chiefs
DATE OBJECTIVE INITIATED: December 15, 2011
TARGET DATE FOR COMPLETION OF OBJECTIVE:
December 31, 2016
DATE OBJECTIVE COMPLETED (Skip this row if not completed)
September 30, 2015 Completed
PLANNED ACTIVITIES TOWARD COMPLETION OF OBJECTIVE: TARGET DATE (Must be specific)
COMPLETION DATE (if completed)
N/A
REPORT OF ACCOMPLISHMENTS and MODIFICATIONS TO OBJECTIVE
The FWS was provided the Final FY 2015 Exit Survey Report. HR and ODIWM collaborated to make an initial contact with Metrics that Matter (MTM) regarding data access and quality. A report prepared by MTM suggested that the response rate was higher than previously thought. The available data was compiled by each question and by percent of participation, FWS-wide and by Region. The survey is anonymous and questions are tailored to the FWS, and will improve the quality of information gathered about barriers to retention. The ODIWM works together with HR to ensure that managers inform employees and encourage them to complete the exit interview and survey processes. The FWS conducted an Organizational Climate Survey in FY 2015 as a part of the MD-715 Barrier Analysis process to identify potential barriers to retention. However, there were no significant issues reported or identified. The findings were discussed with the Director and each Regional Director. Additionally, FWS analyzes the results of the Federal Employee Viewpoint Survey.

40
THIS PAGE IS LEFT BLANK

41
EEOC FORM 715-01
PART I (1 of 7): Plan to Eliminate Identified Barriers
U.S. Equal Employment Opportunity Commission FEDERAL AGENCY ANNUAL
EEO PROGRAM STATUS REPORT
U.S. FISH AND WILDLIFE SERVICE FY 2015
DESCRIBE THE CONDITION THAT WAS A TRIGGER FOR THIS POTENTIAL BARRIER: Provide a brief narrative describing the condition at issue. How was the condition recognized as a potential barrier?
There is a low participation rate of Asians in the total FWS permanent workforce. This condition was recognized after conducting a review of FY 2015 permanent workforce data. Analysis revealed a low participation rate of Asians (2.4%) in the permanent workforce in comparison to the CLF (5.7%). (See Table A1) Permanent workforce data was analyzed by comparing participation rates of all racial and ethnic groups in FWS workforce with their respective CLF. This determined the initial cause of the condition.
BARRIER ANALYSIS: Describe the steps taken and data analyzed to determine cause of the condition.
Representation in Workforce: The participation rate of Asians in the permanent workforce in FY 2015 (2.4%) increased by 0.1% compared to FY 2014 (2.3%). The participation of Asians in all the major occupational series is below their CLF availability, with the exception of the law enforcement related series, 1811 CI, 0025 LE and 1801 LE. Hires and Separations: A total of 18 (3.1%) Asians were hired in FY 2015, which is above their participation rate. In addition 5 Native Hawaiian or Pacific Islanders were hired which we attribute to FWS recruitment sources that are combined, such as: Federal Asian Pacific American Council (FAPAC), Conference on Asian Pacific American Leadership (CAPAL), Asian American and Native American Pacific Islander-Serving Institutions (AANAPISIs) and the Asian & Pacific Islander American Scholarship Fund (APIASF). A review of separations on Table A14 indicated that there were 9 (1.5%) separations of Asians from the permanent workforce which is below their participation rate; therefore it does not constitute a concern. Steps Taken: The Fish and Wildlife Service has conducted in-depth workforce data analyses which revealed conditions that trigger further analyses. Initially, the cause for the condition appeared to be a lack of targeted recruitment. However, FWS realizes that it needs a standard methodology to better identify specific root causes such as a specific policy, practice, or procedure. Therefore, FWS is developing a standard methodology and tools to assist in analyzing barriers and identifying root causes for these conditions. Tools and methods identified include team analysis of root causes, survey results, focus group results, and internal management discussions.
STATEMENT OF IDENTIFIED BARRIER/PROBLEM: Provide a succinct statement of the agency policy, procedure or practice that has been determined to be the barrier of the undesired condition.
The percentage of Asians hired has increased from last year; however workforce participation rate is still well below the CLF. The cause of the less-than-expected participation rate for Asians is unknown.
OBJECTIVE: State the alternative or revised agency policy, procedure or practice to be implemented to correct the undesired condition.
FWS is developing a standard methodology and tools to assist in analyzing barriers and identifying root causes for these conditions. Although root causes are currently being investigated, FWS will continue to enhance targeted recruitment strategies to encourage more Asians to apply for all

42
FWS vacancies.
RESPONSIBLE OFFICIAL(S): FWS Directorate Project Leaders and Hiring Officials Division of Human Resources Office of Diversity and Inclusive Workforce Management Workforce Recruiters
DATE OBJECTIVE INITIATED: December 15, 2009
TARGET DATE FOR COMPLETION OF OBJECTIVE:
September 30, 2016
DATE OBJECTIVE COMPLETED (Skip this row if not completed)
PLANNED ACTIVITIES TOWARD COMPLETION OF OBJECTIVE: TARGET DATE (Must be specific)
1. Establish a specific partnership with the Director of the Gates Millennium Scholars Program. at the Asian and Pacific Islander American Scholarship Fund to help locate Asian candidates for recruitment.
September 30, 2016 COMPLETED
2. Modified: Establish a process for hiring officials to document their collaboration with recruiters and human resources specialists in planning to fill vacancies for all positions, to include the review of proposed Position Descriptions and Vacancy Announcements for any unnecessary requirements that are causing barriers to increasing the number of Asian candidates qualified to apply. They will work together to develop job-specific targeted recruitment plans to reach Asians.
September 30, 2016
4. The FWS will also continue to work with students from AAPI universities to provide information sessions on careers, and workshops on resume building, job searches, Federal hiring authorities, and networking.
September 30, 2016 COMPLETED
5. FWS will develop a standard methodology and identify tools to assist in analyzing barriers and identifying root causes for trigger conditions.
September 30, 2016
REPORT OF ACCOMPLISHMENTS and MODIFICATIONS TO OBJECTIVE
1. The FWS has established an agreement with the Asian & Pacific Islander American Scholarship Fund, Gates Millennium Scholars Program (GMS), to advertise FWS employment opportunities on their social media to reach Asian students and alumni. 2. The Director has established a procedure for hiring officials to work with the recruiters and human resources specialists when planning to fill vacancies for all positions and review proposed Position Descriptions and Vacancy Announcements for any unnecessary requirements that are causing barriers to increasing the number of Asian candidates qualified to apply. Workforce Recruiters are working with hiring officials to better understand the qualifications needed for the positions in order to develop job-specific targeted recruitment plans to reach Asians. 3. In addition to increasing targeted recruitment strategies, FWS is also increasing visibility of careers in conservation and natural resources by conducting outreach to the Asian community. FWS has conducted Conservation Career Symposia (CCSs) for Asian graduate and undergraduate students interested in public service careers in natural resource and wildlife management, providing tools to help students with building resumes, job searches, Federal hiring authorities, networking, and competing for FWS Pathways internships. The FWS partnered with the Conference on Asian Pacific American Leadership (CAPAL) to bring a CCS to their 2015 annual conference. The FWS will continue to provide recruitment information to CAPAL. FWS participated in other career fairs and informational sessions throughout its component Regions. For example: FWS sponsored a CCS at Oregon State University in April 2015 and offered a site visit to William L. Finley National Wildlife Refuge; FWS participated in 17 career fairs and student information sessions at colleges and universities in the Midwest Region where the Asian student body ranges from 2.02% to 11.08%; FWS conducted a CCS at the University of California, Davis, which focused

43
REPORT OF ACCOMPLISHMENTS and MODIFICATIONS TO OBJECTIVE
on Asian students majoring in degree programs that complement the FWS’s mission critical 0400 series; FWS also conducted several information sessions at MSIs with high Asian student populations in the Pacific Southwest Region. In addition to CCSs, the FWS also provided a total of $55,000 through a grant agreement to the Corporate Work Study Program; over a 5-year period, FWS has educated, trained and employed 12 disadvantaged Asian and Hispanic youth in the Mountain Region alone, providing invaluable learning and work experience in conservation and natural resources resulting in the students continuing to grow in their understanding of the mission of the FWS. In FY-2015, FWS awarded a $15,000 grant to the Hawaiian Conservation Alliance that provides opportunities for professional development for the next generation of conservation leaders at the annual Nahululeihiwakuipapa Workshop. The workshop is a venue where seasoned conservation professionals interact with students and emerging professionals. Attendees to the 2015 Nahululeihiwakuipapa Workshop traveled from colleges and universities throughout the Pacific, including the University of Guam, University of Hawaii at Hilo and Manoa. In FY-2015, FWS awarded a $20,000 grant to the University of Hawaii Hilo Pacific Internship Programs for Exploring Science (PIPES) program. This program provided 10 students internships in conservation-related programs throughout the Hawaiian Islands.

44
EEOC FORM 715-01
PART I (2 of 7): Plan to Eliminate Identified Barriers
U.S. Equal Employment Opportunity Commission FEDERAL AGENCY ANNUAL
EEO PROGRAM STATUS REPORT
U.S. FISH AND WILDLIFE SERVICE FY 2015
DESCRIBE THE CONDITION THAT WAS A TRIGGER FOR THIS POTENTIAL BARRIER: Provide a brief narrative describing the condition at issue. How was the condition recognized as a potential barrier?
There is a low participation rate of Black employees in FWS total permanent workforce. This condition was recognized after conducting a review of FY 2015 permanent workforce data. The participation rate of Blacks is 4.7% compared to their availability (6.8%) in the CLF. Permanent workforce data was analyzed by comparing participation rates of all racial and ethnic groups in FWS workforce with their respective CLF. This identified the specific condition.
BARRIER ANALYSIS: Describe the steps taken and data analyzed to determine cause of the condition.
Representation in Workforce: The number of Blacks in the permanent workforce declined by only 4 so there was little change in the participation rate of Blacks (4.7%) in the workforce in FY 2015 compared to FY 2014 (4.8%). Hires and Separations: A review of accessions and separations of Black employees was conducted. There were 34 (5.9%) Blacks hired in FY 2015 in the permanent workforce, which is above their on-board rate, however it is lower than their availability of 6.8% in the CLF (see Table A8). A total of 37 Black employees separated from the permanent workforce, which was 6.3% of the total 589 separations (see Table A14), which is above their on-board percent of 4.7%. Steps Taken: The Fish and Wildlife Service has conducted in-depth workforce data analyses which revealed conditions that trigger further analyses. Initially, the cause for the condition appeared to be a lack of targeted recruitment. However, FWS realizes that it needs a standard methodology to better identify specific root causes such as a specific policy, practice, or procedure. Therefore, FWS is developing a standard methodology and tools to assist in analyzing barriers and identifying root causes for these conditions. Tools and methods identified include team analysis of root causes, survey results, focus group results, and internal management discussions.
STATEMENT OF IDENTIFIED BARRIER/PROBLEM: Provide a succinct statement of the agency policy, procedure or practice that has been determined to be the barrier of the undesired condition.
The percentage of Blacks hired has decreased from last year, and workforce participation rate is still well below the CLF. The cause of the less-than-expected participation rate for Blacks is unknown.
OBJECTIVE: State the alternative or revised agency policy, procedure or practice to be implemented to correct the undesired condition.
FWS is developing a standard methodology and tools to assist in analyzing barriers and identifying root causes for these conditions. Although root causes are currently being investigated, FWS will continue to enhance targeted recruitment strategies to encourage more Blacks to apply for all FWS vacancies.
RESPONSIBLE OFFICIAL(S): FWS Directorate Division of Human Resources Project Leaders and Hiring Officials Office of Diversity and Inclusive Workforce Management

45
Workforce Recruiters
DATE OBJECTIVE INITIATED: December 15, 2009
TARGET DATE FOR COMPLETION OF OBJECTIVE:
September 30, 2016
DATE OBJECTIVE COMPLETED (Skip this row if not completed)
PLANNED ACTIVITIES TOWARD COMPLETION OF OBJECTIVE: TARGET DATE (Must be specific)
1. Strengthen FWS engagement with communities and educational institutions that are able to reach Black candidates by conducting activities, such as, Conservation Career Symposia.
September 30, 2016 COMPLETED
2. Develop non-traditional partnerships, such as, with the Phi Beta Sigma Fraternity to reach Black students and alumni at targeted colleges and universities to promote a greater understanding and appreciation of natural resource management and wildlife conservation in anticipation they will consider careers in the FWS.
September 30, 2016 COMPLETED
3. The FWS/NCTC will engage professors and students from Historically Black Colleges and Universities to work on a research projects at local field stations to develop collaborative efforts and to interest them in conservation and natural resource management.
September 30, 2016 COMPLETED
4. Establish a process for hiring officials to document their collaboration with recruiters and human resources specialists in planning to fill vacancies for all positions, to include the review of proposed Position Descriptions and Vacancy Announcements for any unnecessary requirements that are causing barriers to increasing the number of Black candidates qualified to apply. They will work together to develop job-specific targeted recruitment plans to reach Blacks.
September 30, 2016
5. FWS will develop a standard methodology and identify tools to assist in analyzing barriers and identifying root causes for trigger conditions.
September 30, 2016
REPORT OF ACCOMPLISHMENTS and MODIFICATIONS TO OBJECTIVE
1. FWS partnered with representatives of the Forest Service African American Strategy Group to develop and share outreach contacts to increase diversity within the FWS and Forest Service by building a recruitment network. FWS shared vacancy announcements with them for the Criminal Investigator (GS-1811) positions to reach experienced women and minority applicants. The FWS also participated in the Forest Service Diversity and Inclusion Coalition for Empowerment (DICE) to provide a forum to network with Forest Service employees to bring forth and present ideas, problems, or current projects to a diverse group of employees (representing all levels and areas). The FWS is developing new methods of engaging the subcomponents of the United Negro College Funds and other organizations to reach Black students and alumni in a continuing effort to enhance and expand their partnership with the Gates Millennium Scholars Program (GMS). In addition to increasing targeted recruitment strategies, the FWS is also increasing visibility of careers in conservation and natural resources by conducting outreach to the Black community. The FWS conducted 10 Conservation Career Symposia (CCSs) for diverse graduate and undergraduate students interested in public service careers in natural resource and wildlife management, providing tools to help students with building resumes, job searches, Federal hiring authorities, networking, and competing for FWS Pathways internships. FWS also participated in other career fairs and informational sessions in many Regions. For example, in the Southeast Region, FWS participated in 12 information sessions at colleges, universities, and conferences to talk to STEM classes about conservation careers and FWS opportunities. 2. Continued FWS partnership with the Phi Beta Sigma Fraternity and Sorority to reach Black students and alumni at targeted colleges and universities to promote a greater understanding and appreciation of natural resource management and wildlife

46
REPORT OF ACCOMPLISHMENTS and MODIFICATIONS TO OBJECTIVE
conservation. FWS met with the Phi Beta SIGMA Fraternity at its Conclave in Little Rock, Arkansas, to discuss natural resources career opportunities with 150 young men as well as network with other professionals. 3. The FWS continued to implement the Directorate Resource Assistant Fellows Program (DFP), developed in 2014, designed to target individuals who are enrolled in Minority-Serving Institutions. Upon successful completion of an 11-week fellowship and graduation from their university, the students have an opportunity for a permanent appointment in the FWS without further competition. Minorities comprised 29.5% of the 2015 cohort of 54 student interns; 4 (7.4%) were Black. FWS Workforce Recruiters worked with others to sponsor outreach and recruitment activities at HBCUs such as at Langston and Delaware State Universities, through campus visits to natural resources departments and participation in career fairs. FWS Recruiters participated in MANRRS Conferences by providing career information and networking with students. FWS supported the SEAFWA 2015 Conference and provided $5000 for the attendance of women and minority students interested in natural resources opportunities.
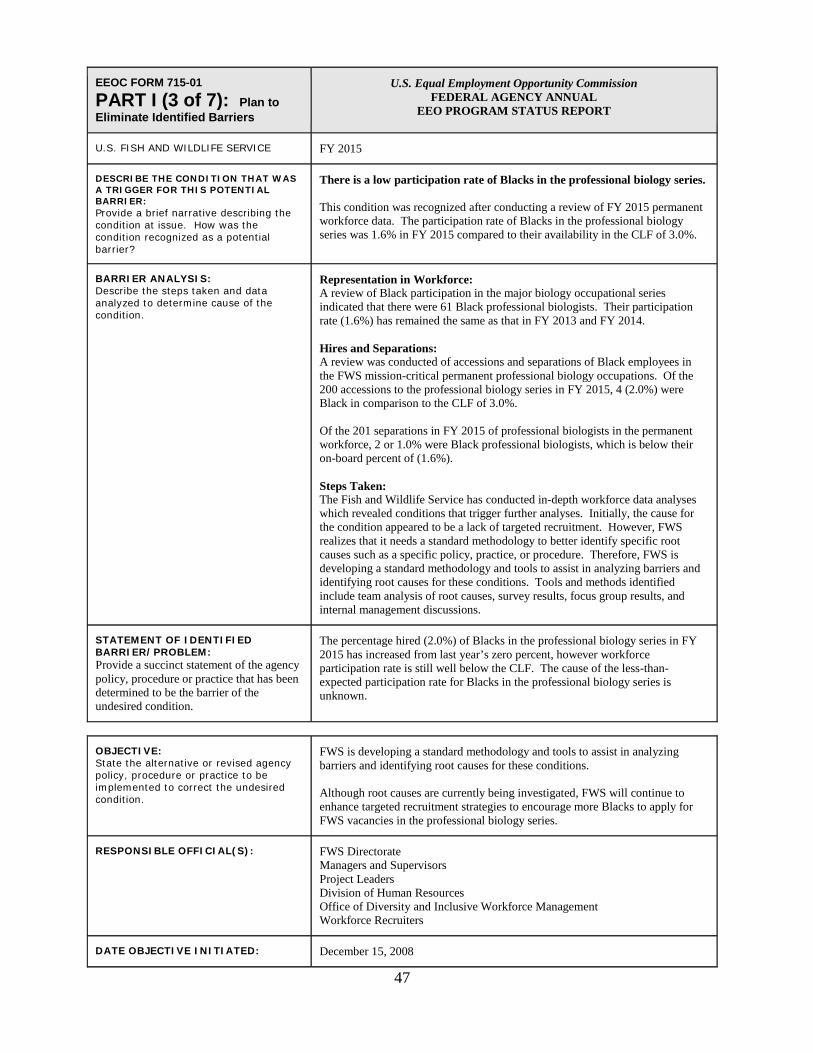
47
EEOC FORM 715-01
PART I (3 of 7): Plan to Eliminate Identified Barriers
U.S. Equal Employment Opportunity Commission FEDERAL AGENCY ANNUAL
EEO PROGRAM STATUS REPORT
U.S. FISH AND WILDLIFE SERVICE FY 2015
DESCRIBE THE CONDITION THAT WAS A TRIGGER FOR THIS POTENTIAL BARRIER: Provide a brief narrative describing the condition at issue. How was the condition recognized as a potential barrier?
There is a low participation rate of Blacks in the professional biology series. This condition was recognized after conducting a review of FY 2015 permanent workforce data. The participation rate of Blacks in the professional biology series was 1.6% in FY 2015 compared to their availability in the CLF of 3.0%.
BARRIER ANALYSIS: Describe the steps taken and data analyzed to determine cause of the condition.
Representation in Workforce: A review of Black participation in the major biology occupational series indicated that there were 61 Black professional biologists. Their participation rate (1.6%) has remained the same as that in FY 2013 and FY 2014. Hires and Separations: A review was conducted of accessions and separations of Black employees in the FWS mission-critical permanent professional biology occupations. Of the 200 accessions to the professional biology series in FY 2015, 4 (2.0%) were Black in comparison to the CLF of 3.0%. Of the 201 separations in FY 2015 of professional biologists in the permanent workforce, 2 or 1.0% were Black professional biologists, which is below their on-board percent of (1.6%). Steps Taken: The Fish and Wildlife Service has conducted in-depth workforce data analyses which revealed conditions that trigger further analyses. Initially, the cause for the condition appeared to be a lack of targeted recruitment. However, FWS realizes that it needs a standard methodology to better identify specific root causes such as a specific policy, practice, or procedure. Therefore, FWS is developing a standard methodology and tools to assist in analyzing barriers and identifying root causes for these conditions. Tools and methods identified include team analysis of root causes, survey results, focus group results, and internal management discussions.
STATEMENT OF IDENTIFIED BARRIER/PROBLEM: Provide a succinct statement of the agency policy, procedure or practice that has been determined to be the barrier of the undesired condition.
The percentage hired (2.0%) of Blacks in the professional biology series in FY 2015 has increased from last year’s zero percent, however workforce participation rate is still well below the CLF. The cause of the less-than-expected participation rate for Blacks in the professional biology series is unknown.
OBJECTIVE: State the alternative or revised agency policy, procedure or practice to be implemented to correct the undesired condition.
FWS is developing a standard methodology and tools to assist in analyzing barriers and identifying root causes for these conditions. Although root causes are currently being investigated, FWS will continue to enhance targeted recruitment strategies to encourage more Blacks to apply for FWS vacancies in the professional biology series.
RESPONSIBLE OFFICIAL(S): FWS Directorate Managers and Supervisors Project Leaders Division of Human Resources Office of Diversity and Inclusive Workforce Management Workforce Recruiters
DATE OBJECTIVE INITIATED: December 15, 2008

48
TARGET DATE FOR COMPLETION OF OBJECTIVE:
September 30, 2016
DATE OBJECTIVE COMPLETED (Skip this row if not completed)
PLANNED ACTIVITIES TOWARD COMPLETION OF OBJECTIVE: TARGET DATE (Must be specific)
1. Engage Black communities, organizations, and associations to promote careers in conservation and natural resources management to their members.
September 30, 2016 COMPLETED
2. Increase the number and quality of partnerships and activities with Historically Black Colleges and Universities, such as hosting Conservation Career Symposia at selected Historically Black Colleges and Universities, such as, Langston, Delaware State, Arkansas-Pine Bluff Universities to reach students who qualify to apply for internships, Pathways positions, and other entry level positions.
September 30, 2016 COMPLETED
3. Continue the use of the Directorate Resource Assistant Fellows Program (DFP) to target and recruit individuals who are enrolled in Historically Black Colleges and Universities.
September 30, 2016 COMPLETED
4. Modified: Establish a process for hiring officials to document their collaboration with recruiters and human resources specialists in planning to fill vacancies for all positions, to include the review of proposed Position Descriptions and Vacancy Announcements for any unnecessary requirements that are causing barriers to increasing the number of Black professional biology candidates qualified to apply. They will work together to develop job-specific targeted recruitment plans to reach Black professional biology candidates.
September 30, 2016
5. FWS will develop a standard methodology and identify tools to assist in analyzing barriers and identifying root causes for trigger conditions.
September 30, 2016
REPORT OF ACCOMPLISHMENTS and MODIFICATIONS TO OBJECTIVE
1. FWS partnered with representatives of the Forest Service African American Strategy Group to develop and share outreach contacts to increase diversity within the FWS and Forest Service by building a recruitment network. FWS shared vacancy announcements with them for the Criminal Investigator (GS-1811) positions to reach experienced women and minority applicants. The FWS also participated in the Forest Service Diversity and Inclusion Coalition for Empowerment (DICE) to provide a forum to network with Forest Service employees to bring forth and present ideas, problems, or current projects to a diverse group of employees (representing all levels and areas). The FWS increased its participation in activities that were developed through its partnership with the Phi Beta Sigma Fraternity and Sorority to reach Black students and alumni at targeted colleges and universities to promote a greater understanding and appreciation of natural resource management and wildlife conservation. FWS met with the Phi Beta SIGMA Fraternity at its Conclave in Little Rock, Arkansas, to discuss opportunities with 150 young men as well as network with other professionals. The Alpha Nu Sigma Chapter in Oakland, CA and the U.S. Fish and Wildlife Service, San Francisco Bay Pacific Southwest Region joined forces to encourage San Francisco Bay Area youth, particularly the Alpha Nu Sigma Chapters Sigma Beta Club to learn more about conservation, environmentalism and the preservation of the San Francisco Bay, its natural tributaries and the wildlife it sustains. The Chapters Sigma Beta Club and advisers had a full day of walking trails, observing indigenous wildlife, plant life and learning about the complex chemistry of the San Francisco Bay. The Sigma Betas also planted native Milkweed seeds in the refuge's nursery. Milkweed is a necessary plant for pollinators and the food for the Monarch butterfly. In spring 2016, the Sigma Betas will return to the nursery to check on the well-being of their seedlings and plant them outdoors on the grounds of the refuge. FWS sponsored exhibitor participation at the MANRRS Conference in Houston, Texas, to network with minority students and

49
REPORT OF ACCOMPLISHMENTS and MODIFICATIONS TO OBJECTIVE
professionals about FWS opportunities. FWS established contact with over 50 points of contact from MANRRS chapters at colleges to communicate information on FWS positions. FWS supported the SEAFWA 2015 Conference and provided funding for the attendance of women and minority students interested in natural resources opportunities. 2. Outreach and recruitment activities were sponsored at HBCUs, such as: Arkansas-Pine Bluff, Langston and Delaware State Universities, through campus visits to natural resources departments and participation in career fairs. 3. The FWS continued to sponsor t the Directorate Resource Assistant Fellows Program (DFP), developed in 2014, designed to target individuals who are enrolled in Minority-Serving Institutions. Upon successful completion of an 11-week fellowship and graduation from their university, the students have an opportunity for a permanent appointment in the FWS. The FWS hosted 54 DFP Fellows in FY 2015, 4 (7.4%) of whom were Black. 4. The FWS conducted Conservation Career Symposia (CCSs) for diverse graduate and undergraduate students interested in public service careers in natural resource and wildlife management, providing tools to help students with building resumes, job searches, Federal hiring authorities, networking, and competing for FWS Pathways summer internships. The FWS also participated in other career fairs and informational sessions throughout its component Regions. For example, FWS participated in 12 information sessions at colleges, universities, and conferences in the Southeast Region to talk to STEM classes about conservation careers and FWS opportunities. The FWS funded 42 Student Conservation Association (SCA) interns through the Conservation Discovery Intern Program (CDIP), exposing culturally diverse youth from urban settings to conservation related careers. These efforts helped to create a diverse pipeline of students to apply for Pathways internships in the future. In FY 2015, 79% of the interns were minorities; 19% of whom were Black. FWS also hosted a visiting professor in the Alaska Region as part of a partnership between the FWS and Tulsa Community College called the Experimental Program to Stimulate Competitive Research (EPSCR) and Research Infrastructure Development (RID) Program. This program addresses the need to recruit and retain more diverse students in Science Technology Engineering and Mathematics related fields and research, and gives university faculty from institutions with diverse student populations an overview of the FWS's mission and equips them to act as ambassadors for the FWS at their respective campuses. Future Pathways and other student program opportunities will be disseminated through this individual.

50
EEOC FORM 715-01
PART I (4 of 7): Plan to Eliminate Identified Barriers
U.S. Equal Employment Opportunity Commission FEDERAL AGENCY ANNUAL
EEO PROGRAM STATUS REPORT
U.S. FISH AND WILDLIFE SERVICE FY 2015
DESCRIBE THE CONDITION THAT WAS A TRIGGER FOR THIS POTENTIAL BARRIER: Provide a brief narrative describing the condition at issue. How was the condition recognized as a potential barrier?
There is a low participation rate of Hispanic women in the professional biology series. This condition was recognized after conducting a review of FY 2015 permanent workforce data. The participation rate of Hispanic women in the professional biology workforce series was 1.9% in FY 2015 compared to their availability in the CLF of 2.1%.
BARRIER ANALYSIS: Describe the steps taken and data analyzed to determine cause of the condition.
Representation in Workforce: 233 Hispanic women make up 3.0% of the permanent workforce of which 71 Hispanic women are professional biologists which is 1.9% of the 3,703 total employees in that category in the permanent workforce compared to their availability of 2.1% in the CLF. The 1.9% participation of Hispanic women in the professional biology series in FY 2015 increased from FY 2014’s rate of 1.5%. Hires and Separations: A review was conducted of accessions and separations of Hispanic women employees in the FWS permanent professional biology occupations. Of the 200 accessions to the professional biology series in FY 2015, 3 (1.5%) were of Hispanic women biologists compared to their availability in the CLF of 2.1%. Of the 201 separations in FY 2015 of professional biologists in the permanent workforce, 2 or 1.0% were of Hispanic women professional biologists, well below their on-board participation of 1.9%. Steps Taken: The Fish and Wildlife Service has conducted in-depth workforce data analyses which revealed conditions that trigger further analyses. Initially, the cause for the condition appeared to be a lack of targeted recruitment. However, FWS realizes that it needs a standard methodology to better identify specific root causes such as a specific policy, practice, or procedure. Therefore, FWS is developing a standard methodology and tools to assist in analyzing barriers and identifying root causes for these conditions. Tools and methods identified include team analysis of root causes, survey results, focus group results, and internal management discussions.
STATEMENT OF IDENTIFIED BARRIER/PROBLEM: Provide a succinct statement of the agency policy, procedure or practice that has been determined to be the barrier of the undesired condition.
The percentage hired of Hispanic women in the professional biology series in FY 2015 has increased from last year’s percentage, however workforce participation rate is still well below the CLF. The cause of the less-than-expected participation rate for Hispanic women in the professional biology series is unknown.
OBJECTIVE: State the alternative or revised agency policy, procedure or practice to be implemented to correct the undesired condition.
FWS is developing a standard methodology and tools to assist in analyzing barriers and identifying root causes for these conditions. Although root causes are currently being investigated, FWS will continue to enhance targeted recruitment strategies to encourage more Hispanic women to apply for FWS vacancies in the professional biology series.
RESPONSIBLE OFFICIAL(S): FWS Directorate Managers and Supervisors Project Leaders Division of Human Resources
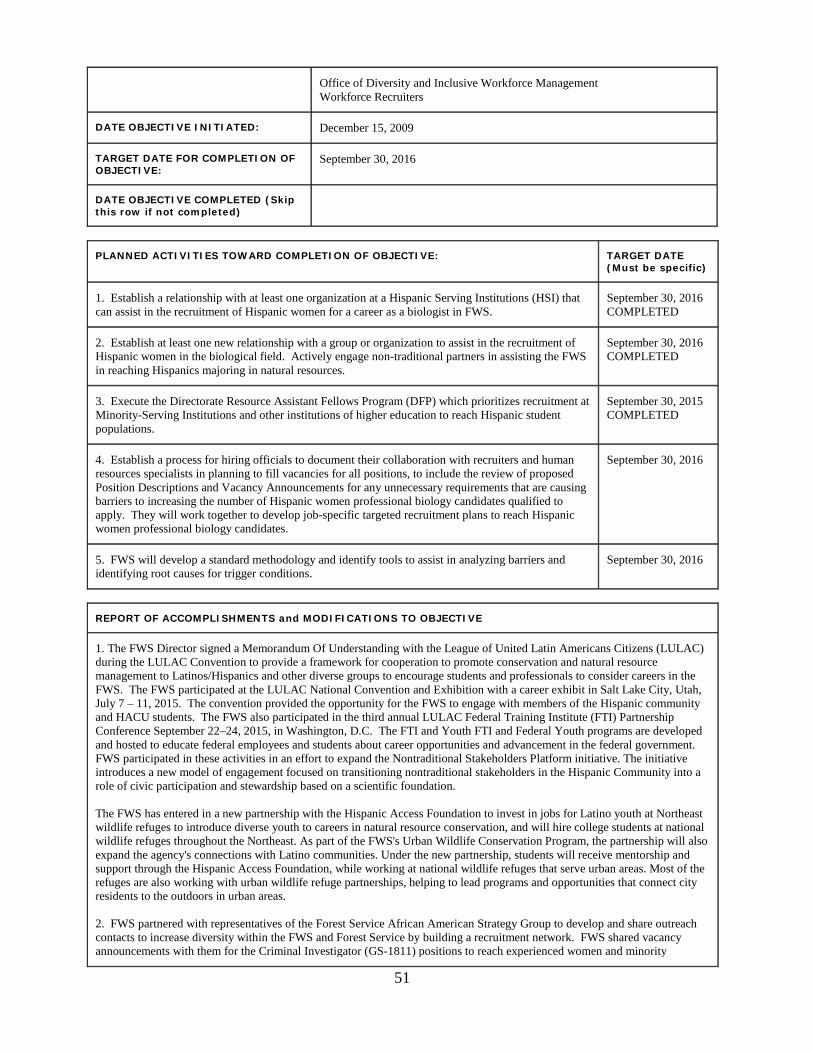
51
Office of Diversity and Inclusive Workforce Management Workforce Recruiters
DATE OBJECTIVE INITIATED: December 15, 2009
TARGET DATE FOR COMPLETION OF OBJECTIVE:
September 30, 2016
DATE OBJECTIVE COMPLETED (Skip this row if not completed)
PLANNED ACTIVITIES TOWARD COMPLETION OF OBJECTIVE: TARGET DATE (Must be specific)
1. Establish a relationship with at least one organization at a Hispanic Serving Institutions (HSI) that can assist in the recruitment of Hispanic women for a career as a biologist in FWS.
September 30, 2016 COMPLETED
2. Establish at least one new relationship with a group or organization to assist in the recruitment of Hispanic women in the biological field. Actively engage non-traditional partners in assisting the FWS in reaching Hispanics majoring in natural resources.
September 30, 2016 COMPLETED
3. Execute the Directorate Resource Assistant Fellows Program (DFP) which prioritizes recruitment at Minority-Serving Institutions and other institutions of higher education to reach Hispanic student populations.
September 30, 2015 COMPLETED
4. Establish a process for hiring officials to document their collaboration with recruiters and human resources specialists in planning to fill vacancies for all positions, to include the review of proposed Position Descriptions and Vacancy Announcements for any unnecessary requirements that are causing barriers to increasing the number of Hispanic women professional biology candidates qualified to apply. They will work together to develop job-specific targeted recruitment plans to reach Hispanic women professional biology candidates.
September 30, 2016
5. FWS will develop a standard methodology and identify tools to assist in analyzing barriers and identifying root causes for trigger conditions.
September 30, 2016
REPORT OF ACCOMPLISHMENTS and MODIFICATIONS TO OBJECTIVE
1. The FWS Director signed a Memorandum Of Understanding with the League of United Latin Americans Citizens (LULAC) during the LULAC Convention to provide a framework for cooperation to promote conservation and natural resource management to Latinos/Hispanics and other diverse groups to encourage students and professionals to consider careers in the FWS. The FWS participated at the LULAC National Convention and Exhibition with a career exhibit in Salt Lake City, Utah, July 7 – 11, 2015. The convention provided the opportunity for the FWS to engage with members of the Hispanic community and HACU students. The FWS also participated in the third annual LULAC Federal Training Institute (FTI) Partnership Conference September 22–24, 2015, in Washington, D.C. The FTI and Youth FTI and Federal Youth programs are developed and hosted to educate federal employees and students about career opportunities and advancement in the federal government. FWS participated in these activities in an effort to expand the Nontraditional Stakeholders Platform initiative. The initiative introduces a new model of engagement focused on transitioning nontraditional stakeholders in the Hispanic Community into a role of civic participation and stewardship based on a scientific foundation. The FWS has entered in a new partnership with the Hispanic Access Foundation to invest in jobs for Latino youth at Northeast wildlife refuges to introduce diverse youth to careers in natural resource conservation, and will hire college students at national wildlife refuges throughout the Northeast. As part of the FWS's Urban Wildlife Conservation Program, the partnership will also expand the agency's connections with Latino communities. Under the new partnership, students will receive mentorship and support through the Hispanic Access Foundation, while working at national wildlife refuges that serve urban areas. Most of the refuges are also working with urban wildlife refuge partnerships, helping to lead programs and opportunities that connect city residents to the outdoors in urban areas. 2. FWS partnered with representatives of the Forest Service African American Strategy Group to develop and share outreach contacts to increase diversity within the FWS and Forest Service by building a recruitment network. FWS shared vacancy announcements with them for the Criminal Investigator (GS-1811) positions to reach experienced women and minority

52
REPORT OF ACCOMPLISHMENTS and MODIFICATIONS TO OBJECTIVE
applicants. The FWS also participated in the Forest Service Diversity and Inclusion Coalition for Empowerment (DICE) to provide a forum to network with Forest Service employees to bring forth and present ideas, problems, or current projects to a diverse group of employees (representing all levels and areas). On March 3, 2015, FWS gave a presentation at Texas A&M University, College Station, Texas for the student chapter of the Society for the Advancement of Chicanos and Native American’s in Science (SACNAS). FWS participated in the annual 2015 Society for the Advancement of Chicanos and Native American’s in Science (SACNAS) conference at the National Harbor, Maryland, staffing an outreach booth and taking applications on site for a job vacancy. FY 2015 was the fourth year for the Summer Faculty Fellowship Program which expands the network of the MSI faculty members who are familiar with FWS programs, activities, and careers and who serve as additional sources for recruitment. FWS elected to fund two faculty fellows this year who completed summer 2015 projects and who will be conducting campus conservation career awareness projects; one fellow is a wildlife biology professor from a Hispanic Serving Institution. Regional Workforce Recruiters worked to promote vacancies at HSI’s and through the Hispanic Association of Colleges and Universities (HACU), and hosted and sponsored events such as the HACU conference in Denver, Colorado. The goal of the events was to connect students with institutes of higher education and employers in STEM related fields. FWS also participated in numerous career fairs and informational sessions. For example, FWS sponsored a CCS at the Bill Williams River NWR, and 18 students, faculty, and staff from Northern Arizona University, Arizona State University, and University of Arizona attended; all three are Hispanic Serving Institutions. 2. FWS’s National Wildlife Refuge System worked in partnership with the Student Conservation Association to identify diverse candidates at a number of educational institutions, including Minority-Serving Institutions for its Conservation Internship Program. For the Summer 2015 Program, the FWS National Wildlife Refuge System selected a total of 13 interns for its Conservation Internship Program. Of the 13 interns, 3 self-identified as Hispanic. FWS hosted and sponsored events at the National Organization for Mexican American Rights (NOMAR) convention in Salt Lake City, Utah in 2015. NOMAR promotes the civil rights of Americans of Hispanic origin. FWS sponsored exhibitor participation at the Minorities in Agriculture, Natural Resources and Related Science (MANRRS) Conference in Houston, Texas, to network with minority students and professionals about FWS opportunities. It established contact with over 50 POCs from MANRRS chapters at colleges to communicate information on FWS positions. In partnership with Soul River, Inc., FWS hosted an outreach event “Celebrating the Return of Wild Steelhead” in North Portland, Oregon. The purpose of this event was to connect youth of color with conservation through the sport of fly fishing. Over 100 youth participated in workshops designed to bring awareness to conservation, and instruction on fly tying, casting, and hunting. Partner groups for this event included the Oregon Zoo, Oregon Department of Fish and Wildlife, the Native Fish Society, The Intertwine, Scientific Anglers, and the Boy Scouts of America. To promote youth of color in Science, Technology, Engineering and Math, FWS continued its partnership with iUrban Teen Tech. Through this partnership, over 150 students attended a full day workshop at Washington State University and the University of Portland, and were able to learn about fish conservation and genetics. These events targeted diverse youth of color, with a focus on Black and Hispanic, as well as children with disabilities. FWS expanded its partnership with Arrupe Jesuit High School through their Corporate Work Study Program (CWSP) by providing $55,000 through a grant agreement to employ and educate six Hispanic students, offering field trips to refuges and working with the students on their capstone projects. The FWS partnered with the San Diego National Wildlife Refuge Complex to fund two Hispanic interns through a partnership with the Environment for the Americas. FWS also hosted a visiting professor as part of a partnership between the FWS and Tulsa Community College called the Experimental Program to Stimulate Competitive Research (EPSCR) and Research Infrastructure Development (RID) Program. This program addresses the need to recruit and retain more diverse students in Science Technology Engineering and Mathematics related fields and research, and gives university faculty from institutions with diverse student populations an overview of the FWS’s mission and equips them to act as ambassadors for the FWS at their respective campuses. Future Pathways and other student program opportunities will be disseminated through this individual.

53
REPORT OF ACCOMPLISHMENTS and MODIFICATIONS TO OBJECTIVE
3. Hispanics comprised 13% of the Directorate Resource Assistant Fellows Program (DFP) FY 2015 cohort of 56 DFP interns; 9.3% of the cohort was Hispanic women. One of the undergraduate students from Arizona State University, a Hispanic Serving Institute, was selected to work on a 2015 DFP project (at the Deer Flat National Wildlife Refuge) with the objective of establishing a Spanish-language outreach program for the surrounding community. The FWS funded 42 Student Conservation Association (SCA) interns through the Conservation Discovery Intern Program (CDIP), exposing culturally diverse youth from urban settings to conservation related careers. These efforts helped to create a diverse pipeline of students for future Pathways Opportunities. In FY 2015, 79% of the interns were minorities; 26% of the interns were Hispanic.

54
EEOC FORM 715-01
PART I (5 of 7): Plan to Eliminate Identified Barriers
U.S. Equal Employment Opportunity Commission FEDERAL AGENCY ANNUAL
EEO PROGRAM STATUS REPORT
U.S. FISH AND WILDLIFE SERVICE FY 2015
DESCRIBE THE CONDITION THAT WAS A TRIGGER FOR THIS POTENTIAL BARRIER: Provide a brief narrative describing the condition at issue. How was the condition recognized as a potential barrier?
The participation rate of Asians in the professional biology series within FWS workforce is lower than expected. This condition was recognized after conducting a review of FY 2015 permanent workforce data. The participation rate of Asian permanent employees in the professional biology workforce series was 1.9% in FY 2015 compared to the CLF of 7.2%.
BARRIER ANALYSIS: Describe the steps taken and data analyzed to determine cause of the condition.
Representation in Workforce: A review of Asian participation in the major biology occupational series indicated that there were 69 Asian professional biologists. Their 1.9% participation rate in FY 2015 is a slight increase from the rate of 1.8% in FY 2014. Hires and Separations: In FY 2015, there were 200 accessions of professional biologists to the permanent workforce of whom 5 (2.5%) were Asian, which is above their on-board rate, and which is an increase from the FY 2014 accession rate of 1.5%. Of the 201 separations in FY 2015 of professional biologists in the permanent workforce, 4 or 2.0% were Asian professional biologists, which is slightly above their on-board percent of (1.9%). Steps Taken: The Fish and Wildlife Service has conducted in-depth workforce data analyses which revealed conditions that trigger further analyses. Initially, the cause for the condition appeared to be a lack of targeted recruitment. However, FWS realizes that it needs a standard methodology to better identify specific root causes such as a specific policy, practice, or procedure. Therefore, FWS is developing a standard methodology and tools to assist in analyzing barriers and identifying root causes for these conditions. Tools and methods identified include team analysis of root causes, survey results, focus group results, and internal management discussions.
STATEMENT OF IDENTIFIED BARRIER/PROBLEM: Provide a succinct statement of the agency policy, procedure or practice that has been determined to be the barrier of the undesired condition.
The rate of Asians hired in the professional biology series in FY 2015 has increased from last year’s, however their workforce participation rate in the professional biology series is still well below the CLF. The cause of the less-than-expected participation rate for Asians in the professional biology series is unknown.
OBJECTIVE: State the alternative or revised agency policy, procedure or practice to be implemented to correct the undesired condition.
FWS is developing a standard methodology and tools to assist in analyzing barriers and identifying root causes for these conditions. Although root causes are currently being investigated, FWS will continue to enhance targeted recruitment strategies to encourage more Asians to apply for FWS vacancies in the professional biology series.
RESPONSIBLE OFFICIAL(S): FWS Directorate Division of Human Resources Office of Diversity and Inclusive Workforce Management Hiring Officials and Project Leaders Workforce Recruiters

55
DATE OBJECTIVE INITIATED: December 15, 2010
TARGET DATE FOR COMPLETION OF OBJECTIVE:
September 30, 2016
DATE OBJECTIVE COMPLETED (Skip this row if not completed)
PLANNED ACTIVITIES TOWARD COMPLETION OF OBJECTIVE: TARGET DATE (Must be specific)
1. Conduct Conservation Career Symposia at universities with a high Asian population to inform students about FWS careers, developing resumes for Federal jobs, how to search for vacancies, and apply for positions.
September 30, 2016 COMPLETED
2. Engage Gates Millennium Scholars Program, Asian American Government Executives Network, and National Council of Asian Pacific Americans to assist FWS in reaching Asian professional biologists for the pipeline.
September 30, 2016 COMPLETED
3. Identify and meet with key contacts and establish partnerships that will benefit the FWS in locating and reaching individuals from targeted groups. Coordinate a course of action with the partner(s) to evaluate the outcomes.
September 30, 2016 COMPLETED
4. Work with managers and human resources to consider advertising vacancies in multiple series to reach a broader pool of candidates for biology positions.
September 30, 2016 COMPLETED
5. Establish a process for hiring officials to document their collaboration with recruiters and human resources specialists in planning to fill vacancies for all positions, to include the review of proposed Position Descriptions and Vacancy Announcements for any unnecessary requirements that are causing barriers to increasing the number of Asian professional biology candidates qualified to apply. They will work together to develop job-specific targeted recruitment plans to reach Asian professional biology candidates.
September 30, 2016
6. FWS will develop a standard methodology and identify tools to assist in analyzing barriers and identifying root causes for trigger conditions.
September 30, 2016
REPORT OF ACCOMPLISHMENTS and MODIFICATIONS TO OBJECTIVE
1. The FWS conducted Conservation Career Symposia (CCSs) for diverse graduate and undergraduate students interested in public service careers in natural resource and wildlife management, providing tools to help students with building resumes, job searches, Federal hiring authorities, networking, and competing for FWS Pathways summer internships. FWS also participated in other career fairs and informational sessions. For example, FWS sponsored a CCS at Oregon State University in April 2015 and offered a site visit to William L. Finley National Wildlife Refuge; FWS also sponsored a CCS at the Bill Williams River National Wildlife Refuge; and at Colorado State University. FWS participated in over 50 career fairs and student information sessions at colleges and universities: many were at locations where the Asian student body ranges from 2.02% to 11.08%. At the information sessions at colleges, universities and conferences, FWS Recruiters talk to STEM classes about conservation careers and FWS opportunities. 2. The FWS continued their partnership with the Gates Millennium Scholars Program (GMS) to develop new methods of engaging Asian students and alumni. The FWS has established an agreement with the Asian & Pacific Islander American Scholarship Fund, Gates Millennium Scholars Program (GMS), to advertise FWS employment opportunities on their social media to reach Asian students and alumni. The FWS sponsored the Directorate Resource Assistant Fellows Program (DFP), developed in 2014, which is designed to target individuals who are enrolled in Minority-Serving Institutions. Upon successful completion of an 11-week fellowship and graduation from their university, the students have an opportunity for a permanent appointment in the FWS. Asians and Pacific Islanders comprised 5.6% of the Directorate Resource Assistant Fellows Program (DFP) FY 2015 cohort.

56
REPORT OF ACCOMPLISHMENTS and MODIFICATIONS TO OBJECTIVE
3. The FWS also participated in the Forest Service Diversity and Inclusion Coalition for Empowerment (DICE) to provide a forum to network with Forest Service employees to bring forth and present ideas, problems, or current projects to a diverse group of employees (representing all levels and areas). FWS created the Natural Resource Intern Program (NRIP) in FY 2015 in its Mountain-Prairie Region. This is a unique training program for one DFP graduate each year in a career conditional appointment as a “Natural Resource Intern”, GS-7/9/11, in the multi-disciplinary series 0401, 0482, 0486. Interns will experience a 3-year training program exposing them to multiple programs and field locations. If successful, the intern will be permanently placed in a position. An Asian female DFP graduate was selected for the FY 2015 NRIP. The FWS National Wildlife Refuge System worked in partnership with the Student Conservation Association to identify diverse candidates at a number of educational institutions, including Minority-Serving Institutions for its Conservation Internship Program. For the Summer 2015 Program, the National Wildlife Refuge System selected a total of 13 interns for its Conservation Internship Program. Of the 13 interns (9 female interns and 4 male interns), 3 (23.1%) self-identified as Asian. The FWS funded 42 Student Conservation Association (SCA) interns through the Conservation Discovery Intern Program (CDIP), exposing culturally diverse youth from urban settings to conservation related careers. These efforts helped to create a diverse pipeline of students for future Pathways Opportunities. In FY 2015, 79% of the interns were minorities; 14% of the interns were Asians. FWS also hosted a visiting professor as part of a partnership in the Alaska Region between the FWS and Tulsa Community College called the Experimental Program to Stimulate Competitive Research (EPSCR) and Research Infrastructure Development (RID) Program. This program addresses the need to recruit and retain more diverse students in Science Technology Engineering and Mathematics related fields and research, and gives university faculty from institutions with diverse student populations an overview of the FWS’s mission and equips them to act as ambassadors for the FWS at their respective campuses. Future Pathways and other student program opportunities will be disseminated through this individual.

57
EEOC FORM 715-01
PART I (6 of 7): Plan to Eliminate Identified Barriers
U.S. Equal Employment Opportunity Commission FEDERAL AGENCY ANNUAL
EEO PROGRAM STATUS REPORT
U.S. FISH AND WILDLIFE SERVICE FY 2015
DESCRIBE THE CONDITION THAT WAS A TRIGGER FOR THIS POTENTIAL BARRIER: Provide a brief narrative describing the condition at issue. How was the condition recognized as a potential barrier?
The participation rate of women Criminal Investigators (CI) in the FWS workforce is lower than expected. This condition was recognized after conducting a review of FY 2015 permanent workforce data. The participation rate of women CI was 12.7% at the end of FY 2015 which is well below the applicable CLF benchmark of 23.7%.
BARRIER ANALYSIS: Describe the steps taken and data analyzed to determine cause of the condition.
Representation in Workforce: The CI workforce decreased from 212 in FY 2013 to 202 in FY 2014, and to 197 in FY 2015. The participation rate of women in this series has remained effectively unchanged between FY 2013 and FY 2015. (See Table A6 prm) Hires and Separations: There were 4 new hires to the GS-1811 (CI) series, none of whom were women. Nine CIs separated from the permanent workforce, one of whom was a woman. Steps Taken: The Fish and Wildlife Service has conducted in-depth workforce data analyses which revealed conditions that trigger further analyses. Initially, the cause for the condition appeared to be a lack of targeted recruitment. However, FWS realizes that it needs a standard methodology to better identify specific root causes such as a specific policy, practice, or procedure. Therefore, FWS is developing a standard methodology and tools to assist in analyzing barriers and identifying root causes for these conditions. Tools and methods identified include team analysis of root causes, survey results, focus group results, and internal management discussions.
STATEMENT OF IDENTIFIED BARRIER/PROBLEM: Provide a succinct statement of the agency policy, procedure or practice that has been determined to be the barrier of the undesired condition.
Although it is apparent that limited hiring reduced the opportunities for all CIs, including women, to join the FWS law enforcement workforce, other root causes of the less-than-expected participation rate of women in the CI series are unknown.
OBJECTIVE: State the alternative or revised agency policy, procedure or practice to be implemented to correct the undesired condition.
FWS is developing a standard methodology and tools to assist in analyzing barriers and identifying root causes for these conditions. Although root causes are currently being investigated, FWS will continue to enhance targeted recruitment strategies for CI positions that start with review of the Position Description and Vacancy Announcement to look for unnecessary qualifications that might be restricting women from applying. FWS will continue to partner with other Law Enforcement agencies comprised of experienced CIs to increase the pool of candidates.
RESPONSIBLE OFFICIAL(S): Chief, Office of Law Enforcement Division of Human Resources Office of Diversity and Inclusive Workforce Management Workforce Recruiters
DATE OBJECTIVE INITIATED: December 15, 2009
TARGET DATE FOR COMPLETION OF OBJECTIVE:
September 30, 2016

58
DATE OBJECTIVE COMPLETED (Skip this row if not completed)
PLANNED ACTIVITIES TOWARD COMPLETION OF OBJECTIVE: TARGET DATE (Must be specific)
1. FWS will work with Law Enforcement to identify at least one Law Enforcement organization to conduct outreach for the purpose of increasing women’s participation in CI.
September 30, 2015 COMPLETED
2. ODIWM and HR will work with Law Enforcement to develop a survey for employees currently in the Criminal Investigator (GS-1811) series to identify best recruitment strategies/sources to increase the participation rate for women CI. Modified: Combined with # 6 for FY 2016.
September 30, 2015 MODIFIED
3. Develop strategies such as partnering with other Federal Law Enforcement agencies and organizations such as Women in Federal Law Enforcement to develop targeted recruitment plans.
September 30, 2015 COMPLETED
4. ODIWM and HR will continue to work with Law Enforcement to develop recruitment strategies to increase the participation of women CI. As vacancies occur, FWS will continue to conduct targeted recruitment focusing on organizations and other Federal, State and municipal agencies to reach women who qualify for the Criminal Investigator series.
September 30, 2016 COMPLETED
5. ODIWM will have discussions with the Chief of LE and SACs to develop recruitment strategies to increase diversity in the CI series.
September 30, 2015 COMPLETED
6. Establish a process for hiring officials to document their collaboration with recruiters and human resources specialists in planning to fill vacancies for all positions, to include the review of proposed Position Descriptions and Vacancy Announcements for any unnecessary requirements that are causing barriers to increasing the number of women qualified to apply for the CI series. They will work together to develop job-specific targeted recruitment plans to reach qualified women candidates.
September 30, 2016
7. FWS will develop a standard methodology and identify tools to assist in analyzing barriers and identifying root causes for trigger conditions.
September 30, 2016
REPORT OF ACCOMPLISHMENTS and MODIFICATIONS TO OBJECTIVE
Activity #2 will be included in the new Activity #6 as an activity for consideration in the targeted recruitment approach. FWS partnered with representatives of the Forest Service African American Strategy Group to develop and share outreach contacts to increase diversity within the FWS and Forest Service by building a recruitment network. FWS shared vacancy announcements with them for the Criminal Investigator (GS-1811) positions to reach experienced women and minority applicants. The FWS also participated in the Forest Service Diversity and Inclusion Coalition for Empowerment (DICE) to provide a forum to network with Forest Service employees to bring forth and present ideas, problems, or current projects to a diverse group of employees (representing all levels and areas). The Diversity and Inclusion Implementation Plan (DIIP) has been redesigned to provide more focused and strategic guidance to assist the Directorate, project leaders, and managers and supervisors in their efforts to build and maintain a diverse, inclusive, and highly qualified workforce. The Workforce Recruiters and HR work with Law Enforcement to develop targeted recruitment strategies to increase the participation of women CI. As vacancies occurred, targeted recruitment was conducted to reach organizations and other Federal, State and municipal agencies to reach women who qualify for the Criminal Investigator series. The Workforce Recruiters had discussions with the Chief of LE and SACs as they developed targeted recruitment strategies, reviewed Position Descriptions and Vacancy Announcements to look for barriers to women applying for positions in the CI series

59
EEOC FORM 715-01
PART I (7 of 7): Plan to Eliminate Identified Barriers
U.S. Equal Employment Opportunity Commission FEDERAL AGENCY ANNUAL
EEO PROGRAM STATUS REPORT
U.S. FISH AND WILDLIFE SERVICE FY 2015
DESCRIBE THE CONDITION THAT WAS A TRIGGER FOR THIS POTENTIAL BARRIER: Provide a brief narrative describing the condition at issue. How was the condition recognized as a potential barrier?
There is a low participation rate of individuals with targeted disabilities in FWS. This condition was recognized after conducting a review of FY 2015 permanent workforce data. The participation rate of individuals with targeted disabilities was1.3% at the end of FY 2015 which is below the Federal goal of 2.0%.
BARRIER ANALYSIS: Describe the steps taken and data analyzed to determine cause of the condition.
Representation in Workforce: Employees with targeted disabilities make up 1.3% of the FWS workforce which is 0.7% below the Federal goal of 2.0% (See Table B1). However, the participation of individuals with non-targeted disabilities is higher (638 individuals or 8.2%), as was the accession rate (77 individuals or 13.3%) in FY 2015. Hires and Separations: There were 11 individuals with targeted disabilities hired into the permanent workforce, including 2 hired to permanent from temporary appointments, and 9 individuals hired into the temporary workforce. Although this is an increase from FY 2014, the overall increase in hiring means that individuals with targeted disabilities comprised a smaller share of employees hired in FY 2015 than in FY 2014. (See Table B8-Alt) In FY 2015 there were 8 voluntary separations of individuals with targeted disabilities. There were no involuntary separations. (See Table B12) Steps Taken: See Part J, Item IV for barrier analysis related to individuals with targeted disabilities. The Fish and Wildlife Service has conducted in-depth workforce data analyses which revealed conditions that trigger further analyses. Initially, the cause for the condition appeared to be a lack of targeted recruitment. However, FWS realizes that it needs a standard methodology to better identify specific root causes such as a specific policy, practice, or procedure. Therefore, FWS is developing a standard methodology and tools to assist in analyzing barriers and identifying root causes for these conditions. Tools and methods identified include team analysis of root causes, survey results, focus group results, and internal management discussions.
STATEMENT OF IDENTIFIED BARRIER/PROBLEM: Provide a succinct statement of the agency policy, procedure or practice that has been determined to be the barrier of the undesired condition.
Although it is apparent that traditional recruitment sources cannot always reach individuals with targeted disabilities who meet the qualification requirements for established positions, other root causes of the less-than-expected participation rate of individuals with targeted disabilities are unknown.
OBJECTIVE: State the alternative or revised agency policy, procedure or practice to be implemented to correct the undesired condition.
To complement the Part J analysis, FWS is developing a standard methodology and tools to assist in analyzing barriers and identifying root causes for these conditions. Although root causes are currently being investigated, FWS will continue to enhance targeted recruitment strategies for individuals with targeted disabilities that start with review of Position Descriptions and Vacancy Announcements to look for unnecessary qualifications that might be restricting individuals with

60
targeted disabilities from applying.
RESPONSIBLE OFFICIAL(S): FWS Directorate Managers and Supervisors Division of Human Resources Office of Diversity and Inclusive Workforce Management
DATE OBJECTIVE INITIATED: December 15, 2007
TARGET DATE FOR COMPLETION OF OBJECTIVE:
September 30, 2016
DATE OBJECTIVE COMPLETED (Skip this row if not completed)
PLANNED ACTIVITIES TOWARD COMPLETION OF OBJECTIVE: TARGET DATE (Must be specific)
1. Implement the Director’s hiring goals for individuals with targeted disabilities. Continue to work towards the Director’s annual goal of hiring three individuals with targeted disabilities per Region (a total of 27) in an effort to increase the number of individuals with targeted disabilities hired.
September 30, 2015 COMPLETED
2. Continue to develop strategic recruitment initiatives to reach individuals with targeted disabilities through partnerships, national recruitment programs, and college career fairs. Leverage existing partnerships and develop new partnerships to reach more individuals with targeted disabilities.
September 30, 2016 COMPLETED
3. Monitor statistics on hires of individuals with targeted disabilities and provide reports to managers and supervisors quarterly. Use quarterly workforce briefings, monthly staff meetings, and other meetings with managers and supervisors to develop recruitment sources and strategies for using various hiring authorities to reach individuals with targeted disabilities.
September 30, 2015 COMPLETED
4. Continue to provide training, advice, and guidance on the legal and regulatory requirements associated with special employment programs that can be used to recruit and hire individuals with targeted disabilities and disabled veterans (i.e., Schedule A – Appointment of Individuals with Disabilities; Appointment of 30% or More Disabled Veterans).
September 30, 2015 COMPLETED
5. Issue an all-employee message to ask employees to update their race, national origin, and disability status in employee express to improve the quality of data for all regions.
September 30, 2014 COMPLETED
6. Continue to use quarterly workforce briefings, monthly staff meetings, and other meetings with managers and supervisors to develop recruitment sources and strategies for using various hiring authorities to reach individuals with targeted disabilities.
September 30, 2015 COMPLETED
7. Continue partnering with External Affairs and managers and supervisors to develop and share more articles on partnerships and employees with disabilities for InsideFWS and public web pages.
September 30, 2015 COMPLETED
8. Participate in college career fairs and conduct on-campus visits with partners and colleges such as Gallaudet University to recruit students with targeted disabilities.
September 30, 2015 COMPLETED
9. Establish a process for hiring officials to document their collaboration with recruiters and human resources specialists in planning to fill vacancies for all positions, to include the review of proposed Position Descriptions and Vacancy Announcements for any unnecessary requirements that are causing barriers to increasing the number of individuals with targeted disabilities who are qualified to apply for FWS positions. They will work together to develop job-specific targeted recruitment plans to reach qualified candidates with targeted disabilities.
September 30, 2016
10. FWS will develop a standard methodology and identify tools to assist in analyzing barriers and identifying root causes for trigger conditions.
September 30, 2016
61
REPORT OF ACCOMPLISHMENTS and MODIFICATIONS TO OBJECTIVE
Continued to implement the Director’s annual hiring goal for individuals with targeted disabilities of hiring three individuals with targeted disabilities per Region (a total of 27) in an effort to increase the number of individuals with targeted disabilities hired. A total of 20 permanent and temporary individuals with targeted disabilities were hired as new outside hires to the FWS. Analysis is being conducted to restructuring the goal in order to achieve a more substantial increase in percent participation of individuals with targeted disabilities. FWS conducted targeted recruitment that resulted in numerous Schedule A applications. There were 11 individuals with targeted disabilities hired into the permanent workforce, including 2 hired from temporary appointment, and 9 individuals hired into the temporary workforce. Although the FWS did not reach its goal of hiring 27 individuals with targeted disabilities, this recruitment activity did increase the number of individuals with non-targeted disabilities hired for a total of 149 new hires. Targeted recruitment initiatives were developed to reach individuals with targeted disabilities through partnerships with the State Department Rehabilitative Services and other sources, and through career fairs at universities such as Gallaudet University. FWS worked in partnership with advocacy groups and organizations that represent people with disabilities and veterans (i.e., Armed Forces Employer Partnership Office; Department of Interior’s Veteran’s Employment Program; Department of Veterans Affairs Vocational Rehabilitation and Employment Division; Operation Warfighter; Paralyzed Veterans of America; Wounded Warrior Program; and Department of Veterans Affairs Coming Home to Work Program). In FY 2015, FWS expanded its partnership with the U.S. Department of Veterans Affairs by meeting to strategize how to support the VA’s Initiative to end Veteran homelessness by the end of 2015. A significant number of Homeless Veterans are also individuals with disabilities. This resulted in connecting the FWS Recruiters to the VA Community Employment Coordinators (CEC) who work to connect homeless and at-risk Veterans with housing solutions, health care, community employment services and other required supports. The recruiters have included the CECs in their network and routinely share FWS job announcements and career information with the CECs. Some other examples include: FWS established and continued relations with the Atlanta Metropolitan Employment Networking Association; FWS renewed its agreement, established in 2013, with the City of Springfield – Department of Elder Affairs operating under Title V of the Older Americans Act and under the Senior Community Service Employment Program; and FWS also established a new host-agency agreement with the statewide agency Massachusetts Rehabilitation Commission and Manpower, Inc. in an endeavor to provide individuals with disabilities valuable on-the-job experience with the expectation of enhancing the participants’ prospects for Federal employment thereafter. Selecting officials are provided information regarding applicants from the Workforce Recruitment Program. FWS Diversity Chiefs and Recruiters routinely assisted managers and supervisors with targeted recruitment and outreach efforts to increase the participation of individuals with targeted disabilities by working with representatives of advocacy groups and organizations that promote the recruitment, hiring, and advancement of people with targeted disabilities and veterans. Workforce statistics were monitored quarterly through the preparation and review of Regional and Headquarters Diversity Workforce Briefings. For example, through this process in FY 2015, FWS hired a total of four individuals in the Midwest Region who self-identified as having targeted disabilities. Programs within FWS coordinated with each other and managers and supervisors to develop and share more articles on partnerships and employees with disabilities for InsideFWS and public web pages.

62
THIS PAGE IS LEFT BLANK

63
EEOC FORM 715-01
PART J: Special Program Plan for the Recruitment, Hiring, and Advancement of Individuals with Targeted Disabilities
U.S. Equal Employment Opportunity Commission FEDERAL AGENCY ANNUAL
EEO PROGRAM STATUS REPORT
J: I Department or Agency Information
1. Agency 1. U.S. FISH AND WILDLIFE SERVICE
1.a. 2nd Level Component 1.a.
1.b. 3rd Level or lower 1.b.
J: II Employment Trend and Special Recruitment for Individuals with Targeted Disabilities
Enter Actual Number at the ...
... beginning of FY. ... end of FY. Net Change
Number % Number % Number Rate of Change
Total Work Force 7,845 100.00% 7,814 100.00% -31 -0.4%
Reportable Disability 725 9.2% 742 9.5% 17 2.3%
Targeted Disability* 102 1.3% 104 1.3% 2 2.0%
* If the rate of change for persons with targeted disabilities is not equal to or greater than the rate of change for the total workforce, a barrier analysis should be conducted (see below).
1. Total Number of Applications Received From Persons With Targeted Disabilities during the reporting period.
N/A (USAStaffing data availability began partway through 2015)
2. Total Number of Selections of Individuals with Targeted Disabilities during the reporting period. 11 (1.9%)
J: III Participation Rates in Agency Employment Programs
Other Employment/Personnel Programs
TOTAL Reportable Disability
Targeted Disability
Not Identified No Disability
# % # % # % # %
3. Competitive Promotions 337 20 5.9% 2 0.6% 10 3.0% 307 91.1%
4. Non-Competitive Promotions 358 51 14.2% 17 4.7% 20 5.6% 287 80.2%
5. Employee Career Dev. Programs 78 3 3.8% 0 0.0% 2 2.6% 73 93.6%
5.a. Grades 5 - 12 48 3 6.3% 0 0.0% 0 0.0% 45 93.8%
5.b. Grades 13 - 14 24 0 0.0% 0 0.0% 2 8.3% 22 91.7%
5.c. Grade 15/SES 6 0 0.0% 0 0.0% 0 0.0% 6 100.0%
6. Employee Recognition and Awards 10,574 954 9.0% 124 1.2% 264 2.5% 9,356 88.5%
6.a. Time-Off Awards (Total hrs awarded) 85,666 8,931 10.4% 1,320 1.5% 1,944 2.3% 74,791 87.3%
6.b. Cash Awards (total $$$ awarded) $8,918,039 $693,027 7.8% $85,667 1.0% $247,311 2.8% $7,977,701 89.5%
6.c. Quality-Step Increase 307 27 8.8% 4 1.3% 9 2.9% 271 88.3%

64
EEOC FORM 715-01
PART J: Special Program Plan for the Recruitment, Hiring, and Advancement of Individuals with Targeted Disabilities
U.S. Equal Employment Opportunity Commission FEDERAL AGENCY ANNUAL
EEO PROGRAM STATUS REPORT
J: IV Identification and Elimination of Barriers
At the end of FY 2015, there were a total of 104 persons with targeted disabilities in the permanent workforce, an increase of 2 employees compared to the previous year. The participation rate remained consistent at 1.3%. Accessions: There were a total of 9 accessions (2.0%) of employees with targeted disabilities into the permanent workforce during FY 2015. Two temporary employees with targeted disabilities were also hired into permanent positions during this time period representing 1.5% of conversions from temporary to permanent status. Overall, persons with reportable disabilities comprised 15.6% of accessions to the permanent workforce and 14.0% of permanent hires from the temporary workforce. The Schedule A excepted hiring authority for persons with disabilities [Schedule A, 5 CFR 213.3102(u)] was used in 9 permanent hires of persons with reportable disabilities, 4 of whom had targeted disabilities. Temporary appointments have historically provided a pathway to permanent appointments for individuals with and without disabilities. Schedule A for individuals with disabilities and the hiring authority for 30% or more disabled veterans allows eligible individuals with disabilities to be hired into temporary appointments, which may then be converted to permanent. In FY 2015, there were 78 employees with Schedule A appointments at some point during the year. This number included 48 permanent Schedule A employees and another 30 in temporary Schedule A positions. Of these 30 employees in temporary Schedule A positions, 6 were converted to permanent positions during the fiscal year. Another 2 temporary Schedule A employees separated from the agency during this time period, as did 5 permanent Schedule A employees. During FY 2015, 19 permanent Schedule A appointees were eligible for conversion to competitive service appointments and 10 were ultimately converted. Only 1 of these 10 employees went on to separate by the end of the fiscal year. Separations: There were a total of 8 employees with targeted disabilities who voluntarily separated from the permanent workforce during FY 2015, constituting 1.4% of all separations. There were no involuntary separations of individuals with targeted disabilities. Promotions: There were a total of 695 promotions (competitive and non-competitive) in the permanent workforce during FY 2015. Of these, 19 promotions were of individuals with targeted disabilities. Employees with targeted disabilities earned 2.7% of all promotions. Leadership Development: FWS ran two leadership development programs in FY 2015, one for GS 11-12 level employees and an advanced program available to GS 13-14 level employees. Additionally, DOI solicited applications for its SES candidate development program from GS-14 and GS-15 level employees across the Department. At the GS 11-12 level, one employee with a targeted disability applied for the leadership program and was not selected for participation. There were no employees with targeted disabilities among the applicants for the GS 13-14 Advanced Leadership Development Program or the FWS applicants for the SES Candidate Development Program.
J: V Goals for Targeted Disabilities
Objective: FWS will continue the Director's goal of increasing the participation rate of individuals with targeted disabilities. The numerical objective for FY 2016 is 27 new hires. Summary of Recruitment Guide for Individuals with Targeted Disabilities Recruitment Strategies: Increase the coordination between the Recruiters, Human Resources Specialists, and Hiring Officials to:

65
EEOC FORM 715-01
PART J: Special Program Plan for the Recruitment, Hiring, and Advancement of Individuals with Targeted Disabilities
U.S. Equal Employment Opportunity Commission FEDERAL AGENCY ANNUAL
EEO PROGRAM STATUS REPORT
• Develop recruitment strategies and sources to reach more applicants with targeted disabilities. • Develop and execute strategies to reach individuals with targeted disabilities who have the positive
education requirements for conservation and environmental biology positions. • Share best practices for recruitment of individuals with targeted disabilities with the Regions/Programs
so that they may benefit from proven successful practices. • Maximize recruiting from all sources when filling positions, including managerial and supervisory
positions at grades GS-13 to GS-15, in an effort to attract a broader pool of candidates with targeted disabilities.
• Develop collaborative recruiting partnerships with community, academic and governmental groups that can reach individuals with targeted disabilities to locate and market potential applicants to selecting officials.
• Increase the use of the Department of Aging and Rehabilitative Services, Non Paid Work Experience Program, to provide experience and exposure to individuals with targeted disabilities of work experiences and potential job opportunities.
• Cultivate contacts at the Disability Resources Offices of colleges and universities and other placement offices to increase the awareness of the FWS’s interests to identify applicants/candidates with targeted disabilities for positions.
• Increase FWS’s presence at meetings, conferences and career fairs sponsored by organizations serving individuals with targeted disabilities to reach a larger pool of potential candidates.
• Contact students with targeted disabilities listed in the Workforce Recruitment Program (WRP) annual on-line recruitment list and provide managers resumes for job vacancies.
Recruitment Sources: Expand the use of recruitment sources of applicants with targeted disabilities including: • State/local Vocational Rehabilitation Agencies (SVRAs) • U.S. Department of Veterans Affairs (VA) • Department of Defense, Operation Warfighter Program (OWP) • Workforce Recruitment Program for College Students with Disabilities (WRP) • Paralyzed Veterans of America (PVA) • Easter Seals • Employer Assistance Referral Network (EARN) • Rehabilitation Service Administration (RSA) • Disability Service Offices at Colleges and Universities • Career Opportunities for Students with Disabilities (COSD) • National Employment Team (NET) • Talent Ability Acquisition Portal (TAAP) • The American Association of People with Disabilities (AAPD) • Professional organizations and publications serving the interests of individuals with targeted disabilities • National and local community organizations and disability advocacy groups. • Department of the Interior’s Veteran’s Employment Program • Atlanta Metropolitan Employment Networking Association • City of Springfield – Senior Community Service Employment Program • Manpower, Inc. and the Massachusetts Rehabilitation Commission
Hiring Strategies: The Division of Human Resources and the Office of Diversity and Inclusive Workforce Management will continue provide guidance and training to managers on the use of the special appointing authorities available when hiring individuals with targeted disabilities, including but not limited to: • Schedule A, 5 CFR 213.3102(u) for hiring people with severe physical disabilities, psychiatric
disabilities, and mental retardation. This excepted authority is used to appoint persons with severe

66
EEOC FORM 715-01
PART J: Special Program Plan for the Recruitment, Hiring, and Advancement of Individuals with Targeted Disabilities
U.S. Equal Employment Opportunity Commission FEDERAL AGENCY ANNUAL
EEO PROGRAM STATUS REPORT
physical disabilities, psychiatric disabilities, and intellectual disabilities. Such individuals may qualify for conversion to permanent status after two years of satisfactory FWS. Severe physical disabilities include but are not limited to blindness, deafness, paralysis, missing limbs, epilepsy, dwarfism, and more.
• Schedule A, 5 CFR 213.3102(11) for hiring readers, interpreters, and personal assistants. This excepted authority is used to appoint readers, interpreters, and personal assistants for employees with severe disabilities as reasonable accommodations.
• 5 CFR 315.604 for hiring disabled veterans enrolled in a Department of Veterans Affairs (VA) training program. This authority is used to hire veterans with disabilities who are eligible for training under the VA vocational rehabilitation program (38 U.S.C. Chapter 31). The veterans may enroll for training or work experience at an agency under the terms of an agreement between the agency and VA. Veterans in this program are beneficiaries of the VA, thus for most purposes are not Federal employees. Upon successful completion of the program, the Region may appoint the veterans non-competitively under a status quo appointment that may be converted to permanent status at any time.
• 5 CFR 316.201(b) for hiring worker-trainees for programs such as the Welfare to Work program. Federal agencies are encouraged to expand the use of the worker-trainee authority under TAPER (Temporary Appointment Pending Establishment of a Register) and other excepted FWS hiring authorities to appoint welfare recipients to entry-level positions. Accordingly, the worker-trainee authority may be used as an additional tool to increase employment opportunities for people with disabilities under the Welfare to Work program.
• 5 CFR 316.302(b)(4) and 5 CFR 316.402(b)(4) for hiring 30 percent or more disabled veterans. These authorities are used to hire veterans with a compensable FWS connected disability of 30% or more who were issued a notice of retirement or discharge from active military service due to the disability; or who was rated by the VA within the preceding year as having a compensable service-connected disability of 30 percent or more. If the appointment is for more than 60 days, they may be converted, without a break in service, to permanent status at any time during the appointment.
Retention Strategies: • Provide guidance to managers and supervisors on the requirements in the Diversity and Inclusion
Implementation Plan (DIIP) to develop Individual Development Plans (IDPs) for all of their employees, especially individuals with targeted disabilities to provide career development opportunities and participation in formal leadership training programs.
• Sponsor activities and training through the Special Emphasis Program to provide awareness and education to management and employees focused on strategies for retention of individuals with targeted disabilities, especially during the observance for Disability Employment Awareness Month (October).
• Educate managers on how to make the workplace accessible for individuals with targeted disabilities and how to assess the ability of potential individuals with targeted disabilities to perform the essential functions of the job.
• Discuss strategies and guidance from the Department of the Interior’s Reasonable Accommodation Policy with managers and supervisors in Diversity Training and staff meetings.
• Educate Change Agents on Reasonable Accommodation Policy and Process and collect any feedback relating to barriers for individuals with targeted disabilities.
• Provide managers and supervisors information on obtaining electronic equipment through the Department of Defense, Computer/Electronics Accommodations Program (CAP) and the Job Accommodation Network (JAN).
• Monitor and track quarterly the conversion of individuals with targeted disabilities from an excepted appointment to career conditional.
• Monitor and track retention of individuals with targeted disabilities quarterly and report any barriers.

67
Workforce Tables A Section Table A1: TOTAL WORKFORCE - Distribution by Race/Ethnicity and Sex Table A2: PERMANENT WORKFORCE BY COMPONENT - Distribution by Race/Ethnicity and Sex Table A3-1: OCCUPATIONAL CATEGORIES - Distribution by Race/Ethnicity and Sex - Permanent Workforce Table A3-2: OCCUPATIONAL CATEGORIES - Distribution by Race/Ethnicity and Sex - Permanent Workforce Table A4-1: PARTICIPATION RATES FOR GENERAL SCHEDULE GRADES by Race/Ethnicity and Sex - Permanent Workforce Table A4-1: PARTICIPATION RATES FOR GENERAL SCHEDULE GRADES by Race/Ethnicity and Sex - Temporary Workforce Table A4-2: PARTICIPATION RATES FOR GENERAL SCHEDULE GRADES by Race/Ethnicity and Sex - Permanent Workforce Table A4-2: PARTICIPATION RATES FOR GENERAL SCHEDULE GRADES by Race/Ethnicity and Sex - Temporary Workforce Table A5NS-1: PARTICIPATION RATES FOR NON-SUPERVISORY WAGE GRADES by Race/Ethnicity and Sex - Permanent Workforce Table A5NS-1: PARTICIPATION RATES FOR NON-SUPERVISORY WAGE GRADES by Race/Ethnicity and Sex - Temporary Workforce Table A5NS-2: PARTICIPATION RATES FOR NON-SUPERVISORY WAGE GRADES by Race/Ethnicity and Sex - Permanent Workforce Table A5NS-2: PARTICIPATION RATES FOR NON-SUPERVISORY WAGE GRADES by Race/Ethnicity and Sex - Temporary Workforce Table A5S-1: PARTICIPATION RATES FOR SUPERVISORY WAGE GRADES by Race/Ethnicity and Sex - Permanent Workforce Table A5S-1: PARTICIPATION RATES FOR SUPERVISORY WAGE GRADES by Race/Ethnicity and Sex - Temporary Workforce Table A5S-2: PARTICIPATION RATES FOR SUPERVISORY WAGE GRADES by Race/Ethnicity and Sex - Permanent Workforce Table A5S-2: PARTICIPATION RATES FOR SUPERVISORY WAGE GRADES by Race/Ethnicity and Sex - Temporary Workforce Table A6: PARTICIPATION RATES FOR MAJOR OCCUPATIONS - Distribution by Race/Ethnicity and Sex - Permanent Workforce Table A6: PARTICIPATION RATES FOR MAJOR OCCUPATIONS - Distribution by Race/Ethnicity and Sex - Temporary Workforce Table A7-Alt: HIRES FOR MAJOR OCCUPATIONS by Race/Ethnicity and Sex - Permanent Workforce Table A7-Alt: HIRES FOR MAJOR OCCUPATIONS by Race/Ethnicity and Sex - Temporary Workforce Table A7-2: SOME APPLICANTS AND SELECTIONS FOR AUDITED VACANCIES IN MAJOR OCCUPATIONS by Race/Ethnicity and Sex Table A8: NEW HIRES BY TYPE OF APPOINTMENT - Distribution by Race/Ethnicity and Sex Table A9-1: SELECTIONS FOR INTERNAL COMPETITIVE PROMOTIONS FOR MAJOR OCCUPATIONS by Race/Ethnicity and Sex Table A9-2: SELECTIONS FOR INTERNAL COMPETITIVE PROMOTIONS FOR MAJOR OCCUPATIONS by Race/Ethnicity and Sex Table A10: NON-COMPETITIVE PROMOTIONS - TIME IN GRADE - Distribution by Race/Ethnicity and Sex Table A11: INTERNAL SELECTIONS FOR SENIOR LEVEL POSITIONS (GS 13/14, GS 15, AND SES) by Race/Ethnicity and Sex Table A12: PARTICIPATION IN LEADERSHIP DEVELOPMENT - Distribution by Race/Ethnicity and Sex Table A13: EMPLOYEE RECOGNITION AND AWARDS - Distribution by Race/Ethnicity and Sex - Permanent Workforce Table A14: SEPARATIONS BY TYPE OF SEPARATION - Distribution by Race/Ethnicity and Sex - Permanent Workforce

All male female male female male female male female male female male female male female male female
# 8877 5356 3521 302 246 4559 2802 161 232 99 102 32 28 188 100 15 11
% 100% 60.3% 39.7% 3.4% 2.8% 51.4% 31.6% 1.8% 2.6% 1.1% 1.1% 0.4% 0.3% 2.1% 1.1% 0.2% 0.1%
# 8945 5380 3565 293 244 4598 2850 158 225 100 108 26 21 188 104 17 13
% 100% 60.1% 39.9% 3.3% 2.7% 51.4% 31.9% 1.8% 2.5% 1.1% 1.2% 0.3% 0.2% 2.1% 1.2% 0.2% 0.1%
All Occupations CLF % 100% 51.9% 48.1% 5.2% 4.8% 38.3% 34.0% 5.5% 6.5% 2.0% 1.9% 0.1% 0.1% 0.6% 0.5% 0.3% 0.3%
Organizational CLF % 100% 53.9% 46.1% 3.6% 3.2% 43.4% 35.5% 3.2% 3.6% 2.7% 3.2% 0.1% 0.1% 0.6% 0.4% 0.2% 0.2%
Difference # 68 24 44 -9 -2 39 48 -3 -7 1 6 -6 -7 0 4 2 2
Ratio Change % - -0.2% 0.2% -0.1% 0.0% 0.0% 0.3% 0.0% -0.1% 0.0% 0.1% -0.1% -0.1% 0.0% 0.0% 0.0% 0.0%
Net Change % 0.8% 0.4% 1.2% -3.0% -0.8% 0.9% 1.7% -1.9% -3.0% 1.0% 5.9% -18.8% -25.0% 0.0% 4.0% 13.3% 18.2%
# 7845 4664 3181 276 231 3957 2512 148 227 82 96 11 15 176 91 14 9
% 100% 59.5% 40.5% 3.5% 2.9% 50.4% 32.0% 1.9% 2.9% 1.0% 1.2% 0.1% 0.2% 2.2% 1.2% 0.2% 0.1%
# 7814 4642 3172 268 233 3937 2494 149 222 86 101 13 17 173 94 16 11
% 100% 59.4% 40.6% 3.4% 3.0% 50.4% 31.9% 1.9% 2.8% 1.1% 1.3% 0.2% 0.2% 2.2% 1.2% 0.2% 0.1%
Difference # -31 -22 -9 -8 2 -20 -18 1 -5 4 5 2 2 -3 3 2 2
Ratio Change % - 0.0% 0.0% -0.1% 0.0% -0.1% -0.1% 0.0% -0.1% 0.1% 0.1% 0.0% 0.0% 0.0% 0.0% 0.0% 0.0%
Net Change % -0.4% -0.5% -0.3% -2.9% 0.9% -0.5% -0.7% 0.7% -2.2% 4.9% 5.2% 18.2% 13.3% -1.7% 3.3% 14.3% 22.2%
# 1032 692 340 26 15 602 290 13 5 17 6 21 13 12 9 1 2
% 100% 67.1% 32.9% 2.5% 1.5% 58.3% 28.1% 1.3% 0.5% 1.6% 0.6% 2.0% 1.3% 1.2% 0.9% 0.1% 0.2%
# 1131 738 393 25 11 661 356 9 3 14 7 13 4 15 10 1 2
% 100% 65.3% 34.7% 2.2% 1.0% 58.4% 31.5% 0.8% 0.3% 1.2% 0.6% 1.1% 0.4% 1.3% 0.9% 0.1% 0.2%
Difference # 99 46 53 -1 -4 59 66 -4 -2 -3 1 -8 -9 3 1 0 0
Ratio Change % - -1.8% 1.8% -0.3% -0.5% 0.1% 3.4% -0.5% -0.2% -0.4% 0.0% -0.9% -0.9% 0.2% 0.0% 0.0% 0.0%
Net Change % 9.6% 6.6% 15.6% -3.8% -26.7% 9.8% 22.8% -30.8% -40.0% -17.6% 16.7% -38.1% -69.2% 25.0% 11.1% 0.0% 0.0%
Prior FY
AsianAmerican Indian or
Alaska Native
Current FY
Prior FY
Current FY
Temporary Workforce
Two or more races
Total Workforce
Permanent Workforce
Native Hawaiian or Other Pacific
Islander
Current FY
Prior FY
Fish & Wildlife Service - Servicewide FY2015Table A1: TOTAL WORKFORCE - Distribution by Race/Ethnicity and Sex
Employment TenureTOTAL
WORKFORCE
RACE/ETHNICITY
Hispanic or Latino
Non- Hispanic or Latino
White Black or African American

All male female male female male female male female male female male female male female male female
AsianAmerican Indian or
Alaska Native
Two or more races
Native Hawaiian or Other Pacific
Islander
Fish & Wildlife Service - Servicewide FY2015Table A1: TOTAL WORKFORCE - Distribution by Race/Ethnicity and Sex
Employment TenureTOTAL
WORKFORCE
RACE/ETHNICITY
Hispanic or Latino
Non- Hispanic or Latino
White Black or African American
#
% - - - - - - - - - - - - - - - - -
#
% - - - - - - - - - - - - - - - - -
Difference # 0 0 0 0 0 0 0 0 0 0 0 0 0 0 0 0 0
Ratio Change % - - - - - - - - - - - - - - - - -
Net Change % - - - - - - - - - - - - - - - - -All Occupations CLF is based on all workers in all Census Occupation groups.Organizational CLF is based on the number of incumbants in each occupation in the organization.
Prior FY
Current FY
Non-Appropriated Workforce

All male female male female male female male female male female male female male female male female
# 7814 4642 3172 268 233 3937 2494 149 222 86 101 13 17 173 94 16 11
% 100% 59.4% 40.6% 3.4% 3.0% 50.4% 31.9% 1.9% 2.8% 1.1% 1.3% 0.2% 0.2% 2.2% 1.2% 0.2% 0.1%
All Occupations CLF % 100% 51.9% 48.1% 5.2% 4.8% 38.3% 34.0% 5.5% 6.5% 2.0% 1.9% 0.1% 0.1% 0.6% 0.5% 0.3% 0.3%
Organizational CLF % 100% 53.7% 46.3% 3.5% 3.1% 43.6% 35.8% 3.1% 3.6% 2.6% 3.0% 0.1% 0.1% 0.6% 0.4% 0.2% 0.2%
# 907 541 366 18 17 477 304 5 6 15 25 3 8 20 6 3
% 100% 59.6% 40.4% 2.0% 1.9% 52.6% 33.5% 0.6% 0.7% 1.7% 2.8% 0.3% 0.9% 2.2% 0.7% 0.3% 0.0%
# 771 489 282 92 68 343 194 8 5 11 2 1 33 13 1
% 100% 63.4% 36.6% 11.9% 8.8% 44.5% 25.2% 1.0% 0.6% 1.4% 0.3% 0.1% 0.0% 4.3% 1.7% 0.1% 0.0%
# 871 542 329 10 5 503 292 8 15 2 6 3 2 16 8 1
% 100% 62.2% 37.8% 1.1% 0.6% 57.7% 33.5% 0.9% 1.7% 0.2% 0.7% 0.3% 0.2% 1.8% 0.9% 0.0% 0.1%
# 1213 784 429 46 26 667 335 48 58 10 2 1 10 8 2
% 100% 64.6% 35.4% 3.8% 2.1% 55.0% 27.6% 4.0% 4.8% 0.8% 0.2% 0.1% 0.0% 0.8% 0.7% 0.2% 0.0%
# 709 396 313 10 10 349 275 15 17 9 6 1 2 8 3 4
% 100% 55.9% 44.1% 1.4% 1.4% 49.2% 38.8% 2.1% 2.4% 1.3% 0.8% 0.1% 0.3% 1.1% 0.4% 0.6% 0.0%
# 816 524 292 20 20 465 250 9 5 2 5 26 11 2 1
% 100% 64.2% 35.8% 2.5% 2.5% 57.0% 30.6% 1.1% 0.6% 0.2% 0.6% 0.0% 0.0% 3.2% 1.3% 0.2% 0.1%
# 492 276 216 3 11 228 170 6 5 6 10 1 32 18 1 1
% 100% 56.1% 43.9% 0.6% 2.2% 46.3% 34.6% 1.2% 1.0% 1.2% 2.0% 0.0% 0.2% 6.5% 3.7% 0.2% 0.2%
# 710 415 295 28 20 359 242 2 5 11 17 1 1 11 8 3 2
% 100% 58.5% 41.5% 3.9% 2.8% 50.6% 34.1% 0.3% 0.7% 1.5% 2.4% 0.1% 0.1% 1.5% 1.1% 0.4% 0.3%
# 1325 675 650 41 56 546 432 48 106 20 28 3 3 17 19 6
% 100% 50.9% 49.1% 3.1% 4.2% 41.2% 32.6% 3.6% 8.0% 1.5% 2.1% 0.2% 0.2% 1.3% 1.4% 0.0% 0.5%All Occupations CLF is based on all workers in all Census Occupation groups.Organizational CLF is based on the number of incumbents in each occupation in the organization.
Region 4
Region 5
Region 6
Region 7
Region 8
Headquarters
American Indian or
Alaska Native
Two or more races
Total
Region 1
AsianNative Hawaiian or Other Pacific
Islander
Region 2
Region 3
Fish & Wildlife Service - Servicewide as of September 30, 2015Table A2: PERMANENT WORKFORCE BY COMPONENT - Distribution by Race/Ethnicity and Sex
Organizational Component
TOTAL EMPLOYEES
RACE/ETHNICITY
Hispanic or Latino
Non- Hispanic or Latino
White Black or African American

All male female male female male female male female male female male female male female male female
1. Officials and Managers
# 147 97 50 11 5 77 43 3 2 1 5
% 100% 66.0% 34.0% 7.5% 3.4% 52.4% 29.3% 2.0% 1.4% 0.7% 0.0% 0.0% 0.0% 3.4% 0.0% 0.0% 0.0%
# 943 659 284 28 16 581 240 20 11 9 9 17 8 4
% 100% 69.9% 30.1% 3.0% 1.7% 61.6% 25.5% 2.1% 1.2% 1.0% 1.0% 0.0% 0.0% 1.8% 0.8% 0.4% 0.0%
# 468 340 128 28 5 286 113 5 2 4 3 1 3 13 2 3
% 100% 72.6% 27.4% 6.0% 1.1% 61.1% 24.1% 1.1% 0.4% 0.9% 0.6% 0.2% 0.6% 2.8% 0.4% 0.6% 0.0%
# 1157 505 652 22 63 401 447 36 89 17 20 2 5 26 23 1 5
% 100% 43.6% 56.4% 1.9% 5.4% 34.7% 38.6% 3.1% 7.7% 1.5% 1.7% 0.2% 0.4% 2.2% 2.0% 0.1% 0.4%
# 2715 1601 1114 89 89 1345 843 64 104 31 32 3 8 61 33 8 5
% 100% 59.0% 41.0% 3.3% 3.3% 49.5% 31.0% 2.4% 3.8% 1.1% 1.2% 0.1% 0.3% 2.2% 1.2% 0.3% 0.2%
# 3277 1931 1346 99 80 1685 1136 38 49 36 45 4 5 63 30 6 1
% 100% 58.9% 41.1% 3.0% 2.4% 51.4% 34.7% 1.2% 1.5% 1.1% 1.4% 0.1% 0.2% 1.9% 0.9% 0.2% 0.0%
# 259 213 46 19 4 175 38 5 1 3 1 4 1 7 1
% 100% 82.2% 17.8% 7.3% 1.5% 67.6% 14.7% 1.9% 0.4% 1.2% 0.4% 1.5% 0.4% 2.7% 0.4% 0.0% 0.0%
#
% - - - - - - - - - - - - - - - - -
# 599 127 472 15 49 79 325 23 58 8 13 1 2 22 4
% 100% 21.2% 78.8% 2.5% 8.2% 13.2% 54.3% 3.8% 9.7% 1.3% 2.2% 0.0% 0.2% 0.3% 3.7% 0.0% 0.7%
# 505 498 7 29 1 430 6 10 5 22 2
% 100% 98.6% 1.4% 5.7% 0.2% 85.1% 1.2% 2.0% 0.0% 1.0% 0.0% 0.0% 0.0% 4.4% 0.0% 0.4% 0.0%
# 15 15 1 8 1 5
% 100% 100.0% 0.0% 6.7% 0.0% 53.3% 0.0% 6.7% 0.0% 0.0% 0.0% 0.0% 0.0% 33.3% 0.0% 0.0% 0.0%
# 60 50 10 2 42 9 6 1
% 100% 83.3% 16.7% 3.3% 0.0% 70.0% 15.0% 0.0% 0.0% 0.0% 0.0% 0.0% 0.0% 10.0% 1.7% 0.0% 0.0%
# 358 198 160 14 9 166 125 6 7 3 10 2 2 7 6 1
% 100% 55.3% 44.7% 3.9% 2.5% 46.4% 34.9% 1.7% 2.0% 0.8% 2.8% 0.6% 0.6% 2.0% 1.7% 0.0% 0.3%
Officials and Managers - TOTAL
2. Professionals
7. Operatives
8. Laborers and Helpers
9. Service Workers
3. Technicians
4. Sales Workers
5. Administrative Support Workers
6. Craft Workers
American Indian or Alaska Native
Two or more races
Executive/Senior Level (Grades 15 and Above)
Mid-level (Grades 13-14)
Asian
Native Hawaiian or Other Pacific
Islander
First-Level (Grades 12 and Below)
- Other
Fish & Wildlife Service - Servicewide as of September 30, 2015Table A3-1: OCCUPATIONAL CATEGORIES - Distribution by Race/Ethnicity and Sex - Permanent Workforce
Occupational Categories
TOTAL EMPLOYEES
RACE/ETHNICITY
Hispanic or Latino
Non- Hispanic or Latino
White Black or African American

All male female male female male female male female male female male female male female male female
1. Officials and Managers
# 147 97 50 11 5 77 43 3 2 1 5
% 1.9% 2.1% 1.6% 4.1% 2.1% 2.0% 1.7% 2.0% 0.9% 1.2% 0.0% 0.0% 0.0% 2.9% 0.0% 0.0% 0.0%
# 943 659 284 28 16 581 240 20 11 9 9 17 8 4
% 12.1% 14.2% 9.0% 10.4% 6.9% 14.8% 9.6% 13.4% 5.0% 10.5% 8.9% 0.0% 0.0% 9.8% 8.5% 25.0% 0.0%
# 468 340 128 28 5 286 113 5 2 4 3 1 3 13 2 3
% 6.0% 7.3% 4.0% 10.4% 2.1% 7.3% 4.5% 3.4% 0.9% 4.7% 3.0% 7.7% 17.6% 7.5% 2.1% 18.8% 0.0%
# 1157 505 652 22 63 401 447 36 89 17 20 2 5 26 23 1 5
% 14.8% 10.9% 20.6% 8.2% 27.0% 10.2% 17.9% 24.2% 40.1% 19.8% 19.8% 15.4% 29.4% 15.0% 24.5% 6.3% 45.5%
# 2715 1601 1114 89 89 1345 843 64 104 31 32 3 8 61 33 8 5
% 34.7% 34.5% 35.1% 33.2% 38.2% 34.2% 33.8% 43.0% 46.8% 36.0% 31.7% 23.1% 47.1% 35.3% 35.1% 50.0% 45.5%
# 3277 1931 1346 99 80 1685 1136 38 49 36 45 4 5 63 30 6 1
% 41.9% 41.6% 42.4% 36.9% 34.3% 42.8% 45.5% 25.5% 22.1% 41.9% 44.6% 30.8% 29.4% 36.4% 31.9% 37.5% 9.1%
# 259 213 46 19 4 175 38 5 1 3 1 4 1 7 1
% 3.3% 4.6% 1.5% 7.1% 1.7% 4.4% 1.5% 3.4% 0.5% 3.5% 1.0% 30.8% 5.9% 4.0% 1.1% 0.0% 0.0%
#
% 0.0% 0.0% 0.0% 0.0% 0.0% 0.0% 0.0% 0.0% 0.0% 0.0% 0.0% 0.0% 0.0% 0.0% 0.0% 0.0% 0.0%
# 599 127 472 15 49 79 325 23 58 8 13 1 2 22 4
% 7.7% 2.7% 14.9% 5.6% 21.0% 2.0% 13.0% 15.4% 26.1% 9.3% 12.9% 0.0% 5.9% 1.2% 23.4% 0.0% 36.4%
# 505 498 7 29 1 430 6 10 5 22 2
% 6.5% 10.7% 0.2% 10.8% 0.4% 10.9% 0.2% 6.7% 0.0% 5.8% 0.0% 0.0% 0.0% 12.7% 0.0% 12.5% 0.0%
# 15 15 1 8 1 5
% 0.2% 0.3% 0.0% 0.4% 0.0% 0.2% 0.0% 0.7% 0.0% 0.0% 0.0% 0.0% 0.0% 2.9% 0.0% 0.0% 0.0%
# 60 50 10 2 42 9 6 1
% 0.8% 1.1% 0.3% 0.7% 0.0% 1.1% 0.4% 0.0% 0.0% 0.0% 0.0% 0.0% 0.0% 3.5% 1.1% 0.0% 0.0%
# 358 198 160 14 9 166 125 6 7 3 10 2 2 7 6 1
% 4.6% 4.3% 5.0% 5.2% 3.9% 4.2% 5.0% 4.0% 3.2% 3.5% 9.9% 15.4% 11.8% 4.0% 6.4% 0.0% 9.1%
# 7814 4642 3172 268 233 3937 2494 149 222 86 101 13 17 173 94 16 11
% 100% 100% 100% 100% 100% 100% 100% 100% 100% 100% 100% 100% 100% 100% 100% 100% 100%
Fish & Wildlife Service - Servicewide as of September 30, 2015Table A3-2: OCCUPATIONAL CATEGORIES - Distribution by Race/Ethnicity and Sex - Permanent Workforce
Occupational Categories
TOTAL EMPLOYEES
RACE/ETHNICITY
Hispanic or Latino
Non- Hispanic or Latino
White Black or African American Asian
Native Hawaiian or Other Pacific
Islander
First-Level (Grades 12 and Below)
- Other
Officials and Managers - TOTAL
2. Professionals
American Indian or Alaska Native
Two or more races
Executive/Senior Level (Grades 15 and Above)
Mid-level (Grades 13-14)
Permanent Workforce
7. Operatives
8. Laborers and Helpers
9. Service Workers
3. Technicians
4. Sales Workers
5. Administrative Support Workers
6. Craft Workers

All male female male female male female male female male female male female male female male female
# 1 1 1% 100% 100.0% 0.0% 0.0% 0.0% 100.0% 0.0% 0.0% 0.0% 0.0% 0.0% 0.0% 0.0% 0.0% 0.0% 0.0% 0.0%# 4 1 3 1 3
% 100% 25.0% 75.0% 0.0% 0.0% 25.0% 75.0% 0.0% 0.0% 0.0% 0.0% 0.0% 0.0% 0.0% 0.0% 0.0% 0.0%# 10 7 3 1 4 3 1 1
% 100% 70.0% 30.0% 10.0% 0.0% 40.0% 30.0% 10.0% 0.0% 10.0% 0.0% 0.0% 0.0% 0.0% 0.0% 0.0% 0.0%# 47 22 25 5 2 12 21 1 1 3 2
% 100% 46.8% 53.2% 10.6% 4.3% 25.5% 44.7% 2.1% 0.0% 0.0% 0.0% 2.1% 0.0% 6.4% 4.3% 0.0% 0.0%# 224 111 113 14 14 72 78 10 11 4 3 3 3 7 4 1
% 100% 49.6% 50.4% 6.3% 6.3% 32.1% 34.8% 4.5% 4.9% 1.8% 1.3% 1.3% 1.3% 3.1% 1.8% 0.4% 0.0%# 183 71 112 9 7 53 77 3 11 2 6 1 3 8 3
% 100% 38.8% 61.2% 4.9% 3.8% 29.0% 42.1% 1.6% 6.0% 1.1% 3.3% 0.5% 0.0% 1.6% 4.4% 0.0% 1.6%# 532 216 316 15 32 169 226 11 33 5 8 1 16 14 2
% 100% 40.6% 59.4% 2.8% 6.0% 31.8% 42.5% 2.1% 6.2% 0.9% 1.5% 0.0% 0.2% 3.0% 2.6% 0.0% 0.4%# 122 49 73 3 8 38 50 6 10 1 2 1 2 1
% 100% 40.2% 59.8% 2.5% 6.6% 31.1% 41.0% 4.9% 8.2% 0.8% 1.6% 0.0% 0.0% 0.8% 1.6% 0.0% 0.8%# 865 461 404 20 30 394 305 22 37 13 14 1 3 10 15 1
% 100% 53.3% 46.7% 2.3% 3.5% 45.5% 35.3% 2.5% 4.3% 1.5% 1.6% 0.1% 0.3% 1.2% 1.7% 0.1% 0.0%# 9 1 8 1 1 4 1 2
% 100% 11.1% 88.9% 0.0% 11.1% 11.1% 44.4% 0.0% 11.1% 0.0% 0.0% 0.0% 0.0% 0.0% 22.2% 0.0% 0.0%# 1450 786 664 55 47 656 535 21 33 17 23 3 5 31 19 3 2
% 100% 54.2% 45.8% 3.8% 3.2% 45.2% 36.9% 1.4% 2.3% 1.2% 1.6% 0.2% 0.3% 2.1% 1.3% 0.2% 0.1%# 1755 1058 697 52 35 921 582 29 45 17 19 2 4 33 10 4 2
% 100% 60.3% 39.7% 3.0% 2.0% 52.5% 33.2% 1.7% 2.6% 1.0% 1.1% 0.1% 0.2% 1.9% 0.6% 0.2% 0.1%# 1308 808 500 38 41 706 395 22 29 16 20 1 1 23 13 2 1
% 100% 61.8% 38.2% 2.9% 3.1% 54.0% 30.2% 1.7% 2.2% 1.2% 1.5% 0.1% 0.1% 1.8% 1.0% 0.2% 0.1%# 543 360 183 13 10 327 153 9 10 2 6 7 4 2
% 100% 66.3% 33.7% 2.4% 1.8% 60.2% 28.2% 1.7% 1.8% 0.4% 1.1% 0.0% 0.0% 1.3% 0.7% 0.4% 0.0%# 133 89 44 8 3 73 39 2 1 1 6
% 100% 66.9% 33.1% 6.0% 2.3% 54.9% 29.3% 0.0% 1.5% 0.8% 0.0% 0.8% 0.0% 4.5% 0.0% 0.0% 0.0%# 2 1 1 1 1
% 100% 50.0% 50.0% 50.0% 0.0% 0.0% 50.0% 0.0% 0.0% 0.0% 0.0% 0.0% 0.0% 0.0% 0.0% 0.0% 0.0%# 23 16 7 2 2 11 5 3
% 100% 69.6% 30.4% 8.7% 8.7% 47.8% 21.7% 13.0% 0.0% 0.0% 0.0% 0.0% 0.0% 0.0% 0.0% 0.0% 0.0%Senior Executive Service
GS-11
GS-12
GS-13
GS-14
GS-07
GS-08
GS-15
All other (unspecified GS)
GS-09
GS-10
American Indian or Alaska Native
Two or more races
GS-01
GS-02
GS-03
GS-04
GS-05
GS-06
Fish & Wildlife Service - Servicewide as of September 30, 2015Table A4-1: PARTICIPATION RATES FOR GENERAL SCHEDULE GRADES by Race/Ethnicity and Sex - Permanent Workforce
GS/GL/GM, SES, AND RELATED GRADES
TOTAL EMPLOYEES
RACE/ETHNICITY
Hispanic or Latino
Non- Hispanic or Latino
White Black or African American Asian
Native Hawaiian or Other Pacific
Islander

All male female male female male female male female male female male female male female male female
# 3 2 1 1 1 1% 100% 66.7% 33.3% 0.0% 0.0% 33.3% 33.3% 33.3% 0.0% 0.0% 0.0% 0.0% 0.0% 0.0% 0.0% 0.0% 0.0%# 12 8 4 1 6 4 1
% 100% 66.7% 33.3% 8.3% 0.0% 50.0% 33.3% 0.0% 0.0% 0.0% 0.0% 0.0% 0.0% 8.3% 0.0% 0.0% 0.0%# 103 70 33 2 62 30 2 1 2 1 1 2
% 100% 68.0% 32.0% 1.9% 0.0% 60.2% 29.1% 1.9% 1.0% 1.9% 1.0% 0.0% 1.0% 1.9% 0.0% 0.0% 0.0%# 184 113 71 4 3 98 65 1 1 1 7 1 2 1
% 100% 61.4% 38.6% 2.2% 1.6% 53.3% 35.3% 0.5% 0.0% 0.5% 0.5% 3.8% 0.5% 1.1% 0.0% 0.0% 0.5%# 305 193 112 5 2 178 103 2 5 3 2 4 1
% 100% 63.3% 36.7% 1.6% 0.7% 58.4% 33.8% 0.7% 0.0% 1.6% 1.0% 0.7% 0.0% 0.0% 1.3% 0.3% 0.0%# 48 27 21 27 17 2 2
% 100% 56.3% 43.8% 0.0% 0.0% 56.3% 35.4% 0.0% 4.2% 0.0% 0.0% 0.0% 0.0% 0.0% 4.2% 0.0% 0.0%# 110 60 50 4 4 53 44 3 1 1
% 100% 54.5% 45.5% 3.6% 3.6% 48.2% 40.0% 0.0% 0.0% 2.7% 0.9% 0.0% 0.0% 0.0% 0.9% 0.0% 0.0%# 3 3 1 2
% 100% 100.0% 0.0% 0.0% 0.0% 33.3% 0.0% 0.0% 0.0% 0.0% 0.0% 0.0% 0.0% 66.7% 0.0% 0.0% 0.0%# 111 66 45 5 2 57 41 1 1 2 2
% 100% 59.5% 40.5% 4.5% 1.8% 51.4% 36.9% 0.9% 0.0% 0.9% 0.0% 0.0% 0.0% 1.8% 1.8% 0.0% 0.0%#
% - - - - - - - - - - - - - - - - -# 78 46 32 2 42 30 1 1 1 1
% 100% 59.0% 41.0% 2.6% 0.0% 53.8% 38.5% 0.0% 0.0% 1.3% 0.0% 1.3% 1.3% 0.0% 1.3% 0.0% 0.0%# 15 11 4 9 3 1 1 1
% 100% 73.3% 26.7% 0.0% 0.0% 60.0% 20.0% 0.0% 0.0% 6.7% 0.0% 6.7% 0.0% 0.0% 0.0% 0.0% 6.7%# 7 4 3 4 3
% 100% 57.1% 42.9% 0.0% 0.0% 57.1% 42.9% 0.0% 0.0% 0.0% 0.0% 0.0% 0.0% 0.0% 0.0% 0.0% 0.0%# 5 3 2 2 1 1 1
% 100% 60.0% 40.0% 0.0% 0.0% 40.0% 20.0% 0.0% 0.0% 0.0% 0.0% 0.0% 20.0% 20.0% 0.0% 0.0% 0.0%#
% - - - - - - - - - - - - - - - - -#
% - - - - - - - - - - - - - - - - -# 1 1 1
% 100% 100.0% 0.0% 0.0% 0.0% 100.0% 0.0% 0.0% 0.0% 0.0% 0.0% 0.0% 0.0% 0.0% 0.0% 0.0% 0.0%
GS-01
GS-02
White Black or African American
Fish & Wildlife Service - Servicewide as of September 30, 2015Table A4-1: PARTICIPATION RATES FOR GENERAL SCHEDULE GRADES by Race/Ethnicity and Sex - Temporary Workforce
GS/GL/GM, SES, AND RELATED GRADES
TOTAL EMPLOYEES
RACE/ETHNICITY
Hispanic or Latino
Non- Hispanic or Latino
American Indian or Alaska Native
Two or more racesAsian
Native Hawaiian or Other Pacific
Islander
GS-09
GS-10
GS-03
GS-04
GS-05
GS-06
GS-07
GS-08
GS-15
All other (unspecified GS)
Senior Executive Service
GS-11
GS-12
GS-13
GS-14

All male female male female male female male female male female male female male female male female
# 1 1 1% 0.0% 0.0% 0.0% 0.0% 0.0% 0.0% 0.0% 0.0% 0.0% 0.0% 0.0% 0.0% 0.0% 0.0% 0.0% 0.0% 0.0%# 4 1 3 1 3% 0.1% 0.0% 0.1% 0.0% 0.0% 0.0% 0.1% 0.0% 0.0% 0.0% 0.0% 0.0% 0.0% 0.0% 0.0% 0.0% 0.0%# 10 7 3 1 4 3 1 1% 0.1% 0.2% 0.1% 0.4% 0.0% 0.1% 0.1% 0.7% 0.0% 1.3% 0.0% 0.0% 0.0% 0.0% 0.0% 0.0% 0.0%# 47 22 25 5 2 12 21 1 1 3 2% 0.7% 0.5% 0.8% 2.1% 0.9% 0.3% 0.8% 0.7% 0.0% 0.0% 0.0% 7.7% 0.0% 2.1% 2.2% 0.0% 0.0%# 224 111 113 14 14 72 78 10 11 4 3 3 3 7 4 1% 3.1% 2.7% 3.6% 5.9% 6.0% 2.1% 3.1% 7.2% 5.0% 5.1% 3.0% 23.1% 17.6% 5.0% 4.3% 7.7% 0.0%# 183 71 112 9 7 53 77 3 11 2 6 1 3 8 3% 2.5% 1.7% 3.6% 3.8% 3.0% 1.5% 3.1% 2.2% 5.0% 2.5% 5.9% 7.7% 0.0% 2.1% 8.6% 0.0% 27.3%# 532 216 316 15 32 169 226 11 33 5 8 1 16 14 2% 7.4% 5.3% 10.0% 6.4% 13.8% 4.9% 9.1% 8.0% 14.9% 6.3% 7.9% 0.0% 5.9% 11.4% 15.1% 0.0% 18.2%# 122 49 73 3 8 38 50 6 10 1 2 1 2 1% 1.7% 1.2% 2.3% 1.3% 3.4% 1.1% 2.0% 4.3% 4.5% 1.3% 2.0% 0.0% 0.0% 0.7% 2.2% 0.0% 9.1%# 865 461 404 20 30 394 305 22 37 13 14 1 3 10 15 1% 12.0% 11.4% 12.8% 8.5% 12.9% 11.5% 12.3% 15.9% 16.7% 16.5% 13.9% 7.7% 17.6% 7.1% 16.1% 7.7% 0.0%# 9 1 8 1 1 4 1 2% 0.1% 0.0% 0.3% 0.0% 0.4% 0.0% 0.2% 0.0% 0.5% 0.0% 0.0% 0.0% 0.0% 0.0% 2.2% 0.0% 0.0%# 1450 786 664 55 47 656 535 21 33 17 23 3 5 31 19 3 2% 20.1% 19.4% 21.1% 23.3% 20.3% 19.1% 21.6% 15.2% 14.9% 21.5% 22.8% 23.1% 29.4% 22.1% 20.4% 23.1% 18.2%# 1755 1058 697 52 35 921 582 29 45 17 19 2 4 33 10 4 2% 24.3% 26.1% 22.1% 22.0% 15.1% 26.8% 23.5% 21.0% 20.3% 21.5% 18.8% 15.4% 23.5% 23.6% 10.8% 30.8% 18.2%# 1308 808 500 38 41 706 395 22 29 16 20 1 1 23 13 2 1% 18.1% 19.9% 15.9% 16.1% 17.7% 20.5% 15.9% 15.9% 13.1% 20.3% 19.8% 7.7% 5.9% 16.4% 14.0% 15.4% 9.1%# 543 360 183 13 10 327 153 9 10 2 6 7 4 2% 7.5% 8.9% 5.8% 5.5% 4.3% 9.5% 6.2% 6.5% 4.5% 2.5% 5.9% 0.0% 0.0% 5.0% 4.3% 15.4% 0.0%# 133 89 44 8 3 73 39 2 1 1 6% 1.8% 2.2% 1.4% 3.4% 1.3% 2.1% 1.6% 0.0% 0.9% 1.3% 0.0% 7.7% 0.0% 4.3% 0.0% 0.0% 0.0%# 2 1 1 1 1
% 0.0% 0.0% 0.0% 0.4% 0.0% 0.0% 0.0% 0.0% 0.0% 0.0% 0.0% 0.0% 0.0% 0.0% 0.0% 0.0% 0.0%
# 23 16 7 2 2 11 5 3% 0.3% 0.4% 0.2% 0.8% 0.9% 0.3% 0.2% 2.2% 0.0% 0.0% 0.0% 0.0% 0.0% 0.0% 0.0% 0.0% 0.0%# 7211 4058 3153 236 232 3439 2477 138 222 79 101 13 17 140 93 13 11% 100% 100% 100% 100% 100% 100% 100% 100% 100% 100% 100% 100% 100% 100% 100% 100% 100%
GS-13
GS-14
Asian
Native Hawaiian or Other Pacific
Islander
GS-03
GS-04
GS-05
GS-06
American Indian or Alaska Native
GS-02
GS-01
NOTE: Percentages computed down columns and NOT across rows.
TOTAL
GS-07
GS-08
GS-09
GS-10
GS-15
All other (unspecified GS)
Senior Executive Service
GS-12
Two or more races
GS-11
Fish & Wildlife Service - Servicewide as of September 30, 2015Table A4-2: PARTICIPATION RATES FOR GENERAL SCHEDULE GRADES by Race/Ethnicity and Sex - Permanent Workforce
GS/GL/GM, SES, AND RELATED GRADES
TOTAL EMPLOYEES
RACE/ETHNICITY
Hispanic or Latino
Non- Hispanic or Latino
White Black or African American

All male female male female male female male female male female male female male female male female
# 3 2 1 1 1 1% 0.3% 0.3% 0.3% 0.0% 0.0% 0.2% 0.3% 14.3% 0.0% 0.0% 0.0% 0.0% 0.0% 0.0% 0.0% 0.0% 0.0%# 12 8 4 1 6 4 1% 1.2% 1.3% 1.1% 4.3% 0.0% 1.1% 1.2% 0.0% 0.0% 0.0% 0.0% 0.0% 0.0% 10.0% 0.0% 0.0% 0.0%# 103 70 33 2 62 30 2 1 2 1 1 2% 10.5% 11.5% 8.7% 8.7% 0.0% 11.5% 8.8% 28.6% 33.3% 14.3% 16.7% 0.0% 25.0% 20.0% 0.0% 0.0% 0.0%# 184 113 71 4 3 98 65 1 1 1 7 1 2 1% 18.7% 18.6% 18.8% 17.4% 27.3% 18.1% 19.0% 14.3% 0.0% 7.1% 16.7% 63.6% 25.0% 20.0% 0.0% 0.0% 50.0%# 305 193 112 5 2 178 103 2 5 3 2 4 1% 31.0% 31.8% 29.6% 21.7% 18.2% 32.9% 30.1% 28.6% 0.0% 35.7% 50.0% 18.2% 0.0% 0.0% 40.0% 100.0% 0.0%# 48 27 21 27 17 2 2% 4.9% 4.4% 5.6% 0.0% 0.0% 5.0% 5.0% 0.0% 66.7% 0.0% 0.0% 0.0% 0.0% 0.0% 20.0% 0.0% 0.0%# 110 60 50 4 4 53 44 3 1 1% 11.2% 9.9% 13.2% 17.4% 36.4% 9.8% 12.9% 0.0% 0.0% 21.4% 16.7% 0.0% 0.0% 0.0% 10.0% 0.0% 0.0%# 3 3 1 2% 0.3% 0.5% 0.0% 0.0% 0.0% 0.2% 0.0% 0.0% 0.0% 0.0% 0.0% 0.0% 0.0% 20.0% 0.0% 0.0% 0.0%# 111 66 45 5 2 57 41 1 1 2 2% 11.3% 10.9% 11.9% 21.7% 18.2% 10.5% 12.0% 14.3% 0.0% 7.1% 0.0% 0.0% 0.0% 20.0% 20.0% 0.0% 0.0%#% 0.0% 0.0% 0.0% 0.0% 0.0% 0.0% 0.0% 0.0% 0.0% 0.0% 0.0% 0.0% 0.0% 0.0% 0.0% 0.0% 0.0%# 78 46 32 2 42 30 1 1 1 1% 7.9% 7.6% 8.5% 8.7% 0.0% 7.8% 8.8% 0.0% 0.0% 7.1% 0.0% 9.1% 25.0% 0.0% 10.0% 0.0% 0.0%# 15 11 4 9 3 1 1 1% 1.5% 1.8% 1.1% 0.0% 0.0% 1.7% 0.9% 0.0% 0.0% 7.1% 0.0% 9.1% 0.0% 0.0% 0.0% 0.0% 50.0%# 7 4 3 4 3% 0.7% 0.7% 0.8% 0.0% 0.0% 0.7% 0.9% 0.0% 0.0% 0.0% 0.0% 0.0% 0.0% 0.0% 0.0% 0.0% 0.0%# 5 3 2 2 1 1 1% 0.5% 0.5% 0.5% 0.0% 0.0% 0.4% 0.3% 0.0% 0.0% 0.0% 0.0% 0.0% 25.0% 10.0% 0.0% 0.0% 0.0%#% 0.0% 0.0% 0.0% 0.0% 0.0% 0.0% 0.0% 0.0% 0.0% 0.0% 0.0% 0.0% 0.0% 0.0% 0.0% 0.0% 0.0%#
% 0.0% 0.0% 0.0% 0.0% 0.0% 0.0% 0.0% 0.0% 0.0% 0.0% 0.0% 0.0% 0.0% 0.0% 0.0% 0.0% 0.0%
# 1 1 1% 0.1% 0.2% 0.0% 0.0% 0.0% 0.2% 0.0% 0.0% 0.0% 0.0% 0.0% 0.0% 0.0% 0.0% 0.0% 0.0% 0.0%# 985 607 378 23 11 541 342 7 3 14 6 11 4 10 10 1 2% 100% 100% 100% 100% 100% 100% 100% 100% 100% 100% 100% 100% 100% 100% 100% 100% 100%
Fish & Wildlife Service - Servicewide as of September 30, 2015Table A4-2: PARTICIPATION RATES FOR GENERAL SCHEDULE GRADES by Race/Ethnicity and Sex - Temporary Workforce
GS/GL/GM, SES, AND RELATED GRADES
TOTAL EMPLOYEES
RACE/ETHNICITY
Hispanic or Latino
GS-03
White
Native Hawaiian or Other Pacific
Islander
Two or more racesAsian
All other (unspecified GS)
Non- Hispanic or Latino
GS-11
Black or African American
American Indian or Alaska Native
GS-13
GS-14
GS-09
GS-01
Senior Executive Service
GS-04
GS-15
GS-02
GS-12
NOTE: Percentages computed down columns and NOT across rows.
TOTAL
GS-05
GS-06
GS-07
GS-08
GS-10

All male female male female male female male female male female male female male female male female
# 19 11 8 11 8% 100% 57.9% 42.1% 0.0% 0.0% 57.9% 42.1% 0.0% 0.0% 0.0% 0.0% 0.0% 0.0% 0.0% 0.0% 0.0% 0.0%# 4 3 1 1 1 2
% 100% 75.0% 25.0% 0.0% 0.0% 25.0% 25.0% 0.0% 0.0% 50.0% 0.0% 0.0% 0.0% 0.0% 0.0% 0.0% 0.0%# 3 3 3
% 100% 100.0% 0.0% 0.0% 0.0% 100.0% 0.0% 0.0% 0.0% 0.0% 0.0% 0.0% 0.0% 0.0% 0.0% 0.0% 0.0%# 5 4 1 3 1 1
% 100% 80.0% 20.0% 0.0% 0.0% 60.0% 20.0% 0.0% 0.0% 0.0% 0.0% 0.0% 0.0% 20.0% 0.0% 0.0% 0.0%# 42 41 1 3 29 2 7 1
% 100% 97.6% 2.4% 7.1% 0.0% 69.0% 0.0% 4.8% 0.0% 0.0% 0.0% 0.0% 0.0% 16.7% 2.4% 0.0% 0.0%# 28 27 1 3 16 1 1 2 4 1
% 100% 96.4% 3.6% 10.7% 0.0% 57.1% 3.6% 3.6% 0.0% 7.1% 0.0% 0.0% 0.0% 14.3% 0.0% 3.6% 0.0%# 52 51 1 4 39 1 1 1 6
% 100% 98.1% 1.9% 7.7% 0.0% 75.0% 1.9% 1.9% 0.0% 1.9% 0.0% 0.0% 0.0% 11.5% 0.0% 0.0% 0.0%# 182 179 3 13 1 155 2 2 1 7 1
% 100% 98.4% 1.6% 7.1% 0.5% 85.2% 1.1% 1.1% 0.0% 0.5% 0.0% 0.0% 0.0% 3.8% 0.0% 0.5% 0.0%# 99 97 2 3 88 2 1 5
% 100% 98.0% 2.0% 3.0% 0.0% 88.9% 2.0% 1.0% 0.0% 0.0% 0.0% 0.0% 0.0% 5.1% 0.0% 0.0% 0.0%# 153 153 5 141 4 1 2
% 100% 100.0% 0.0% 3.3% 0.0% 92.2% 0.0% 2.6% 0.0% 0.7% 0.0% 0.0% 0.0% 1.3% 0.0% 0.0% 0.0%# 4 4 1 2 1
% 100% 100.0% 0.0% 25.0% 0.0% 50.0% 0.0% 0.0% 0.0% 0.0% 0.0% 0.0% 0.0% 25.0% 0.0% 0.0% 0.0%#
% - - - - - - - - - - - - - - - - -#
% - - - - - - - - - - - - - - - - -#
% - - - - - - - - - - - - - - - - -#
% - - - - - - - - - - - - - - - - -# 4 4 4
% 100% 100.0% 0.0% 0.0% 0.0% 100.0% 0.0% 0.0% 0.0% 0.0% 0.0% 0.0% 0.0% 0.0% 0.0% 0.0% 0.0%
Grade-01
Grade-02
White Black or African American
Fish & Wildlife Service - Servicewide as of September 30, 2015Table A5NS-1: PARTICIPATION RATES FOR NON-SUPERVISORY WAGE GRADES by Race/Ethnicity and Sex - Permanent Workforce
WD, WG, WL, XD, XL, & XPTOTAL
EMPLOYEES
RACE/ETHNICITY
Hispanic or Latino
Non- Hispanic or Latino
American Indian or Alaska Native
Two or more racesAsian
Native Hawaiian or Other Pacific
Islander
Grade-09
Grade-10
Grade-03
Grade-04
Grade-05
Grade-06
Grade-07
Grade-08
Grade-15
All Other Non-supervisory Wage Grades
Grade-11
Grade-12
Grade-13
Grade-14

All male female male female male female male female male female male female male female male female
# 11 5 6 5 6% 100% 45.5% 54.5% 0.0% 0.0% 45.5% 54.5% 0.0% 0.0% 0.0% 0.0% 0.0% 0.0% 0.0% 0.0% 0.0% 0.0%# 10 8 2 7 2 1
% 100% 80.0% 20.0% 0.0% 0.0% 70.0% 20.0% 0.0% 0.0% 0.0% 0.0% 0.0% 0.0% 10.0% 0.0% 0.0% 0.0%# 15 14 1 13 1 1
% 100% 93.3% 6.7% 0.0% 0.0% 86.7% 6.7% 0.0% 0.0% 0.0% 0.0% 6.7% 0.0% 0.0% 0.0% 0.0% 0.0%# 6 5 1 5 1
% 100% 83.3% 16.7% 0.0% 0.0% 83.3% 0.0% 0.0% 0.0% 0.0% 16.7% 0.0% 0.0% 0.0% 0.0% 0.0% 0.0%# 53 52 1 1 47 1 1 1 2
% 100% 98.1% 1.9% 1.9% 0.0% 88.7% 1.9% 1.9% 0.0% 0.0% 0.0% 1.9% 0.0% 3.8% 0.0% 0.0% 0.0%# 12 12 11 1
% 100% 100.0% 0.0% 0.0% 0.0% 91.7% 0.0% 8.3% 0.0% 0.0% 0.0% 0.0% 0.0% 0.0% 0.0% 0.0% 0.0%# 11 9 2 8 2 1
% 100% 81.8% 18.2% 0.0% 0.0% 72.7% 18.2% 0.0% 0.0% 0.0% 0.0% 0.0% 0.0% 9.1% 0.0% 0.0% 0.0%# 20 18 2 1 16 2 1
% 100% 90.0% 10.0% 5.0% 0.0% 80.0% 10.0% 0.0% 0.0% 0.0% 0.0% 0.0% 0.0% 5.0% 0.0% 0.0% 0.0%# 3 3 3
% 100% 100.0% 0.0% 0.0% 0.0% 100.0% 0.0% 0.0% 0.0% 0.0% 0.0% 0.0% 0.0% 0.0% 0.0% 0.0% 0.0%# 5 5 5
% 100% 100.0% 0.0% 0.0% 0.0% 100.0% 0.0% 0.0% 0.0% 0.0% 0.0% 0.0% 0.0% 0.0% 0.0% 0.0% 0.0%#
% - - - - - - - - - - - - - - - - -#
% - - - - - - - - - - - - - - - - -#
% - - - - - - - - - - - - - - - - -#
% - - - - - - - - - - - - - - - - -#
% - - - - - - - - - - - - - - - - -#
% - - - - - - - - - - - - - - - - -
Grade-07
Grade-08
Grade-15
All Other Non-supervisory Wage Grades
Grade-11
Grade-12
Grade-13
Grade-14
Grade-09
Grade-10
American Indian or Alaska Native
Two or more races
Grade-01
Grade-02
Grade-03
Grade-04
Asian
Native Hawaiian or Other Pacific
Islander
Grade-05
Grade-06
Fish & Wildlife Service - Servicewide as of September 30, 2015Table A5NS-1: PARTICIPATION RATES FOR NON-SUPERVISORY WAGE GRADES by Race/Ethnicity and Sex - Temporary Workforce
WD, WG, WL, XD, XL, & XPTOTAL
EMPLOYEES
RACE/ETHNICITY
Hispanic or Latino
Non- Hispanic or Latino
White Black or African American

All male female male female male female male female male female male female male female male female
# 19 11 8 11 8% 3.2% 1.9% 44.4% 0.0% 0.0% 2.2% 50.0% 0.0% - 0.0% - - - 0.0% 0.0% 0.0% -# 4 3 1 1 1 2
% 0.7% 0.5% 5.6% 0.0% 0.0% 0.2% 6.3% 0.0% - 28.6% - - - 0.0% 0.0% 0.0% -# 3 3 3
% 0.5% 0.5% 0.0% 0.0% 0.0% 0.6% 0.0% 0.0% - 0.0% - - - 0.0% 0.0% 0.0% -# 5 4 1 3 1 1
% 0.8% 0.7% 5.6% 0.0% 0.0% 0.6% 6.3% 0.0% - 0.0% - - - 3.0% 0.0% 0.0% -# 42 41 1 3 29 2 7 1
% 7.1% 7.1% 5.6% 9.4% 0.0% 5.9% 0.0% 18.2% - 0.0% - - - 21.2% 100.0% 0.0% -# 28 27 1 3 16 1 1 2 4 1
% 4.7% 4.7% 5.6% 9.4% 0.0% 3.3% 6.3% 9.1% - 28.6% - - - 12.1% 0.0% 50.0% -# 52 51 1 4 39 1 1 1 6
% 8.7% 8.8% 5.6% 12.5% 0.0% 7.9% 6.3% 9.1% - 14.3% - - - 18.2% 0.0% 0.0% -# 182 179 3 13 1 155 2 2 1 7 1
% 30.6% 31.0% 16.7% 40.6% 100.0% 31.5% 12.5% 18.2% - 14.3% - - - 21.2% 0.0% 50.0% -# 99 97 2 3 88 2 1 5
% 16.6% 16.8% 11.1% 9.4% 0.0% 17.9% 12.5% 9.1% - 0.0% - - - 15.2% 0.0% 0.0% -# 153 153 5 141 4 1 2
% 25.7% 26.5% 0.0% 15.6% 0.0% 28.7% 0.0% 36.4% - 14.3% - - - 6.1% 0.0% 0.0% -# 4 4 1 2 1
% 0.7% 0.7% 0.0% 3.1% 0.0% 0.4% 0.0% 0.0% - 0.0% - - - 3.0% 0.0% 0.0% -#
% 0.0% 0.0% 0.0% 0.0% 0.0% 0.0% 0.0% 0.0% - 0.0% - - - 0.0% 0.0% 0.0% -#
% 0.0% 0.0% 0.0% 0.0% 0.0% 0.0% 0.0% 0.0% - 0.0% - - - 0.0% 0.0% 0.0% -#
% 0.0% 0.0% 0.0% 0.0% 0.0% 0.0% 0.0% 0.0% - 0.0% - - - 0.0% 0.0% 0.0% -#
% 0.0% 0.0% 0.0% 0.0% 0.0% 0.0% 0.0% 0.0% - 0.0% - - - 0.0% 0.0% 0.0% -# 4 4 4
% 0.7% 0.7% 0.0% 0.0% 0.0% 0.8% 0.0% 0.0% - 0.0% - - - 0.0% 0.0% 0.0% -# 595 577 18 32 1 492 16 11 7 33 1 2
% 100% 100% 100% 100% 100% 100% 100% 100% - 100% - - - 100% 100% 100% -
Non- Hispanic or Latino
White Black or African American Asian
Native Hawaiian or Other Pacific
Islander
American Indian or Alaska Native
Two or more races
Grade-01
Total Non-supervisory Wage Grades
Fish & Wildlife Service - Servicewide as of September 30, 2015Table A5NS-2: PARTICIPATION RATES FOR NON-SUPERVISORY WAGE GRADES by Race/Ethnicity and Sex - Permanent Workforce
WD, WG, WL, XD, XL, & XPTOTAL
EMPLOYEES
RACE/ETHNICITY
Hispanic or Latino
Grade-06
Grade-07
Grade-08
Grade-09
Grade-02
Grade-03
Grade-04
Grade-05
Grade-10
Grade-15
All Other Non-supervisory Wage Grades
Grade-11
Grade-12
Grade-13
Grade-14

All male female male female male female male female male female male female male female male female
# 11 5 6 5 6% 7.5% 3.8% 40.0% 0.0% - 4.2% 42.9% 0.0% - - 0.0% 0.0% - 0.0% - - -# 10 8 2 7 2 1
% 6.8% 6.1% 13.3% 0.0% - 5.8% 14.3% 0.0% - - 0.0% 0.0% - 20.0% - - -# 15 14 1 13 1 1
% 10.3% 10.7% 6.7% 0.0% - 10.8% 7.1% 0.0% - - 0.0% 50.0% - 0.0% - - -# 6 5 1 5 1
% 4.1% 3.8% 6.7% 0.0% - 4.2% 0.0% 0.0% - - 100.0% 0.0% - 0.0% - - -# 53 52 1 1 47 1 1 1 2
% 36.3% 39.7% 6.7% 50.0% - 39.2% 7.1% 50.0% - - 0.0% 50.0% - 40.0% - - -# 12 12 11 1
% 8.2% 9.2% 0.0% 0.0% - 9.2% 0.0% 50.0% - - 0.0% 0.0% - 0.0% - - -# 11 9 2 8 2 1
% 7.5% 6.9% 13.3% 0.0% - 6.7% 14.3% 0.0% - - 0.0% 0.0% - 20.0% - - -# 20 18 2 1 16 2 1
% 13.7% 13.7% 13.3% 50.0% - 13.3% 14.3% 0.0% - - 0.0% 0.0% - 20.0% - - -# 3 3 3
% 2.1% 2.3% 0.0% 0.0% - 2.5% 0.0% 0.0% - - 0.0% 0.0% - 0.0% - - -# 5 5 5
% 3.4% 3.8% 0.0% 0.0% - 4.2% 0.0% 0.0% - - 0.0% 0.0% - 0.0% - - -#
% 0.0% 0.0% 0.0% 0.0% - 0.0% 0.0% 0.0% - - 0.0% 0.0% - 0.0% - - -#
% 0.0% 0.0% 0.0% 0.0% - 0.0% 0.0% 0.0% - - 0.0% 0.0% - 0.0% - - -#
% 0.0% 0.0% 0.0% 0.0% - 0.0% 0.0% 0.0% - - 0.0% 0.0% - 0.0% - - -#
% 0.0% 0.0% 0.0% 0.0% - 0.0% 0.0% 0.0% - - 0.0% 0.0% - 0.0% - - -#
% 0.0% 0.0% 0.0% 0.0% - 0.0% 0.0% 0.0% - - 0.0% 0.0% - 0.0% - - -#
% 0.0% 0.0% 0.0% 0.0% - 0.0% 0.0% 0.0% - - 0.0% 0.0% - 0.0% - - -# 146 131 15 2 120 14 2 1 2 5
% 100% 100% 100% 100% - 100% 100% 100% - - 100% 100% - 100% - - -
All Other Non-supervisory Wage Grades
Grade-11
Grade-12
Grade-13
Grade-14
Grade-04
Grade-05
Grade-06
Grade-07
Grade-10
Grade-15
Grade-02
Grade-03
Total Non-supervisory Wage Grades
Fish & Wildlife Service - Servicewide as of September 30, 2015Table A5NS-2: PARTICIPATION RATES FOR NON-SUPERVISORY WAGE GRADES by Race/Ethnicity and Sex - Temporary Workforce
WD, WG, WL, XD, XL, & XPTOTAL
EMPLOYEES
RACE/ETHNICITY
Hispanic or Latino
Grade-08
Grade-09
Non- Hispanic or Latino
White Black or African American Asian Two or more
races
Grade-01
Native Hawaiian or Other Pacific
Islander
American Indian or Alaska Native
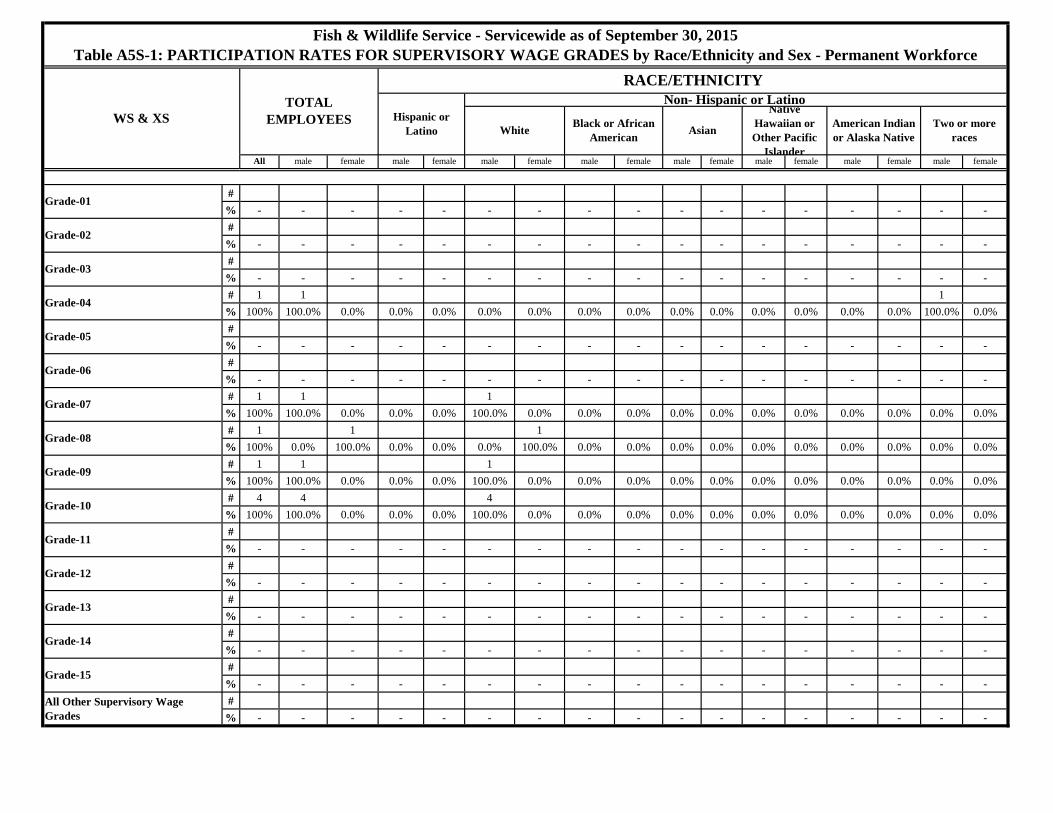
All male female male female male female male female male female male female male female male female
#% - - - - - - - - - - - - - - - - -#
% - - - - - - - - - - - - - - - - -#
% - - - - - - - - - - - - - - - - -# 1 1 1
% 100% 100.0% 0.0% 0.0% 0.0% 0.0% 0.0% 0.0% 0.0% 0.0% 0.0% 0.0% 0.0% 0.0% 0.0% 100.0% 0.0%#
% - - - - - - - - - - - - - - - - -#
% - - - - - - - - - - - - - - - - -# 1 1 1
% 100% 100.0% 0.0% 0.0% 0.0% 100.0% 0.0% 0.0% 0.0% 0.0% 0.0% 0.0% 0.0% 0.0% 0.0% 0.0% 0.0%# 1 1 1
% 100% 0.0% 100.0% 0.0% 0.0% 0.0% 100.0% 0.0% 0.0% 0.0% 0.0% 0.0% 0.0% 0.0% 0.0% 0.0% 0.0%# 1 1 1
% 100% 100.0% 0.0% 0.0% 0.0% 100.0% 0.0% 0.0% 0.0% 0.0% 0.0% 0.0% 0.0% 0.0% 0.0% 0.0% 0.0%# 4 4 4
% 100% 100.0% 0.0% 0.0% 0.0% 100.0% 0.0% 0.0% 0.0% 0.0% 0.0% 0.0% 0.0% 0.0% 0.0% 0.0% 0.0%#
% - - - - - - - - - - - - - - - - -#
% - - - - - - - - - - - - - - - - -#
% - - - - - - - - - - - - - - - - -#
% - - - - - - - - - - - - - - - - -#
% - - - - - - - - - - - - - - - - -#
% - - - - - - - - - - - - - - - - -
Grade-01
Grade-02
White Black or African American
Fish & Wildlife Service - Servicewide as of September 30, 2015Table A5S-1: PARTICIPATION RATES FOR SUPERVISORY WAGE GRADES by Race/Ethnicity and Sex - Permanent Workforce
WS & XSTOTAL
EMPLOYEES
RACE/ETHNICITY
Hispanic or Latino
Non- Hispanic or Latino
American Indian or Alaska Native
Two or more racesAsian
Native Hawaiian or Other Pacific
Islander
Grade-09
Grade-10
Grade-03
Grade-04
Grade-05
Grade-06
Grade-07
Grade-08
Grade-15
All Other Supervisory Wage Grades
Grade-11
Grade-12
Grade-13
Grade-14

All male female male female male female male female male female male female male female male female
#% - - - - - - - - - - - - - - - - -#
% - - - - - - - - - - - - - - - - -#
% - - - - - - - - - - - - - - - - -#
% - - - - - - - - - - - - - - - - -#
% - - - - - - - - - - - - - - - - -#
% - - - - - - - - - - - - - - - - -#
% - - - - - - - - - - - - - - - - -#
% - - - - - - - - - - - - - - - - -#
% - - - - - - - - - - - - - - - - -#
% - - - - - - - - - - - - - - - - -#
% - - - - - - - - - - - - - - - - -#
% - - - - - - - - - - - - - - - - -#
% - - - - - - - - - - - - - - - - -#
% - - - - - - - - - - - - - - - - -#
% - - - - - - - - - - - - - - - - -#
% - - - - - - - - - - - - - - - - -
Grade-07
Grade-08
Grade-15
All Other Supervisory Wage Grades
Grade-11
Grade-12
Grade-13
Grade-14
Grade-09
Grade-10
American Indian or Alaska Native
Two or more races
Grade-01
Grade-02
Grade-03
Grade-04
Asian
Native Hawaiian or Other Pacific
Islander
Grade-05
Grade-06
Fish & Wildlife Service - Servicewide as of September 30, 2015Table A5S-1: PARTICIPATION RATES FOR SUPERVISORY WAGE GRADES by Race/Ethnicity and Sex - Temporary Workforce
WS & XSTOTAL
EMPLOYEES
RACE/ETHNICITY
Hispanic or Latino
Non- Hispanic or Latino
White Black or African American

All male female male female male female male female male female male female male female male female
#% 0.0% 0.0% 0.0% - - 0.0% 0.0% - - - - - - - - 0.0% -#
% 0.0% 0.0% 0.0% - - 0.0% 0.0% - - - - - - - - 0.0% -#
% 0.0% 0.0% 0.0% - - 0.0% 0.0% - - - - - - - - 0.0% -# 1 1 1
% 12.5% 14.3% 0.0% - - 0.0% 0.0% - - - - - - - - 100.0% -#
% 0.0% 0.0% 0.0% - - 0.0% 0.0% - - - - - - - - 0.0% -#
% 0.0% 0.0% 0.0% - - 0.0% 0.0% - - - - - - - - 0.0% -# 1 1 1
% 12.5% 14.3% 0.0% - - 16.7% 0.0% - - - - - - - - 0.0% -# 1 1 1
% 12.5% 0.0% 100.0% - - 0.0% 100.0% - - - - - - - - 0.0% -# 1 1 1
% 12.5% 14.3% 0.0% - - 16.7% 0.0% - - - - - - - - 0.0% -# 4 4 4
% 50.0% 57.1% 0.0% - - 66.7% 0.0% - - - - - - - - 0.0% -#
% 0.0% 0.0% 0.0% - - 0.0% 0.0% - - - - - - - - 0.0% -#
% 0.0% 0.0% 0.0% - - 0.0% 0.0% - - - - - - - - 0.0% -#
% 0.0% 0.0% 0.0% - - 0.0% 0.0% - - - - - - - - 0.0% -#
% 0.0% 0.0% 0.0% - - 0.0% 0.0% - - - - - - - - 0.0% -#
% 0.0% 0.0% 0.0% - - 0.0% 0.0% - - - - - - - - 0.0% -#
% 0.0% 0.0% 0.0% - - 0.0% 0.0% - - - - - - - - 0.0% -# 8 7 1 6 1 1
% 100% 100% 100% - - 100% 100% - - - - - - - - 100% -
All Other Supervisory Wage Grades
Grade-11
Grade-12
Grade-13
Grade-14
Grade-04
Grade-05
Grade-06
Grade-07
Grade-10
Grade-15
Grade-02
Grade-03
Total Supervisory Wage Grades
Fish & Wildlife Service - Servicewide as of September 30, 2015Table A5S-2: PARTICIPATION RATES FOR SUPERVISORY WAGE GRADES by Race/Ethnicity and Sex - Permanent Workforce
WS & XSTOTAL
EMPLOYEES
RACE/ETHNICITY
Hispanic or Latino
Grade-08
Grade-09
Non- Hispanic or Latino
White Black or African American Asian Two or more
races
Grade-01
Native Hawaiian or Other Pacific
Islander
American Indian or Alaska Native

All male female male female male female male female male female male female male female male female
#% - - - - - - - - - - - - - - - - -#
% - - - - - - - - - - - - - - - - -#
% - - - - - - - - - - - - - - - - -#
% - - - - - - - - - - - - - - - - -#
% - - - - - - - - - - - - - - - - -#
% - - - - - - - - - - - - - - - - -#
% - - - - - - - - - - - - - - - - -#
% - - - - - - - - - - - - - - - - -#
% - - - - - - - - - - - - - - - - -#
% - - - - - - - - - - - - - - - - -#
% - - - - - - - - - - - - - - - - -#
% - - - - - - - - - - - - - - - - -#
% - - - - - - - - - - - - - - - - -#
% - - - - - - - - - - - - - - - - -#
% - - - - - - - - - - - - - - - - -#
% - - - - - - - - - - - - - - - - -#
% - - - - - - - - - - - - - - - - -
Non- Hispanic or Latino
White Black or African American Asian
Native Hawaiian or Other Pacific
Islander
American Indian or Alaska Native
Two or more races
Grade-01
Total Supervisory Wage Grades
Fish & Wildlife Service - Servicewide as of September 30, 2015Table A5S-2: PARTICIPATION RATES FOR SUPERVISORY WAGE GRADES by Race/Ethnicity and Sex - Temporary Workforce
WS & XSTOTAL
EMPLOYEES
RACE/ETHNICITY
Hispanic or Latino
Grade-06
Grade-07
Grade-08
Grade-09
Grade-02
Grade-03
Grade-04
Grade-05
Grade-10
Grade-15
All Other Supervisory Wage Grades
Grade-11
Grade-12
Grade-13
Grade-14
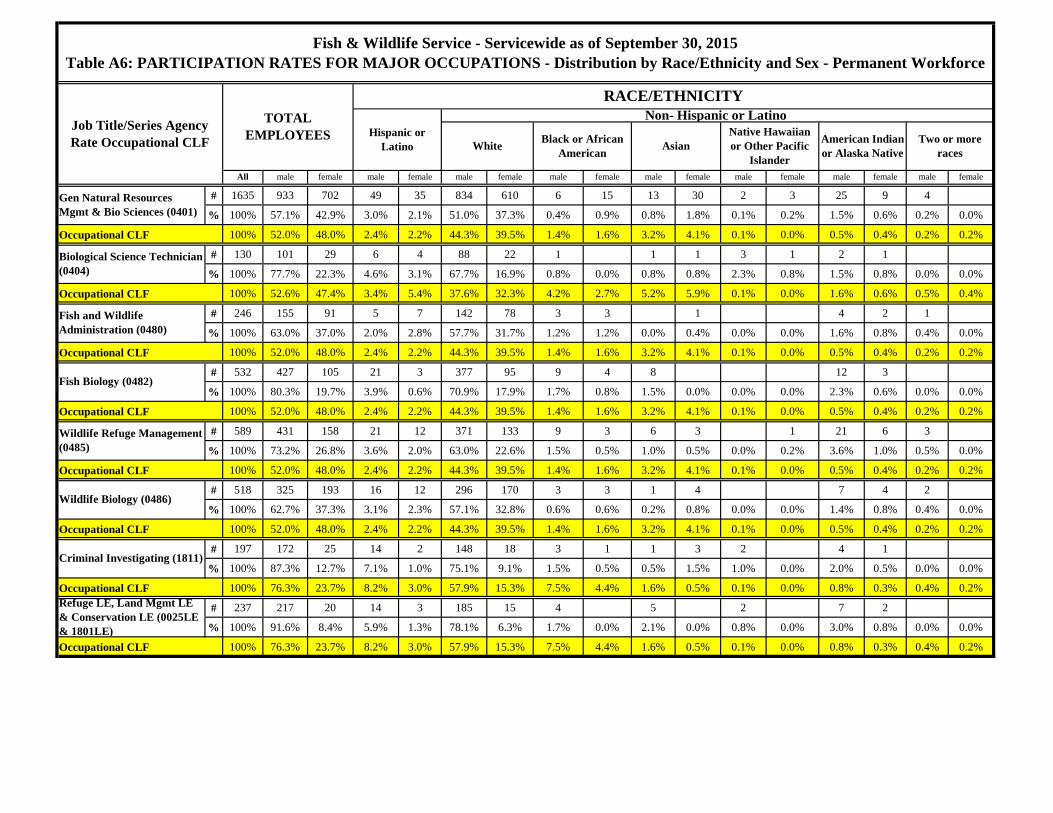
All male female male female male female male female male female male female male female male female
# 1635 933 702 49 35 834 610 6 15 13 30 2 3 25 9 4
% 100% 57.1% 42.9% 3.0% 2.1% 51.0% 37.3% 0.4% 0.9% 0.8% 1.8% 0.1% 0.2% 1.5% 0.6% 0.2% 0.0%
Occupational CLF 100% 52.0% 48.0% 2.4% 2.2% 44.3% 39.5% 1.4% 1.6% 3.2% 4.1% 0.1% 0.0% 0.5% 0.4% 0.2% 0.2%
# 130 101 29 6 4 88 22 1 1 1 3 1 2 1
% 100% 77.7% 22.3% 4.6% 3.1% 67.7% 16.9% 0.8% 0.0% 0.8% 0.8% 2.3% 0.8% 1.5% 0.8% 0.0% 0.0%
Occupational CLF 100% 52.6% 47.4% 3.4% 5.4% 37.6% 32.3% 4.2% 2.7% 5.2% 5.9% 0.1% 0.0% 1.6% 0.6% 0.5% 0.4%
# 246 155 91 5 7 142 78 3 3 1 4 2 1
% 100% 63.0% 37.0% 2.0% 2.8% 57.7% 31.7% 1.2% 1.2% 0.0% 0.4% 0.0% 0.0% 1.6% 0.8% 0.4% 0.0%
Occupational CLF 100% 52.0% 48.0% 2.4% 2.2% 44.3% 39.5% 1.4% 1.6% 3.2% 4.1% 0.1% 0.0% 0.5% 0.4% 0.2% 0.2%
# 532 427 105 21 3 377 95 9 4 8 12 3
% 100% 80.3% 19.7% 3.9% 0.6% 70.9% 17.9% 1.7% 0.8% 1.5% 0.0% 0.0% 0.0% 2.3% 0.6% 0.0% 0.0%
Occupational CLF 100% 52.0% 48.0% 2.4% 2.2% 44.3% 39.5% 1.4% 1.6% 3.2% 4.1% 0.1% 0.0% 0.5% 0.4% 0.2% 0.2%
# 589 431 158 21 12 371 133 9 3 6 3 1 21 6 3
% 100% 73.2% 26.8% 3.6% 2.0% 63.0% 22.6% 1.5% 0.5% 1.0% 0.5% 0.0% 0.2% 3.6% 1.0% 0.5% 0.0%
Occupational CLF 100% 52.0% 48.0% 2.4% 2.2% 44.3% 39.5% 1.4% 1.6% 3.2% 4.1% 0.1% 0.0% 0.5% 0.4% 0.2% 0.2%
# 518 325 193 16 12 296 170 3 3 1 4 7 4 2
% 100% 62.7% 37.3% 3.1% 2.3% 57.1% 32.8% 0.6% 0.6% 0.2% 0.8% 0.0% 0.0% 1.4% 0.8% 0.4% 0.0%
Occupational CLF 100% 52.0% 48.0% 2.4% 2.2% 44.3% 39.5% 1.4% 1.6% 3.2% 4.1% 0.1% 0.0% 0.5% 0.4% 0.2% 0.2%
# 197 172 25 14 2 148 18 3 1 1 3 2 4 1
% 100% 87.3% 12.7% 7.1% 1.0% 75.1% 9.1% 1.5% 0.5% 0.5% 1.5% 1.0% 0.0% 2.0% 0.5% 0.0% 0.0%
Occupational CLF 100% 76.3% 23.7% 8.2% 3.0% 57.9% 15.3% 7.5% 4.4% 1.6% 0.5% 0.1% 0.0% 0.8% 0.3% 0.4% 0.2%
# 237 217 20 14 3 185 15 4 5 2 7 2
% 100% 91.6% 8.4% 5.9% 1.3% 78.1% 6.3% 1.7% 0.0% 2.1% 0.0% 0.8% 0.0% 3.0% 0.8% 0.0% 0.0%
Occupational CLF 100% 76.3% 23.7% 8.2% 3.0% 57.9% 15.3% 7.5% 4.4% 1.6% 0.5% 0.1% 0.0% 0.8% 0.3% 0.4% 0.2%
Fish & Wildlife Service - Servicewide as of September 30, 2015Table A6: PARTICIPATION RATES FOR MAJOR OCCUPATIONS - Distribution by Race/Ethnicity and Sex - Permanent Workforce
Job Title/Series Agency Rate Occupational CLF
TOTAL EMPLOYEES
RACE/ETHNICITY
Hispanic or Latino
Non- Hispanic or Latino
American Indian or Alaska Native
Two or more racesAsian
Native Hawaiian or Other Pacific
IslanderWhite Black or African
American
Wildlife Refuge Management (0485)
Wildlife Biology (0486)
Criminal Investigating (1811)
Refuge LE, Land Mgmt LE & Conservation LE (0025LE & 1801LE)
Fish and Wildlife Administration (0480)
Fish Biology (0482)
Gen Natural Resources Mgmt & Bio Sciences (0401)
Biological Science Technician (0404)
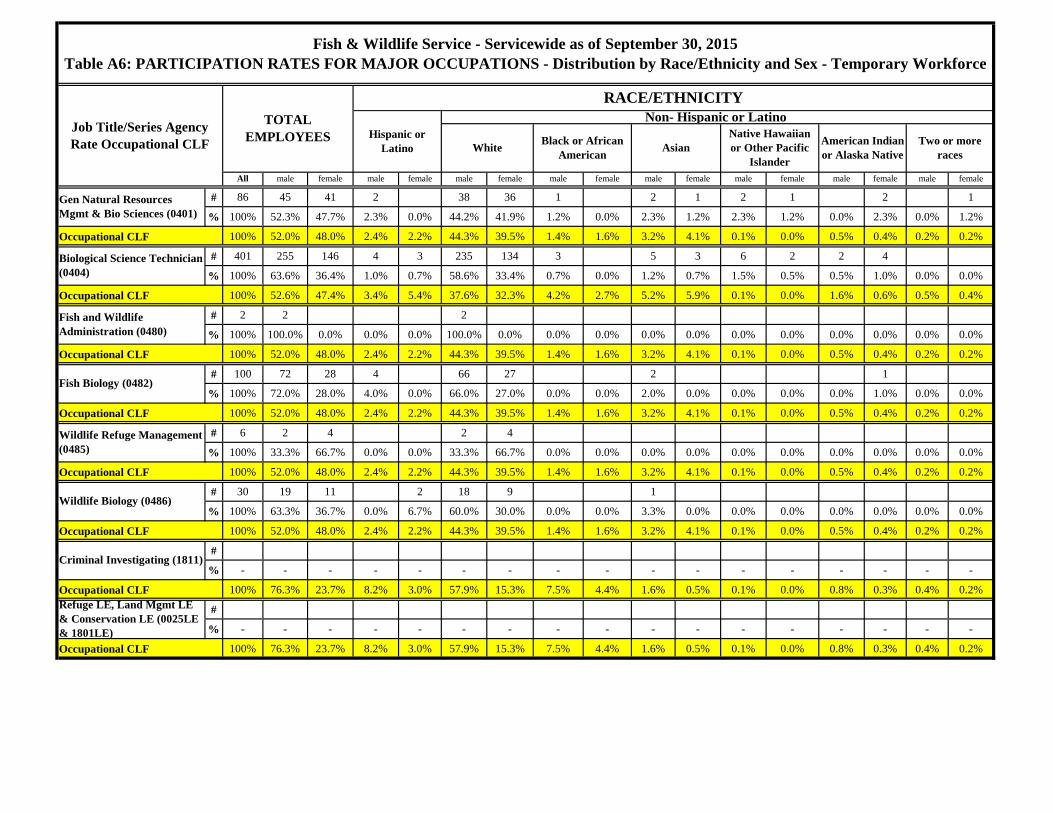
All male female male female male female male female male female male female male female male female
# 86 45 41 2 38 36 1 2 1 2 1 2 1
% 100% 52.3% 47.7% 2.3% 0.0% 44.2% 41.9% 1.2% 0.0% 2.3% 1.2% 2.3% 1.2% 0.0% 2.3% 0.0% 1.2%
Occupational CLF 100% 52.0% 48.0% 2.4% 2.2% 44.3% 39.5% 1.4% 1.6% 3.2% 4.1% 0.1% 0.0% 0.5% 0.4% 0.2% 0.2%
# 401 255 146 4 3 235 134 3 5 3 6 2 2 4
% 100% 63.6% 36.4% 1.0% 0.7% 58.6% 33.4% 0.7% 0.0% 1.2% 0.7% 1.5% 0.5% 0.5% 1.0% 0.0% 0.0%
Occupational CLF 100% 52.6% 47.4% 3.4% 5.4% 37.6% 32.3% 4.2% 2.7% 5.2% 5.9% 0.1% 0.0% 1.6% 0.6% 0.5% 0.4%
# 2 2 2
% 100% 100.0% 0.0% 0.0% 0.0% 100.0% 0.0% 0.0% 0.0% 0.0% 0.0% 0.0% 0.0% 0.0% 0.0% 0.0% 0.0%
Occupational CLF 100% 52.0% 48.0% 2.4% 2.2% 44.3% 39.5% 1.4% 1.6% 3.2% 4.1% 0.1% 0.0% 0.5% 0.4% 0.2% 0.2%
# 100 72 28 4 66 27 2 1
% 100% 72.0% 28.0% 4.0% 0.0% 66.0% 27.0% 0.0% 0.0% 2.0% 0.0% 0.0% 0.0% 0.0% 1.0% 0.0% 0.0%
Occupational CLF 100% 52.0% 48.0% 2.4% 2.2% 44.3% 39.5% 1.4% 1.6% 3.2% 4.1% 0.1% 0.0% 0.5% 0.4% 0.2% 0.2%
# 6 2 4 2 4
% 100% 33.3% 66.7% 0.0% 0.0% 33.3% 66.7% 0.0% 0.0% 0.0% 0.0% 0.0% 0.0% 0.0% 0.0% 0.0% 0.0%
Occupational CLF 100% 52.0% 48.0% 2.4% 2.2% 44.3% 39.5% 1.4% 1.6% 3.2% 4.1% 0.1% 0.0% 0.5% 0.4% 0.2% 0.2%
# 30 19 11 2 18 9 1
% 100% 63.3% 36.7% 0.0% 6.7% 60.0% 30.0% 0.0% 0.0% 3.3% 0.0% 0.0% 0.0% 0.0% 0.0% 0.0% 0.0%
Occupational CLF 100% 52.0% 48.0% 2.4% 2.2% 44.3% 39.5% 1.4% 1.6% 3.2% 4.1% 0.1% 0.0% 0.5% 0.4% 0.2% 0.2%
#
% - - - - - - - - - - - - - - - - -
Occupational CLF 100% 76.3% 23.7% 8.2% 3.0% 57.9% 15.3% 7.5% 4.4% 1.6% 0.5% 0.1% 0.0% 0.8% 0.3% 0.4% 0.2%
#
% - - - - - - - - - - - - - - - - -
Occupational CLF 100% 76.3% 23.7% 8.2% 3.0% 57.9% 15.3% 7.5% 4.4% 1.6% 0.5% 0.1% 0.0% 0.8% 0.3% 0.4% 0.2%
Wildlife Refuge Management (0485)
Wildlife Biology (0486)
Gen Natural Resources Mgmt & Bio Sciences (0401)
Biological Science Technician (0404)
AsianNative Hawaiian or Other Pacific
Islander
American Indian or Alaska Native
Two or more races
Fish and Wildlife Administration (0480)
Fish Biology (0482)
Criminal Investigating (1811)
Refuge LE, Land Mgmt LE & Conservation LE (0025LE & 1801LE)
Fish & Wildlife Service - Servicewide as of September 30, 2015Table A6: PARTICIPATION RATES FOR MAJOR OCCUPATIONS - Distribution by Race/Ethnicity and Sex - Temporary Workforce
Job Title/Series Agency Rate Occupational CLF
TOTAL EMPLOYEES
RACE/ETHNICITY
Hispanic or Latino
Non- Hispanic or Latino
White Black or African American

All male female male female male female male female male female male female male female male female
# 55 25 30 1 1 23 26 2 1 1
% 100% 45.5% 54.5% 1.8% 1.8% 41.8% 47.3% 0.0% 0.0% 0.0% 3.6% 0.0% 1.8% 1.8% 0.0% 0.0% 0.0%
# 42 21 21 21 18 1 2
% 100% 50.0% 50.0% 0.0% 0.0% 50.0% 42.9% 0.0% 2.4% 0.0% 4.8% 0.0% 0.0% 0.0% 0.0% 0.0% 0.0%
# 97 46 51 1 1 44 44 1 4 1 1
% 100% 47.4% 52.6% 1.0% 1.0% 45.4% 45.4% 0.0% 1.0% 0.0% 4.1% 0.0% 1.0% 1.0% 0.0% 0.0% 0.0%
Occupational CLF 100% 52.0% 48.0% 2.4% 2.2% 44.3% 39.5% 1.4% 1.6% 3.2% 4.1% 0.1% 0.0% 0.5% 0.4% 0.2% 0.2%
# 19 8 11 1 6 7 2 2 1
% 100% 42.1% 57.9% 5.3% 0.0% 31.6% 36.8% 0.0% 10.5% 0.0% 10.5% 0.0% 0.0% 5.3% 0.0% 0.0% 0.0%
# 9 6 3 6 3
% 100% 66.7% 33.3% 0.0% 0.0% 66.7% 33.3% 0.0% 0.0% 0.0% 0.0% 0.0% 0.0% 0.0% 0.0% 0.0% 0.0%
# 17 11 6 1 1 7 4 3 1
% 100% 64.7% 35.3% 5.9% 5.9% 41.2% 23.5% 0.0% 0.0% 0.0% 0.0% 17.6% 5.9% 0.0% 0.0% 0.0% 0.0%
# 26 17 9 1 1 13 7 3 1
% 100% 65.4% 34.6% 3.8% 3.8% 50.0% 26.9% 0.0% 0.0% 0.0% 0.0% 11.5% 3.8% 0.0% 0.0% 0.0% 0.0%
Occupational CLF 100% 52.6% 47.4% 3.4% 5.4% 37.6% 32.3% 4.2% 2.7% 5.2% 5.9% 0.1% 0.0% 1.6% 0.6% 0.5% 0.4%
# 2 2 2
% 100% 100.0% 0.0% 0.0% 0.0% 100.0% 0.0% 0.0% 0.0% 0.0% 0.0% 0.0% 0.0% 0.0% 0.0% 0.0% 0.0%
# 9 8 1 8 1
% 100% 88.9% 11.1% 0.0% 0.0% 88.9% 0.0% 0.0% 0.0% 0.0% 0.0% 0.0% 0.0% 0.0% 11.1% 0.0% 0.0%
#
% - - - - - - - - - - - - - - - - -
# 9 8 1 8 1
% 100% 88.9% 11.1% 0.0% 0.0% 88.9% 0.0% 0.0% 0.0% 0.0% 0.0% 0.0% 0.0% 0.0% 11.1% 0.0% 0.0%
Occupational CLF 100% 52.0% 48.0% 2.4% 2.2% 44.3% 39.5% 1.4% 1.6% 3.2% 4.1% 0.1% 0.0% 0.5% 0.4% 0.2% 0.2%
#
% - - - - - - - - - - - - - - - - -From Pathways Intern
Total Hires
Total Hires
Native Hawaiian or Other Pacific
Islander
American Indian or Alaska Native
Two or more races
Accessions
From Temporary
Fish & Wildlife Service - Servicewide FY2015Table A7-Alt: HIRES FOR MAJOR OCCUPATIONS by Race/Ethnicity and Sex - Permanent Workforce (1 of 3 pages)
Job Title/Series Agency Rate Occupational CLF
TOTAL EMPLOYEES
RACE/ETHNICITY
Hispanic or Latino
Fish and Wildlife Administration (0480)
Accessions
From Temporary
Total Hires
Non- Hispanic or Latino
White Black or African American Asian
From Pathways Intern
Biological Science Technician (0404)
Accessions
From Temporary
From Pathways Intern
General Natural Resources Management and Biological Sciences (0401)

All male female male female male female male female male female male female male female male female
Native Hawaiian or Other Pacific
Islander
American Indian or Alaska Native
Two or more races
Fish & Wildlife Service - Servicewide FY2015Table A7-Alt: HIRES FOR MAJOR OCCUPATIONS by Race/Ethnicity and Sex - Permanent Workforce (2 of 3 pages)
Job Title/Series Agency Rate Occupational CLF
TOTAL EMPLOYEES
RACE/ETHNICITY
Hispanic or Latino
Non- Hispanic or Latino
White Black or African American Asian
# 8 6 2 5 2 1
% 100% 75.0% 25.0% 0.0% 0.0% 62.5% 25.0% 0.0% 0.0% 0.0% 0.0% 0.0% 0.0% 12.5% 0.0% 0.0% 0.0%
# 13 10 3 10 3
% 100% 76.9% 23.1% 0.0% 0.0% 76.9% 23.1% 0.0% 0.0% 0.0% 0.0% 0.0% 0.0% 0.0% 0.0% 0.0% 0.0%
# 21 16 5 15 5 1
% 100% 76.2% 23.8% 0.0% 0.0% 71.4% 23.8% 0.0% 0.0% 0.0% 0.0% 0.0% 0.0% 4.8% 0.0% 0.0% 0.0%
Occupational CLF 100% 52.0% 48.0% 2.4% 2.2% 44.3% 39.5% 1.4% 1.6% 3.2% 4.1% 0.1% 0.0% 0.5% 0.4% 0.2% 0.2%
# 2 1 1 1 1
% 100% 50.0% 50.0% 0.0% 0.0% 50.0% 50.0% 0.0% 0.0% 0.0% 0.0% 0.0% 0.0% 0.0% 0.0% 0.0% 0.0%
# 10 9 1 9 1
% 100% 90.0% 10.0% 0.0% 0.0% 90.0% 10.0% 0.0% 0.0% 0.0% 0.0% 0.0% 0.0% 0.0% 0.0% 0.0% 0.0%
# 3 2 1 2 1
% 100% 66.7% 33.3% 0.0% 0.0% 66.7% 33.3% 0.0% 0.0% 0.0% 0.0% 0.0% 0.0% 0.0% 0.0% 0.0% 0.0%
# 13 11 2 11 2
% 100% 84.6% 15.4% 0.0% 0.0% 84.6% 15.4% 0.0% 0.0% 0.0% 0.0% 0.0% 0.0% 0.0% 0.0% 0.0% 0.0%
Occupational CLF 100% 52.0% 48.0% 2.4% 2.2% 44.3% 39.5% 1.4% 1.6% 3.2% 4.1% 0.1% 0.0% 0.5% 0.4% 0.2% 0.2%
# 7 4 3 1 1 3 2
% 100% 57.1% 42.9% 14.3% 0.0% 14.3% 42.9% 0.0% 0.0% 0.0% 0.0% 0.0% 0.0% 28.6% 0.0% 0.0% 0.0%
# 19 12 7 1 12 5 1
% 100% 63.2% 36.8% 0.0% 5.3% 63.2% 26.3% 0.0% 5.3% 0.0% 0.0% 0.0% 0.0% 0.0% 0.0% 0.0% 0.0%
# 4 4 4
% 100% 100.0% 0.0% 0.0% 0.0% 100.0% 0.0% 0.0% 0.0% 0.0% 0.0% 0.0% 0.0% 0.0% 0.0% 0.0% 0.0%
# 23 16 7 1 16 5 1
% 100% 69.6% 30.4% 0.0% 4.3% 69.6% 21.7% 0.0% 4.3% 0.0% 0.0% 0.0% 0.0% 0.0% 0.0% 0.0% 0.0%
Occupational CLF 100% 52.0% 48.0% 2.4% 2.2% 44.3% 39.5% 1.4% 1.6% 3.2% 4.1% 0.1% 0.0% 0.5% 0.4% 0.2% 0.2%
# 6 3 3 3 3
% 100% 50.0% 50.0% 0.0% 0.0% 50.0% 50.0% 0.0% 0.0% 0.0% 0.0% 0.0% 0.0% 0.0% 0.0% 0.0% 0.0%
Total Hires
Accessions
Fish Biology (0482)
From Temporary
From Pathways Intern
Total Hires
From Temporary
From Pathways Intern
Wildlife Biology (0486)
From Temporary
Accessions
Total Hires
From Pathways Intern
Wildlife Refuge Management (0485)
Accessions

All male female male female male female male female male female male female male female male female
Native Hawaiian or Other Pacific
Islander
American Indian or Alaska Native
Two or more races
Fish & Wildlife Service - Servicewide FY2015Table A7-Alt: HIRES FOR MAJOR OCCUPATIONS by Race/Ethnicity and Sex - Permanent Workforce (3 of 3 pages)
Job Title/Series Agency Rate Occupational CLF
TOTAL EMPLOYEES
RACE/ETHNICITY
Hispanic or Latino
Non- Hispanic or Latino
White Black or African American Asian
# 4 4 4
% 100% 100.0% 0.0% 0.0% 0.0% 100.0% 0.0% 0.0% 0.0% 0.0% 0.0% 0.0% 0.0% 0.0% 0.0% 0.0% 0.0%
#
% - - - - - - - - - - - - - - - - -
# 4 4 4
% 100% 100.0% 0.0% 0.0% 0.0% 100.0% 0.0% 0.0% 0.0% 0.0% 0.0% 0.0% 0.0% 0.0% 0.0% 0.0% 0.0%
Occupational CLF 100% 76.3% 23.7% 8.2% 3.0% 57.9% 15.3% 7.5% 4.4% 1.6% 0.5% 0.1% 0.0% 0.8% 0.3% 0.4% 0.2%
#
% - - - - - - - - - - - - - - - - -
# 5 5 4 1
% 100% 100.0% 0.0% 0.0% 0.0% 80.0% 0.0% 20.0% 0.0% 0.0% 0.0% 0.0% 0.0% 0.0% 0.0% 0.0% 0.0%
#
% - - - - - - - - - - - - - - - - -
# 5 5 4 1
% 100% 100.0% 0.0% 0.0% 0.0% 80.0% 0.0% 20.0% 0.0% 0.0% 0.0% 0.0% 0.0% 0.0% 0.0% 0.0% 0.0%
Occupational CLF 100% 76.3% 23.7% 8.2% 3.0% 57.9% 15.3% 7.5% 4.4% 1.6% 0.5% 0.1% 0.0% 0.8% 0.3% 0.4% 0.2%
#
% - - - - - - - - - - - - - - - - -
Total Hires
Accessions
From Temporary
From Pathways Intern
Land Management LE & Conservation LE (0025LE & 1801LE)
Criminal Investigating (1811)
Total Hires
From Pathways Intern
Accessions
From Temporary

All male female male female male female male female male female male female male female male female
# 25 11 14 10 12 1 2
% 100% 44.0% 56.0% 0.0% 0.0% 40.0% 48.0% 4.0% 0.0% 0.0% 0.0% 0.0% 0.0% 0.0% 8.0% 0.0% 0.0%
Occupational CLF 100% 52.0% 48.0% 2.4% 2.2% 44.3% 39.5% 1.4% 1.6% 3.2% 4.1% 0.1% 0.0% 0.5% 0.4% 0.2% 0.2%
# 359 215 144 3 4 197 129 1 1 6 3 4 1 4 5 1
% 100% 59.9% 40.1% 0.8% 1.1% 54.9% 35.9% 0.3% 0.3% 1.7% 0.8% 1.1% 0.3% 1.1% 1.4% 0.0% 0.3%
Occupational CLF 100% 52.6% 47.4% 3.4% 5.4% 37.6% 32.3% 4.2% 2.7% 5.2% 5.9% 0.1% 0.0% 1.6% 0.6% 0.5% 0.4%
# 1 1 1
% 100% 100.0% 0.0% 0.0% 0.0% 100.0% 0.0% 0.0% 0.0% 0.0% 0.0% 0.0% 0.0% 0.0% 0.0% 0.0% 0.0%
Occupational CLF 100% 52.0% 48.0% 2.4% 2.2% 44.3% 39.5% 1.4% 1.6% 3.2% 4.1% 0.1% 0.0% 0.5% 0.4% 0.2% 0.2%
# 27 17 10 1 16 10
% 100% 63.0% 37.0% 3.7% 0.0% 59.3% 37.0% 0.0% 0.0% 0.0% 0.0% 0.0% 0.0% 0.0% 0.0% 0.0% 0.0%
Occupational CLF 100% 52.0% 48.0% 2.4% 2.2% 44.3% 39.5% 1.4% 1.6% 3.2% 4.1% 0.1% 0.0% 0.5% 0.4% 0.2% 0.2%
# 2 2 2
% 100% 0.0% 100.0% 0.0% 0.0% 0.0% 100.0% 0.0% 0.0% 0.0% 0.0% 0.0% 0.0% 0.0% 0.0% 0.0% 0.0%
Occupational CLF 100% 52.0% 48.0% 2.4% 2.2% 44.3% 39.5% 1.4% 1.6% 3.2% 4.1% 0.1% 0.0% 0.5% 0.4% 0.2% 0.2%
# 7 3 4 3 4
% 100% 42.9% 57.1% 0.0% 0.0% 42.9% 57.1% 0.0% 0.0% 0.0% 0.0% 0.0% 0.0% 0.0% 0.0% 0.0% 0.0%
Occupational CLF 100% 52.0% 48.0% 2.4% 2.2% 44.3% 39.5% 1.4% 1.6% 3.2% 4.1% 0.1% 0.0% 0.5% 0.4% 0.2% 0.2%
#
% - - - - - - - - - - - - - - - - -
Occupational CLF 100% 76.3% 23.7% 8.2% 3.0% 57.9% 15.3% 7.5% 4.4% 1.6% 0.5% 0.1% 0.0% 0.8% 0.3% 0.4% 0.2%
Wildlife Biology (0486)
Accessions
Criminal Investigating (1811)
Accessions
Accessions
General Natural Resources Management and Biological Sciences (0401)
Wildlife Refuge Management (0485)
Accessions
Fish Biology (0482)
Accessions
Fish & Wildlife Service - Servicewide FY2015Table A7-Alt: HIRES FOR MAJOR OCCUPATIONS by Race/Ethnicity and Sex - Temporary Workforce (1 of 2 pages)
Job Title/Series Agency Rate Occupational CLF
TOTAL EMPLOYEES
RACE/ETHNICITY
Hispanic or Latino
Non- Hispanic or Latino
White Black or African American
Fish and Wildlife Administration (0480)
Accessions
American Indian or Alaska Native
Two or more racesAsian
Native Hawaiian or Other Pacific
Islander
Biological Science Technician (0404)
Accessions

All male female male female male female male female male female male female male female male female
Fish & Wildlife Service - Servicewide FY2015Table A7-Alt: HIRES FOR MAJOR OCCUPATIONS by Race/Ethnicity and Sex - Temporary Workforce (2 of 2 pages)
Job Title/Series Agency Rate Occupational CLF
TOTAL EMPLOYEES
RACE/ETHNICITY
Hispanic or Latino
Non- Hispanic or Latino
White Black or African American
American Indian or Alaska Native
Two or more racesAsian
Native Hawaiian or Other Pacific
Islander
#
% - - - - - - - - - - - - - - - - -
Occupational CLF 100% 76.3% 23.7% 8.2% 3.0% 57.9% 15.3% 7.5% 4.4% 1.6% 0.5% 0.1% 0.0% 0.8% 0.3% 0.4% 0.2%
Land Management LE & Conservation LE (0025LE & 1801LE)
Accessions

All male female NotProvided
male female NotProvided
male female NotProvided
male female NotProvided
male female NotProvided
male female NotProvided
male female NotProvided
male female NotProvided
male female NotProvided
Vacancies #
# 3006 1237 1146 623 111 109 971 889 7 50 46 50 42 2 6 34 35 11 7 8 12 616
% 100% 41.2% 38.1% 20.7% 3.7% 3.6% 0.0% 32.3% 29.6% 0.2% 1.7% 1.5% 0.0% 1.7% 1.4% 0.0% 0.1% 0.2% 0.0% 1.1% 1.2% 0.0% 0.4% 0.2% 0.0% 0.3% 0.4% 20.5%
# 2525 962 943 620 83 93 770 733 4 29 32 41 35 2 5 27 28 7 6 3 11 616
% 100% 38.1% 37.3% 24.6% 3.3% 3.7% 0.0% 30.5% 29.0% 0.2% 1.1% 1.3% 0.0% 1.6% 1.4% 0.0% 0.1% 0.2% 0.0% 1.1% 1.1% 0.0% 0.3% 0.2% 0.0% 0.1% 0.4% 24.4%
# 1229 326 286 617 26 30 263 225 1 11 2 10 11 1 10 11 4 2 2 4 616
% 100% 26.5% 23.3% 50.2% 2.1% 2.4% 0.0% 21.4% 18.3% 0.1% 0.9% 0.2% 0.0% 0.8% 0.9% 0.0% 0.0% 0.1% 0.0% 0.8% 0.9% 0.0% 0.3% 0.2% 0.0% 0.2% 0.3% 50.1%
# 133 33 32 68 1 4 29 24 1 2 1 1 2 68
% 100% 24.8% 24.1% 51.1% 0.8% 3.0% 0.0% 21.8% 18.0% 0.0% 0.8% 0.0% 0.0% 1.5% 0.8% 0.0% 0.0% 0.0% 0.0% 0.0% 0.0% 0.0% 0.0% 0.8% 0.0% 0.0% 1.5% 51.1%
CLF % 100% 52.0% 48.0% 2.4% 2.2% 44.3% 39.5% 1.4% 1.6% 3.2% 4.1% 0.1% 0.0% 0.5% 0.4% 0.2% 0.2%
Vacancies #
# 4519 1949 1799 771 239 211 1533 1378 4 44 65 89 77 1 1 5 28 38 9 7 6 18 766
% 100% 43.1% 39.8% 17.1% 5.3% 4.7% 0.0% 33.9% 30.5% 0.1% 1.0% 1.4% 0.0% 2.0% 1.7% 0.0% 0.0% 0.1% 0.0% 0.6% 0.8% 0.0% 0.2% 0.2% 0.0% 0.1% 0.4% 17.0%
# 4248 1791 1686 771 214 193 1416 1297 4 42 64 80 71 1 1 5 24 34 8 7 6 15 766
% 100% 42.2% 39.7% 18.1% 5.0% 4.5% 0.0% 33.3% 30.5% 0.1% 1.0% 1.5% 0.0% 1.9% 1.7% 0.0% 0.0% 0.1% 0.0% 0.6% 0.8% 0.0% 0.2% 0.2% 0.0% 0.1% 0.4% 18.0%
# 1611 464 382 765 39 34 390 310 11 9 14 13 1 7 11 1 1 1 4 765
% 100% 28.8% 23.7% 47.5% 2.4% 2.1% 0.0% 24.2% 19.2% 0.0% 0.7% 0.6% 0.0% 0.9% 0.8% 0.0% 0.1% 0.0% 0.0% 0.4% 0.7% 0.0% 0.1% 0.1% 0.0% 0.1% 0.2% 47.5%
# 226 78 44 104 2 3 73 39 1 2 1 1 104
% 100% 34.5% 19.5% 46.0% 0.9% 1.3% 0.0% 32.3% 17.3% 0.0% 0.4% 0.0% 0.0% 0.9% 0.4% 0.0% 0.0% 0.0% 0.0% 0.0% 0.4% 0.0% 0.0% 0.0% 0.0% 0.0% 0.0% 46.0%
CLF % 100% 52.6% 47.4% 3.4% 5.4% 37.6% 32.3% 4.2% 2.7% 5.2% 5.9% 0.1% 0.0% 1.6% 0.6% 0.5% 0.4%
Vacancies #
# 587 279 157 151 32 18 200 113 20 12 11 5 3 1 8 7 3 2 1 151
% 100% 47.5% 26.7% 25.7% 5.5% 3.1% 0.0% 34.1% 19.3% 0.0% 3.4% 2.0% 0.0% 1.9% 0.9% 0.0% 0.5% 0.2% 0.0% 1.4% 1.2% 0.0% 0.5% 0.0% 0.0% 0.3% 0.2% 25.7%
# 411 165 96 150 17 9 132 72 8 7 1 3 1 1 3 3 2 1 1 150
% 100% 40.1% 23.4% 36.5% 4.1% 2.2% 0.0% 32.1% 17.5% 0.0% 1.9% 1.7% 0.0% 0.2% 0.7% 0.0% 0.2% 0.2% 0.0% 0.7% 0.7% 0.0% 0.5% 0.0% 0.0% 0.2% 0.2% 36.5%
# 306 101 55 150 10 7 85 43 4 1 2 1 1 1 1 150
% 100% 33.0% 18.0% 49.0% 3.3% 2.3% 0.0% 27.8% 14.1% 0.0% 1.3% 0.3% 0.0% 0.0% 0.7% 0.0% 0.0% 0.0% 0.0% 0.3% 0.3% 0.0% 0.0% 0.0% 0.0% 0.3% 0.3% 49.0%
# 29 7 6 16 1 1 4 5 1 1 16
% 100% 24.1% 20.7% 55.2% 3.4% 3.4% 0.0% 13.8% 17.2% 0.0% 3.4% 0.0% 0.0% 0.0% 0.0% 0.0% 0.0% 0.0% 0.0% 3.4% 0.0% 0.0% 0.0% 0.0% 0.0% 0.0% 0.0% 55.2%
CLF % 100% 52.0% 48.0% 2.4% 2.2% 44.3% 39.5% 1.4% 1.6% 3.2% 4.1% 0.1% 0.0% 0.5% 0.4% 0.2% 0.2%
Vacancies #
Selected ofthose Included
Fish & Wildlife Service - Servicewide FY2015Table A7-2: SOME APPLICANTS AND SELECTIONS FOR AUDITED VACANCIES IN MAJOR OCCUPATIONS by Race/Ethnicity and Sex
Includes both internal and external applicants and both temporary and permanent appointments (1 of 3 pages)
Category
TOTAL WORKFORCE
RACE/ETHNICITY
Hispanic or Latino White Black or African American Asian
Native Hawaiian or Other Pacific
Islander
American Indian or Alaska Native
General Natural Resources Management and Biological Sciences (0401)
ApplicantsIncluded*
Two or more races
Non- Hispanic or Latino
Not Provided
Qualified ofthose Included
Biological Science Technician (0404)
ApplicantsIncluded*
Qualified ofthose Included
Selected ofthose Included
Fish and Wildlife Administration (0480)
ApplicantsIncluded*
Qualified ofthose Included
Selected ofthose Included
Fish Biology (0482)
Referred ofthose Included
Referred ofthose Included
Referred ofthose Included

All male female NotProvided
male female NotProvided
male female NotProvided
male female NotProvided
male female NotProvided
male female NotProvided
male female NotProvided
male female NotProvided
male female NotProvided
Fish & Wildlife Service - Servicewide FY2015Table A7-2: SOME APPLICANTS AND SELECTIONS FOR AUDITED VACANCIES IN MAJOR OCCUPATIONS by Race/Ethnicity and Sex
Includes both internal and external applicants and both temporary and permanent appointments (2 of 3 pages)
Category
TOTAL WORKFORCE
RACE/ETHNICITY
Hispanic or Latino White Black or African American Asian
Native Hawaiian or Other Pacific
Islander
American Indian or Alaska Native Two or more races
Non- Hispanic or Latino
Not Provided
# 1148 582 361 205 41 33 470 283 1 18 21 34 9 1 13 8 3 4 2 3 204
% 100% 50.7% 31.4% 17.9% 3.6% 2.9% 0.0% 40.9% 24.7% 0.1% 1.6% 1.8% 0.0% 3.0% 0.8% 0.0% 0.1% 0.0% 0.0% 1.1% 0.7% 0.0% 0.3% 0.3% 0.0% 0.2% 0.3% 17.8%
# 999 489 306 204 33 27 401 244 14 16 26 6 10 7 3 3 2 3 204
% 100% 48.9% 30.6% 20.4% 3.3% 2.7% 0.0% 40.1% 24.4% 0.0% 1.4% 1.6% 0.0% 2.6% 0.6% 0.0% 0.0% 0.0% 0.0% 1.0% 0.7% 0.0% 0.3% 0.3% 0.0% 0.2% 0.3% 20.4%
# 448 170 74 204 11 4 140 62 5 5 9 3 2 1 1 1 204
% 100% 37.9% 16.5% 45.5% 2.5% 0.9% 0.0% 31.3% 13.8% 0.0% 1.1% 1.1% 0.0% 2.0% 0.0% 0.0% 0.0% 0.0% 0.0% 0.7% 0.4% 0.0% 0.2% 0.2% 0.0% 0.2% 0.0% 45.5%
# 49 10 11 28 9 11 1 28
% 100% 20.4% 22.4% 57.1% 0.0% 0.0% 0.0% 18.4% 22.4% 0.0% 0.0% 0.0% 0.0% 2.0% 0.0% 0.0% 0.0% 0.0% 0.0% 0.0% 0.0% 0.0% 0.0% 0.0% 0.0% 0.0% 0.0% 57.1%
CLF % 100% 52.0% 48.0% 2.4% 2.2% 44.3% 39.5% 1.4% 1.6% 3.2% 4.1% 0.1% 0.0% 0.5% 0.4% 0.2% 0.2%
Vacancies #
# 1023 459 322 242 43 29 358 265 1 20 16 13 3 1 22 5 2 1 1 2 241
% 100% 44.9% 31.5% 23.7% 4.2% 2.8% 0.0% 35.0% 25.9% 0.1% 2.0% 1.6% 0.0% 1.3% 0.3% 0.0% 0.0% 0.1% 0.0% 2.2% 0.5% 0.0% 0.2% 0.1% 0.0% 0.1% 0.2% 23.6%
# 856 349 265 242 27 19 281 222 1 13 15 9 2 1 16 4 2 1 2 241
% 100% 40.8% 31.0% 28.3% 3.2% 2.2% 0.0% 32.8% 25.9% 0.1% 1.5% 1.8% 0.0% 1.1% 0.2% 0.0% 0.0% 0.1% 0.0% 1.9% 0.5% 0.0% 0.2% 0.0% 0.0% 0.1% 0.2% 28.2%
# 443 136 65 242 13 6 103 56 1 6 3 1 9 2 1 1 241
% 100% 30.7% 14.7% 54.6% 2.9% 1.4% 0.0% 23.3% 12.6% 0.2% 1.4% 0.0% 0.0% 0.7% 0.2% 0.0% 0.0% 0.0% 0.0% 2.0% 0.5% 0.0% 0.2% 0.0% 0.0% 0.2% 0.0% 54.4%
# 59 15 10 34 4 2 9 8 1 1 34
% 100% 25.4% 16.9% 57.6% 6.8% 3.4% 0.0% 15.3% 13.6% 0.0% 1.7% 0.0% 0.0% 0.0% 0.0% 0.0% 0.0% 0.0% 0.0% 1.7% 0.0% 0.0% 0.0% 0.0% 0.0% 0.0% 0.0% 57.6%
CLF % 100% 52.0% 48.0% 2.4% 2.2% 44.3% 39.5% 1.4% 1.6% 3.2% 4.1% 0.1% 0.0% 0.5% 0.4% 0.2% 0.2%
Vacancies #
# 946 407 384 155 47 36 323 305 10 14 17 16 9 6 1 3 4 155
% 100% 43.0% 40.6% 16.4% 5.0% 3.8% 0.0% 34.1% 32.2% 0.0% 1.1% 1.5% 0.0% 1.8% 1.7% 0.0% 0.0% 0.0% 0.0% 1.0% 0.6% 0.0% 0.1% 0.3% 0.0% 0.0% 0.4% 16.4%
# 701 271 275 155 27 27 222 218 7 8 10 11 4 5 1 3 3 155
% 100% 38.7% 39.2% 22.1% 3.9% 3.9% 0.0% 31.7% 31.1% 0.0% 1.0% 1.1% 0.0% 1.4% 1.6% 0.0% 0.0% 0.0% 0.0% 0.6% 0.7% 0.0% 0.1% 0.4% 0.0% 0.0% 0.4% 22.1%
# 353 108 90 155 11 9 91 72 2 3 3 1 1 3 1 1 155
% 100% 30.6% 25.5% 43.9% 3.1% 2.5% 0.0% 25.8% 20.4% 0.0% 0.6% 0.8% 0.0% 0.8% 0.3% 0.0% 0.0% 0.0% 0.0% 0.3% 0.8% 0.0% 0.0% 0.3% 0.0% 0.0% 0.3% 43.9%
# 33 13 7 13 1 11 7 1 13
% 100% 39.4% 21.2% 39.4% 3.0% 0.0% 0.0% 33.3% 21.2% 0.0% 0.0% 0.0% 0.0% 0.0% 0.0% 0.0% 0.0% 0.0% 0.0% 3.0% 0.0% 0.0% 0.0% 0.0% 0.0% 0.0% 0.0% 39.4%
CLF % 100% 52.0% 48.0% 2.4% 2.2% 44.3% 39.5% 1.4% 1.6% 3.2% 4.1% 0.1% 0.0% 0.5% 0.4% 0.2% 0.2%
Vacancies #
# 463 258 32 173 52 6 162 17 1 21 2 8 3 2 10 1 3 2 1 172
% 100% 55.7% 6.9% 37.4% 11.2% 1.3% 0.0% 35.0% 3.7% 0.2% 4.5% 0.4% 0.0% 1.7% 0.6% 0.0% 0.4% 0.0% 0.0% 2.2% 0.2% 0.0% 0.6% 0.4% 0.0% 0.0% 0.2% 37.1%
Referred ofthose Included
Selected ofthose Included
Criminal Investigating (1811)
ApplicantsIncluded*
Selected ofthose Included
ApplicantsIncluded*
Referred ofthose Included
Referred ofthose Included
Qualified ofthose Included
Wildlife Refuge Management (0485)
ApplicantsIncluded*
Qualified ofthose Included
Selected ofthose Included
Wildlife Biology (0486)
ApplicantsIncluded*
Qualified ofthose Included
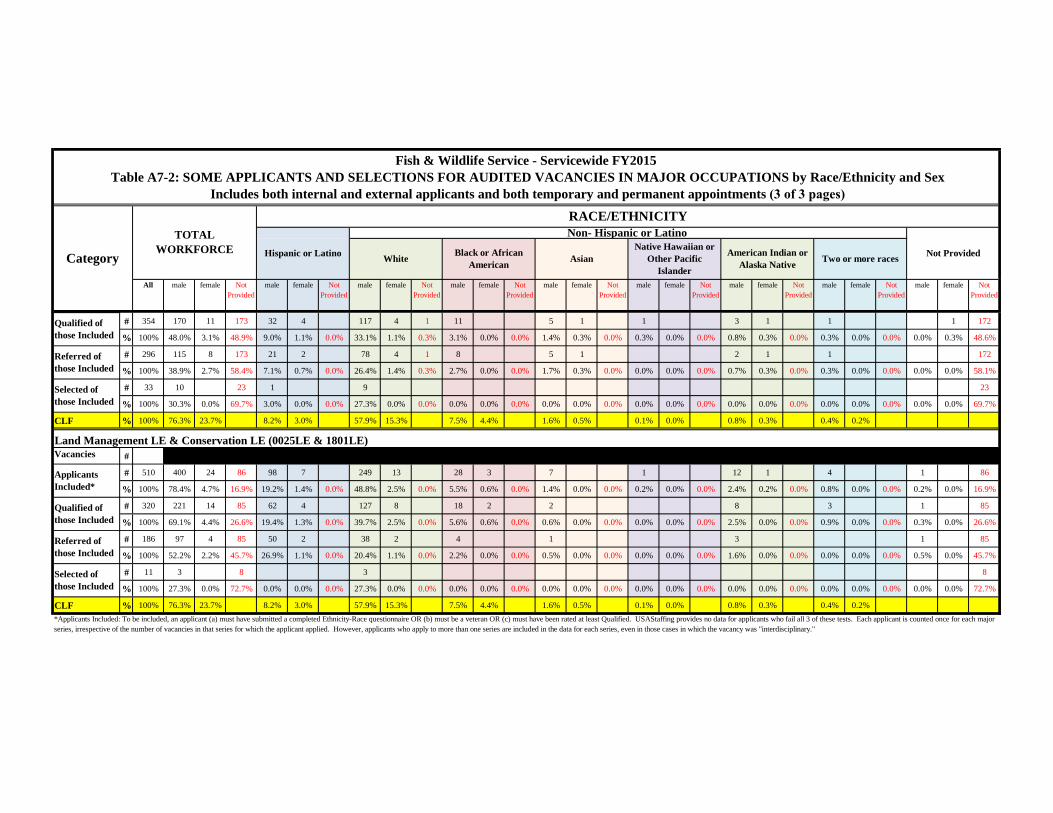
All male female NotProvided
male female NotProvided
male female NotProvided
male female NotProvided
male female NotProvided
male female NotProvided
male female NotProvided
male female NotProvided
male female NotProvided
Fish & Wildlife Service - Servicewide FY2015Table A7-2: SOME APPLICANTS AND SELECTIONS FOR AUDITED VACANCIES IN MAJOR OCCUPATIONS by Race/Ethnicity and Sex
Includes both internal and external applicants and both temporary and permanent appointments (3 of 3 pages)
Category
TOTAL WORKFORCE
RACE/ETHNICITY
Hispanic or Latino White Black or African American Asian
Native Hawaiian or Other Pacific
Islander
American Indian or Alaska Native Two or more races
Non- Hispanic or Latino
Not Provided
# 354 170 11 173 32 4 117 4 1 11 5 1 1 3 1 1 1 172
% 100% 48.0% 3.1% 48.9% 9.0% 1.1% 0.0% 33.1% 1.1% 0.3% 3.1% 0.0% 0.0% 1.4% 0.3% 0.0% 0.3% 0.0% 0.0% 0.8% 0.3% 0.0% 0.3% 0.0% 0.0% 0.0% 0.3% 48.6%
# 296 115 8 173 21 2 78 4 1 8 5 1 2 1 1 172
% 100% 38.9% 2.7% 58.4% 7.1% 0.7% 0.0% 26.4% 1.4% 0.3% 2.7% 0.0% 0.0% 1.7% 0.3% 0.0% 0.0% 0.0% 0.0% 0.7% 0.3% 0.0% 0.3% 0.0% 0.0% 0.0% 0.0% 58.1%
# 33 10 23 1 9 23
% 100% 30.3% 0.0% 69.7% 3.0% 0.0% 0.0% 27.3% 0.0% 0.0% 0.0% 0.0% 0.0% 0.0% 0.0% 0.0% 0.0% 0.0% 0.0% 0.0% 0.0% 0.0% 0.0% 0.0% 0.0% 0.0% 0.0% 69.7%
CLF % 100% 76.3% 23.7% 8.2% 3.0% 57.9% 15.3% 7.5% 4.4% 1.6% 0.5% 0.1% 0.0% 0.8% 0.3% 0.4% 0.2%
Vacancies #
# 510 400 24 86 98 7 249 13 28 3 7 1 12 1 4 1 86
% 100% 78.4% 4.7% 16.9% 19.2% 1.4% 0.0% 48.8% 2.5% 0.0% 5.5% 0.6% 0.0% 1.4% 0.0% 0.0% 0.2% 0.0% 0.0% 2.4% 0.2% 0.0% 0.8% 0.0% 0.0% 0.2% 0.0% 16.9%
# 320 221 14 85 62 4 127 8 18 2 2 8 3 1 85
% 100% 69.1% 4.4% 26.6% 19.4% 1.3% 0.0% 39.7% 2.5% 0.0% 5.6% 0.6% 0.0% 0.6% 0.0% 0.0% 0.0% 0.0% 0.0% 2.5% 0.0% 0.0% 0.9% 0.0% 0.0% 0.3% 0.0% 26.6%
# 186 97 4 85 50 2 38 2 4 1 3 1 85
% 100% 52.2% 2.2% 45.7% 26.9% 1.1% 0.0% 20.4% 1.1% 0.0% 2.2% 0.0% 0.0% 0.5% 0.0% 0.0% 0.0% 0.0% 0.0% 1.6% 0.0% 0.0% 0.0% 0.0% 0.0% 0.5% 0.0% 45.7%
# 11 3 8 3 8
% 100% 27.3% 0.0% 72.7% 0.0% 0.0% 0.0% 27.3% 0.0% 0.0% 0.0% 0.0% 0.0% 0.0% 0.0% 0.0% 0.0% 0.0% 0.0% 0.0% 0.0% 0.0% 0.0% 0.0% 0.0% 0.0% 0.0% 72.7%
CLF % 100% 76.3% 23.7% 8.2% 3.0% 57.9% 15.3% 7.5% 4.4% 1.6% 0.5% 0.1% 0.0% 0.8% 0.3% 0.4% 0.2%
Selected ofthose Included
*Applicants Included: To be included, an applicant (a) must have submitted a completed Ethnicity-Race questionnaire OR (b) must be a veteran OR (c) must have been rated at least Qualified. USAStaffing provides no data for applicants who fail all 3 of these tests. Each applicant is counted once for each majorseries, irrespective of the number of vacancies in that series for which the applicant applied. However, applicants who apply to more than one series are included in the data for each series, even in those cases in which the vacancy was "interdisciplinary."
Referred ofthose Included
Land Management LE & Conservation LE (0025LE & 1801LE)
Qualified ofthose Included
ApplicantsIncluded*
Referred ofthose Included
Qualified ofthose Included
Selected ofthose Included

All male female male female male female male female male female male female male female male female
# 441 242 199 6 10 204 156 16 12 5 6 1 9 11 2 3
% 100% 54.9% 45.1% 1.4% 2.3% 46.3% 35.4% 3.6% 2.7% 1.1% 1.4% 0.0% 0.2% 2.0% 2.5% 0.5% 0.7%
# 136 78 58 2 5 67 43 1 5 4 3 3 1 1 1
% 100% 57.4% 42.6% 1.5% 3.7% 49.3% 31.6% 0.7% 3.7% 2.9% 2.2% 2.2% 0.7% 0.7% 0.7% 0.0% 0.0%
# 577 320 257 8 15 271 199 17 17 9 9 3 2 10 12 2 3
% 100% 55.5% 44.5% 1.4% 2.6% 47.0% 34.5% 2.9% 2.9% 1.6% 1.6% 0.5% 0.3% 1.7% 2.1% 0.3% 0.5%
# 859 545 314 12 9 490 284 4 5 8 6 10 2 20 7 1 1
% 100% 63.4% 36.6% 1.4% 1.0% 57.0% 33.1% 0.5% 0.6% 0.9% 0.7% 1.2% 0.2% 2.3% 0.8% 0.1% 0.1%
#
% - - - - - - - - - - - - - - - - -
All Occupations CLF % 100% 51.9% 48.1% 5.2% 4.8% 38.3% 34.0% 5.5% 6.5% 2.0% 1.9% 0.1% 0.1% 0.6% 0.5% 0.3% 0.3%
Organizational CLF % 100% 53.9% 46.1% 3.6% 3.2% 43.4% 35.5% 3.2% 3.6% 2.7% 3.2% 0.1% 0.1% 0.6% 0.4% 0.2% 0.2%
Non- Hispanic or Latino
Black or African American
Accessions
Non-Appropriated Workforce
White
Temporary Workforce
Fish & Wildlife Service - Servicewide FY2015Table A8: NEW HIRES BY TYPE OF APPOINTMENT - Distribution by Race/Ethnicity and Sex
Employment TenureTOTAL
WORKFORCE
RACE/ETHNICITY
Hispanic or Latino
From Temporary
Accessions
American Indian or Alaska Native
Permanent Workforce
Two or more races
All Occupations CLF is based on all workers in all Census Occupation groups.Organizational CLF is based on the number of incumbants in each occupation in the organization.
Accessions
AsianNative Hawaiian or Other Pacific
Islander
Total Hires

All male female male female male female male female male female male female male female male female
Applicants ##
% - - - - - - - - - - - - - - - - -# 74 44 30 2 3 38 26 1 2 2
% 100% 59.5% 40.5% 2.7% 4.1% 51.4% 35.1% 0.0% 1.4% 2.7% 0.0% 0.0% 0.0% 2.7% 0.0% 0.0% 0.0%# 1614 932 682 47 34 833 600 8 12 13 25 2 2 25 9 4
% 100% 57.7% 42.3% 2.9% 2.1% 51.6% 37.2% 0.5% 0.7% 0.8% 1.5% 0.1% 0.1% 1.5% 0.6% 0.2% 0.0%
Applicants ##
% - - - - - - - - - - - - - - - - -# 5 3 2 1 2 2
% 100% 60.0% 40.0% 20.0% 40.0% 40.0% 0.0% 0.0% 0.0% 0.0% 0.0% 0.0% 0.0% 0.0% 0.0% 0.0% 0.0%# 115 92 23 5 3 84 18 1 1 2 1
% 100% 80.0% 20.0% 4.3% 2.6% 73.0% 15.7% 0.0% 0.0% 0.9% 0.9% 0.0% 0.0% 1.7% 0.9% 0.0% 0.0%
Applicants ##
% - - - - - - - - - - - - - - - - -# 24 14 10 1 12 8 1 1 1
% 100% 58.3% 41.7% 0.0% 4.2% 50.0% 33.3% 4.2% 4.2% 0.0% 0.0% 0.0% 0.0% 4.2% 0.0% 0.0% 0.0%# 231 146 85 7 7 132 74 2 2 1 1 3 1 1
% 100% 63.2% 36.8% 3.0% 3.0% 57.1% 32.0% 0.9% 0.9% 0.4% 0.4% 0.0% 0.0% 1.3% 0.4% 0.4% 0.0%
Applicants ##
% - - - - - - - - - - - - - - - - -# 17 15 2 15 2
% 100% 88.2% 11.8% 0.0% 0.0% 88.2% 11.8% 0.0% 0.0% 0.0% 0.0% 0.0% 0.0% 0.0% 0.0% 0.0% 0.0%# 537 429 108 23 3 378 97 8 5 9 11 3
% 100% 79.9% 20.1% 4.3% 0.6% 70.4% 18.1% 1.5% 0.9% 1.7% 0.0% 0.0% 0.0% 2.0% 0.6% 0.0% 0.0%
Applicants ##
% - - - - - - - - - - - - - - - - -# 39 28 11 1 24 10 2 2
% 100% 71.8% 28.2% 0.0% 2.6% 61.5% 25.6% 5.1% 0.0% 0.0% 0.0% 0.0% 0.0% 5.1% 0.0% 0.0% 0.0%# 590 426 164 19 12 368 136 9 6 6 3 1 21 6 3
% 100% 72.2% 27.8% 3.2% 2.0% 62.4% 23.1% 1.5% 1.0% 1.0% 0.5% 0.0% 0.2% 3.6% 1.0% 0.5% 0.0%
Applicants ##
% - - - - - - - - - - - - - - - - -# 17 12 5 1 9 5 1 1
% 100% 70.6% 29.4% 5.9% 0.0% 52.9% 29.4% 5.9% 0.0% 0.0% 0.0% 0.0% 0.0% 5.9% 0.0% 0.0% 0.0%# 535 340 195 17 12 310 171 2 2 2 6 7 4 2
% 100% 63.6% 36.4% 3.2% 2.2% 57.9% 32.0% 0.4% 0.4% 0.4% 1.1% 0.0% 0.0% 1.3% 0.7% 0.4% 0.0%
Applicants ##
% - - - - - - - - - - - - - - - - -# 10 9 1 9 1
% 100% 90.0% 10.0% 0.0% 0.0% 90.0% 10.0% 0.0% 0.0% 0.0% 0.0% 0.0% 0.0% 0.0% 0.0% 0.0% 0.0%# 202 176 26 15 2 150 19 4 1 1 3 2 4 1
% 100% 87.1% 12.9% 7.4% 1.0% 74.3% 9.4% 2.0% 0.5% 0.5% 1.5% 1.0% 0.0% 2.0% 0.5% 0.0% 0.0%
Applicants ##
% - - - - - - - - - - - - - - - - -# 22 21 1 1 17 1 3
% 100% 95.5% 4.5% 4.5% 0.0% 77.3% 4.5% 0.0% 0.0% 0.0% 0.0% 0.0% 0.0% 13.6% 0.0% 0.0% 0.0%# 243 223 20 15 3 190 15 4 5 2 7 2
% 100% 91.8% 8.2% 6.2% 1.2% 78.2% 6.2% 1.6% 0.0% 2.1% 0.0% 0.8% 0.0% 2.9% 0.8% 0.0% 0.0%
Relevant Pool
Relevant Pool
Relevant Pool
Selected
Wildlife Refuge Management (0485)
Qualified
Selected
Selected
Park Ranger (LE/Refuge), Land Mgmt LE & Conservation LE (0025LE & 1801LE)
Qualified
Relevant Pool
Selected
Selected
Criminal Investigating (1811)
Relevant Pool
Qualified
Relevant Pool
Qualified
Wildlife Biology (0486)
Qualified
Fish Biology (0482)
Relevant Pool
Selected
Fish and Wildlife Administration (0480)
Qualified
Qualified
Black or African American
Biological Science Technician (0404)
Qualified
AsianNative Hawaiian or Other Pacific
Islander
Selected
General Natural Resources Management and Biological Sciences (0401)
Two or more races
Relevant Pool
Selected
Fish & Wildlife Service - Servicewide FY2015Table A9-1: SELECTIONS FOR INTERNAL COMPETITIVE PROMOTIONS FOR MAJOR OCCUPATIONS by Race/Ethnicity and Sex
Based on occupational series of employee after the promotion
ActionTOTAL
WORKFORCE
RACE/ETHNICITY
Hispanic or Latino
Non- Hispanic or Latino
White American Indian or Alaska Native

All male female male female male female male female male female male female male female male female
Applicants ##
% - - - - - - - - - - - - - - - - -# 70 43 27 2 3 34 24 2 2 3
% 100% 61.4% 38.6% 2.9% 4.3% 48.6% 34.3% 2.9% 0.0% 2.9% 0.0% 0.0% 0.0% 4.3% 0.0% 0.0% 0.0%# 1614 932 682 47 34 833 600 8 12 13 25 2 2 25 9 4
% 100% 57.7% 42.3% 2.9% 2.1% 51.6% 37.2% 0.5% 0.7% 0.8% 1.5% 0.1% 0.1% 1.5% 0.6% 0.2% 0.0%
Applicants ##
% - - - - - - - - - - - - - - - - -# 8 5 3 1 2 4 1
% 100% 62.5% 37.5% 12.5% 25.0% 50.0% 12.5% 0.0% 0.0% 0.0% 0.0% 0.0% 0.0% 0.0% 0.0% 0.0% 0.0%# 115 92 23 5 3 84 18 1 1 2 1
% 100% 80.0% 20.0% 4.3% 2.6% 73.0% 15.7% 0.0% 0.0% 0.9% 0.9% 0.0% 0.0% 1.7% 0.9% 0.0% 0.0%
Applicants ##
% - - - - - - - - - - - - - - - - -# 3 1 2 1 2
% 100% 33.3% 66.7% 33.3% 0.0% 0.0% 66.7% 0.0% 0.0% 0.0% 0.0% 0.0% 0.0% 0.0% 0.0% 0.0% 0.0%# 231 146 85 7 7 132 74 2 2 1 1 3 1 1
% 100% 63.2% 36.8% 3.0% 3.0% 57.1% 32.0% 0.9% 0.9% 0.4% 0.4% 0.0% 0.0% 1.3% 0.4% 0.4% 0.0%
Applicants ##
% - - - - - - - - - - - - - - - - -# 17 14 3 14 2 1
% 100% 82.4% 17.6% 0.0% 0.0% 82.4% 11.8% 0.0% 5.9% 0.0% 0.0% 0.0% 0.0% 0.0% 0.0% 0.0% 0.0%# 537 429 108 23 3 378 97 8 5 9 11 3
% 100% 79.9% 20.1% 4.3% 0.6% 70.4% 18.1% 1.5% 0.9% 1.7% 0.0% 0.0% 0.0% 2.0% 0.6% 0.0% 0.0%
Applicants ##
% - - - - - - - - - - - - - - - - -# 44 31 13 1 26 11 2 1 3
% 100% 70.5% 29.5% 0.0% 2.3% 59.1% 25.0% 4.5% 2.3% 0.0% 0.0% 0.0% 0.0% 6.8% 0.0% 0.0% 0.0%# 590 426 164 19 12 368 136 9 6 6 3 1 21 6 3
% 100% 72.2% 27.8% 3.2% 2.0% 62.4% 23.1% 1.5% 1.0% 1.0% 0.5% 0.0% 0.2% 3.6% 1.0% 0.5% 0.0%
Applicants ##
% - - - - - - - - - - - - - - - - -# 23 16 7 16 7
% 100% 69.6% 30.4% 0.0% 0.0% 69.6% 30.4% 0.0% 0.0% 0.0% 0.0% 0.0% 0.0% 0.0% 0.0% 0.0% 0.0%# 535 340 195 17 12 310 171 2 2 2 6 7 4 2
% 100% 63.6% 36.4% 3.2% 2.2% 57.9% 32.0% 0.4% 0.4% 0.4% 1.1% 0.0% 0.0% 1.3% 0.7% 0.4% 0.0%
Applicants ##
% - - - - - - - - - - - - - - - - -# 10 9 1 9 1
% 100% 90.0% 10.0% 0.0% 0.0% 90.0% 10.0% 0.0% 0.0% 0.0% 0.0% 0.0% 0.0% 0.0% 0.0% 0.0% 0.0%# 202 176 26 15 2 150 19 4 1 1 3 2 4 1
% 100% 87.1% 12.9% 7.4% 1.0% 74.3% 9.4% 2.0% 0.5% 0.5% 1.5% 1.0% 0.0% 2.0% 0.5% 0.0% 0.0%
Applicants ##
% - - - - - - - - - - - - - - - - -# 22 21 1 1 17 1 3
% 100% 95.5% 4.5% 4.5% 0.0% 77.3% 4.5% 0.0% 0.0% 0.0% 0.0% 0.0% 0.0% 13.6% 0.0% 0.0% 0.0%# 243 223 20 15 3 190 15 4 5 2 7 2
% 100% 91.8% 8.2% 6.2% 1.2% 78.2% 6.2% 1.6% 0.0% 2.1% 0.0% 0.8% 0.0% 2.9% 0.8% 0.0% 0.0%
American Indian or Alaska Native
Black or African American Asian
Native Hawaiian or Other Pacific
Islander
Selected
General Natural Resources Management and Biological Sciences (0401)
Two or more races
Fish & Wildlife Service - Servicewide FY2015Table A9-2: SELECTIONS FOR INTERNAL COMPETITIVE PROMOTIONS FOR MAJOR OCCUPATIONS by Race/Ethnicity and Sex
Based on occupational series of employee before the promotion
ActionTOTAL
WORKFORCE
RACE/ETHNICITY
Hispanic or Latino
Non- Hispanic or Latino
White
Selected
Qualified
Relevant Pool
Selected
Fish Biology (0482)
Qualified
Fish and Wildlife Administration (0480)
Relevant Pool
Biological Science Technician (0404)
Qualified
Qualified
Relevant Pool
Wildlife Biology (0486)
Qualified
Selected
Criminal Investigating (1811)
Relevant Pool
Qualified
Selected
Park Ranger (LE/Refuge), Land Mgmt LE & Conservation LE (0025LE & 1801LE)
Selected
Relevant Pool
Wildlife Refuge Management (0485)
Qualified
Selected
Qualified
Selected
Relevant Pool
Relevant Pool
Relevant Pool

All male female male female male female male female male female male female male female male female
# 507 288 219 26 14 224 163 13 24 6 9 3 2 16 7
% 100% 56.8% 43.2% 5.1% 2.8% 44.2% 32.1% 2.6% 4.7% 1.2% 1.8% 0.6% 0.4% 3.2% 1.4% 0.0% 0.0%
# 47 27 20 6 1 18 14 2 1 3 2
% 100% 57.4% 42.6% 12.8% 2.1% 38.3% 29.8% 0.0% 4.3% 0.0% 0.0% 0.0% 2.1% 6.4% 4.3% 0.0% 0.0%
# 30 21 9 2 1 18 8 1
% 100% 70.0% 30.0% 6.7% 3.3% 60.0% 26.7% 0.0% 0.0% 3.3% 0.0% 0.0% 0.0% 0.0% 0.0% 0.0% 0.0%
# 8 8 7 1
% 100% 100.0% 0.0% 0.0% 0.0% 87.5% 0.0% 0.0% 0.0% 0.0% 0.0% 0.0% 0.0% 12.5% 0.0% 0.0% 0.0%
13 - 24 months
25+ months
American Indian or Alaska Native
Two or more races
Time in grade in excess of minimum
1 - 12 months
Total Employees Eligible for Career Ladder Promotions
Fish & Wildlife Service - Servicewide as of September 30, 2015Table A10: NON-COMPETITIVE PROMOTIONS - TIME IN GRADE - Distribution by Race/Ethnicity and Sex
Permanent WorkforceTOTAL
WORKFORCE
RACE/ETHNICITY
Hispanic or Latino
Non- Hispanic or Latino
White Black or African American Asian
Native Hawaiian or Other Pacific
Islander

All male female male female male female male female male female male female male female male female
#% - - - - - - - - - - - - - - - - -#
% - - - - - - - - - - - - - - - - -# 67 47 20 2 1 38 17 2 1 2 4
% 100% 70.1% 29.9% 3.0% 1.5% 56.7% 25.4% 3.0% 0.0% 1.5% 3.0% 0.0% 0.0% 6.0% 0.0% 0.0% 0.0%# 1806 1084 722 53 34 939 606 32 42 20 25 2 2 36 11 2 2
% 100% 60.0% 40.0% 2.9% 1.9% 52.0% 33.6% 1.8% 2.3% 1.1% 1.4% 0.1% 0.1% 2.0% 0.6% 0.1% 0.1%
#% - - - - - - - - - - - - - - - - -#
% - - - - - - - - - - - - - - - - -# 49 34 15 29 14 3 1 1 1
% 100% 69.4% 30.6% 0.0% 0.0% 59.2% 28.6% 6.1% 2.0% 2.0% 0.0% 0.0% 0.0% 2.0% 0.0% 0.0% 0.0%# 1313 835 478 40 41 732 381 21 31 17 15 1 1 22 9 2
% 100% 63.6% 36.4% 3.0% 3.1% 55.8% 29.0% 1.6% 2.4% 1.3% 1.1% 0.1% 0.1% 1.7% 0.7% 0.2% 0.0%
#% - - - - - - - - - - - - - - - - -#
% - - - - - - - - - - - - - - - - -# 6 3 3 1 2 3
% 100% 50.0% 50.0% 16.7% 0.0% 33.3% 50.0% 0.0% 0.0% 0.0% 0.0% 0.0% 0.0% 0.0% 0.0% 0.0% 0.0%# 519 328 191 16 9 298 163 5 8 1 7 1 6 4 1
% 100% 63.2% 36.8% 3.1% 1.7% 57.4% 31.4% 1.0% 1.5% 0.2% 1.3% 0.2% 0.0% 1.2% 0.8% 0.2% 0.0%
#% - - - - - - - - - - - - - - - - -#
% - - - - - - - - - - - - - - - - -# 1 1 1
% 100% 0.0% 100.0% 0.0% 100.0% 0.0% 0.0% 0.0% 0.0% 0.0% 0.0% 0.0% 0.0% 0.0% 0.0% 0.0% 0.0%# 160 112 48 9 5 90 41 3 2 2 1 7
% 100% 70.0% 30.0% 5.6% 3.1% 56.3% 25.6% 1.9% 1.3% 1.3% 0.0% 0.6% 0.0% 4.4% 0.0% 0.0% 0.0%
Relevant Pool
Relevant Pool
Senior Executive Service Vacancies
Applied
Qualified
Selected
Fish & Wildlife Service - Servicewide FY2015Table A11: INTERNAL SELECTIONS FOR SENIOR LEVEL POSITIONS (GS 13/14, GS 15, AND SES) by Race/Ethnicity and Sex
ActionTOTAL
WORKFORCE
RACE/ETHNICITY
Hispanic or Latino
Non- Hispanic or Latino
White Two or more races
American Indian or Alaska Native
Black or African American
GS-14 Vacancies
Applied
Qualified
Applied
Relevant Pool
AsianNative Hawaiian or Other Pacific
Islander
Selected
GS-13 Vacancies
Qualified
Selected
GS-15 Vacancies
Selected
Relevant Pool
Applied
Qualified
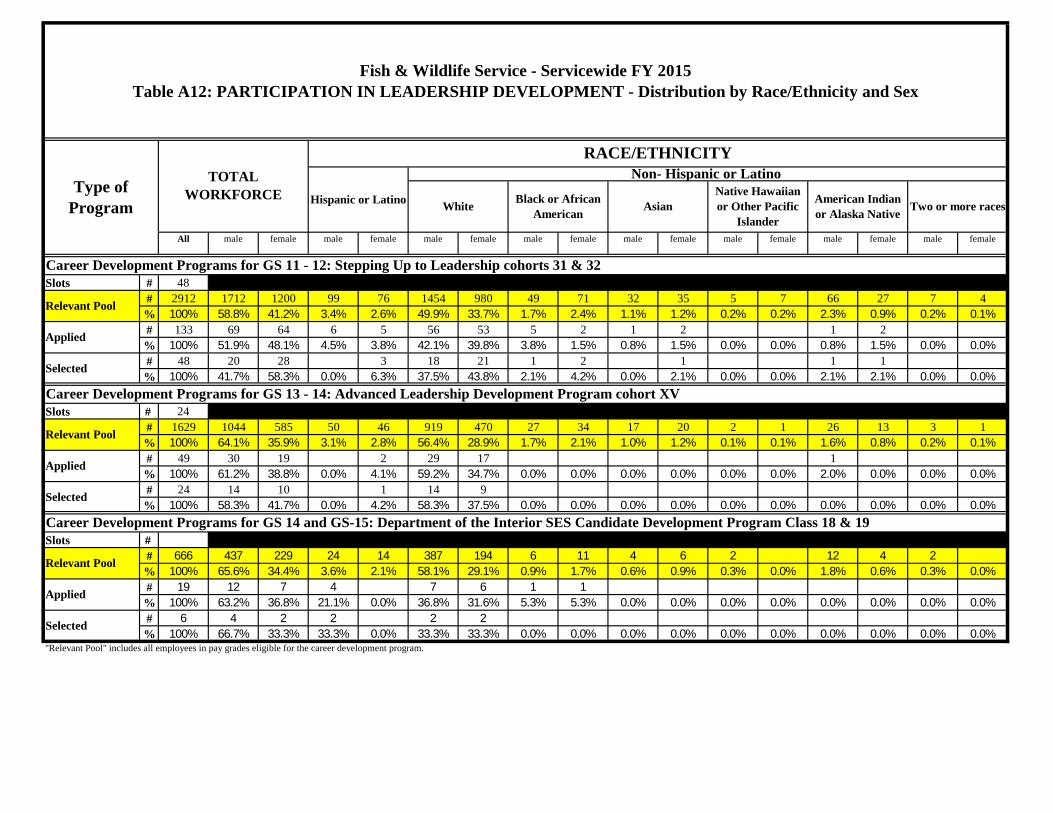
All male female male female male female male female male female male female male female male female
Slots # 48# 2912 1712 1200 99 76 1454 980 49 71 32 35 5 7 66 27 7 4% 100% 58.8% 41.2% 3.4% 2.6% 49.9% 33.7% 1.7% 2.4% 1.1% 1.2% 0.2% 0.2% 2.3% 0.9% 0.2% 0.1%# 133 69 64 6 5 56 53 5 2 1 2 1 2% 100% 51.9% 48.1% 4.5% 3.8% 42.1% 39.8% 3.8% 1.5% 0.8% 1.5% 0.0% 0.0% 0.8% 1.5% 0.0% 0.0%# 48 20 28 3 18 21 1 2 1 1 1% 100% 41.7% 58.3% 0.0% 6.3% 37.5% 43.8% 2.1% 4.2% 0.0% 2.1% 0.0% 0.0% 2.1% 2.1% 0.0% 0.0%
Slots # 24# 1629 1044 585 50 46 919 470 27 34 17 20 2 1 26 13 3 1% 100% 64.1% 35.9% 3.1% 2.8% 56.4% 28.9% 1.7% 2.1% 1.0% 1.2% 0.1% 0.1% 1.6% 0.8% 0.2% 0.1%# 49 30 19 2 29 17 1% 100% 61.2% 38.8% 0.0% 4.1% 59.2% 34.7% 0.0% 0.0% 0.0% 0.0% 0.0% 0.0% 2.0% 0.0% 0.0% 0.0%# 24 14 10 1 14 9% 100% 58.3% 41.7% 0.0% 4.2% 58.3% 37.5% 0.0% 0.0% 0.0% 0.0% 0.0% 0.0% 0.0% 0.0% 0.0% 0.0%
Slots # # 666 437 229 24 14 387 194 6 11 4 6 2 12 4 2% 100% 65.6% 34.4% 3.6% 2.1% 58.1% 29.1% 0.9% 1.7% 0.6% 0.9% 0.3% 0.0% 1.8% 0.6% 0.3% 0.0%# 19 12 7 4 7 6 1 1% 100% 63.2% 36.8% 21.1% 0.0% 36.8% 31.6% 5.3% 5.3% 0.0% 0.0% 0.0% 0.0% 0.0% 0.0% 0.0% 0.0%# 6 4 2 2 2 2% 100% 66.7% 33.3% 33.3% 0.0% 33.3% 33.3% 0.0% 0.0% 0.0% 0.0% 0.0% 0.0% 0.0% 0.0% 0.0% 0.0%
Relevant Pool
Relevant Pool
American Indian or Alaska Native Two or more races
Career Development Programs for GS 11 - 12: Stepping Up to Leadership cohorts 31 & 32
Career Development Programs for GS 13 - 14: Advanced Leadership Development Program cohort XV
Selected
Applied
Relevant Pool
Fish & Wildlife Service - Servicewide FY 2015Table A12: PARTICIPATION IN LEADERSHIP DEVELOPMENT - Distribution by Race/Ethnicity and Sex
Type of Program
TOTAL WORKFORCE
RACE/ETHNICITY
Hispanic or Latino
Non- Hispanic or Latino
White Black or African American Asian
Native Hawaiian or Other Pacific
Islander
"Relevant Pool" includes all employees in pay grades eligible for the career development program.
Applied
Selected
Applied
Selected
Career Development Programs for GS 14 and GS-15: Department of the Interior SES Candidate Development Program Class 18 & 19

All male female male female male female male female male female male female male female male female
# 359 197 162 9 9 171 128 4 16 5 6 1 1 6 1 1 1
% 100% 54.9% 45.1% 2.5% 2.5% 47.6% 35.7% 1.1% 4.5% 1.4% 1.7% 0.3% 0.3% 1.7% 0.3% 0.3% 0.3%
Total Hours 2476 1375 1101 70 68 1174 850 32 121 38 39 8 7 45 8 8 8
Average Hours 7 7 7 8 8 7 7 8 8 8 7 8 7 8 8 8 8
# 2995 1614 1381 60 78 1434 1130 41 93 24 39 2 1 50 38 3 2
% 100% 53.9% 46.1% 2.0% 2.6% 47.9% 37.7% 1.4% 3.1% 0.8% 1.3% 0.1% 0.0% 1.7% 1.3% 0.1% 0.1%
Total Hours 83190 44133 39057 1599 2167 39352 32267 966 2375 660 1073 63 10 1420 1126 73 39
Average Hours 28 27 28 27 28 27 29 24 26 28 28 32 10 28 30 24 20
# 1257 723 534 28 32 630 414 19 48 15 18 5 7 23 13 3 2
% 100% 57.5% 42.5% 2.2% 2.5% 50.1% 32.9% 1.5% 3.8% 1.2% 1.4% 0.4% 0.6% 1.8% 1.0% 0.2% 0.2%
Total Amount $510,212 $294,837 $215,375 $11,029 $12,994 $258,474 $166,715 $7,030 $19,155 $6,825 $7,821 $1,760 $2,580 $8,569 $5,210 $1,150 $900
Average Amount $406 $408 $403 $394 $406 $410 $403 $370 $399 $455 $435 $352 $369 $373 $401 $383 $450
# 5633 3277 2356 188 167 2822 1894 99 162 46 70 6 6 104 54 12 3
% 100% 58.2% 41.8% 3.3% 3.0% 50.1% 33.6% 1.8% 2.9% 0.8% 1.2% 0.1% 0.1% 1.8% 1.0% 0.2% 0.1%
Total Amount $8,407,827 $4,804,669 $3,603,158 $271,292 $254,138 $4,159,272 $2,890,791 $153,468 $276,362 $61,587 $91,058 $6,261 $7,303 $137,321 $80,934 $15,468 $2,572
Average Amount $1,493 $1,466 $1,529 $1,443 $1,522 $1,474 $1,526 $1,550 $1,706 $1,339 $1,301 $1,044 $1,217 $1,320 $1,499 $1,289 $857
# 23 16 7 2 1 11 6 3
% 100% 69.6% 30.4% 8.7% 4.3% 47.8% 26.1% 13.0% 0.0% 0.0% 0.0% 0.0% 0.0% 0.0% 0.0% 0.0% 0.0%
Total Amount $298,947 $208,149 $90,798 $15,543 $9,075 $168,700 $81,723 $23,906
Average Amount $12,998 $13,009 $12,971 $7,772 $9,075 $15,336 $13,621 $7,969 - - - - - - - - -
# 307 153 154 6 13 128 120 6 10 6 9 1 6 2
% 100% 49.8% 50.2% 2.0% 4.2% 41.7% 39.1% 2.0% 3.3% 2.0% 2.9% 0.3% 0.0% 2.0% 0.7% 0.0% 0.0%
Total Benefit $793,070 $408,210 $384,860 $16,776 $32,465 $343,186 $302,857 $15,686 $21,942 $15,748 $22,282 $2,389 $14,425 $5,314
Average Benefit $2,583 $2,668 $2,499 $2,796 $2,497 $2,681 $2,524 $2,614 $2,194 $2,625 $2,476 $2,389 - $2,404 $2,657 - -
Quality Step Increases (QSI)
Cash Awards - $100 - $500
Cash Awards $501+
Total Cash Awards Given
Senior Executive Service Performance Awards
Total Cash Awards Given
Two or more races
Time-Off awards - 1-9 hours
Time-Off awards - 9+ hours
Total Time-Off Awards Given
Black or African American Asian
Native Hawaiian or Other Pacific
Islander
American Indian or Alaska Native
Total QSIs Awarded
Total Time-Off Awards Given
Total Cash Awards Given
Fish & Wildlife Service - Servicewide FY2015Table A13: EMPLOYEE RECOGNITION AND AWARDS - Distribution by Race/Ethnicity and Sex - Permanent Workforce
Type of AwardTOTAL
WORKFORCE
RACE/ETHNICITY
Hispanic or Latino
Non- Hispanic or Latino
White

All male female male female male female male female male female male female male female male female
# 572 325 247 15 12 278 206 16 19 5 4 11 5 1
% 100% 56.8% 43.2% 2.6% 2.1% 48.6% 36.0% 2.8% 3.3% 0.9% 0.7% 0.0% 0.0% 1.9% 0.9% 0.0% 0.2%
# 17 9 8 7 4 2 1 1 2
% 100% 52.9% 47.1% 0.0% 0.0% 41.2% 23.5% 0.0% 11.8% 0.0% 0.0% 5.9% 0.0% 5.9% 11.8% 0.0% 0.0%
#% - - - - - - - - - - - - - - - - -
# 589 334 255 15 12 285 210 16 21 5 4 1 12 7 1
% 100% 56.7% 43.3% 2.5% 2.0% 48.4% 35.7% 2.7% 3.6% 0.8% 0.7% 0.2% 0.0% 2.0% 1.2% 0.0% 0.2%
# 7845 4664 3181 276 231 3957 2512 148 227 82 96 11 15 176 91 14 9
% 100% 59.5% 40.5% 3.5% 2.9% 50.4% 32.0% 1.9% 2.9% 1.0% 1.2% 0.1% 0.2% 2.2% 1.2% 0.2% 0.1%
Total Separations
Permanent Workforce(09/30/2014)
American Indian or Alaska Native
Two or more races
Voluntary
Involuntary
RIF
Fish & Wildlife Service - Servicewide FY2015Table A14: SEPARATIONS BY TYPE OF SEPARATION - Distribution by Race/Ethnicity and Sex - Permanent Workforce
Type of SeparationTOTAL
WORKFORCE
RACE/ETHNICITY
Hispanic or Latino
Non- Hispanic or Latino
White Black or African American Asian
Native Hawaiian or Other Pacific
Islander

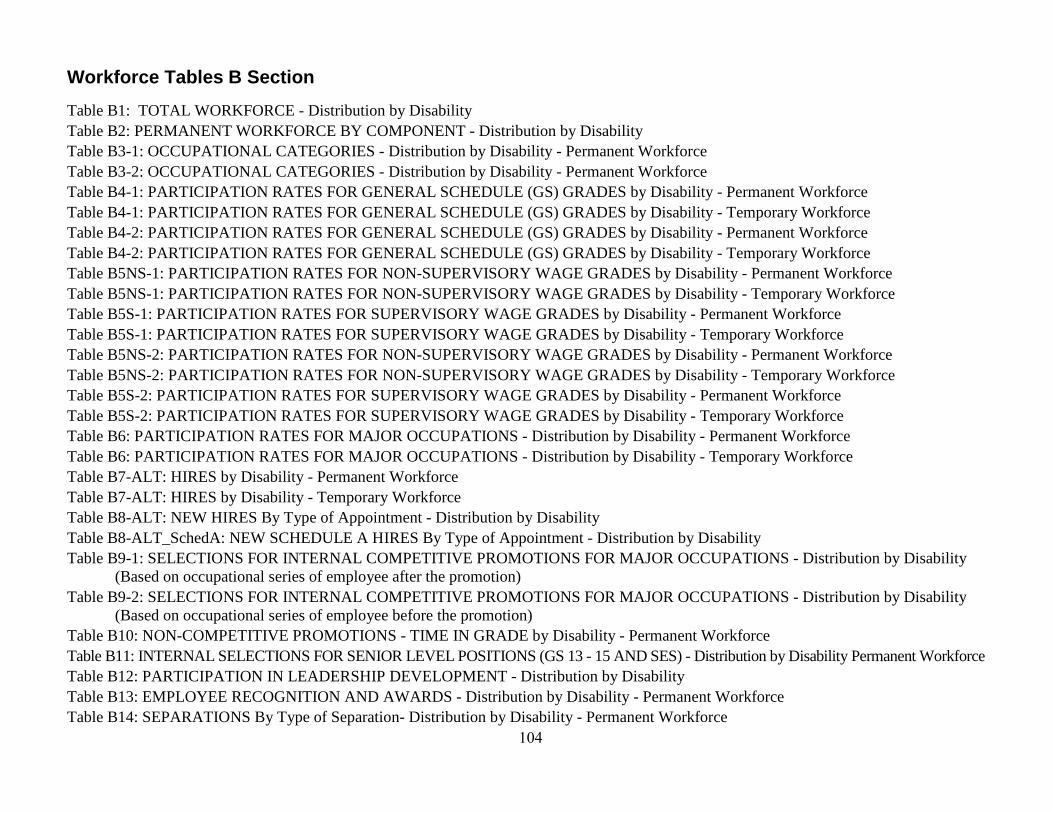
104
Workforce Tables B Section Table B1: TOTAL WORKFORCE - Distribution by Disability Table B2: PERMANENT WORKFORCE BY COMPONENT - Distribution by Disability Table B3-1: OCCUPATIONAL CATEGORIES - Distribution by Disability - Permanent Workforce Table B3-2: OCCUPATIONAL CATEGORIES - Distribution by Disability - Permanent Workforce Table B4-1: PARTICIPATION RATES FOR GENERAL SCHEDULE (GS) GRADES by Disability - Permanent Workforce Table B4-1: PARTICIPATION RATES FOR GENERAL SCHEDULE (GS) GRADES by Disability - Temporary Workforce Table B4-2: PARTICIPATION RATES FOR GENERAL SCHEDULE (GS) GRADES by Disability - Permanent Workforce Table B4-2: PARTICIPATION RATES FOR GENERAL SCHEDULE (GS) GRADES by Disability - Temporary Workforce Table B5NS-1: PARTICIPATION RATES FOR NON-SUPERVISORY WAGE GRADES by Disability - Permanent Workforce Table B5NS-1: PARTICIPATION RATES FOR NON-SUPERVISORY WAGE GRADES by Disability - Temporary Workforce Table B5S-1: PARTICIPATION RATES FOR SUPERVISORY WAGE GRADES by Disability - Permanent Workforce Table B5S-1: PARTICIPATION RATES FOR SUPERVISORY WAGE GRADES by Disability - Temporary Workforce Table B5NS-2: PARTICIPATION RATES FOR NON-SUPERVISORY WAGE GRADES by Disability - Permanent Workforce Table B5NS-2: PARTICIPATION RATES FOR NON-SUPERVISORY WAGE GRADES by Disability - Temporary Workforce Table B5S-2: PARTICIPATION RATES FOR SUPERVISORY WAGE GRADES by Disability - Permanent Workforce Table B5S-2: PARTICIPATION RATES FOR SUPERVISORY WAGE GRADES by Disability - Temporary Workforce Table B6: PARTICIPATION RATES FOR MAJOR OCCUPATIONS - Distribution by Disability - Permanent Workforce Table B6: PARTICIPATION RATES FOR MAJOR OCCUPATIONS - Distribution by Disability - Temporary Workforce Table B7-ALT: HIRES by Disability - Permanent Workforce Table B7-ALT: HIRES by Disability - Temporary Workforce Table B8-ALT: NEW HIRES By Type of Appointment - Distribution by Disability Table B8-ALT_SchedA: NEW SCHEDULE A HIRES By Type of Appointment - Distribution by Disability Table B9-1: SELECTIONS FOR INTERNAL COMPETITIVE PROMOTIONS FOR MAJOR OCCUPATIONS - Distribution by Disability
(Based on occupational series of employee after the promotion) Table B9-2: SELECTIONS FOR INTERNAL COMPETITIVE PROMOTIONS FOR MAJOR OCCUPATIONS - Distribution by Disability
(Based on occupational series of employee before the promotion) Table B10: NON-COMPETITIVE PROMOTIONS - TIME IN GRADE by Disability - Permanent Workforce Table B11: INTERNAL SELECTIONS FOR SENIOR LEVEL POSITIONS (GS 13 - 15 AND SES) - Distribution by Disability Permanent Workforce Table B12: PARTICIPATION IN LEADERSHIP DEVELOPMENT - Distribution by Disability Table B13: EMPLOYEE RECOGNITION AND AWARDS - Distribution by Disability - Permanent Workforce Table B14: SEPARATIONS By Type of Separation- Distribution by Disability - Permanent Workforce
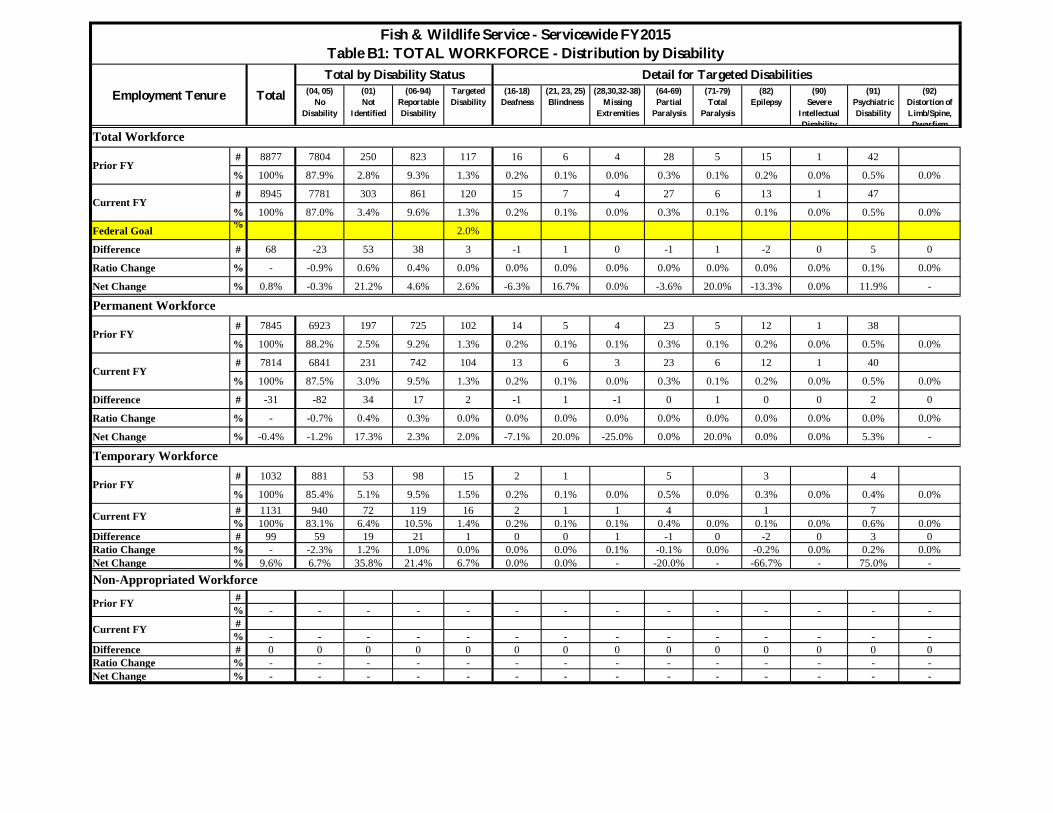
# 8877 7804 250 823 117 16 6 4 28 5 15 1 42
% 100% 87.9% 2.8% 9.3% 1.3% 0.2% 0.1% 0.0% 0.3% 0.1% 0.2% 0.0% 0.5% 0.0%
# 8945 7781 303 861 120 15 7 4 27 6 13 1 47
% 100% 87.0% 3.4% 9.6% 1.3% 0.2% 0.1% 0.0% 0.3% 0.1% 0.1% 0.0% 0.5% 0.0%
Federal Goal % 2.0%
Difference # 68 -23 53 38 3 -1 1 0 -1 1 -2 0 5 0
Ratio Change % - -0.9% 0.6% 0.4% 0.0% 0.0% 0.0% 0.0% 0.0% 0.0% 0.0% 0.0% 0.1% 0.0%
Net Change % 0.8% -0.3% 21.2% 4.6% 2.6% -6.3% 16.7% 0.0% -3.6% 20.0% -13.3% 0.0% 11.9% -
# 7845 6923 197 725 102 14 5 4 23 5 12 1 38
% 100% 88.2% 2.5% 9.2% 1.3% 0.2% 0.1% 0.1% 0.3% 0.1% 0.2% 0.0% 0.5% 0.0%
# 7814 6841 231 742 104 13 6 3 23 6 12 1 40
% 100% 87.5% 3.0% 9.5% 1.3% 0.2% 0.1% 0.0% 0.3% 0.1% 0.2% 0.0% 0.5% 0.0%
Difference # -31 -82 34 17 2 -1 1 -1 0 1 0 0 2 0
Ratio Change % - -0.7% 0.4% 0.3% 0.0% 0.0% 0.0% 0.0% 0.0% 0.0% 0.0% 0.0% 0.0% 0.0%
Net Change % -0.4% -1.2% 17.3% 2.3% 2.0% -7.1% 20.0% -25.0% 0.0% 20.0% 0.0% 0.0% 5.3% -
# 1032 881 53 98 15 2 1 5 3 4
% 100% 85.4% 5.1% 9.5% 1.5% 0.2% 0.1% 0.0% 0.5% 0.0% 0.3% 0.0% 0.4% 0.0%# 1131 940 72 119 16 2 1 1 4 1 7% 100% 83.1% 6.4% 10.5% 1.4% 0.2% 0.1% 0.1% 0.4% 0.0% 0.1% 0.0% 0.6% 0.0%
Difference # 99 59 19 21 1 0 0 1 -1 0 -2 0 3 0Ratio Change % - -2.3% 1.2% 1.0% 0.0% 0.0% 0.0% 0.1% -0.1% 0.0% -0.2% 0.0% 0.2% 0.0%Net Change % 9.6% 6.7% 35.8% 21.4% 6.7% 0.0% 0.0% - -20.0% - -66.7% - 75.0% -
#% - - - - - - - - - - - - - -#% - - - - - - - - - - - - - -
Difference # 0 0 0 0 0 0 0 0 0 0 0 0 0 0Ratio Change % - - - - - - - - - - - - - -Net Change % - - - - - - - - - - - - - -
Prior FY
(16-18)Deafness
(21, 23, 25)Blindness
(28,30,32-38)Missing
Extremities
Employment Tenure
Total Workforce
(91)PsychiatricDisability
(92)Distortion ofLimb/Spine,Dwarfism
(01)Not
Identified
(64-69)Partial
Paralysis
Fish & Wildlife Service - Servicewide FY2015Table B1: TOTAL WORKFORCE - Distribution by Disability
TotalTotal by Disability Status Detail for Targeted Disabilities
(04, 05)No
Disability
(06-94)ReportableDisability
TargetedDisability
(90)Severe
IntellectualDisability
(71-79)Total
Paralysis
(82)Epilepsy
Current FY
Non-Appropriated Workforce
Current FY
Prior FY
Current FY
Prior FY
Current FY
Prior FY
Permanent Workforce
Temporary Workforce

# 7814 6841 231 742 104 13 6 3 23 6 12 1 40
% 100% 87.5% 3.0% 9.5% 1.3% 0.2% 0.1% 0.0% 0.3% 0.1% 0.2% 0.0% 0.5% 0.0%
Federal Goal % 2.0%
# 907 779 37 91 12 1 3 2 3 3
% 100% 85.9% 4.1% 10.0% 1.3% 0.0% 0.1% 0.3% 0.2% 0.0% 0.3% 0.0% 0.3% 0.0%
# 771 668 11 92 12 1 2 3 1 5
% 100% 86.6% 1.4% 11.9% 1.6% 0.1% 0.3% 0.0% 0.4% 0.0% 0.1% 0.0% 0.6% 0.0%
# 871 769 23 79 13 2 2 4 2 3
% 100% 88.3% 2.6% 9.1% 1.5% 0.2% 0.2% 0.0% 0.5% 0.2% 0.0% 0.0% 0.3% 0.0%
# 1213 1066 47 100 8 1 2 5
% 100% 87.9% 3.9% 8.2% 0.7% 0.0% 0.0% 0.0% 0.1% 0.2% 0.0% 0.0% 0.4% 0.0%
# 709 632 21 56 8 3 3 2
% 100% 89.1% 3.0% 7.9% 1.1% 0.4% 0.0% 0.0% 0.4% 0.0% 0.3% 0.0% 0.0% 0.0%
# 816 728 18 70 5 2 1 2
% 100% 89.2% 2.2% 8.6% 0.6% 0.0% 0.0% 0.0% 0.2% 0.0% 0.0% 0.1% 0.2% 0.0%
# 492 411 27 54 8 1 2 1 4
% 100% 83.5% 5.5% 11.0% 1.6% 0.2% 0.0% 0.0% 0.4% 0.0% 0.2% 0.0% 0.8% 0.0%
# 710 634 18 58 6 1 2 3
% 100% 89.3% 2.5% 8.2% 0.8% 0.1% 0.0% 0.0% 0.3% 0.0% 0.0% 0.0% 0.4% 0.0%
# 1325 1154 29 142 32 5 1 4 2 5 15
% 100% 87.1% 2.2% 10.7% 2.4% 0.4% 0.1% 0.0% 0.3% 0.2% 0.4% 0.0% 1.1% 0.0%
Region 7
Region 8
Headquarters
Fish & Wildlife Service - Servicewide as of September 30, 2015Table B2: PERMANENT WORKFORCE BY COMPONENT - Distribution by Disability
TotalTotal by Disability Status Detail for Targeted Disabilities
(04, 05)No
Disability
(06-94)ReportableDisability
TargetedDisability
(90)Severe
IntellectualDisability
Region 4
Region 5
Region 6
(16-18)DeafnessComponent
Total
Region 1
Region 2
Region 3
(91)PsychiatricDisability
(92)Distortion ofLimb/Spine,Dwarfism
(01)Not
Identified
(64-69)Partial
Paralysis
(71-79)Total
Paralysis
(82)Epilepsy
(21, 23, 25)Blindness
(28,30,32-38)Missing
Extremities

1. Officials and Managers
# 147 134 4 9
% 100% 91.2% 2.7% 6.1% 0.0% 0.0% 0.0% 0.0% 0.0% 0.0% 0.0% 0.0% 0.0% 0.0%
# 943 863 24 56 8 1 1 3 1 2
% 100% 91.5% 2.5% 5.9% 0.8% 0.1% 0.1% 0.0% 0.3% 0.0% 0.1% 0.0% 0.2% 0.0%
# 468 432 9 27 1 1
% 100% 92.3% 1.9% 5.8% 0.2% 0.2% 0.0% 0.0% 0.0% 0.0% 0.0% 0.0% 0.0% 0.0%
# 1157 985 38 134 19 1 5 1 4 8
% 100% 85.1% 3.3% 11.6% 1.6% 0.0% 0.1% 0.0% 0.4% 0.1% 0.3% 0.0% 0.7% 0.0%
# 2715 2414 75 226 28 2 2 8 1 5 10
% 100% 88.9% 2.8% 8.3% 1.0% 0.1% 0.1% 0.0% 0.3% 0.0% 0.2% 0.0% 0.4% 0.0%
# 3277 2915 99 263 31 6 3 1 4 1 4 12
% 100% 89.0% 3.0% 8.0% 0.9% 0.2% 0.1% 0.0% 0.1% 0.0% 0.1% 0.0% 0.4% 0.0%
# 259 231 6 22 3 2 1
% 100% 89.2% 2.3% 8.5% 1.2% 0.8% 0.0% 0.0% 0.0% 0.0% 0.0% 0.0% 0.4% 0.0%
#
% - - - - - - - - - - - - - -
# 599 433 23 143 35 2 1 2 8 3 3 1 15
% 100% 72.3% 3.8% 23.9% 5.8% 0.3% 0.2% 0.3% 1.3% 0.5% 0.5% 0.2% 2.5% 0.0%
# 505 435 14 56 3 1 1 1
% 100% 86.1% 2.8% 11.1% 0.6% 0.2% 0.0% 0.0% 0.2% 0.0% 0.0% 0.0% 0.2% 0.0%
# 15 10 3 2
% 100% 66.7% 20.0% 13.3% 0.0% 0.0% 0.0% 0.0% 0.0% 0.0% 0.0% 0.0% 0.0% 0.0%
# 60 48 4 8 1 1
% 100% 80.0% 6.7% 13.3% 1.7% 0.0% 0.0% 0.0% 0.0% 0.0% 0.0% 0.0% 1.7% 0.0%
# 358 332 7 19 2 1 1
% 100% 92.7% 2.0% 5.3% 0.6% 0.0% 0.0% 0.0% 0.3% 0.3% 0.0% 0.0% 0.0% 0.0%
(91)PsychiatricDisability
(92)Distortion ofLimb/Spine,Dwarfism
(01)Not
Identified
(64-69)Partial
Paralysis
(71-79)Total
Paralysis
(82)Epilepsy
Officials and Managers - TOTAL
2. Professionals
3. Technicians
(16-18)DeafnessOccupational Category
Executive/Senior Level (Grades 15 and Above)
Mid-level (Grades 13-14)
First-Level (Grades 12 and Below)
- Other
Fish & Wildlife Service - Servicewide as of September 30, 2015Table B3-1: OCCUPATIONAL CATEGORIES - Distribution by Disability - Permanent Workforce
TotalTotal by Disability Status Detail for Targeted Disabilities
(04, 05)No
Disability
(06-94)ReportableDisability
TargetedDisability
(21, 23, 25)Blindness
(28,30,32-38)Missing
Extremities
(90)Severe
IntellectualDisability
8. Laborers and Helpers
9. Service Workers
4. Sales Workers
5. Administrative Support Workers
6. Craft Workers
7. Operatives

1. Officials and Managers
# 147 134 4 9
% 1.9% 2.0% 1.7% 1.2% 0.0% 0.0% 0.0% 0.0% 0.0% 0.0% 0.0% 0.0% 0.0% -
# 943 863 24 56 8 1 1 3 1 2
% 12.1% 12.6% 10.4% 7.5% 7.7% 7.7% 16.7% 0.0% 13.0% 0.0% 8.3% 0.0% 5.0% -
# 468 432 9 27 1 1
% 6.0% 6.3% 3.9% 3.6% 1.0% 7.7% 0.0% 0.0% 0.0% 0.0% 0.0% 0.0% 0.0% -
# 1157 985 38 134 19 1 5 1 4 8
% 14.8% 14.4% 16.5% 18.1% 18.3% 0.0% 16.7% 0.0% 21.7% 16.7% 33.3% 0.0% 20.0% -
# 2715 2414 75 226 28 2 2 8 1 5 10
% 34.7% 35.3% 32.5% 30.5% 26.9% 15.4% 33.3% 0.0% 34.8% 16.7% 41.7% 0.0% 25.0% -
# 3277 2915 99 263 31 6 3 1 4 1 4 12
% 41.9% 42.6% 42.9% 35.4% 29.8% 46.2% 50.0% 33.3% 17.4% 16.7% 33.3% 0.0% 30.0% -
# 259 231 6 22 3 2 1
% 3.3% 3.4% 2.6% 3.0% 2.9% 15.4% 0.0% 0.0% 0.0% 0.0% 0.0% 0.0% 2.5% -
#
% 0.0% 0.0% 0.0% 0.0% 0.0% 0.0% 0.0% 0.0% 0.0% 0.0% 0.0% 0.0% 0.0% -
# 599 433 23 143 35 2 1 2 8 3 3 1 15
% 7.7% 6.3% 10.0% 19.3% 33.7% 15.4% 16.7% 66.7% 34.8% 50.0% 25.0% 100.0% 37.5% -
# 505 435 14 56 3 1 1 1
% 6.5% 6.4% 6.1% 7.5% 2.9% 7.7% 0.0% 0.0% 4.3% 0.0% 0.0% 0.0% 2.5% -
# 15 10 3 2
% 0.2% 0.1% 1.3% 0.3% 0.0% 0.0% 0.0% 0.0% 0.0% 0.0% 0.0% 0.0% 0.0% -
# 60 48 4 8 1 1
% 0.8% 0.7% 1.7% 1.1% 1.0% 0.0% 0.0% 0.0% 0.0% 0.0% 0.0% 0.0% 2.5% -
# 358 332 7 19 2 1 1
% 4.6% 4.9% 3.0% 2.6% 1.9% 0.0% 0.0% 0.0% 4.3% 16.7% 0.0% 0.0% 0.0% -
# 7814 6841 231 742 104 13 6 3 23 6 12 1 40
% 100% 100% 100% 100% 100% 100% 100% 100% 100% 100% 100% 100% 100% -
8. Laborers and Helpers
9. Service Workers
Permanent Workforce
4. Sales Workers
5. Administrative Support Workers
6. Craft Workers
7. Operatives
Fish & Wildlife Service - Servicewide as of September 30, 2015Table B3-2: OCCUPATIONAL CATEGORIES - Distribution by Disability - Permanent Workforce
TotalTotal by Disability Status Detail for Targeted Disabilities
(04, 05)No
Disability
(06-94)ReportableDisability
TargetedDisability
(21, 23, 25)Blindness
(28,30,32-38)Missing
Extremities
(90)Severe
IntellectualDisability
Officials and Managers - TOTAL
2. Professionals
3. Technicians
(16-18)DeafnessOccupational Category
Executive/Senior Level (Grades 15 and Above)
Mid-level (Grades 13-14)
First-Level (Grades 12 and Below)
- Other
(91)PsychiatricDisability
(92)Distortion ofLimb/Spine,Dwarfism
(01)Not
Identified
(64-69)Partial
Paralysis
(71-79)Total
Paralysis
(82)Epilepsy
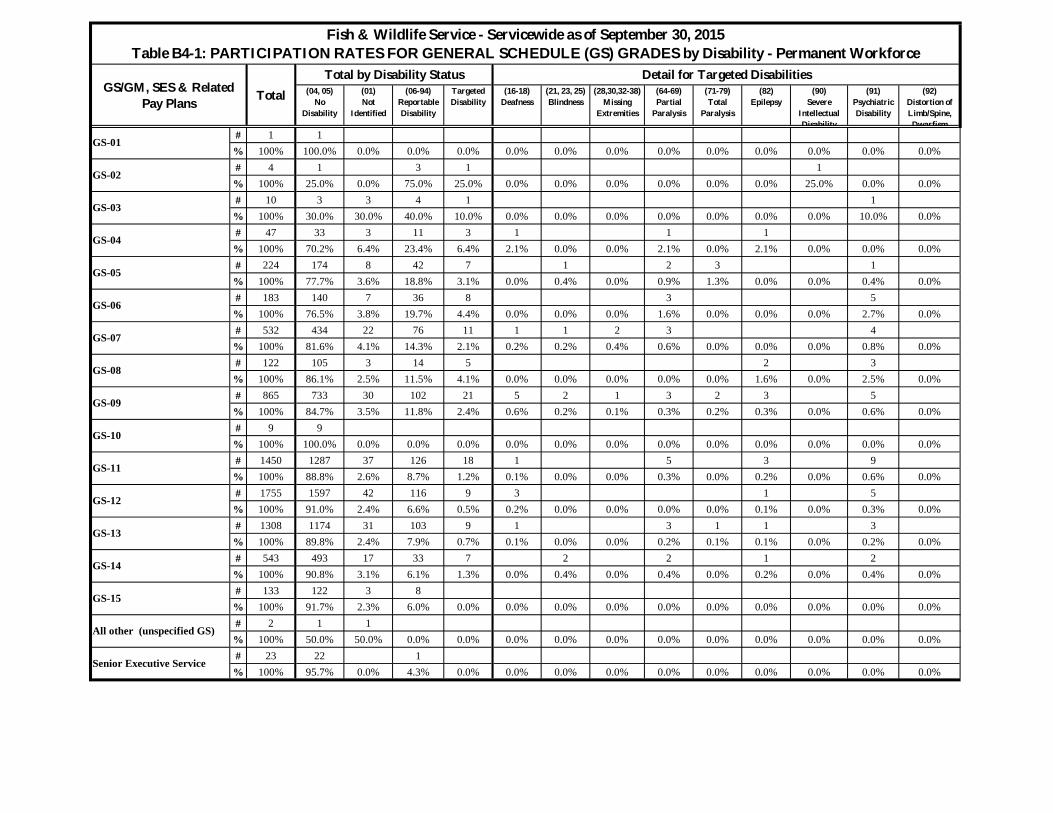
# 1 1% 100% 100.0% 0.0% 0.0% 0.0% 0.0% 0.0% 0.0% 0.0% 0.0% 0.0% 0.0% 0.0% 0.0%# 4 1 3 1 1% 100% 25.0% 0.0% 75.0% 25.0% 0.0% 0.0% 0.0% 0.0% 0.0% 0.0% 25.0% 0.0% 0.0%# 10 3 3 4 1 1% 100% 30.0% 30.0% 40.0% 10.0% 0.0% 0.0% 0.0% 0.0% 0.0% 0.0% 0.0% 10.0% 0.0%# 47 33 3 11 3 1 1 1% 100% 70.2% 6.4% 23.4% 6.4% 2.1% 0.0% 0.0% 2.1% 0.0% 2.1% 0.0% 0.0% 0.0%# 224 174 8 42 7 1 2 3 1% 100% 77.7% 3.6% 18.8% 3.1% 0.0% 0.4% 0.0% 0.9% 1.3% 0.0% 0.0% 0.4% 0.0%# 183 140 7 36 8 3 5% 100% 76.5% 3.8% 19.7% 4.4% 0.0% 0.0% 0.0% 1.6% 0.0% 0.0% 0.0% 2.7% 0.0%# 532 434 22 76 11 1 1 2 3 4% 100% 81.6% 4.1% 14.3% 2.1% 0.2% 0.2% 0.4% 0.6% 0.0% 0.0% 0.0% 0.8% 0.0%# 122 105 3 14 5 2 3% 100% 86.1% 2.5% 11.5% 4.1% 0.0% 0.0% 0.0% 0.0% 0.0% 1.6% 0.0% 2.5% 0.0%# 865 733 30 102 21 5 2 1 3 2 3 5% 100% 84.7% 3.5% 11.8% 2.4% 0.6% 0.2% 0.1% 0.3% 0.2% 0.3% 0.0% 0.6% 0.0%# 9 9% 100% 100.0% 0.0% 0.0% 0.0% 0.0% 0.0% 0.0% 0.0% 0.0% 0.0% 0.0% 0.0% 0.0%# 1450 1287 37 126 18 1 5 3 9% 100% 88.8% 2.6% 8.7% 1.2% 0.1% 0.0% 0.0% 0.3% 0.0% 0.2% 0.0% 0.6% 0.0%# 1755 1597 42 116 9 3 1 5% 100% 91.0% 2.4% 6.6% 0.5% 0.2% 0.0% 0.0% 0.0% 0.0% 0.1% 0.0% 0.3% 0.0%# 1308 1174 31 103 9 1 3 1 1 3% 100% 89.8% 2.4% 7.9% 0.7% 0.1% 0.0% 0.0% 0.2% 0.1% 0.1% 0.0% 0.2% 0.0%# 543 493 17 33 7 2 2 1 2% 100% 90.8% 3.1% 6.1% 1.3% 0.0% 0.4% 0.0% 0.4% 0.0% 0.2% 0.0% 0.4% 0.0%# 133 122 3 8% 100% 91.7% 2.3% 6.0% 0.0% 0.0% 0.0% 0.0% 0.0% 0.0% 0.0% 0.0% 0.0% 0.0%# 2 1 1% 100% 50.0% 50.0% 0.0% 0.0% 0.0% 0.0% 0.0% 0.0% 0.0% 0.0% 0.0% 0.0% 0.0%# 23 22 1% 100% 95.7% 0.0% 4.3% 0.0% 0.0% 0.0% 0.0% 0.0% 0.0% 0.0% 0.0% 0.0% 0.0%
Senior Executive Service
GS-13
GS-14
GS-15
All other (unspecified GS)
Fish & Wildlife Service - Servicewide as of September 30, 2015Table B4-1: PARTICIPATION RATES FOR GENERAL SCHEDULE (GS) GRADES by Disability - Permanent Workforce
TotalTotal by Disability Status Detail for Targeted Disabilities
(04, 05)No
Disability
GS-10
(64-69)Partial
Paralysis
(71-79)Total
Paralysis
(82)Epilepsy
(16-18)Deafness
(28,30,32-38)Missing
Extremities
GS-02
GS-04
(06-94)ReportableDisability
(91)PsychiatricDisability
(90)Severe
IntellectualDisability
(01)Not
Identified
(92)Distortion ofLimb/Spine,Dwarfism
TargetedDisability
(21, 23, 25)Blindness
GS-11
GS-12
GS/GM, SES & Related Pay Plans
GS-01
GS-05
GS-06
GS-07
GS-08
GS-09
GS-03

# 3 3% 100% 100.0% 0.0% 0.0% 0.0% 0.0% 0.0% 0.0% 0.0% 0.0% 0.0% 0.0% 0.0% 0.0%# 12 8 4% 100% 66.7% 0.0% 33.3% 0.0% 0.0% 0.0% 0.0% 0.0% 0.0% 0.0% 0.0% 0.0% 0.0%# 103 81 8 14 3 1 2% 100% 78.6% 7.8% 13.6% 2.9% 0.0% 1.0% 0.0% 1.9% 0.0% 0.0% 0.0% 0.0% 0.0%# 184 161 9 14 1 1% 100% 87.5% 4.9% 7.6% 0.5% 0.0% 0.0% 0.0% 0.5% 0.0% 0.0% 0.0% 0.0% 0.0%# 305 250 26 29 3 1 2% 100% 82.0% 8.5% 9.5% 1.0% 0.3% 0.0% 0.0% 0.0% 0.0% 0.0% 0.0% 0.7% 0.0%# 48 40 2 6 3 1 2% 100% 83.3% 4.2% 12.5% 6.3% 0.0% 0.0% 0.0% 2.1% 0.0% 0.0% 0.0% 4.2% 0.0%# 110 94 9 7% 100% 85.5% 8.2% 6.4% 0.0% 0.0% 0.0% 0.0% 0.0% 0.0% 0.0% 0.0% 0.0% 0.0%# 3 3% 100% 100.0% 0.0% 0.0% 0.0% 0.0% 0.0% 0.0% 0.0% 0.0% 0.0% 0.0% 0.0% 0.0%# 111 94 6 11 3 1 1 1% 100% 84.7% 5.4% 9.9% 2.7% 0.9% 0.0% 0.0% 0.0% 0.0% 0.9% 0.0% 0.9% 0.0%#% - - - - - - - - - - - - - -# 78 69 2 7% 100% 88.5% 2.6% 9.0% 0.0% 0.0% 0.0% 0.0% 0.0% 0.0% 0.0% 0.0% 0.0% 0.0%# 15 12 1 2% 100% 80.0% 6.7% 13.3% 0.0% 0.0% 0.0% 0.0% 0.0% 0.0% 0.0% 0.0% 0.0% 0.0%# 7 7% 100% 100.0% 0.0% 0.0% 0.0% 0.0% 0.0% 0.0% 0.0% 0.0% 0.0% 0.0% 0.0% 0.0%# 5 4 1% 100% 80.0% 0.0% 20.0% 0.0% 0.0% 0.0% 0.0% 0.0% 0.0% 0.0% 0.0% 0.0% 0.0%#% - - - - - - - - - - - - - -#% - - - - - - - - - - - - - -# 1 1% 100% 100.0% 0.0% 0.0% 0.0% 0.0% 0.0% 0.0% 0.0% 0.0% 0.0% 0.0% 0.0% 0.0%
GS-12
GS/GM, SES & Related Pay Plans
GS-01
GS-05
GS-06
GS-07
GS-08
GS-09
GS-10
(64-69)Partial
Paralysis
(71-79)Total
Paralysis
(82)Epilepsy
(16-18)Deafness
GS-11
(28,30,32-38)Missing
Extremities
Fish & Wildlife Service - Servicewide as of September 30, 2015Table B4-1: PARTICIPATION RATES FOR GENERAL SCHEDULE (GS) GRADES by Disability - Temporary Workforce
TotalTotal by Disability Status Detail for Targeted Disabilities
(04, 05)No
Disability
(06-94)ReportableDisability
TargetedDisability
(21, 23, 25)Blindness
(91)PsychiatricDisability
(92)Distortion ofLimb/Spine,Dwarfism
Senior Executive Service
GS-13
GS-14
GS-15
All other (unspecified GS)
(90)Severe
IntellectualDisability
GS-02
GS-03
GS-04
(01)Not
Identified

# 1 1% 0.0% 0.0% 0.0% 0.0% 0.0% 0.0% 0.0% 0.0% 0.0% 0.0% 0.0% 0.0% 0.0% -# 4 1 3 1 1% 0.1% 0.0% 0.0% 0.4% 1.0% 0.0% 0.0% 0.0% 0.0% 0.0% 0.0% 100.0% 0.0% -# 10 3 3 4 1 1% 0.1% 0.0% 1.4% 0.6% 1.0% 0.0% 0.0% 0.0% 0.0% 0.0% 0.0% 0.0% 2.6% -# 47 33 3 11 3 1 1 1% 0.7% 0.5% 1.4% 1.6% 3.0% 8.3% 0.0% 0.0% 4.5% 0.0% 8.3% 0.0% 0.0% -# 224 174 8 42 7 1 2 3 1% 3.1% 2.7% 3.9% 6.2% 7.0% 0.0% 16.7% 0.0% 9.1% 50.0% 0.0% 0.0% 2.6% -# 183 140 7 36 8 3 5% 2.5% 2.2% 3.4% 5.3% 8.0% 0.0% 0.0% 0.0% 13.6% 0.0% 0.0% 0.0% 13.2% -# 532 434 22 76 11 1 1 2 3 4% 7.4% 6.9% 10.6% 11.3% 11.0% 8.3% 16.7% 66.7% 13.6% 0.0% 0.0% 0.0% 10.5% -# 122 105 3 14 5 2 3% 1.7% 1.7% 1.4% 2.1% 5.0% 0.0% 0.0% 0.0% 0.0% 0.0% 16.7% 0.0% 7.9% -# 865 733 30 102 21 5 2 1 3 2 3 5% 12.0% 11.6% 14.5% 15.1% 21.0% 41.7% 33.3% 33.3% 13.6% 33.3% 25.0% 0.0% 13.2% -# 9 9% 0.1% 0.1% 0.0% 0.0% 0.0% 0.0% 0.0% 0.0% 0.0% 0.0% 0.0% 0.0% 0.0% -# 1450 1287 37 126 18 1 5 3 9% 20.1% 20.3% 17.9% 18.7% 18.0% 8.3% 0.0% 0.0% 22.7% 0.0% 25.0% 0.0% 23.7% -# 1755 1597 42 116 9 3 1 5% 24.3% 25.2% 20.3% 17.2% 9.0% 25.0% 0.0% 0.0% 0.0% 0.0% 8.3% 0.0% 13.2% -# 1308 1174 31 103 9 1 3 1 1 3% 18.1% 18.5% 15.0% 15.3% 9.0% 8.3% 0.0% 0.0% 13.6% 16.7% 8.3% 0.0% 7.9% -# 543 493 17 33 7 2 2 1 2% 7.5% 7.8% 8.2% 4.9% 7.0% 0.0% 33.3% 0.0% 9.1% 0.0% 8.3% 0.0% 5.3% -# 133 122 3 8% 1.8% 1.9% 1.4% 1.2% 0.0% 0.0% 0.0% 0.0% 0.0% 0.0% 0.0% 0.0% 0.0% -# 2 1 1% 0.0% 0.0% 0.5% 0.0% 0.0% 0.0% 0.0% 0.0% 0.0% 0.0% 0.0% 0.0% 0.0% -# 23 22 1% 0.3% 0.3% 0.0% 0.1% 0.0% 0.0% 0.0% 0.0% 0.0% 0.0% 0.0% 0.0% 0.0% -# 7211 6329 207 675 100 12 6 3 22 6 12 1 38% 100% 100% 100% 100% 100% 100% 100% 100% 100% 100% 100% 100% 100% -
TOTAL
NOTE: Percentages computed down columns and NOT across rows.
GS-10
GS-11
GS-12
Senior Executive Service
GS-13
GS-14
GS-15
All other (unspecified GS)
GS-01
GS/GM, SES & Related Pay Plans
Fish & Wildlife Service - Servicewide as of September 30, 2015Table B4-2: PARTICIPATION RATES FOR GENERAL SCHEDULE (GS) GRADES by Disability - Permanent Workforce
TotalTotal by Disability Status Detail for Targeted Disabilities
(04, 05)No
Disability
(06-94)ReportableDisability
TargetedDisability
(21, 23, 25)Blindness
(91)PsychiatricDisability
(92)Distortion ofLimb/Spine,Dwarfism
(01)Not
Identified
(64-69)Partial
Paralysis
(71-79)Total
Paralysis
(82)Epilepsy
(16-18)Deafness
(28,30,32-38)Missing
Extremities
(90)Severe
IntellectualDisability
GS-06
GS-07
GS-08
GS-09
GS-02
GS-03
GS-04
GS-05

# 3 3% 0.3% 0.4% 0.0% 0.0% 0.0% 0.0% 0.0% - 0.0% - 0.0% - 0.0% -# 12 8 4% 1.2% 1.0% 0.0% 4.2% 0.0% 0.0% 0.0% - 0.0% - 0.0% - 0.0% -# 103 81 8 14 3 1 2% 10.5% 9.8% 12.7% 14.7% 23.1% 0.0% 100.0% - 50.0% - 0.0% - 0.0% -# 184 161 9 14 1 1% 18.7% 19.5% 14.3% 14.7% 7.7% 0.0% 0.0% - 25.0% - 0.0% - 0.0% -# 305 250 26 29 3 1 2% 31.0% 30.2% 41.3% 30.5% 23.1% 50.0% 0.0% - 0.0% - 0.0% - 40.0% -# 48 40 2 6 3 1 2% 4.9% 4.8% 3.2% 6.3% 23.1% 0.0% 0.0% - 25.0% - 0.0% - 40.0% -# 110 94 9 7% 11.2% 11.4% 14.3% 7.4% 0.0% 0.0% 0.0% - 0.0% - 0.0% - 0.0% -# 3 3% 0.3% 0.4% 0.0% 0.0% 0.0% 0.0% 0.0% - 0.0% - 0.0% - 0.0% -# 111 94 6 11 3 1 1 1% 11.3% 11.4% 9.5% 11.6% 23.1% 50.0% 0.0% - 0.0% - 100.0% - 20.0% -#% 0.0% 0.0% 0.0% 0.0% 0.0% 0.0% 0.0% - 0.0% - 0.0% - 0.0% -# 78 69 2 7% 7.9% 8.3% 3.2% 7.4% 0.0% 0.0% 0.0% - 0.0% - 0.0% - 0.0% -# 15 12 1 2% 1.5% 1.5% 1.6% 2.1% 0.0% 0.0% 0.0% - 0.0% - 0.0% - 0.0% -# 7 7% 0.7% 0.8% 0.0% 0.0% 0.0% 0.0% 0.0% - 0.0% - 0.0% - 0.0% -# 5 4 1% 0.5% 0.5% 0.0% 1.1% 0.0% 0.0% 0.0% - 0.0% - 0.0% - 0.0% -#% 0.0% 0.0% 0.0% 0.0% 0.0% 0.0% 0.0% - 0.0% - 0.0% - 0.0% -#% 0.0% 0.0% 0.0% 0.0% 0.0% 0.0% 0.0% - 0.0% - 0.0% - 0.0% -# 1 1% 0.1% 0.1% 0.0% 0.0% 0.0% 0.0% 0.0% - 0.0% - 0.0% - 0.0% -# 985 827 63 95 13 2 1 4 1 5% 100% 100% 100% 100% 100% 100% 100% - 100% - 100% - 100% -
GS-08
GS-09
GS-02
GS-03
GS-04
GS-05
GS-06
GS-07
(91)PsychiatricDisability
(92)Distortion ofLimb/Spine,Dwarfism
(01)Not
Identified
(64-69)Partial
Paralysis
(71-79)Total
Paralysis
(82)Epilepsy
(16-18)Deafness
(28,30,32-38)Missing
Extremities
(90)Severe
IntellectualDisability
GS-01
GS/GM, SES & Related Pay Plans
Fish & Wildlife Service - Servicewide as of September 30, 2015Table B4-2: PARTICIPATION RATES FOR GENERAL SCHEDULE (GS) GRADES by Disability - Temporary Workforce
TotalTotal by Disability Status Detail for Targeted Disabilities
(04, 05)No
Disability
(06-94)ReportableDisability
TargetedDisability
(21, 23, 25)Blindness
TOTAL
NOTE: Percentages computed down columns and NOT across rows.
GS-10
GS-11
GS-12
Senior Executive Service
GS-13
GS-14
GS-15
All other (unspecified GS)

# 19 16 1 2
% 100% 84.2% 5.3% 10.5% 0.0% 0.0% 0.0% 0.0% 0.0% 0.0% 0.0% 0.0% 0.0% 0.0%
# 4 3 1
% 100% 75.0% 25.0% 0.0% 0.0% 0.0% 0.0% 0.0% 0.0% 0.0% 0.0% 0.0% 0.0% 0.0%
# 3 1 1 1 1 1
% 100% 33.3% 33.3% 33.3% 33.3% 0.0% 0.0% 0.0% 0.0% 0.0% 0.0% 0.0% 33.3% 0.0%
# 5 4 1
% 100% 80.0% 0.0% 20.0% 0.0% 0.0% 0.0% 0.0% 0.0% 0.0% 0.0% 0.0% 0.0% 0.0%
# 42 34 3 5
% 100% 81.0% 7.1% 11.9% 0.0% 0.0% 0.0% 0.0% 0.0% 0.0% 0.0% 0.0% 0.0% 0.0%
# 28 18 2 8
% 100% 64.3% 7.1% 28.6% 0.0% 0.0% 0.0% 0.0% 0.0% 0.0% 0.0% 0.0% 0.0% 0.0%
# 52 45 1 6
% 100% 86.5% 1.9% 11.5% 0.0% 0.0% 0.0% 0.0% 0.0% 0.0% 0.0% 0.0% 0.0% 0.0%
# 182 146 10 26 2 1 1
% 100% 80.2% 5.5% 14.3% 1.1% 0.0% 0.0% 0.0% 0.5% 0.0% 0.0% 0.0% 0.5% 0.0%
# 99 90 4 5
% 100% 90.9% 4.0% 5.1% 0.0% 0.0% 0.0% 0.0% 0.0% 0.0% 0.0% 0.0% 0.0% 0.0%
# 153 142 11 1 1
% 100% 92.8% 0.0% 7.2% 0.7% 0.7% 0.0% 0.0% 0.0% 0.0% 0.0% 0.0% 0.0% 0.0%
# 4 3 1
% 100% 75.0% 0.0% 25.0% 0.0% 0.0% 0.0% 0.0% 0.0% 0.0% 0.0% 0.0% 0.0% 0.0%
#% - - - - - - - - - - - - - -
#% - - - - - - - - - - - - - -
#% - - - - - - - - - - - - - -
#% - - - - - - - - - - - - - -
# 4 4
% 100% 100.0% 0.0% 0.0% 0.0% 0.0% 0.0% 0.0% 0.0% 0.0% 0.0% 0.0% 0.0% 0.0%
Grade-14
Grade-15
All Other Non-supervisory Wage Grades
Grade-10
Grade-11
Grade-12
Grade-13
Grade-09
Grade-01
Grade-02
Grade-03
Grade-04
Grade-05
Grade-06
Grade-07
Grade-08
(92)Distortion ofLimb/Spine,Dwarfism
(01)Not
Identified
(64-69)Partial
Paralysis
(71-79)Total
Paralysis
(82)Epilepsy
(16-18)Deafness
(28,30,32-38)Missing
Extremities
(90)Severe
IntellectualDisability
WG, WL & Equivalent Pay Plans
Fish & Wildlife Service - Servicewide as of September 30, 2015Table B5NS-1: PARTICIPATION RATES FOR NON-SUPERVISORY WAGE GRADES by Disability - Permanent Workforce
TotalTotal by Disability Status Detail for Targeted Disabilities
(04, 05)No
Disability
(06-94)ReportableDisability
TargetedDisability
(21, 23, 25)Blindness
(91)PsychiatricDisability

# 11 8 3
% 100% 72.7% 0.0% 27.3% 0.0% 0.0% 0.0% 0.0% 0.0% 0.0% 0.0% 0.0% 0.0% 0.0%
# 10 7 2 1
% 100% 70.0% 20.0% 10.0% 0.0% 0.0% 0.0% 0.0% 0.0% 0.0% 0.0% 0.0% 0.0% 0.0%
# 15 12 2 1 1 1
% 100% 80.0% 13.3% 6.7% 6.7% 0.0% 0.0% 6.7% 0.0% 0.0% 0.0% 0.0% 0.0% 0.0%
# 6 5 1
% 100% 83.3% 0.0% 16.7% 0.0% 0.0% 0.0% 0.0% 0.0% 0.0% 0.0% 0.0% 0.0% 0.0%
# 53 45 1 7 1 1
% 100% 84.9% 1.9% 13.2% 1.9% 0.0% 0.0% 0.0% 0.0% 0.0% 0.0% 0.0% 1.9% 0.0%
# 12 6 1 5
% 100% 50.0% 8.3% 41.7% 0.0% 0.0% 0.0% 0.0% 0.0% 0.0% 0.0% 0.0% 0.0% 0.0%
# 11 8 3 1 1
% 100% 72.7% 0.0% 27.3% 9.1% 0.0% 0.0% 0.0% 0.0% 0.0% 0.0% 0.0% 9.1% 0.0%
# 20 14 3 3
% 100% 70.0% 15.0% 15.0% 0.0% 0.0% 0.0% 0.0% 0.0% 0.0% 0.0% 0.0% 0.0% 0.0%
# 3 3
% 100% 100.0% 0.0% 0.0% 0.0% 0.0% 0.0% 0.0% 0.0% 0.0% 0.0% 0.0% 0.0% 0.0%
# 5 5
% 100% 100.0% 0.0% 0.0% 0.0% 0.0% 0.0% 0.0% 0.0% 0.0% 0.0% 0.0% 0.0% 0.0%
#% - - - - - - - - - - - - - -
#% - - - - - - - - - - - - - -
#% - - - - - - - - - - - - - -
#% - - - - - - - - - - - - - -
#% - - - - - - - - - - - - - -
#% - - - - - - - - - - - - - -
WG, WL & Equivalent Pay Plans
Fish & Wildlife Service - Servicewide as of September 30, 2015Table B5NS-1: PARTICIPATION RATES FOR NON-SUPERVISORY WAGE GRADES by Disability - Temporary Workforce
TotalTotal by Disability Status Detail for Targeted Disabilities
(04, 05)No
Disability
(06-94)ReportableDisability
TargetedDisability
(21, 23, 25)Blindness
(91)PsychiatricDisability
(92)Distortion ofLimb/Spine,Dwarfism
(01)Not
Identified
(64-69)Partial
Paralysis
(71-79)Total
Paralysis
(82)Epilepsy
(16-18)Deafness
(28,30,32-38)Missing
Extremities
(90)Severe
IntellectualDisability
Grade-09
Grade-01
Grade-02
Grade-03
Grade-04
Grade-05
Grade-06
Grade-07
Grade-08
Grade-14
Grade-15
All Other Non-supervisory Wage Grades
Grade-10
Grade-11
Grade-12
Grade-13

#% - - - - - - - - - - - - - -
#% - - - - - - - - - - - - - -
#% - - - - - - - - - - - - - -
# 1 1
% 100% 100.0% 0.0% 0.0% 0.0% 0.0% 0.0% 0.0% 0.0% 0.0% 0.0% 0.0% 0.0% 0.0%
#% - - - - - - - - - - - - - -
#% - - - - - - - - - - - - - -
# 1 1
% 100% 100.0% 0.0% 0.0% 0.0% 0.0% 0.0% 0.0% 0.0% 0.0% 0.0% 0.0% 0.0% 0.0%
# 1 1
% 100% 100.0% 0.0% 0.0% 0.0% 0.0% 0.0% 0.0% 0.0% 0.0% 0.0% 0.0% 0.0% 0.0%
# 1 1
% 100% 0.0% 0.0% 100.0% 0.0% 0.0% 0.0% 0.0% 0.0% 0.0% 0.0% 0.0% 0.0% 0.0%
# 4 3 1
% 100% 75.0% 25.0% 0.0% 0.0% 0.0% 0.0% 0.0% 0.0% 0.0% 0.0% 0.0% 0.0% 0.0%
#% - - - - - - - - - - - - - -
#% - - - - - - - - - - - - - -
#% - - - - - - - - - - - - - -
#% - - - - - - - - - - - - - -
#% - - - - - - - - - - - - - -
#% - - - - - - - - - - - - - -
WS, XS & Equivalent Pay Plans
Fish & Wildlife Service - Servicewide as of September 30, 2015Table B5S-1: PARTICIPATION RATES FOR SUPERVISORY WAGE GRADES by Disability - Permanent Workforce
TotalTotal by Disability Status Detail for Targeted Disabilities
(04, 05)No
Disability
(06-94)ReportableDisability
TargetedDisability
(21, 23, 25)Blindness
(91)PsychiatricDisability
(92)Distortion ofLimb/Spine,Dwarfism
(01)Not
Identified
(64-69)Partial
Paralysis
(71-79)Total
Paralysis
(82)Epilepsy
(16-18)Deafness
(28,30,32-38)Missing
Extremities
(90)Severe
IntellectualDisability
Grade-09
Grade-01
Grade-02
Grade-03
Grade-04
Grade-05
Grade-06
Grade-07
Grade-08
Grade-14
Grade-15
All Other Supervisory Wage Grades
Grade-10
Grade-11
Grade-12
Grade-13

#% - - - - - - - - - - - - - -
#% - - - - - - - - - - - - - -
#% - - - - - - - - - - - - - -
#% - - - - - - - - - - - - - -
#% - - - - - - - - - - - - - -
#% - - - - - - - - - - - - - -
#% - - - - - - - - - - - - - -
#% - - - - - - - - - - - - - -
#% - - - - - - - - - - - - - -
#% - - - - - - - - - - - - - -
#% - - - - - - - - - - - - - -
#% - - - - - - - - - - - - - -
#% - - - - - - - - - - - - - -
#% - - - - - - - - - - - - - -
#% - - - - - - - - - - - - - -
#% - - - - - - - - - - - - - -
Grade-14
Grade-15
All Other Supervisory Wage Grades
Grade-10
Grade-11
Grade-12
Grade-13
Grade-09
Grade-01
Grade-02
Grade-03
Grade-04
Grade-05
Grade-06
Grade-07
Grade-08
(92)Distortion ofLimb/Spine,Dwarfism
(01)Not
Identified
(64-69)Partial
Paralysis
(71-79)Total
Paralysis
(82)Epilepsy
(16-18)Deafness
(28,30,32-38)Missing
Extremities
(90)Severe
IntellectualDisability
WS, XS & Equivalent Pay Plans
Fish & Wildlife Service - Servicewide as of September 30, 2015Table B5S-1: PARTICIPATION RATES FOR SUPERVISORY WAGE GRADES by Disability - Temporary Workforce
TotalTotal by Disability Status Detail for Targeted Disabilities
(04, 05)No
Disability
(06-94)ReportableDisability
TargetedDisability
(21, 23, 25)Blindness
(91)PsychiatricDisability

# 19 16 1 2% 3.2% 3.2% 4.3% 3.0% 0.0% 0.0% - - 0.0% - - - 0.0% -# 4 3 1% 0.7% 0.6% 4.3% 0.0% 0.0% 0.0% - - 0.0% - - - 0.0% -# 3 1 1 1 1 1% 0.5% 0.2% 4.3% 1.5% 25.0% 0.0% - - 0.0% - - - 50.0% -# 5 4 1% 0.8% 0.8% 0.0% 1.5% 0.0% 0.0% - - 0.0% - - - 0.0% -# 42 34 3 5% 7.1% 6.7% 13.0% 7.6% 0.0% 0.0% - - 0.0% - - - 0.0% -# 28 18 2 8% 4.7% 3.6% 8.7% 12.1% 0.0% 0.0% - - 0.0% - - - 0.0% -# 52 45 1 6% 8.7% 8.9% 4.3% 9.1% 0.0% 0.0% - - 0.0% - - - 0.0% -# 182 146 10 26 2 1 1% 30.6% 28.9% 43.5% 39.4% 50.0% 0.0% - - 100.0% - - - 50.0% -# 99 90 4 5% 16.6% 17.8% 17.4% 7.6% 0.0% 0.0% - - 0.0% - - - 0.0% -# 153 142 11 1 1% 25.7% 28.1% 0.0% 16.7% 25.0% 100.0% - - 0.0% - - - 0.0% -# 4 3 1% 0.7% 0.6% 0.0% 1.5% 0.0% 0.0% - - 0.0% - - - 0.0% -#% 0.0% 0.0% 0.0% 0.0% 0.0% 0.0% - - 0.0% - - - 0.0% -#% 0.0% 0.0% 0.0% 0.0% 0.0% 0.0% - - 0.0% - - - 0.0% -#% 0.0% 0.0% 0.0% 0.0% 0.0% 0.0% - - 0.0% - - - 0.0% -#% 0.0% 0.0% 0.0% 0.0% 0.0% 0.0% - - 0.0% - - - 0.0% -# 4 4% 0.7% 0.8% 0.0% 0.0% 0.0% 0.0% - - 0.0% - - - 0.0% -# 595 506 23 66 4 1 1 2% 100% 100% 100% 100% 100% 100% - - 100% - - - 100% -
Total Non-supervisory Wage Grades
WG, WL & Equivalent Pay Plans
Fish & Wildlife Service - Servicewide as of September 30, 2015Table B5NS-2: PARTICIPATION RATES FOR NON-SUPERVISORY WAGE GRADES by Disability - Permanent Workforce
TotalTotal by Disability Status Detail for Targeted Disabilities
(04, 05)No
Disability
(06-94)ReportableDisability
TargetedDisability
(21, 23, 25)Blindness
(91)PsychiatricDisability
(92)Distortion ofLimb/Spine,Dwarfism
(01)Not
Identified
(64-69)Partial
Paralysis
(71-79)Total
Paralysis
(82)Epilepsy
(16-18)Deafness
(28,30,32-38)Missing
Extremities
(90)Severe
IntellectualDisability
Grade-09
Grade-01
Grade-02
Grade-03
Grade-04
Grade-05
Grade-06
Grade-07
Grade-08
Grade-14
Grade-15
All Other Non-supervisory Wage Grades
Grade-10
Grade-11
Grade-12
Grade-13

# 11 8 3% 7.5% 7.1% 0.0% 12.5% 0.0% - - 0.0% - - - - 0.0% -# 10 7 2 1% 6.8% 6.2% 22.2% 4.2% 0.0% - - 0.0% - - - - 0.0% -# 15 12 2 1 1 1% 10.3% 10.6% 22.2% 4.2% 33.3% - - 100.0% - - - - 0.0% -# 6 5 1% 4.1% 4.4% 0.0% 4.2% 0.0% - - 0.0% - - - - 0.0% -# 53 45 1 7 1 1% 36.3% 39.8% 11.1% 29.2% 33.3% - - 0.0% - - - - 50.0% -# 12 6 1 5% 8.2% 5.3% 11.1% 20.8% 0.0% - - 0.0% - - - - 0.0% -# 11 8 3 1 1% 7.5% 7.1% 0.0% 12.5% 33.3% - - 0.0% - - - - 50.0% -# 20 14 3 3% 13.7% 12.4% 33.3% 12.5% 0.0% - - 0.0% - - - - 0.0% -# 3 3% 2.1% 2.7% 0.0% 0.0% 0.0% - - 0.0% - - - - 0.0% -# 5 5% 3.4% 4.4% 0.0% 0.0% 0.0% - - 0.0% - - - - 0.0% -#% 0.0% 0.0% 0.0% 0.0% 0.0% - - 0.0% - - - - 0.0% -#% 0.0% 0.0% 0.0% 0.0% 0.0% - - 0.0% - - - - 0.0% -#% 0.0% 0.0% 0.0% 0.0% 0.0% - - 0.0% - - - - 0.0% -#% 0.0% 0.0% 0.0% 0.0% 0.0% - - 0.0% - - - - 0.0% -#% 0.0% 0.0% 0.0% 0.0% 0.0% - - 0.0% - - - - 0.0% -#% 0.0% 0.0% 0.0% 0.0% 0.0% - - 0.0% - - - - 0.0% -# 146 113 9 24 3 1 2% 100% 100% 100% 100% 100% - - 100% - - - - 100% -
Grade-14
Grade-15
All Other Non-supervisory Wage Grades
Grade-10
Grade-11
Grade-12
Grade-13
Grade-09
Grade-01
Grade-02
Grade-03
Grade-04
Grade-05
Grade-06
Grade-07
Grade-08
(91)PsychiatricDisability
(92)Dwarfism
(01)Not
Identified
(64-69)Partial
Paralysis
(71-79)Total
Paralysis
(82)Epilepsy
(16-18)Deafness
(28,30,32-38)Missing
Extremities
(90)Severe
Intellectual
Total Non-supervisory Wage Grades
WG, WL & Equivalent Pay Plans
Fish & Wildlife Service - Servicewide as of September 30, 2015Table B5NS-2: PARTICIPATION RATES FOR NON-SUPERVISORY WAGE GRADES by Disability - Temporary Workforce
TotalTotal by Disability Status Detail for Targeted Disabilities
(04, 05)No
Disability
(06-94)Disability
TargetedDisability
(21, 23, 25)Blindness

#% 0.0% 0.0% 0.0% 0.0% - - - - - - - - - -#% 0.0% 0.0% 0.0% 0.0% - - - - - - - - - -#% 0.0% 0.0% 0.0% 0.0% - - - - - - - - - -# 1 1% 12.5% 16.7% 0.0% 0.0% - - - - - - - - - -#% 0.0% 0.0% 0.0% 0.0% - - - - - - - - - -#% 0.0% 0.0% 0.0% 0.0% - - - - - - - - - -# 1 1% 12.5% 16.7% 0.0% 0.0% - - - - - - - - - -# 1 1% 12.5% 16.7% 0.0% 0.0% - - - - - - - - - -# 1 1% 12.5% 0.0% 0.0% 100.0% - - - - - - - - - -# 4 3 1% 50.0% 50.0% 100.0% 0.0% - - - - - - - - - -#% 0.0% 0.0% 0.0% 0.0% - - - - - - - - - -#% 0.0% 0.0% 0.0% 0.0% - - - - - - - - - -#% 0.0% 0.0% 0.0% 0.0% - - - - - - - - - -#% 0.0% 0.0% 0.0% 0.0% - - - - - - - - - -#% 0.0% 0.0% 0.0% 0.0% - - - - - - - - - -#% 0.0% 0.0% 0.0% 0.0% - - - - - - - - - -# 8 6 1 1% 100% 100% 100% 100% - - - - - - - - - -
Grade-14
Grade-15
All Other Supervisory Wage Grades
Grade-10
Grade-11
Grade-12
Grade-13
Grade-09
Grade-01
Grade-02
Grade-03
Grade-04
Grade-05
Grade-06
Grade-07
Grade-08
(91)PsychiatricDisability
(92)Distortion
ofLimb/Spine,
(01)Not
Identified
(64-69)Partial
Paralysis
(71-79)Total
Paralysis
(82)Epilepsy
(16-18)Deafness
(28,30,32-38)Missing
Extremities
(90)Severe
IntellectualDisability
Total Supervisory Wage Grades
WS, XS & Equivalent Pay Plans
Fish & Wildlife Service - Servicewide as of September 30, 2015Table B5S-2: PARTICIPATION RATES FOR SUPERVISORY WAGE GRADES by Disability - Permanent Workforce
TotalTotal by Disability Status Detail for Targeted Disabilities
(04, 05)No
Disability
(06-94)ReportableDisability
TargetedDisability
(21, 23, 25)Blindness

#% - - - - - - - - - - - - - -#% - - - - - - - - - - - - - -#% - - - - - - - - - - - - - -#% - - - - - - - - - - - - - -#% - - - - - - - - - - - - - -#% - - - - - - - - - - - - - -#% - - - - - - - - - - - - - -#% - - - - - - - - - - - - - -#% - - - - - - - - - - - - - -#% - - - - - - - - - - - - - -#% - - - - - - - - - - - - - -#% - - - - - - - - - - - - - -#% - - - - - - - - - - - - - -#% - - - - - - - - - - - - - -#% - - - - - - - - - - - - - -#% - - - - - - - - - - - - - -#% - - - - - - - - - - - - - -
Total Supervisory Wage Grades
WS, XS & Equivalent Pay Plans
Fish & Wildlife Service - Servicewide as of September 30, 2015Table B5S-2: PARTICIPATION RATES FOR SUPERVISORY WAGE GRADES by Disability - Temporary Workforce
TotalTotal by Disability Status Detail for Targeted Disabilities
(04, 05)No
Disability
(06-94)ReportableDisability
TargetedDisability
(21, 23, 25)Blindness
(91)PsychiatricDisability
(92)Distortion ofLimb/Spine,Dwarfism
(01)Not
Identified
(64-69)Partial
Paralysis
(71-79)Total
Paralysis
(82)Epilepsy
(16-18)Deafness
(28,30,32-38)Missing
Extremities
(90)Severe
IntellectualDisability
Grade-09
Grade-01
Grade-02
Grade-03
Grade-04
Grade-05
Grade-06
Grade-07
Grade-08
Grade-14
Grade-15
All Other Supervisory Wage Grades
Grade-10
Grade-11
Grade-12
Grade-13

# 1635 1487 40 108 10 1 3 6
% 100% 90.9% 2.4% 6.6% 0.6% 0.1% 0.0% 0.0% 0.2% 0.0% 0.0% 0.0% 0.4% 0.0%
# 130 118 3 9
% 100% 90.8% 2.3% 6.9% 0.0% 0.0% 0.0% 0.0% 0.0% 0.0% 0.0% 0.0% 0.0% 0.0%
# 246 231 5 10 1 1
% 100% 93.9% 2.0% 4.1% 0.4% 0.0% 0.0% 0.0% 0.4% 0.0% 0.0% 0.0% 0.0% 0.0%
# 532 489 17 26 1 1
% 100% 91.9% 3.2% 4.9% 0.2% 0.0% 0.0% 0.0% 0.2% 0.0% 0.0% 0.0% 0.0% 0.0%
# 589 543 14 32 4 3 1
% 100% 92.2% 2.4% 5.4% 0.7% 0.5% 0.0% 0.2% 0.0% 0.0% 0.0% 0.0% 0.0% 0.0%
# 518 461 10 47 3 1 1 1
% 100% 89.0% 1.9% 9.1% 0.6% 0.2% 0.0% 0.0% 0.2% 0.0% 0.0% 0.0% 0.2% 0.0%
# 197 189 5 3
% 100% 95.9% 2.5% 1.5% 0.0% 0.0% 0.0% 0.0% 0.0% 0.0% 0.0% 0.0% 0.0% 0.0%
# 237 219 6 12
% 100% 92.4% 2.5% 5.1% 0.0% 0.0% 0.0% 0.0% 0.0% 0.0% 0.0% 0.0% 0.0% 0.0%
Refuge LE, Land Mgmt LE & Conservation LE (0025LE & 1801LE)
Biological Science Technician (0404)
Fish Biology (0482)
Wildlife Biology (0486)
Fish and Wildlife Administration (0480)
Wildlife Refuge Management (0485)
Criminal Investigating (1811)
Gen Natural Resources Mgmt & Bio Sciences (0401)
(91)PsychiatricDisability
(92)Distortion ofLimb/Spine,Dwarfism
(01)Not
Identified
(64-69)Partial
Paralysis
(71-79)Total
Paralysis
(82)Epilepsy
(16-18)Deafness
(28,30,32-38)Missing
Extremities
(90)Severe
IntellectualDisability
Job Title/Series
Fish & Wildlife Service - Servicewide as of September 30, 2015Table B6: PARTICIPATION RATES FOR MAJOR OCCUPATIONS - Distribution by Disability - Permanent Workforce
TotalTotal by Disability Status Detail for Targeted Disabilities
(04, 05)No
Disability
(06-94)ReportableDisability
TargetedDisability
(21, 23, 25)Blindness

# 86 73 4 9 1 1
% 100% 84.9% 4.7% 10.5% 1.2% 1.2% 0.0% 0.0% 0.0% 0.0% 0.0% 0.0% 0.0% 0.0%
# 401 342 32 27 1 1
% 100% 85.3% 8.0% 6.7% 0.2% 0.0% 0.0% 0.0% 0.0% 0.0% 0.0% 0.0% 0.2% 0.0%
# 2 2
% 100% 100.0% 0.0% 0.0% 0.0% 0.0% 0.0% 0.0% 0.0% 0.0% 0.0% 0.0% 0.0% 0.0%
# 100 89 6 5 2 1 1
% 100% 89.0% 6.0% 5.0% 2.0% 0.0% 0.0% 0.0% 0.0% 0.0% 1.0% 0.0% 1.0% 0.0%
# 6 6
% 100% 100.0% 0.0% 0.0% 0.0% 0.0% 0.0% 0.0% 0.0% 0.0% 0.0% 0.0% 0.0% 0.0%
# 30 24 2 4
% 100% 80.0% 6.7% 13.3% 0.0% 0.0% 0.0% 0.0% 0.0% 0.0% 0.0% 0.0% 0.0% 0.0%
#
% - - - - - - - - - - - - - -
#
% - - - - - - - - - - - - - -
Job Title/Series
Fish & Wildlife Service - Servicewide as of September 30, 2015Table B6: PARTICIPATION RATES FOR MAJOR OCCUPATIONS - Distribution by Disability - Temporary Workforce
TotalTotal by Disability Status Detail for Targeted Disabilities
(04, 05)No
Disability
(06-94)ReportableDisability
TargetedDisability
(21, 23, 25)Blindness
Gen Natural Resources Mgmt & Bio Sciences (0401)
(91)PsychiatricDisability
(92)Distortion ofLimb/Spine,Dwarfism
(01)Not
Identified
(64-69)Partial
Paralysis
(71-79)Total
Paralysis
(82)Epilepsy
(16-18)Deafness
(28,30,32-38)Missing
Extremities
(90)Severe
IntellectualDisability
Refuge LE, Land Mgmt LE & Conservation LE (0025LE & 1801LE)
Biological Science Technician (0404)
Fish Biology (0482)
Wildlife Biology (0486)
Fish and Wildlife Administration (0480)
Wildlife Refuge Management (0485)
Criminal Investigating (1811)

# 55 48 6 1
% 100% 87.3% 10.9% 1.8% 0.0% 0.0% 0.0% 0.0% 0.0% 0.0% 0.0% 0.0% 0.0% 0.0%
# 42 38 4 1 1
% 100% 90.5% 0.0% 9.5% 2.4% 0.0% 0.0% 0.0% 0.0% 0.0% 0.0% 0.0% 2.4% 0.0%
# 97 86 6 5 1 1
% 100% 88.7% 6.2% 5.2% 1.0% 0.0% 0.0% 0.0% 0.0% 0.0% 0.0% 0.0% 1.0% 0.0%
# 19 17 2
% 100% 89.5% 0.0% 10.5% 0.0% 0.0% 0.0% 0.0% 0.0% 0.0% 0.0% 0.0% 0.0% 0.0%
# 9 8 1
% 100% 88.9% 0.0% 11.1% 0.0% 0.0% 0.0% 0.0% 0.0% 0.0% 0.0% 0.0% 0.0% 0.0%
# 17 14 2 1
% 100% 82.4% 11.8% 5.9% 0.0% 0.0% 0.0% 0.0% 0.0% 0.0% 0.0% 0.0% 0.0% 0.0%
# 26 22 2 2
% 100% 84.6% 7.7% 7.7% 0.0% 0.0% 0.0% 0.0% 0.0% 0.0% 0.0% 0.0% 0.0% 0.0%
# 2 2
% 100% 100.0% 0.0% 0.0% 0.0% 0.0% 0.0% 0.0% 0.0% 0.0% 0.0% 0.0% 0.0% 0.0%
# 9 9
% 100% 100.0% 0.0% 0.0% 0.0% 0.0% 0.0% 0.0% 0.0% 0.0% 0.0% 0.0% 0.0% 0.0%
#
% - - - - - - - - - - - - - -
# 9 9
% 100% 100.0% 0.0% 0.0% 0.0% 0.0% 0.0% 0.0% 0.0% 0.0% 0.0% 0.0% 0.0% 0.0%
#
% - - - - - - - - - - - - - -
# 8 6 1 1
% 100% 75.0% 12.5% 12.5% 0.0% 0.0% 0.0% 0.0% 0.0% 0.0% 0.0% 0.0% 0.0% 0.0%
From Temporary
Total Hires
From Pathways Intern
Fish Biology (0482)
From Temporary
From Pathways Intern
Accessions
Total Hires
Biological Science Technician (0404)
Accessions
Fish and Wildlife Administration (0480)
Accessions
From Temporary
Total Hires
(92)Distortion ofLimb/Spine,Dwarfism
(01)Not
Identified
(64-69)Partial
Paralysis
(71-79)Total
Paralysis
(82)Epilepsy
General Natural Resources Management and Biological Sciences (0401)
Fish & Wildlife Service - Servicewide FY2015Table B7-ALT: HIRES by Disability - Permanent Workforce (1 of 3 pages)
TotalTotal by Disability Status Detail for Targeted Disabilities
(04, 05)No
Disability
(06-94)ReportableDisability
TargetedDisability
(21, 23, 25)Blindness
(91)PsychiatricDisability
(90)Severe
IntellectualDisability
Job Title/Series
Accessions
(16-18)Deafness
(28,30,32-38)Missing
Extremities
From Pathways Intern

(92)Distortion ofLimb/Spine,Dwarfism
(01)Not
Identified
(64-69)Partial
Paralysis
(71-79)Total
Paralysis
(82)Epilepsy
Fish & Wildlife Service - Servicewide FY2015Table B7-ALT: HIRES by Disability - Permanent Workforce (2 of 3 pages)
TotalTotal by Disability Status Detail for Targeted Disabilities
(04, 05)No
Disability
(06-94)ReportableDisability
TargetedDisability
(21, 23, 25)Blindness
(91)PsychiatricDisability
(90)Severe
IntellectualDisability
Job Title/Series (16-18)Deafness
(28,30,32-38)Missing
Extremities
# 13 10 3
% 100% 76.9% 23.1% 0.0% 0.0% 0.0% 0.0% 0.0% 0.0% 0.0% 0.0% 0.0% 0.0% 0.0%
# 21 16 4 1
% 100% 76.2% 19.0% 4.8% 0.0% 0.0% 0.0% 0.0% 0.0% 0.0% 0.0% 0.0% 0.0% 0.0%
# 2 2
% 100% 100.0% 0.0% 0.0% 0.0% 0.0% 0.0% 0.0% 0.0% 0.0% 0.0% 0.0% 0.0% 0.0%
# 10 7 2 1
% 100% 70.0% 20.0% 10.0% 0.0% 0.0% 0.0% 0.0% 0.0% 0.0% 0.0% 0.0% 0.0% 0.0%
# 3 3
% 100% 100.0% 0.0% 0.0% 0.0% 0.0% 0.0% 0.0% 0.0% 0.0% 0.0% 0.0% 0.0% 0.0%
# 13 10 2 1
% 100% 76.9% 15.4% 7.7% 0.0% 0.0% 0.0% 0.0% 0.0% 0.0% 0.0% 0.0% 0.0% 0.0%
# 7 6 1
% 100% 85.7% 14.3% 0.0% 0.0% 0.0% 0.0% 0.0% 0.0% 0.0% 0.0% 0.0% 0.0% 0.0%
# 19 16 3
% 100% 84.2% 0.0% 15.8% 0.0% 0.0% 0.0% 0.0% 0.0% 0.0% 0.0% 0.0% 0.0% 0.0%
# 4 3 1
% 100% 75.0% 0.0% 25.0% 0.0% 0.0% 0.0% 0.0% 0.0% 0.0% 0.0% 0.0% 0.0% 0.0%
# 23 19 4
% 100% 82.6% 0.0% 17.4% 0.0% 0.0% 0.0% 0.0% 0.0% 0.0% 0.0% 0.0% 0.0% 0.0%
# 6 5 1
% 100% 83.3% 16.7% 0.0% 0.0% 0.0% 0.0% 0.0% 0.0% 0.0% 0.0% 0.0% 0.0% 0.0%
# 4 4
% 100% 100.0% 0.0% 0.0% 0.0% 0.0% 0.0% 0.0% 0.0% 0.0% 0.0% 0.0% 0.0% 0.0%
#
% - - - - - - - - - - - - - -
# 4 4
From Temporary
Total Hires
Wildlife Refuge Management (0485)
Wildlife Biology (0486)
From Temporary
Total Hires
From Pathways Intern
Accessions
From Temporary
Total Hires
From Pathways Intern
From Pathways Intern
Criminal Investigating (1811)
Accessions
Accessions
From Temporary
Total Hires

(92)Distortion ofLimb/Spine,Dwarfism
(01)Not
Identified
(64-69)Partial
Paralysis
(71-79)Total
Paralysis
(82)Epilepsy
Fish & Wildlife Service - Servicewide FY2015Table B7-ALT: HIRES by Disability - Permanent Workforce (3 of 3 pages)
TotalTotal by Disability Status Detail for Targeted Disabilities
(04, 05)No
Disability
(06-94)ReportableDisability
TargetedDisability
(21, 23, 25)Blindness
(91)PsychiatricDisability
(90)Severe
IntellectualDisability
Job Title/Series (16-18)Deafness
(28,30,32-38)Missing
Extremities
% 100% 100.0% 0.0% 0.0% 0.0% 0.0% 0.0% 0.0% 0.0% 0.0% 0.0% 0.0% 0.0% 0.0%
#
% - - - - - - - - - - - - - -
# 5 4 1
% 100% 80.0% 0.0% 20.0% 0.0% 0.0% 0.0% 0.0% 0.0% 0.0% 0.0% 0.0% 0.0% 0.0%
#
% - - - - - - - - - - - - - -
# 5 4 1
% 100% 80.0% 0.0% 20.0% 0.0% 0.0% 0.0% 0.0% 0.0% 0.0% 0.0% 0.0% 0.0% 0.0%
#
% - - - - - - - - - - - - - -
From Temporary
Total Hires
Total Hires
From Pathways Intern
From Pathways Intern
Land Management LE & Conservation LE (0025LE & 1801LE)
Accessions

# 25 24 1
% 100% 96.0% 0.0% 4.0% 0.0% 0.0% 0.0% 0.0% 0.0% 0.0% 0.0% 0.0% 0.0% 0.0%
# 359 305 32 22 1 1
% 100% 85.0% 8.9% 6.1% 0.3% 0.0% 0.0% 0.0% 0.0% 0.0% 0.0% 0.0% 0.3% 0.0%
# 1 1
% 100% 100.0% 0.0% 0.0% 0.0% 0.0% 0.0% 0.0% 0.0% 0.0% 0.0% 0.0% 0.0% 0.0%
# 27 23 3 1 1 1
% 100% 85.2% 11.1% 3.7% 3.7% 0.0% 0.0% 0.0% 0.0% 0.0% 0.0% 0.0% 3.7% 0.0%
# 2 2
% 100% 100.0% 0.0% 0.0% 0.0% 0.0% 0.0% 0.0% 0.0% 0.0% 0.0% 0.0% 0.0% 0.0%
# 7 7
% 100% 100.0% 0.0% 0.0% 0.0% 0.0% 0.0% 0.0% 0.0% 0.0% 0.0% 0.0% 0.0% 0.0%
#
% - - - - - - - - - - - - - -
#
% - - - - - - - - - - - - - -
Accessions
Land Management LE & Conservation LE (0025LE & 1801LE)
Accessions
Criminal Investigating (1811)
Job Title/Series
Fish & Wildlife Service - Servicewide FY2015Table B7-ALT: HIRES by Disability - Temporary Workforce
TotalTotal by Disability Status Detail for Targeted Disabilities
(04, 05)No
Disability
(21, 23, 25)Blindness
(91)PsychiatricDisability
Fish and Wildlife Administration (0480)
Accessions
(92)Distortion ofLimb/Spine,Dwarfism
(01)Not
Identified
(64-69)Partial
Paralysis
(71-79)Total
Paralysis
Accessions
Accessions
Accessions
Wildlife Biology (0486)
General Natural Resources Management and Biological Sciences (0401)
Accessions
Fish Biology (0482)
Wildlife Refuge Management (0485)
Biological Science Technician (0404)
Accessions
(82)Epilepsy
(16-18)Deafness
(28,30,32-38)Missing
Extremities
(90)Severe
IntellectualDisability
(06-94)ReportableDisability
TargetedDisability

# 441 329 43 69 9 1 1 1 6
% 100% 74.6% 9.8% 15.6% 2.0% 0.0% 0.2% 0.0% 0.2% 0.2% 0.0% 0.0% 1.4% 0.0%
# 136 111 6 19 2 1 1
% 100% 81.6% 4.4% 14.0% 1.5% 0.0% 0.0% 0.0% 0.7% 0.0% 0.0% 0.0% 0.7% 0.0%
# 577 440 49 88 11 1 2 1 7
% 100% 76.3% 8.5% 15.3% 1.9% 0.0% 0.2% 0.0% 0.3% 0.2% 0.0% 0.0% 1.2% 0.0%
# 155 121 12 22 4 1 1 2
% 100% 78.1% 7.7% 14.2% 2.6% 0.0% 0.0% 0.6% 0.0% 0.6% 0.0% 0.0% 1.3% 0.0%
# 67 56 4 7 1 1
% 100% 83.6% 6.0% 10.4% 1.5% 0.0% 0.0% 0.0% 0.0% 0.0% 0.0% 0.0% 1.5% 0.0%
# 222 177 16 29 5 1 1 3
% 100% 79.7% 7.2% 13.1% 2.3% 0.0% 0.0% 0.5% 0.0% 0.5% 0.0% 0.0% 1.4% 0.0%
# 859 707 71 81 9 1 1 7
% 100% 82.3% 8.3% 9.4% 1.0% 0.0% 0.0% 0.1% 0.1% 0.0% 0.0% 0.0% 0.8% 0.0%
# 700 575 57 68 9 1 1 2 5
% 100% 82.1% 8.1% 9.7% 1.3% 0.1% 0.0% 0.0% 0.1% 0.0% 0.3% 0.0% 0.7% 0.0%
#
% - - - - - - - - - - - - - -
#
% - - - - - - - - - - - - - -FY2014 Accessions
Accessions
Permanent Workforce
Temporary Workforce
Non-Appropriated Workforce
(92)Distortion ofLimb/Spine,Dwarfism
Accessions
(91)PsychiatricDisability
From Temporary
(90)Severe
IntellectualDisability
FY2014 Accessions
Accessions
Fish & Wildlife Service - Servicewide FY2015Table B8-ALT: NEW HIRES By Type of Appointment - Distribution by Disability
TotalTotal by Disability Status Detail for Targeted Disabilities
(04, 05)No
Disability
(06-94)ReportableDisability
(64-69)Partial
Paralysis
TargetedDisability
(16-18)Deafness
(21, 23, 25)Blindness
(82)Epilepsy
(71-79)Total
Paralysis
(28,30,32-38)Missing
Extremities
FY2014 Total Hires
FY2014 Accessions
FY2014From Temporary
Employment Tenure (01)Not
Identified
Total Hires
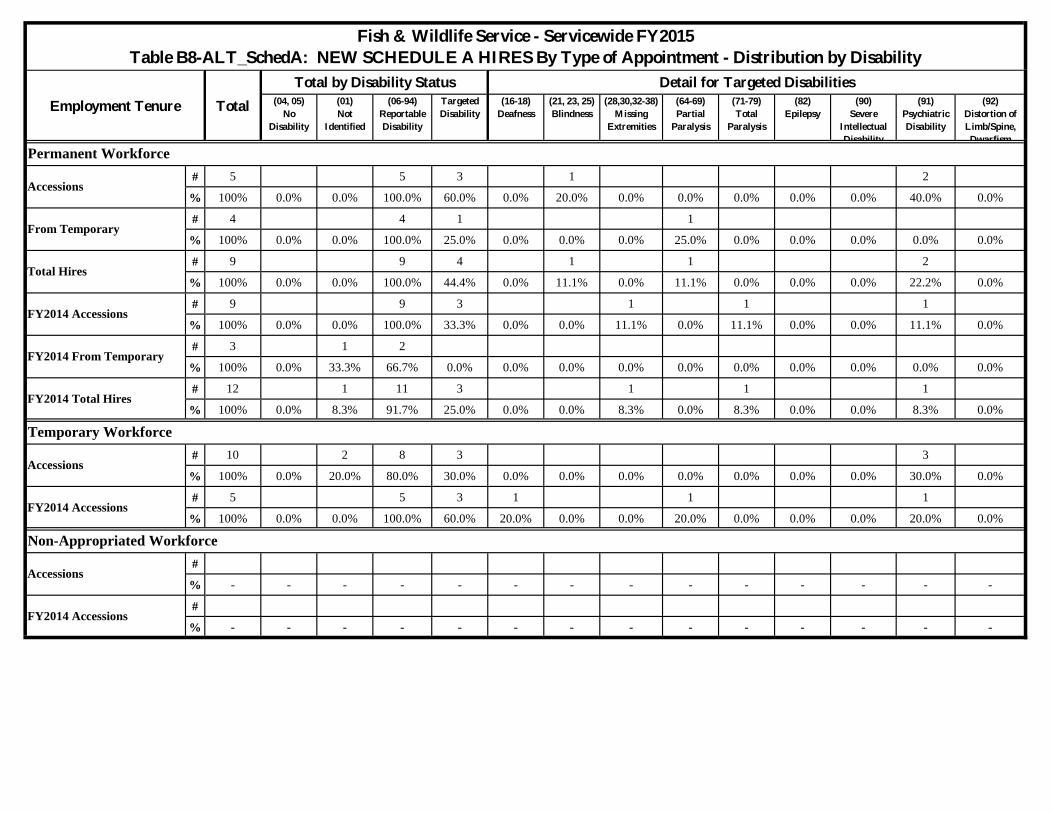
# 5 5 3 1 2
% 100% 0.0% 0.0% 100.0% 60.0% 0.0% 20.0% 0.0% 0.0% 0.0% 0.0% 0.0% 40.0% 0.0%
# 4 4 1 1
% 100% 0.0% 0.0% 100.0% 25.0% 0.0% 0.0% 0.0% 25.0% 0.0% 0.0% 0.0% 0.0% 0.0%
# 9 9 4 1 1 2
% 100% 0.0% 0.0% 100.0% 44.4% 0.0% 11.1% 0.0% 11.1% 0.0% 0.0% 0.0% 22.2% 0.0%
# 9 9 3 1 1 1
% 100% 0.0% 0.0% 100.0% 33.3% 0.0% 0.0% 11.1% 0.0% 11.1% 0.0% 0.0% 11.1% 0.0%
# 3 1 2
% 100% 0.0% 33.3% 66.7% 0.0% 0.0% 0.0% 0.0% 0.0% 0.0% 0.0% 0.0% 0.0% 0.0%
# 12 1 11 3 1 1 1
% 100% 0.0% 8.3% 91.7% 25.0% 0.0% 0.0% 8.3% 0.0% 8.3% 0.0% 0.0% 8.3% 0.0%
# 10 2 8 3 3
% 100% 0.0% 20.0% 80.0% 30.0% 0.0% 0.0% 0.0% 0.0% 0.0% 0.0% 0.0% 30.0% 0.0%
# 5 5 3 1 1 1
% 100% 0.0% 0.0% 100.0% 60.0% 20.0% 0.0% 0.0% 20.0% 0.0% 0.0% 0.0% 20.0% 0.0%
#
% - - - - - - - - - - - - - -
#
% - - - - - - - - - - - - - -
Total Hires
(21, 23, 25)Blindness
(28,30,32-38)Missing
Extremities
Permanent Workforce
Accessions
(92)Distortion ofLimb/Spine,Dwarfism
(90)Severe
IntellectualDisability
(71-79)Total
Paralysis
TargetedDisability
(16-18)Deafness
From Temporary
Accessions
(82)Epilepsy
Accessions
Fish & Wildlife Service - Servicewide FY2015Table B8-ALT_SchedA: NEW SCHEDULE A HIRES By Type of Appointment - Distribution by Disability
Employment Tenure TotalTotal by Disability Status Detail for Targeted Disabilities
(04, 05)No
Disability
(91)PsychiatricDisability
FY2014 Accessions
FY2014 Accessions
FY2014 From Temporary
FY2014 Total Hires
Temporary Workforce
(64-69)Partial
Paralysis
FY2014 Accessions
(01)Not
Identified
(06-94)ReportableDisability
Non-Appropriated Workforce

Applied ##% - - - - - - - - - - - - - -# 74 71 1 2% 100% 95.9% 1.4% 2.7% 0.0% 0.0% 0.0% 0.0% 0.0% 0.0% 0.0% 0.0% 0.0% 0.0%# 1614 1475 35 104 11 2 3 6% 100% 91.4% 2.2% 6.4% 0.7% 0.1% 0.0% 0.0% 0.2% 0.0% 0.0% 0.0% 0.4% 0.0%
Applied ##% - - - - - - - - - - - - - -# 5 5% 100% 100.0% 0.0% 0.0% 0.0% 0.0% 0.0% 0.0% 0.0% 0.0% 0.0% 0.0% 0.0% 0.0%# 115 107 1 7% 100% 93.0% 0.9% 6.1% 0.0% 0.0% 0.0% 0.0% 0.0% 0.0% 0.0% 0.0% 0.0% 0.0%
Applied ##% - - - - - - - - - - - - - -# 24 23 1% 100% 95.8% 4.2% 0.0% 0.0% 0.0% 0.0% 0.0% 0.0% 0.0% 0.0% 0.0% 0.0% 0.0%# 231 214 5 12 1 1% 100% 92.6% 2.2% 5.2% 0.4% 0.0% 0.0% 0.0% 0.4% 0.0% 0.0% 0.0% 0.0% 0.0%
Applied ##% - - - - - - - - - - - - - -# 17 16 1% 100% 94.1% 0.0% 5.9% 0.0% 0.0% 0.0% 0.0% 0.0% 0.0% 0.0% 0.0% 0.0% 0.0%# 537 497 13 27% 100% 92.6% 2.4% 5.0% 0.0% 0.0% 0.0% 0.0% 0.0% 0.0% 0.0% 0.0% 0.0% 0.0%
Applied ##% - - - - - - - - - - - - - -# 39 37 2% 100% 94.9% 5.1% 0.0% 0.0% 0.0% 0.0% 0.0% 0.0% 0.0% 0.0% 0.0% 0.0% 0.0%# 590 548 11 31 3 2 1% 100% 92.9% 1.9% 5.3% 0.5% 0.3% 0.0% 0.2% 0.0% 0.0% 0.0% 0.0% 0.0% 0.0%
Applied ##% - - - - - - - - - - - - - -# 17 15 2% 100% 88.2% 0.0% 11.8% 0.0% 0.0% 0.0% 0.0% 0.0% 0.0% 0.0% 0.0% 0.0% 0.0%# 535 477 11 47 3 1 1 1% 100% 89.2% 2.1% 8.8% 0.6% 0.2% 0.0% 0.0% 0.2% 0.0% 0.0% 0.0% 0.2% 0.0%
Applied ##% - - - - - - - - - - - - - -# 10 10% 100% 100.0% 0.0% 0.0% 0.0% 0.0% 0.0% 0.0% 0.0% 0.0% 0.0% 0.0% 0.0% 0.0%# 202 194 5 3% 100% 96.0% 2.5% 1.5% 0.0% 0.0% 0.0% 0.0% 0.0% 0.0% 0.0% 0.0% 0.0% 0.0%
Applied ##% - - - - - - - - - - - - - -# 22 20 1 1% 100% 90.9% 4.5% 4.5% 0.0% 0.0% 0.0% 0.0% 0.0% 0.0% 0.0% 0.0% 0.0% 0.0%# 243 224 8 11% 100% 92.2% 3.3% 4.5% 0.0% 0.0% 0.0% 0.0% 0.0% 0.0% 0.0% 0.0% 0.0% 0.0%
General Natural Resources Management and Biological Sciences (0401)
Qualified
Fish and Wildlife Administration (0480)
Qualified
Selected
Biological Science Technician (0404)
Qualified
Selected
Relevant Pool
Relevant Pool
Fish & Wildlife Service - Servicewide FY2015Table B9-1: SELECTIONS FOR INTERNAL COMPETITIVE PROMOTIONS FOR MAJOR OCCUPATIONS - Distribution by Disability
Based on occupational series of employee after the promotion
TotalTotal by Disability Status Detail for Targeted Disabilities
(04, 05)No
Disability
(06-94)ReportableDisability
TargetedDisability
(91)PsychiatricDisability
(92)Distortion ofLimb/Spine,Dwarfism
(90)Severe
IntellectualDisability
Wildlife Refuge Management (0485)
Qualified
(82)EpilepsyApplicants (01)
NotIdentified
(64-69)Partial
Paralysis
(71-79)Total
Paralysis
(16-18)Deafness
(28,30,32-38)Missing
Extremities
(21, 23, 25)Blindness
Qualified
Selected
Relevant Pool
Selected
Wildlife Biology (0486)
Qualified
Selected
Relevant Pool
Qualified
Selected
Park Ranger (LE/Refuge), Land Mgmt LE & Conservation LE (0025LE & 1801LE)
Selected
Fish Biology (0482)
Relevant Pool
Relevant Pool
Criminal Investigating (1811)
Qualified
Selected
Relevant Pool
Relevant Pool

Applied ##% - - - - - - - - - - - - - -# 70 68 1 1% 100% 97.1% 1.4% 1.4% 0.0% 0.0% 0.0% 0.0% 0.0% 0.0% 0.0% 0.0% 0.0% 0.0%# 1614 1475 35 104 11 2 3 6% 100% 91.4% 2.2% 6.4% 0.7% 0.1% 0.0% 0.0% 0.2% 0.0% 0.0% 0.0% 0.4% 0.0%
Applied ##% - - - - - - - - - - - - - -# 8 8% 100% 100.0% 0.0% 0.0% 0.0% 0.0% 0.0% 0.0% 0.0% 0.0% 0.0% 0.0% 0.0% 0.0%# 115 107 1 7% 100% 93.0% 0.9% 6.1% 0.0% 0.0% 0.0% 0.0% 0.0% 0.0% 0.0% 0.0% 0.0% 0.0%
Applied ##% - - - - - - - - - - - - - -# 3 3% 100% 100.0% 0.0% 0.0% 0.0% 0.0% 0.0% 0.0% 0.0% 0.0% 0.0% 0.0% 0.0% 0.0%# 231 214 5 12 1 1% 100% 92.6% 2.2% 5.2% 0.4% 0.0% 0.0% 0.0% 0.4% 0.0% 0.0% 0.0% 0.0% 0.0%
Applied ##% - - - - - - - - - - - - - -# 17 16 1% 100% 94.1% 0.0% 5.9% 0.0% 0.0% 0.0% 0.0% 0.0% 0.0% 0.0% 0.0% 0.0% 0.0%# 537 497 13 27% 100% 92.6% 2.4% 5.0% 0.0% 0.0% 0.0% 0.0% 0.0% 0.0% 0.0% 0.0% 0.0% 0.0%
Applied ##% - - - - - - - - - - - - - -# 44 42 2% 100% 95.5% 4.5% 0.0% 0.0% 0.0% 0.0% 0.0% 0.0% 0.0% 0.0% 0.0% 0.0% 0.0%# 590 548 11 31 3 2 1% 100% 92.9% 1.9% 5.3% 0.5% 0.3% 0.0% 0.2% 0.0% 0.0% 0.0% 0.0% 0.0% 0.0%
Applied ##% - - - - - - - - - - - - - -# 23 19 1 3% 100% 82.6% 4.3% 13.0% 0.0% 0.0% 0.0% 0.0% 0.0% 0.0% 0.0% 0.0% 0.0% 0.0%# 535 477 11 47 3 1 1 1% 100% 89.2% 2.1% 8.8% 0.6% 0.2% 0.0% 0.0% 0.2% 0.0% 0.0% 0.0% 0.2% 0.0%
Applied ##% - - - - - - - - - - - - - -# 10 10% 100% 100.0% 0.0% 0.0% 0.0% 0.0% 0.0% 0.0% 0.0% 0.0% 0.0% 0.0% 0.0% 0.0%# 202 194 5 3% 100% 96.0% 2.5% 1.5% 0.0% 0.0% 0.0% 0.0% 0.0% 0.0% 0.0% 0.0% 0.0% 0.0%
Applied ##% - - - - - - - - - - - - - -# 22 20 1 1% 100% 90.9% 4.5% 4.5% 0.0% 0.0% 0.0% 0.0% 0.0% 0.0% 0.0% 0.0% 0.0% 0.0%# 243 224 8 11% 100% 92.2% 3.3% 4.5% 0.0% 0.0% 0.0% 0.0% 0.0% 0.0% 0.0% 0.0% 0.0% 0.0%
Selected
Relevant Pool
Relevant Pool
Qualified
Park Ranger (LE/Refuge), Land Mgmt LE & Conservation LE (0025LE & 1801LE)
Qualified
Wildlife Biology (0486)
Qualified
Selected
Relevant Pool
Selected
Relevant Pool
Selected
Selected
Fish Biology (0482)
Relevant Pool
Relevant Pool
Criminal Investigating (1811)
Qualified
Selected
Wildlife Refuge Management (0485)
Qualified
(82)EpilepsyApplicants (01)
NotIdentified
(64-69)Partial
Paralysis
(71-79)Total
Paralysis
(16-18)Deafness
(28,30,32-38)Missing
Extremities
(21, 23, 25)Blindness
Fish & Wildlife Service - Servicewide FY2015Table B9-2: SELECTIONS FOR INTERNAL COMPETITIVE PROMOTIONS FOR MAJOR OCCUPATIONS - Distribution by Disability
Based on occupational series of employee before the promotion
TotalTotal by Disability Status Detail for Targeted Disabilities
(04, 05)No
Disability
(06-94)ReportableDisability
TargetedDisability
(91)PsychiatricDisability
(92)Distortion ofLimb/Spine,Dwarfism
(90)Severe
IntellectualDisability
General Natural Resources Management and Biological Sciences (0401)
Qualified
Fish and Wildlife Administration (0480)
Qualified
Selected
Biological Science Technician (0404)
Qualified
Selected
Relevant Pool
Relevant Pool

# 507 413 29 65 10 1 4 3 1 1
% 100% 81.5% 5.7% 12.8% 2.0% 0.0% 0.2% 0.0% 0.8% 0.6% 0.2% 0.0% 0.2% 0.0%
# 47 39 1 7 1 1
% 100% 83.0% 2.1% 14.9% 2.1% 0.0% 0.0% 0.0% 0.0% 0.0% 2.1% 0.0% 0.0% 0.0%
# 30 27 3 1 1
% 100% 90.0% 0.0% 10.0% 3.3% 0.0% 0.0% 0.0% 0.0% 3.3% 0.0% 0.0% 0.0% 0.0%
# 8 7 1
% 100% 87.5% 12.5% 0.0% 0.0% 0.0% 0.0% 0.0% 0.0% 0.0% 0.0% 0.0% 0.0% 0.0%
(21, 23, 25)Blindness
(82)Epilepsy
(16-18)Deafness
(90)Severe
IntellectualDisability
(28,30,32-38)Missing
Extremities
13 - 24 months
1 - 12 months
25+ months
Time in grade in excess of minimum
Total Employees Eligible for Career Ladder Promotions
(91)PsychiatricDisability
(92)Distortion ofLimb/Spine,Dwarfism
(01)Not
Identified
(64-69)Partial
Paralysis
(71-79)Total
Paralysis
Fish & Wildlife Service - Servicewide as of September 30, 2015Table B10: NON-COMPETITIVE PROMOTIONS - TIME IN GRADE by Disability - Permanent Workforce
TotalTotal by Disability Status Detail for Targeted Disabilities
(04, 05)No
Disability
(06-94)ReportableDisability
TargetedDisability

#% - - - - - - - - - - - - - -#
% - - - - - - - - - - - - - -# 67 61 1 5 1 1
% 100% 91.0% 1.5% 7.5% 1.5% 0.0% 0.0% 0.0% 0.0% 0.0% 0.0% 0.0% 1.5% 0.0%# 1806 1649 28 129 9 3 1 5
% 100% 91.3% 1.6% 7.1% 0.5% 0.2% 0.0% 0.0% 0.0% 0.0% 0.1% 0.0% 0.3% 0.0%
#% - - - - - - - - - - - - - -#
% - - - - - - - - - - - - - -# 49 47 1 1
% 100% 95.9% 2.0% 2.0% 0.0% 0.0% 0.0% 0.0% 0.0% 0.0% 0.0% 0.0% 0.0% 0.0%# 1313 1186 30 97 8 1 4 1 1 1
% 100% 90.3% 2.3% 7.4% 0.6% 0.1% 0.0% 0.0% 0.3% 0.1% 0.1% 0.0% 0.1% 0.0%
#% - - - - - - - - - - - - - -#
% - - - - - - - - - - - - - -# 6 6
% 100% 100.0% 0.0% 0.0% 0.0% 0.0% 0.0% 0.0% 0.0% 0.0% 0.0% 0.0% 0.0% 0.0%# 519 470 16 33 6 2 1 1 2
% 100% 90.6% 3.1% 6.4% 1.2% 0.0% 0.4% 0.0% 0.2% 0.0% 0.2% 0.0% 0.4% 0.0%
#% - - - - - - - - - - - - - -#
% - - - - - - - - - - - - - -# 1 1
% 100% 100.0% 0.0% 0.0% 0.0% 0.0% 0.0% 0.0% 0.0% 0.0% 0.0% 0.0% 0.0% 0.0%# 160 146 3 11
% 100% 91.3% 1.9% 6.9% 0.0% 0.0% 0.0% 0.0% 0.0% 0.0% 0.0% 0.0% 0.0% 0.0%
Selected
GS-15 Vacancies
Applied
Relevant Pool
Applied
GS-14 Vacancies
Applied
Qualified
Selected
Relevant Pool
Relevant Pool
Qualified
Selected
Senior Executive Service Vacancies
Applied
Qualified
Selected
Relevant Pool
GS-13 Vacancies
Qualified
Fish & Wildlife Service - Servicewide FY2015Table B11: INTERNAL SELECTIONS FOR SENIOR LEVEL POSITIONS (GS 13 - 15 AND SES) - Distribution by Disability Permanent Workforce
TotalTotal by Disability Status Detail for Targeted Disabilities
(04, 05)No
Disability
(06-94)ReportableDisability
TargetedDisability
(91)PsychiatricDisability
(92)Distortion ofLimb/Spine,Dwarfism
(90)Severe
IntellectualDisability
(82)EpilepsyApplicants (01)
NotIdentified
(64-69)Partial
Paralysis
(71-79)Total
Paralysis
(16-18)Deafness
(28,30,32-38)Missing
Extremities
(21, 23, 25)Blindness

Slots # 48# 2912 2621 63 228 27 3 6 3 15% 100% 90.0% 2.2% 7.8% 0.9% 0.1% 0.0% 0.0% 0.2% 0.0% 0.1% 0.0% 0.5% 0.0%# 133 123 4 6 1 1% 100% 92.5% 3.0% 4.5% 0.8% 0.0% 0.0% 0.0% 0.8% 0.0% 0.0% 0.0% 0.0% 0.0%# 48 45 3% 100% 93.8% 0.0% 6.3% 0.0% 0.0% 0.0% 0.0% 0.0% 0.0% 0.0% 0.0% 0.0% 0.0%
Slots # 24# 1629 1458 44 127 14 1 1 5 1 2 4% 100% 89.5% 2.7% 7.8% 0.9% 0.1% 0.1% 0.0% 0.3% 0.1% 0.1% 0.0% 0.2% 0.0%# 49 44 5% 100% 89.8% 10.2% 0.0% 0.0% 0.0% 0.0% 0.0% 0.0% 0.0% 0.0% 0.0% 0.0% 0.0%# 24 22 2% 100% 91.7% 8.3% 0.0% 0.0% 0.0% 0.0% 0.0% 0.0% 0.0% 0.0% 0.0% 0.0% 0.0%
Slots # # 666 605 20 41 6 2 1 1 2% 100% 90.8% 3.0% 6.2% 0.9% 0.0% 0.3% 0.0% 0.2% 0.0% 0.2% 0.0% 0.3% 0.0%# 19 17 2% 100% 89.5% 0.0% 10.5% 0.0% 0.0% 0.0% 0.0% 0.0% 0.0% 0.0% 0.0% 0.0% 0.0%# 6 6% 100% 100.0% 0.0% 0.0% 0.0% 0.0% 0.0% 0.0% 0.0% 0.0% 0.0% 0.0% 0.0% 0.0%
Relevant Pool
Relevant Pool
Relevant Pool
Career Development Programs for GS 13 - 14: Advanced Leadership Development Program cohort XV
Applied
Selected
"Relevant Pool" includes all employees in pay grades eligible for the career development program.
Applied
Selected
Applied
Selected
Career Development Programs for GS 14 and GS 15: Department of the Interior SES Candicate Development Program Class 18 & 19
Fish & Wildlife Service - Servicewide FY 2015Table B12: PARTICIPATION IN LEADERSHIP DEVELOPMENT - Distribution by Disability
Total
Total by Disability Status Detail for Targeted Disabilities(04, 05)
NoDisability
(06-94)ReportableDisability
TargetedDisability
(21, 23, 25)Blindness
(91)PsychiatricDisability
(90)Severe
IntellectualDisability
Career Development Programs for GS 11 - 12: Stepping Up to Leadership cohorts 31 & 32
Type of Program(92)
Distortion ofLimb/Spine,Dwarfism
(01)Not
Identified
(64-69)Partial
Paralysis
(71-79)Total
Paralysis
(82)Epilepsy
(16-18)Deafness
(28,30,32-38)Missing
Extremities
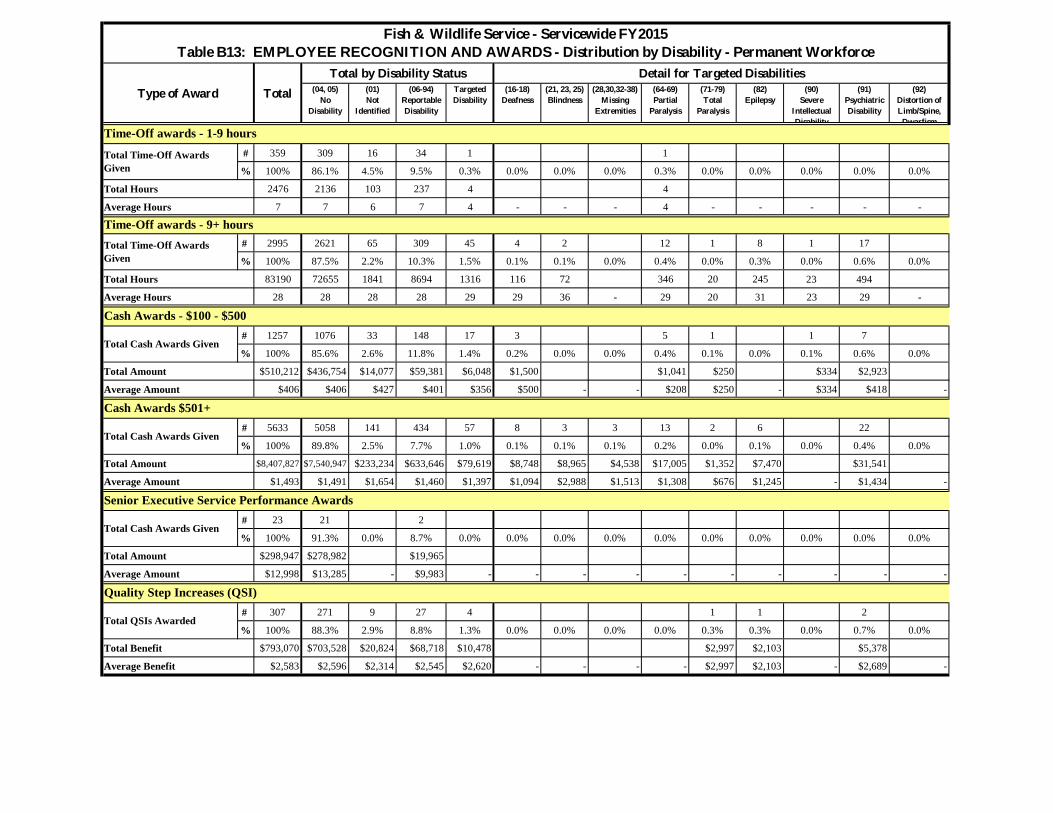
# 359 309 16 34 1 1
% 100% 86.1% 4.5% 9.5% 0.3% 0.0% 0.0% 0.0% 0.3% 0.0% 0.0% 0.0% 0.0% 0.0%
Total Hours 2476 2136 103 237 4 4
Average Hours 7 7 6 7 4 - - - 4 - - - - -
# 2995 2621 65 309 45 4 2 12 1 8 1 17
% 100% 87.5% 2.2% 10.3% 1.5% 0.1% 0.1% 0.0% 0.4% 0.0% 0.3% 0.0% 0.6% 0.0%
Total Hours 83190 72655 1841 8694 1316 116 72 346 20 245 23 494
Average Hours 28 28 28 28 29 29 36 - 29 20 31 23 29 -
# 1257 1076 33 148 17 3 5 1 1 7
% 100% 85.6% 2.6% 11.8% 1.4% 0.2% 0.0% 0.0% 0.4% 0.1% 0.0% 0.1% 0.6% 0.0%
Total Amount $510,212 $436,754 $14,077 $59,381 $6,048 $1,500 $1,041 $250 $334 $2,923
Average Amount $406 $406 $427 $401 $356 $500 - - $208 $250 - $334 $418 -
# 5633 5058 141 434 57 8 3 3 13 2 6 22
% 100% 89.8% 2.5% 7.7% 1.0% 0.1% 0.1% 0.1% 0.2% 0.0% 0.1% 0.0% 0.4% 0.0%
Total Amount $8,407,827 $7,540,947 $233,234 $633,646 $79,619 $8,748 $8,965 $4,538 $17,005 $1,352 $7,470 $31,541
Average Amount $1,493 $1,491 $1,654 $1,460 $1,397 $1,094 $2,988 $1,513 $1,308 $676 $1,245 - $1,434 -
# 23 21 2
% 100% 91.3% 0.0% 8.7% 0.0% 0.0% 0.0% 0.0% 0.0% 0.0% 0.0% 0.0% 0.0% 0.0%
Total Amount $298,947 $278,982 $19,965
Average Amount $12,998 $13,285 - $9,983 - - - - - - - - - -
# 307 271 9 27 4 1 1 2
% 100% 88.3% 2.9% 8.8% 1.3% 0.0% 0.0% 0.0% 0.0% 0.3% 0.3% 0.0% 0.7% 0.0%
Total Benefit $793,070 $703,528 $20,824 $68,718 $10,478 $2,997 $2,103 $5,378
Average Benefit $2,583 $2,596 $2,314 $2,545 $2,620 - - - - $2,997 $2,103 - $2,689 -
Total Time-Off Awards Given
Total Time-Off Awards Given
Total Cash Awards Given
Total Cash Awards Given
Total Cash Awards Given
Total QSIs Awarded
Time-Off awards - 9+ hours
Cash Awards - $100 - $500
Cash Awards $501+
Quality Step Increases (QSI)
Senior Executive Service Performance Awards
(91)PsychiatricDisability
(92)Distortion ofLimb/Spine,Dwarfism
(01)Not
Identified
(64-69)Partial
Paralysis
(71-79)Total
Paralysis
(82)Epilepsy
(16-18)Deafness
(28,30,32-38)Missing
Extremities
(90)Severe
IntellectualDisability
Time-Off awards - 1-9 hours
Type of Award
Fish & Wildlife Service - Servicewide FY2015Table B13: EMPLOYEE RECOGNITION AND AWARDS - Distribution by Disability - Permanent Workforce
TotalTotal by Disability Status Detail for Targeted Disabilities
(04, 05)No
Disability
(06-94)ReportableDisability
TargetedDisability
(21, 23, 25)Blindness

# 572 497 12 63 8 1 1 2 4
% 100% 86.9% 2.1% 11.0% 1.4% 0.2% 0.0% 0.2% 0.3% 0.0% 0.0% 0.0% 0.7% 0.0%
# 17 10 2 5
% 100% 58.8% 11.8% 29.4% 0.0% 0.0% 0.0% 0.0% 0.0% 0.0% 0.0% 0.0% 0.0% 0.0%
#% - - - - - - - - - - - - - -
# 589 507 14 68 8 1 1 2 4
% 100% 86.1% 2.4% 11.5% 1.4% 0.2% 0.0% 0.2% 0.3% 0.0% 0.0% 0.0% 0.7% 0.0%
# 7845 6923 197 725 102 14 5 4 23 5 12 1 38
% 100% 88.2% 2.5% 9.2% 1.3% 0.2% 0.1% 0.1% 0.3% 0.1% 0.2% 0.0% 0.5% 0.0%
Type of Separation
Voluntary
Involuntary
Total Permanent Workforce (09/30/2014)
Total Separations
RIF
Fish & Wildlife Service - Servicewide FY2015Table B14: SEPARATIONS By Type of Separation- Distribution by Disability - Permanent Workforce
TotalTotal by Disability Status Detail for Targeted Disabilities
(04, 05)No
Disability
(06-94)ReportableDisability
TargetedDisability
(21, 23, 25)Blindness
(91)PsychiatricDisability
(92)Distortion ofLimb/Spine,Dwarfism
(90)Severe
IntellectualDisability
(01)Not
Identified
(64-69)Partial
Paralysis
(71-79)Total
Paralysis
(82)Epilepsy
(16-18)Deafness
(28,30,32-38)Missing
Extremities


137
Organizational Charts

US Fish and Wildlife Service
Dan AsheDirector
(202)208-4545Deputy Director-Program Management & Policy
Steve Guertin(202)208-4545
Deputy Director- Operations Jim Kurth
(202)208-4545
Assistant Director Fish & Aquatic ConservationDavid Hoskins(202)208-6393
Jeff Underwood(703)358-1941
Chief National Wildlife System
RefugeCynthia Martinez
(703)358-2632Shaun Sanchez(703)358-2304
Assistant Director Ecological Services
Gary Frazer (202)208-4646
Gina Shultz(703)358-1985
Assistant DirectorMigratory Birds
Jerome Ford(202)208-6394
Michael Johnson(703)358-1893
Assistant DirectorInternational Affairs
Bryan Arroyo(202)208-6394
Gloria Bell(703)358-1767
Assistant DirectorWildlife & Sport Fish RestorationHannibal Bolton(202)208-7337
Chief Law Enforcement
William Woody(202)208-3809Edward Grace(703)358-2417
Assistant Director External Affairs
Betsy Hildebrant(202)208-6541Matt Huggler
(703)358-2243
Assistant Director Science
Applications Paul Souza
(703)358-1941Seth Mott
(703)358-1969
Assistant Director Budget, Planning &
Human Capital Denise Sheehan(703)358-2400
Assistant Director Business
Management & Operations Paul Rauch
(703)358-1912Brian Bloodsworth
(703)358-2116
Assistant Director Information Resources
& Technology Management
Kenneth Taylor(703)358-1968
Shelley Hartman(703)358-2004
Division of Natural Resources &
Conservation PlanningJeffery Rupert(703)358-2660
Division of RealtyA Eric Alvarez
(703)358-2410
Division of Visitor Services &
CommunicationMarcia Pradines(703)358-2377
Division of Information Technology & ManagementRobert Miller
(703)358-2385
Division of Budget, Performance &
WorkforceVacant
Division of Fish & Aquatic Conservation Programs
David Miko(703)358-2279
Division of Budget & CommunicationsJeff Underwood(703)358-1941
Division of Conservation & Classification
Vacant
Division of Budget & Technical Support
Martha Balis-Larson(703)358-2314
Division of Restoration & Recovery
Jeff Newman(703)358-2555
Division of Environmental Craig Aubrey
(703)358-2442
Division of Migratory Bird Management Brad Bortner
(703)358-2026
Division of Bird Habitat Conservation Sarah Mott
(703)358-1910
Office of Aviation Management
Anthony Lascano(703)358-2059
Division of Scientific Authority
Rosemarie Gnam(703)358-2497
Division of Management Authority
Craig Hoover(703)358-2162
Division of International Conservation
Richard Ruggiero (703)358-2460
Division of Policy & Programs
Tom Busiahn(703)358-2231
Division of Administration & Information ManagementSteve Barton
(703)358-2237
Division of Special Operations James Gale
(404)679-7040
Division of Marketing Communications Nancy Monroe(703)358-2613
Division of Partner & Intergovernmental Affairs
Bruce Decker(703)358-2521
Division of Public Affairs Gavin Shire
(703)358-2649
Regional Special Agents-in-Charge
Clark R. Bavin National Forensics Laboratory
Kenneth Goddard(541)488-4191
Division of Technical & Field Support
Vacant
Division of Congressional & Legislative Affairs
Marty Kodis(703)358-2241
Division of Contracting & General Services
Kristin Young (703)358-2176
Division of Engineering Marilyn Bower(703)358-1924
Division of EconomicsJames Caudill
(703)358-1927
Division of Financial Management
Michael Sciortino(703)358-2054
Division of Information Resources Business
ManagementVacant
Division of Human Resources
Rebekah Giddings(703)358-2117
Division of Policy Performances &
Management ProgramsTina Campbell(703)358-2676
Division of BudgetChris Nolin
(703)358-2343
Division of Information Assurance
Vacant
Division of OperationsShelley Hartman (703)358-2004
Division of Safety & Health
Mary Parkinson(703)358-2255
Division of Refuge Law Enforcement
Richard Johnston(703)358-2553
November 2015
Office of Diversity & Inclusive Worforce
ManagementInez Uhl
(703)358-2396
Director National Conservation Training
Center Jay Slack
(304)876-7263Jim Willis
(304)876-7263
Division of Knowledge Resources & Technology
Chris Horsch (304)876-7662
Division of TrainingTheresa Trainor(304)876-7431
Division of Facility Operations
Karin Christensen(304)876-7222
Division of Education Outreach
Steven Chase (304)876-7266
Regional Director
1-8*See Region Chart
Chief of StaffCharisa Morris(202)208-3843
Deputy Ethics Officer
Anne Badgley(503)725-9098
Native American
LiaisonScott Aikin
(360)604-2531
Senior AdvisorNoah Matson
(202)208-4331
Associate Director
Robert Dreher(202)208-4070
Office of Business & Innovative
TransformationPam Sirotzky
(703)358-2076
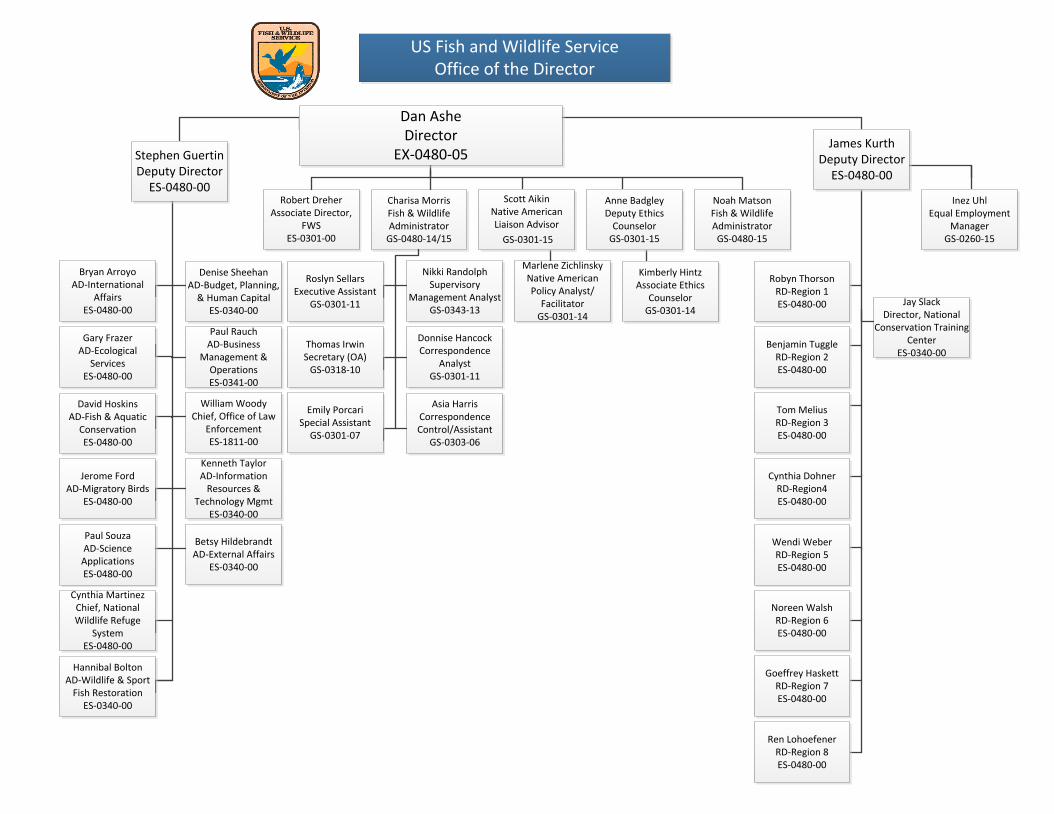
US Fish and Wildlife ServiceOffice of the Director
Charisa MorrisFish & Wildlife Administrator
GS-0480-14/15
Robert DreherAssociate Director,
FWSES-0301-00
Noah MatsonFish & Wildlife Administrator
GS-0480-15
Stephen GuertinDeputy Director
ES-0480-00
Denise SheehanAD-Budget, Planning,
& Human CapitalES-0340-00
Bryan ArroyoAD-International
AffairsES-0480-00
Paul RauchAD-Business
Management & OperationsES-0341-00
Gary FrazerAD-Ecological
ServicesES-0480-00
William WoodyChief, Office of Law
EnforcementES-1811-00
David HoskinsAD-Fish & Aquatic
ConservationES-0480-00
Jerome FordAD-Migratory Birds
ES-0480-00
Kenneth TaylorAD-Information
Resources & Technology Mgmt
ES-0340-00
Paul SouzaAD-Science ApplicationsES-0480-00
Cynthia MartinezChief, National Wildlife Refuge
SystemES-0480-00
Hannibal BoltonAD-Wildlife & Sport
Fish RestorationES-0340-00
Betsy HildebrandtAD-External Affairs
ES-0340-00
Robyn ThorsonRD-Region 1ES-0480-00
Benjamin TuggleRD-Region 2ES-0480-00
Tom MeliusRD-Region 3ES-0480-00
Cynthia DohnerRD-Region4ES-0480-00
Wendi WeberRD-Region 5ES-0480-00
Noreen WalshRD-Region 6ES-0480-00
Goeffrey HaskettRD-Region 7ES-0480-00
Ren Lohoefener RD-Region 8 ES-0480-00
Marlene ZichlinskyNative American Policy Analyst/
FacilitatorGS-0301-14
Kimberly HintzAssociate Ethics
CounselorGS-0301-14
Anne BadgleyDeputy Ethics
CounselorGS-0301-15
Scott Aikin Native American Liaison Advisor
GS-0301-15
Nikki RandolphSupervisory
Management AnalystGS-0343-13
Donnise HancockCorrespondence
AnalystGS-0301-11
Asia HarrisCorrespondence Control/Assistant
GS-0303-06
James KurthDeputy Director
ES-0480-00
Roslyn SellarsExecutive Assistant
GS-0301-11
Thomas Irwin Secretary (OA)
GS-0318-10
Emily Porcari Special Assistant
GS-0301-07
Inez Uhl Equal Employment
ManagerGS-0260-15
Jay SlackDirector, National
Conservation Training Center
ES-0340-00
Dan AsheDirector
EX-0480-05

140
Annual Federal Equal Employment Opportunity Statistical (462) Report of Discrimination Complaints

ANNUAL FEDERAL EQUAL EMPLOYMENT OPPORTUNITY
STATISTICAL REPORT OF DISCRIMINATION COMPLAINTS
(REPORTING PERIOD BEGINS OCTOBER 1ST AND ENDS SEPTEMBER 30TH)
AGENCY OR DEPARTMENT: DOI U.S. Fish and Wildlife Service REPORTING PERIOD: FY 2015
EEOC FORM 462 (REVISED NOV 2014) Report Status: Finalized, 11/03/2015 7:44 AM 1
PART I - PRE-COMPLAINT ACTIVITIES
COUNSELING INDIVIDUALS
INTENTIONALLY LEFT BLANK
TOTAL COMPLETED/ENDED COUNSELINGCOUNSELING INDIVIDUALS
C. TOTAL COMPLETED/ENDED COUNSELINGS 33 33
C.1. COUNSELED WITHIN 30 DAYS 12 12
C.2. COUNSELED WITHIN 31 TO 90 DAYS 19 19
C.2.a. COUNSELED WITHIN WRITTEN EXTENSION PERIOD NO LONGER THAN 60 DAYS
11 11
C.2.b. COUNSELED WITHIN 90 DAYS WHERE INDIVIDUAL PARTICIPATED IN ADR
5 5
C.2.c. COUNSELED WITHIN 31-90 DAYS THAT WERE UNTIMELY
3 3
C.3. COUNSELED BEYOND 90 DAYS 2 2
C.4. COUNSELED DUE TO REMANDS 0 0
COUNSELING INDIVIDUALS
D. PRE-COMPLAINT ACTIVITIES
D.1. ON HAND AT THE BEGINNING OF THE REPORTING PERIOD
4 4
D.2. INITIATED DURING THE REPORTING PERIOD 43 43
D.3. COMPLETED/ENDED COUNSELINGS 33 33
D.3.a. SETTLEMENTS (MONETARY AND NON-MONETARY)
3 3
D.3.b. WITHDRAWALS/NO COMPLAINT FILED
10 10
D.3.c. COUNSELINGS COMPLETED/ENDED IN REPORTING PERIOD THAT RESULTED IN COMPLAINT FILINGS IN REPORTING PERIOD
20 20
D.3.d. DECISION TO FILE COMPLAINT PENDING AT THE END OF THE REPORTING PERIOD
0 0
D.4. COUNSELINGS PENDING AT THE END OF THE REPORTING PERIOD
14 14
E. NON-ADR SETTLEMENTS WITH MONETARY BENEFITS
COUNSELING INDIVIDUALS AMOUNT
E. NON-ADR SETTLEMENTS WITH MONETARY BENEFITS TOTAL
0 0 $0.00
E.1. COMPENSATORY DAMAGES 0 0 $0.00E.2. BACKPAY/FRONTPAY 0 0 $0.00E.3. LUMP SUM PAYMENT 0 0 $0.00E.4. ATTORNEY FEES AND COSTS 0 0 $0.00E.5. 0 0 $0.00E.6. 0 0 $0.00
F. NON-ADR SETTLEMENTS WITH NON-MONETARY BENEFITS
COUNSELING INDIVIDUALS
F. NON-ADR SETTLEMENTS WITH NON-MONETARY BENEFITS TOTAL
2 2
F.1. HIRES 0 0F.1.a. RETROACTIVE 0 0F.1.b. NON-RETROACTIVE 0 0
F.2. PROMOTIONS 0 0F.2.a. RETROACTIVE 0 0F.2.b. NON-RETROACTIVE 0 0
F.3. EXPUNGEMENTS 1 1F.4. REASSIGNMENTS 0 0F.5. REMOVALS RESCINDED 0 0
F.5.a. REINSTATEMENT 0 0F.5.b. VOLUNTARY RESIGNATION 0 0
F.6. ACCOMMODATIONS 0 0F.7. TRAINING 0 0F.8. APOLOGY 0 0F.9. DISCIPLINARY ACTIONS 1 1
F.9.a. RESCINDED 1 1F.9.b. MODIFIED 0 0
F.10. PERFORMANCE EVALUATION MODIFIED 0 0F.11. LEAVE RESTORED 0 0F.12. NEUTRAL REFERENCE 0 0F.13. 0 0F.14 0 0
G. ADR SETTLEMENTS WITH MONETARY BENEFITS
COUNSELING INDIVIDUALS AMOUNT
G. ADR SETTLEMENTS WITH MONETARY BENEFITS TOTAL
0 0 $0.00
G.1. COMPENSATORY DAMAGES 0 0 $0.00G.2. BACKPAY/FRONTPAY 0 0 $0.00G.3. LUMP SUM PAYMENT 0 0 $0.00G.4. ATTORNEY FEES AND COSTS 0 0 $0.00G.5. 0 0 $0.00G.6. 0 0 $0.00
H. ADR SETTLEMENTS WITH NON-MONETARY BENEFITS
COUNSELING INDIVIDUALS
H. ADR SETTLEMENTS WITH NON-MONETARY BENEFITS TOTAL
1 1
H.1. HIRES 0 0H.1.a. RETROACTIVE 0 0H.1.b. NON-RETROACTIVE 0 0
H.2. PROMOTIONS 1 1H.2.a. RETROACTIVE 1 1H.2.b. NON-RETROACTIVE 0 0
H.3. EXPUNGEMENTS 0 0H.4. REASSIGNMENTS 0 0H.5. REMOVALS RESCINDED 0 0
H.5.a. REINSTATEMENT 0 0H.5.b. VOLUNTARY RESIGNATION 0 0
H.6. ACCOMMODATIONS 0 0H.7. TRAINING 0 0H.8. APOLOGY 0 0H.9. DISCIPLINARY ACTIONS 0 0
H.9.a. RESCINDED 0 0H.9.b. MODIFIED 0 0
H.10. PERFORMANCE EVALUATION MODIFIED 0 0H.11. LEAVE RESTORED 0 0H.12. NEUTRAL REFERENCE 0 0H.13. 0 0H.14 0 0
I. NON-ADR SETTLEMENTS
COUNSELING INDIVIDUALS
TOTAL 2 2

ANNUAL FEDERAL EQUAL EMPLOYMENT OPPORTUNITY
STATISTICAL REPORT OF DISCRIMINATION COMPLAINTS
(REPORTING PERIOD BEGINS OCTOBER 1ST AND ENDS SEPTEMBER 30TH)
AGENCY OR DEPARTMENT: DOI U.S. Fish and Wildlife Service REPORTING PERIOD: FY 2015
EEOC FORM 462 (REVISED NOV 2014) Report Status: Finalized, 11/03/2015 7:44 AM 2
PART II - FORMAL COMPLAINT ACTIVITIES
45A. COMPLAINTS ON HAND AT THE BEGINNING OF THE REPORTING PERIOD
23 B. COMPLAINTS FILED
2 C. REMANDS (sum of lines C1+C2+C3)
2C.1. REMANDS (NOT INCLUDED IN A OR B)
0 C.2. REMANDS (INCLUDED IN A OR B)
0
C.3. NUMBER OF ADDITIONAL REMANDS IN THIS REPORTING PERIOD THAT ARE NOT CAPTURED IN C.1 OR C.2 ABOVE
0
C.4. ADDITIONAL CLOSURES IN THIS REPORTING PERIOD NOT REFLECTED IN F. OR H. THAT RESULTED FROM REMANDS
70 D. TOTAL COMPLAINTS
62E. COMPLAINTS IN LINE D THAT WERE NOT CONSOLIDATED
28F. COMPLAINTS IN LINE E CLOSED DURING REPORT PERIOD
8G. COMPLAINTS IN LINE D THAT WERE CONSOLIDATED
4H. COMPLAINTS IN LINE G CLOSED DURING REPORT PERIOD
38
I. COMPLAINTS ON HAND AT THE END OF THE REPORTING PERIOD (Line D - (F+H)) + [(C2 + C3) - C4]
23J. INDIVIDUALS FILING COMPLAINTS (Complainants)
4K. NUMBER OF JOINT PROCESSING UNITS FROM CONSOLIDATION OF COMPLAINTS
PART III - AGENCY RESOURCES, TRAINING, REPORTING LINE
A. AGENCY & CONTRACT RESOURCES
AGENCY CONTRACT
NUMBER PERCENT NUMBER PERCENT
A.1. WORKFORCE
A.1.a. TOTAL WORK FORCE 8,945 A.1.b. PERMANENT EMPLOYEES 7,814
A.2. COUNSELOR 5 13 A.2.a. FULL-TIME 3 60 13 100A.2.b. PART-TIME 2 40 0 0A.2.c. COLLATERAL DUTY 0 0 0 0
A.3. INVESTIGATOR 0 12 A.3.a. FULL-TIME 0 0 12 100A.3.b. PART-TIME 0 0 0 0A.3.c. COLLATERAL DUTY 0 0 0 0
A.4. COUNSELOR/INVESTIGATOR 0 0 A.4.a. FULL-TIME 0 0 0 0A.4.b. PART-TIME 0 0 0 0A.4.c. COLLATERAL DUTY 0 0 0 0
B. AGENCY & CONTRACT STAFF TRAINING
COUNSELORS INVESTIGATORS COUNS/INVESTIG
AGENCY CONTRACT AGENCY CONTRACT AGENCY CONTRACT
B.1. NEW STAFF (NS) - TOTAL
0 0 0 0 0 0
B.1.a. STAFF RECEIVING REQUIRED 32 OR MORE HOURS
0 0 0 0 0 0
B.1.b. STAFF RECEIVING 8 OR MORE HOURS, USUALLY GIVEN TO EXPERIENCED STAFF
0 0 0 0 0 0
B.1.c. STAFF RECEIVING NO TRAINING AT ALL
0 0 0 0 0 0
B.2. EXPERIENCED STAFF (ES) - TOTAL
5 13 0 12 0 0
B.2.a. STAFF RECEIVING REQUIRED 8 OR MORE HOURS
5 13 0 12 0 0
B.2.b. STAFF RECEIVING 32 OR MORE HOURS, GENERALLY GIVEN TO NEW STAFF
0 0 0 0 0 0
B.2.c. STAFF RECEIVING NO TRAINING AT ALL
0 0 0 0 0 0
C. REPORTING LINE
1. EEO DIRECTOR'S NAME: John W. Burden
1a. DOES THE AGENCY DIRECTOR REPORT YES NO
TO THE AGENCY HEAD? X
2. IF NO, WHO DOES THE EEO DIRECTOR REPORT TO?
PERSON Mary F. Pletcher
TITLE Deputy Assistant Secretary, DOI-DASHO
3. WHO IS RESPONSIBLE FOR THE DAY-TO-DAY OPERATION OF THE EEO
PROGRAM IN YOUR DEPARTMENT/AGENCY/ORGANIZATION?
PERSON Inez Uhl
TITLE Equal Employment Opportunity Officer
4. WHO DOES THAT PERSON REPORT TO?
PERSON Jim Kurth
TITLE Deputy Director, U.S. Fish and Wildlife Service

ANNUAL FEDERAL EQUAL EMPLOYMENT OPPORTUNITY
STATISTICAL REPORT OF DISCRIMINATION COMPLAINTS
(REPORTING PERIOD BEGINS OCTOBER 1ST AND ENDS SEPTEMBER 30TH)
AGENCY OR DEPARTMENT: DOI U.S. Fish and Wildlife Service REPORTING PERIOD: FY 2015
EEOC FORM 462 (REVISED NOV 2014) Report Status: Finalized, 11/03/2015 7:44 AM 3
PART IV - BASES AND ISSUES ALLEGED IN COMPLAINTS FILED (Part 1)
ISSUES OFALLEGED
DISCRIMINATION
BASES OF ALLEGED DISCRIMINATION
RACE
COLOR RELIGION REPRISAL
TOTALALL BASESBY ISSUE
TOTAL ALLCOMPLAINTS
BY ISSUE
TOTAL ALLCOMPLAINANTS
BY ISSUE
AMERICAN INDIANOR ALASKA
NATIVE ASIAN
NATIVE HAWAIIANOR OTHER PACIFIC
ISLANDER
BLACK ORAFRICAN
AMERICAN WHITETWO OR MORE
RACES
A. APPOINTMENT/HIRE 0 0 0 0 0 0 0 0 1 1 1 1
B. ASSIGNMENT OF DUTIES 0 0 0 2 0 0 1 0 5 11 5 5
C. AWARDS 0 0 0 0 0 0 0 0 0 0 0 0
D. CONVERSION TO FULL TIME/PERM STATUS 0 0 0 0 0 0 0 0 0 0 0 0
E. DISCIPLINARY ACTION 1 0 0 0 0 0 1 1 1 8 2 2
E.1. DEMOTION 0 0 0 0 0 0 0 0 0 0 0 0
E.2. REPRIMAND 0 0 0 0 0 0 0 0 0 0 0 0
E.3. SUSPENSION 1 0 0 0 0 0 1 1 1 7 1 1
E.4. REMOVAL 0 0 0 0 0 0 0 0 0 1 1 1
E.5 5. 0 0 0 0 0 0 0 0 0 0 0 0
E.6 6. 0 0 0 0 0 0 0 0 0 0 0 0
F. DUTY HOURS 0 0 0 0 0 0 0 0 1 1 1 1
G. PERF. EVAL./APPRAISAL 0 0 0 2 1 0 0 1 2 11 4 4
H. EXAMINATION/TEST 0 0 0 0 0 0 0 0 0 0 0 0
I. HARASSMENT 1 0 0 5 1 0 1 1 11 37 15 15
I.1. NON-SEXUAL 1 0 0 5 1 0 1 1 11 37 15 15
I.2. SEXUAL 0 0 0 0
J. MEDICAL EXAMINATION 0 0 0 0 0 0 0 0 0 0 0 0
K. PAY INCLUDING OVERTIME 0 0 0 0 0 0 0 0 0 0 0 0
L. PROMOTION/NON-SELECTION 0 0 0 3 0 0 0 0 2 7 3 3
M. REASSIGNMENT 0 0 0 0 0 0 0 0 0 0 0 0
M.1. DENIED 0 0 0 0 0 0 0 0 0 0 0 0
M.2. DIRECTED 0 0 0 0 0 0 0 0 0 0 0 0
N. REASONABLE ACCOMMODATION 1 3 1 1
O. REINSTATEMENT 0 0 0 0 0 0 0 0 0 0 0 0
P. RELIGIOUS ACCOMODATION 0 0 0 0 0
Q. RETIREMENT 0 0 0 0 0 0 0 0 0 0 0 0
R. SEX-STEROTYPING 0 0 0
S. TELEWORK 0 0 0 0 0 0 0 0 0 0 0 0
T. TERMINATION 0 0 0 0 0 0 0 1 0 2 1 1
U. TERMS/CONDITIONS OF EMPLOYMENT 0 0 0 0 1 0 0 1 2 8 3 3
V. TIME AND ATTENDANCE 0 0 0 1 0 0 0 0 3 7 3 3
W. TRAINING 0 0 0 1 0 0 0 0 1 4 2 2
X. OTHER (Please specify below) 0 0 0 0 0 0 0 0 0 0 0 0
X.1. 1. 0 0 0 0 0 0 0 0 0 0 0 0
X.2. 2. 0 0 0 0 0 0 0 0 0 0 0 0
X.3. 3. 0 0 0 0 0 0 0 0 0 0 0 0
X.4. 4. 0 0 0 0 0 0 0 0 0 0 0 0
TOTAL ALL ISSUES BY BASES 2 0 0 14 3 0 3 5 30
TOTAL ALL COMPLAINTS FILED BY BASES 1 0 0 8 1 0 2 3 16

ANNUAL FEDERAL EQUAL EMPLOYMENT OPPORTUNITY
STATISTICAL REPORT OF DISCRIMINATION COMPLAINTS
(REPORTING PERIOD BEGINS OCTOBER 1ST AND ENDS SEPTEMBER 30TH)
AGENCY OR DEPARTMENT: DOI U.S. Fish and Wildlife Service REPORTING PERIOD: FY 2015
EEOC FORM 462 (REVISED NOV 2014) Report Status: Finalized, 11/03/2015 7:44 AM 4
PART IV - BASES AND ISSUES ALLEGED IN COMPLAINTS FILED (Part 1)
ISSUES OFALLEGED
DISCRIMINATION
BASES OF ALLEGED DISCRIMINATION
RACE
COLOR RELIGION REPRISAL
TOTALALL BASESBY ISSUE
TOTAL ALLCOMPLAINTS
BY ISSUE
TOTAL ALLCOMPLAINANTS
BY ISSUE
AMERICAN INDIANOR ALASKA
NATIVE ASIAN
NATIVE HAWAIIANOR OTHER PACIFIC
ISLANDER
BLACK ORAFRICAN
AMERICAN WHITETWO OR MORE
RACES
TOTAL ALL COMPLAINANTS BY BASES 1 0 0 8 1 0 2 3 16

ANNUAL FEDERAL EQUAL EMPLOYMENT OPPORTUNITY
STATISTICAL REPORT OF DISCRIMINATION COMPLAINTS
(REPORTING PERIOD BEGINS OCTOBER 1ST AND ENDS SEPTEMBER 30TH)
AGENCY OR DEPARTMENT: DOI U.S. Fish and Wildlife Service REPORTING PERIOD: FY 2015
EEOC FORM 462 (REVISED NOV 2014) Report Status: Finalized, 11/03/2015 7:44 AM 5
PART IV BASES AND ISSUES ALLEGED IN COMPLAINTS FILED (Part 2)
ISSUES OFALLEGED
DISCRIMINATION
BASES OF ALLEGED DISCRIMINATION
SEX
PREGNANCYDISCRIMINATION ACT
NATIONAL ORIGIN EQUAL PAYACT
AGE
DISABILITY
GINA
TOTALALL BASESBY ISSUE
TOTAL ALLCOMPLAINTS
BY ISSUE
TOTAL ALLCOMPLAINANTS
BY ISSUEMALE FEMALE LGBTHISPANIC /
LATINO OTHER MALE FEMALE MENTAL PHYSICAL
A. APPOINTMENT/HIRE 0 0 0 0 0 0 0 0 0 0 1 1 1
B. ASSIGNMENT OF DUTIES 0 2 0 0 0 0 0 0 1 0 11 5 5
C. AWARDS 0 0 0 0 0 0 0 0 0 0 0 0 0
D. CONVERSION TO FULL TIME 0 0 0 0 0 0 0 0 0 0 0 0 0
E. DISCIPLINARY ACTION 0 0 0 0 0 0 2 1 1 0 8 2 2
E.1. DEMOTION 0 0 0 0 0 0 0 0 0 0 0 0 0
E.2. REPRIMAND 0 0 0 0 0 0 0 0 0 0 0 0 0
E.3. SUSPENSION 0 0 0 0 0 0 1 1 1 0 7 1 1
E.4. REMOVAL 0 0 0 0 0 0 1 0 0 0 1 1 1
E.5. 0 0 0 0 0 0 0 0 0 0 0 0 0
E.6. 0 0 0 0 0 0 0 0 0 0 0 0 0
F. DUTY HOURS 0 0 0 0 0 0 0 0 0 0 1 1 1
G. EVALUATION/APPRAISAL 0 4 0 0 0 0 1 0 0 0 11 4 4
H. EXAMINATION/TEST 0 0 0 0 0 0 0 0 0 0 0 0 0
I. HARASSMENT 2 6 0 0 0 1 4 1 3 0 37 15 15
I.1. NON-SEXUAL 2 6 0 0 0 1 4 1 3 0 37 15 15
I.2. SEXUAL 0 0 0 0 0 0 0
J. MEDICAL EXAMINATION 0 0 0 0 0 0 0 0 0 0 0 0 0
K. PAY INCLUDING OVERTIME 0 0 0 0 0 0 0 0 0 0 0 0 0 0 0
L. PROMOTION/NON-SELECTION 1 0 0 0 0 0 1 0 0 0 7 3 3
M. REASSIGNMENT 0 0 0 0 0 0 0 0 0 0 0 0 0
M.1. DENIED 0 0 0 0 0 0 0 0 0 0 0 0 0
M.2. DIRECTED 0 0 0 0 0 0 0 0 0 0 0 0 0
N. REASONABLE ACCOMMODATION DISABILITY 0 1 1 0 3 1 1
O. REINSTATEMENT 0 0 0 0 0 0 0 0 0 0 0 0 0
P. RELIGIOUS ACCOMMODATION 0 0 0
Q. RETIREMENT 0 0 0 0 0 0 0 0 0 0 0 0 0
R. SEX-STEROTYPING 0 0 0 0 0 0
S. TELEWORK 0 0 0 0 0 0 0 0 0 0 0 0 0
T. TERMINATION 0 0 0 0 0 0 1 0 0 0 2 1 1
U. TERMS/CONDITIONS OF EMPLOYMENT 1 1 0 0 0 0 1 0 1 0 8 3 3
V. TIME AND ATTENDANCE 1 1 0 0 0 0 1 0 0 0 7 3 3
W. TRAINING 0 2 0 0 0 0 0 0 0 0 4 2 2
X. OTHER (Please specify below) 0 0 0 0 0 0 0 0 0 0 0 0 0
X.1. 0 0 0 0 0 0 0 0 0 0 0 0 0
X.2. 0 0 0 0 0 0 0 0 0 0 0 0 0
X.3. 0 0 0 0 0 0 0 0 0 0 0 0 0
X.4. 0 0 0 0 0 0 0 0 0 0 0 0 0
TOTAL ALL ISSUES BY BASES 5 16 0 0 0 1 0 0 11 3 7 0
TOTAL ALL COMPLAINTS FILED BY BASES 3 8 0 0 0 1 0 0 7 3 5 0

ANNUAL FEDERAL EQUAL EMPLOYMENT OPPORTUNITY
STATISTICAL REPORT OF DISCRIMINATION COMPLAINTS
(REPORTING PERIOD BEGINS OCTOBER 1ST AND ENDS SEPTEMBER 30TH)
AGENCY OR DEPARTMENT: DOI U.S. Fish and Wildlife Service REPORTING PERIOD: FY 2015
EEOC FORM 462 (REVISED NOV 2014) Report Status: Finalized, 11/03/2015 7:44 AM 6
PART IV BASES AND ISSUES ALLEGED IN COMPLAINTS FILED (Part 2)
ISSUES OFALLEGED
DISCRIMINATION
BASES OF ALLEGED DISCRIMINATION
SEX
PREGNANCYDISCRIMINATION ACT
NATIONAL ORIGIN EQUAL PAYACT
AGE
DISABILITY
GINA
TOTALALL BASESBY ISSUE
TOTAL ALLCOMPLAINTS
BY ISSUE
TOTAL ALLCOMPLAINANTS
BY ISSUEMALE FEMALE LGBTHISPANIC /
LATINO OTHER MALE FEMALE MENTAL PHYSICAL
TOTAL ALL COMPLAINANTS BY BASES 3 8 0 0 0 1 0 0 7 3 5 0
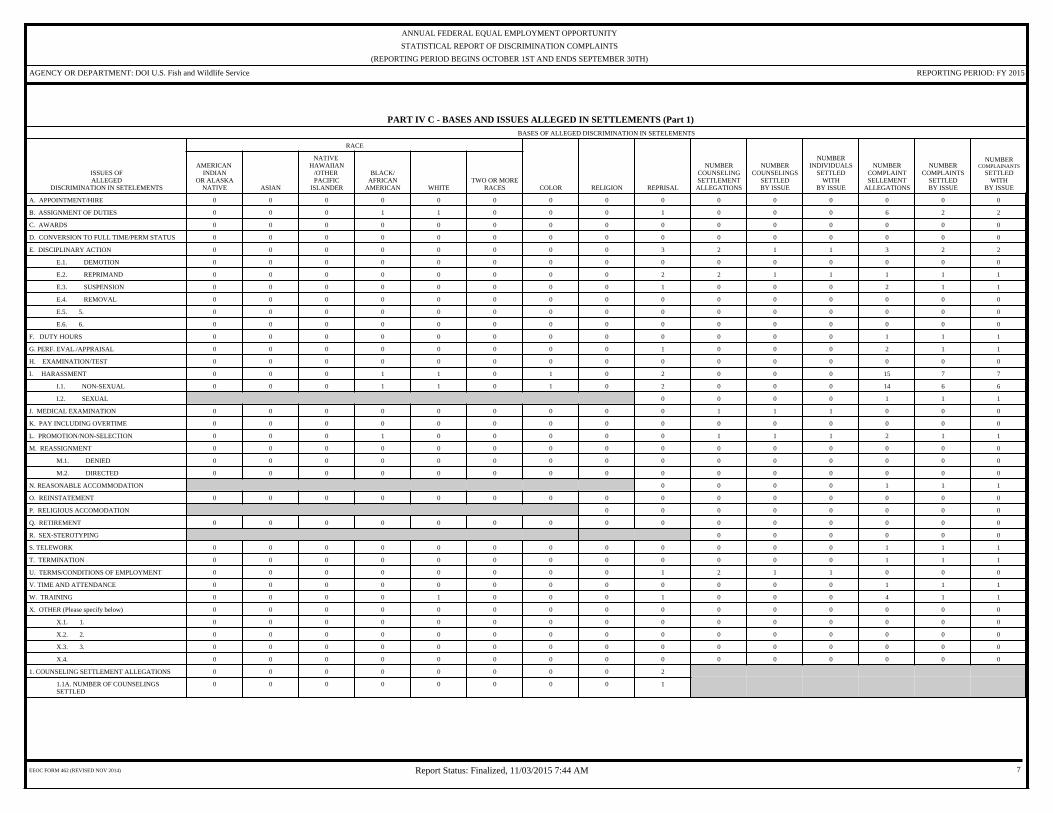
ANNUAL FEDERAL EQUAL EMPLOYMENT OPPORTUNITY
STATISTICAL REPORT OF DISCRIMINATION COMPLAINTS
(REPORTING PERIOD BEGINS OCTOBER 1ST AND ENDS SEPTEMBER 30TH)
AGENCY OR DEPARTMENT: DOI U.S. Fish and Wildlife Service REPORTING PERIOD: FY 2015
EEOC FORM 462 (REVISED NOV 2014) Report Status: Finalized, 11/03/2015 7:44 AM 7
PART IV C - BASES AND ISSUES ALLEGED IN SETTLEMENTS (Part 1)BASES OF ALLEGED DISCRIMINATION IN SETELEMENTS
ISSUES OFALLEGED
DISCRIMINATION IN SETELEMENTS
RACE
COLOR RELIGION REPRISAL
NUMBER
COUNSELINGSETTLEMENTALLEGATIONS
NUMBERCOUNSELINGS
SETTLEDBY ISSUE
NUMBERINDIVIDUALS
SETTLEDWITH
BY ISSUE
NUMBERCOMPLAINTSELLEMENT
ALLEGATIONS
NUMBERCOMPLAINTS
SETTLEDBY ISSUE
NUMBERCOMPLAINANTS
SETTLEDWITH
BY ISSUE
AMERICAN INDIAN
OR ALASKANATIVE ASIAN
NATIVE HAWAIIAN
/OTHER PACIFIC
ISLANDER
BLACK/AFRICAN
AMERICAN WHITETWO OR MORE
RACES
A. APPOINTMENT/HIRE 0 0 0 0 0 0 0 0 0 0 0 0 0 0 0
B. ASSIGNMENT OF DUTIES 0 0 0 1 1 0 0 0 1 0 0 0 6 2 2
C. AWARDS 0 0 0 0 0 0 0 0 0 0 0 0 0 0 0
D. CONVERSION TO FULL TIME/PERM STATUS 0 0 0 0 0 0 0 0 0 0 0 0 0 0 0
E. DISCIPLINARY ACTION 0 0 0 0 0 0 0 0 3 2 1 1 3 2 2
E.1. DEMOTION 0 0 0 0 0 0 0 0 0 0 0 0 0 0 0
E.2. REPRIMAND 0 0 0 0 0 0 0 0 2 2 1 1 1 1 1
E.3. SUSPENSION 0 0 0 0 0 0 0 0 1 0 0 0 2 1 1
E.4. REMOVAL 0 0 0 0 0 0 0 0 0 0 0 0 0 0 0
E.5. 5. 0 0 0 0 0 0 0 0 0 0 0 0 0 0 0
E.6. 6. 0 0 0 0 0 0 0 0 0 0 0 0 0 0 0
F. DUTY HOURS 0 0 0 0 0 0 0 0 0 0 0 0 1 1 1
G. PERF. EVAL./APPRAISAL 0 0 0 0 0 0 0 0 1 0 0 0 2 1 1
H. EXAMINATION/TEST 0 0 0 0 0 0 0 0 0 0 0 0 0 0 0
I. HARASSMENT 0 0 0 1 1 0 1 0 2 0 0 0 15 7 7
I.1. NON-SEXUAL 0 0 0 1 1 0 1 0 2 0 0 0 14 6 6
I.2. SEXUAL 0 0 0 0 1 1 1
J. MEDICAL EXAMINATION 0 0 0 0 0 0 0 0 0 1 1 1 0 0 0
K. PAY INCLUDING OVERTIME 0 0 0 0 0 0 0 0 0 0 0 0 0 0 0
L. PROMOTION/NON-SELECTION 0 0 0 1 0 0 0 0 0 1 1 1 2 1 1
M. REASSIGNMENT 0 0 0 0 0 0 0 0 0 0 0 0 0 0 0
M.1. DENIED 0 0 0 0 0 0 0 0 0 0 0 0 0 0 0
M.2. DIRECTED 0 0 0 0 0 0 0 0 0 0 0 0 0 0 0
N. REASONABLE ACCOMMODATION 0 0 0 0 1 1 1
O. REINSTATEMENT 0 0 0 0 0 0 0 0 0 0 0 0 0 0 0
P. RELIGIOUS ACCOMODATION 0 0 0 0 0 0 0 0
Q. RETIREMENT 0 0 0 0 0 0 0 0 0 0 0 0 0 0 0
R. SEX-STEROTYPING 0 0 0 0 0 0
S. TELEWORK 0 0 0 0 0 0 0 0 0 0 0 0 1 1 1
T. TERMINATION 0 0 0 0 0 0 0 0 0 0 0 0 1 1 1
U. TERMS/CONDITIONS OF EMPLOYMENT 0 0 0 0 0 0 0 0 1 2 1 1 0 0 0
V. TIME AND ATTENDANCE 0 0 0 0 0 0 0 0 0 0 0 0 1 1 1
W. TRAINING 0 0 0 0 1 0 0 0 1 0 0 0 4 1 1
X. OTHER (Please specify below) 0 0 0 0 0 0 0 0 0 0 0 0 0 0 0
X.1. 1. 0 0 0 0 0 0 0 0 0 0 0 0 0 0 0
X.2. 2. 0 0 0 0 0 0 0 0 0 0 0 0 0 0 0
X.3. 3. 0 0 0 0 0 0 0 0 0 0 0 0 0 0 0
X.4. 0 0 0 0 0 0 0 0 0 0 0 0 0 0 0
1. COUNSELING SETTLEMENT ALLEGATIONS 0 0 0 0 0 0 0 0 2
1.1A. NUMBER OF COUNSELINGS SETTLED
0 0 0 0 0 0 0 0 1

ANNUAL FEDERAL EQUAL EMPLOYMENT OPPORTUNITY
STATISTICAL REPORT OF DISCRIMINATION COMPLAINTS
(REPORTING PERIOD BEGINS OCTOBER 1ST AND ENDS SEPTEMBER 30TH)
AGENCY OR DEPARTMENT: DOI U.S. Fish and Wildlife Service REPORTING PERIOD: FY 2015
EEOC FORM 462 (REVISED NOV 2014) Report Status: Finalized, 11/03/2015 7:44 AM 8
PART IV C - BASES AND ISSUES ALLEGED IN SETTLEMENTS (Part 1)BASES OF ALLEGED DISCRIMINATION IN SETELEMENTS
ISSUES OFALLEGED
DISCRIMINATION IN SETELEMENTS
RACE
COLOR RELIGION REPRISAL
NUMBER
COUNSELINGSETTLEMENTALLEGATIONS
NUMBERCOUNSELINGS
SETTLEDBY ISSUE
NUMBERINDIVIDUALS
SETTLEDWITH
BY ISSUE
NUMBERCOMPLAINTSELLEMENT
ALLEGATIONS
NUMBERCOMPLAINTS
SETTLEDBY ISSUE
NUMBERCOMPLAINANTS
SETTLEDWITH
BY ISSUE
AMERICAN INDIAN
OR ALASKANATIVE ASIAN
NATIVE HAWAIIAN
/OTHER PACIFIC
ISLANDER
BLACK/AFRICAN
AMERICAN WHITETWO OR MORE
RACES
1.1B. NUMBER OF COUNSELEES SETTLED WITH
0 0 0 0 0 0 0 0 1
2. COMPLAINT SETTLEMENT ALLEGATIONS 0 0 0 3 3 0 1 0 7
2.2A. NUMBER OF COMPLAINTS SETTLED
0 0 0 3 1 0 1 0 4
2.2B. NUMBER OF COMPLAINANTS SETTLED WITH
0 0 0 2 1 0 1 0 4

ANNUAL FEDERAL EQUAL EMPLOYMENT OPPORTUNITY
STATISTICAL REPORT OF DISCRIMINATION COMPLAINTS
(REPORTING PERIOD BEGINS OCTOBER 1ST AND ENDS SEPTEMBER 30TH)
AGENCY OR DEPARTMENT: DOI U.S. Fish and Wildlife Service REPORTING PERIOD: FY 2015
EEOC FORM 462 (REVISED NOV 2014) Report Status: Finalized, 11/03/2015 7:44 AM 9
PART IV C - BASES AND ISSUES ALLEGED IN SETTLEMENTS (Part 2)BASES OF ALLEGED DESCRIMINATION IN SETTLEMENTS
ISSUES OFALLEGED
DISCRIMINATION IN SETELEMENTS
SEX
PDA
NATIONAL ORIGIN EQUAL PAY ACT
AGE
DISABILITY
GINA
NUMBERCOUNSELINGSETTLEMENTALLEGATIONS
NUMBERCOUNSELINGS
SETTLEDBY ISSUE
NUMBERINDIVIDUALS
SETTLEDWITH
BY ISSUE
NUMBERCOMPLAINTSELLEMENT
ALLEGATIONS
NUMBERCOMPLAINTS
SETTLEDBY ISSUE
NUMBERCOMPLAINANTS
SETTLEDWITH
BY ISSUEMALE FEMALE LGBTHISPANICLATINO OTHER MALE FEMALE MENTAL PHYSICAL
A. APPOINTMENT/HIRE 0 0 0 0 0 0 0 0 0 0 0 0 0 0 0 0
B. ASSIGNMENT OF DUTIES 0 1 0 0 1 0 1 0 0 0 0 0 0 6 2 2
C. AWARDS 0 0 0 0 0 0 0 0 0 0 0 0 0 0 0 0
D. CONVERSION TO FULL TIME/PERM STATUS
0 0 0 0 0 0 0 0 0 0 0 0 0 0 0 0
E. DISCIPLINARY ACTION 0 2 0 0 0 0 0 0 0 0 2 1 1 3 2 2
E.1. DEMOTION 0 0 0 0 0 0 0 0 0 0 0 0 0 0 0 0
E.2. REPRIMAND 0 1 0 0 0 0 0 0 0 0 2 1 1 1 1 1
E.3. SUSPENSION 0 1 0 0 0 0 0 0 0 0 0 0 0 2 1 1
E.4. REMOVAL 0 0 0 0 0 0 0 0 0 0 0 0 0 0 0 0
E.5. 5. 0 0 0 0 0 0 0 0 0 0 0 0 0 0 0 0
E.6. 6. 0 0 0 0 0 0 0 0 0 0 0 0 0 0 0 0
F. DUTY HOURS 0 0 0 0 0 0 0 1 0 0 0 0 0 1 1 1
G. EVALUATION/APPRAISAL 0 1 0 0 0 0 0 0 0 0 0 0 0 2 1 1
H. EXAMINATION/TEST 0 0 0 0 0 0 0 0 0 0 0 0 0 0 0 0
I. HARASSMENT 0 5 0 0 1 0 1 0 3 0 0 0 0 15 7 7
I.1. NON-SEXUAL 0 4 0 0 1 0 1 0 3 0 0 0 0 14 6 6
I.2. SEXUAL 0 1 0 0 0 0 0 1 1 1
J. MEDICAL EXAMINATION 0 0 0 0 0 0 1 0 0 0 1 1 1 0 0 0
K. PAY INCLUDING OVERTIME 0 0 0 0 0 0 0 0 0 0 0 0 0 0 0 0 0 0
L. PROMOTION/NON-SELECTION 0 1 0 0 0 0 1 0 0 0 1 1 1 2 1 1
M. REASSIGNMENT 0 0 0 0 0 0 0 0 0 0 0 0 0 0 0 0
M.1. DENIED 0 0 0 0 0 0 0 0 0 0 0 0 0 0 0 0
M.2. DIRECTED 0 0 0 0 0 0 0 0 0 0 0 0 0 0 0 0
N. REASONABLE ACCOMMODATION DISABILITY
0 0 1 0 0 0 0 1 1 1
O. REINSTATEMENT 0 0 0 0 0 0 0 0 0 0 0 0 0 0 0 0
P. RELIGIOUS ACCOMMODATION 0 0 0 0 0 0
Q. RETIREMENT 0 0 0 0 0 0 0 0 0 0 0 0 0 0 0 0
R. SEX-STEROTYPING 0 0 0 0 0 0 0 0 0
S. TELEWORK 0 0 0 0 0 0 0 1 0 0 0 0 0 1 1 1
T. TERMINATION 0 0 0 0 0 0 0 0 1 0 0 0 0 1 1 1
U. TERMS/CONDITIONS OF EMPLOYMENT 0 1 0 0 0 0 0 0 0 0 2 1 1 0 0 0
V. TIME AND ATTENDANCE 0 0 0 0 0 0 0 1 0 0 0 0 0 1 1 1
W. TRAINING 0 1 0 0 1 0 0 0 0 0 0 0 0 4 1 1
X. OTHER (Please specify below) 0 0 0 0 0 0 0 0 0 0 0 0 0 0 0 0
X.1. 1. 0 0 0 0 0 0 0 0 0 0 0 0 0 0 0 0
X.2. 2. 0 0 0 0 0 0 0 0 0 0 0 0 0 0 0 0
X.3. 3. 0 0 0 0 0 0 0 0 0 0 0 0 0 0 0 0
X.4. 4. 0 0 0 0 0 0 0 0 0 0 0 0 0 0 0 0
1. COUNSELING SETTLEMENT ALLEGATIONS
0 3 0 0 0 0 0 0 1 0 0 0
1.1A. NUMBER OF COUNSELINGS SETTLED
0 2 0 0 0 0 0 0 1 0 0 0

ANNUAL FEDERAL EQUAL EMPLOYMENT OPPORTUNITY
STATISTICAL REPORT OF DISCRIMINATION COMPLAINTS
(REPORTING PERIOD BEGINS OCTOBER 1ST AND ENDS SEPTEMBER 30TH)
AGENCY OR DEPARTMENT: DOI U.S. Fish and Wildlife Service REPORTING PERIOD: FY 2015
EEOC FORM 462 (REVISED NOV 2014) Report Status: Finalized, 11/03/2015 7:44 AM 10
PART IV C - BASES AND ISSUES ALLEGED IN SETTLEMENTS (Part 2)BASES OF ALLEGED DESCRIMINATION IN SETTLEMENTS
ISSUES OFALLEGED
DISCRIMINATION IN SETELEMENTS
SEX
PDA
NATIONAL ORIGIN EQUAL PAY ACT
AGE
DISABILITY
GINA
NUMBERCOUNSELINGSETTLEMENTALLEGATIONS
NUMBERCOUNSELINGS
SETTLEDBY ISSUE
NUMBERINDIVIDUALS
SETTLEDWITH
BY ISSUE
NUMBERCOMPLAINTSELLEMENT
ALLEGATIONS
NUMBERCOMPLAINTS
SETTLEDBY ISSUE
NUMBERCOMPLAINANTS
SETTLEDWITH
BY ISSUEMALE FEMALE LGBTHISPANICLATINO OTHER MALE FEMALE MENTAL PHYSICAL
1.1B. NUMBER OF COUNSELEES SETTLED WITH
0 2 0 0 0 0 0 0 1 0 0 0
2. COMPLAINT SETTLEMENT ALLEGATIONS 0 9 0 0 3 0 0 0 3 3 5 0
2.2A. NUMBER OF COMPLAINTS SETTLED
0 5 0 0 1 0 0 0 3 1 4 0
2.2B. NUMBER OF COMPLAINANTS SETTLED WITH
0 5 0 0 1 0 0 0 2 1 4 0

ANNUAL FEDERAL EQUAL EMPLOYMENT OPPORTUNITY
STATISTICAL REPORT OF DISCRIMINATION COMPLAINTS
(REPORTING PERIOD BEGINS OCTOBER 1ST AND ENDS SEPTEMBER 30TH)
AGENCY OR DEPARTMENT: DOI U.S. Fish and Wildlife Service REPORTING PERIOD: FY 2015
EEOC FORM 462 (REVISED NOV 2014) Report Status: Finalized, 11/03/2015 7:44 AM 11
PART IV D - BASES AND ISSUES FOUND IN FAD's AND FINAL ORDERS (Part 1)BASES OF DISCRIMINATION FOUND IN FAD's AND FINAL ORDERS
ISSUES OFDISCRIMINATION
FOUND IN FAD's AND FINAL ORDERS
RACE
COLOR RELIGION REPRISAL
NUMBERFAD
FINDINGSBY ISSUE
NUMBEROF FADs
WITHFINDINGSBY ISSUE
NUMBERCOMPLAINENTSISSUED FAD
FINDINGSBY ISSUE
NUMBERAJ DECISION
FINDINGBY ISSUE
NUMBERAJ DECISION
WITHFINDINGBY ISSUE
# FINAL ORDER FINDINGS
FULLYIMPLEMENTED
BY ISSUE
# FINAL ORDERS w/
FINDINGS FULLYIMPLEMENTED
BY ISSUE
# COMPLAINANTSISSUED FINAL
ORDERSW/ FINDINGS
FULLY IMPLEMENTED
BY ISSUE
AMERICAN INDIAN
/ALASKANATIVE ASIAN
NATIVE HAWAIIAN
/OTHER PACIFIC
ISLANDER
BLACK/AFRICAN
AMERICAN WHITE
TWO OR MORERACES
A. APPOINTMENT/HIRE 0 0 0 0 0 0 0 0 0 0 0 0 0 0 0 0 0
B. ASSIGNMENT OF DUTIES 0 0 0 0 0 0 0 0 0 0 0 0 0 0 0 0 0
C. AWARDS 0 0 0 0 0 0 0 0 0 0 0 0 0 0 0 0 0
D. CONVERSION TO FULL TIME/PERM STATUS
0 0 0 0 0 0 0 0 0 0 0 0 0 0 0 0 0
E. DISCIPLINARY ACTION 0 0 0 0 0 0 0 0 0 0 0 0 0 0 0 0 0
E.1. DEMOTION 0 0 0 0 0 0 0 0 0 0 0 0 0 0 0 0 0
E.2. REPRIMAND 0 0 0 0 0 0 0 0 0 0 0 0 0 0 0 0 0
E.3. SUSPENSION 0 0 0 0 0 0 0 0 0 0 0 0 0 0 0 0 0
E.4. REMOVAL 0 0 0 0 0 0 0 0 0 0 0 0 0 0 0 0 0
E.5. 5. 0 0 0 0 0 0 0 0 0 0 0 0 0 0 0 0 0
E.6. 6. 0 0 0 0 0 0 0 0 0 0 0 0 0 0 0 0 0
F. DUTY HOURS 0 0 0 0 0 0 0 0 0 0 0 0 0 0 0 0 0
G. PERF. EVAL./APPRAISAL 0 0 0 0 0 0 0 0 0 0 0 0 0 0 0 0 0
H. EXAMINATION/TEST 0 0 0 0 0 0 0 0 0 0 0 0 0 0 0 0 0
I. HARASSMENT 0 0 0 0 0 0 0 0 0 0 0 0 0 0 0 0 0
I.1. NON-SEXUAL 0 0 0 0 0 0 0 0 0 0 0 0 0 0 0 0 0
I.2. SEXUAL 0 0 0 0 0 0 0 0 0
J. MEDICAL EXAMINATION 0 0 0 0 0 0 0 0 0 0 0 0 0 0 0 0 0
K. PAY INCLUDING OVERTIME 0 0 0 0 0 0 0 0 0 0 0 0 0 0 0 0 0
L. PROMOTION/NON-SELECTION 0 0 0 0 0 0 0 0 0 0 0 0 0 0 0 0 0
M. REASSIGNMENT 0 0 0 0 0 0 0 0 0 0 0 0 0 0 0 0 0
M.1. DENIED 0 0 0 0 0 0 0 0 0 0 0 0 0 0 0 0 0
M.2. DIRECTED 0 0 0 0 0 0 0 0 0 0 0 0 0 0 0 0 0
N. REASONABLE ACCOMMODATION 0 0 0 0 0 0 0 0 0
O. REINSTATEMENT 0 0 0 0 0 0 0 0 0 0 0 0 0 0 0 0 0
P. RELIGIOUS ACCOMODATION 0 0 0 0 0 0 0 0 0 0
Q. RETIREMENT 0 0 0 0 0 0 0 0 0 0 0 0 0 0 0 0 0
R. SEX-STEROTYPING 0 0 0 0 0 0 0 0
S. TELEWORK 0 0 0 0 0 0 0 0 0 0 0 0 0 0 0 0 0
T. TERMINATION 0 0 0 0 0 0 0 0 0 0 0 0 0 0 0 0 0
U. TERMS/CONDITIONS OF EMPLOYMENT 0 0 0 0 0 0 0 0 0 0 0 0 0 0 0 0 0
V. TIME AND ATTENDANCE 0 0 0 0 0 0 0 0 0 0 0 0 0 0 0 0 0
W. TRAINING 0 0 0 0 0 0 0 0 0 0 0 0 0 0 0 0 0
X. OTHER (Please specify below) 0 0 0 0 0 0 0 0 0 0 0 0 0 0 0 0 0
X.1. 1. 0 0 0 0 0 0 0 0 0 0 0 0 0 0 0 0 0
X.2. 2. 0 0 0 0 0 0 0 0 0 0 0 0 0 0 0 0 0
X.3. 3. 0 0 0 0 0 0 0 0 0 0 0 0 0 0 0 0 0
X.4. 4. 0 0 0 0 0 0 0 0 0 0 0 0 0 0 0 0 0
1. Final Agency Decision Findings 0 0 0 0 0 0 0 0 0
1.1a. Number FADs with Findings 0 0 0 0 0 0 0 0 0

ANNUAL FEDERAL EQUAL EMPLOYMENT OPPORTUNITY
STATISTICAL REPORT OF DISCRIMINATION COMPLAINTS
(REPORTING PERIOD BEGINS OCTOBER 1ST AND ENDS SEPTEMBER 30TH)
AGENCY OR DEPARTMENT: DOI U.S. Fish and Wildlife Service REPORTING PERIOD: FY 2015
EEOC FORM 462 (REVISED NOV 2014) Report Status: Finalized, 11/03/2015 7:44 AM 12
PART IV D - BASES AND ISSUES FOUND IN FAD's AND FINAL ORDERS (Part 1)BASES OF DISCRIMINATION FOUND IN FAD's AND FINAL ORDERS
ISSUES OFDISCRIMINATION
FOUND IN FAD's AND FINAL ORDERS
RACE
COLOR RELIGION REPRISAL
NUMBERFAD
FINDINGSBY ISSUE
NUMBEROF FADs
WITHFINDINGSBY ISSUE
NUMBERCOMPLAINENTSISSUED FAD
FINDINGSBY ISSUE
NUMBERAJ DECISION
FINDINGBY ISSUE
NUMBERAJ DECISION
WITHFINDINGBY ISSUE
# FINAL ORDER FINDINGS
FULLYIMPLEMENTED
BY ISSUE
# FINAL ORDERS w/
FINDINGS FULLYIMPLEMENTED
BY ISSUE
# COMPLAINANTSISSUED FINAL
ORDERSW/ FINDINGS
FULLY IMPLEMENTED
BY ISSUE
AMERICAN INDIAN
/ALASKANATIVE ASIAN
NATIVE HAWAIIAN
/OTHER PACIFIC
ISLANDER
BLACK/AFRICAN
AMERICAN WHITE
TWO OR MORERACES
1.1b. Number Complainants Issued FAD Findings
0 0 0 0 0 0 0 0 0
2. AJ Decision Findings 0 0 0 0 0 0 0 0 0
2.2a. Number AJ Decisions With Findings 0 0 0 0 0 0 0 0 0
3. Final Agency Order Findings Implemented 0 0 0 0 0 0 0 0 0
3.3a. # of Final Orders (Fos) With Findings Implemented
0 0 0 0 0 0 0 0 0
3.3b. # of Complainants issued FOs with Findings Implemented
0 0 0 0 0 0 0 0 0

ANNUAL FEDERAL EQUAL EMPLOYMENT OPPORTUNITY
STATISTICAL REPORT OF DISCRIMINATION COMPLAINTS
(REPORTING PERIOD BEGINS OCTOBER 1ST AND ENDS SEPTEMBER 30TH)
AGENCY OR DEPARTMENT: DOI U.S. Fish and Wildlife Service REPORTING PERIOD: FY 2015
EEOC FORM 462 (REVISED NOV 2014) Report Status: Finalized, 11/03/2015 7:44 AM 13
PART IV D - BASES AND ISSUES FOUND IN FAD's AND FINAL ORDERS (Part 2)BASES OF DISCRIMINATION FOUND IN FAD's AND FINAL ORDERS
ISSUES OFDISCRIMINATION
FOUND IN FAD's AND FINAL ORDERS
SEX
PDA
NATIONAL ORIGIN EQUAL PAY ACT
AGE
DISABILITY
GINA
NUMBERFAD
FINDINGSBY ISSUE
NUMBEROF FADs
WITHFINDINGSBY ISSUE
NUMBERCOMPLAINENTS
ISSUED FAD
FINDINGSBY ISSUE
NUMBERAJ
DECISIONFINDINGBY ISSUE
NUMBERAJ
DECISIONWITH
FINDINGBY ISSUE
# FINAL ORDER
FINDINGSFULLY
IMPLEMENTEDBY ISSUE
# FINAL ORDERS w/FINDINGS
FULLYIMPLEMENTED
FINDINGS
# COMPLAINANTSISSUED FINAL
ORDERSW/ FINDINGS
FULLY IMPLEMENTED
BY ISSUEMALE FEMALE LGBTHISPANICLATINO OTHER MALE FEMALE MENTAL PHYSICAL
A. APPOINTMENT/HIRE 0 0 0 0 0 0 0 0 0 0 0 0 0 0 0 0 0 0
B. ASSIGNMENT OF DUTIES 0 0 0 0 0 0 0 0 0 0 0 0 0 0 0 0 0 0
C. AWARDS 0 0 0 0 0 0 0 0 0 0 0 0 0 0 0 0 0 0
D. CONVERSION TO FULL TIME/PERM STATUS
0 0 0 0 0 0 0 0 0 0 0 0 0 0 0 0 0 0
E. DISCIPLINARY ACTION 0 0 0 0 0 0 0 0 0 0 0 0 0 0 0 0 0 0
E.1. DEMOTION 0 0 0 0 0 0 0 0 0 0 0 0 0 0 0 0 0 0
E.2. REPRIMAND 0 0 0 0 0 0 0 0 0 0 0 0 0 0 0 0 0 0
E.3. SUSPENSION 0 0 0 0 0 0 0 0 0 0 0 0 0 0 0 0 0 0
E.4. REMOVAL 0 0 0 0 0 0 0 0 0 0 0 0 0 0 0 0 0 0
E.5. 5. 0 0 0 0 0 0 0 0 0 0 0 0 0 0 0 0 0 0
E.6. 6. 0 0 0 0 0 0 0 0 0 0 0 0 0 0 0 0 0 0
F. DUTY HOURS 0 0 0 0 0 0 0 0 0 0 0 0 0 0 0 0 0 0
G. EVALUATION/APPRAISAL 0 0 0 0 0 0 0 0 0 0 0 0 0 0 0 0 0 0
H. EXAMINATION/TEST 0 0 0 0 0 0 0 0 0 0 0 0 0 0 0 0 0 0
I. HARASSMENT 0 0 0 0 0 0 0 0 0 0 0 0 0 0 0 0 0 0
I.1. NON-SEXUAL 0 0 0 0 0 0 0 0 0 0 0 0 0 0 0 0 0 0
I.2. SEXUAL 0 0 0 0 0 0 0 0 0 0 0 0
J. MEDICAL EXAMINATION 0 0 0 0 0 0 0 0 0 0 0 0 0 0 0 0 0 0
K. PAY INCLUDING OVERTIME 0 0 0 0 0 0 0 0 0 0 0 0 0 0 0 0 0 0 0 0
L. PROMOTION/NON-SELECTION 0 0 0 0 0 0 0 0 0 0 0 0 0 0 0 0 0 0
M. REASSIGNMENT 0 0 0 0 0 0 0 0 0 0 0 0 0 0 0 0 0 0
M.1. DENIED 0 0 0 0 0 0 0 0 0 0 0 0 0 0 0 0 0 0
M.2. DIRECTED 0 0 0 0 0 0 0 0 0 0 0 0 0 0 0 0 0 0
N. REASONABLE ACCOMMODATION DISABILITY
0 0 0 0 0 0 0 0 0 0 0 0
O. REINSTATEMENT 0 0 0 0 0 0 0 0 0 0 0 0 0 0 0 0 0 0
P. RELIGIOUS ACCOMMODATION 0 0 0 0 0 0 0 0
Q. RETIREMENT 0 0 0 0 0 0 0 0 0 0 0 0 0 0 0 0 0 0
R. SEX-STEROTYPING 0 0 0 0 0 0 0 0 0 0 0
S. TELEWORK 0 0 0 0 0 0 0 0 0 0 0 0 0 0 0 0 0 0
T. TERMINATION 0 0 0 0 0 0 0 0 0 0 0 0 0 0 0 0 0 0
U. TERMS/CONDITIONS OF EMPLOYMENT
0 0 0 0 0 0 0 0 0 0 0 0 0 0 0 0 0 0
V. TIME AND ATTENDANCE 0 0 0 0 0 0 0 0 0 0 0 0 0 0 0 0 0 0
W. TRAINING 0 0 0 0 0 0 0 0 0 0 0 0 0 0 0 0 0 0
X. OTHER (Please specify below) 0 0 0 0 0 0 0 0 0 0 0 0 0 0 0 0 0 0
X.1. 1. 0 0 0 0 0 0 0 0 0 0 0 0 0 0 0 0 0 0
X.2. 2. 0 0 0 0 0 0 0 0 0 0 0 0 0 0 0 0 0 0
X.3. 3. 0 0 0 0 0 0 0 0 0 0 0 0 0 0 0 0 0 0
X.4. 4. 0 0 0 0 0 0 0 0 0 0 0 0 0 0 0 0 0 0
1. Final Agency Decision Findings 0 0 0 0 0 0 0 0 0 0 0 0
1.1a. Number FADs with Findings 0 0 0 0 0 0 0 0 0 0 0 0

ANNUAL FEDERAL EQUAL EMPLOYMENT OPPORTUNITY
STATISTICAL REPORT OF DISCRIMINATION COMPLAINTS
(REPORTING PERIOD BEGINS OCTOBER 1ST AND ENDS SEPTEMBER 30TH)
AGENCY OR DEPARTMENT: DOI U.S. Fish and Wildlife Service REPORTING PERIOD: FY 2015
EEOC FORM 462 (REVISED NOV 2014) Report Status: Finalized, 11/03/2015 7:44 AM 14
PART IV D - BASES AND ISSUES FOUND IN FAD's AND FINAL ORDERS (Part 2)BASES OF DISCRIMINATION FOUND IN FAD's AND FINAL ORDERS
ISSUES OFDISCRIMINATION
FOUND IN FAD's AND FINAL ORDERS
SEX
PDA
NATIONAL ORIGIN EQUAL PAY ACT
AGE
DISABILITY
GINA
NUMBERFAD
FINDINGSBY ISSUE
NUMBEROF FADs
WITHFINDINGSBY ISSUE
NUMBERCOMPLAINENTS
ISSUED FAD
FINDINGSBY ISSUE
NUMBERAJ
DECISIONFINDINGBY ISSUE
NUMBERAJ
DECISIONWITH
FINDINGBY ISSUE
# FINAL ORDER
FINDINGSFULLY
IMPLEMENTEDBY ISSUE
# FINAL ORDERS w/FINDINGS
FULLYIMPLEMENTED
FINDINGS
# COMPLAINANTSISSUED FINAL
ORDERSW/ FINDINGS
FULLY IMPLEMENTED
BY ISSUEMALE FEMALE LGBTHISPANICLATINO OTHER MALE FEMALE MENTAL PHYSICAL
1.1b. Number Complainants Issued FAD Findings
0 0 0 0 0 0 0 0 0 0 0 0
2. AJ Decision Findings 0 0 0 0 0 0 0 0 0 0 0 0
2.2a. Number AJ Decisions With Findings 0 0 0 0 0 0 0 0 0 0 0 0
3. Final Agency Order Findings Implemented 0 0 0 0 0 0 0 0 0 0 0 0
3.3a. # of Final Orders (Fos) With Findings Implemented
0 0 0 0 0 0 0 0 0 0 0 0
3.3b. # of Complainants issued FOs with Findings Implemented
0 0 0 0 0 0 0 0 0 0 0 0

ANNUAL FEDERAL EQUAL EMPLOYMENT OPPORTUNITY
STATISTICAL REPORT OF DISCRIMINATION COMPLAINTS
(REPORTING PERIOD BEGINS OCTOBER 1ST AND ENDS SEPTEMBER 30TH)
AGENCY OR DEPARTMENT: DOI U.S. Fish and Wildlife Service REPORTING PERIOD: FY 2015
EEOC FORM 462 (REVISED NOV 2014) Report Status: Finalized, 11/03/2015 7:44 AM 15
PART V - SUMMARY OF CLOSURES BY STATUTE
28 A.1. TITLE VII
1 A.1a. PREGNANCY DISCRIMINATION ACT (PDA)
9 A.2. AGE DISRIMINATION IN EMPLOYMENT ACT (ADEA)
9 A.3. REHABILITATION ACT
0 A.4. EQUAL PAY ACT (EPA)
0 A.5. GENETIC INFORMATION NONDISCRIMINATION ACT (GINA)
47 B. TOTAL BY STATUTES - THIS NUMBER MAY BE LARGER THAN THE TOTAL NUMBER OF COMPLAINTS CLOSED. (A1+A1a+A2+A3+A4+A5)
PART VI - SUMMARY OF CLOSURES BY CATEGORY
TOTALNUMBER
TOTALDAYS
AVERAGEDAYS
A. TOTAL NUMBER OF CLOSURES 32 14549 454.66
A.1. WITHDRAWALS 1 12 12.00
A.1.a. NON-ADR WITHDRAWALS 1 12 12.00
A.1.b. ADR WITHDRAWALS 0 0 0.00
A.2. SETTLEMENTS 11 5780 525.45
A.2.a. NON-ADR SETTLEMENTS 11 5780 525.45
A.2.b. ADR SETTLEMENTS 0 0 0.00
A.3. FINAL AGENCY ACTIONS 20 8757 437.85
B. FINAL AGENCY DECISIONS WITHOUT AN ADMINISTRATIVE JUDGE DECISION 20 8757 437.85
B.1. FINDING DISCRIMINATION 0 0 0.00
B.2. FINDING NO DISCRIMINATION 13 6540 503.08
B.3. DISMISSAL OF COMPLAINTS 7 2217 316.71
C. FINAL AGENCY ORDERS WITH AN ADMINISTRATIVE JUDGE (AJ) DECISION 0 0 0.00
C.1. AJ DECISION FULLY IMPLEMENTED 0 0 0.00
C.1.a FINDING DISCRIMINATION 0 0 0.00
C.1.b FINDING NO DISCRIMINATION 0 0 0.00
C.1.c DISMISSAL OF COMPLAINTS 0 0 0.00
C.2. AJ DECISION NOT FULLY IMPLEMENTED 0 0 0.00
C.2.a FINDING DISCRIMINATION 0 0 0.00
C.2.a.i. AGENCY APPEALED FINDING BUT NOT REMEDY 0 0 0.00
C.2.a.ii. AGENCY APPEALED REMEDY BUT NOT FINDING 0 0 0.00
C.2.a.iii. AGENCY APPEALED BOTH FINDING AND REMEDY 0 0 0.00
C.2.b FINDING NO DISCRIMINATION 0 0 0.00
C.2.c DISMISSAL OF COMPLAINTS 0 0 0.00

ANNUAL FEDERAL EQUAL EMPLOYMENT OPPORTUNITY
STATISTICAL REPORT OF DISCRIMINATION COMPLAINTS
(REPORTING PERIOD BEGINS OCTOBER 1ST AND ENDS SEPTEMBER 30TH)
AGENCY OR DEPARTMENT: DOI U.S. Fish and Wildlife Service REPORTING PERIOD: FY 2015
EEOC FORM 462 (REVISED NOV 2014) Report Status: Finalized, 11/03/2015 7:44 AM 16
PART VI - SUMMARY OF CLOSURES BY CATEGORY (Continued)
TOTALNUMBER
TOTALDAYS
AVERAGEDAYS
D. FINAL AGENCY MERIT DECISIONS (FAD) ISSUED 13 2767 212.85
D.1. COMPLAINANT REQUESTED IMMEDIATE FAD 6 448 74.67
D.1.a. AGENCY ISSUED FAD WITHIN 60 DAYS OF RECEIPT OF FAD REQUEST 4 237 59.25
D.1.b. AGENCY ISSUED FAD MORE THAN 60 DAYS BEYOND RECEIPT OF FAD REQUEST 2 211 105.50
D.2. COMPLAINANT DID NOT ELECT HEARING OR FAD 5 1984 396.80
D.2.a. AGENCY ISSUED FAD WITHIN 60 DAYS OF END OF 30-DAY ELECTION PERIOD 1 50 50.00
D.2.b. AGENCY ISSUED FAD MORE THAN 60 DAYS BEYOND END OF 30-DAY ELECTION PERIOD 4 1934 483.50
D.3. HEARING REQUESTED; AJ RETURNED CASE TO AGENCY FOR FAD WITHOUT AJ DECISION (3a+3b) 2 335 167.50
D.3.a. AGENCY ISSUED FAD WITHIN 60 DAYS OF RECEIPT OF AJ RETURNED CASE FOR FAD ISSUANCE 1 56 56.00
D.3.b. AGENCY ISSUED FAD MORE THAN 60 DAYS AFTER RECEIPT OF AJ RETURNED CASE FOR FAD ISSUANCE 1 279 279.00
D.4. FINAL AGENCY DECISION ISSUED ON A MIXED CASE (4a+4b) 0 0 0.00
D.4.a. AGENCY ISSUED FAD WITHIN 45 DAYS AFTER INVESTIGATION 0 0 0.00
D.4.b. AGENCY ISSUED FAD MORE THAN 45 DAYS AFTER INVESTIGATION 0 0 0.00
PART VII - SUMMARY OF FORMAL COMPLAINTS CLOSED BY TYPES OF BENEFITS
NUMBER AMOUNT
A. TOTAL COMPLAINTS CLOSED WITH BENEFITS 11
B. TOTAL CLOSURES WITH MONETARY BENEFITS TO COMPLAINANT 8 $171,877.50
B.1. BACK PAY/FRONT PAY 0 $0.00
B.2. LUMP SUM PAYMENT 6 $76,877.50
B.3. COMPENSATORY DAMAGES 1 $35,000.00
B.4. ATTORNEY FEES AND COSTS 4 $60,000.00
D. INTENTIONALLY LEFT BLANK
B.5. 5. 0 $0.00
B.6. 6. 0 $0.00
E. TOTAL CLOSURES WITH NON-MONETARY BENEFITS TO COMPLAINANT 9
F. TYPES OF BENEFITS IN NON-MONETARY CLOSURES
NUMBER OF CLOSURES THAT RECEIVED MONETARY BENEFITS AS
WELL
NUMBER OF CLOSURES THAT RECEIVED ONLY NON-MONETARY
BENEFITS
F.1. HIRES 0 0
F.1.a. RETROACTIVE 0 0
F.1.b. NON-RETROACTIVE 0 0
F.2. PROMOTIONS 0 1
F.2.a. RETROACTIVE 0 0
F.2.b. NON-RETROACTIVE 0 1
F.3. EXPUNGEMENTS 2 1
F.4. REASSIGNMENTS 2 1
F.5. REMOVALS RESCINDED 0 1
F.5.a. REINSTATEMENT 0 0
F.5.b. VOLUNTARY RESIGNATION 0 1
F.6. ACCOMMODATIONS 2 0
F.7. TRAINING 1 1
F.8. APOLOGY 0 0
F.9. DISCIPLINARY ACTIONS 3 0
F.9.a. RESCINDED 3 0
F.9.b. MODIFIED 0 0
F.10. PERFORMANCE EVALUATION MODIFIED 1 1
F.11. LEAVE RESTORED 1 0
F.12. NEUTRAL REFERENCE 0 0
F.13. Working Conditions Improved 1 1
F.14. 14. 0 0
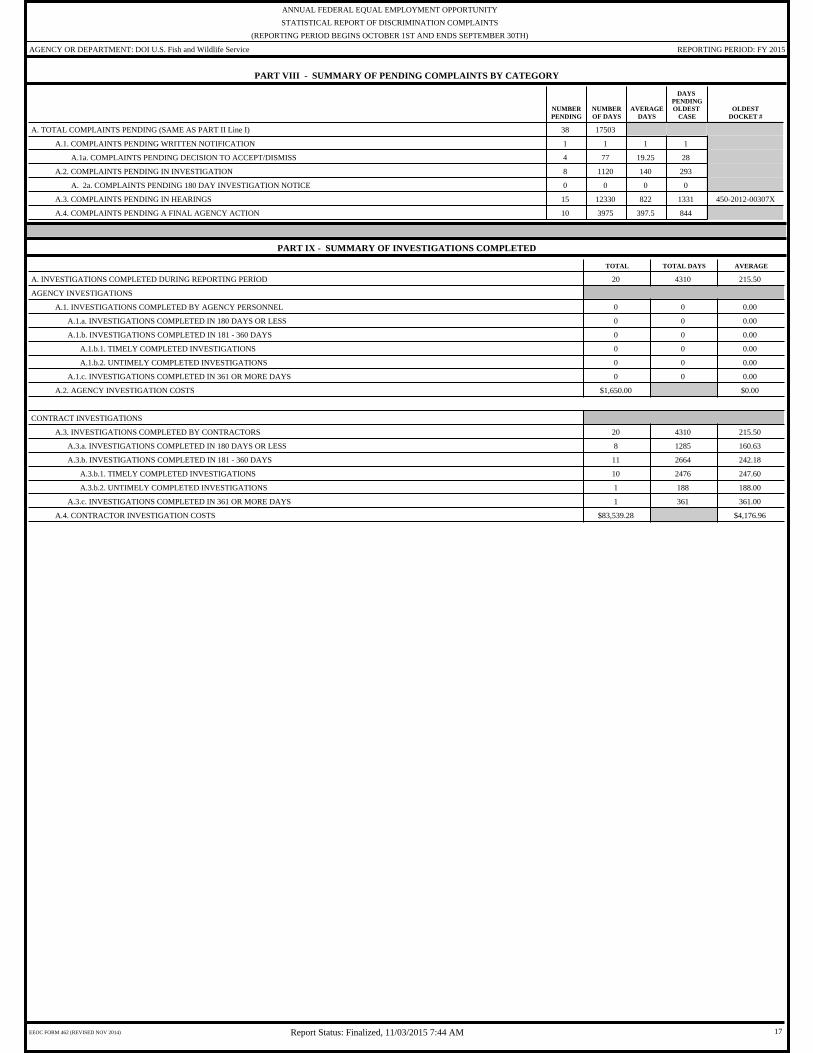
ANNUAL FEDERAL EQUAL EMPLOYMENT OPPORTUNITY
STATISTICAL REPORT OF DISCRIMINATION COMPLAINTS
(REPORTING PERIOD BEGINS OCTOBER 1ST AND ENDS SEPTEMBER 30TH)
AGENCY OR DEPARTMENT: DOI U.S. Fish and Wildlife Service REPORTING PERIOD: FY 2015
EEOC FORM 462 (REVISED NOV 2014) Report Status: Finalized, 11/03/2015 7:44 AM 17
PART VIII - SUMMARY OF PENDING COMPLAINTS BY CATEGORY
NUMBERPENDING
NUMBEROF DAYS
AVERAGEDAYS
DAYS PENDINGOLDEST
CASEOLDEST
DOCKET #
A. TOTAL COMPLAINTS PENDING (SAME AS PART II Line I) 38 17503
A.1. COMPLAINTS PENDING WRITTEN NOTIFICATION 1 1 1 1
A.1a. COMPLAINTS PENDING DECISION TO ACCEPT/DISMISS 4 77 19.25 28
A.2. COMPLAINTS PENDING IN INVESTIGATION 8 1120 140 293
A. 2a. COMPLAINTS PENDING 180 DAY INVESTIGATION NOTICE 0 0 0 0
A.3. COMPLAINTS PENDING IN HEARINGS 15 12330 822 1331 450-2012-00307X
A.4. COMPLAINTS PENDING A FINAL AGENCY ACTION 10 3975 397.5 844
PART IX - SUMMARY OF INVESTIGATIONS COMPLETED
TOTAL TOTAL DAYS AVERAGE
A. INVESTIGATIONS COMPLETED DURING REPORTING PERIOD 20 4310 215.50
AGENCY INVESTIGATIONS
A.1. INVESTIGATIONS COMPLETED BY AGENCY PERSONNEL 0 0 0.00
A.1.a. INVESTIGATIONS COMPLETED IN 180 DAYS OR LESS 0 0 0.00
A.1.b. INVESTIGATIONS COMPLETED IN 181 - 360 DAYS 0 0 0.00
A.1.b.1. TIMELY COMPLETED INVESTIGATIONS 0 0 0.00
A.1.b.2. UNTIMELY COMPLETED INVESTIGATIONS 0 0 0.00
A.1.c. INVESTIGATIONS COMPLETED IN 361 OR MORE DAYS 0 0 0.00
A.2. AGENCY INVESTIGATION COSTS $1,650.00 $0.00
CONTRACT INVESTIGATIONS
A.3. INVESTIGATIONS COMPLETED BY CONTRACTORS 20 4310 215.50
A.3.a. INVESTIGATIONS COMPLETED IN 180 DAYS OR LESS 8 1285 160.63
A.3.b. INVESTIGATIONS COMPLETED IN 181 - 360 DAYS 11 2664 242.18
A.3.b.1. TIMELY COMPLETED INVESTIGATIONS 10 2476 247.60
A.3.b.2. UNTIMELY COMPLETED INVESTIGATIONS 1 188 188.00
A.3.c. INVESTIGATIONS COMPLETED IN 361 OR MORE DAYS 1 361 361.00
A.4. CONTRACTOR INVESTIGATION COSTS $83,539.28 $4,176.96
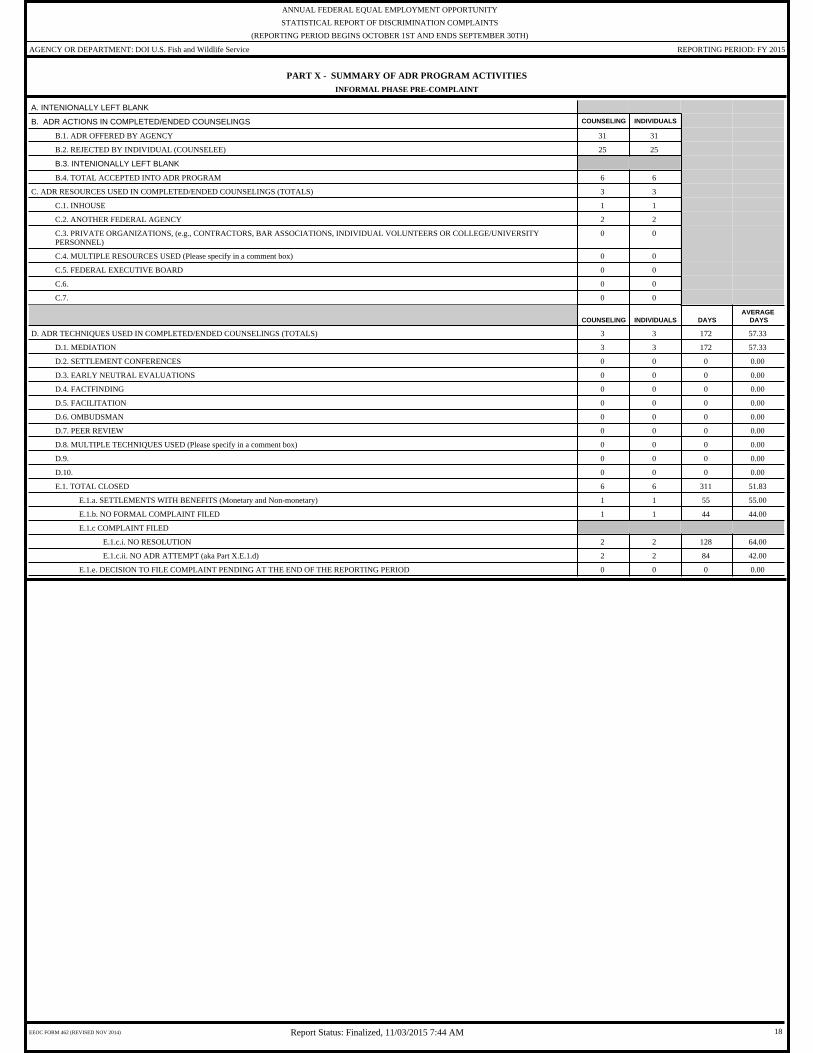
ANNUAL FEDERAL EQUAL EMPLOYMENT OPPORTUNITY
STATISTICAL REPORT OF DISCRIMINATION COMPLAINTS
(REPORTING PERIOD BEGINS OCTOBER 1ST AND ENDS SEPTEMBER 30TH)
AGENCY OR DEPARTMENT: DOI U.S. Fish and Wildlife Service REPORTING PERIOD: FY 2015
EEOC FORM 462 (REVISED NOV 2014) Report Status: Finalized, 11/03/2015 7:44 AM 18
PART X - SUMMARY OF ADR PROGRAM ACTIVITIESINFORMAL PHASE PRE-COMPLAINT
A. INTENIONALLY LEFT BLANK
B. ADR ACTIONS IN COMPLETED/ENDED COUNSELINGS COUNSELING INDIVIDUALS
B.1. ADR OFFERED BY AGENCY 31 31
B.2. REJECTED BY INDIVIDUAL (COUNSELEE) 25 25
B.3. INTENIONALLY LEFT BLANK
B.4. TOTAL ACCEPTED INTO ADR PROGRAM 6 6
C. ADR RESOURCES USED IN COMPLETED/ENDED COUNSELINGS (TOTALS) 3 3
C.1. INHOUSE 1 1
C.2. ANOTHER FEDERAL AGENCY 2 2
C.3. PRIVATE ORGANIZATIONS, (e.g., CONTRACTORS, BAR ASSOCIATIONS, INDIVIDUAL VOLUNTEERS OR COLLEGE/UNIVERSITY PERSONNEL)
0 0
C.4. MULTIPLE RESOURCES USED (Please specify in a comment box) 0 0
C.5. FEDERAL EXECUTIVE BOARD 0 0
C.6. 0 0
C.7. 0 0
COUNSELING INDIVIDUALS DAYS
AVERAGE DAYS
D. ADR TECHNIQUES USED IN COMPLETED/ENDED COUNSELINGS (TOTALS) 3 3 172 57.33
D.1. MEDIATION 3 3 172 57.33
D.2. SETTLEMENT CONFERENCES 0 0 0 0.00
D.3. EARLY NEUTRAL EVALUATIONS 0 0 0 0.00
D.4. FACTFINDING 0 0 0 0.00
D.5. FACILITATION 0 0 0 0.00
D.6. OMBUDSMAN 0 0 0 0.00
D.7. PEER REVIEW 0 0 0 0.00
D.8. MULTIPLE TECHNIQUES USED (Please specify in a comment box) 0 0 0 0.00
D.9. 0 0 0 0.00
D.10. 0 0 0 0.00
E.1. TOTAL CLOSED 6 6 311 51.83
E.1.a. SETTLEMENTS WITH BENEFITS (Monetary and Non-monetary) 1 1 55 55.00
E.1.b. NO FORMAL COMPLAINT FILED 1 1 44 44.00
E.1.c COMPLAINT FILED
E.1.c.i. NO RESOLUTION 2 2 128 64.00
E.1.c.ii. NO ADR ATTEMPT (aka Part X.E.1.d) 2 2 84 42.00
E.1.e. DECISION TO FILE COMPLAINT PENDING AT THE END OF THE REPORTING PERIOD 0 0 0 0.00

ANNUAL FEDERAL EQUAL EMPLOYMENT OPPORTUNITY
STATISTICAL REPORT OF DISCRIMINATION COMPLAINTS
(REPORTING PERIOD BEGINS OCTOBER 1ST AND ENDS SEPTEMBER 30TH)
AGENCY OR DEPARTMENT: DOI U.S. Fish and Wildlife Service REPORTING PERIOD: FY 2015
EEOC FORM 462 (REVISED NOV 2014) Report Status: Finalized, 11/03/2015 7:44 AM 19
PART XI SUMMARY OF ADR PROGRAM ACTIVITIESFORMAL PHASE (COMPLAINT FILED)
B. ADR ACTIONS IN COMPLAINT CLOSURES COMPLAINTS COMPLAINANTS
B.1. ADR OFFERED BY AGENCY 24 33B.2. REJECTED BY COMPLAINANT 23 22B.3. INTENTIONALLY LEFT BLANKB.4. TOTAL ACCEPTED INTO ADR PROGRAM 1 1
C. ADR RESOURCES USED IN COMPLAINT CLOSURES (TOTALS) 1 1C.1. INHOUSE 0 0C.2. ANOTHER FEDERAL AGENCY 1 1C.3. PRIVATE ORGANIZATIONS, (e.g., CONTRACTORS, BAR ASSOCIATIONS, INDIVIDUAL VOLUNTEERS OR COLLEGE/UNIVERSITY 0 0C.4. MULTIPLE RESOURCES USED (Please specify in a comment box) 0 0C.5. FEDERAL EXECUTIVE BOARD 0 0C.6. 0 0C.7. 0 0
COMPLAINTS COMPLAINANTS DAYS AVERAGE DAYS
D. ADR TECHNIQUES USED IN COMPLAINT CLOSURES (TOTALS) 1 1 77 77.00
D.1. MEDIATION 1 1 77 77.00
D.2. SETTLEMENT CONFERENCES 0 0 0 0.00
D.3. EARLY NEUTRAL EVALUATIONS 0 0 0 0.00
D.4. FACTFINDING 0 0 0 0.00
D.5. FACILITATION 0 0 0 0.00
D.6. OMBUDSMAN 0 0 0 0.00
D.7. MINI-TRIALS 0 0 0 0.00
D.8. PEER REVIEW 0 0 0 0.00
D.9. MULTIPLE TECHNIQUES USED (Please specify in a comment box) 0 0 0 0.00
D.10. 0 0 0 0.00
D.11. 0 0 0 0.00
E. STATUS OF CASES IN COMPLAINT CLOSURES COMPLAINTS COMPLAINANTS DAYS AVERAGE DAYS
E.1. TOTAL CLOSED 1 1 77 77.00E.1.a. SETTLEMENTS WITH BENEFITS (Monetary and Non-monetary) 0 0 0 0.00E.1.b. WITHDRAWAL FROM EEO PROCESS 0 0 0 0.00E.1.c. NO RESOLUTION 1 1 77 77.00E.1.d. NO ADR ATTEMPT 0 0 0 0.00
2. INTENTIONALLY LEFT BLANKF. BENEFITS RECEIVED COMPLAINTS COMPLAINANTS AMOUNT
F.1. MONETARY (INSERT TOTALS) 0 0 $0.00F.1.a. COMPENSATORY DAMAGES 0 0 $0.00F.1.b. BACKPAY/FRONTPAY 0 0 $0.00F.1.c. LUMP SUM 0 0 $0.00F.1.d. ATTORNEY FEES AND COSTS 0 0 $0.00F.1.e. 0 0 $0.00
F.2. NON-MONETARY (INSERT TOTALS) 0 0F.2.a. HIRES 0 0
F.2.a.i. RETROACTIVE 0 0F.2.a.ii. NON-RETROACTIVE 0 0
F.2.b. PROMOTIONS 0 0F.2.b.i. RETROACTIVE 0 0F.2.b.ii. NON-RETROACTIVE 0 0
F.2.c. EXPUNGEMENTS 0 0F.2.d. REASSIGNMENTS 0 0F.2.e. REMOVALS RESCINDED 0 0
F.2.e.i. REINSTATEMENT 0 0F.2.e.ii. VOLUNTARY RESIGNATION 0 0
F.2.f. ACCOMMODATIONS 0 0F.2.g. TRAINING 0 0F.2.h. APOLOGY 0 0F.2.i. DISCIPLINARY ACTIONS 0 0
F.2.i.i. RESCINDED 0 0F.2.i.ii. MODIFIED 0 0
F.2.j. PERFORMANCE EVALUATION MODIFIED 0 0F.2.k. LEAVE RESTORED 0 0F.2.l. NEUTRAL REFERENCE 0 0F.2.m. 0 0

ANNUAL FEDERAL EQUAL EMPLOYMENT OPPORTUNITY
STATISTICAL REPORT OF DISCRIMINATION COMPLAINTS
(REPORTING PERIOD BEGINS OCTOBER 1ST AND ENDS SEPTEMBER 30TH)
AGENCY OR DEPARTMENT: DOI U.S. Fish and Wildlife Service REPORTING PERIOD: FY 2015
EEOC FORM 462 (REVISED NOV 2014) Report Status: Finalized, 11/03/2015 7:44 AM 20
PART XII - SUMMARY OF EEO ADR PROGRAM ACTIVITIES
EEO ADR RESOURCES
A. NO LONGER COLLECTED
B. EMPLOYEES THAT CAN PARTICIPATE IN EEO ADR 8945
C. RESOURCES THAT MANAGE EEO ADR PROGRAM (DOES NOT INCLUDE NEUTRALS AS REPORTED IN PARTS X. & XI.) 1
C.1. IN-HOUSE FULL TIME (40 HOURS EEO ADR ONLY) 1
C.2. IN-HOUSE PART TIME (32 HOURS EEO ADR ONLY) 0
C.3. IN-HOUSE COLLATERAL DUTY (OTHERS/NON-CONTRACT) 0
C.4. CONTRACT (ANOTHER FEDERAL AGENCY/PRIVATE ORGANIZATIONS) 0
AMOUNT
D. EEO ADR FUNDING SPENT $7,669.00
E. EEO ADR CONTACT INFORMATION
E.1. NAME OF EEO ADR PROGRAM DIRECTOR / MANAGER Matthew Costello
E.2. TITLE Director
E.3. TELEPHONE NUMBER 703-235-3791
E.4. EMAIL [email protected]
F. EEO ADR PROGRAM INFORMATION
YES NO
F.1. Does the agency require the alleged responsible management official to participate in EEO ADR? X
F.1a. If yes, is there a written policy requiring the participation? X
F.2. Does the alleged responsible management official have a role in deciding if the case is appropriate for EEO ADR? X
CERTIFICATION AND CONTACT INFORMATION
I certify that the EEO complaint data contained in this report, EEOC Form 462, Annual Federal Equal Employment Opportunity Statistical Report of Discrimination Complaints, for the reporting period October 1, 2014 through September 30, 2015 is accurate and complete.
NAME OF CERTIFYING OFFICIAL: Inez Uhl
TITLE OF CERTIFYING OFFICIAL: EEO Director
TELEPHONE NUMBER: (703) 358-2369
E-MAIL: [email protected]
SIGNATURE OF CERTIFYING OFFICIAL: (Enter PIN to serve as your electronic signature)
DATE: 29-10-2015
NAME OF PREPARER: Tanisha Edmonds
TITLE OF PREPARER: Chief, ECAD
TELEPHONE NUMBER: (202) 208-4016
E-MAIL: [email protected]
DATE: 29-10-2015
The FY 2015 Form 462 report must be "Accepted/Finalized" by EEOC by November 2, 2015 to be considered timely.

ANNUAL FEDERAL EQUAL EMPLOYMENT OPPORTUNITY
STATISTICAL REPORT OF DISCRIMINATION COMPLAINTS
(REPORTING PERIOD BEGINS OCTOBER 1ST AND ENDS SEPTEMBER 30TH)
AGENCY OR DEPARTMENT: DOI U.S. Fish and Wildlife Service REPORTING PERIOD: FY 2015
EEOC FORM 462 (REVISED NOV 2014) Report Status: Finalized, 11/03/2015 7:44 AM 21
Form 462 CommentsPart Name COMMENT( expression left | evaluation symbol | expression right | value1 | value2 | comment )
Part I
D.1 -- On Hand At The Beginning Of The Reporting Period, Counselings (Current year) | = | D.4.-- Counselings Pending At The End Of The Reporting Period (Previous Year) | 4 | 6 | USFWS conducted a review of the FY 2015 counselings on hand at beginning of the reporting period. The review confirmed that there were 4 carry-overs from FY 2014, including one from a breach of settlement that had been closed in the FY 2014. Based on this review, USFW has concluded that initial contact date fields were corrected during the course of FY 2015; these corrections caused the discrepancy between the 2 annual reports.
D.1 -- On Hand At The Beginning Of The Reporting Period, Individuals (Current year) | = | D.4.-- Individuals Pending At The End Of The Reporting Period (Previous Year) | 4 | 6 | USFWS conducted a review of the FY 2015 counselings on hand at beginning of the reporting period. The review confirmed that there were 4 carry-overs from FY 2014, including one from a breach of settlement that had been closed in the FY 2014. Based on this review, USFW has concluded that initial contact date fields were corrected during the course of FY 2015; these corrections caused the discrepancy between the 2 annual reports.
D3c -- Counseling Completed/Ended in Reporting Period that Resulted in Complaint Filing in Reporting Period - Individuals | = | Part II. J | 20 | 23 | DOI-FWS-14-0249 Mariana Sanders and DOI-FWS-14-0444 Gerri Castonguay concluded their pre-complaint in FY2014 but did not file their formal complaint until FY2015. Additionally, DOI-FWS-14-0091 (Secondary) / Sheryl Ritter was not on hand at the end of previous FY. Complaint had been closed in previous FY but due to a breach of settlement, the case was restarted in FY15.
D3c -- Counseling Completed/Ended in Reporting Period that Resulted in Complaint Filing in Reporting Period Complaints | = | Part II. B | 20 | 23 | DOI-FWS-14-0249 Mariana Sanders and DOI-FWS-14-0444 Gerri Castonguay concluded their pre-complaint in FY2014 but did not file their formal complaint until FY2015. Additionally, DOI-FWS-14-0091 (Secondary) / Sheryl Ritter was not on hand at the end of previous FY. Complaint had been closed in previous FY but due to a breach of settlement, the case was restarted in FY15.
PART XII
C. RESOURCES THAT MANAGE EEO ADR PROGRAM (DOES NOT INCLUDE NEUTRALS AS REPORTED IN PARTS X. & XI.), N/A | Not empty | N/A | 1 | | FWS verifies that this is accurate. ADR Director Matthew Costello solely manages the EEO ADR Program
C.1. IN-HOUSE FULL TIME (40 HOURS EEO ADR ONLY), N/A | Not empty | N/A | 1 | | FWS verifies that this is accurate. ADR Director Matthew Costello solely manages the EEO ADR Program

162
Examples of Projects Completed in FY15 with Significant Accessibility Components
Unit Facility Name
State Project Title
Accessibility Comments
Great Dismal Swamp NWR VA Replace Deteriorated Crew Quarters The facility must comply with ADA and ABA requirements and energy standards.
Overflow NWR AR Replace Visitor Contact/Admin Building
Mason Neck NWR VA Replace Maintenance Shop
Pea Island NWR NC Replace Storage Building
Marais des Cygnes NWR KS Replace Refuge Office Building New building will replace two buildings (10032844 and 1003287) and meet all safety regulations and codes and create a more energy efficient building.
Port Louisa NWR IA Replace Headquarters Building
Iroquois NWR NY Rehabilitate Visitor Contact Building Rehabilitate visitor restrooms to meet accessibility.
Blackbeard Island NWR GA Replace bathhouse and public restroom facility
Don Edwards San Francisco Bay NWR
CA Rehabilitate restrooms at Environmental Education Center
Rehabilitate one men's and one women's restrooms within the Environmental Education Center of the Don Edwards San Francisco Bay NWR in order to bring them up to standards for ADA accessibility. Project Need/Benefit: Bringing the Education Center in compliance with ADA standards will ensure that the refuge extends the opportunities it provides to all members of the public.
Moosehorn NWR ME Replace Office and include Energy Efficiency Phase I (cc)
Replacement should include the addition of accessible (ABA) restrooms,
Muleshoe NWR TX Replace deficient Butler storage building/carpenter shop/wood shop
The project will improve employee safety and accessibility by providing additional work space and cabinet storage for tools in the storage/carpenter shop.
Noxubee NWR MS Rehabilitate Building Rehabilitate building and bring up to date meeting all building codes, life safety codes and ADA requirements
163
Policy Memos
Equal Employment Opportunity and Non-Discrimination Policy Memo
Zero Tolerance Harassment Policy Memo
Annual Collection of Ethnicity, Race, and Disability Data Memo
Reasonable Accommodation Policy for Scheduled Events Memo
Award Nominations for the Fiscal Year 2015 U.S. Fish and Wildlife Service Diversity Champion Memo
Mandatory EEO and Diversity Training for Managers, Supervisors, and Employees for FY 2016 Memo
Anti-Harassment Policy and Procedures
United States Department of the Interior FISH AND WILDLIFE SERVICE
Washington, D.C. 20240
NOV 20 2011 In Reply Refer To: FWS/ODIWM/049937
Memorandum
To: All FWS Employees
From: Director
Subject: Equal Employment Opportunity and Non-Discrimination Policy
It is the policy of the U.S. Fish and Wildlife Service (Service) to provide equal opportunity to all employees and applicants for employment regardless of race, color, national origin, religion, sex (including pregnancy and gender identity), disability, age (40 years or older), reprisal, or protected genetic information. Moreover, consistent with Presidential Executive Orders and other laws designed to protect federal employees, the Service must vigilantly prevent discrimination based on sexual orientation, parental status, military service, or any other non-merit factor. These commitments must be exemplified in all of our management practices and decisions including recruitment and hiring practices, appraisal systems, promotions, and training and career development programs.
The Service must strive to create and foster an inclusive work environment, one that affords all employees the opportunity to attain their personal goals, to grow within the Service, and to fully contribute to the accomplishment of our vital mission. All Service employees have a responsibility to carry out this policy and to promote it through exemplary conduct, stewardship, and professionalism with other Service employees, conservation partners, and the public. Managers and supervisors will be held responsible and accountable for promoting and ensuring equal opportunity in the Service’s policies, programs and practices. This is essential to attracting, developing and retaining the most qualified workforce to carry out the Service's mission.
The Service does not tolerate discrimination, harassment or reprisal in the workplace. Allegations of discrimination will be addressed promptly and professionally. Timely compliance with decisions issued on discrimination complaints is mandatory. Appropriate disciplinary action will be taken when a decision is issued confirming allegations of discrimination, harassment, or reprisal.

Employees who believe that they have been the subject of unlawful discrimination must initiate contact with their Regional Diversity and Civil Rights Office or the Office of Diversity and Inclusive Workforce Management in Washington, D.C. within 45 calendar days of the alleged discriminatory event, or in case of a personnel action, within 45 days of the effective date of the action.
This Policy and the Department of the Interior’s policy on Equal Opportunity and Zero Tolerance of Discrimination and Harassment shall be posted on the Service’s internal website, in all Human Resources and Diversity and Civil Rights Offices, in common areas such as break rooms, and on official bulletin boards. Inquiries concerning either this policy or specific situations relevant to this policy should be directed to the Office of Diversity and Inclusive Workforce Management, in Washington, D.C. at (703) 358-1724.

United States Department of the Interior FISH AND WILDLIFE SERVICE
Washington, D.C. 20240
In Reply Refer To: Nov 23 2011 FWS/ODIWM/049942
Memorandum
To: All FWS Employees
From: Director
Subject: Zero Tolerance Harassment Policy
It is the policy of the U.S. Fish and Wildlife Service (Service) to provide employees with a work environment that is free from harassment. The Service prohibits harassment on the basis of race, color, national origin, religion, sex (whether or not of a sexual nature including pregnancy and gender identity), disability, age (40 years or older), reprisal, protected genetic information, or sexual orientation.
Workplace harassment is any form of unwelcome, pervasive, persistent, unsolicited verbal, non-verbal, or physical conduct that is so objectively offensive that it alters the victim’s terms and conditions of employment, either by culminating in a tangible employment action or by being sufficiently severe or pervasive as to unreasonably interfere with an employee’s work performance by creating an intimidating, abusive, offensive, and hostile work environment. The use of derogatory words, phrases, epithets, gestures, pictures, drawings, or cartoons can create an intimidating and hostile work environment and will not be tolerated in the workplace regardless of the means of delivery to include, but not limited to, verbal communication, electronic mail, text messaging, or any other form of written or electronic communication.
Just as we strive to accomplish our mission, we must also strive to maintain the trust and confidence of our employees, conservation partners, and the public. Harassment adversely affects morale, teamwork, and productivity and is strictly prohibited.
Employees are strongly encouraged to report incidents of harassment to their immediate supervisor (allegations involving an immediate supervisor should be reported to a higher level management official). Employees may also contact their servicing Human Resources (HR) Office or Diversity and Civil Rights (DCR) Office, or the Washington D.C. Office of Diversity and Inclusive Workforce Management (ODIWM). Supervisors and managers will take immediate action to conduct an internal inquiry and resolve

reports of harassment. If evidence confirms allegations of harassment, the supervisor will take appropriate corrective and disciplinary action. Any employee found to have participated in harassment of any kind will be subject to appropriate administrative or disciplinary action, which may include removal from federal service. Disciplinary action will also be taken against supervisors who do not carry out their responsibilities under this policy. Any action taken to address and resolve issues of harassment will be confidential and retaliatory action against an employee who raises a claim of harassment of any kind will not be tolerated.
The Service’s internal inquiry is a management responsibility and is not part of the Equal Employment Opportunity (EEO) complaint process. Any employee who desires to initiate an EEO Complaint alleging harassment must contact their Regional DCR office or the Washington, D.C. ODWIM within 45 calendar days of the date of the alleged harassment. The Service’s inquiry does not have an impact on the EEO time requirement. Therefore, employees may not wait until after an internal inquiry is conducted if they desire to enter into the EEO process.
If you have any questions or require additional information on the Service’s policy regarding Harassment and Zero Tolerance, contact your servicing DCR or HR Office, or the Washington, D.C. ODWIM at (703) 358-1724.

United States Department of the Interior FISH AND WILDLIFE SERVICE
Washington, D.C. 20240
In Reply Refer To: SEP 20 2013 FWS/ODIWM/055675 Memorandum
To: All U.S. Fish and Wildlife Service Employees
From: Deputy Director
Subject: Annual Collection of Ethnicity, Race, and Disability Data
The U.S. Fish and Wildlife Service (Service) is committed to being a model employer for the employment of a diverse workforce and reports annually on its progress toward achieving this objective. To help the Service succeed in this effort, your help is requested to ensure that the statistical data used for reporting is accurate in tracking our progress and ask that you verify and update your ethnicity, race, and disability data in the Federal Personnel and Payroll System (FPPS). This voluntary activity can be accomplished by using the Office of Personnel Management (OPM) Employee Express website. Your ethnicity, race, and disability data is protected under the Privacy Act and is collected for statistical purposes only and in no way affects payroll or personnel decisions. Please rest assured that this information will remain confidential and will not be shared with third parties to include managers and supervisors. Please make updates by October 18, 2013.
To update your ethnicity, race, and disability status follow these steps:
1) Log onto the OPM Employee Express website at https://www.employeeexpress.gov
2) Select the topics “Ethnicity and Race Indicator” and “Disability Update”
3) Input and/or update the appropriate data
Please note that you can use OPM's Self-Identification form as a guide to help you with entering information in the "Disability Update" section of Employee Express. See http://www.opm.gov/Forms/pdf_fill/sf256.pdf for more information.
If you have any questions or comments concerning this matter, please contact your servicing Human Resources Office of Diversity and Civil Rights Office. Contact Employee Express at 1-888-353-9450 if you need help with your user name or password.
United States Department of the Interior FISH AND WILDLIFE SERVICE
Washington, D.C. 20240
In Reply Refer To: Nov 20 2014 FWS/ODIWM/058879 Memorandum To: All U.S. Fish and Wildlife Service Employees From: Acting Director Subject: Reasonable Accommodation Policy for Scheduled Events The U.S. Fish and Wildlife Service (Service) is committed to ensuring its programs, facilities, and activities are accessible to all individuals, including persons with disabilities. Headquarters (HQ) and Regional Offices (RO) are required to have a primary point of contact to ensure that Service sponsored activities, events, and electronic information technology meet the required accessibility standards. All event sponsors or coordinators are responsible for working with their HQ or RO point of contact to ensure that events are accessible to all Service employees. When announcing an event or meeting it is required that all Service sponsored activities include an accessibility statement explaining how individuals with disabilities may request an accommodation or program modification. The following statement is required for inclusion in all HQ and RO event announcements, electronic and hard copy fliers: "The U.S. Fish and Wildlife Service is committed to providing access to this meeting (or event) for all participants. Please direct all requests for sign language interpreting services, close captioning, or other accommodation needs to [name, phone, e-mail], TTY 800-877-8339 with your request by close of business (deadline)." Please note that sign language interpreters should be requested at least five business days in advance of the event. Interpreters must be provided for Service sponsored events that are open to all employees or the public and for all events at which the Director or Deputy Directors are scheduled to speak. Furthermore, event coordinators should not wait for requests from employees when it is known that employees with hearing impairments are expected to be present. Service events include, but are not limited to: Service sponsored events on and outside of Service property; management or employee sponsored meetings and briefings; special emphasis observances; announcements of reports or major initiatives; conferences; training programs; and office social functions such as retirement celebrations and holiday parties. If you have any questions or need more information, please contact Ms. Julia Bumbaca, the Service’s Diversity Program Manager, at 703-358-2349 (Voice), TTY 800-877-8339 or Julia_ [email protected].

United States Department of the Interior FISH AND WILDLIFE SERVICE
Washington, D.C. 20240
In Reply Refer To: FWS/ODIWM/061095
Memorandum /signed September 1, 2015
To: Service Directorate
From: Deputy Director
Subject: Award Nominations for the Fiscal Year 2015 U.S. Fish and Wildlife Service Diversity Champion(Response due November 20, 2015)
The U.S. Fish and Wildlife Service (Service) takes great pride in honoring employees who excel or distinguish themselves in helping the Service to attain and sustain a high-performing inclusive workforcethat embraces diversity and empowers all employees to achieve their full potential. It is now time todetermine your nominations for the Service’s Champion of Diversity for Fiscal Year (FY) 15. The Service will hold its FY15 Diversity Champions Award ceremony in early 2016.
Each Region and Headquarters program can submit one nomination for each of three categories below.In selecting your nominees for this award, please consider the following categories and criteria when reviewing your Champions of Diversity.
There are three categories of Champion of Diversity awards: • Leadership (for supervisors and managers up to and including the GS-15 level) • Individual (for employees other than supervisors or managers) • Group (for teams or groups participating on particular projects)
Criteria for all nominees: • Demonstrates outstanding performance on initiatives that support diversity and inclusion in the
Service • Demonstrates outstanding performance in addressing low participation rates of women,
minorities, and individuals with targeted disabilities • Demonstrates outstanding performance in managing and implementing the Service’s
2015-2019 Diversity and Inclusion Implementation Plan • Demonstrates outstanding leadership/support for the Director’s Diversity Objectives for FY 15
Nomination packages must include: • Award Nomination Form (Form 3-2324), approved by supervising Directorate member • A summary of the individual’s current position in the Service • An electronic photograph (.jpg) of the nominee that may be used during the award presentation
All submissions received will be reviewed by the Service’s Executive Diversity Committee for final consideration. Please direct questions and submit all nomination packages electronically by November 20, 2015, to Ms. Julia Bumbaca, at [email protected] (703-358-2674).
Attachments

U.S. Fish and Wildlife Service’s Champion of Diversity Award
The annual Champion of Diversity and Inclusion Award is given to an employee or a group of employees in each one of the following categories for their exceptional contributions in promoting and creating a diverse and inclusive workforce: • Leadership Award (for supervisors and managers up to and including the GS 15 level), • Group Award, and • Individual Award (for employees who are not supervisors or managers).
The award criteria are: • Demonstrated outstanding leadership in promoting diversity and inclusion goals; • Demonstrated outstanding innovation in design and implementation of diversity
programs; • Demonstrated tangible results related to recruitment, mentoring, funding, or program
implementation; and • Demonstrated outstanding performance in cultivating and promoting diversity initiatives
that have lead or are leading to the creation of a more inclusive and equitable work environment.
Award Responsibilities
The Director ensures that there is a program and policy in place to recognize diversity and inclusion achievements.
Directorate members are responsible for (1) nominating and approving candidates for diversity awards from their respective Region or Program in each of the award categories, (2) notifying the Regional or HQ Human Resources and Diversity and Civil Rights Offices about each nomination, and (3) sending nominations to the ODIWM for processing.
The Chief of ODIWM (1) manages and implements the Service's Diversity and Inclusion Award program, (2) assists Directorate members with nominations, (3) ensures nominations are approved by the appropriate Directorate member, and (4) reviews each nomination to ensure there is sufficient information to support the award nomination.
The Regional and Headquarters Diversity and Civil Rights Chiefs (DCRs and Chief of ODIWM) (1) assist Directorate members with award nominations, and (2) provide, as requested, additional information to ODIWM on award nominees.
Division Chiefs, Assistant Regional Directors, supervisors, hiring officials, and employees may nominate employees for awards through the appropriate chain of command within each Region and Program for review and approval by the supervising Directorate member.
Award Process
• Nominations for the award must be for accomplishments achieved during the preceding fiscal year (October 1 to September 30).
• ODIWM must receive the fiscal year 2015 nominations by Friday, November 20, 2015. • An employee or a manager may recommend someone for this award by completing the
“Champion of Diversity and Inclusion Award Nomination Form” (FWS Form 3-2324) and sending it through his/her chain of command for approval by the supervising Directorate member.
• After the supervising Directorate member approves it, the nomination(s) should be sent to ODIWM accompanied by a cover letter that the Directorate member signs.
• ODIWM will review all justifications for nominees and, as warranted, gather additional information from the Regional Diversity and Civil Rights Chief or other appropriate personnel to supplement the justifications.
• All award nominations, except those for an SES/SL employee, will be given to a panel consisting of the Chief of ODIWM and members of the Executive Diversity Council. These panel members review and select one nominee for each category.
• The panel sends the selections, justification packages, and its recommendations to the Director, who makes the final decision on the award recipients in each category.
• Although the Service’s Champion for Diversity Award is limited to those at or below a GS-15 level, Senior Executive Service/Senior Level (SES/SL) employees may be nominated for a DOI diversity and inclusion award. Nominations for these may be sent to ODIWM for review. ODIWM will forward these nominations to the Division of Human Resources which will send them to the Director for concurrence before they are sent to the Department of the Interior’s Executive Resource Board for consideration and approval.
Champions of Diversity Award Presentation
• Each recipient of the Service’s Champion of Diversity Award will receive a certificate, appropriate for framing, signed by the Director.
• The Service will hold its FY 2015 Diversity Champions Award ceremony in early 2016, to be announced Servicewide at least 30 days ahead of event.

DEPARTMENT OF THE INTERIOR
U.S. FISH AND WILDLIFE SERVICE “CHAMPIONS OF DIVERSITY” AWARD NOMINATION FORM
NAME TITLE OF POSITION/GRADE
ORGANIZATION/PROGRAM OFFICE UNIT LOCATION (City & State)
DESCRIPTION OF ACHIEVEMENT AND PERIOD COVERED (Continue on a separate sheet, if necessary)
N O M I N A T I O N R E C O M M E N D E D
ORIGINATOR DATE CHIEF, DCR DATE
REGIONAL/HEADQUARTERS DIRECTORATE MEMBER DATE DIRECTOR DATE
US FWS Form 3-2324
Rev 08/11
United States Department of the Interior FISH AND WILDLIFE SERVICE
Washington, D.C. 20240
In Reply Refer To: FWS/ODIWM/061640 s/ OCT 30, 2015 Memorandum To: Service Directorate From: Deputy Director Subject: Mandatory Equal Employment Opportunity and Diversity Training for Managers,
Supervisors, and Employees for FY 2016 The U.S. Fish and Wildlife Service (Service) is committed to achieving and fostering an inclusive and diverse workforce as well as a workplace that is free of discrimination, harassment, or reprisal. The Service is requiring that all employees complete annual training in equal employment opportunity (EEO) and workforce diversity. Managers and supervisors will complete a minimum of eight hours of training on an annual basis: four hours related to EEO and four hours related to workforce diversity or inclusion. As part of the EEO training this year, managers and supervisors should focus their training to include one hour each of the following topics in meeting their EEO portion of the requirement: No FEAR, reasonable accommodations, reprisal, and anti-harassment. Completion of this training is included in the performance plans for all managers and supervisors. In addition, all non-supervisory employees will complete a minimum of two hours of EEO training and two hours of diversity/inclusion training this year. Employees are expected to complete the training during duty time. In creating a continuous learning environment that will strengthen our leadership, mandatory training will focus on topics deemed essential in developing our future workforce. Essential topics should include subjects such as cultural competency, engaging a multicultural workforce, leveraging differences, and other topics that will help foster an inclusive workforce. Training may be completed through various media, including classroom, online, audio or video conference, satellite broadcast, and webinar. Videos and DVDs may be only be used to complement facilitated training. However, managers and supervisors should consult with their Regional Diversity and Civil Rights (DCR) Office to confirm that outside training courses meet the requirement of workplace- and employment-related practices. Other questions concerning whether a certain training course would fulfill requirements of EEO or diversity training should also be directed to your Regional DCR Office. All Service employees, permanent and temporary, are requested to complete Fiscal Year 2016 annual training no later than October 1, 2016. Regional DCR offices will regularly assess the completion rate of diversity/EEO training, providing a status report to the Service's Office of

Diversity and Inclusive Workforce Management no later than the 30th day of the month following the end of the second, third, and fourth quarters. The first report is due to the Office of Diversity and Inclusive Workforce Management by April 30, 2016. If you have any questions concerning EEO and Diversity training, please contact Ms. Inez Uhl, the Service's EEO Officer at 703-358-2396.


FISH AND WILDLIFE SERVICE EQUAL OPPORTUNITY
Equal Opportunity Part 060 Equal Opportunity Program Chapter 7 Anti-Harassment Policy and Procedures 060 FW 7
EQUAL OPPORTUNITY
7.1 What is the purpose of this chapter? This chapter: A. Establishes the U.S. Fish and Wildlife Service’s (Service) policy and procedures for responding to harassment in the workplace, and B. Describes: (1) The statutory prohibitions against harassment, (2) The procedures and remedies the Service provides for addressing harassment, and (3) What an individual must do and where they go to get help if they believe they have been harassed. 7.2 What are the goal and objectives of the policy? A. The goal of the policy is to prevent and correct conduct that is, or has the potential to become, so severe or pervasive that it may constitute a violation of the law, B. The objectives of our policy are to: (1) Provide a clear process for employees to report harassment; (2) Describe what a manager or supervisor must do when they receive an allegation of harassment or witness harassment of an employee; (3) Define conduct that violates Service policy and outline the procedures for addressing it; (4) Ensure that appropriate officials are notified and have the opportunity to promptly correct hostile or abusive conduct; and (5) Establish a process that is:
(a) Distinct and does not exist for the same purpose as the Equal Employment Opportunity (EEO) complaint process, and (b) Intended for management to take immediate and appropriate corrective action to eradicate harassment, regardless of whether the harassment rises to the level of violating the law (i.e., even if it is simply inappropriate).
7.3 What is the Service’s policy regarding harassment and reprisal? The Service: A. Strives to create and maintain a work environment in which people are treated with dignity, decency, and respect, and are free from harassment. Our workplace should be characterized by mutual trust and the absence of intimidation, oppression, and exploitation. B. Does not tolerate the use of derogatory words, phrases, epithets, gestures, pictures, drawings, or cartoons that target race, color, religion, age (40 years or older), disability (physical or mental), national origin, sex, sexual orientation, or genetic information, regardless of the means of delivery (i.e., verbal or electronic communication). C. Does not tolerate retaliation against any employee for reporting matters under this policy, or for assisting in a management inquiry related to such a report.

D. Takes appropriate corrective and disciplinary action when a record of a management inquiry supports a finding that harassment has occurred, or when a manager or supervisor fails to follow the procedures in this policy. 7.4 What are the authorities for this chapter? See 060 FW 1 for a list of all the authorities relevant to the chapters in Part 060. In addition to those authorities, the following are specifically relevant to our anti-harassment policy: A. Agency Administrative Grievance System (5 CFR 771). B. 370 DM 771, Administrative Grievance Procedures. C. Notification and Federal Employee Antidiscrimination and Retaliation Act of 2002, as amended (P.L. 107-174). D. Equal Employment Opportunity Commission (EEOC) Enforcement Guidance: Vicarious Employer Liability for Unlawful Harassment by Supervisors, Notice 915.002, June 18, 1999. E. 370 DM 752, Discipline and Adverse Actions. 7.5. What terms do you need to know to understand this chapter? A. Employment actions are decisions that significantly change an employee’s employment status. Such actions include, but are not limited to, hiring, firing, promoting, demoting, and reassigning an employee. B. Reprisal or retaliation occurs when employees are treated differently because they are, or were, involved in reporting harassment or a protected EEO activity. Examples include providing testimony in a harassment or EEO investigation, filing a complaint, or speaking out against activities that are discriminatory or involve harassment. C. Unlawful harassment includes unwelcome intimidation, ridicule, insults, comments, or verbal or physical conduct that is based on race, color, religion, age (40 years or older), disability (physical or mental), national origin, reprisal, sex (whether or not of a sexual nature), sexual orientation, or genetic information when: (1) Submission to such conduct is made either explicitly or implicitly a term or condition of an individual’s employment; (2) A manager/supervisor makes an employee’s submission to or rejection of such conduct the basis for employment decisions affecting the employee; or (3) The conduct is intended to or actually has the effect of unreasonably interfering with an individual’s work performance or creates an intimidating, hostile, or offensive work environment. D. Workplace harassment is any form of unwelcome, pervasive, persistent, and unsolicited verbal, non-verbal, written, or physical conduct that is so objectively offensive that it alters the victim’s terms and conditions of employment. This happens by either culminating in a tangible employment action or by being sufficiently severe or pervasive as to unreasonably interfere with an employee’s work performance by creating an intimidating, abusive, offensive, or hostile work environment. 7.6 Who is responsible for implementing the anti-harassment policy? See Table 7-1. Table 7-1: Responsibilities for the Anti-Harassment Policy
This official… Is responsible for…

FISH AND WILDLIFE SERVICE EQUAL OPPORTUNITY
Equal Opportunity Part 060 Equal Opportunity Program Chapter 7 Anti-Harassment Policy and Procedures 060 FW 7
EQUAL OPPORTUNITY
Table 7-1: Responsibilities for the Anti-Harassment Policy
This official… Is responsible for… A. The Director (1) Providing overall direction for the Service’s anti-
harassment program, and (2) Ensuring Directorate members implement this policy Servicewide.
B. Directorate members (1) Ensuring employees are informed of the Service’s anti-harassment policy and procedures,
(2) Promoting management and employee efforts to eliminate harassment,
(3) Ensuring appropriate actions are taken to enforce the anti-harassment policy and procedures,
(4) Appropriately evaluating subordinate supervisors and managers on their performance under this policy, and (5) Displaying or making readily available copies of relevant policies and procedures.
C. Deputy Regional Directors/Deputy Assistant Directors/Deputy Chiefs (DRD/DAD/DC)
(1) Overseeing the process to address claims by ensuring the requirements for inquiries, reports, and any necessary employment actions comply with this policy; and (2) Preparing a summary of the Report of Management Inquiry (RMI) into allegations of harassment in consultation with the servicing Human Resources Office (HRO) as described in this policy.
D. Supervisors and Managers
(1) Receiving allegations of harassment; (2) Ensuring that employees know the specific procedures for dealing with harassment and providing training on those procedures;
(3) Acting promptly and appropriately to prevent harassment in the workplace and preventing retaliation against those who report it;
(4) Handling allegations of harassment promptly, thoroughly, and appropriately, in accordance with the procedures in this chapter; (5) Informing the alleged victim of his or her options and rights for addressing the alleged harassment, including his or her right to consult the Office of Diversity and Inclusive Workforce Management (ODIWM) or a Regional Diversity and Civil Rights Office (DCR) about harassment involving any allegations of unlawful discrimination; (6) Consulting with the servicing HRO and taking prompt and
Table 7-1: Responsibilities for the Anti-Harassment Policy
This official… Is responsible for… appropriate corrective and disciplinary action, as necessary; and (7) Documenting all efforts to address harassment allegations.
E. Chief, Headquarters Division of Human Resources (HQ HRO)
(1) In collaboration with ODIWM, establishing and updating policies, procedures, and guidelines to administer the Service’s anti-harassment program; (2) Providing oversight, technical assistance, and support to all management officials/supervisors, employees, and Regional HROs to ensure compliance with this policy; (3) Receiving reports alleging violations of the Service’s policy and taking appropriate action as we describe in this chapter; (4) Informing the alleged victim of his or her options and rights for addressing the alleged harassment, including his or her right to consult ODIWM or DCR about harassment involving allegations of unlawful discrimination; (5) When there is a conflict of interest, such as an allegation against a Directorate member, referring allegations to the Deputy Director to assign another program or Region to conduct a management inquiry; (6) Consulting with the DRD/DAD/DC on preparing a summary of the RMI into allegations of harassment and notifying the appropriate management official as described in this policy; (7) Maintaining a written record of harassment reports and actions taken at HQ; (8) Reporting quarterly on alleged harassment, findings, and actions taken at HQ to the Chief, ODIWM; and (9) As appropriate, developing, conducting, and coordinating training with ODIWM and the National Conservation Training Center (NCTC) on harassment in the workplace.

FISH AND WILDLIFE SERVICE EQUAL OPPORTUNITY
Equal Opportunity Part 060 Equal Opportunity Program Chapter 7 Anti-Harassment Policy and Procedures 060 FW 7
EQUAL OPPORTUNITY
Table 7-1: Responsibilities for the Anti-Harassment Policy
This official… Is responsible for… F. Chief, ODIWM (1) In collaboration with the HQ HRO, establishing and updating
policies, procedures, and guidelines to administer the Service’s anti-harassment program, and disseminating them annually;
(2) Providing support and technical assistance on this policy and procedures, as requested, to ensure compliance, including explaining the differences between this policy and the EEO complaints process. (ODIWM staff should refer the alleged victim to the servicing HRO without getting into details about specific incidents). (3) Informing the alleged victim, as appropriate, of his or her options and rights for addressing the alleged harassment, including his or her right to consult an EEO counselor about harassment involving any allegations of unlawful discrimination; (4) Within 2 business days of receipt, referring reports alleging violations of the Service’s policy to the appropriate servicing HRO. The report must include the alleged victim’s name and contact information; (5) As appropriate, developing, conducting, and coordinating training with the HQ HRO and NCTC on harassment in the workplace; and (6) Collecting information quarterly on all alleged harassment, findings, and actions taken, and analyzing this information for compliance with this policy.
G. Regional Human Resources Offices (HRO)
(1) Providing technical assistance and support to management officials, supervisors, and employees in the Region to ensure compliance with this policy; (2) Receiving reports alleging violations of the Service’s policy, and taking appropriate action as we describe in this chapter; (3) Informing the alleged victim of his or her options for addressing the alleged harassment, including his or her right to consult ODIWM or DCR about harassment involving any allegations of unlawful discrimination; (4) When there is a conflict of interest, referring allegations of harassment to the HQ HRO; (5) Consulting with the DRD/DAD/DC on preparing a written summary of the RMI into allegations of harassment and notifying the appropriate management official as described in this policy; (6) Maintaining a written record of harassment reports and actions taken in the Region in accordance with this policy;

Table 7-1: Responsibilities for the Anti-Harassment Policy
This official… Is responsible for… (7) Reporting quarterly to the DCR on alleged harassment, findings, and actions taken in the Region; and (8) As appropriate, developing, conducting, and coordinating training with DCR on harassment in the workplace.
H. Regional Diversity and Civil Rights Office (DCR)
(1) Providing support and technical assistance on this policy and procedures, as requested, to ensure compliance, including explaining the differences between this policy and procedures and the EEO complaints process. (DCR staff should refer the alleged victim to the servicing HRO without getting into details about specific incidents); (2) Upon receiving an allegation of harassment, informing the alleged victim, as appropriate, of his or her options and rights for addressing the alleged harassment, including his or her right to consult an EEO counselor about harassment involving any allegations of unlawful discrimination; (3) Within 2 business days of receipt, referring reports alleging violations of the Service’s policy to the servicing HRO. Reports must include the alleged victim’s name and contact information; (4) As appropriate, developing, conducting, and coordinating training with the servicing HRO on harassment in the workplace; and (5) Collecting information quarterly on alleged harassment, findings, and actions taken in the Region, and providing it to ODIWM.
I. Employees and other people who are performing work on behalf of the Service
(1) Acting professionally and refraining from engaging in harassment; (2) Understanding the provisions of these procedures, complying with all procedural requirements, and cooperating with any inquiry; (3) Participating in periodic training; and (4) Promptly taking actions regarding incidents of harassment that are experienced or witnessed as this chapter requires.
7.7 What are the procedures for addressing harassment claims? We’ve organized the procedures into the four basic steps shown in sections A through D below—reporting harassment, responding to allegations of harassment, conducting an inquiry, and taking action(s) after the inquiry is complete. A. Reporting harassment: Individuals must take the following actions to avoid harm from unlawful harassment: (1) When appropriate, promptly and professionally inform the offender that his or her behavior is unwelcome and must stop.

FISH AND WILDLIFE SERVICE EQUAL OPPORTUNITY
Equal Opportunity Part 060 Equal Opportunity Program Chapter 7 Anti-Harassment Policy and Procedures 060 FW 7
EQUAL OPPORTUNITY
(2) Individuals who believe they have been harassed, or have witnessed conduct that is in violation of our policy should immediately report the behavior either verbally or in writing to:
(a) A supervisor or management official, (b) An employee in the servicing HRO, or (c) ODIWM or DCR.
(3) Non-employees, such as volunteers and visitors, should immediately notify a Service supervisor. (4) Contractors should contact their employer immediately. They should also inform a Service supervisor or an employee in the servicing HRO. (5) To the greatest extent possible, we will protect the confidentiality of the individual who reports harassment, except as necessary to conduct an appropriate inquiry of the alleged violation(s). We are committed to ensuring that allegations of harassment are shared only with those who have a business need to know. B. Responding to allegations of harassment: (1) When a manager or supervisor receives an allegation of harassment directly from an individual, is a witness to harassment, or is informed about an allegation of harassment, he/she must:
(a) Within 2 business days, report the allegation to the servicing HRO. Failure to report the allegation could result in disciplinary or adverse action against the manager or supervisor for not adhering to policy. (b) Assure the employee who reports alleged harassment that the Service will: (i) Conduct a prompt, thorough, and impartial inquiry; (ii) Protect his/her confidentiality to the extent possible; and
(iii) Take immediate and appropriate corrective action when it has been determined that harassment has occurred.
(c) If the person who was allegedly harassed requests anonymity, the manager/supervisor must still perform the duties we describe in this policy by taking prompt action to prevent and correct any harassment. The manager/supervisor must make clear to the alleged victim that:
(i) All reports of alleged hostile or abusive conduct and related information will be maintained on a confidential basis to the greatest extent possible. The identity of the employee alleging violations of this policy will be kept confidential except as necessary to conduct an appropriate investigation into the alleged violation or when otherwise required by law; and (ii) Information about the allegation of harassment will be shared only with those who have a business need to know about it.
(d) When an allegation of harassment occurs in a manager’s or supervisor’s area of responsibility, he/she should take measures to immediately stop any inappropriate conduct and prevent further harassment or retaliation while an inquiry is being conducted. An example of such a measure would be to change work schedules to avoid contact between the parties or temporarily transfer the alleged harasser. The alleged victim should not be involuntarily transferred or otherwise burdened, since such measures could be considered unlawful retaliation.

(e) The manager or supervisor to whom the incident is reported must always inform the individual of his/her right to: (i) Seek counseling from the servicing DCR office or ODIWM in HQ within 45 calendar
days from the date of the alleged harassment if the basis for the harassment is covered under EEO laws or statutes;
(ii) File a grievance in accordance with the terms of his/her formal bargaining contract, if applicable, or pursue an administrative grievance under 370 DM 771; or
(iii) Seek relief through any other statutory process (see section 7.9).
(f) Take appropriate corrective action in consultation with the servicing HRO. (2) When the servicing HRO receives an allegation of harassment:
(a) The office must inform the alleged victim of his or her options and rights for addressing the alleged harassment, including the right to consult DCR or ODIWM on harassment involving any allegations of unlawful discrimination.
(b) The office must, within 2 business days, refer a report of harassment to the appropriate DRD/DAD/DC who will oversee an inquiry into the harassment allegation. The servicing HRO also serves as an advisor for conducting a management inquiry and monitors the processing of the harassment allegations to ensure that those responsible are meeting the required timeframes.
(c) When there is a conflict of interest at the Regional level, the HRO will refer it within 2 business days to the HQ HRO. When there’s a conflict at HQ, the HQ HRO will refer it to the Deputy Director within 2 business days. (d) The DRD/DAD/DC to whom the allegation is sent must ensure that a prompt, thorough, and impartial inquiry of the allegation begins within 10 business days from the date in which the allegations were brought to his/her attention.
(3) When ODIWM or DCR receives an allegation of harassment:
(a) The staff in these offices will provide support for and technical assistance on the policy and procedures, as requested, to ensure compliance with this policy, including explaining the differences in the requirements and responsibilities between this policy and the rights and requirements under the EEO complaints process. Staff should refer the alleged victim to the servicing HRO without getting into details about specific incidents. (b) The staff in these offices, as appropriate, will advise the alleged victim of his/her options and rights for addressing the alleged harassment, including his or her right to consult about harassment involving any allegations of unlawful discrimination.
(c) The office must within 2 business days report the allegation to the servicing HRO, as appropriate, and provide them with the alleged victim’s name and contact information.
C. Conducting the inquiry: (1) An inquiry is an examination that usually involves collecting statements and, if relevant, supporting documents. (2) The inquiry must result in a record sufficient enough to: (a) Support any corrective or disciplinary action taken, or

FISH AND WILDLIFE SERVICE EQUAL OPPORTUNITY
Equal Opportunity Part 060 Equal Opportunity Program Chapter 7 Anti-Harassment Policy and Procedures 060 FW 7
EQUAL OPPORTUNITY
(b) Indicate that there is not enough evidence to support such an action. (3) The alleged harasser’s program must pay for any costs for a management inquiry. (4) The DRD/DAC/DC to whom the allegation is sent may use one of the following resources to conduct the inquiry:
(a) A supervisor, manager, or other appropriate official from either within or outside of the program area or Region; or (b) A contractor from an investigative firm.
(5) The DRD/DAC/DC to whom the allegation is sent must ensure that the individual conducting the inquiry:
(a) Does not have a conflict of interest with either the alleged victim or the alleged harasser; (b) Is trained in the skills that are required for interviewing witnesses, evaluating credibility, and gathering facts; and (c) Within 21 business days, provides him/her with a completed RMI. Also see section 7.7D(1).
(6) The person conducting the inquiry should, at a minimum, adhere to the following process:
(a) Coordinate with the manager or supervisor responsible for the inquiry and with the servicing HRO to ensure that all obligations are met; (b) Confirm the name, position, and supervisory chain of the alleged victim and the alleged harasser, and identify any potential witnesses; (c) Ask questions, as necessary, of the alleged victim, alleged harasser, and witnesses, and obtain signed statements from them; (d) Identify the alleged misconduct, including: (i) A detailed account of the specific actions/comments; (ii) The dates, times, and locations of the alleged actions/comments; and (iii) The names of any witnesses or others with knowledge of the alleged misconduct; (e) Obtain a detailed response to each allegation from the alleged harasser as well as the witnesses who can corroborate the alleged harasser’s account of events; (f) Refrain from offering his/her opinion; (g) Inform all interviewees that the individual who reported the harassment, the alleged victim, and all witnesses are protected against retaliation; and (h) Tell all interviewees to maintain confidentiality and not to discuss the inquiry with any other employees.
(7) In most cases, if the alleged harasser does not deny the accusation, there is no need to interview witnesses. Management officials should consult with the servicing HRO to determine if additional information is needed and take appropriate corrective action.

D. Taking action(s) after an inquiry is complete: (1) Once the inquiry is complete, the person conducting the inquiry must provide a completed RMI to the DRD/DAD/DC to whom the allegation was sent. The DRD/DAD/DC must review this report and, in consultation with the servicing HRO, evaluate the evidence and determine, if possible, whether the alleged actions occurred. (2) The DRD/DAD/DC, in consultation with the servicing HRO, must prepare a written summary of the documented findings in the RMI. The summary of outcomes may be brief depending on the complexity of the case. The RMI should not be shared with the alleged victim or the alleged harasser. (3) The servicing HRO shares the summary of outcomes (but not the actual RMI) with the appropriate management official, normally the first-line supervisor of the person alleged to have engaged in the harassing conduct. (4) The management official must promptly review the summary and determine the appropriate action to take. If a decision is made that disciplinary action is warranted, the full RMI may be shared with the management official.
(5) When the alleged harasser does not deny the accusation, the management official can immediately determine the appropriate corrective action in consultation with the servicing HRO. (6) When an inquiry establishes that an employee/supervisor engaged in misconduct under this policy, he or she is subject to appropriate corrective action, disciplinary or otherwise, up to and including removal. The management official makes this decision in consultation with the servicing HRO. HRO staff may also consult with the Office of the Solicitor. (7) The management official works with the servicing HRO to notify both the alleged victim and alleged harasser of the outcomes of the management inquiry. Managers should consult with the servicing HRO to determine the appropriate manner in which to communicate the results of the inquiry to the alleged victim and alleged harasser. (8) If the inquiry establishes that immediate and appropriate corrective action is warranted, the alleged harasser must receive as part of the disciplinary process the relevant sections of the RMI used in making the decision of culpability. (9) If the inquiry establishes that a manager or supervisor did not properly carry out his/her responsibilities under this policy, he or she is subject to appropriate corrective action, disciplinary or otherwise, up to and including removal. The first-line supervisor of the manager/supervisor found culpable must make this decision in consultation with the servicing HRO. . (10) Managers/supervisors involved in the process must continually assess the need for training. In most situations, we recommend conducting training regardless of the outcome of the inquiry. (11) Managers/supervisors must maintain a record of all actions they take related to harassment allegations. (12) The servicing HRO must maintain a record of all inquiries and actions taken related to allegations of harassment. 7.8 What are the reporting requirements? ODIWM will request quarterly reports from the HQ HRO and the DCRs, who will request the information from the Regional HROs. ODIWM will provide a reporting format when they send out the data call.

FISH AND WILDLIFE SERVICE EQUAL OPPORTUNITY
Equal Opportunity Part 060 Equal Opportunity Program Chapter 7 Anti-Harassment Policy and Procedures 060 FW 7
EQUAL OPPORTUNITY
7.9 Does compliance with this policy satisfy the Service’s obligation under the grievance policy, EEO complaint process, collective bargaining agreements, or other processes? A. No. Compliance with the policy and procedures in this chapter does not replace, substitute, or otherwise satisfy the separate obligation, including the time limits under an EEO complaint process, formal bargaining contracts, administrative grievance, or any other statutory process. B. Employees who want to pursue an EEO complaint alleging harassment must contact an EEO counselor no later than 45 calendar days from the day the alleged harassment occurred. For more information about filing a complaint based on a protected class, see the ODIWM public Web site, intranet site, and 061 FW 2, Pre-Complaints and Complaint Processing.
C. Employees who want to pursue an administrative grievance in accordance with 370 DM 771 should contact their servicing HRO for assistance within 15 days of the date of an incident or occurrence. Employees follow the procedures in 370 DM 771 if they have a grievance due to a concern or dissatisfaction related to their employment or a condition of employment subject to the control of management. D. Employees covered under a collective bargaining contract should refer to their agreement for instructions on filing a grievance using the negotiated grievance procedures. 7.10 How can employees get more information about the Service’s policy and procedures on harassment? If you have a question about this policy, contact HQ HRO, your Regional HRO, ODIWM, or your Regional DCR. s/ Stephen Guertin Deputy DIRECTOR Date: December 15, 2015