u3 teacher's guide - comap · 1998-09-22 · unit summary teacher’s guide 37–58 ... if you...
TRANSCRIPT
33U N I T
Landsat
Teacher’s Guide
37
Mathematics: Modeling Our World Teacher’s Guide
38
Video Support
LESSON ONE 39
Seeing from a Distance
LESSON TWO 45
Satellite Vision
LESSON THREE 49
Interpreting Size and Shape
LESSON FOUR 53
Areas
57
Unit Summary
TEACHER’S GUIDE 37–58
HANDOUTS H3.1–H3.6 155–166
*SUPPLEMENTAL
ACTIVITIES S3.1–S3.14 291–334
ASSESSMENT A3.1–A3.8 505–520
TRANSPARENCIES T3.1–T3.11 691–701
*The following Supplemental Activities are found in theTeacher’s Guide on the listed pages.S3.4 Line It Up 47S3.11 Project: Backwards Matching 52

38 VIDEO SUPPORT UNIT THREE: LANDSAT
Teacher’s Guide Mathematics: Modeling Our World
H andout H3.1 is intended for use with this video.The questions for the Video Viewing Guide are
listed below.
1. How many times has the town of Grafton,Illinois been flooded?
2. How many structures in Grafton were flooded in1993?
3. How high is Landsat 5’s orbit?
4. How do satellite photographs start?
5. Does Landsat “see” only what is visible tohuman eyes?
6. How often does Landsat circle Earth?
7. What are some physical properties of objects thatLandsat identifies?
8. How much midwestern land was flooded in1993?
9. How did Grafton solve the flooding problem?
Video Support VIDEO SUPPORT
39UNIT THREE: LANDSAT LESSON ONE
Mathematics: Modeling Our World Teacher’s Guide
PREPARATION READING
What Resources Can Be Monitored with Landsat Data?
Ideally, students should have a chance to work onActivity 1 during the first day of this unit. The best
way to allow for this is to assign the preparation read-ing prior to the first class day of the unit. A discussionof the preparation reading can then be incorporatedinto the discussion following the video, leaving agood deal of time for exploration.
An alternative is to show the video at the beginningof the class. Then have each group read only one ofthe three sections of the preparation reading andanswer its follow-up Items. A short discussion couldthen summarize the readings, allowing the final 15–20minutes for work on Activity 1.
Other possibilities are to use the preparation readingas an assignment following the first class, combiningit with Individual Work 1, or to combine the prepara-tion reading and Individual Work 1 into a single dis-cussion prior to Activity 1.
ACTIVITY 1
Deforestation in the Czech Republic
If you are using computers, the image fileCZECH85.LAN may be used with the MultiSpec®
software. The file CZECH85.PIC is a PICT file, whichmay be opened by a variety of software. MultiSpecand a number of other image processing programsare available on the Internet. See Teacher BackgroundReading 3.1 at the end of Lesson 1 (Teacher’sResources page 43) for details on installing MultiSpec.Handout H3.2 is provided to assist student work withthis software. Note, however, that due to continuingdevelopment, newer versions of the software may notfollow these notes exactly; check your version so that
you will be able to assist your students.
Use whatever software is available. Many paint pro-grams work very well with the PICT files. Some kindof dilation operation (“Scale By %,” or “Zoom,” forexample) and a coordinate system (“Rulers On,” forexample) will be useful in later lessons. If images maybe made “transparent” so that direct overlays are pos-sible, that feature will contribute much to Lesson 3.MultiSpec does not provide this option.
INDIVIDUAL WORK 1
Thinking About Distances
See Annotated Teacher’s Edition.
ACTIVITY 2
Viewing Earth from DifferentDistances
See Annotated Teacher’s Edition.
INDIVIDUAL WORK 2
Practice Your Scales
See Annotated Teacher’s Edition.
LESSON 1
Seeing from a Distance
ACTIVITY 3
Changing Scales
F or more practice in interpreting the “side-by-siderulers” view of scaling, either a calculator with
list or table features, or a computer spreadsheet isvaluable as a quick table-builder. For example, aspreadsheet (or list or function table) could listcolumns as “ruler1” and “ruler2.” Enter any linearrelation defining the second column from the first(you know the relation, students don’t), display thetable, and have students determine the scaling thatgoes from the first list to the second. Teaching stu-dents to carry out these spreadsheet or calculator-table operations is optional at this time, but will beuseful in Lesson 4. Therefore, you might wish tobegin sharing these ideas with students now.
If you plan to use spreadsheets but did not use themin Unit 2, Secret Codes and the Power of Algebra, youmay wish to refer to the teaching suggestions for Unit 2, Individual Work 8 on page 29 of the Teacher’sResources to introduce the positional notation typicalof spreadsheets.
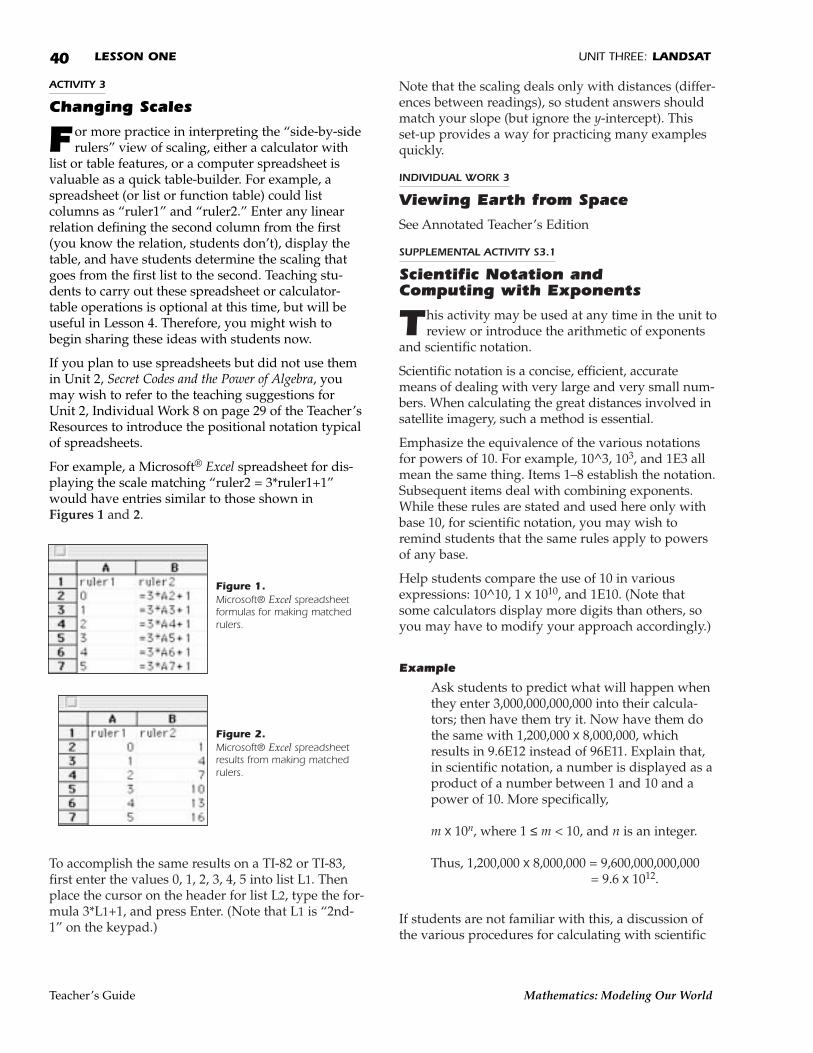
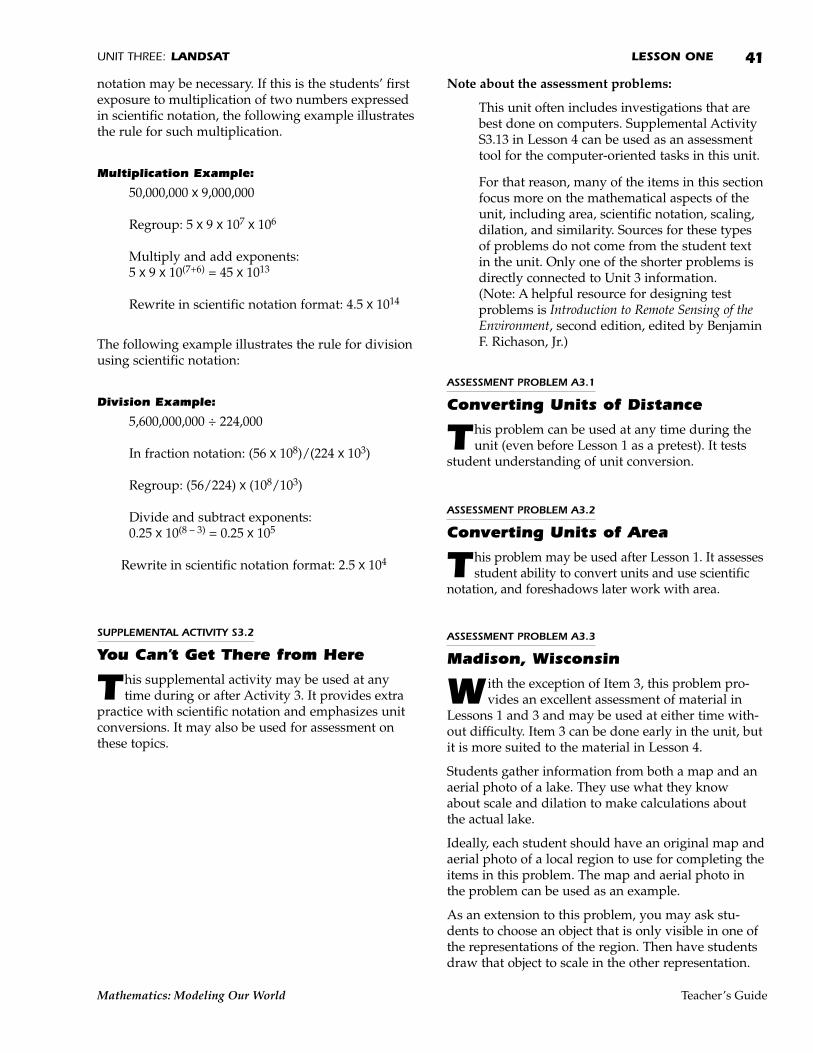
For example, a Microsoft® Excel spreadsheet for dis-playing the scale matching “ruler2 = 3*ruler1+1”would have entries similar to those shown in Figures 1 and 2.
Figure 1. Microsoft® Excel spreadsheetformulas for making matchedrulers.
Figure 2.Microsoft® Excel spreadsheetresults from making matchedrulers.
To accomplish the same results on a TI-82 or TI-83,first enter the values 0, 1, 2, 3, 4, 5 into list L1. Thenplace the cursor on the header for list L2, type the for-mula 3*L1+1, and press Enter. (Note that L1 is “2nd-1” on the keypad.)
Note that the scaling deals only with distances (differ-ences between readings), so student answers shouldmatch your slope (but ignore the y-intercept). Thisset-up provides a way for practicing many examplesquickly.
INDIVIDUAL WORK 3
Viewing Earth from Space
See Annotated Teacher’s Edition
SUPPLEMENTAL ACTIVITY S3.1
Scientific Notation and Computing with Exponents
T his activity may be used at any time in the unit toreview or introduce the arithmetic of exponents
and scientific notation.
Scientific notation is a concise, efficient, accuratemeans of dealing with very large and very small num-bers. When calculating the great distances involved insatellite imagery, such a method is essential.
Emphasize the equivalence of the various notationsfor powers of 10. For example, 10^3, 103, and 1E3 allmean the same thing. Items 1–8 establish the notation.Subsequent items deal with combining exponents.While these rules are stated and used here only withbase 10, for scientific notation, you may wish toremind students that the same rules apply to powersof any base.
Help students compare the use of 10 in variousexpressions: 10^10, 1 x 10¹⁰, and 1E10. (Note thatsome calculators display more digits than others, soyou may have to modify your approach accordingly.)
Example
Ask students to predict what will happen whenthey enter 3,000,000,000,000 into their calcula-tors; then have them try it. Now have them dothe same with 1,200,000 x 8,000,000, whichresults in 9.6E12 instead of 96E11. Explain that,in scientific notation, a number is displayed as aproduct of a number between 1 and 10 and apower of 10. More specifically,
m x 10n, where 1 ≤ m < 10, and n is an integer.
Thus, 1,200,000 x 8,000,000 = 9,600,000,000,000 = 9.6 x 10¹².
If students are not familiar with this, a discussion ofthe various procedures for calculating with scientific
40 LESSON ONE UNIT THREE: LANDSAT
Teacher’s Guide Mathematics: Modeling Our World
notation may be necessary. If this is the students’ firstexposure to multiplication of two numbers expressedin scientific notation, the following example illustratesthe rule for such multiplication.
Multiplication Example:
50,000,000 x 9,000,000
Regroup: 5 x 9 x 107 x 106
Multiply and add exponents: 5 x 9 x 10(7+6) = 45 x 1013
Rewrite in scientific notation format: 4.5 x 10¹⁴
The following example illustrates the rule for divisionusing scientific notation:
Division Example:
5,600,000,000 ÷ 224,000
In fraction notation: (56 x 108)/(224 x 103)
Regroup: (56/224) x (108/103)
Divide and subtract exponents: 0.25 x 10(8 – 3) = 0.25 x 10⁵
Rewrite in scientific notation format: 2.5 x 10⁴
SUPPLEMENTAL ACTIVITY S3.2
You Can’t Get There from Here
T his supplemental activity may be used at anytime during or after Activity 3. It provides extra
practice with scientific notation and emphasizes unitconversions. It may also be used for assessment onthese topics.
Note about the assessment problems:
This unit often includes investigations that arebest done on computers. Supplemental ActivityS3.13 in Lesson 4 can be used as an assessmenttool for the computer-oriented tasks in this unit.
For that reason, many of the items in this sectionfocus more on the mathematical aspects of theunit, including area, scientific notation, scaling,dilation, and similarity. Sources for these typesof problems do not come from the student textin the unit. Only one of the shorter problems isdirectly connected to Unit 3 information. (Note: A helpful resource for designing testproblems is Introduction to Remote Sensing of theEnvironment, second edition, edited by BenjaminF. Richason, Jr.)
ASSESSMENT PROBLEM A3.1
Converting Units of Distance
T his problem can be used at any time during theunit (even before Lesson 1 as a pretest). It tests
student understanding of unit conversion.
ASSESSMENT PROBLEM A3.2
Converting Units of Area
T his problem may be used after Lesson 1. It assessesstudent ability to convert units and use scientific
notation, and foreshadows later work with area.
ASSESSMENT PROBLEM A3.3
Madison, Wisconsin
W ith the exception of Item 3, this problem pro-vides an excellent assessment of material in
Lessons 1 and 3 and may be used at either time with-out difficulty. Item 3 can be done early in the unit, butit is more suited to the material in Lesson 4.
Students gather information from both a map and anaerial photo of a lake. They use what they knowabout scale and dilation to make calculations aboutthe actual lake.
Ideally, each student should have an original map andaerial photo of a local region to use for completing theitems in this problem. The map and aerial photo inthe problem can be used as an example.
As an extension to this problem, you may ask stu-dents to choose an object that is only visible in one ofthe representations of the region. Then have studentsdraw that object to scale in the other representation.
41UNIT THREE: LANDSAT LESSON ONE
Mathematics: Modeling Our World Teacher’s Guide
ASSESSMENT PROBLEM A3.4
The Netherlands
I tems 1, 4, 5, and 6 can be used as early as the endof Lesson 1. This entire problem may be used
either after Lesson 4 or as a pretest for Lesson 4.
Items 1, 2, 3, and 4 are closely related to activitiesdone in the lessons. The last two items ask for somereflective thinking about what was done with theoriginal map. The Dutch context can, of course, bechanged to an American one without detracting fromthe nature of the questioning.
ASSESSMENT PROBLEM A3.5
Wyoming
I tems 1–3 are appropriate for assessing work inLesson 1. Item 4 may also be used then, but it
should be considered as a challenge exercise becauseit is not directly covered until Lesson 4.
It is important to mention that students should notuse “1 mile = 1.61 km” to answer Items 3 and 4. Thatis why the Item stipulates that they use only theanswers of 1 and 2. The intent is to test understandingof the process, not knowledge of a particular formula.
42 LESSON ONE UNIT THREE: LANDSAT
Teacher’s Guide Mathematics: Modeling Our World

TEACHER BACKGROUND READING 3.1
Introduction to MultiSpec
Funded by a NASA grant, David Landgrebe, inconjunction with the Purdue Research
Foundation, developed the software programMultiSpec (© Purdue Research Foundation) to allowfor the investigation of the use of satellite imaging inan educational setting. Although originally intendedfor university use, MultiSpec has proven to be a highlymotivational educational computer program at theupper-elementary through high school level.
MultiSpec is licensed through the Purdue ResearchFoundation for educational purposes. MultiSpec isavailable on the Internet at http://dynamo.ecn.purdue.edu/~biehl/Multispec/.(Notes below and in Handout H3.2 may refer to anearlier program version than is available at publica-tion of this text.)
EOSAT, a corporation licensed by NASA, processesand distributes 32,930-km2 Landsat scenes. Becauseprocessing of scenes from data transmitted directlyfrom satellites is extremely complex, the current costis about $4400 per scene. Scenes, in the form they aredistributed, require sophisticated computer equip-ment to process further into the specific format suit-able for the work being done by the researcher. Theimages you received are 9.5-mi.-by-9.5-mi., five-bandsubsets of scenes that have been purchased for educa-tional purposes by universities or research institu-tions. Their size is dictated by 3.5” high-density floppy disk space limitations. Each image youreceived fits on one such disk. You may be able toacquire free local images from sources in your state.To do this, check with your state university and try tolocate people who are doing research with Landsatsatellite images. You should ask them for a subset of ascene in Macintosh format. They may be willing todownload the data from their workstations to MS-DOS format and from MS-DOS format to Macintoshformat.
COMPUTER REQUIREMENTS FOR USINGMULTISPEC
To use the MultiSpec computer program, you need aMacintosh computer with a hard drive, twomegabytes (2000K) of random-access memory (RAM),and a color monitor. This configuration will allow theselection of eight-bit color.
In order to use the 24-bit color option, you will need aminimum of four megabytes (4000K) of RAM.Twenty-four-bit color renders features more distin-guishable in an image display.
If your Macintosh computer has virtual memorycapability, and you feel comfortable using it, you maywant to turn it on. Virtual memory is not a require-ment.
Note: If you lack experience using a Macintosh com-puter, the authors recommend you take a few minutesto get accustomed to using a Macintosh before follow-ing the instructions below. One of the easiest methodsis to use the “Learning to Use Your Macintosh” tutorial program that came with your computer.
Once you have installed the program on your com-puter, the following instructions will help you use theimages provided on the Course 1 CD-ROM.
INSTALLING THE LANDSAT IMAGESEach Landsat image has a .LAN and a .STA version.The first is the image; the second contains the statis-tics for the display images. You need to copy bothfiles for each image into the Multispec folder on yourhard drive. Do so by dragging their icons into theMultispec folder.
43UNIT THREE: LANDSAT LESSON ONE
Mathematics: Modeling Our World Teacher’s Guide

MEMORY OPTIONSThe MultiSpec programs you received have been pre-set to use two megabytes (2000K) of RAM. This is suf-ficient for eight-bit color. If you do not have at leastfour megabytes of RAM on your Macintosh computeror you would prefer not to address memory concernsat this time, you may skip this section.
If you wish to change the amount of RAM assigned tothis program, you may follow the following steps.
•Be sure you have quit the MultiSpec program.
•If the MultiSpec folder is not open, open it nowby clicking on the arrow to the left of the words“MultiSpec folder” on the hard drive. The arrowwill point downward and reveal the contents ofthe folder. Highlight the MultiSpec applicationprogram on your hard drive by clicking
ONCE on the icon identifying the program. DONOT double-click on the application programicon to open the program at this time. You donot want the application program open for thisprocedure, just selected (highlighted).
•With the MultiSpec application program high-lighted, pull down the File menu and select GetInfo. Your screen should look like Figure 3.
•In the Memory box, where the small arrow inthe diagram points, edit the Preferred Size boxto read 4000K.
•Close the Get Info window. You are now readyto run the program.
44 LESSON ONE UNIT THREE: LANDSAT
Teacher’s Guide Mathematics: Modeling Our World
Figure 3.
45UNIT THREE: LANDSAT LESSON TWO
Mathematics: Modeling Our World Teacher’s Guide
PREPARATION READING
What Does Landsat 5 See?
See Annotated Teacher’s Edition.
ACTIVITY 4
The Road to Progress
See Annotated Teacher’s Edition.
INDIVIDUAL WORK 4
Information Highway
I tems may be given as home assignments or as classwork. A minimal assignment covering the main
ideas should include Items 2, 4(a), 5, 6, and 9(a).However, it is suggested that as many of the items bedone as possible.
If you use these items for class work, you might wishto discuss ideas from Items 1–4 first, then have stu-dents work on Items 1–8. Following a discussion ofthe decisions students made in Item 8, Item 9(a) couldbe done as a class example, either by individuals,groups, or the class as a whole, with individuals com-pleting Items 9(b–d) on their own.
See teaching suggestions below about SupplementalActivity S3.4 for an extension of Item 9.
ACTIVITY 5
What Does Landsat 5 See?
In this activity, students simulate satellite imagingby looking at small sections of a designated scene,
and selecting a gray-scale number that best representseach of 36 smaller square “pixels” in the image.Several ideas for designating images and organizinggroup work are described below. Read them all, thenchoose the one most appropriate for your class, or cre-ate your own. Also see the teaching suggestionsbelow for Supplemental Activity S3.3.
Following the scenario descriptions are ideas for awrap-up discussion.
Scenario 1: Class Collage
This activity works best if you have at least six groupsof three or four students.
Designate adjacent three-meter-square regions for stu-dent groups to digitize. Depending on your class andschool policies, this large region may be in your class-room or outside on the school property. Either you oryour students should mark these regions using tape,chalk, or string.
Each group then subdivides its square and selects ashade of gray that best represents each square half-meter of the region. They then cut that shade off theirgray-scale squares (Handout H3.5) sheet and paste itonto one of their blank grids (Handout H3.4).
Following the digitizing and decoding portions of theactivity, make a poster or bulletin-board display byarranging the decoded images in their respectivepositions, thus reconstructing the large region youoriginally designated for the class. An alternate ver-sion of the reconstruction step may be carried outusing a paint program on a computer. Build the pixelsquares in their appropriate places, one at a time,using an appropriate range of shadings.
LESSON 2
Satellite Vision
Discuss your ability to recognize the region from theclass’s rendering of it.
Scenario 2: Image Detectives
On various portions of school property, either you oreach student group marks a three-meter-squareregion to digitize, using tape, chalk, or string. Thearea selected must contain at least three different levels of reflectance, and it must also have enoughdiversity that no single shade of gray will cover morethan 50 percent of the grid.
After regions are selected, digitizing procedures are asin the “Class Collage” option, above.
When the completed grids are collected and redistrib-uted, each group should attempt to locate the regionrepresented by the grid they have received.
Scenario 3: Through the Window Panes
If it is not feasible to go outside, but you wish to usean outdoor image, another option is to designate aportion of the classroom windows for each group.Have them mark off a grid of 36 squares directly onthe window, using removable tape. Then, viewingfrom a fixed location, they may digitize the scene out-side. Students should take turns being the “viewer”and should compare their own perceptions of thegray-scale levels to those assigned by their peers.
Using this scenario it is vital that students view fromexactly the same location. One trick they can use is tohave the first observer clearly identify what is visiblein each corner of the main grid so that subsequentobservers can align the scene in the same manner.
Complete the activity as in the “Image Detectives”scenario above.
Scenario 4: Cut It Out
You may prefer to work with printed images. Thesame approaches may be applied to photographs orother printed matter as were used with actual scenes.Again, a collage of combined decoded images from asingle print is possible. A “guess my picture” contestof various images will do well also.
Discussion
Hearing or writing a number incorrectly as it isreported by a student may give you an opportunity todiscuss the concept of “noise,” an error in data trans-mission resulting from channel disturbances. In outerspace, the electromagnetic radiation from the sun fre-quently interferes with satellite transmissions, creat-ing “noisy” data.
After you have recorded all the pixel codes, discussthe difficulties inherent in digitization. Groups willhave encountered some obstacles in assigning a singlegray scale to each pixel. These obstacles will give youan opportunity to discuss the following uncertaintyfactors.
Reflectance
Students may express concern about their ability tomatch the “real view” and the gray scale appropriately.Did low lighting affect their decision?
Brightness
Students may feel uncomfortable that each element oftheir area contributes equally. An unusually-coloredor highly-reflective surface may contribute dispropor-tionately more to the gray scale selected.
Precision
How likely was each group to evaluate the sameregion at the same level of gray? Lack of precision—inability to replicate the measurement using the samealgorithm—may contribute to uncertainty.
Accuracy
How closely does the reflectance observed by the stu-dents match the actual reflectance of their areas?Students with poor visual discrimination may consis-tently pick the wrong gray scale, and some groupsmay have pasted the right gray scale in the wrongsquare on their grid, or vice-versa.
Statistics
If a group decides to use an averaging process or themedian of the reflectance, important data about indi-vidual components may be lost along the way.
Rounding
Since each group had to select from a discrete grayscale, they might have rounded up or down to find aspecific shade of gray to represent their area, intro-ducing further uncertainty.
Resolution
The size of the pixel is a significant factor in determin-ing the quality of image resolution. In a satelliteimage, where pixels are 30 meters square, objects mayoverlap pixels. Thus, on a satellite image, a bridgemay appear to be two pixels wide. Does this mean the
46 LESSON TWO UNIT THREE: LANDSAT
Teacher’s Guide Mathematics: Modeling Our World
bridge is 60 meters wide? How much error is possiblewhen one measures an object on the computer screen?What about a building with a very bright, reflectiveroof—can you tell how large the building is by count-ing pixels?
An object that is highly reflective and almost white incolor may affect the brightness of an entire pixel, eventhough the object may be small. If that small, brightobject is located on the border between two pixels, itmay affect the brightness of both pixels and appeareven larger. Conversely, an object that has very lowreflectance may not show up at all.
INDIVIDUAL WORK 5
Coding and Decoding Satellite Data
S ee the teaching suggestions below forSupplemental Activity S3.3 (on “smoothing” the
digitization process) and Supplemental Activity S3.5(on errors in digitization).
SUPPLEMENTAL ACTIVITY S3.3
Alphabet Soup
Computer with printer
T his activity is intended for use with Activity 5,either after the activity as an extension, during
the activity as a parallel development, or instead ofthe activity.
Before the days of high-resolution graphics and goodimage software, crude images were designed andprinted using ordinary keyboard characters as thepixels. You may have seen sidewalk T-shirt vendorswho took snapshots of their customers and renderedtheir likenesses onto a shirt in this manner. The fun-damental idea behind this kind of imagery is that dif-ferent letters and symbols require differing amountsof ink; some symbols look darker than others.
Assign to each student a set of a few symbols fromthe keyboard. If possible, assign all keyboard symbolswithin your class. Each student should then use atypewriter or computer to print half a page of nothingbut the assigned symbol, one symbol per half page, asmany repetitions of the symbol as will fit. For consis-tency, students should all use the same printer.
When all printing is complete, have a “contest”among all the symbols. Hold a pair of half-pages infront of the class and let students decide which of thepair is darkest. Select another half-page and deter-mine where it falls relative to the first two. Continueuntil you have a line of all the symbols according totheir apparent darkness. Number the symbols usingthis ordering; that’s the class gray-scale.
Follow procedures similar to those in Activity 5 inselecting images for the class to render. Here, however, it is probably best to select a single imagefor the entire class and use the “class collage”approach, with each student responsible for a smallsection of a fairly large image. Since most paper willaccommodate 80 columns and 60 rows comfortably,help students divide it into pixels so that the entireimage size is no more than these dimensions.
SUPPLEMENTAL ACTIVITY S3.4
Line It Up
Graph paper and gray scale
Paint program
Note: There are no student pages for this activity.
T his activity is a project intended for use afterActivity 5.
Have students rework Item 9 of Individual Work 4using the multiple-brightness scale introduced inActivity 5 instead of just the “on-off” coding initiallyused in that item. (A computer paint program, graphpaper and gray scale, or some other means of repre-senting pixels can be used.) Have students comparethe results obtained by the two methods.
Some kind of averaging of brightnesses might be usedfor pixels for which the line is not centered in someway. For example, if a line goes through the center ofa pixel, make it as dark as possible. If the line passesthrough a point halfway between the center of thepixel and the top of the pixel, make it only half asdark. Generalize this, or some other, scheme.
In general, lines might look better using varyingbrightnesses, especially if viewed from a distance.
47UNIT THREE: LANDSAT LESSON TWO
Mathematics: Modeling Our World Teacher’s Guide

SUPPLEMENTAL ACTIVITY S3.5
Is Landsat’s Vision 20-20?
T his activity may be used at any time followingActivity 5.
The student pages focus closer attention on the diffi-culties encountered in producing and interpretingdigitized image information. The activity is in twoparts: the first deals with the possibility that data maybe missing; the second part examines the possibilityof incorrectly recorded data or that the region repre-sented by a single pixel may contain a small, verybright object.
Part 1: Errors due to “missing” data
See the Solutions Manual for detailed comments onreasonable methods for dealing with this problem. Besure that “average” is one of the methods mentionedin class. However, there are no right answers here.The main point is that students realize that thenumerical storage of visual information via digitizingallows the possibility that missing information maybe approximated in reasonable ways.
Part 2: Errors due to outliers
Students should realize that digitizing causes someimage information to be lost; digitized images are“blurred” at the pixel level.
ASSESSMENT PROBLEM A3.6
North Mankato, Minnesota
U se this problem after Lesson 2. It assesses com-prehension of the discrete nature of satellite
images and understanding of the digitization processdeveloped in Lesson 2.
Students are given two representations of the sameregion. They compare the two images and translateinformation between them.
Note: Item 2 offers students the opportunity to makeand defend reasonable conjectures. (The facts neededto answer this item are not in the unit.) In particular,different kinds of objects reflect varying amounts of different kinds (frequencies) of light. So somethings that are visible to one band may not be visibleto another, as indicated by the article excerpts inLesson 1’s preparation reading.
48 LESSON TWO UNIT THREE: LANDSAT
Teacher’s Guide Mathematics: Modeling Our World

49UNIT THREE: LANDSAT LESSON THREE
Mathematics: Modeling Our World Teacher’s Guide
ACTIVITY 6
Staying in Shape
S tudent characterizations of “same shape” willvary. The Solutions Manual gives two methods
for determining whether two figures are similar. Besure students see and understand method (i). Thismethod focuses first on characterizing an image’sshape, then on comparing that shape to the shape ofanother image.
For example, students may characterize the shape of apolygon by finding the ratios of adjacent sides. If theyfind that another polygon’s adjacent sides have thesame proportions to one another, the two figures aresimilar. For numerical examples, see the SolutionsManual for items in Individual Work 6.
INDIVIDUAL WORK 6
Staying In Shape
See Annotated Teacher’s Edition.
ACTIVITY 7
Zoom with a View
I f you are confident that students’ data fromActivity 2 are reliable, students may use their data
instead of setting up the apparatus in Activity 7.
Alternately, you may wish to repeat Activity 2 withan emphasis on taking precise measurements.Encourage students to take measurements from a fewadditional distances.
If students are having difficulty, SupplementalActivity S3.7 provides students with additional guid-ance for Item 5.
INDIVIDUAL WORK 7
Zoom with a View
See Annotated Teacher’s Edition.
ACTIVITY 8
Zooming into Magnitude
Suppose some figure ABCD in the 0.5 image corre-sponds to the figure EFGH in the 1.0 image.
•Shape is preserved. So for two lengths in thescene, their ratio in the 1.0 image is the same as their ratio in the 0.5 image: .
•Since a scaling took place, the ratio of length inthe 1.0 image to the length of the same feature inthe 0.5 image also remains constant from featureto feature: .
•A dilation occurred, so the ratio of distances to center between the 1.0 and 0.5 images is constant for corresponding features: .
INDIVIDUAL WORK 8
Dilations
See Annotated Teacher’s Edition.
OE
OA= OF
OB
FG
BC= EF
AB
EF
FG= AB
BC
LESSON 3
Interpreting Size and Shape
ACTIVITY 9
The Match Game
C onstructing dilations using a variety of methodscan help students to better understand the rela-
tionship among different dilations having the samemagnitude. For example, you may encourage stu-dents to carry out Supplemental Activity S3.9 usingseveral approaches. When possible, students shouldbegin with cruder methods such as using pencil andpaper or a geometric drawing utility. Then theyshould construct dilations using a photocopier orpaint software. Encourage students to investigate thedifferences between each method of dilation.
In many programs constructions are only approxi-mate and centers cannot be specified. The differencesin what you can tell the computer from program toprogram allow students to better understand whatthey need to know to match images.
Even when students construct dilations correctly onthe computer, there can be discrepancies betweenimages. When zooming in on images, students maynotice that there is not a direct correlation betweenpixels in the pre-image and its dilation. They shouldunderstand that a computer-generated dilation is onlyan approximation of its pre-image. Since the originalimage was composed of pixels, and since not all pixels will be dilated exactly to an existing pixel loca-tion, you should expect the relative locations andsizes of adjacent pixels in the pre-image to becomesomewhat distorted when dilated. Pixels may be cre-ated or destroyed. You may encourage students toinvestigate this issue further.
NOTES ABOUT SOFTWARE:
Paint vs. Draw Programs
Paint and draw programs treat images differently.Images in paint programs are recorded as pixels.Draw programs usually work with “objects,” whichmay be points, lines, or entire figures. Encourage stu-dents to experiment with these programs by openinga new file and creating their own figures from scratchto get a feel for the difference between images createdby pixels and images created by objects.
Before you begin, make a back-up disk of all originalimages. This is a must; some students will accidentallysave over the existing files. Show students how to“Save As” in order to avoid altering an originalimage.
Become familiar with the software the class will usefor the activity. Try the activity with the softwarebefore you assign it to students.
Encourage students to experiment with the programsthey’ll be using. They should familiarize themselveswith the program’s selection tools. Selection tools typ-ically appear in the tool panel as an arrow or as a dot-ted box. Most programs allow for selection of multi-ple objects when the Shift key is held down. Checkyour software for details.
Implementing the Dilations
Some programs have a “%” tool for creating dilations,others have a “Zoom” command. Re-size, stretch,scale, enlarge, reduce, and dilate are other terms thatmay be used. Test the command on a simple object, asegment, for example, to be sure it works as it should.Be sure, also, that it can be applied to part of theimage, not just to the entire image.
Have students turn on the coordinate grid. This maybe called a coordinate system, a grid, or rulers.Students should be able to describe the exact horizon-tal and vertical location of any point. If possible, usemetric units, otherwise use inches or pixels.
There are advantages and disadvantages to workingwith two separate images. Students who work withimages on the same screen can superimpose them,whereas students who work with separate imageswill have to rely on the images’ coordinates to com-pare the images. As a result, working with two sepa-rate images may help students to gain a better under-standing of the mathematics.
Students who use the combined images will be ableto check by overlaying them, but they should bewareof the difficulties due to “pixel rounding” discussedabove.
In either case, the comparisons are easier if studentsenlarge rather than reduce images when they maketheir dilations.
Software Tips for Items 6 and 7
Many generic paint and draw programs are appropri-ate for Items 6 and 7. It is advisable for you to try thisactivity yourself before having the class begin.
After finding the basic tools, have students load theimages for this exploration. For Item 6, open the filesPRINT1.PIC and PRINT2.PIC if you wish to workwith the two images separately. Open PRINTS.PIC tohave them both on the same screen (they will be adja-cent to one another if you choose this option).
Although some geometric drawing utilities do allowimages to be pasted into them, they generally do notpermit operations on those pasted images. Direct
50 LESSON THREE UNIT THREE: LANDSAT
Teacher’s Guide Mathematics: Modeling Our World
matching is not possible; these programs are not rec-ommended for work on Item 6.
Geometric drawing utilities are excellent for use withItem 7. Most such programs have a dilation com-mand. Again, try the construction yourself beforehaving students begin. Students will need to under-stand how to construct points, lines or rays, and mea-sure distances. Usually students will have to indicatethe “center of transformation” to execute the dilationcommand.
For Item 7, have students complete the followingsteps:
1. Create one complete image and define the centerfor the dilation.
2. Construct lines from the center through the ver-tices of the original image.
3. Measure appropriate distances along these lines.
4. Add points for the dilated image.
5. When the image is complete, erase the centerand the guide lines.
INDIVIDUAL WORK 9
Coordinated Transformations
S tudents may wish to use a geometric drawingutility instead of working by hand. Either method
is acceptable.
In Item 3, students relate algebraic work on coordi-nates to the geometry of dilation and translation. Ifyour calculators permit “list” operations, have stu-dents enter the original coordinates into two lists, onefor x-coordinates and one for y-coordinates. Show stu-dents how to use list operations for one list; let stu-dents do the other list to verify their understanding.You may also choose to show students how to grapha list as a scatter plot to serve as a visual check.Similar work is possible on spreadsheets. SeeTeacher’s Resources page 40 about Activity 3 in Lesson 1 for examples of these operations.
If your class studied the optional section on matrixmultiplication in Unit 1 Pick a Winner: Decision Makingin a Democracy, here is a great place to revisit thattopic. Use matrix multiplication for the dilation, andmatrix addition for the translation. The coordinates ofn key points in the original image may be stored in a2 x n matrix C, with x’s in row 1 and y’s in row 2. Adilation centered at (0, 0) is created by the
matrix multiplication x C, where m is the
magnitude of the dilation. After dilation, do the trans-lation by adding a 2 x n matrix in which all row-1entries are the proper horizontal translation and allrow-2 entries are the vertical translation.
SUPPLEMENTAL ACTIVITY S3.6
Shadows
T his activity may be used for additional practiceor for assessment following the work on
similarity in Activity 6.
These items are based on shadows and similarity;shadows cast by sunlight and lamplight are studied.The activity discusses the use of three-dimensionalpictures, side views, and top views for calculations. Itmay help students to do some hands-on activities,using real objects and working with real sunlight andlamplight.
This set of items is also meant as a preparation forSupplemental Activity S3.10, which is more complexand directly related to the satellite imagery context. Inparticular, if you assign that project, be sure studentswork through Items 11–13 of this activity first.
SUPPLEMENTAL ACTIVITY S3.7
Zoom with a View: Alternate Version of Item 5
This is a more guided version of Item 5 in Activity 7.
SUPPLEMENTAL ACTIVITY 3.8
Zooming into Magnitude: Alternate Version
This is a more guided version of Activity 8. Item 4might be beneficial to all students.
SUPPLEMENTAL ACTIVITY S3.9
The Match Game: Alternate Versions of Items 1 and 4
This activity contains more guided versions of Items 1and 4 for Activity 9.
m 0
0 m
51UNIT THREE: LANDSAT LESSON THREE
Mathematics: Modeling Our World Teacher’s Guide
SUPPLEMENTAL ACTIVITY S3.10
Project: Shadows and Height
T his project may be used at any point after Lesson 3. Supplemental Activity S3.6 provides
additional preparation for this project for studentswho need it.
A satellite picture of a region of Mt. Everest shows alot of snow and shadows of hills. The question iswhether it is possible to determine heights, using onlythis top view. Sticks and walls are used as models formountains, allowing for discovery of some surprisingfacts about shadows.
SUPPLEMENTAL ACTIVITY S3.11
Project: Backwards Matching
T here are no student pages for this activity. This isa follow-up project based on work done in
Activity 9 and Individual Work 9.
Students who have completed the work in Lesson 3 now know that two images can be matchedby first applying a dilation of the proper magnitudewith an arbitrary center, then applying a translation.In general, reversing the process does not result in amatching. The question to explore in this project is,“Under what conditions can the order of operationsbe reversed (i.e., translate, then dilate) and have theresult still be a valid matching?”
This question may be interpreted in at least two dif-ferent ways. If the intent is to ask whether the samedilation and translations can be reversible, the shortanswer is “essentially never,” only when the dilationresults in a match without a translation.
However, a more interesting interpretation of thequestion asks whether the order of operations can bereversed while allowing the sizes of the translationsto change. For that case, students might benefit fromrevisiting the work in Unit 2, Secret Codes and thePower of Algebra, involving the distributive law. Thecenter of the dilation plays the role of “zero,” andsolutions are possible, provided the center is known.
ASSESSMENT PROBLEM A3.7
Slide Projector
U se this problem after Lesson 3. It assesses stu-dent understanding of similar figures and their
proportional relationships.
52 LESSON THREE UNIT THREE: LANDSAT
Teacher’s Guide Mathematics: Modeling Our World
53UNIT THREE: LANDSAT LESSON FOUR
Mathematics: Modeling Our World Teacher’s Guide
PREPARATION READING
Areas
See Annotated Teacher’s Edition.
ACTIVITY 10
From A to Z
Emphasize the importance of taking careful mea-surements of each length. Explain that students
may improve precision by measuring a length two orthree times and averaging the measurements.
The student text is written for use with MultiSpec soft-ware or Figures 3.82–3.84, which were producedusing MultiSpec. If your students use MultiSpec, besure they understand how to display the pixel coordi-nates. Student Handout H3.2 from Lesson 1 includesinstructions on how to display coordinates.
If students use Figures 3.82–3.84, no special instruc-tions should be necessary. Of course, they will nothave the option of working with pixel coordinates.
If students are using a draw or paint program, theymay have a little more difficulty locating the regiondescribed in their text. You may wish to show theapproximate location with a transparency.Transparency T3.5 shows a full-screen view of theBeverly region. The rectangle in question is located onthe bit of land just south of the pair of bridges studiedin earlier lessons. Have students select the generallocation of the region they seek, then activate thezoom feature of their software. Most paint and drawprograms will center the zoomed image on the cursor,allowing a better view of the selected point. A newpoint can be selected as they identify the desiredregion more closely through further zooming.
Some programs display a record of the net magnitudeof multiple dilations of an image. Find out whetheryour software has this feature. If your students are
working with a program that does not display the netmagnitude, students will have to record the series ofmagnitudes and the net magnitude of their dilations.An arrow diagram may help to determine the com-bined magnitude of several dilations.
INDIVIDUAL WORK 10
From A To Z
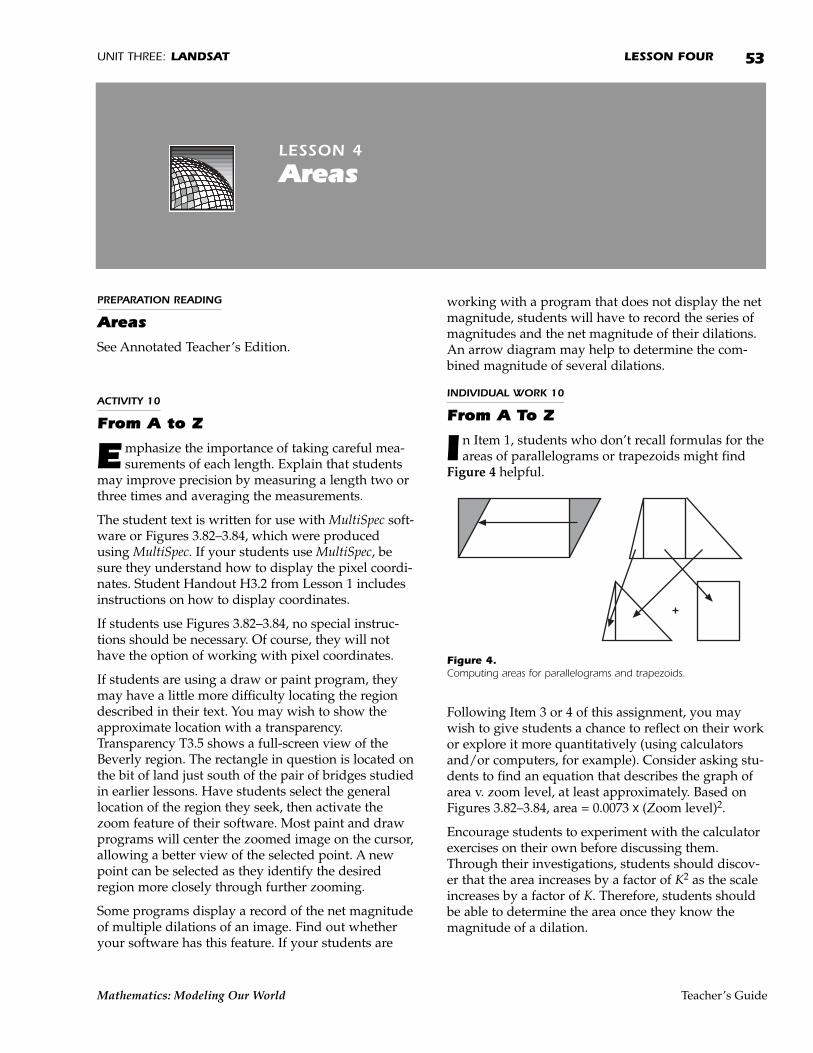
In Item 1, students who don’t recall formulas for theareas of parallelograms or trapezoids might find
Figure 4 helpful.
Figure 4. Computing areas for parallelograms and trapezoids.
Following Item 3 or 4 of this assignment, you maywish to give students a chance to reflect on their workor explore it more quantitatively (using calculatorsand/or computers, for example). Consider asking stu-dents to find an equation that describes the graph ofarea v. zoom level, at least approximately. Based onFigures 3.82–3.84, area = 0.0073 x (Zoom level)2.
Encourage students to experiment with the calculatorexercises on their own before discussing them.Through their investigations, students should discov-er that the area increases by a factor of K2 as the scaleincreases by a factor of K. Therefore, students shouldbe able to determine the area once they know themagnitude of a dilation.
LESSON 4
Areas
ACTIVITY 11
No Matter What ShapeInscribed/Circumscribed Rectangle Method
T his method is quick and easy to use. If your stu-dents are working with MultiSpec, using coordi-
nates to calculate area can be tricky. Normally, whencalculating the area of a region, the boundary has nowidth. But, in MultiSpec, coordinate points have awidth of one pixel. As a result, the boundary of aregion on the coordinate grid includes the width ofthe pixels that form the region’s boundary. Consider arectangle that has opposite corners with the coordi-nates (1, 1) and (2, 2). Using MultiSpec, the width of (2 – 1) is the distance between the centers of the twopixels at these coordinates. The other half-pixelwidths of the two pixels at the coordinates need to beincluded, so the total width of the rectangle is (2 – 1) + 1 pixel width. And the entire rectangle con-tains four pixels of area, not just one. If students areusing MultiSpec for their Landsat work, you may wishto refer them back to Figures 3.60–3.65 to illustratethis point before they calculate the area of the islandin Figure 3.98.
You may want to encourage students who wish topursue pixel counting further. In particular, recall thatpixels represent “average brightness” within a 30-meter-square region. That means that exact locationsof boundaries between pixels are not discernible.Therefore, it may be argued that pixels on the bound-ary should only count as half, since it’s impossible todetermine exactly where each one begins and ends.There is no exact answer here; these methods are onlyapproximations.
Students particularly interested in approximatingareas with circumscribed and inscribed rectanglesmight like to investigate how the method works whenthe rectangles are tilted in relation to the horizontaland vertical axes.
Square Grid Methods
When students use the scale to find the actual area,they may either calculate the actual dimensions beforethey calculate the area, or calculate the area first, thenuse the scale to calculate the actual area. (Recall fromthe work in Activity 10 that the scale factor for areasis the square of the scale factor for linear measure.)Check that students use units throughout and calcu-late conversions correctly.
Item 3 gives less guidance for students. They maydevelop a couple of methods for solving the problem.In one case, students may count a set of grid squaresthat lie inside the region, then count a second set ofgrid squares that lie entirely or partially within theregion. An average of these two counts gives anapproximation. (This is the underlying idea in theTrapezoidal rule in calculus.)
Alternately, students may estimate fractional squaresalong the boundary of the region to get their approxi-mation. (Additional guidance is offered to students inItems 2 and 3 of Individual Work 11. See below.)
For computer images that have fixed pixels, thesemethods are equivalent to zooming in and countingpixels (or fractional pixels) since the desired region isinitially composed of a grid of pixels. This isaddressed in Item 3(d). Counting pixels one at a timeis nearly impossible. However, combining theinscribed/circumscribed rectangle method withcounting pixels may be more manageable: inscribe therectangle, then just count those pixels that are outsidethe rectangle. With MultiSpec, the “Show SelectionCoordinates” option allows checking top and bottomcoordinates for each column of pixels, too.
INDIVIDUAL WORK 11
Knitty-Griddy
I tems 2 and 3 revisit Item 3 of Activity 11 by apply-ing the Inscribed/Circumscribed Rectangle method
to the square grid. Students trace a region boundedby the edges of the grid squares. They circumscribethe desired region to give a close overestimate for thearea. Then they inscribe the region to find an underes-timate. By averaging the overestimate and underesti-mate, students find an even closer estimate of the areaof the region.
Students can follow a variation of this method bycounting partial grid squares based on “eyeball esti-mates” where the region boundary cuts through gridsquares.
ACTIVITY 12
What’s Up, Dot?
See Annotated Teacher’s Edition.
54 LESSON FOUR UNIT THREE: LANDSAT
Teacher’s Guide Mathematics: Modeling Our World
INDIVIDUAL WORK 12
Dot’s All, Folks
I tem 3(a) describes how a calculator with a RANDcommand may be used to generate single points on
a coordinate system. (The RAND command for manycalculators is found under a “Probability” menu,sometimes accessed by a “math” key. Check yourmanual for your particular type of calculator.) Be surestudents understand the slow method before movingto more efficient methods. After students becomecomfortable with the process, you may wish todemonstrate the use of lists.
For many calculators that allow entering formulasinto lists, you can generate a list of random x-valuesby first creating a “counter list.” For example, if youwant a list of 50 random values between 1 and 20,you first create L1, a list of values 1–50. Then, inanother list enter a formula such as 20*RAND(L1).Other calculators will generate a list of random valueswithout depending on a counter list. By creating tworandom lists, you can use calculators to generate ran-dom coordinates: one list for x-values and the otherfor y-values. Specific instructions for TI-82 and TI-83calculators are provided in Handout H3.6.
Spreadsheet software allows for another quick andeasy method for generating lists of random coordi-nates. Commands are usually similar to those givenabove for calculators. For example, in Excel, the com-mand “=RAND()” is equivalent to the calculatorRAND command. The formula =20*RAND() in Excelwill produce a list of random numbers between 0 and20. The list will be as long as the column in which youcopied the formula.
Item 4 solutions may benefit from the calculator list orspreadsheet work done in Item 3 by having studentscreate another column of data of the distance from thecenter to the random point. Students can calculatethis distance using the Pythagorean formula. Thenstudents may compare these distances to the length ofthe radius of the circle to determine whether points lieinside or outside the circle.
ACTIVITY 13
What Happened to the Trees?
See Annotated Teacher’s Edition.
SUPPLEMENTAL ACTIVITY S3.12
How Did the Egyptians Measure Their Land?
T his activity may be used after Individual Work 10. It shows students how people in an
ancient civilization solved geometric problems, usinga way of measuring area that is completely differentfrom the usual rectangular method.
Items 1–8 develop the formula for the area of a general triangle. The formula should be review formost students, but even students who know the for-mula may find it interesting to see several ways toapproach the problem. Though the word is neverused, the idea of proof is at the heart of this work.
Items 9–16 deal with finding areas of quadrilateralsby dividing them into triangles. Methods for findingthe exact and approximate areas are used and com-pared. This section may be viewed as an historicalintroduction to the work in Activities 11 and 12, or asan extension of that work.
Items 17 and 18 allow students to apply methodsdeveloped during the unit to a new situation.
SUPPLEMENTAL ACTIVITY S3.13
Project: Finding Lengths of Curves
Compass
Detailed map of a lake
Map of Crater Lake
Map of your state or local region
Transparency T3.9
T his activity may be used as a project for individuals, groups, or the entire class, during or
after Lesson 4.
If you live near an artificial lake, check with theagency responsible for managing its resources (theArmy Corps of Engineers, etc.). In many cases theyhave very large, accurate maps of the shoreline.
The purpose of this project is to encourage students toconsider a question from an active field of research incurrent mathematics: fractal dimension. Students aregiven an irregular shoreline as an example of a fractalstructure. They learn that as the shoreline is examinedmore and more closely, its measured perimeterincreases without bound. Completion of this project isnot essential to the unit.
55UNIT THREE: LANDSAT LESSON FOUR
Mathematics: Modeling Our World Teacher’s Guide

In Item 1, students might lay a 0.5-cm grid(Transparency T3.9) over the lake to help them todetermine that the shoreline passes through 30squares. The section of the shoreline included in thesquare may be less than, greater than, or equivalent tothe length of a side. Suppose there are eight squaresin which the length of shoreline appears to be morethan a side, four where the length of the shoreline isless than a side, and 18 where the shoreline appears tobe about the length of a side (0.5 cm). The shorelinewould then measure
(8 x 0.6) + (4 x 0.4) + (18 x 0.5).Thus,
4.8 + 1.6 + 9 gives 15.4 cm, or 15.4 x 1 km
yields a shoreline of 15.4 km.
Items 2–6 expose students to some basic issues aboutfractals. Students should understand that as rulerlengths consistently decrease, the overall perimeterconsistently increases.
If you choose to use this section of the project, youwill need a more detailed map that shows the irregu-larities of a shoreline. The image of Crater Lakeincluded in this lesson does not show enough detailfor students to discover this effect.
SUPPLEMENTAL ACTIVITY S3.14
Monte Carlo
Software: Lakearea
T his activity may be used after Activity 12. It usesa program for TI-82 or TI-83 calculators and pro-
vides a fun setting in which students practice the rela-tionships examined in Activity 12. It also describes ageneral difficulty with calculator or computer imple-mentation of Monte Carlo methods for real areas andsuggests a direction of inquiry for able students inter-ested in project work.
If students are comfortable with the list feature oftheir calculators, have them work with two calcula-tors per group. Groups use one calculator to generatethe data and the other to store them for repeated simulations.
Using the calculator program Lakearea, lakes may bedrawn randomly, or the user may specify the use of“ARISE LAKE.” The program draws the lake, tosses
the appropriate number of “pebbles,” and displaysthe counts of pebbles that land inside or outside ofthe lake. Students then use this information to calcu-late an estimate of the area of the lake.
Point out that the effectiveness of the programdepends on accurately determining whether a point isinside or outside of the lake. Since there is no simpleway to program calculators to determine the bound-aries of actual lakes, this method has major draw-backs for application to real area situations.
Though solutions may be nearly impossible to findusing a calculator, you might like to discuss with stu-dents ways in which they could help the computerfigure out whether a point is inside or outside of thelake region. For example, from Lesson 2, studentsknow that a digitized image is stored as a matrix ofbrightness levels, each indicated by a coordinate. It isreasonable to think that a computer could use thecoordinates of the point to find the brightness levelfor that location and decide whether it was part of thelake region or not.
Unfortunately, students using image software gener-ally do not have access to the brightness levels of theimage. MultiSpec can help students who are interestedin using brightness levels with the Monte Carlomethod. The Processor, Utilities, List Data optionallows direct examination of the brightness levels foreach pixel.
ASSESSMENT PROBLEM A3.8
Cubism
Use this problem after early sections of Lesson 4. Itassesses student understanding that correspondingmeasurements of a solid, in different dimensions, areproportional.
56 LESSON FOUR UNIT THREE: LANDSAT
Teacher’s Guide Mathematics: Modeling Our World

57UNIT THREE: LANDSAT UNIT SUMMARY
Mathematics: Modeling Our World Teacher’s Guide
Wrapping Up Unit Three
See Annotated Teacher’s Edition.
Mathematical Summary
See Annotated Teacher’s Edition.
Glossary
See Annotated Teacher’s Edition.
UNIT SUMMARY
Landsat

58
Teacher’s Guide Mathematics: Modeling Our World