uae property review special edition - asteco · uae property review special edition: historic...
TRANSCRIPT
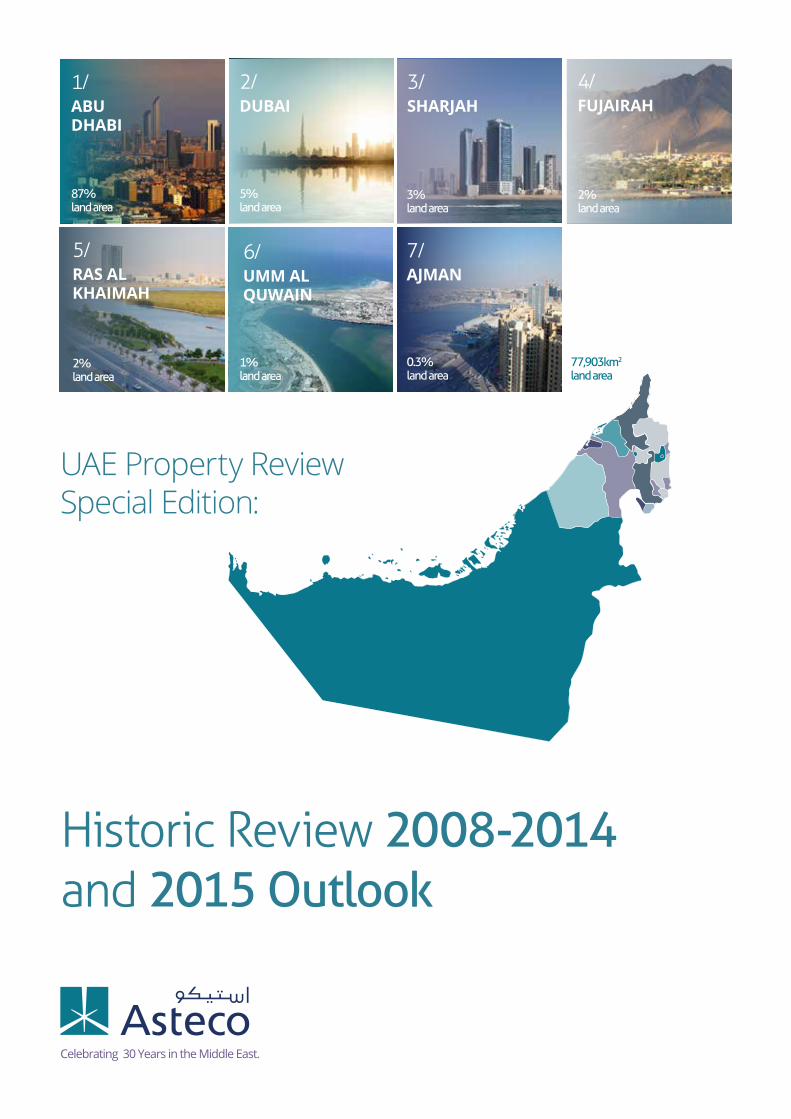
UAE Property Review Special Edition:
Historic Review 2008-2014 and 2015 Outlook
1/ABUDHABI
2/DUBAI
3/SHARJAH
4/FUJAIRAH
5/RAS ALKHAIMAH
6/UMM ALQUWAIN
87% land area
5% land area
3% land area
2% land area
2% land area
1% land area
77,903km2
land area
7/AJMAN
0.3% land area
Xxx
32 © Asteco Property Management, 2015© Asteco Property Management, 2015
UAE ANNUAL REPORT 2014 UAE ANNUAL REPORT Q4 2014
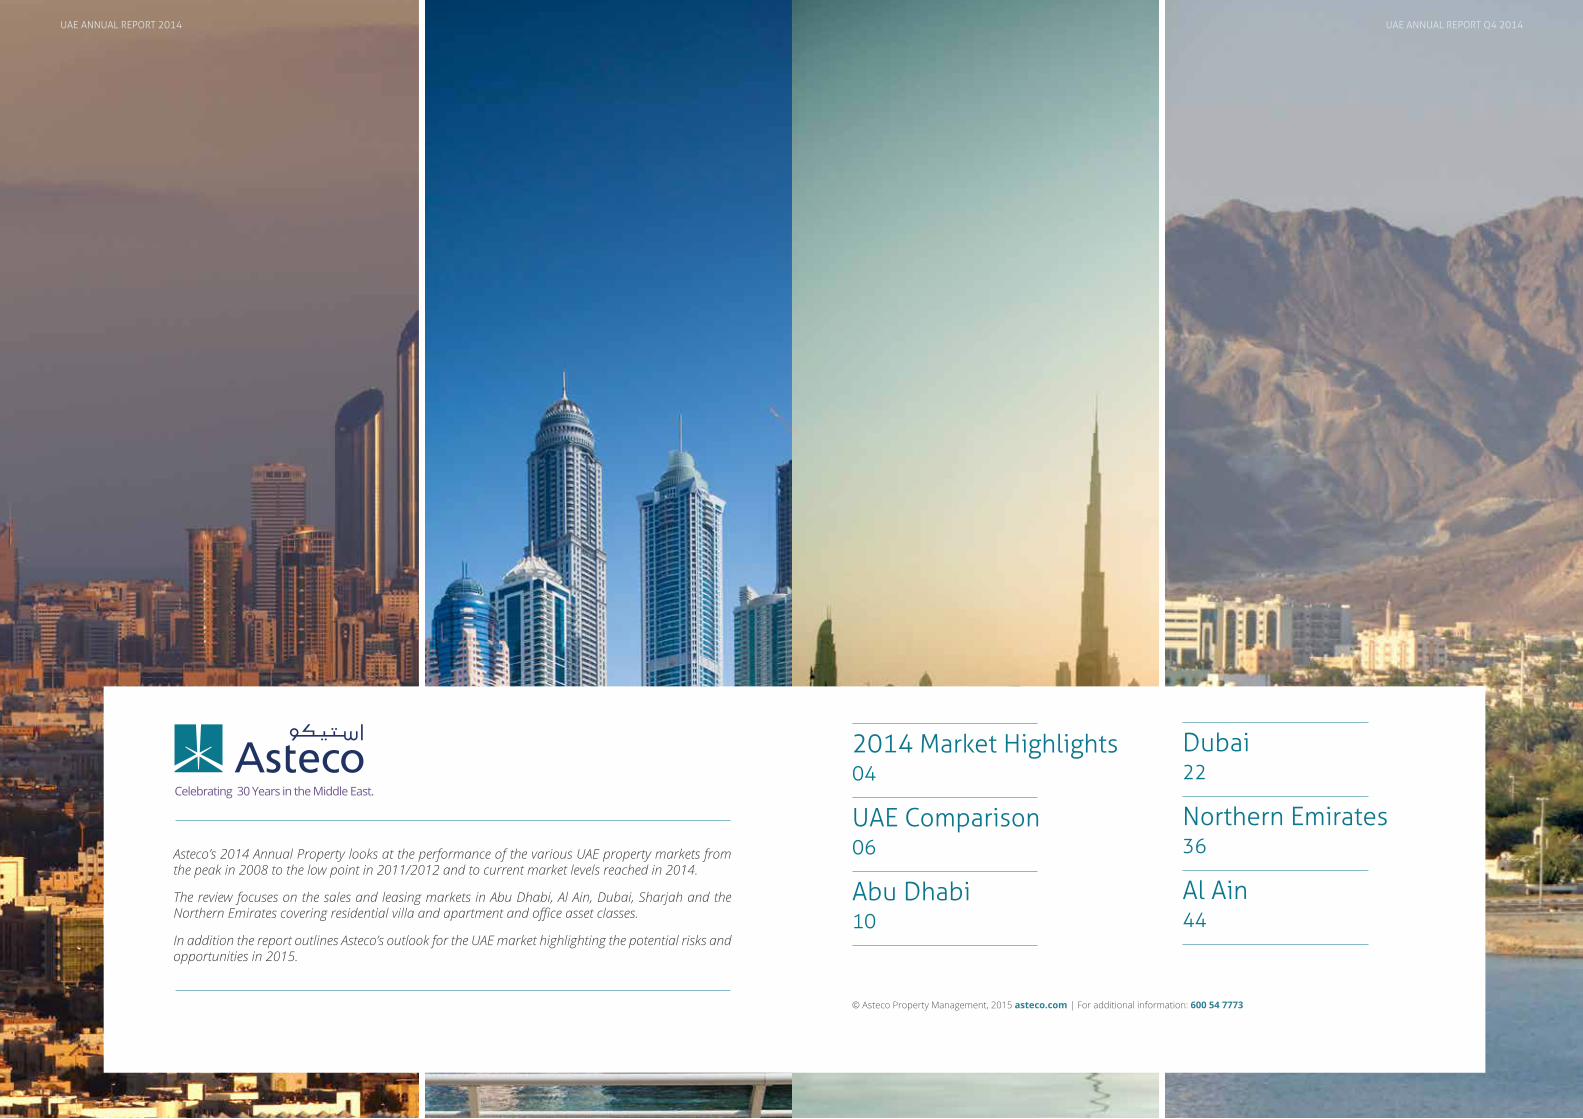
2014 Market Highlights04
UAE Comparison06
Abu Dhabi10
Dubai22
Northern Emirates36
Al Ain44
© Asteco Property Management, 2015 asteco.com | For additional information: 600 54 7773
Asteco’s 2014 Annual Property looks at the performance of the various UAE property markets from the peak in 2008 to the low point in 2011/2012 and to current market levels reached in 2014.
The review focuses on the sales and leasing markets in Abu Dhabi, Al Ain, Dubai, Sharjah and the Northern Emirates covering residential villa and apartment and office asset classes.
In addition the report outlines Asteco’s outlook for the UAE market highlighting the potential risks and opportunities in 2015.
UAE ANNUAL REPORT 2014
54
UAE ANNUAL REPORT 2014
© Asteco Property Management, 2015© Asteco Property Management, 2015
2014 Market Highlights
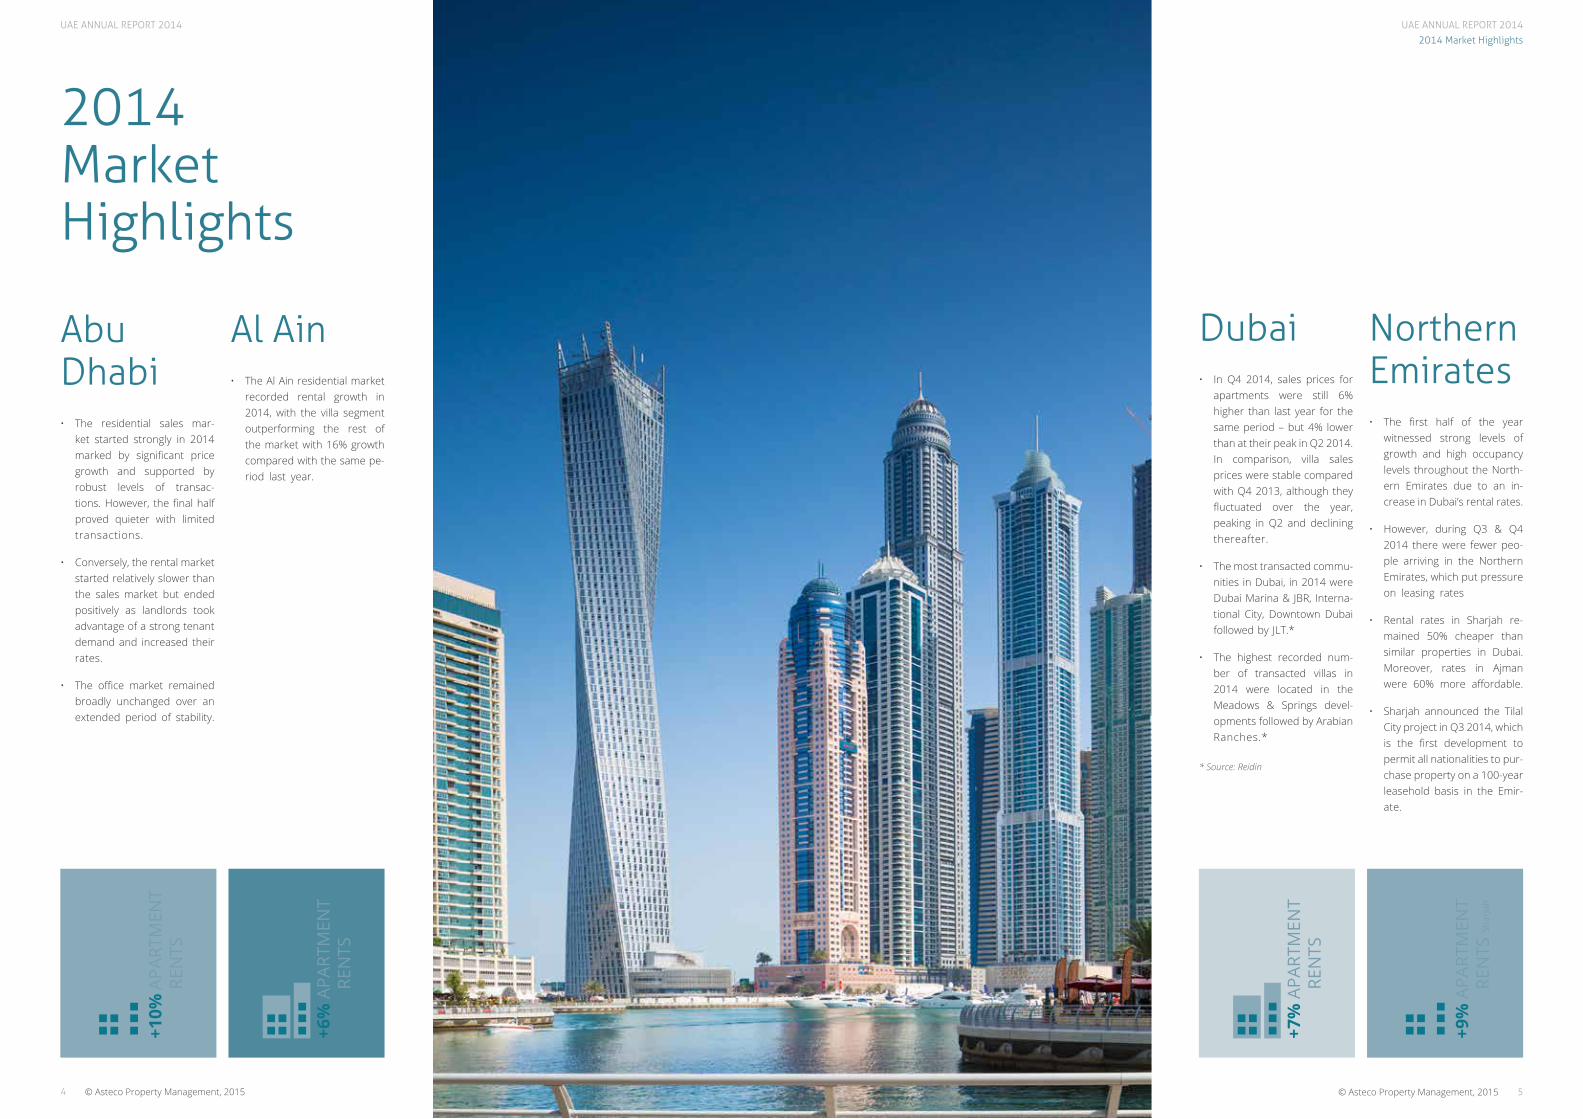
Abu Dhabi• The residential sales mar-
ket started strongly in 2014 marked by significant price growth and supported by robust levels of transac-tions. However, the final half proved quieter with limited transactions.
• Conversely, the rental market started relatively slower than the sales market but ended positively as landlords took advantage of a strong tenant demand and increased their rates.
• The office market remained broadly unchanged over an extended period of stability.
Al Ain• The Al Ain residential market
recorded rental growth in 2014, with the villa segment outperforming the rest of the market with 16% growth compared with the same pe-riod last year.
2014Market Highlights
Dubai• In Q4 2014, sales prices for
apartments were still 6% higher than last year for the same period – but 4% lower than at their peak in Q2 2014. In comparison, villa sales prices were stable compared with Q4 2013, although they fluctuated over the year, peaking in Q2 and declining thereafter.
• The most transacted commu-nities in Dubai, in 2014 were Dubai Marina & JBR, Interna-tional City, Downtown Dubai followed by JLT.*
• The highest recorded num-ber of transacted villas in 2014 were located in the Meadows & Springs devel-opments followed by Arabian Ranches.*
* Source: Reidin
NorthernEmirates• The first half of the year
witnessed strong levels of growth and high occupancy levels throughout the North-ern Emirates due to an in-crease in Dubai’s rental rates.
• However, during Q3 & Q4 2014 there were fewer peo-ple arriving in the Northern Emirates, which put pressure on leasing rates
• Rental rates in Sharjah re-mained 50% cheaper than similar properties in Dubai. Moreover, rates in Ajman were 60% more affordable.
• Sharjah announced the Tilal City project in Q3 2014, which is the first development to permit all nationalities to pur-chase property on a 100-year leasehold basis in the Emir-ate.
+9%
APA
RTM
ENT
R
ENTS
Shar
jah SHS
+7%
APA
RTM
ENT
R
ENTS
+6%
APA
RTM
ENT
R
ENTS
+10%
APA
RTM
ENT
R
ENTS
UAE ANNUAL REPORT 2014
7© Asteco Property Management, 2015
UAE Comparison
UAE RentalComparison
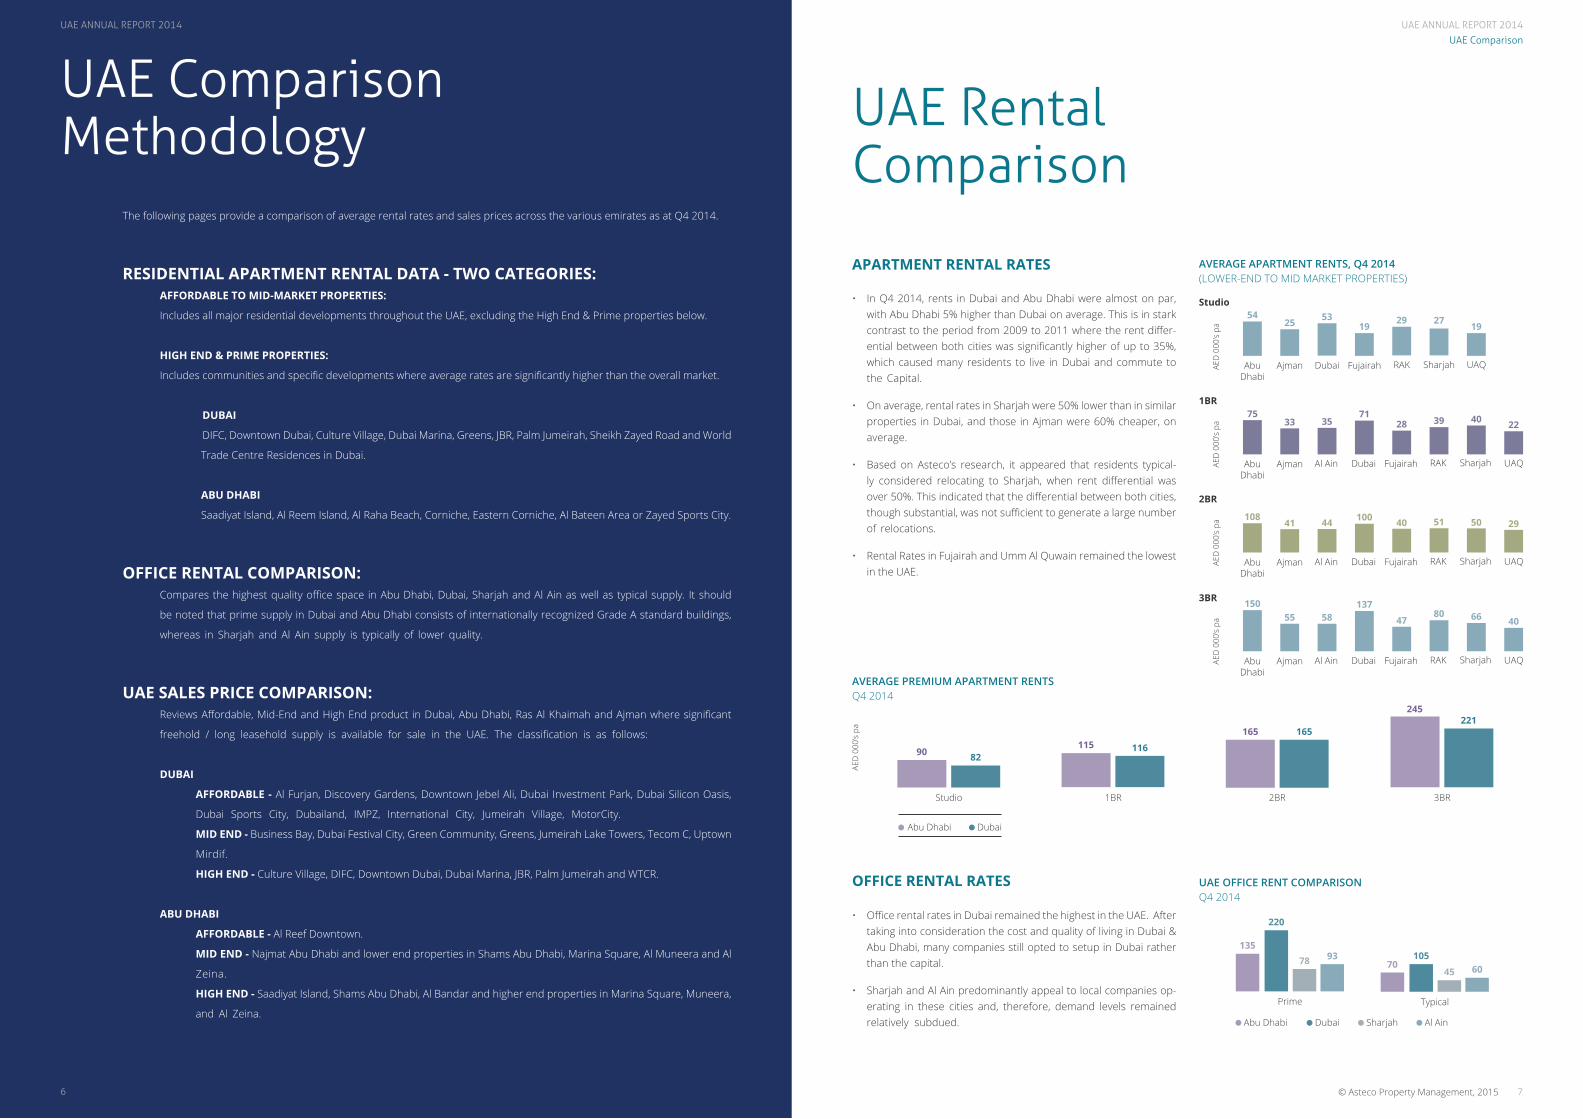
• In Q4 2014, rents in Dubai and Abu Dhabi were almost on par, with Abu Dhabi 5% higher than Dubai on average. This is in stark contrast to the period from 2009 to 2011 where the rent differ-ential between both cities was significantly higher of up to 35%, which caused many residents to live in Dubai and commute to the Capital.
• On average, rental rates in Sharjah were 50% lower than in similar properties in Dubai, and those in Ajman were 60% cheaper, on average.
• Based on Asteco’s research, it appeared that residents typical-ly considered relocating to Sharjah, when rent differential was over 50%. This indicated that the differential between both cities, though substantial, was not sufficient to generate a large number of relocations.
• Rental Rates in Fujairah and Umm Al Quwain remained the lowest in the UAE.
• Office rental rates in Dubai remained the highest in the UAE. After taking into consideration the cost and quality of living in Dubai & Abu Dhabi, many companies still opted to setup in Dubai rather than the capital.
• Sharjah and Al Ain predominantly appeal to local companies op-erating in these cities and, therefore, demand levels remained relatively subdued.
AVERAGE APARTMENT RENTS, Q4 2014 (LOWER-END TO MID MARKET PROPERTIES)
APARTMENT RENTAL RATES
OFFICE RENTAL RATES
AED
000
’s pa
AED
000
’s pa
AED
000
’s pa
AED
000
’s pa
54
75
108
150
25
33
41
55
53
35
44
58
19
71
100
137
29
28
40
47
27
39
51
80
19
40
50
66
22
29
40
AbuDhabi
AbuDhabi
AbuDhabi
AbuDhabi
Ajman
Ajman
Ajman
Ajman
Dubai
Al Ain
Al Ain
Al Ain
Fujairah RAK Sharjah UAQ
UAQ
UAQ
UAQ
Studio
1BR
2BR
3BR
AVERAGE PREMIUM APARTMENT RENTS Q4 2014
AED
000
’s pa
Studio 1BR 2BR 3BR
221165
11682
245
165
135
70
220
1057845
9360
11590
UAE OFFICE RENT COMPARISONQ4 2014
Prime
Abu Dhabi Dubai Sharjah Al Ain
Typical
The following pages provide a comparison of average rental rates and sales prices across the various emirates as at Q4 2014.
RESIDENTIAL APARTMENT RENTAL DATA - TWO CATEGORIES: AFFORDABLE TO MID-MARKET PROPERTIES:
Includes all major residential developments throughout the UAE, excluding the High End & Prime properties below.
HIGH END & PRIME PROPERTIES:
Includes communities and specific developments where average rates are significantly higher than the overall market.
DUBAI
DIFC, Downtown Dubai, Culture Village, Dubai Marina, Greens, JBR, Palm Jumeirah, Sheikh Zayed Road and World
Trade Centre Residences in Dubai.
ABU DHABI
Saadiyat Island, Al Reem Island, Al Raha Beach, Corniche, Eastern Corniche, Al Bateen Area or Zayed Sports City.
OFFICE RENTAL COMPARISON: Compares the highest quality office space in Abu Dhabi, Dubai, Sharjah and Al Ain as well as typical supply. It should
be noted that prime supply in Dubai and Abu Dhabi consists of internationally recognized Grade A standard buildings,
whereas in Sharjah and Al Ain supply is typically of lower quality.
UAE SALES PRICE COMPARISON: Reviews Affordable, Mid-End and High End product in Dubai, Abu Dhabi, Ras Al Khaimah and Ajman where significant
freehold / long leasehold supply is available for sale in the UAE. The classification is as follows:
DUBAI
AFFORDABLE - Al Furjan, Discovery Gardens, Downtown Jebel Ali, Dubai Investment Park, Dubai Silicon Oasis,
Dubai Sports City, Dubailand, IMPZ, International City, Jumeirah Village, MotorCity.
MID END - Business Bay, Dubai Festival City, Green Community, Greens, Jumeirah Lake Towers, Tecom C, Uptown
Mirdif.
HIGH END - Culture Village, DIFC, Downtown Dubai, Dubai Marina, JBR, Palm Jumeirah and WTCR.
ABU DHABI
AFFORDABLE - Al Reef Downtown.
MID END - Najmat Abu Dhabi and lower end properties in Shams Abu Dhabi, Marina Square, Al Muneera and Al
Zeina.
HIGH END - Saadiyat Island, Shams Abu Dhabi, Al Bandar and higher end properties in Marina Square, Muneera,
and Al Zeina.
Dubai
Dubai
Dubai
Fujairah
Fujairah
Fujairah
RAK
RAK
RAK
Sharjah
Sharjah
Sharjah
Abu Dhabi Dubai
UAE Comparison Methodology
6
UAE ANNUAL REPORT 2014
UAE ANNUAL REPORT 2014
9© Asteco Property Management, 2015© Asteco Property Management, 2015
UAE Comparison
8
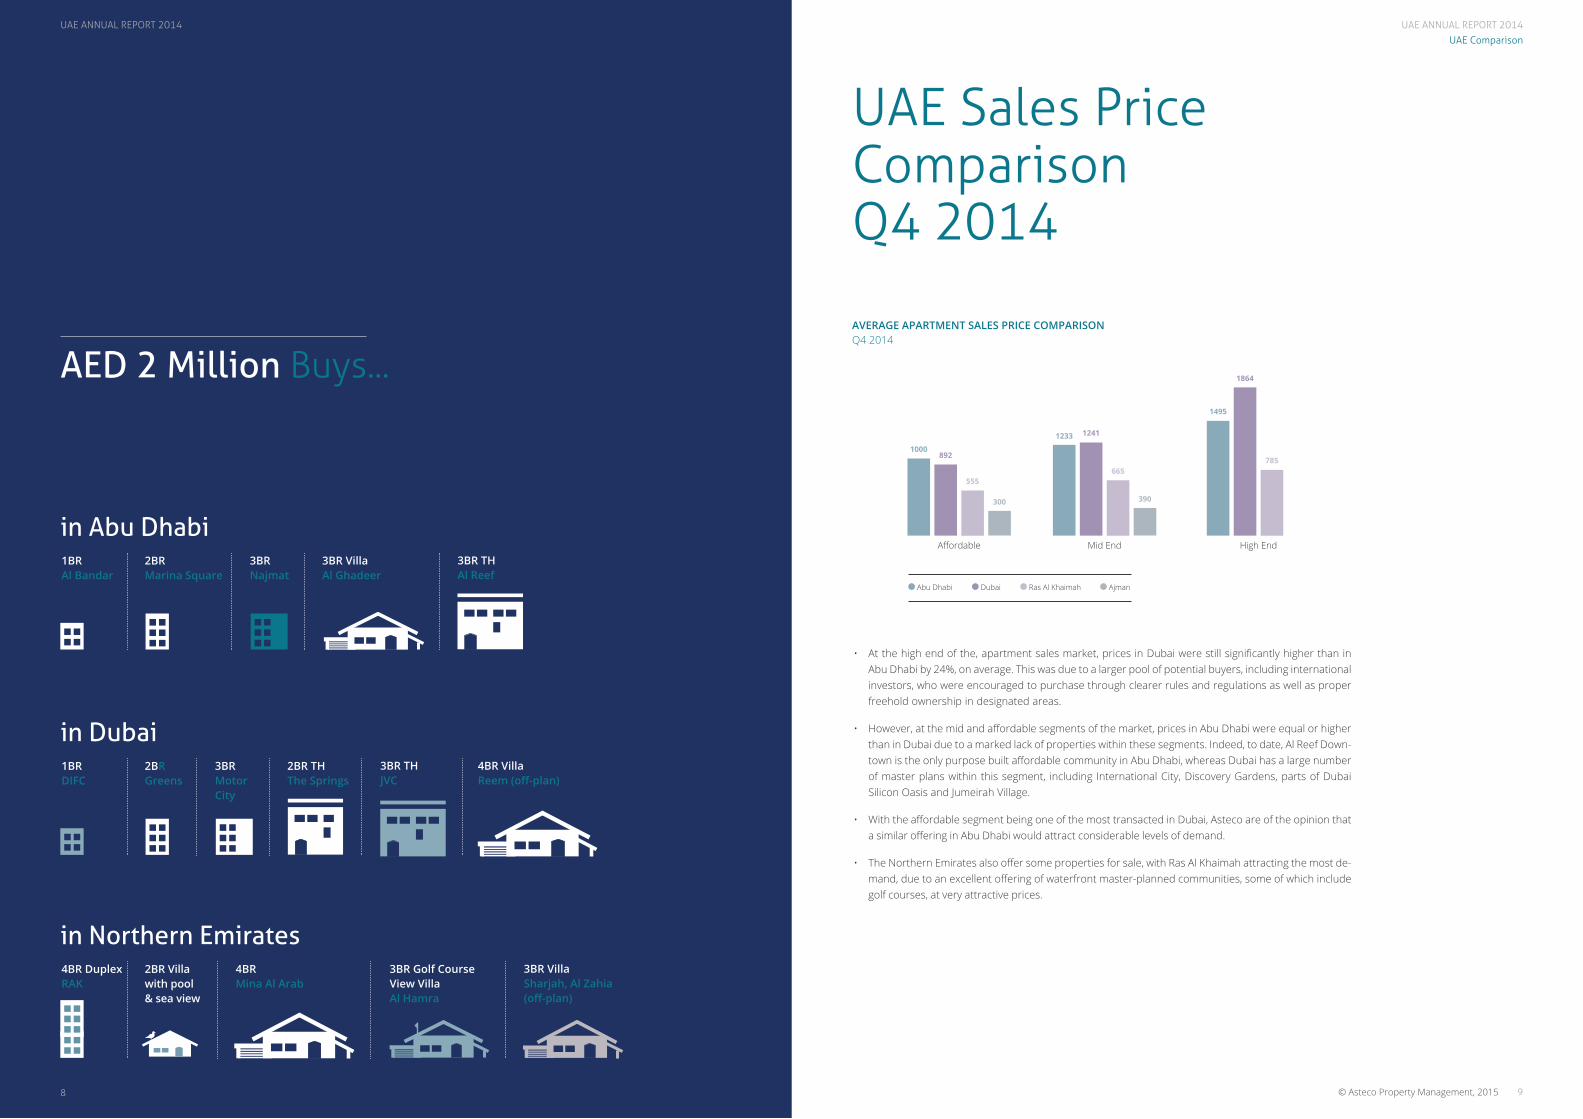
UAE Sales Price Comparison Q4 2014
AVERAGE APARTMENT SALES PRICE COMPARISONQ4 2014
AED 2 Million Buys...
in Abu Dhabi1BRAl Bandar
2BRMarina Square
3BRNajmat
3BR VillaAl Ghadeer
3BR THAl Reef
in Dubai1BRDIFC
2BRGreens
3BRMotorCity
2BR THThe Springs
3BR THJVC
4BR VillaReem (off-plan)
in Northern Emirates4BR DuplexRAK
2BR Villa with pool & sea view
4BRMina Al Arab
3BR Golf Course View VillaAl Hamra
3BR VillaSharjah, Al Zahia (off-plan)
• At the high end of the, apartment sales market, prices in Dubai were still significantly higher than in Abu Dhabi by 24%, on average. This was due to a larger pool of potential buyers, including international investors, who were encouraged to purchase through clearer rules and regulations as well as proper freehold ownership in designated areas.
• However, at the mid and affordable segments of the market, prices in Abu Dhabi were equal or higher than in Dubai due to a marked lack of properties within these segments. Indeed, to date, Al Reef Down-town is the only purpose built affordable community in Abu Dhabi, whereas Dubai has a large number of master plans within this segment, including International City, Discovery Gardens, parts of Dubai Silicon Oasis and Jumeirah Village.
• With the affordable segment being one of the most transacted in Dubai, Asteco are of the opinion that a similar offering in Abu Dhabi would attract considerable levels of demand.
• The Northern Emirates also offer some properties for sale, with Ras Al Khaimah attracting the most de-mand, due to an excellent offering of waterfront master-planned communities, some of which include golf courses, at very attractive prices.
Abu Dhabi Dubai Ras Al Khaimah Ajman
Affordable Mid End High End
1233
1495
1000
1241
1864
892
665785
555
390300
UAE ANNUAL REPORT 2014
UAE ANNUAL REPORT 2014
1110 © Asteco Property Management, 2015© Asteco Property Management, 2015
Abu Dhabi
10
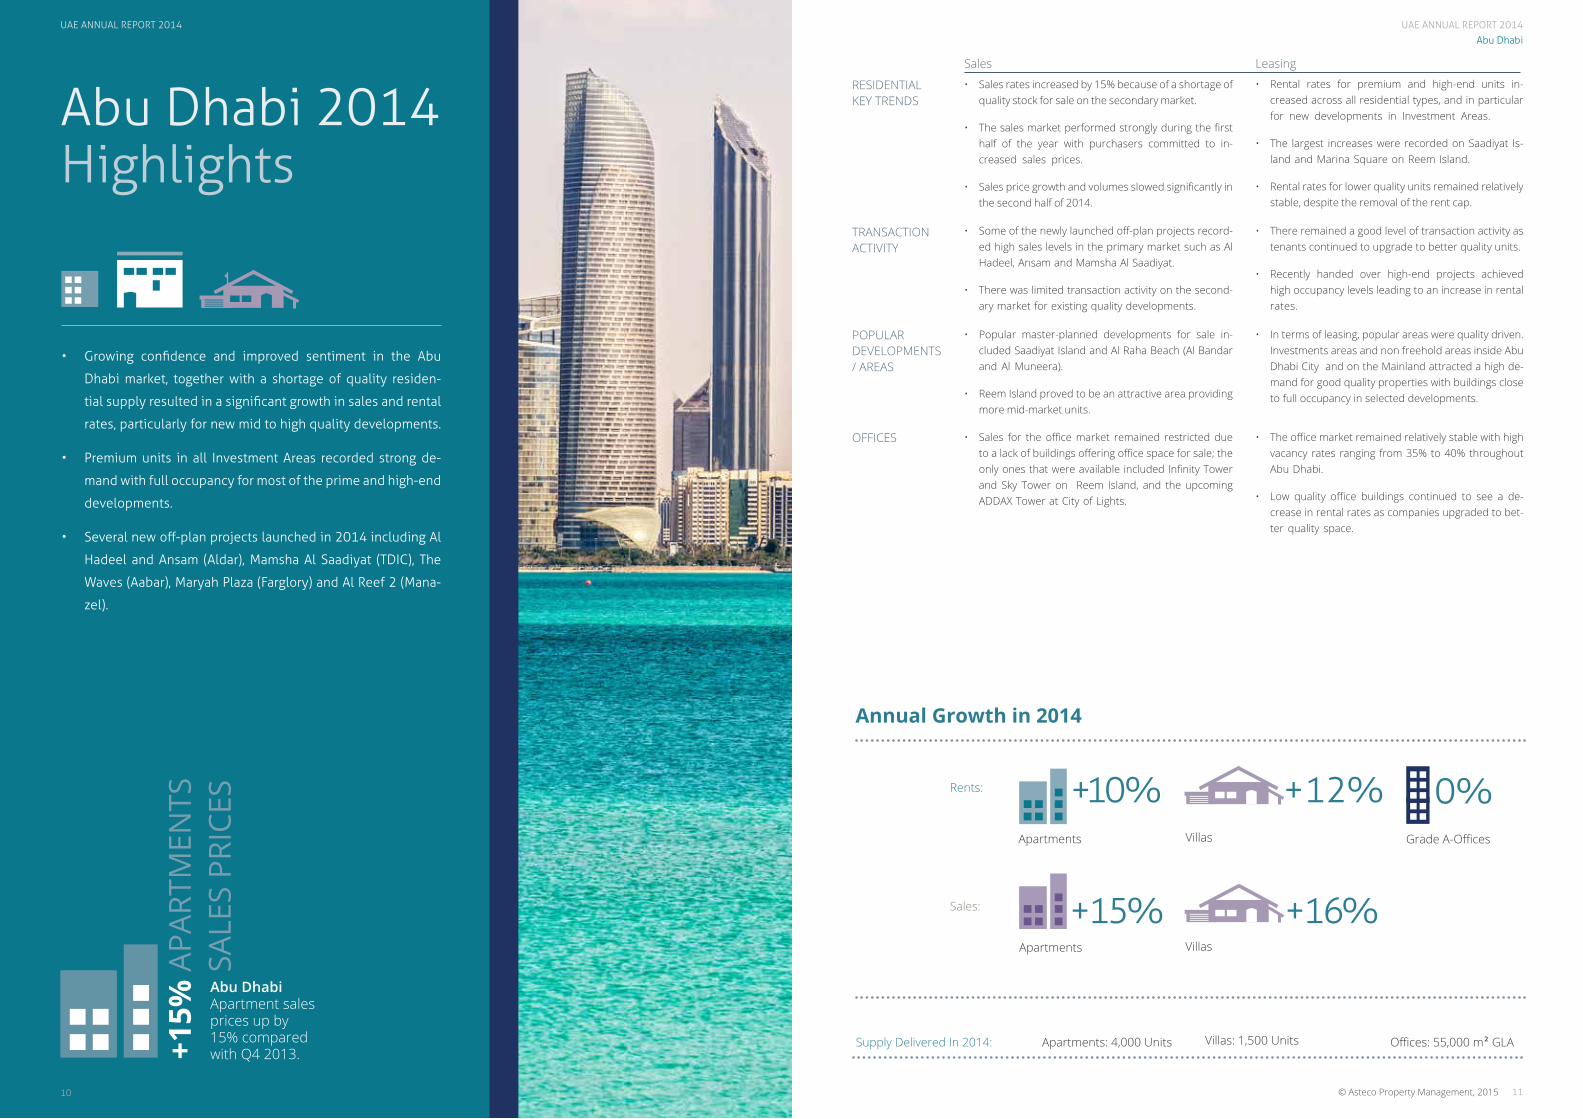
Abu Dhabi 2014 Highlights
Apartments
+10%Villas
+12%Grade A-Offices
0%
Apartments
+15%Villas
+16%
Rents:
Sales:
Supply Delivered In 2014: Apartments: 4,000 Units
Abu Dhabi Apartment sales prices up by 15% compared with Q4 2013.+1
5% A
PART
MEN
TS
SAL
ES P
RICE
S
RESIDENTIAL KEY TRENDS
TRANSACTION ACTIVITY
POPULAR DEVELOPMENTS / AREAS
OFFICES • Sales for the office market remained restricted due to a lack of buildings offering office space for sale; the only ones that were available included Infinity Tower and Sky Tower on Reem Island, and the upcoming ADDAX Tower at City of Lights.
• Popular master-planned developments for sale in-cluded Saadiyat Island and Al Raha Beach (Al Bandar and Al Muneera).
• Reem Island proved to be an attractive area providing more mid-market units.
• Some of the newly launched off-plan projects record-ed high sales levels in the primary market such as Al Hadeel, Ansam and Mamsha Al Saadiyat.
• There was limited transaction activity on the second-ary market for existing quality developments.
• Sales rates increased by 15% because of a shortage of quality stock for sale on the secondary market.
• The sales market performed strongly during the first half of the year with purchasers committed to in-creased sales prices.
• Sales price growth and volumes slowed significantly in the second half of 2014.
• Growing confidence and improved sentiment in the Abu
Dhabi market, together with a shortage of quality residen-
tial supply resulted in a significant growth in sales and rental
rates, particularly for new mid to high quality developments.
• Premium units in all Investment Areas recorded strong de-
mand with full occupancy for most of the prime and high-end
developments.
• Several new off-plan projects launched in 2014 including Al
Hadeel and Ansam (Aldar), Mamsha Al Saadiyat (TDIC), The
Waves (Aabar), Maryah Plaza (Farglory) and Al Reef 2 (Mana-
zel).
• The office market remained relatively stable with high vacancy rates ranging from 35% to 40% throughout Abu Dhabi.
• Low quality office buildings continued to see a de-crease in rental rates as companies upgraded to bet-ter quality space.
• In terms of leasing, popular areas were quality driven. Investments areas and non freehold areas inside Abu Dhabi City and on the Mainland attracted a high de-mand for good quality properties with buildings close to full occupancy in selected developments.
• There remained a good level of transaction activity as tenants continued to upgrade to better quality units.
• Recently handed over high-end projects achieved high occupancy levels leading to an increase in rental rates.
• Rental rates for premium and high-end units in-creased across all residential types, and in particular for new developments in Investment Areas.
• The largest increases were recorded on Saadiyat Is-land and Marina Square on Reem Island.
• Rental rates for lower quality units remained relatively stable, despite the removal of the rent cap.
Sales Leasing
Villas: 1,500 Units Offices: 55,000 m2 GLA
Annual Growth in 2014
UAE ANNUAL REPORT 2014
UAE ANNUAL REPORT 2014
1312
UAE ANNUAL REPORT 2014
© Asteco Property Management, 2015© Asteco Property Management, 2015
Abu Dhabi
12
APARTMENTS
VILLAS
OFFICES • The office sales market is expected to remain un-changed in 2015, with limited transaction activity.
• The villa sales market will remain relatively flat, with limited prime and high-end units available for sale in the primary and secondary markets.
• Market activity is expected to remain relatively stable throughout 2015. Prices will become more competi-tive as new projects are handed over.
• Office rents in strata-owned space could come under pressure as owners of the soon to-be-handed-over ADDAX Tower compete to secure tenants.
• Villa rental rates are expected to increase slightly due to a shortage in quality villa units. However, increased utility costs could slow potential rental increases.
• Occupancy rates will remain high and transaction ac-tivity will also be strong.
• Rental rates are expected to record modest increases in 2015 due to a prevailing “flight to quality” scenar-io, which will put pressure on older and lower quality properties.
• Quality projects in Investment Zones will continue to be sought after and therefore occupancy rates are expected to remain high.
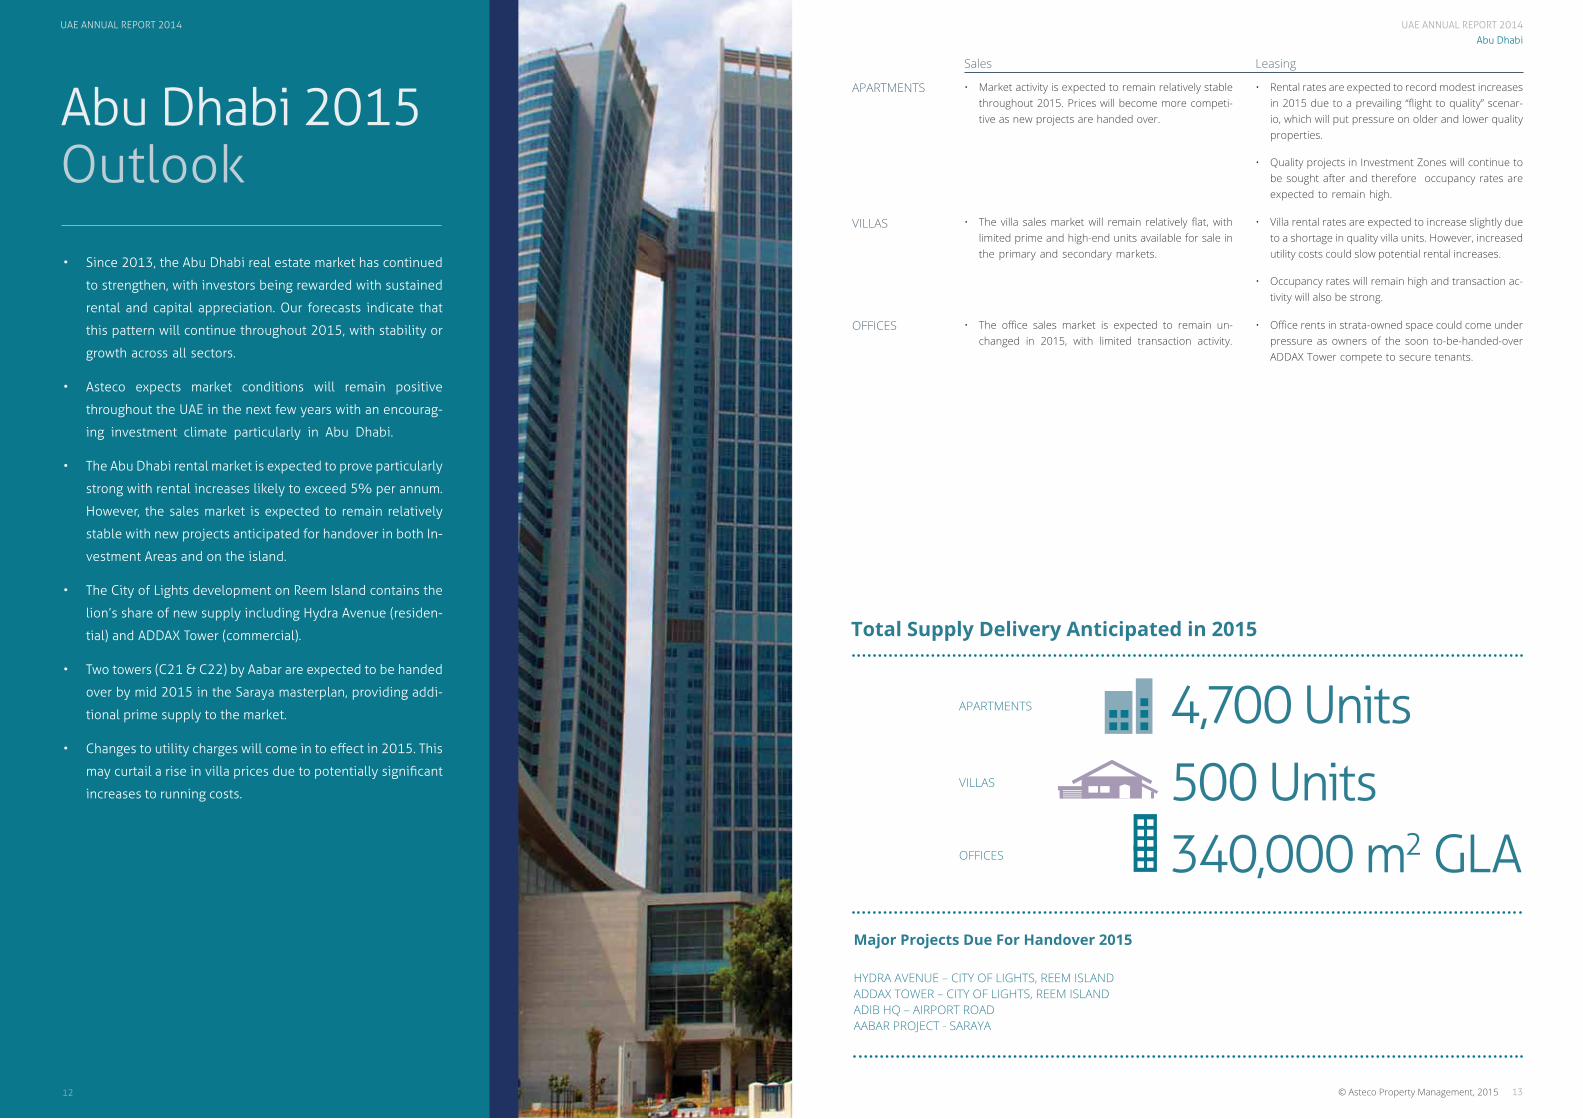
Major Projects Due For Handover 2015
HYDRA AVENUE – CITY OF LIGHTS, REEM ISLANDADDAX TOWER – CITY OF LIGHTS, REEM ISLAND ADIB HQ – AIRPORT ROADAABAR PROJECT - SARAYA
Abu Dhabi 2015 Outlook
4,700 Units500 Units340,000 m2 GLA
APARTMENTS
VILLAS
OFFICES
Sales Leasing
Total Supply Delivery Anticipated in 2015
• Since 2013, the Abu Dhabi real estate market has continued
to strengthen, with investors being rewarded with sustained
rental and capital appreciation. Our forecasts indicate that
this pattern will continue throughout 2015, with stability or
growth across all sectors.
• Asteco expects market conditions will remain positive
throughout the UAE in the next few years with an encourag-
ing investment climate particularly in Abu Dhabi.
• The Abu Dhabi rental market is expected to prove particularly
strong with rental increases likely to exceed 5% per annum.
However, the sales market is expected to remain relatively
stable with new projects anticipated for handover in both In-
vestment Areas and on the island.
• The City of Lights development on Reem Island contains the
lion’s share of new supply including Hydra Avenue (residen-
tial) and ADDAX Tower (commercial).
• Two towers (C21 & C22) by Aabar are expected to be handed
over by mid 2015 in the Saraya masterplan, providing addi-
tional prime supply to the market.
• Changes to utility charges will come in to effect in 2015. This
may curtail a rise in villa prices due to potentially significant
increases to running costs.
UAE ANNUAL REPORT 2014
UAE ANNUAL REPORT 2014
1514
UAE ANNUAL REPORT 2014
© Asteco Property Management, 2015© Asteco Property Management, 2015
Abu Dhabi
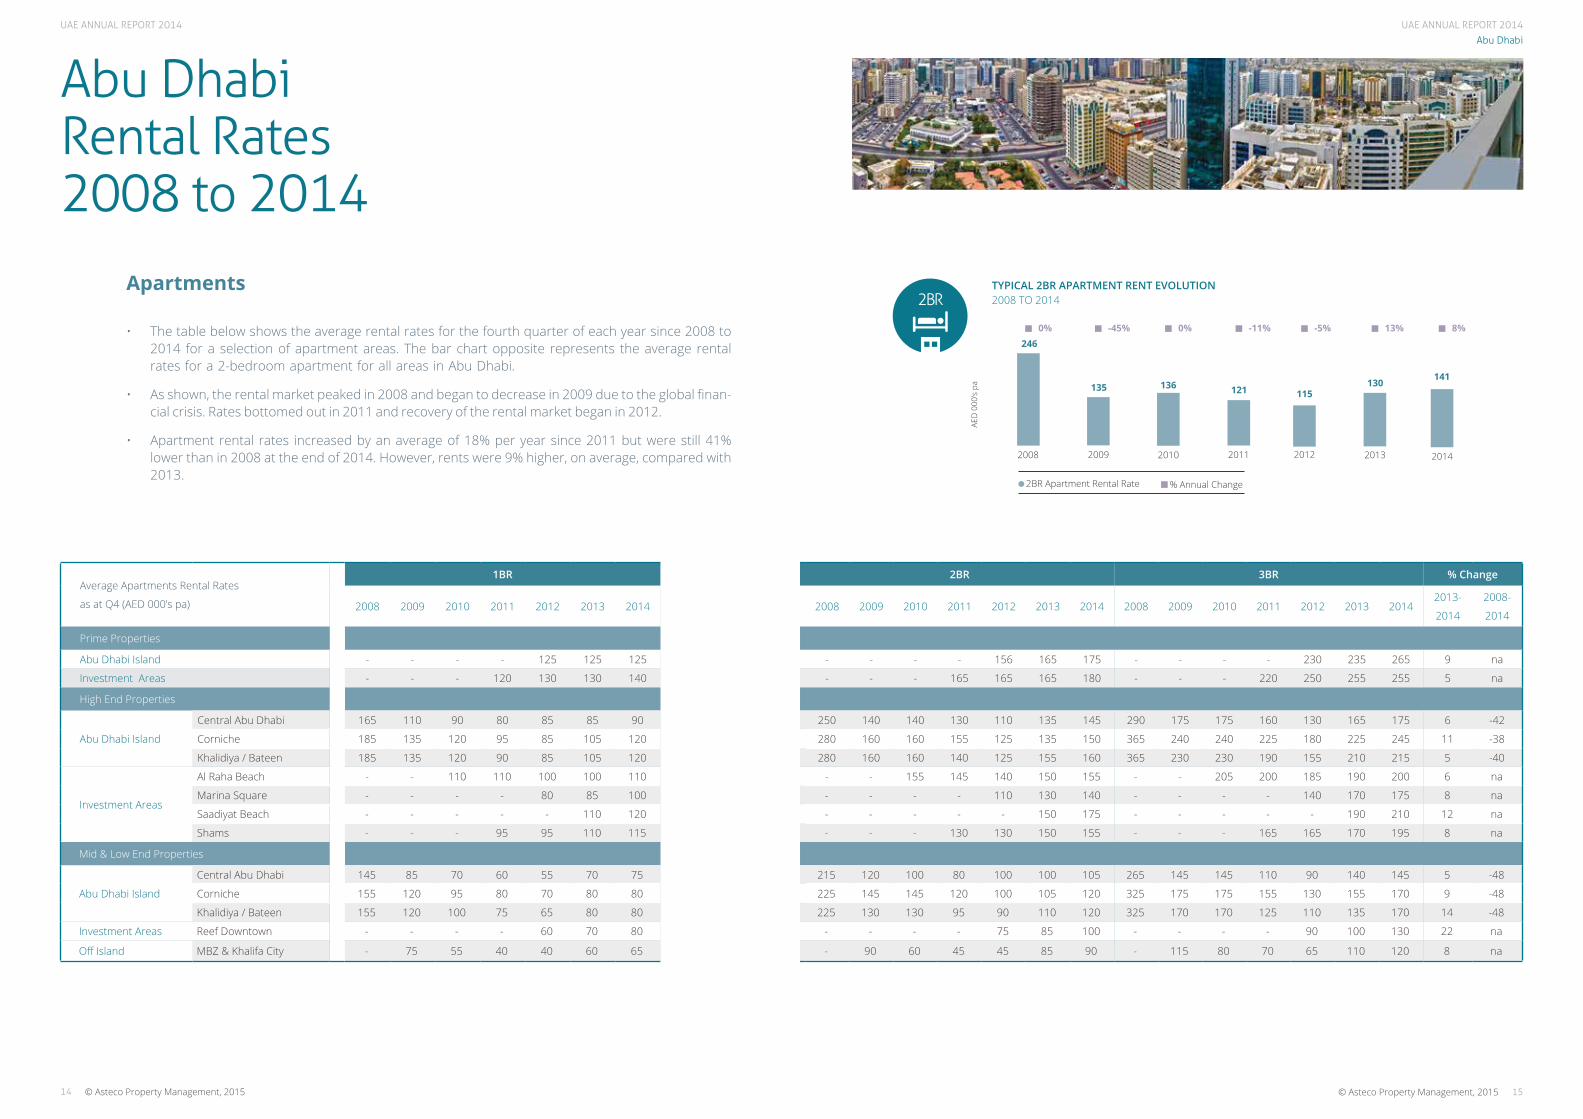
Abu Dhabi Rental Rates 2008 to 2014
TYPICAL 2BR APARTMENT RENT EVOLUTION2008 TO 2014
246
2008
135
2009
136
2010
121 115
2011
2BR Apartment Rental Rate % Annual Change
130141
20142012 2013
2BR
AED
000
’s pa
Apartments
• The table below shows the average rental rates for the fourth quarter of each year since 2008 to 2014 for a selection of apartment areas. The bar chart opposite represents the average rental rates for a 2-bedroom apartment for all areas in Abu Dhabi.
• As shown, the rental market peaked in 2008 and began to decrease in 2009 due to the global finan-cial crisis. Rates bottomed out in 2011 and recovery of the rental market began in 2012.
• Apartment rental rates increased by an average of 18% per year since 2011 but were still 41% lower than in 2008 at the end of 2014. However, rents were 9% higher, on average, compared with 2013.
0% -45% 0% -11% -5% 13% 8%
Average Apartments Rental Rates
as at Q4 (AED 000’s pa)
1BR 2BR 3BR % Change
2008 2009 2010 2011 2012 2013 2014 2008 2009 2010 2011 2012 2013 2014 2008 2009 2010 2011 2012 2013 20142013-
2014
2008-
2014
Prime Properties
Abu Dhabi Island - - - - 125 125 125 - - - - 156 165 175 - - - - 230 235 265 9 na
Investment Areas - - - 120 130 130 140 - - - 165 165 165 180 - - - 220 250 255 255 5 na
High End Properties
Abu Dhabi Island
Central Abu Dhabi 165 110 90 80 85 85 90 250 140 140 130 110 135 145 290 175 175 160 130 165 175 6 -42
Corniche 185 135 120 95 85 105 120 280 160 160 155 125 135 150 365 240 240 225 180 225 245 11 -38
Khalidiya / Bateen 185 135 120 90 85 105 120 280 160 160 140 125 155 160 365 230 230 190 155 210 215 5 -40
Investment Areas
Al Raha Beach - - 110 110 100 100 110 - - 155 145 140 150 155 - - 205 200 185 190 200 6 na
Marina Square - - - - 80 85 100 - - - - 110 130 140 - - - - 140 170 175 8 na
Saadiyat Beach - - - - - 110 120 - - - - - 150 175 - - - - - 190 210 12 na
Shams - - - 95 95 110 115 - - - 130 130 150 155 - - - 165 165 170 195 8 na
Mid & Low End Properties
Abu Dhabi Island
Central Abu Dhabi 145 85 70 60 55 70 75 215 120 100 80 100 100 105 265 145 145 110 90 140 145 5 -48
Corniche 155 120 95 80 70 80 80 225 145 145 120 100 105 120 325 175 175 155 130 155 170 9 -48
Khalidiya / Bateen 155 120 100 75 65 80 80 225 130 130 95 90 110 120 325 170 170 125 110 135 170 14 -48
Investment Areas Reef Downtown - - - - 60 70 80 - - - - 75 85 100 - - - - 90 100 130 22 na
Off Island MBZ & Khalifa City - 75 55 40 40 60 65 - 90 60 45 45 85 90 - 115 80 70 65 110 120 8 na
UAE ANNUAL REPORT 2014
Xxx
1716
UAE ANNUAL REPORT 2014
© Asteco Property Management, 2015© Asteco Property Management, 2015
Abu Dhabi Rental Rates 2008 to 2014
433
2008
257
2009
235
2010
203 208
2011
4BR Villa Rental Rate
214 239
20142012 2013
4BRTYPICAL 4BR VILLA RENT EVOLUTION 2008 TO 2014
AED
000
’s pa
% Annual Change
0% -41% -8% -14% 2% 3% 12%
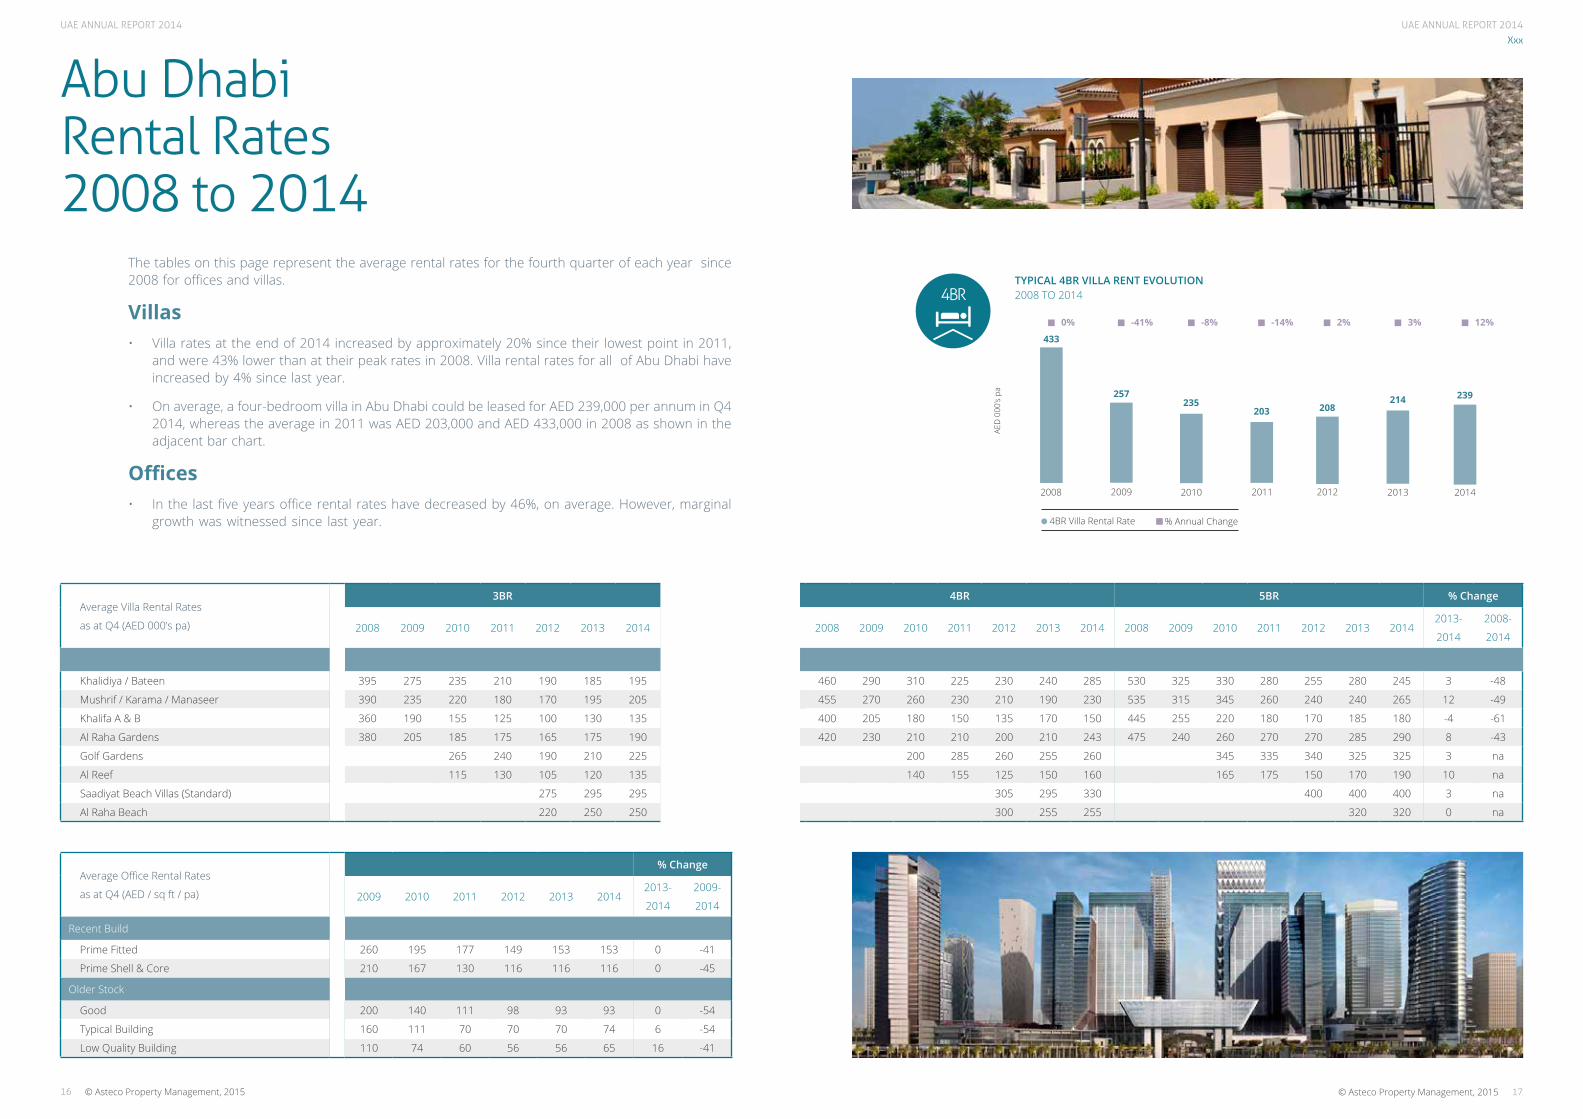
The tables on this page represent the average rental rates for the fourth quarter of each year since 2008 for offices and villas.
Villas• Villa rates at the end of 2014 increased by approximately 20% since their lowest point in 2011,
and were 43% lower than at their peak rates in 2008. Villa rental rates for all of Abu Dhabi have increased by 4% since last year.
• On average, a four-bedroom villa in Abu Dhabi could be leased for AED 239,000 per annum in Q4 2014, whereas the average in 2011 was AED 203,000 and AED 433,000 in 2008 as shown in the adjacent bar chart.
Offices• In the last five years office rental rates have decreased by 46%, on average. However, marginal
growth was witnessed since last year.
Average Villa Rental Rates
as at Q4 (AED 000’s pa)
3BR 4BR 5BR % Change
2008 2009 2010 2011 2012 2013 2014 2008 2009 2010 2011 2012 2013 2014 2008 2009 2010 2011 2012 2013 20142013-
2014
2008-
2014
Khalidiya / Bateen 395 275 235 210 190 185 195 460 290 310 225 230 240 285 530 325 330 280 255 280 245 3 -48
Mushrif / Karama / Manaseer 390 235 220 180 170 195 205 455 270 260 230 210 190 230 535 315 345 260 240 240 265 12 -49
Khalifa A & B 360 190 155 125 100 130 135 400 205 180 150 135 170 150 445 255 220 180 170 185 180 -4 -61
Al Raha Gardens 380 205 185 175 165 175 190 420 230 210 210 200 210 243 475 240 260 270 270 285 290 8 -43
Golf Gardens 265 240 190 210 225 200 285 260 255 260 345 335 340 325 325 3 na
Al Reef 115 130 105 120 135 140 155 125 150 160 165 175 150 170 190 10 na
Saadiyat Beach Villas (Standard) 275 295 295 305 295 330 400 400 400 3 na
Al Raha Beach 220 250 250 300 255 255 320 320 0 na
Average Office Rental Rates
as at Q4 (AED / sq ft / pa)
% Change
2009 2010 2011 2012 2013 20142013-
2014
2009-
2014
Recent Build
Prime Fitted 260 195 177 149 153 153 0 -41
Prime Shell & Core 210 167 130 116 116 116 0 -45
Older Stock
Good 200 140 111 98 93 93 0 -54
Typical Building 160 111 70 70 70 74 6 -54
Low Quality Building 110 74 60 56 56 65 16 -41
UAE ANNUAL REPORT 2014UAE ANNUAL REPORT 2014
Abu Dhabi
Abu Dhabi Sales Prices 2008 to 2014
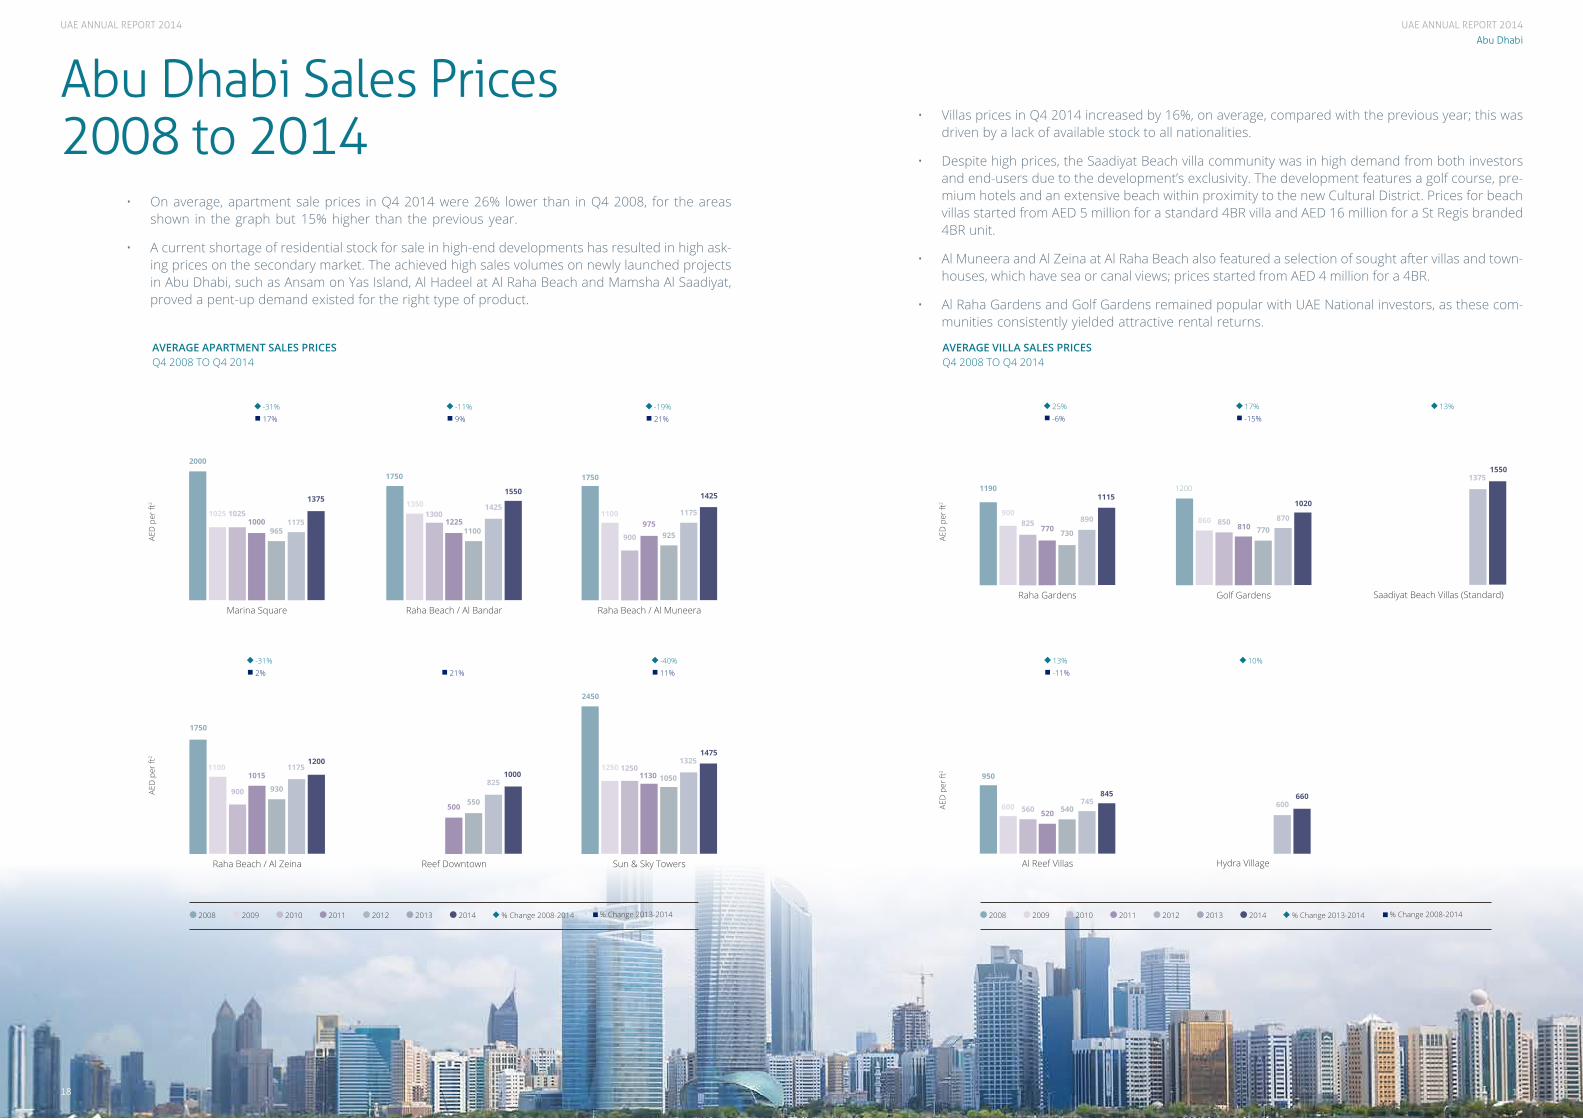
• Villas prices in Q4 2014 increased by 16%, on average, compared with the previous year; this was driven by a lack of available stock to all nationalities.
• Despite high prices, the Saadiyat Beach villa community was in high demand from both investors and end-users due to the development’s exclusivity. The development features a golf course, pre-mium hotels and an extensive beach within proximity to the new Cultural District. Prices for beach villas started from AED 5 million for a standard 4BR villa and AED 16 million for a St Regis branded 4BR unit.
• Al Muneera and Al Zeina at Al Raha Beach also featured a selection of sought after villas and town-houses, which have sea or canal views; prices started from AED 4 million for a 4BR.
• Al Raha Gardens and Golf Gardens remained popular with UAE National investors, as these com-munities consistently yielded attractive rental returns.
• On average, apartment sale prices in Q4 2014 were 26% lower than in Q4 2008, for the areas shown in the graph but 15% higher than the previous year.
• A current shortage of residential stock for sale in high-end developments has resulted in high ask-ing prices on the secondary market. The achieved high sales volumes on newly launched projects in Abu Dhabi, such as Ansam on Yas Island, Al Hadeel at Al Raha Beach and Mamsha Al Saadiyat, proved a pent-up demand existed for the right type of product.
2008 2008 2009 2009 2010 2010 2011 2011 2012 2012 2013 2013 2014 2014
AED
per
ft2
AED
per
ft2
AED
per
ft2
AED
per
ft2
2000
Marina Square
1025 10251000
9651175
1375
Reef Downtown
500 550
8251000
2450
Sun & Sky Towers
12501130 1050
13251475
1750
Raha Beach / Al Bandar
1350
12251100
1425
1550
1300
1750
Raha Beach / Al Muneera
1100975
925
1175
1425
900
1750
Raha Beach / Al Zeina
11001015
930
11751200
900
1250
1190
Raha Gardens
900
770 730
890
1115
25%-31%
-31%
-6%17%
2%
17% 13%-11%-15%9%
21%13% 10%
-19%
-40%-11%
21%
11%
Saadiyat Beach Villas (Standard)
13751550
Hydra Village
600660
825
1200
Golf Gardens
860810 770
870
1020
850
AVERAGE APARTMENT SALES PRICES Q4 2008 TO Q4 2014
AVERAGE VILLA SALES PRICES Q4 2008 TO Q4 2014
950
Al Reef Villas
600520 540
745845
560
% Change 2008-2014 % Change 2013-2014 % Change 2013-2014 % Change 2008-2014
18 19
UAE ANNUAL REPORT 2014
2120
UAE ANNUAL REPORT 2014
© Asteco Property Management, 2015© Asteco Property Management, 2015
Abu Dhabi
Abu Dhabi Area & Rent Affordability Map
Arabian Gulf 11
33
2211
14
11
17
132
22
31
25
19
33
34
32
36
35
37
29
15
18
28
24
6
12
4
26
2320
8
1
7
10 9
5
30
27
16
3
21
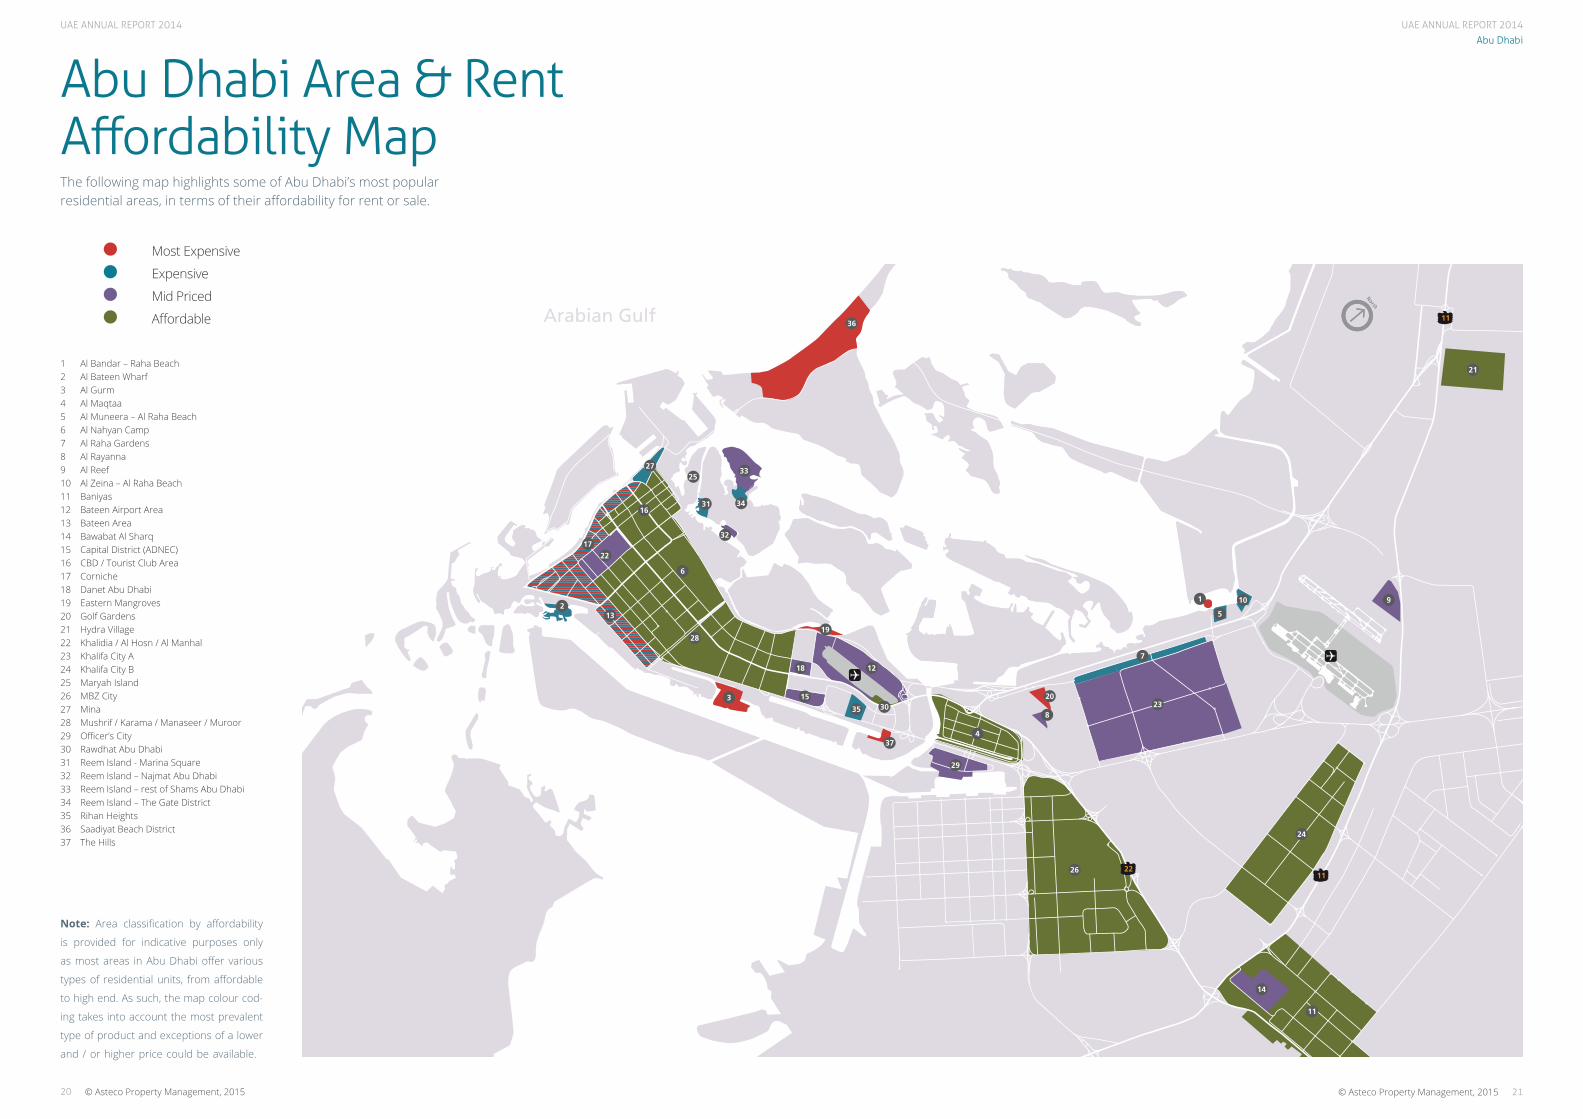
Most Expensive
Expensive
Mid Priced
Affordable
1 Al Bandar – Raha Beach2 Al Bateen Wharf3 Al Gurm4 Al Maqtaa5 Al Muneera – Al Raha Beach6 Al Nahyan Camp7 Al Raha Gardens8 Al Rayanna9 Al Reef10 Al Zeina – Al Raha Beach11 Baniyas12 Bateen Airport Area13 Bateen Area14 Bawabat Al Sharq15 Capital District (ADNEC)16 CBD / Tourist Club Area17 Corniche 18 Danet Abu Dhabi19 Eastern Mangroves20 Golf Gardens21 Hydra Village22 Khalidia / Al Hosn / Al Manhal23 Khalifa City A24 Khalifa City B25 Maryah Island26 MBZ City27 Mina28 Mushrif / Karama / Manaseer / Muroor29 Officer’s City30 Rawdhat Abu Dhabi31 Reem Island - Marina Square32 Reem Island – Najmat Abu Dhabi33 Reem Island – rest of Shams Abu Dhabi34 Reem Island – The Gate District35 Rihan Heights36 Saadiyat Beach District37 The Hills
The following map highlights some of Abu Dhabi’s most popular residential areas, in terms of their affordability for rent or sale.
Note: Area classification by affordability
is provided for indicative purposes only
as most areas in Abu Dhabi offer various
types of residential units, from affordable
to high end. As such, the map colour cod-
ing takes into account the most prevalent
type of product and exceptions of a lower
and / or higher price could be available.
UAE ANNUAL REPORT 2014
2322 © Asteco Property Management, 2015© Asteco Property Management, 2015
Dubai
22
Dubai 2014 Highlights
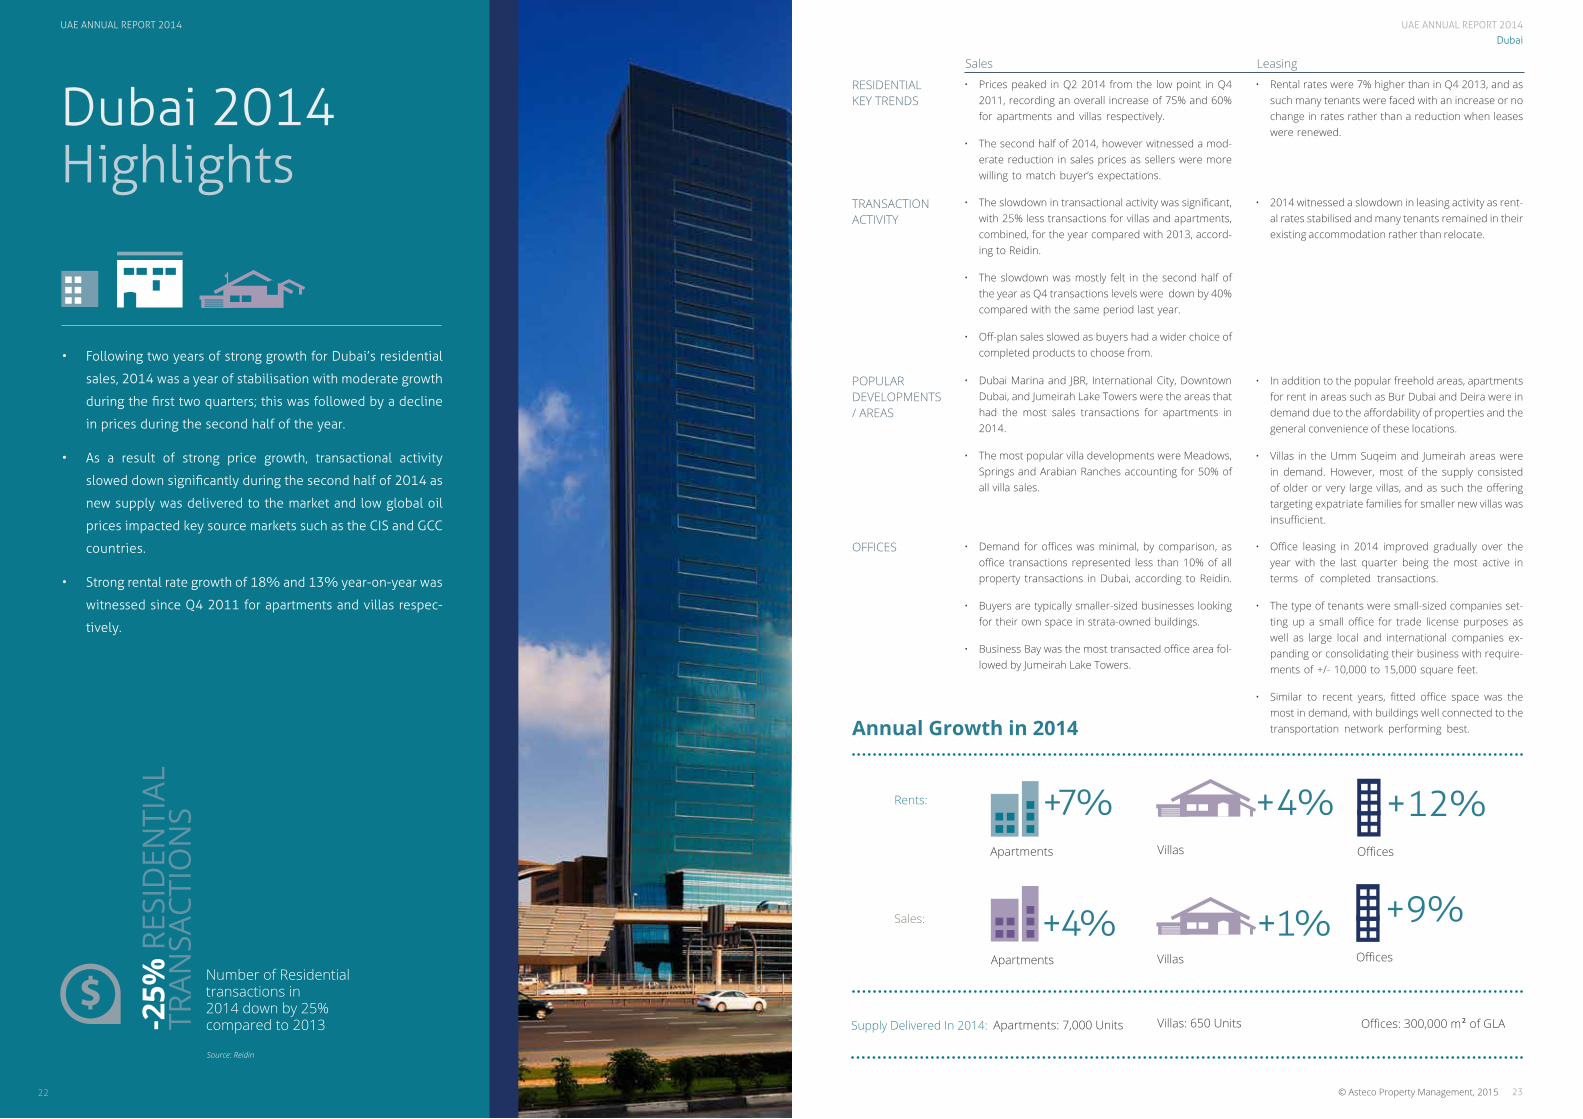
• Following two years of strong growth for Dubai’s residential
sales, 2014 was a year of stabilisation with moderate growth
during the first two quarters; this was followed by a decline
in prices during the second half of the year.
• As a result of strong price growth, transactional activity
slowed down significantly during the second half of 2014 as
new supply was delivered to the market and low global oil
prices impacted key source markets such as the CIS and GCC
countries.
• Strong rental rate growth of 18% and 13% year-on-year was
witnessed since Q4 2011 for apartments and villas respec-
tively.
Number of Residential transactions in 2014 down by 25% compared to 2013-2
5% R
ESID
ENTI
ALTR
ANSA
CTIO
NS
Source: Reidin
Supply Delivered In 2014:
RESIDENTIAL KEY TRENDS
TRANSACTION ACTIVITY
POPULAR DEVELOPMENTS / AREAS
OFFICES • Demand for offices was minimal, by comparison, as office transactions represented less than 10% of all property transactions in Dubai, according to Reidin.
• Buyers are typically smaller-sized businesses looking for their own space in strata-owned buildings.
• Business Bay was the most transacted office area fol-lowed by Jumeirah Lake Towers.
• Dubai Marina and JBR, International City, Downtown Dubai, and Jumeirah Lake Towers were the areas that had the most sales transactions for apartments in 2014.
• The most popular villa developments were Meadows, Springs and Arabian Ranches accounting for 50% of all villa sales.
• The slowdown in transactional activity was significant, with 25% less transactions for villas and apartments, combined, for the year compared with 2013, accord-ing to Reidin.
• The slowdown was mostly felt in the second half of the year as Q4 transactions levels were down by 40% compared with the same period last year.
• Off-plan sales slowed as buyers had a wider choice of completed products to choose from.
• Prices peaked in Q2 2014 from the low point in Q4 2011, recording an overall increase of 75% and 60% for apartments and villas respectively.
• The second half of 2014, however witnessed a mod-erate reduction in sales prices as sellers were more willing to match buyer’s expectations.
• Office leasing in 2014 improved gradually over the year with the last quarter being the most active in terms of completed transactions.
• The type of tenants were small-sized companies set-ting up a small office for trade license purposes as well as large local and international companies ex-panding or consolidating their business with require-ments of +/- 10,000 to 15,000 square feet.
• Similar to recent years, fitted office space was the most in demand, with buildings well connected to the transportation network performing best.
• In addition to the popular freehold areas, apartments for rent in areas such as Bur Dubai and Deira were in demand due to the affordability of properties and the general convenience of these locations.
• Villas in the Umm Suqeim and Jumeirah areas were in demand. However, most of the supply consisted of older or very large villas, and as such the offering targeting expatriate families for smaller new villas was insufficient.
• 2014 witnessed a slowdown in leasing activity as rent-al rates stabilised and many tenants remained in their existing accommodation rather than relocate.
• Rental rates were 7% higher than in Q4 2013, and as such many tenants were faced with an increase or no change in rates rather than a reduction when leases were renewed.
Sales Leasing
Apartments
+7%Villas
+4%Offices
+12%
Apartments
+4%Villas
+1%
Rents:
Sales:
Offices
+9%
Villas: 650 Units Offices: 300,000 m2 of GLA Apartments: 7,000 Units
Annual Growth in 2014
UAE ANNUAL REPORT 2014
UAE ANNUAL REPORT 2014
Xxx
24
UAE ANNUAL REPORT 2014
© Asteco Property Management, 2015© Asteco Property Management, 201524
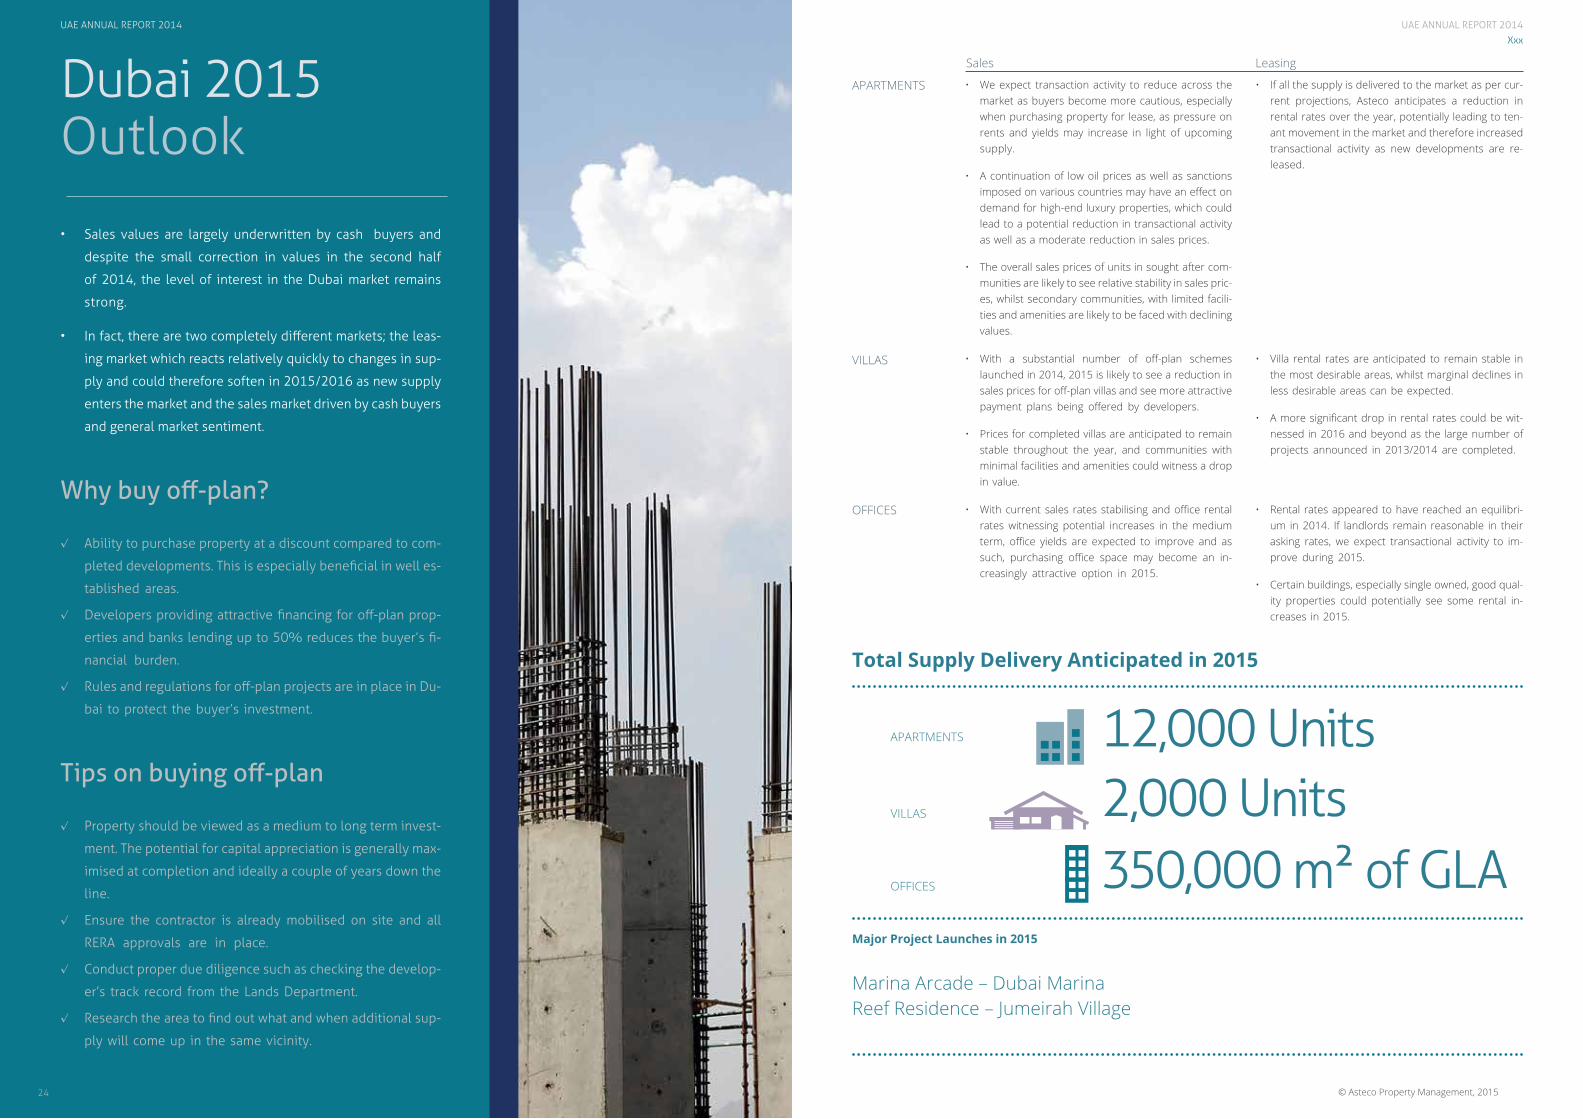
OFFICES • With current sales rates stabilising and office rental rates witnessing potential increases in the medium term, office yields are expected to improve and as such, purchasing office space may become an in-creasingly attractive option in 2015.
• Rental rates appeared to have reached an equilibri-um in 2014. If landlords remain reasonable in their asking rates, we expect transactional activity to im-prove during 2015.
• Certain buildings, especially single owned, good qual-ity properties could potentially see some rental in-creases in 2015.
VILLAS • With a substantial number of off-plan schemes launched in 2014, 2015 is likely to see a reduction in sales prices for off-plan villas and see more attractive payment plans being offered by developers.
• Prices for completed villas are anticipated to remain stable throughout the year, and communities with minimal facilities and amenities could witness a drop in value.
• Villa rental rates are anticipated to remain stable in the most desirable areas, whilst marginal declines in less desirable areas can be expected.
• A more significant drop in rental rates could be wit-nessed in 2016 and beyond as the large number of projects announced in 2013/2014 are completed.
APARTMENTS • We expect transaction activity to reduce across the market as buyers become more cautious, especially when purchasing property for lease, as pressure on rents and yields may increase in light of upcoming supply.
• A continuation of low oil prices as well as sanctions imposed on various countries may have an effect on demand for high-end luxury properties, which could lead to a potential reduction in transactional activity as well as a moderate reduction in sales prices.
• The overall sales prices of units in sought after com-munities are likely to see relative stability in sales pric-es, whilst secondary communities, with limited facili-ties and amenities are likely to be faced with declining values.
• If all the supply is delivered to the market as per cur-rent projections, Asteco anticipates a reduction in rental rates over the year, potentially leading to ten-ant movement in the market and therefore increased transactional activity as new developments are re-leased.
Major Project Launches in 2015
Marina Arcade – Dubai MarinaReef Residence – Jumeirah Village
12,000 Units2,000 Units350,000 m2 of GLA
APARTMENTS
VILLAS
OFFICES
Sales Leasing
Total Supply Delivery Anticipated in 2015
Dubai 2015 Outlook
• Sales values are largely underwritten by cash buyers and
despite the small correction in values in the second half
of 2014, the level of interest in the Dubai market remains
strong.
• In fact, there are two completely different markets; the leas-
ing market which reacts relatively quickly to changes in sup-
ply and could therefore soften in 2015/2016 as new supply
enters the market and the sales market driven by cash buyers
and general market sentiment.
Why buy off-plan?
⎷ Ability to purchase property at a discount compared to com-
pleted developments. This is especially beneficial in well es-
tablished areas.
⎷ Developers providing attractive financing for off-plan prop-
erties and banks lending up to 50% reduces the buyer’s fi-
nancial burden.
⎷ Rules and regulations for off-plan projects are in place in Du-
bai to protect the buyer’s investment.
Tips on buying off-plan
⎷ Property should be viewed as a medium to long term invest-
ment. The potential for capital appreciation is generally max-
imised at completion and ideally a couple of years down the
line.
⎷ Ensure the contractor is already mobilised on site and all
RERA approvals are in place.
⎷ Conduct proper due diligence such as checking the develop-
er’s track record from the Lands Department.
⎷ Research the area to find out what and when additional sup-
ply will come up in the same vicinity.
UAE ANNUAL REPORT 2014

UAE ANNUAL REPORT 2014
2726
UAE ANNUAL REPORT 2014
© Asteco Property Management, 2015© Asteco Property Management, 2015
Dubai
Dubai Rental Rates 2008 to 2014
TYPICAL 2BR APARTMENT RENT EVOLUTION2008 TO 2014
158
99 87 72 84
114122
2008 2009 2010 2011
2BR Apartment Rental Rate % Annual Change
20142012 2013
2BR
AED
000
’s pa
Apartments
• The table below provides average rental rates for the fourth quarter of every year from 2008 to 2014 for a selection of apartment areas.
• Apartment rental rates increased by 65% since 2011 but are still 25% lower than 2008. Rental rates are 6% higher, on average, compared with last year.
• Asteco believes that the rapid growth witnessed from 2011 onwards, and especially during 2013, led to rental rates peaking. Going forward, any further increases will make many areas unafforda-ble to their target market leading to decreased demand and tenant outflow.
• Furthermore, any new projects that are due for delivery in the next 12 to 18 months will result in a softening of rental rates throughout 2015.
• On average, a 2-bedroom apartment for all Dubai areas combined, leased for AED 122,000 per an-num in Q4 2014, whereas the average in 2011 was AED 72,000 and AED 158,000 in 2008 as shown in the adjacent bar chart.
0% -37% -12% -17% 17% 36% 7%
Average Apartment Rental Rates
as at Q4 (AED 000’s pa)
1BR 2BR 3BR % Change
2008 2009 2010 2011 2012 2013 2014 2008 2009 2010 2011 2012 2013 2014 2008 2009 2010 2011 2012 2013 20142013-
2014
2008-
2014
Business Bay 55 45 60 90 93 85 70 85 130 135 115 100 125 178 180 3
Deira 88 48 40 37 35 68 65 103 55 55 53 53 85 90 138 83 75 70 75 135 133 0 -12
Discovery Gardens 100 58 45 38 45 70 70 135 85 70 53 70 83 80 -2 -36
Downtown Dubai 133 85 70 68 80 98 118 185 120 100 100 125 160 170 275 165 150 150 180 228 245 10 -10
Dubai Marina 130 78 63 63 75 105 113 180 110 90 80 100 140 158 245 160 125 115 135 178 210 14 -14
Greens 120 65 58 55 65 85 83 160 88 78 75 100 135 148 180 130 115 105 130 155 173 7 -13
International City 70 44 27 23 24 43 46 93 63 39 38 38 65 63 1 -33
Jumeirah Beach Residence 115 85 73 70 80 108 118 168 118 95 90 100 135 163 203 148 115 110 140 175 200 15 -1
Jumeirah Lakes Towers 110 65 50 45 55 83 90 160 85 65 65 75 110 133 210 118 85 85 100 148 168 15 -19
Jumeirah Village 35 45 70 65 53 70 95 103 80 90 120 130 4
Palm Jumeirah 200 113 90 90 95 135 150 228 145 120 120 140 175 208 300 200 170 170 190 223 243 13 -18
Sheikh Zayed Road 160 83 70 68 83 98 113 203 130 105 100 110 148 148 290 175 120 120 135 195 200 5 -30
UAE ANNUAL REPORT 2014
2928
UAE ANNUAL REPORT 2014
© Asteco Property Management, 2015© Asteco Property Management, 2015
Dubai
Dubai Rental Rates 2008 to 2014
2008 2009 2010 2011
4BR Villa Rental Rate
20142012 2013
4BRTYPICAL 4BR VILLA RENT EVOLUTION 2008 TO 2014
AED
000
’s pa
% Annual Change
0% -38% -9% 0% 19% 14% 5%
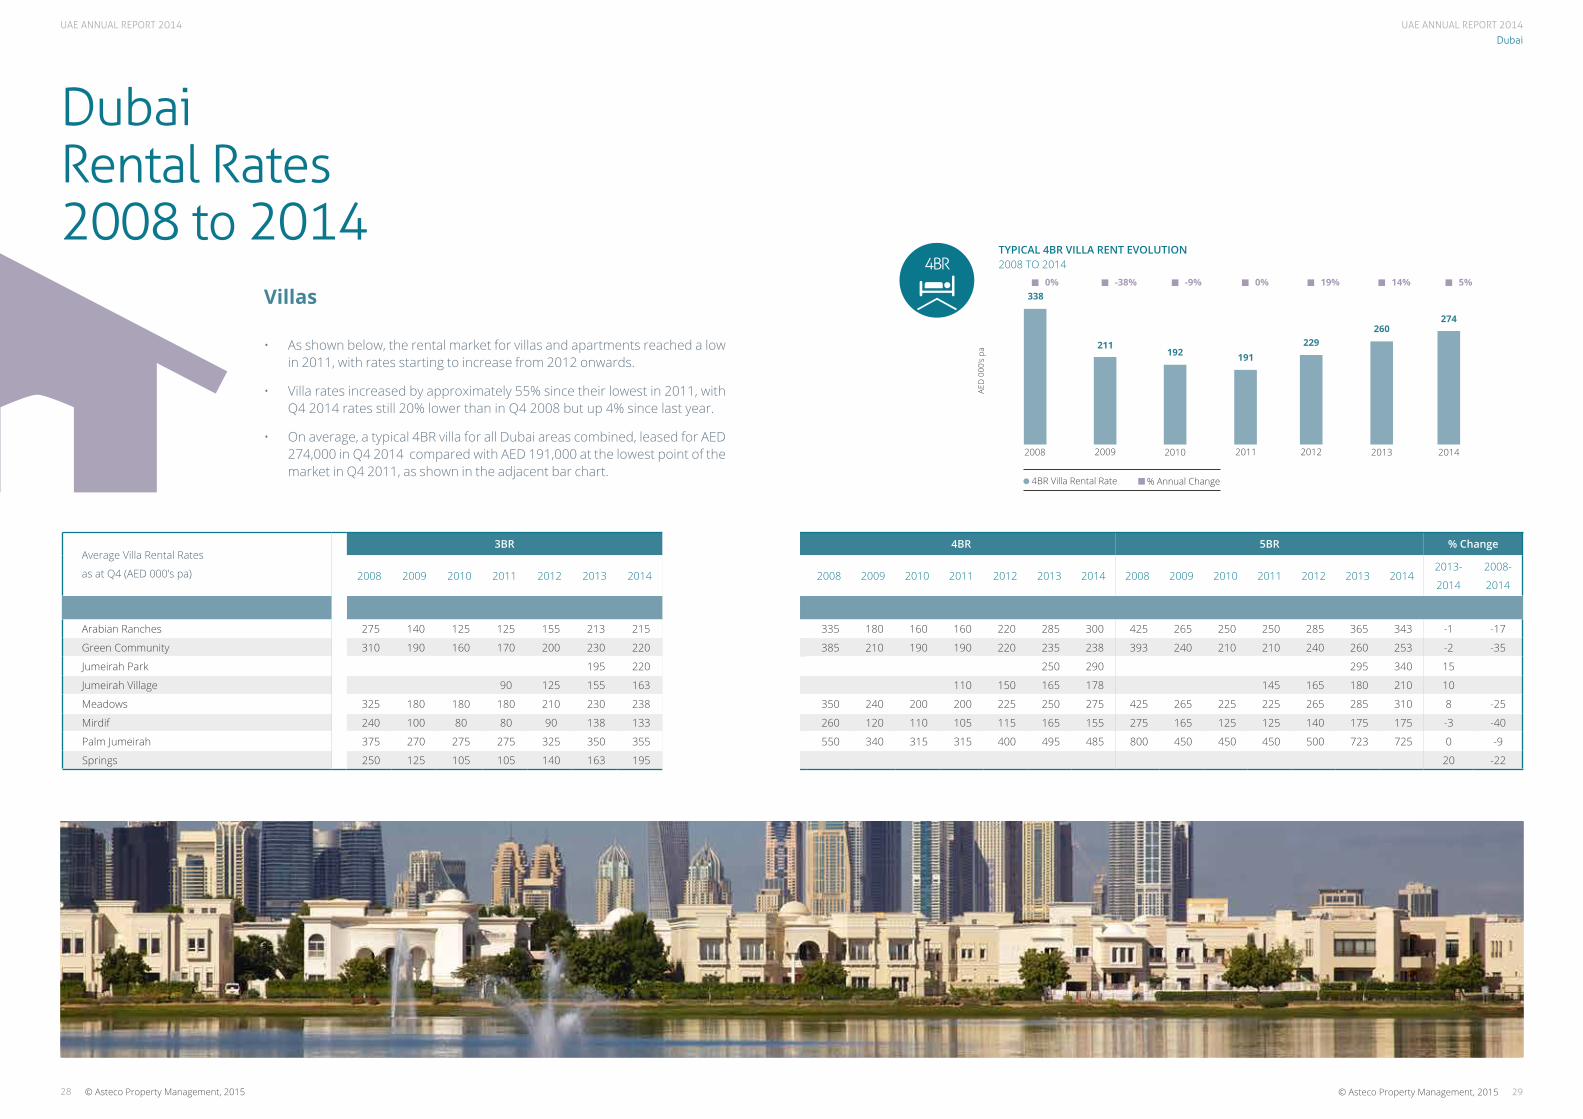
Villas
• As shown below, the rental market for villas and apartments reached a low in 2011, with rates starting to increase from 2012 onwards.
• Villa rates increased by approximately 55% since their lowest in 2011, with Q4 2014 rates still 20% lower than in Q4 2008 but up 4% since last year.
• On average, a typical 4BR villa for all Dubai areas combined, leased for AED 274,000 in Q4 2014 compared with AED 191,000 at the lowest point of the market in Q4 2011, as shown in the adjacent bar chart.
Average Villa Rental Rates
as at Q4 (AED 000’s pa)
3BR 4BR 5BR % Change
2008 2009 2010 2011 2012 2013 2014 2008 2009 2010 2011 2012 2013 2014 2008 2009 2010 2011 2012 2013 20142013-
2014
2008-
2014
Arabian Ranches 275 140 125 125 155 213 215 335 180 160 160 220 285 300 425 265 250 250 285 365 343 -1 -17
Green Community 310 190 160 170 200 230 220 385 210 190 190 220 235 238 393 240 210 210 240 260 253 -2 -35
Jumeirah Park 195 220 250 290 295 340 15
Jumeirah Village 90 125 155 163 110 150 165 178 145 165 180 210 10
Meadows 325 180 180 180 210 230 238 350 240 200 200 225 250 275 425 265 225 225 265 285 310 8 -25
Mirdif 240 100 80 80 90 138 133 260 120 110 105 115 165 155 275 165 125 125 140 175 175 -3 -40
Palm Jumeirah 375 270 275 275 325 350 355 550 340 315 315 400 495 485 800 450 450 450 500 723 725 0 -9
Springs 250 125 105 105 140 163 195 20 -22
338
211192 191
229260
274
UAE ANNUAL REPORT 2014UAE ANNUAL REPORT 2014
© Asteco Property Management, 2015© Asteco Property Management, 2015
Dubai
Dubai Office MarketSales Prices & Rental Rates 2008 to 2014
© Asteco Property Management, 2015 31
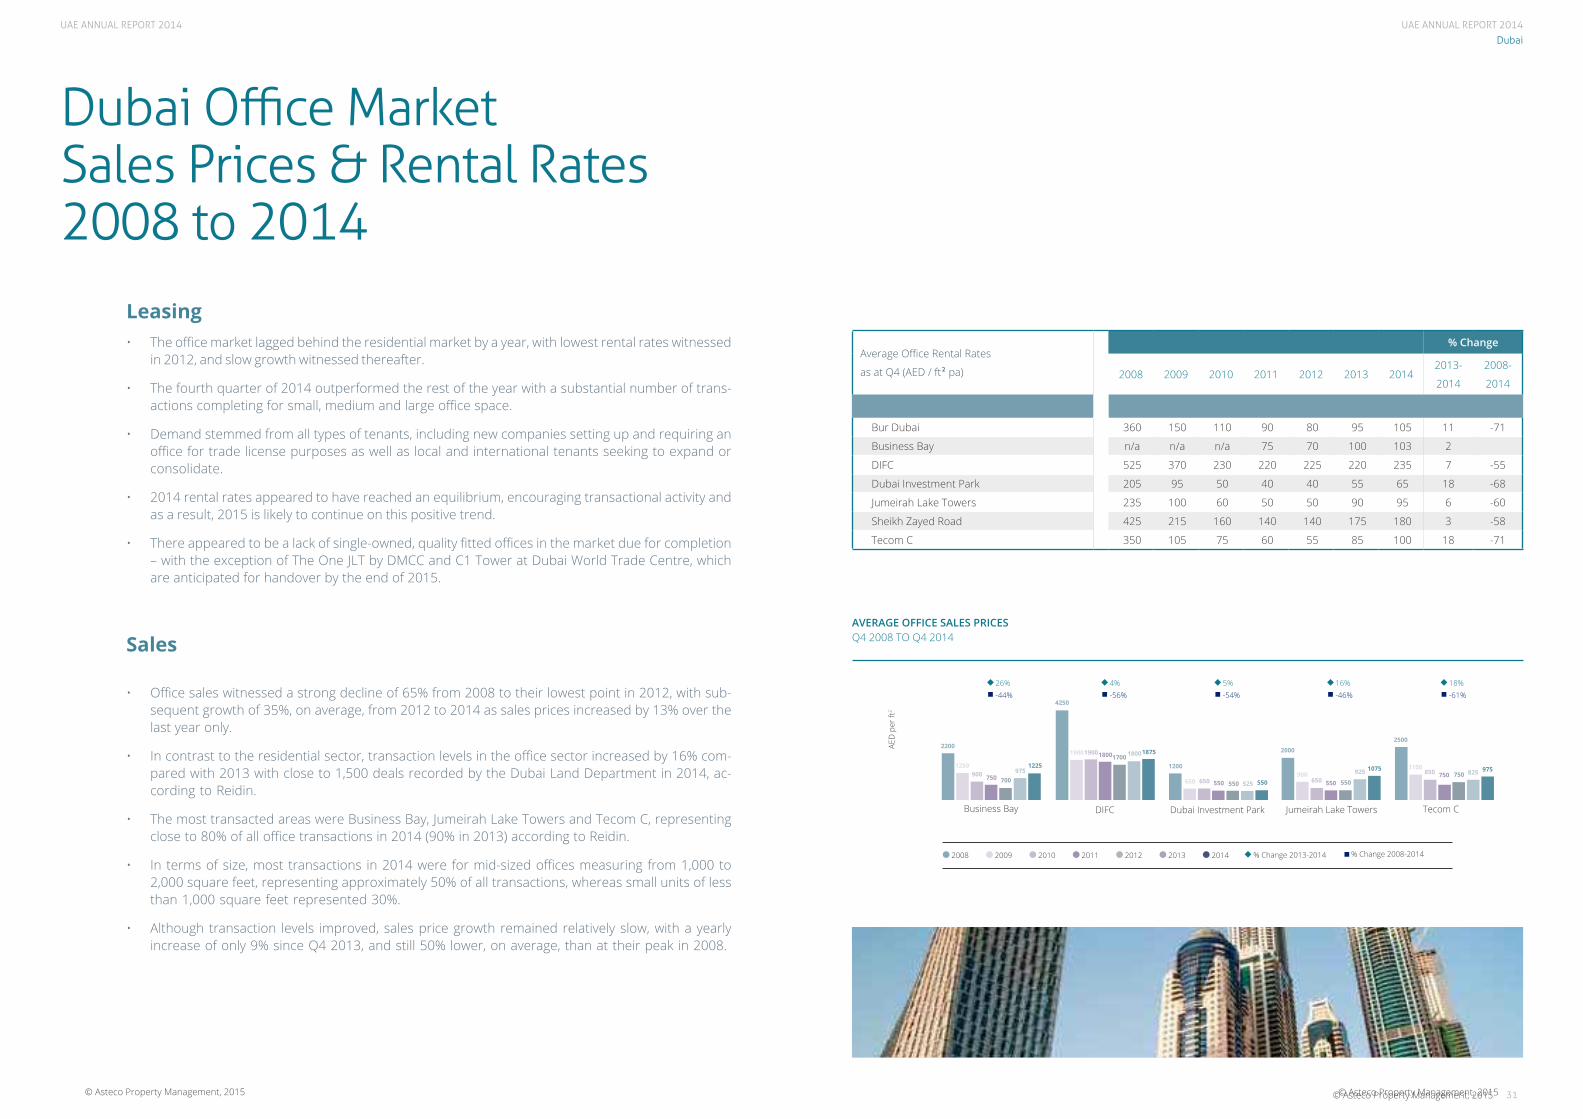
Leasing• The office market lagged behind the residential market by a year, with lowest rental rates witnessed
in 2012, and slow growth witnessed thereafter.
• The fourth quarter of 2014 outperformed the rest of the year with a substantial number of trans-actions completing for small, medium and large office space.
• Demand stemmed from all types of tenants, including new companies setting up and requiring an office for trade license purposes as well as local and international tenants seeking to expand or consolidate.
• 2014 rental rates appeared to have reached an equilibrium, encouraging transactional activity and as a result, 2015 is likely to continue on this positive trend.
• There appeared to be a lack of single-owned, quality fitted offices in the market due for completion – with the exception of The One JLT by DMCC and C1 Tower at Dubai World Trade Centre, which are anticipated for handover by the end of 2015.
Sales
• Office sales witnessed a strong decline of 65% from 2008 to their lowest point in 2012, with sub-sequent growth of 35%, on average, from 2012 to 2014 as sales prices increased by 13% over the last year only.
• In contrast to the residential sector, transaction levels in the office sector increased by 16% com-pared with 2013 with close to 1,500 deals recorded by the Dubai Land Department in 2014, ac-cording to Reidin.
• The most transacted areas were Business Bay, Jumeirah Lake Towers and Tecom C, representing close to 80% of all office transactions in 2014 (90% in 2013) according to Reidin.
• In terms of size, most transactions in 2014 were for mid-sized offices measuring from 1,000 to 2,000 square feet, representing approximately 50% of all transactions, whereas small units of less than 1,000 square feet represented 30%.
• Although transaction levels improved, sales price growth remained relatively slow, with a yearly increase of only 9% since Q4 2013, and still 50% lower, on average, than at their peak in 2008.
Average Office Rental Rates
as at Q4 (AED / ft2 pa)
% Change
2008 2009 2010 2011 2012 2013 20142013-
2014
2008-
2014
Bur Dubai 360 150 110 90 80 95 105 11 -71
Business Bay n/a n/a n/a 75 70 100 103 2
DIFC 525 370 230 220 225 220 235 7 -55
Dubai Investment Park 205 95 50 40 40 55 65 18 -68
Jumeirah Lake Towers 235 100 60 50 50 90 95 6 -60
Sheikh Zayed Road 425 215 160 140 140 175 180 3 -58
Tecom C 350 105 75 60 55 85 100 18 -71
AVERAGE OFFICE SALES PRICESQ4 2008 TO Q4 2014
AED
per
ft2
2008 2009 2010 2011 2012 2013 2014 % Change 2013-2014 % Change 2008-2014
2200
4250
1200
2000
2500
1250
1900
650900
1100900
1900
650 650850
750
1800
550 550750
700
1700
550 550750975
1800
525
925 8251225
1875
550
1075 975
26% 4% 5% 16% 18%-44% -56% -54% -46% -61%
Business Bay DIFC Dubai Investment Park Jumeirah Lake Towers Tecom C
UAE ANNUAL REPORT 2014UAE ANNUAL REPORT 2014
Dubai
Dubai Sales Prices 2008 to 2014
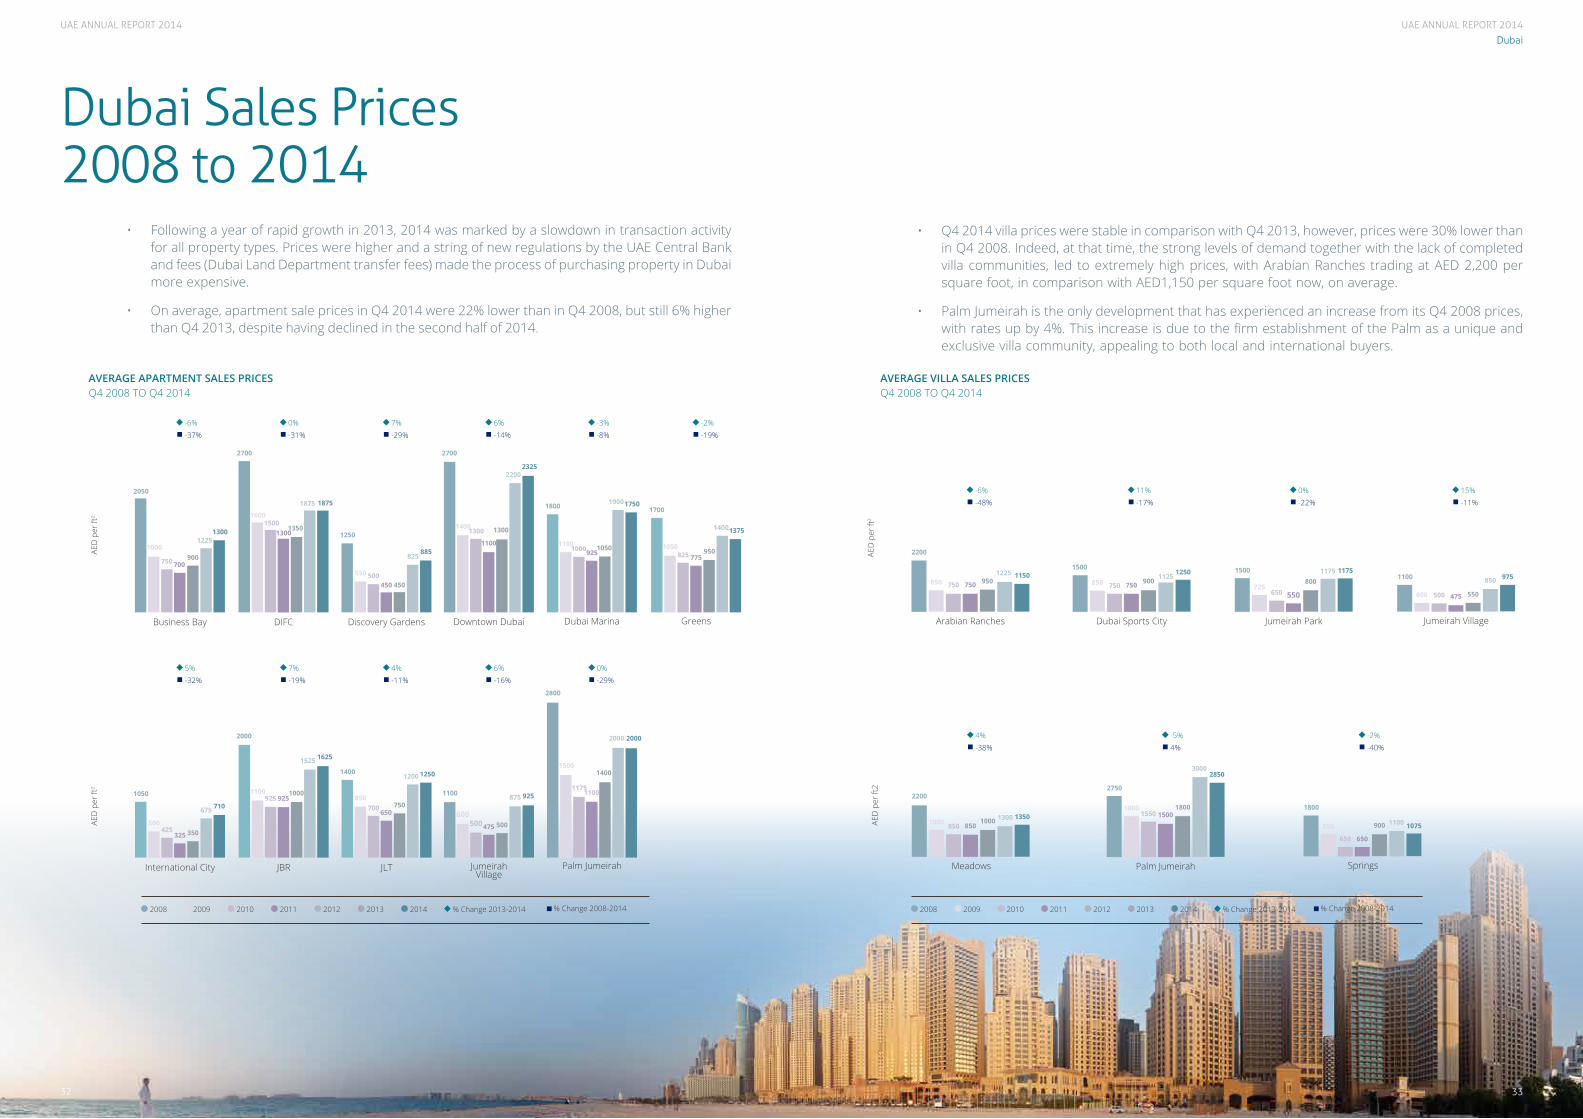
• Q4 2014 villa prices were stable in comparison with Q4 2013, however, prices were 30% lower than in Q4 2008. Indeed, at that time, the strong levels of demand together with the lack of completed villa communities, led to extremely high prices, with Arabian Ranches trading at AED 2,200 per square foot, in comparison with AED1,150 per square foot now, on average.
• Palm Jumeirah is the only development that has experienced an increase from its Q4 2008 prices, with rates up by 4%. This increase is due to the firm establishment of the Palm as a unique and exclusive villa community, appealing to both local and international buyers.
• Following a year of rapid growth in 2013, 2014 was marked by a slowdown in transaction activity for all property types. Prices were higher and a string of new regulations by the UAE Central Bank and fees (Dubai Land Department transfer fees) made the process of purchasing property in Dubai more expensive.
• On average, apartment sale prices in Q4 2014 were 22% lower than in Q4 2008, but still 6% higher than Q4 2013, despite having declined in the second half of 2014.
2008 2008 2009 2009 2010 2010 2011 2011 2012 2012 2013 2013 2014 2014
AED
per
ft2
AVERAGE APARTMENT SALES PRICES Q4 2008 TO Q4 2014
AVERAGE VILLA SALES PRICES Q4 2008 TO Q4 2014
% Change 2013-2014 % Change 2013-2014 % Change 2008-2014 % Change 2008-2014
1050
International City
500
325 350
675 710
425
JBR
2000
1100925
1000
1525 1625
925
JLT
1400
850
650750
1200 1250
700
JumeirahVillage
1100
600475 500
875 925
500
Palm Jumeirah
2800
1500
1100
1400
2000 2000
1175
0%6%4%7%5%-29%-16%-11%-19%-32%
AED
per
ft2
AED
per
ft2
2050
Business Bay
1000
700900
12251300
750
DIFC
2700
1600
13001350
1875 1875
1500
Discovery Gardens
1250
550
450 450
825885
500
Downtown Dubai
2700
1400
1100
1300
22002325
1300
Dubai Marina
1800
1100925
1050
19001750
1000
Greens
1700
1050775
950
14001375
825
-2%-3%6%7%0%-6%-19%-8%-14%-29%-31%-37%
AED
per
ft2
2200
Arabian Ranches
850 750 9501225 1150
Dubai Sports City
1500
850 750 9001250
1125750
Jumeirah Park
1500
725550
8001175 1175
650
Jumeirah Village
1100
600 475 550
850 975
500750
-6% 11% 0% 15%-48% -17% -22% -11%
Palm Jumeirah
2750
18001500
1800
30002850
1550
Springs
1800
850 900 1100 1075
650
Meadows
2200
1000 8501000 1300 1350
850
650
4% -5% -2%-38% 4% -40%
32 33
UAE ANNUAL REPORT 2014
3534
UAE ANNUAL REPORT 2014
© Asteco Property Management, 2015© Asteco Property Management, 2015
Dubai
Dubai Area & Rent Affordability Map
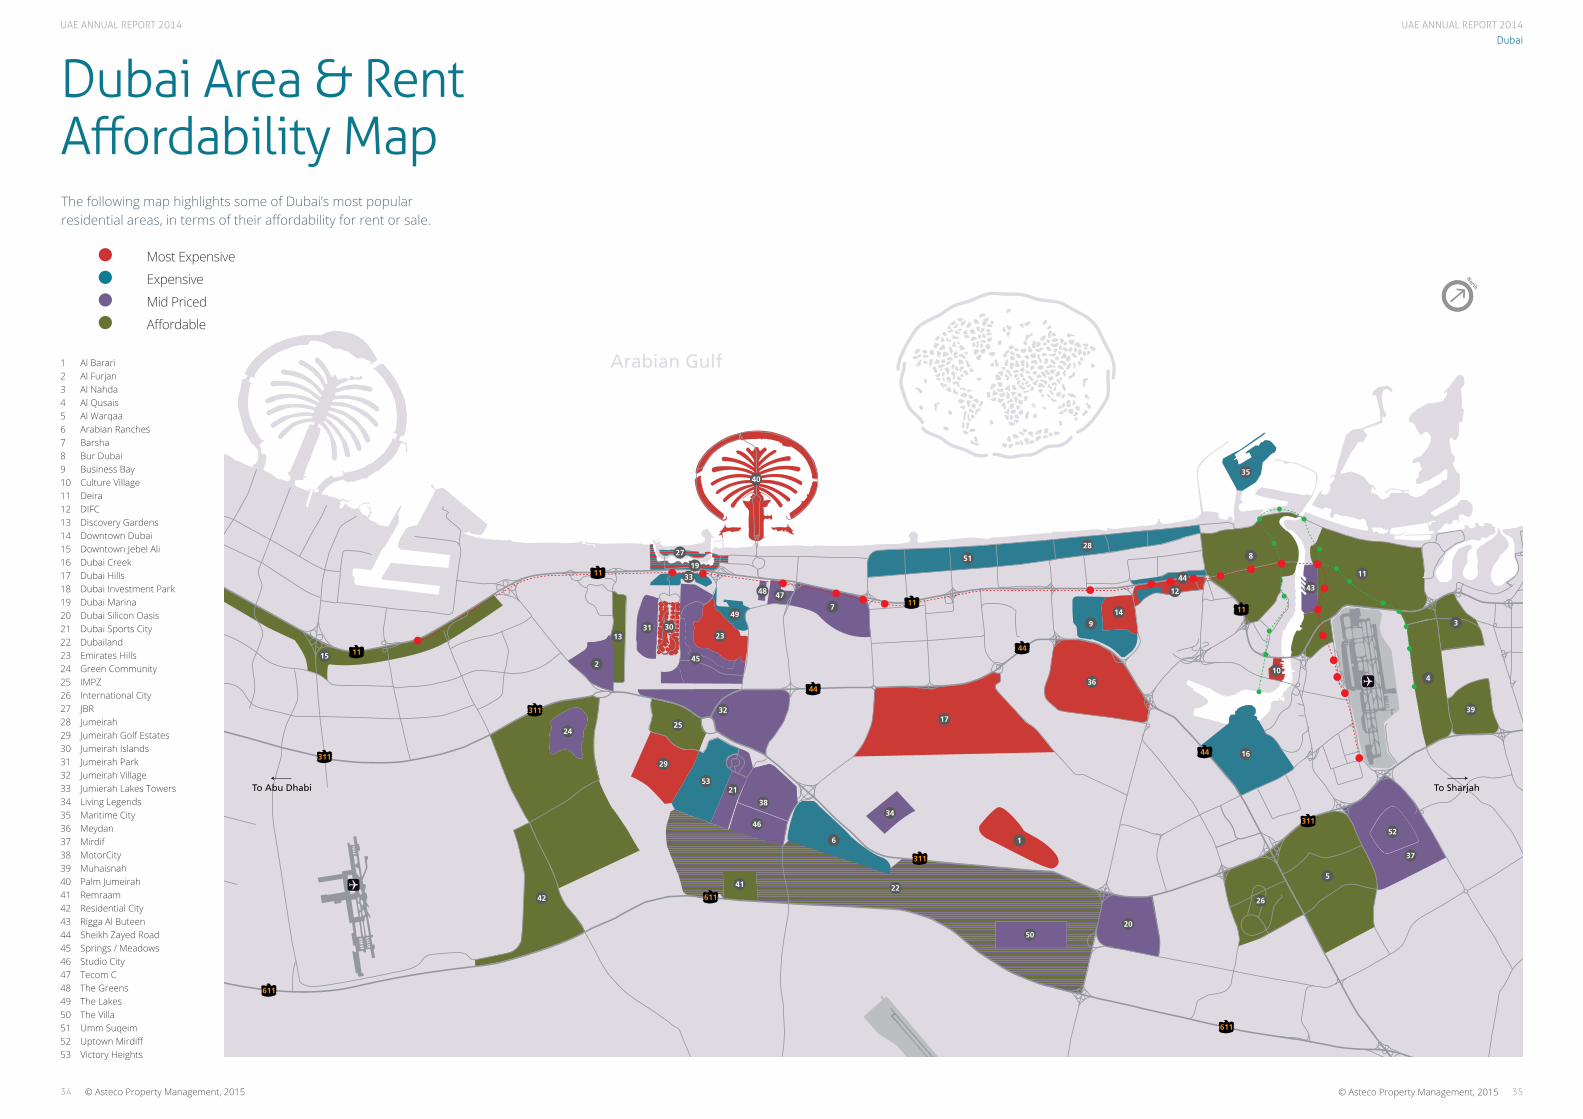
Most Expensive
Expensive
Mid Priced
Affordable
1 Al Barari2 Al Furjan3 Al Nahda4 Al Qusais5 Al Warqaa6 Arabian Ranches7 Barsha8 Bur Dubai9 Business Bay10 Culture Village11 Deira12 DIFC13 Discovery Gardens14 Downtown Dubai15 Downtown Jebel Ali16 Dubai Creek17 Dubai Hills18 Dubai Investment Park19 Dubai Marina20 Dubai Silicon Oasis21 Dubai Sports City22 Dubailand23 Emirates Hills24 Green Community25 IMPZ26 International City27 JBR28 Jumeirah29 Jumeirah Golf Estates30 Jumeirah Islands31 Jumeirah Park32 Jumeirah Village33 Jumierah Lakes Towers34 Living Legends35 Maritime City36 Meydan37 Mirdif38 MotorCity39 Muhaisnah40 Palm Jumeirah41 Remraam42 Residential City43 Rigga Al Buteen44 Sheikh Zayed Road45 Springs / Meadows46 Studio City47 Tecom C48 The Greens49 The Lakes50 The Villa51 Umm Suqeim52 Uptown Mirdiff53 Victory Heights
The following map highlights some of Dubai’s most popular residential areas, in terms of their affordability for rent or sale.
611
611
311
11
11
11
11
44
44
44
311
311
311
611
611
27
19
33
2
1331
7
51
24
15
29
42
2153
38
46
6
41
34
1
17
22
32
25
2050
26
52
37
40
48
23
49
45
30
47
14
36
9
288
35
12
44 11
43
3
4
5
39
10
16
To SharjahTo Abu Dhabi
Arabian Gulf
UAE ANNUAL REPORT 2014
3736 © Asteco Property Management, 2015© Asteco Property Management, 2015
Northern Emirates
36
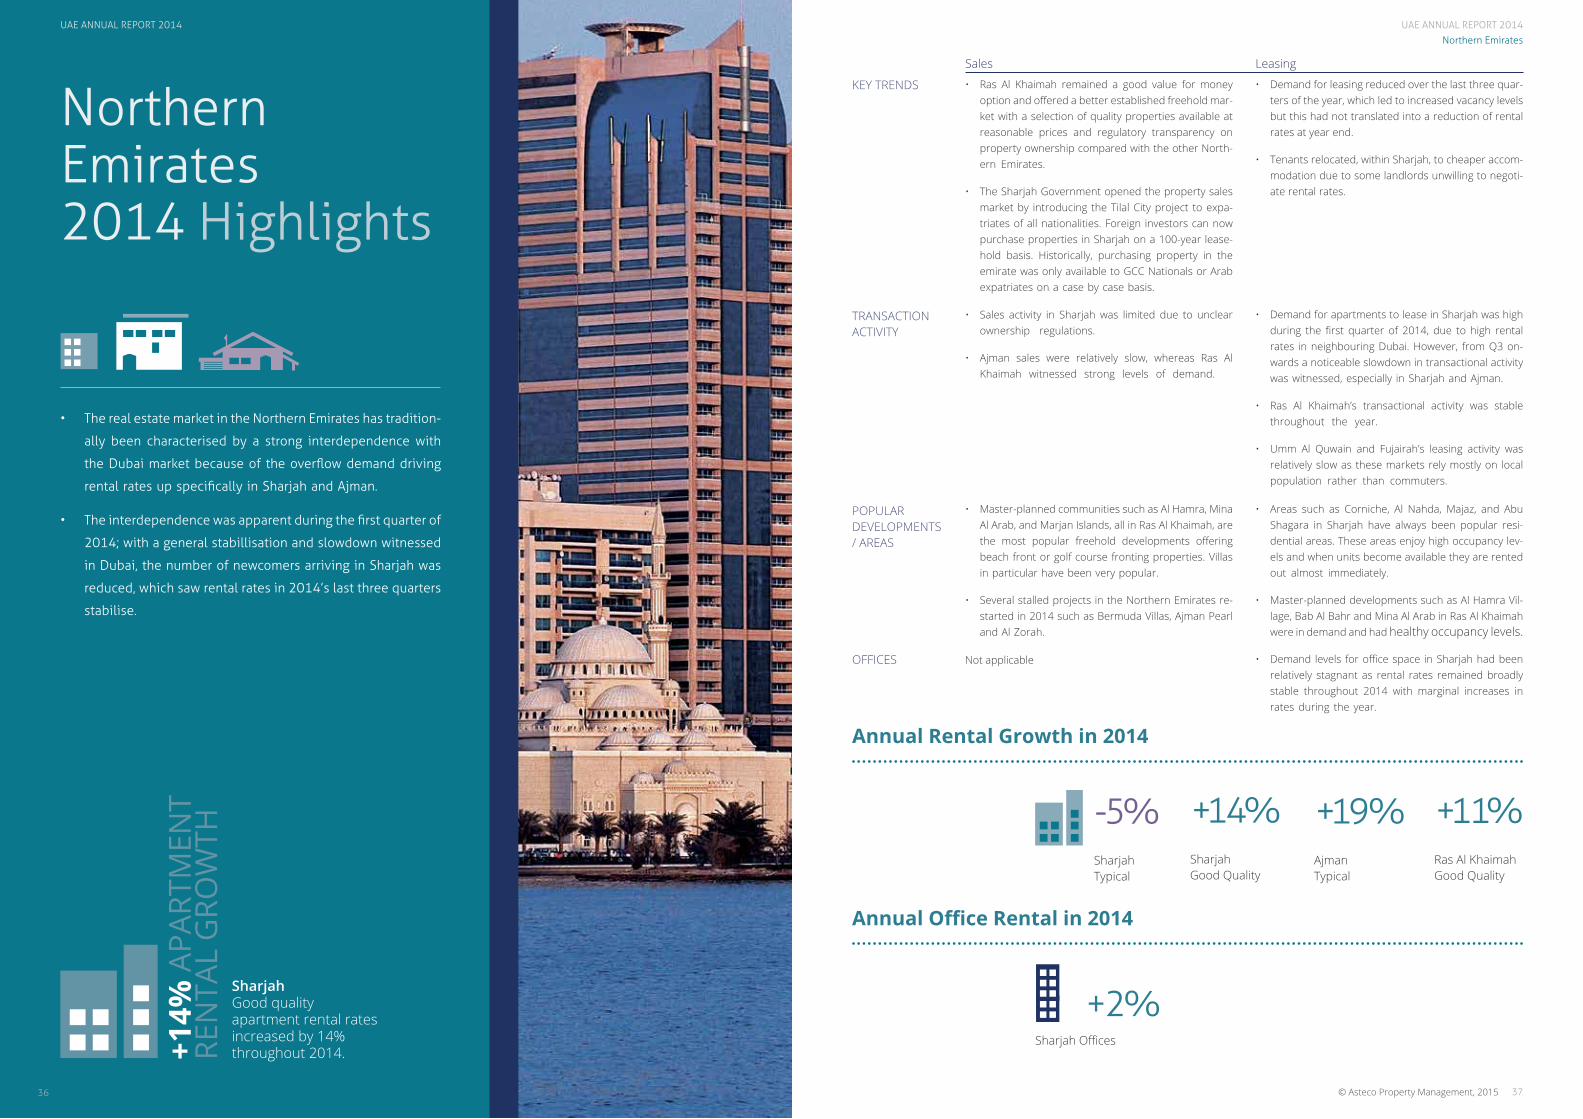
Northern Emirates2014 Highlights
• The real estate market in the Northern Emirates has tradition-
ally been characterised by a strong interdependence with
the Dubai market because of the overflow demand driving
rental rates up specifically in Sharjah and Ajman.
• The interdependence was apparent during the first quarter of
2014; with a general stabillisation and slowdown witnessed
in Dubai, the number of newcomers arriving in Sharjah was
reduced, which saw rental rates in 2014’s last three quarters
stabilise.
SharjahGood quality apartment rental rates increased by 14% throughout 2014.+1
4% A
PART
MEN
TRE
NTA
L G
ROW
TH
Sharjah Typical
Sharjah Offices
+2%
-5%
KEY TRENDS
TRANSACTION ACTIVITY
POPULAR DEVELOPMENTS / AREAS
• Master-planned communities such as Al Hamra, Mina Al Arab, and Marjan Islands, all in Ras Al Khaimah, are the most popular freehold developments offering beach front or golf course fronting properties. Villas in particular have been very popular.
• Several stalled projects in the Northern Emirates re-started in 2014 such as Bermuda Villas, Ajman Pearl and Al Zorah.
• Sales activity in Sharjah was limited due to unclear ownership regulations.
• Ajman sales were relatively slow, whereas Ras Al Khaimah witnessed strong levels of demand.
• Ras Al Khaimah remained a good value for money option and offered a better established freehold mar-ket with a selection of quality properties available at reasonable prices and regulatory transparency on property ownership compared with the other North-ern Emirates.
• The Sharjah Government opened the property sales market by introducing the Tilal City project to expa-triates of all nationalities. Foreign investors can now purchase properties in Sharjah on a 100-year lease-hold basis. Historically, purchasing property in the emirate was only available to GCC Nationals or Arab expatriates on a case by case basis.
OFFICES Not applicable • Demand levels for office space in Sharjah had been relatively stagnant as rental rates remained broadly stable throughout 2014 with marginal increases in rates during the year.
• Areas such as Corniche, Al Nahda, Majaz, and Abu Shagara in Sharjah have always been popular resi-dential areas. These areas enjoy high occupancy lev-els and when units become available they are rented out almost immediately.
• Master-planned developments such as Al Hamra Vil-lage, Bab Al Bahr and Mina Al Arab in Ras Al Khaimah were in demand and had healthy occupancy levels.
• Demand for apartments to lease in Sharjah was high during the first quarter of 2014, due to high rental rates in neighbouring Dubai. However, from Q3 on-wards a noticeable slowdown in transactional activity was witnessed, especially in Sharjah and Ajman.
• Ras Al Khaimah’s transactional activity was stable throughout the year.
• Umm Al Quwain and Fujairah’s leasing activity was relatively slow as these markets rely mostly on local population rather than commuters.
• Demand for leasing reduced over the last three quar-ters of the year, which led to increased vacancy levels but this had not translated into a reduction of rental rates at year end.
• Tenants relocated, within Sharjah, to cheaper accom-modation due to some landlords unwilling to negoti-ate rental rates.
Sales Leasing
Sharjah Good Quality
+14%AjmanTypical
+19%Ras Al Khaimah Good Quality
+11%
Annual Rental Growth in 2014
Annual Office Rental in 2014
UAE ANNUAL REPORT 2014

UAE ANNUAL REPORT 2014
3938
UAE ANNUAL REPORT 2014
© Asteco Property Management, 2015© Asteco Property Management, 2015
Northern Emirates
38
Northern Emirates 2015 Outlook
• Sharjah is likely to see a reduction in the number of reloca-
tions from Dubai and as a result, an increase in vacancy rates
and a decline in rental rates is to be expected.
• Fujairah, Ras Al Khaimah and Umm Al Quwain on the other
hand are expected to remain relatively stable in terms of
rental rates.
OFFICES
VILLAS • The master-planned communities in Ras Al Khaimah such as Al Hamra Village, Bab Al Bahr, and Mina al Arab are expected to see stable levels of demand from both sales and leasing as the communities be-come more established resulting in marginal rate in-creases.
• Demand for villa leasing in Ras Al Khaimah is expected to remain strong as the offering is attractive both in terms of price and quality.
APARTMENTS • Sales demand is expected to grow with the introduc-tion of a property ownership law by Sharjah Govern-ment, which allows expatriates from any country to purchase property on the Tilal City project on a 100-year leasehold basis, providing they hold a UAE resi-dence visa.
• Apartment and villa rates and transactional activity are expected to decline due to a reduction in the number of tenant migrations from Dubai as mid market rental rates in Dubai are expected to decline. This is likely to affect Sharjah and Ajman in particular, whereas the lesser interdependent emirates such as Ras Al Khaimah, Umm Al Quwain and Fujairah are like-ly to see some stability.
Sales Leasing
• Demand levels for office space in Sharjah have been relatively stagnant over the last few years with limited new entrants to the city. As a result, rental rates re-mained relatively flat, which is expected to continue in 2015.
UAE ANNUAL REPORT 2014
UAE ANNUAL REPORT 2014
4140
UAE ANNUAL REPORT 2014
© Asteco Property Management, 2015© Asteco Property Management, 2015
Northern Emirates
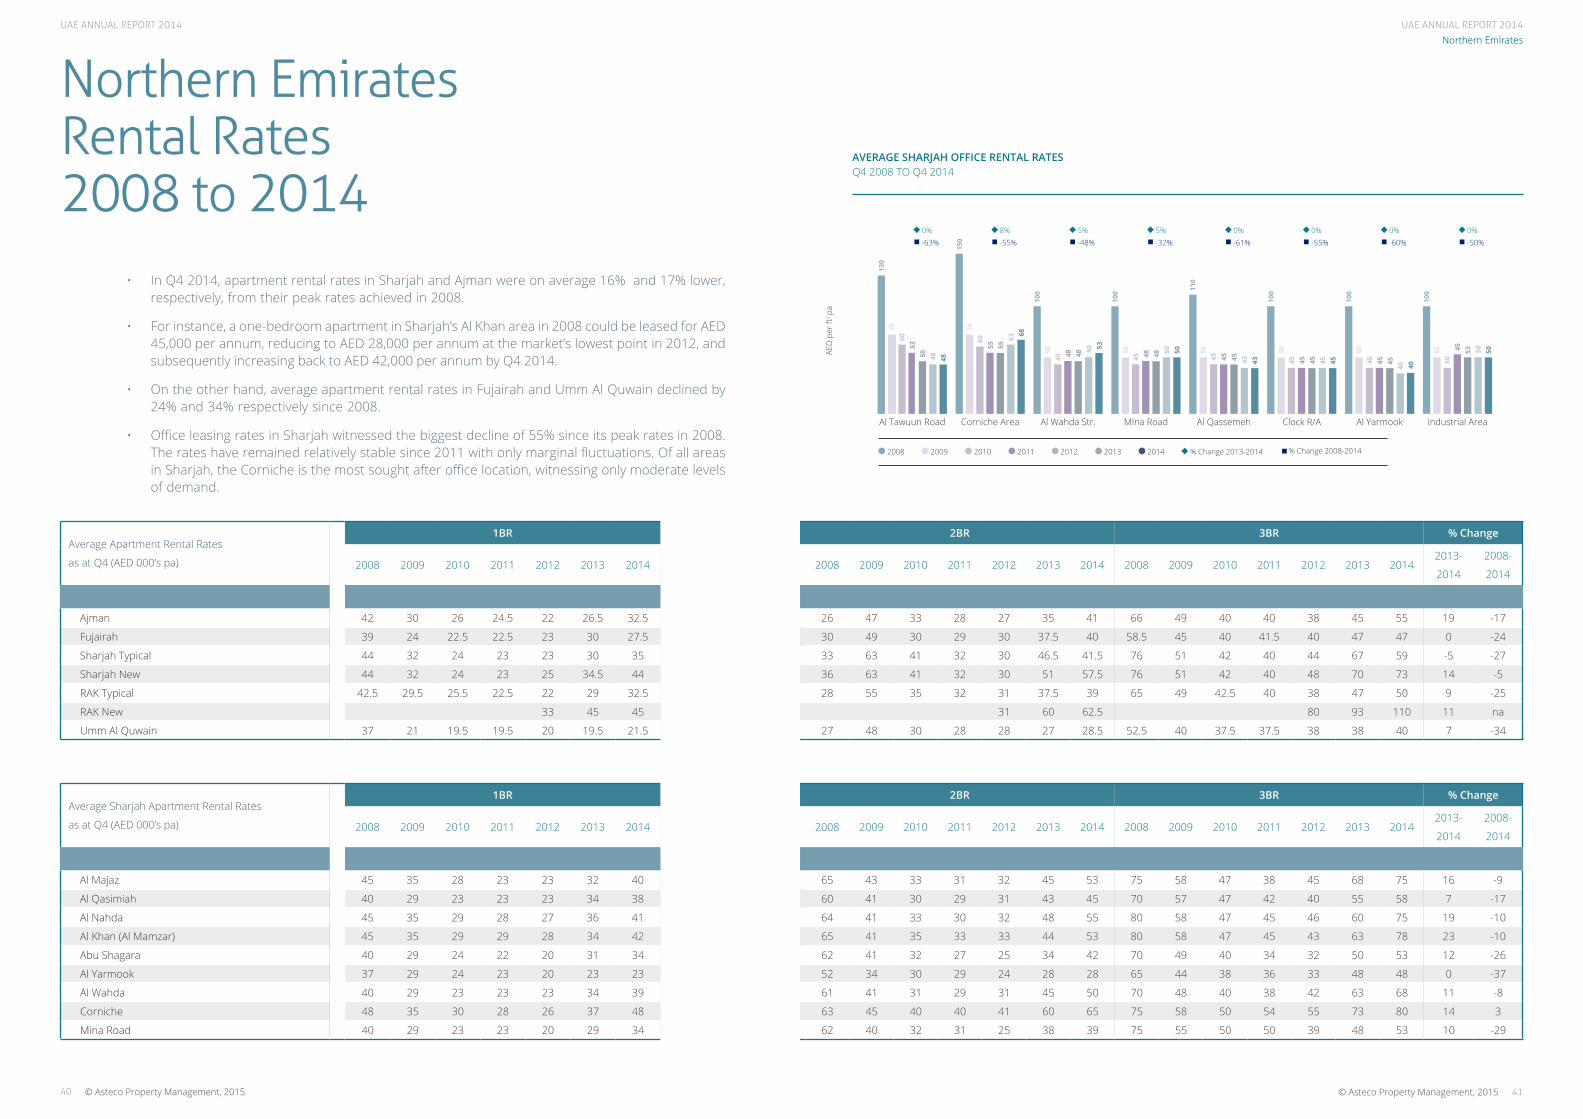
Northern EmiratesRental Rates2008 to 2014
• In Q4 2014, apartment rental rates in Sharjah and Ajman were on average 16% and 17% lower, respectively, from their peak rates achieved in 2008.
• For instance, a one-bedroom apartment in Sharjah’s Al Khan area in 2008 could be leased for AED 45,000 per annum, reducing to AED 28,000 per annum at the market’s lowest point in 2012, and subsequently increasing back to AED 42,000 per annum by Q4 2014.
• On the other hand, average apartment rental rates in Fujairah and Umm Al Quwain declined by 24% and 34% respectively since 2008.
• Office leasing rates in Sharjah witnessed the biggest decline of 55% since its peak rates in 2008. The rates have remained relatively stable since 2011 with only marginal fluctuations. Of all areas in Sharjah, the Corniche is the most sought after office location, witnessing only moderate levels of demand.
AED
per
ft2 pa
Al Tawuun Road Corniche Area Al Wahda Str. MIna Road Al Qassemeh Clock R/A Al Yarmook Industrial Area
Average Sharjah Apartment Rental Rates
as at Q4 (AED 000’s pa)
1BR 2BR 3BR % Change
2008 2009 2010 2011 2012 2013 2014 2008 2009 2010 2011 2012 2013 2014 2008 2009 2010 2011 2012 2013 20142013-
2014
2008-
2014
Al Majaz 45 35 28 23 23 32 40 65 43 33 31 32 45 53 75 58 47 38 45 68 75 16 -9
Al Qasimiah 40 29 23 23 23 34 38 60 41 30 29 31 43 45 70 57 47 42 40 55 58 7 -17
Al Nahda 45 35 29 28 27 36 41 64 41 33 30 32 48 55 80 58 47 45 46 60 75 19 -10
Al Khan (Al Mamzar) 45 35 29 29 28 34 42 65 41 35 33 33 44 53 80 58 47 45 43 63 78 23 -10
Abu Shagara 40 29 24 22 20 31 34 62 41 32 27 25 34 42 70 49 40 34 32 50 53 12 -26
Al Yarmook 37 29 24 23 20 23 23 52 34 30 29 24 28 28 65 44 38 36 33 48 48 0 -37
Al Wahda 40 29 23 23 23 34 39 61 41 31 29 31 45 50 70 48 40 38 42 63 68 11 -8
Corniche 48 35 30 28 26 37 48 63 45 40 40 41 60 65 75 58 50 54 55 73 80 14 3
Mina Road 40 29 23 23 20 29 34 62 40 32 31 25 38 39 75 55 50 50 39 48 53 10 -29
Average Apartment Rental Rates
as at Q4 (AED 000’s pa)
1BR 2BR 3BR % Change
2008 2009 2010 2011 2012 2013 2014 2008 2009 2010 2011 2012 2013 2014 2008 2009 2010 2011 2012 2013 20142013-
2014
2008-
2014
Ajman 42 30 26 24.5 22 26.5 32.5 26 47 33 28 27 35 41 66 49 40 40 38 45 55 19 -17
Fujairah 39 24 22.5 22.5 23 30 27.5 30 49 30 29 30 37.5 40 58.5 45 40 41.5 40 47 47 0 -24
Sharjah Typical 44 32 24 23 23 30 35 33 63 41 32 30 46.5 41.5 76 51 42 40 44 67 59 -5 -27
Sharjah New 44 32 24 23 25 34.5 44 36 63 41 32 30 51 57.5 76 51 42 40 48 70 73 14 -5
RAK Typical 42.5 29.5 25.5 22.5 22 29 32.5 28 55 35 32 31 37.5 39 65 49 42.5 40 38 47 50 9 -25
RAK New 33 45 45 31 60 62.5 80 93 110 11 na
Umm Al Quwain 37 21 19.5 19.5 20 19.5 21.5 27 48 30 28 28 27 28.5 52.5 40 37.5 37.5 38 38 40 7 -34
AVERAGE SHARJAH OFFICE RENTAL RATES Q4 2008 TO Q4 2014
130
100
100 11
0
100
100
100
150
60
45 45 45 45 45 50
60
50 48 48 45 45 45
53
55
48
53 50
43 45 40
50
68
70
50 50 50 50 50 50
70
53
48 48 45 45 45
4555
48
50 50
43 45
40
50
63
0%-63%
8%-55%
5%-48%
5%-32%
0%-61%
0%-55%
0%-60%
0%-50%
2008 2009 2010 2011 2012 2013 2014 % Change 2013-2014 % Change 2008-2014
UAE ANNUAL REPORT 2014
43
UAE ANNUAL REPORT 2014
© Asteco Property Management, 2015© Asteco Property Management, 2015
Northern Emirates
Arabian Gulf
311
11
11
11
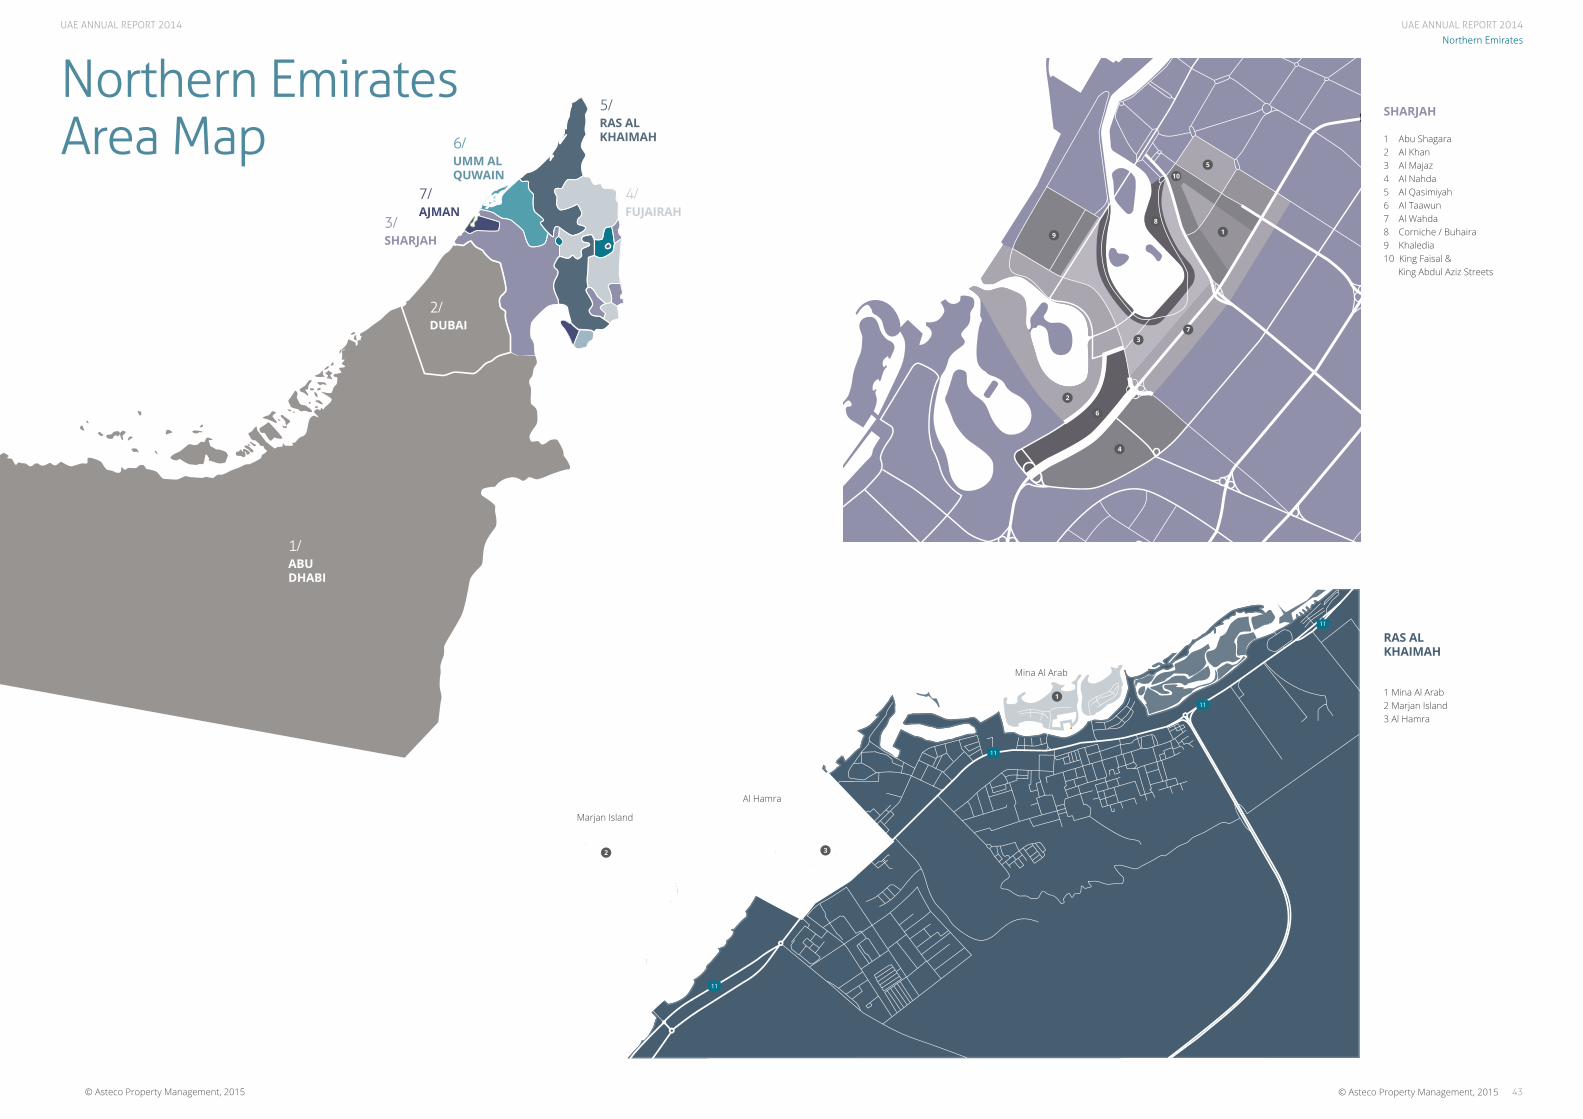
Northern Emirates Area Map
SHARJAH
1 Abu Shagara2 Al Khan3 Al Majaz4 Al Nahda5 Al Qasimiyah6 Al Taawun7 Al Wahda8 Corniche / Buhaira9 Khaledia10 King Faisal & King Abdul Aziz Streets
RAS ALKHAIMAH
1 Mina Al Arab2 Marjan Island3 Al Hamra
1/ABUDHABI
2/DUBAI
3/SHARJAH
4/FUJAIRAH
5/RAS ALKHAIMAH6/
UMM ALQUWAIN
7/AJMAN
42
Mina Al Arab
Marjan Island
1
5
1
10
8
9
3
2
6
4
7
2
Al Hamra
3
UAE ANNUAL REPORT 2014
4544 © Asteco Property Management, 2015© Asteco Property Management, 2015
Al Ain
44
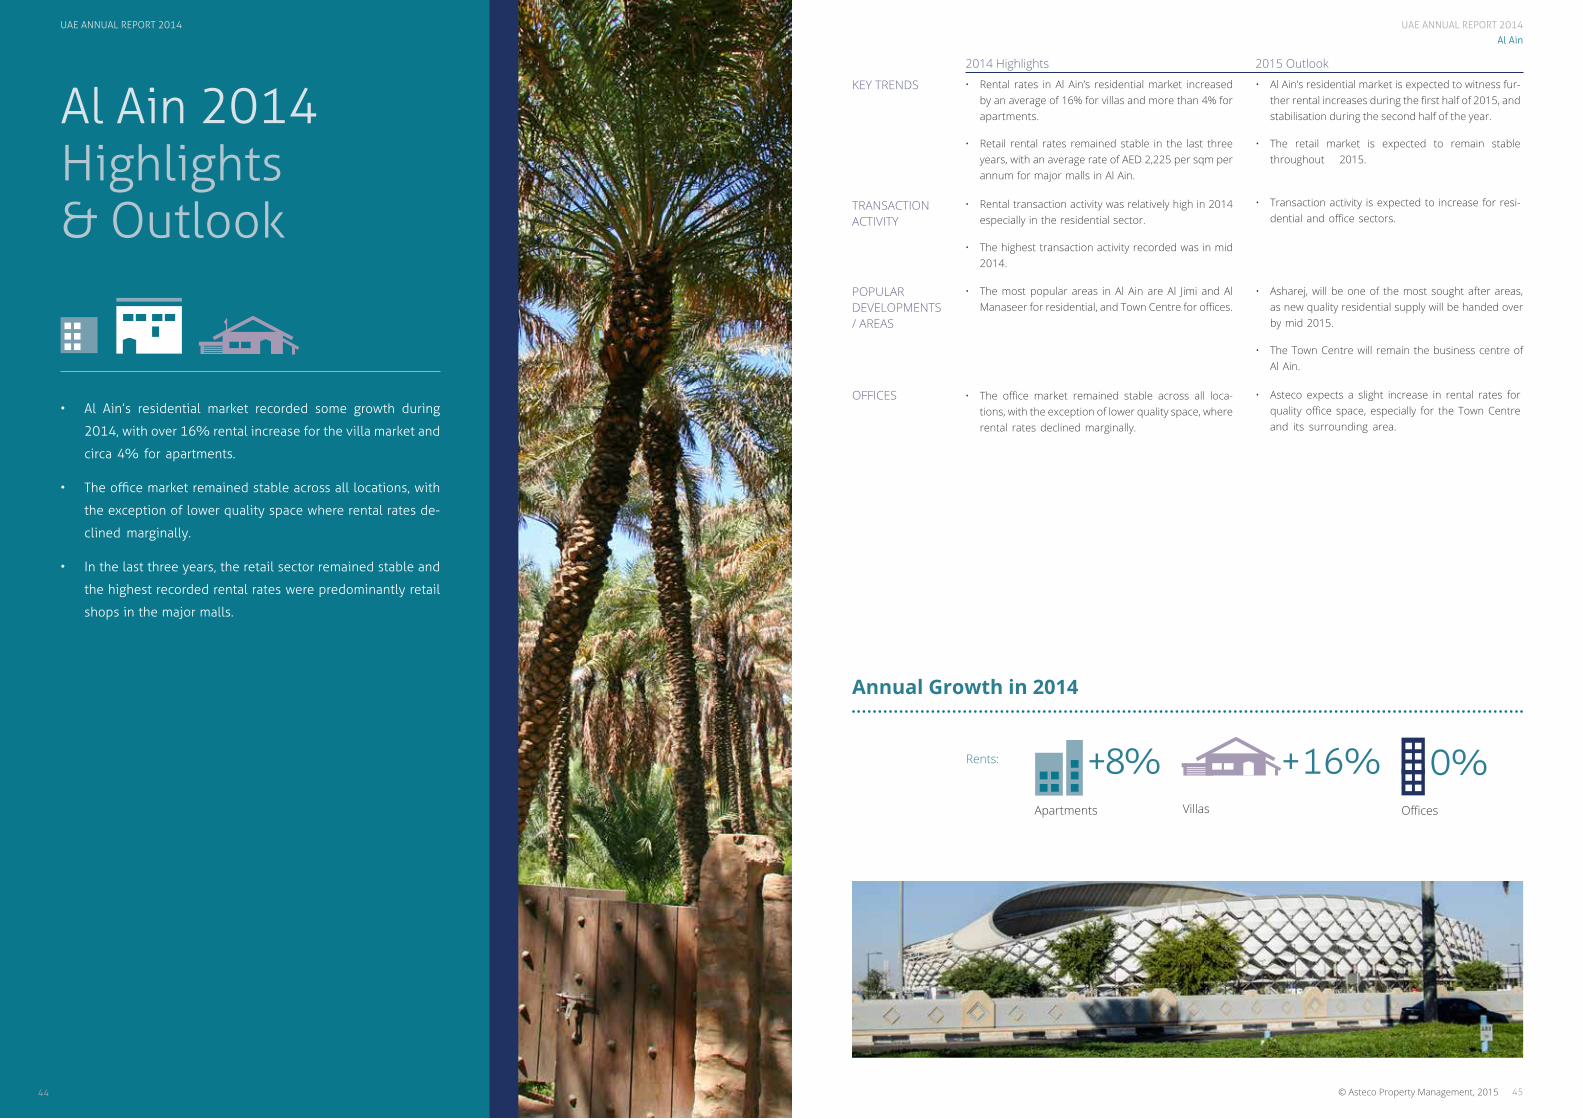
Al Ain 2014 Highlights & Outlook
• Al Ain’s residential market recorded some growth during
2014, with over 16% rental increase for the villa market and
circa 4% for apartments.
• The office market remained stable across all locations, with
the exception of lower quality space where rental rates de-
clined marginally.
• In the last three years, the retail sector remained stable and
the highest recorded rental rates were predominantly retail
shops in the major malls.
KEY TRENDS
TRANSACTION ACTIVITY
POPULAR DEVELOPMENTS / AREAS
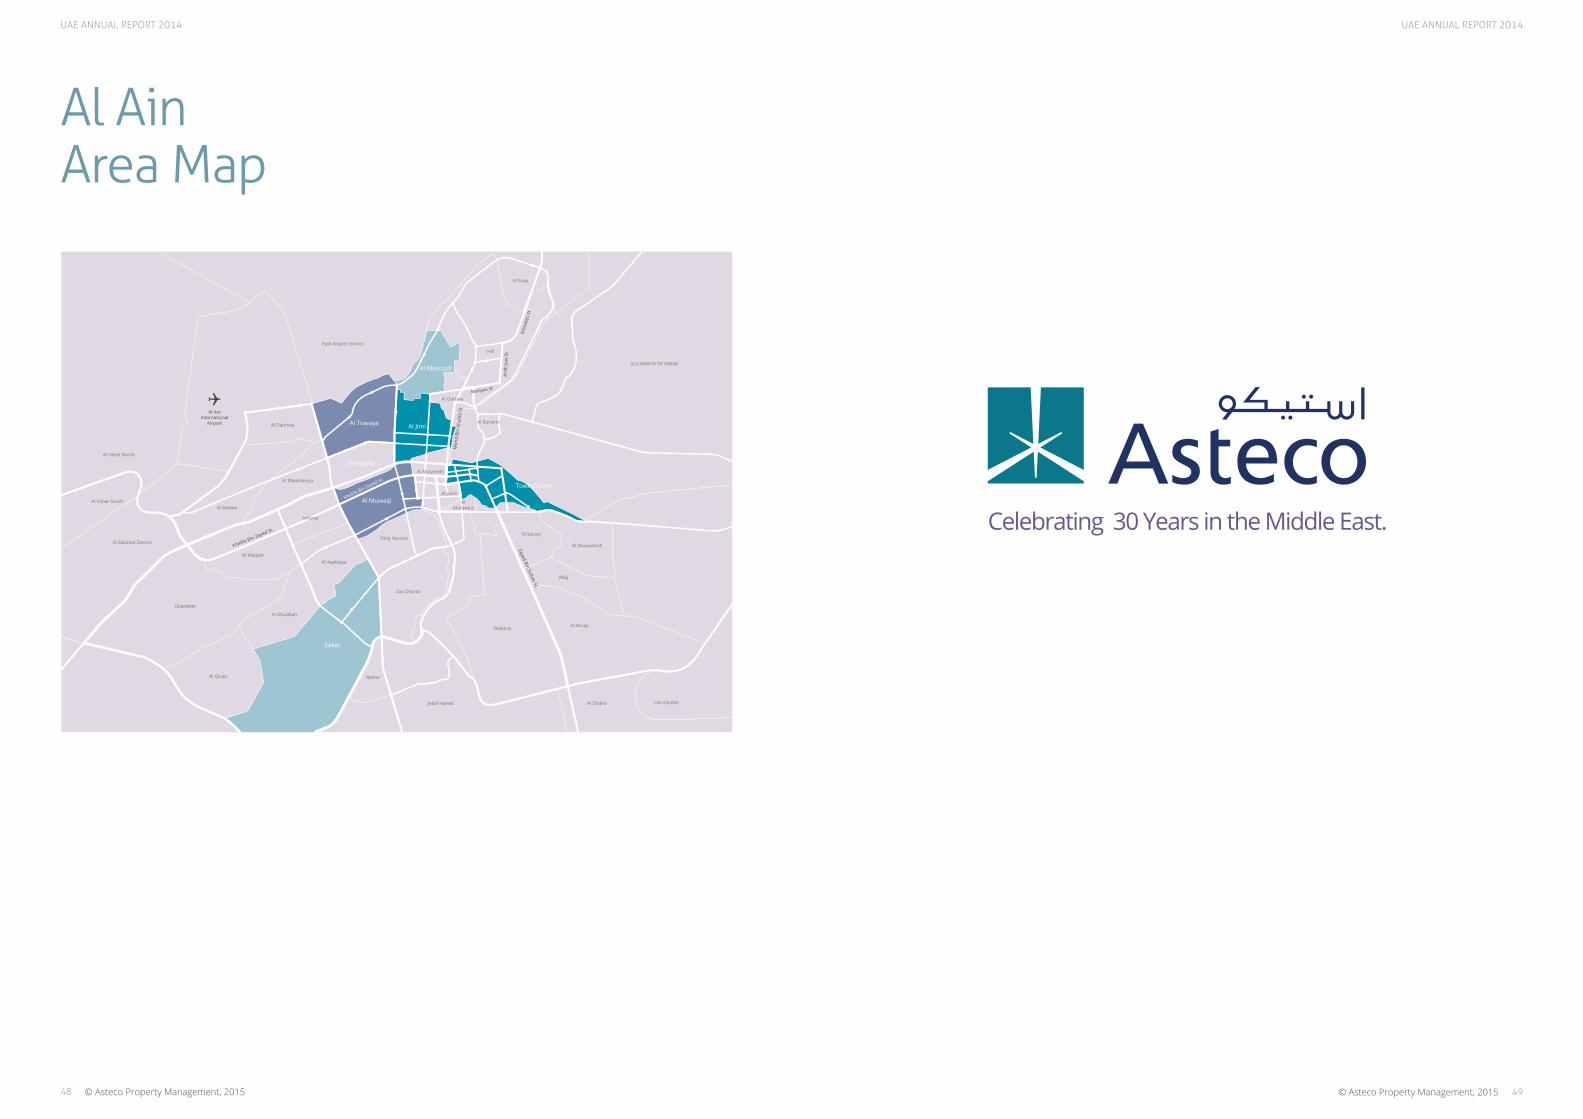
• The most popular areas in Al Ain are Al Jimi and Al Manaseer for residential, and Town Centre for offices.
• Rental transaction activity was relatively high in 2014 especially in the residential sector.
• The highest transaction activity recorded was in mid 2014.
• Rental rates in Al Ain’s residential market increased by an average of 16% for villas and more than 4% for apartments.
• Retail rental rates remained stable in the last three years, with an average rate of AED 2,225 per sqm per annum for major malls in Al Ain.
OFFICES • The office market remained stable across all loca-tions, with the exception of lower quality space, where rental rates declined marginally.
• Asteco expects a slight increase in rental rates for quality office space, especially for the Town Centre and its surrounding area.
• Asharej, will be one of the most sought after areas, as new quality residential supply will be handed over by mid 2015.
• The Town Centre will remain the business centre of Al Ain.
• Transaction activity is expected to increase for resi-dential and office sectors.
• Al Ain’s residential market is expected to witness fur-ther rental increases during the first half of 2015, and stabilisation during the second half of the year.
• The retail market is expected to remain stable throughout 2015.
2014 Highlights 2015 Outlook
Apartments
+8%Villas
+16%Offices
0%Rents:
Annual Growth in 2014
UAE ANNUAL REPORT 2014

UAE ANNUAL REPORT 2014
4746
UAE ANNUAL REPORT 2014
© Asteco Property Management, 2015© Asteco Property Management, 2015
Al Ain
Al AinRental Rates 2008 to 2014
* Includes Al Khabisi, Al Muwaiji, Al Manasir , Al Masoudi Areas and prime compounds
AVERAGE OFFICE RENTAL RATESQ4 2008 TO Q4 2014
AED
per
ft2 pa
850
Khalifa Street
1050 1100
975850 850
1150
Aud Al Touba Street
9501000
1075
925
1125
Main Street
950 950
1100
975
1150
Senaya Street
800 800900
550500 500
900850 850 850 850
AVERAGE RETAIL RENTAL RATESQ4 2008 TO Q4 2014
AED
per
ft2 pa
975
Khalifa Street
150016501700
Main Street
10751350
16501825
1700
Senaya Street
10001200
13001500
1350
Major Malls
1250
1550
2250 2225 2225 22252250
1825
1500 1500
182518251825 1825
0%0%
87%0%
0%-11%
70%0%
0%-11%
50%0%
0%-38%
78%0%
• The Al Ain residential apartment market followed a similar trend to the one witnessed in Abu Dha-bi, with rental rates declining till 2012 and never fully recovering to 2008 levels.
• In comparison, villa rents however recovered beyond 2008 levels, with 18% increases witnessed within older units whereas new units are only 7% lower than in Q4 2008.
2008 2009 2010 2011 2012 2013 2014 % Change 2013-2014 % Change 2008-2014
2008 2009 2010 2011 2012 2013 2014 % Change 2008-2014 % Change 2013-2014
Average Apartments Rental Rates
as at Q4 (AED 000’s pa)
1BR % Change
2008 2009 2010 2011 2012 2013 20142013-
2014
2008-
2014
Mature Units
1BR 50 35 25 23 23 29 33 14 -34
2BR 70 55 45 43 35 39 43 10 -39
3BR 90 75 60 53 48 51 53 4 -41
New Units
1BR 60 50 38 28 28 32 38 19 -37
2BR 75 65 58 45 45 45 48 7 -36
3BR 95 85 73 55 58 63 65 3 -32
Average Villas Rental Rates
as at Q4 (AED 000’s pa)
1BR 2BR 3BR % Change
2008 2009 2010 2011 2012 2013 2014 2008 2009 2010 2011 2012 2013 2014 2008 2009 2010 2011 2012 2013 20142013-
2014
2008-
2014
Mature Units
Town Centre 70 60 60 55 50 65 85 95 80 75 70 65 75 95 95 90 90 85 85 105 125 24 17
Others * 70 60 60 55 50 65 85 85 75 75 70 65 75 95 95 90 90 85 85 105 130 27 24
Zaker 65 55 55 50 45 65 75 75 70 70 65 60 75 75 85 75 85 80 80 105 105 4 13
Al Towaya 75 65 65 60 50 70 80 85 80 80 80 65 85 95 100 95 95 95 85 110 125 13 15
Al Jimi 70 60 60 55 50 65 85 85 75 75 70 65 75 95 95 90 90 85 85 105 125 24 22
New Units
Town Centre 115 95 80 65 65 75 90 125 115 100 90 85 100 110 140 135 125 110 105 130 155 16 -7
Others * 115 95 80 65 65 75 80 120 115 100 90 85 100 115 140 135 125 110 105 130 160 16 -5
Zaker 105 85 65 55 50 75 80 115 95 90 85 75 100 100 135 100 115 105 90 130 130 2 -13
Al Towaya 110 105 85 70 65 80 95 130 125 105 100 85 105 110 140 135 130 120 105 135 160 14 -4
Al Jimi 120 95 80 65 65 75 90 120 115 100 90 85 100 110 140 135 125 110 105 130 155 16 -7
UAE ANNUAL REPORT 2014
4948
UAE ANNUAL REPORT 2014
© Asteco Property Management, 2015© Asteco Property Management, 2015
Al Ain Area Map
5150
UAE ANNUAL REPORT 2014
© Asteco Property Management, 2015© Asteco Property Management, 2015
John Stevens, BSc MRICSManaging Director/Director, Asset Services+971 600 54 [email protected]
John Allen, BSc MRICSDirector, Valuation & Advisory+971 600 54 [email protected]
Jeremy Oates, BSc FRICSGeneral Manager, Abu Dhabi+971 2 626 [email protected]
Sean McCauley, MBA BComDirector - Agency Services+971 600 54 [email protected]
Julia Knibbs, MScResearch & Consultancy Manager, UAE+971 600 54 [email protected]
Ghada Amhaz, MBAResearch & Consultancy Manager, Abu Dhabi+971 2 626 [email protected]
James Joughin, BSc (Hons) MRICSHead of Valuations, Abu Dhabi+971 2 626 [email protected]
Tamer Ibrahim ChaabanBranch Manager, Al Ain+971 3 [email protected]
Zahra Alvi, MScResearch Analyst+971 600 54 [email protected]
The Middle East’s largest full service real estate consultancy company, Asteco was formed in Dubai in 1985. Over the years, Asteco has gained enormous respect for consistently delivering high quality, professional, value-added services in a transparent manner. It is also widely recognised for its involvement with many of the projects that have defined the landscape and physical infrastructure of the Emirates.
Asteco has an essential combination of local knowledge and international expertise. A deeply established brand, renowned for its application of the latest technological advances, its commitment to transparency, winning strategies and human expertise. Undisputed real estate experts, Asteco represents a significant number of the region’s top property owners, developers and investors.
VALUATION & ADVISORYOur professional advisory services are conducted by suitably qualified personnel all of whom have had extensive real estate experience within the Middle East and internationally.
Our valuations are carried out in accordance with the Royal Institution of Chartered Surveyors (RICS) and International Valuation Standards (IVS) and are undertaken by appropriately qualified valuers with extensive local experience.
The Professional Services Asteco conducts throughout the region include:
• Consultancy and Advisory Services• Market Research• Valuation Services
SALESAsteco has established a large regional property sales division with representatives based in the UAE, Qatar and Jordan. Our sales teams have extensive experience in the negotiation and sale of a variety of assets.
LEASINGAsteco has been instrumental in the leasing of many high-profile developments across the GCC.
ASSET MANAGEMENTAsteco provides comprehensive asset management services to all property owners, whether a single unit (IPM) or a regional mixed use portfolio. Our focus is on maximising value for our Clients.
OWNERS ASSOCIATIONAsteco has the experience, systems, procedures and manuals in place to provide streamlined comprehensive Association Management and Consultancy Services to residential, commercial and mixed use communities throughout the GCC Region.
SALES MANAGEMENTOur Sales Management services are comprehensive and encompass everything required for the successful completion and handover of units to individual unit owners.
© Asteco Property Management, 2015 51

Xxx
© Asteco Property Management, 2015
Historic Review 2008-2014 and 2015 Outlook
UAE Property Review Special Edition:
DISCLAIMER: The information contained in this report has been obtained from and is based upon sources that Asteco Property Management believes to be reliable, however, no warranty or representation, expressed or implied, is made to the accuracy or completeness of the information contained herein, and same is submitted subject to errors, omissions, change of price, rental or other conditions, withdrawal without notice, and to any special listing conditions imposed by our principals. Asteco Property Management will not be held responsible for any third-party contributions. All opinions and estimates included in this report constitute Asteco Property Management’s judgment, as of the date of this report and are subject to change without notice. Figures contained in this report are derived from a basket of locations highlighted in this report and therefore represent a snapshot of the Dubai market. Due care and attention has been used in the preparation of forecast information. However, actual results may vary from forecasts and any variation may be materially positive or negative. Forecasts, by their very nature, involve risk and uncertainty because they relate to future events and circumstances which are beyond Asteco Property Management’s control. For a full in-depth study of the market, please contact Asteco Property Management’s research team. Asteco Property Management LLC. Commercial Licence No. 218551. Paid-up Capital AED4,000,000.