uap holding corp. -...
TRANSCRIPT

UNITED STATES SECURITIES AND EXCHANGE COMMISSION
WASHINGTON, D.C. 20549
FORM 10-K ANNUAL REPORT
PURSUANT TO SECTIONS 13 OR 15(d) OF THE SECURITIES EXCHANGE ACT OF 1934
(Mark one) ⌧ ANNUAL REPORT PURSUANT TO SECTION 13 OR 15(d) OF THE SECURITIES
EXCHANGE ACT OF 1934 For the fiscal year ended February 26, 2006
OR TRANSITION REPORT PURSUANT TO SECTION 13 OR 15(d) OF THE SECURITIES
EXCHANGE ACT OF 1934 For the transition period from to .
Commission File Number 000-51035
UAP Holding Corp. (Exact Name of Registrant as Specified in Its Charter)
Delaware 11-3708834 (State or Other Jurisdiction of
Incorporation or Organization) (I.R.S. Employer Identification No.)
7251 W. 4th Street, Greeley, Colorado 80634 (Address of Principal Executive Offices) (Zip Code)
(970) 356-4400 (Registrant’s Telephone Number, Including Area Code)
Securities registered pursuant to Section 12(b) of the Act: None
Securities registered pursuant to Section 12(g) of the Act: Common Stock, par value $.001
Indicate by check mark if the registrant is a well-known seasoned issuer, as defined by Rule 405 of the Securities Act. Yes ⌧ No Indicate by check mark if the registrant is not required to file reports pursuant to Section 13 of 15(d) of the Act. Yes No ⌧ Indicate by check mark whether the registrant has: (1) filed all reports required to be filed by Section 13 or 15(d) of the Securities Exchange Act of 1934 during the preceding 12 months (or for such shorter period that the company was required to file such reports), and (2) has been subject to such filing requirements for the past 90 days.
Yes ⌧ No Indicate by check mark if disclosure of delinquent filers pursuant to Item 405 of Regulation S-K is not contained herein, and will not be contained, to the best of the registrant’s knowledge, in definitive proxy or information statements incorporated by reference in Part III of this Form 10-K or any amendment to this Form 10-K. ⌧ Indicate by check mark whether the company is a large accelerated filer, an accelerated filer, or a non-accelerated filer. (as defined in Exchange Act Rule 12b-2).
Large accelerated filer
Accelerated filer ⌧ Non-accelerated filer
1

Indicate by check mark whether the registrant is a shell company (as defined in Rule 12b-2 of the Exchange Act). Yes No ⌧ As of August 28, 2005, which was the last day of the registrants most recently completed second fiscal quarter, the aggregate market value of the common stock held by non-affiliates of the registrant was approximately $498.7 million, based on the price at which the common stock was last sold on such date. The number of shares outstanding of the registrant’s common stock as of May 9, 2006 was 50,909,331.
DOCUMENTS INCORPORATED BY REFERENCE Certain information required in Part III hereof is incorporated by reference to the Proxy Statement for the registrant’s 2006 Annual Meeting of Shareholders to be filed with the Securities and Exchange Commission pursuant to Regulation 14A not later than 120 days after the end of the fiscal year covered by this Form 10-K.
2

TABLE OF CONTENTS
Page
PART I ........................................................................................................................................................... 4 Item 1. Business ..................................................................................................................................... 4 Item 1A. Risk Factors............................................................................................................................. 13 Item 1B. Unresolved Staff Comments ................................................................................................... 18 Item 2. Properties ................................................................................................................................... 19 Item 3. Legal Proceedings...................................................................................................................... 20 Item 4. Submission of Matters to a Vote of Security Holders................................................................ 20 Executive Officers of the Registrant ...................................................................................................... 20
PART II .......................................................................................................................................................... 22
Item 5. Market for Registrant’s Common Equity, Related Stockholder Matters and Issuer Purchases of Equity Securities ........................................................................................................................................... 22
Item 6. Selected Financial Data.............................................................................................................. 25 Item 7. Management’s Discussion and Analysis of Financial Condition and Results of Operations..... 26 Item 7A. Quantitative and Qualitative Disclosures About Market Risk ................................................ 46 Item 8. Financial Statements and Supplementary Data.......................................................................... 47 Item 9. Changes in and Disagreements with Accountants on Accounting and Financial Disclosure..... 79 Item 9A. Controls and Procedures ......................................................................................................... 79 Item 9B. Other Information.................................................................................................................... 81
PART III ........................................................................................................................................................ 82
Item 10. Directors and Executive Officers of the Registrant.................................................................. 82 Item 11. Executive Compensation.......................................................................................................... 82 Item 12. Security Ownership of Certain Beneficial Owners and Management...................................... 82 Item 13. Certain Relationships and Related Transactions ...................................................................... 82 Item 14. Principal Accountant Fees and Services .................................................................................. 82
PART IV ........................................................................................................................................................ 83
Item 15. Exhibits and Financial Statement Schedules............................................................................ 83 SIGNATURES ............................................................................................................................................... 87
3

FORWARD-LOOKING STATEMENTS This Report and the documents we have incorporated by reference into this Report include “forward-looking statements,” as that term is defined by The Private Securities Litigation Reform Act of 1995 or by the Securities and Exchange Commission (“SEC”) in its rules, regulations, and releases that involve risks and uncertainties. Forward-looking statements include statements concerning our plans, objectives, goals, strategies, future events, future revenue or performance, capital expenditures, financing needs, plans or intentions relating to acquisitions and divestitures, business trends, and other information that is not historical information and, in particular, appear under the heading “Management’s Discussion and Analysis of Financial Condition and Results of Operations.” When used in this Report, the words “estimates,” “expects,” “anticipates,” “projects,” “plans,” “intends,” “believes,” “forecasts,” “foresees,” “likely,” “may,” “should,” “goal,” “target,” and variations of such words or similar expressions are intended to identify forward-looking statements. All forward-looking statements are based upon information available to us on the date of this Report.
These forward-looking statements are subject to risks, uncertainties, and other factors, many of which are outside of our control, that could cause actual results to differ materially from the results discussed in the forward-looking statements including, among other things, the matters discussed in this Report in “Item 1A. Risk Factors” and “Item 7. Management’s Discussion and Analysis of Financial Condition and Results of Operations.” Such risks, uncertainties, and other factors may include, among others:
• general economic and business conditions; • industry trends; • restrictions contained in our debt agreements; • our substantial leverage, including the inability to generate the necessary amount of cash to service our existing
debt and the incurrence of substantial indebtedness in the future; • the seasonality of our business and weather conditions; • the possibility of liability for pollution and other damage that is not covered by insurance or that exceeds our
insurance coverage; • increased competition in the markets in which we operate; • our dependence on product mix and rebate programs to attain profitability; • our dependence on a limited number of key executives who we may not be able to adequately replace if they leave
our company; • changes in government regulations, agricultural policy, and environmental, health, and safety laws and regulations; • changes in business strategy, development plans, or cost savings plans; • our ability to integrate newly acquired operations into our existing operations; • the loss of any of our major suppliers or the bankruptcy or financial distress of our customers; • the ability to maintain prices and/or attain any price increases for our products; • availability, terms, and deployment of capital; and • other factors over which we have little or no control.
There may be other factors, including those discussed elsewhere in this Report, which could cause our actual results to differ materially from the results referred to in the forward-looking statements. All forward-looking statements attributable to us or persons acting on our behalf apply only as of the date of this Report and are expressly qualified in their entirety by the cautionary statements included in this Report. We undertake no obligation to publicly update or revise forward-looking statements to reflect events or circumstances after the date made or to reflect the occurrence of unanticipated events.
4

PART I
Unless the context requires otherwise, all references to “Company,” “we,” “us,” “ours,” and “UAP” refer specifically to UAP Holding Corp. and its consolidated subsidiaries. Additionally, all references to UAP Holding Corp. refer specifically only to UAP Holding Corp., excluding its subsidiaries, all references to “United Agri Products” refer specifically only to United Agri Products, Inc., and its subsidiaries, and all references to “United Agri Products, Inc.” refer specifically to United Agri Products, Inc., excluding its subsidiaries.
We operate on a 52- or 53-week fiscal year. Fiscal years are identified in this Report according to the calendar year in which they ended. Our fiscal years 2006, 2005, and 2004 ended on February 26, 2006, February 27, 2005, and February 22, 2004, respectively. Our fiscal years 2006 and 2004 contained 52 weeks, and our fiscal year 2005 contained 53 weeks.
Item 1. Business.
OVERVIEW
We are the largest independent distributor of agricultural inputs and professional non-crop products in the United States and Canada. We market a comprehensive line of products including chemicals, fertilizer, and seed to farmers, commercial growers, and regional dealers. In addition to our agricultural input product offering, we provide a broad array of value-added services including crop management, biotechnology advisory services, custom blending, inventory management, and custom applications of crop inputs. The products and services we offer are critical to our customers because they lower the overall cost of crop production and improve crop quality and yield. We also operate in the professional non-crop markets that consist of turf and ornamental (golf courses, resorts, nurseries, and greenhouses), pest control operators, forestry, and vegetation management.
We operate a comprehensive network of approximately 340 distribution and storage facilities and three formulation plants, strategically located in major crop-producing areas of the United States and Canada. Our integrated sales network offers over 43,000 active stock keeping units, or SKUs, supported by approximately 1,100 sales professionals. This network of facilities, together with our technical expertise, enables us to efficiently process, distribute, and store products close to our end-users and to supply our customers on a timely basis during the compressed planting and growing seasons. In addition, our widespread geographical presence provides a diversified base of sales that helps insulate our overall business from difficult farming conditions in any one area as a result of poor weather or adverse market conditions for specific crops or regions.
We distribute agricultural inputs and professional non-crop products manufactured by the world’s leading chemical companies, including BASF, Bayer, Dow AgroSciences, DuPont, Monsanto, and Syngenta. We believe we are among the largest customers of agricultural inputs of these suppliers and have long-standing relationships with these companies. We also distribute products from hundreds of other agricultural and professional non-crop product suppliers. In addition to products we purchase from third parties, we market approximately 220 proprietary and private label branded products, under the Loveland Products, Inc. (“LPI”) and Dyna-Gro® brand names. Our extensive infrastructure is a critical element of our suppliers’ route-to-market. As a result of our broad scale and scope, we provide agricultural input and professional non-crop product companies with an efficient means to access a highly fragmented customer base of farmers, commercial growers, regional dealers, and professional non-crop consumers estimated in excess of two million users by the United States Department of Agriculture (“USDA”).
During fiscal 2006, we sold products or services to over 90,000 customers, with our ten largest customers accounting for less than 5% of our net sales. Our customers include farmers, commercial growers, and regional dealers, as well as consumers in professional non-crop markets. We believe our significant scale provides our customers with an efficient and cost-effective method of purchasing agricultural inputs and professional non-crop products. We strive to be the distributor of choice in our industry and earn the trust of our customers by providing high quality products at competitive prices, supported by consistent and reliable service and expertise.
United Agri Products was initially formed by ConAgra Foods through a series of acquisitions, beginning in May 1978. On November 24, 2003, ConAgra Foods sold UAP and its related businesses to UAP Holding Corp., which we refer to as the “Acquisition.” UAP Holding Corp.’s primary asset is the ownership of 100% of the outstanding capital stock of United Agri Products, Inc. UAP Holding Corp. consummated the initial public offering of its common stock in November 2004, which we refer to as the “Common Stock Offering.”
5

INDUSTRY OVERVIEW AND TRENDS
The agricultural inputs market in the United States was estimated at $31.2 billion in 2005, and has grown at a compound annual growth rate of approximately 3.3% over the past fifteen years, as measured by total revenues, according to the most recent available data from the USDA National Agricultural Statistics Service. The growth is due to, among other things, continued population growth; the use of more effective chemicals and fertilizer; relatively stable planted acreage; the trend towards larger and more efficient farms; and the increased adoption of seed varieties with enhanced technology. The three primary product categories of the agricultural input and professional non-crop markets are chemicals, fertilizer, and seed.
Chemicals. Agricultural chemicals expenditures in the United States were estimated at $8.4 billion in 2005, according to the most recent available data provided by the USDA National Agricultural Statistics Service. The chemical product category’s fifteen year compound annual growth rate is approximately 2.1%, according to the same source, primarily due to the replacement of higher-priced patented products with lower-priced generic products. The volume of agricultural chemicals sold in the United States continues to increase but overall revenues have remained essentially flat since 1996. This product category includes: (i) herbicides, which keep weed infestations from depriving crops of plant nutrients and water; (ii) insecticides, which keep insects from damaging crops; (iii) fungicides, which guard against plant diseases; and (iv) other chemicals such as adjuvants and surfactants.
Fertilizer. Fertilizer expenditures in the United States were estimated at $12.8 billion in 2005, according to the most recent available data provided by the USDA National Agricultural Statistics Service. The last three years have seen significant price increases in fertilizer products, especially in nitrogen based fertilizer products, with continued increases forecast for 2006. Nitrogen based fertilizer, for example, anhydrous ammonia, urea, and UAN solutions, are manufactured using natural gas as the primary feedstock. Increased natural gas costs have caused price appreciation across the entire fertilizer market. From 1991 through 2006 (forecast), fertilizer expenditures in the United States grew at a compound annual rate of approximately 3.2% per year, based on data available from the USDA National Agricultural Statistics Service. Fertilizer is added to the soil to replace or supplement one or more deficient nutrients necessary for plant growth. Nearly all commercial crops grown in the United States and Canada today are produced with the use of a commercial fertilizer, as modern crop varieties and higher yields cannot be sustained by other methods.
Seed. Seed expenditures in the United States were estimated at $10.0 billion in 2005, according to the most recent available data provided by the USDA National Agricultural Statistics Service. As a result of improvements in seed technology, the seed market in the United States has experienced a compound annual growth rate of 4.8% over the past fifteen years, according to the same source, driven primarily by increased pricing. In particular, biological “traits” are being genetically engineered into seeds, either increasing farm efficiencies with respect to labor and equipment, reducing the need for chemical treatment, or providing “output” trait benefits such as drought tolerance or high oil content. These traits include providing a plant with the ability to resist pests without a chemical application and the ability of a plant to selectively resist the effects of herbicides. These technological improvements, together with the availability of more productive seed hybrids, have resulted
higher crop yields as well as increased seed expenditures. in
BUSINESS OPERATIONS
We manage our businesses on a centralized basis with operating managers focused on product categories and geographic regions throughout the United States and Canada. Each geographic region sells and distributes agricultural inputs and professional non-crop products and offers services to farmers, commercial growers, regional dealers, and professional non-crop customers in each region based on the specific crops and industry practices in that geography. Our operations entail a network of approximately 340 sales and distribution facilities throughout the United States and Canada. Additionally, we operate three formulation facilities that produce some of our proprietary and private label chemicals and plant nutrition products. We source, formulate, package, and market certain of our proprietary and private label products and provide formulating, blending, and packaging services for third parties, primarily our major suppliers. Sales of our proprietary and private label chemicals and seed accounted for approximately 14.3% of our total chemical and seed sales in fiscal 2006 compared to 13.3% in fiscal 2005.
6

Distribution Operations We operate distribution centers and locations serving retailers, growers, and professional non-crop customers. Retail centers typically service end-users within a 10 to 50 mile radius of their locations. We operate retail centers in most major crop-producing regions of the United States. Our distribution network, though centrally managed, is operated by region due to its size. The following table outlines our regions and identifies states and provinces served (subject to occasional overlap), major crops serviced, approximate number of employees (including hourly and temporary employees), and total net sales for each region in fiscal 2006:
Region States/Provinces Served Major Crops Serviced Employees
Fiscal 2006 Net Sales (dollars in millions)
Northeast CT, DE, IL, IN, KY, MA, MD, ME, MI, MO, NH, NJ, NY, OH, PA, RI, VA, VT, WI, WV
Corn, soybeans, tree fruits, nuts, vines, vegetables, alfalfa, and tobacco
746 $ 571.0
Southeast AL, AR, FL, GA, MO, MS, NC, SC, TN Citrus, tree fruits, cotton, corn, peanuts, rice, soybeans, vegetables, and tobacco
681 $ 625.6
West AK, AZ, CA, CO, HI, ID, KS, LA, MO, NE, NM, NV, OK, OR, TX, UT, WA, WY
Cotton, corn, soybeans, rice, peanuts, potatoes, vegetables, vines, tree fruits, nuts, and wheat
808 $ 839.5
Midwest IA, MN, MT, ND, NE, SD, WY Corn, soybeans, potatoes, canola, sugar beets, alfalfa, and wheat
492 $ 591.1
Canada AB, BC, MN, NB, NS, ON, PEI, QU, SK
Tree fruits, vegetables, soybeans, corn, wheat, canola, and tobacco
111 $ 81.4
Products We sell a complete line of products and services to end-users through our distribution facilities, with each site tailoring its product offering to the specific needs of farmers, growers, and professional non-crop consumers in its service area. Our product offering, coupled with the advice of our sales professionals, provides our customers with a “one-stop shop” for all their agricultural and/or professional non-crop needs.
Chemicals. Sales of chemicals to both agricultural and professional non-crop customers represent a significant portion of our business, accounting for approximately 60% of our net sales in fiscal 2006. We distribute a full range of chemicals, through our distribution locations, including herbicides, insecticides, fungicides, adjuvants, and surfactants. We also provide a variety of services related to the application of certain chemicals.
Fertilizer. We distribute a full range of fertilizer products through our distribution centers, including nitrogen, potassium, and phosphorous, as well as various micronutrients such as iron, boron, and calcium. We also provide fertilizer application services and customized fertilizer blending for the specific needs of individual growers.
Seed. We have placed an emphasis on new seed technology and provide a complete range of seed and seed treatments to growers through our distribution centers. Many of our seed products are sourced from leading seed companies and sold both under their brand names and our private labels (for example, Dyna-Gro®). As a result of advances in seed technology, we often bundle chemicals with complementary seed products.
Services. In addition to selling traditional crop production inputs, our distribution centers provide agronomic services to growers. These services range from traditional custom blending and application of crop nutrients to meet the needs of individual growers, to more sophisticated and technologically advanced services such as soil sampling, pest level monitoring, and yield monitoring using global position systems satellite grids and satellite-linked variable rate spreaders and applicators to analyze the data. In addition, we recently launched a comprehensive crop and soil nutritional service called NutriScription®. This service provides specific recommendations for a customer’s crop or turf needs.
Professional Products. We also distribute chemicals, fertilizer, and seed to various professional non-crop markets, such as turf and ornamental (golf courses, resorts, nurseries, and greenhouses), pest control operators, forestry, and vegetation management. The professional non-crop products business is a niche market unique from most of our agricultural customers and requires different service levels. We service these unique markets from our locations that lie close to suburban areas or leisure centers. We believe we are the only national distributor in our markets with a presence in the three major professional
7

non-crop market areas of turf and ornamental, pest control operators, and vegetation management. Sales to professional non-crop customers are included in our discussion of chemicals, fertilizer, and seed.
The following table shows net sales dollars and the percentage of our net sales by product category for fiscal years 2006, 2005, and 2004, respectively:
Fiscal Year Ended
Product Category
February 26, 2006
February 27, 2005
February 22, 2004
(dollars in thousands) (percentages are of total net sales for the corresponding fiscal year)
Net Sales
Net Sales
Net Sales
Chemicals .......................................... $ 1,633,862 60% $ 1,580,789 63% $ 1,579,700 64% Fertilizer............................................. 682,137 25% 565,287 23% 526,162 21% Seed ................................................... 349,318 13% 302,922 12% 258,942 11% Other .................................................. 62,472 2% 57,732 2% 87,081 4%
Total ......................................... $ 2,727,789 100% $ 2,506,730 100% $ 2,451,885 100%
In fiscal 2006, our top ten brands accounted for approximately 14% of net sales.
Proprietary and Private Label Products We coordinate the marketing, registration and regulatory affairs, sourcing, formulation, and packaging operations for our proprietary and private label products. Our marketing group works with our operating regions to manage our product portfolio, sales activities, advertising, and technical service. We operate three formulation facilities that produce certain of our proprietary branded products as well as some private label products. These products are developed independently by us or in cooperation with our leading suppliers. These products are distributed almost entirely through our network of 340 distribution locations. Additionally, we maintain over 400 federal sub-registrations from basic manufacturers. In order to support these proprietary private label products and sub-registrations, we maintain approximately 7,800 state registrations.
We market approximately 220 of our own proprietary branded products. We have a broad product offering of proprietary brands in each of our product categories. Some of our key proprietary branded products in each category are listed in the table below:
Categories
Key Proprietary Branded Products
Chemicals / Adjuvants ............................................. Saber®, Savage®, Salvo®, Strategy®, Amplify®, LI 700®, Choice®, Weather Guard®, Liberate®, Activator 90®, Boll Buster®
Fertilizer................................................................... ACA®, Awaken®, Nortrace®
Seed and Seed Treatments ....................................... Dyna-Gro®, DynaStart®, So-Fast®
Professional Non-Crop ............................................ Signature®, Bisect®
Our proprietary and private label products allow us to enhance our product offering and provide formulations designed to meet the needs of growers and professional non-crop users. As a result, we typically are able to obtain a higher contribution margin from our proprietary and private label products than from the branded products we distribute from other suppliers. We believe our proprietary and private label products represent a significant value for our customers and help increase the overall value of our suppliers’ products. Our formulation plants also provide formulating, blending, and packaging services for third parties, primarily our major suppliers, allowing us to leverage our fixed costs and increase plant efficiencies.
INTELLECTUAL PROPERTY
We use a wide array of technological and proprietary processes to enhance our chemical, fertilizer, seed, and product development programs. We believe these technologies and proprietary processes enable us to create novel product concepts and reduce time to market. In certain circumstances, we file for patents on technology that we believe is patentable. As of February 26, 2006, we held approximately 260 trademarks (pending or registered) in the United States either directly or through one of our subsidiaries, and United Agri Products Canada Inc., one of our subsidiaries, held approximately 60 Canadian trademarks (pending or registered) either directly or through one of its subsidiaries. These trademarks pertain to products formulated and distributed by us, including chemicals, plant nutrition products, fertilizer, and seed. In addition, we possess contractual rights to certain trademarks held by third parties through arrangements with certain of our suppliers and
8
distributors. Intellectual property rights help protect our products and technologies from use by competitors and others. In addition to trademarks, intellectual property rights of importance to us include trade secrets, confidential statements of formulation, and other proprietary manufacturing information. We use nondisclosure agreements to protect our proprietary and confidential information. Such nondisclosure agreements specifically address the confidential information disclosed and concern the protection of our intellectual property. Our objectives are to prevent disclosure of sensitive information and to protect our legal interests if our trade secrets are appropriated. We will continue to aggressively enforce all of our intellectual property rights.
SEASONALITY
Our and our customers’ businesses are seasonal, based upon the planting, growing, and harvesting cycles. During fiscal 2004 through 2006, greater than 75% of our net sales occurred during the first and second fiscal quarters of each year because of the condensed nature of the planting season. As a result of the seasonality of sales, we experience significant quarterly fluctuations in our revenues, income, and working capital levels. See “Item 7. Management’s Discussion and Analysis of Financial Condition and Results of Operations – Seasonality and Quarterly Fluctuations” for further information.
Our integrated network of formulation and blending, distribution and warehousing facilities, and technical expertise allows us to efficiently process, distribute, and store products close to our end-users and to supply our customers on a timely basis during the compressed planting and growing seasons. See “Item 1A. Risk Factors—Our and our customers’ businesses are subject to seasonality and this may affect our revenues, carrying costs and collection of receivables” for further information.
Due to the seasonal nature of our business, the amount of borrowings outstanding under our revolving credit facility varies significantly throughout the fiscal year. During fiscal 2006, outstanding borrowings (net of cash on hand) reached a period end peak of $276.3 million on October 23, 2005, while cash on hand reached a period end peak of $79.2 million (with no borrowings under the revolving credit facility) on February 26, 2006. Our average period end borrowings (net of cash on hand) for fiscal 2006, were approximately $22.2 million.
COMPETITION
The market for the distribution of chemicals, fertilizer, seed, and agronomic services is highly competitive. In each of our local markets, we typically compete with two or more other distributors. These distributors include agricultural cooperatives, multinational corporation-owned distribution outlets, and other independent distribution companies. Agricultural cooperatives are operated for the benefit of their member growers and include companies such as Agriliance, LLC, and Growmark, Inc. Multinational corporation-owned distribution outlets include companies such as Helena Chemical Company (a subsidiary of Marubeni Corporation) and Royster-Clark, Inc (recently acquired by Agrium Inc.). We generally compete with other distributors on the basis of breadth of product offering, ability to provide “one-stop shopping” with customized local products and services, our sales force’s knowledge of and relationships with our customers, and price. Additionally, we compete within our industry for talented employees in the areas of sales and operations. We strive to provide a competitive compensation and benefits package to retain and attract key employees.
SALES ON CREDIT, EXTENSIONS OF CREDIT, AND ACCOUNTS RECEIVABLE
A significant portion of our sales to growers and independent retailers are made through the use of our credit programs. Typically, we sell products and services on cash or credit terms, with credit terms ranging from 30 days to crop terms. Crop terms typically require payment in December following harvest. Many customer accounts accrue service charges. The interest rate on such service charges varies by state, subject to maximum allowable interest under the particular state’s laws. As of February 26, 2006, our aggregate accounts receivable, most of which constituted extensions of credit to trade customers, totaled $301.6 million compared to $248.6 million as of February 27, 2005.
We have a dedicated and focused credit department, responsible for all our credit and customer receivable risk management. Our credit department is also responsible for establishing credit terms and credit limits, compiling data and generating reports to monitor collections, reserves for bad debt, and progress of credit related initiatives, assuring data integrity, and distributing relevant reports to our field credit managers. Our credit policies and procedures include a detailed computerized analysis of a particular customer’s credit prior to the sale, routine monitoring of customer credit limits, and systematic inactivation of non-conforming accounts. Our centralized credit and procurement functions are responsible for coordinating various sales and working capital initiatives. Our customer prepay program, coordinated by our sales, credit, and procurement staffs, encourages customers to prepay us for their future crop input needs. As of February 26, 2006, we had a net balance of customer prepayments, which are classified as current liabilities, of $279.2 million compared to $271.2 million as of February 27, 2005. 9

MANAGEMENT INFORMATION SYSTEMS
Our finance, credit, and information technology departments are responsible for all our financial reporting, information technology and operating systems, treasury and cash management, financial analysis and budgeting, tax filings, and credit and risk management.
In addition, our finance and credit departments perform financial modeling and analysis, due diligence, and contract negotiations for acquisitions. Our credit department also establishes credit terms and credit limits, compiles data and generates reports to monitor collections, reserves for bad debt, and progress of credit related initiatives, assures data integrity, and distributes relevant reports to the field credit managers.
We have a point-of-sale computer system at our locations, which provide daily reports, including sales and profitability data, credit information, and working capital data. We use these systems to provide data for inventory control, credit controls, budgeting, forecasting, and working capital management requirements.
RAW MATERIALS AND SUPPLIES
We purchase chemicals and seed from many of the world’s leading agricultural input and professional non-crop manufacturers. We have contracts with BASF, Bayer Crop Science, Dow AgroSciences, DuPont, Monsanto, Syngenta, and other prominent suppliers in the industry. We purchase chemical and seed products at the manufacturer’s distributor price and typically receive a rebate based on volume and type of product. The rebate is typically paid near the end of the calendar year, but may be partially paid in advance. Such rebate programs may be published programs, in which case rebates are calculated similarly among all buyers, or unpublished programs, in which case rebates are structured solely according to our business.
We purchase fertilizer from many of the world’s leading fertilizer manufacturers. Our largest suppliers are Agrium, ConAgra International Fertilizer Company, Mosaic, Koch Industries, Simplot, Potash Corp, and Terra. We purchase at the supplier’s market price and may receive a rebate based on our purchased volume with a particular supplier. We may prepay for fertilizer in advance of our peak selling seasons (late fall and early spring) in order to lock in a price for a portion of our forecasted need.
EMPLOYEES AND LABOR RELATIONS
As of February 26, 2006, we employed approximately 2,950 non-unionized and salaried employees, approximately 75 unionized employees, and approximately 275 temporary employees to meet our seasonal needs. We believe we have good relations with our employees. All our unionized employees work at our formulation facility in Greenville, Mississippi, and are all subject to a collective bargaining agreement. This collective bargaining agreement is scheduled to expire in August 2007, but is subject to automatic renewals for additional year-long periods unless otherwise terminated. We have not had any work stoppages in the past five years.
ENVIRONMENTAL MATTERS
Our facilities and operations must comply with a wide variety of federal, state, and local environmental laws, regulations and ordinances, including those related to air emissions, water discharges, and chemical and hazardous waste management and disposal. Our operations are regulated at the federal level under numerous laws, including the Federal Insecticide, Fungicide, and Rodenticide Act, the Emergency Planning and Community Right to Know Act, the Clean Air Act the Clean Water Act, the Resource Conservation and Recovery Act, the Occupational Safety and Health Act, the Hazardous Materials Transportation Act, and, at the state level, analogous state laws and regulations. Our operations also are governed by laws relating to workplace safety and worker health; primarily the rules of the Occupational Safety and Health Administration and the United States Department of Transportation. Non-compliance with these environmental, health, and safety laws can result in significant fines or penalties or restrictions on our ability to sell or transport products. We manage these regulatory risks by employing a staff of highly trained professionals, by performing periodic compliance audits, and by participating in industry stewardship initiatives. We believe that our operations are in compliance in all material respects with current requirements under environmental, transportation, and employee safety laws, except for matters that are not expected to have a material adverse effect on our business, financial conditions, results of operations, or liquidity.
Environmental laws may hold current owners or operators of land or businesses liable for their own and for previous owners’ or operators’ releases of hazardous or toxic substances, materials or wastes, pollutants or contaminants, including petroleum and petroleum products. Because of our operations, the history of industrial or commercial uses at some of our facilities, the operations of predecessor owners or operators of some of the facilities, and the use, production and release of hazardous
10

substances at these sites, we are affected by the liability provisions of environmental laws. Many of our facilities have experienced some level of regulatory scrutiny in the past and are or may be subject to further regulatory inspections, future requests for investigation, or liability for hazardous substance management practices.
From time to time, we incur expenses in connection with remediation of hazardous substances, including chemicals and fertilizer in soil and/or groundwater at our current and former facilities. While a portion of this work is conducted on a voluntary basis under state law, most of it is conducted as part of a state directed enforcement action, some of which provides for reimbursement of expenses by state agricultural funds. In addition, we are engaged in corrective action under the Resource Conservation and Recovery Act at our facilities in Billings, Montana and Garden City, Kansas, and our former facility in Nichols, Iowa. We have also removed or closed underground storage tanks from some of our facilities and, in some instances, are responding to historic releases at these locations. In total, both voluntary and government ordered cleanups of releases of hazardous substances are planned or being performed at approximately 20 sites. In some cases, third parties (including government reimbursement funds and insurers) may contribute to the costs of cleanup at these sites. Without consideration of third-party contributions, the cost of these on-going and potential response actions is not expected to have a material adverse effect on our business, financial condition, results of operations, or liquidity.
The Comprehensive Environmental Response, Compensation and Liability Act, as amended (“CERCLA”), provides for responses to, and, in some instances, joint and several liability for releases of hazardous substances into the environment. At the present time, there are three off-site disposal or formulation facilities at which we have been identified as a potentially responsible party under CERCLA: Malone in Texas City, TX; Red Panther in Clarksdale, MS; and Aberdeen Pesticide Dump in Aberdeen, N.C. We believe that the cost of participating in these on-going and potential response actions will not have a material adverse effect on our business, financial condition, results of operations, or liquidity.
ConAgra has agreed to provide us with a partial reimbursement of costs that we may incur in the future relating to any cleanup requirements arising out of certain environmental conditions at our Greenville, Mississippi facility that existed prior to the Acquisition. On October 14, 2002, December 23, 2002, and December 31, 2002, three separate lawsuits were filed in the Circuit Court of Washington County, Mississippi against our subsidiary, Platte Chemical Co. (“Platte”), and certain former employees of Platte, relating to alleged releases from Platte’s Greenville, Mississippi facility. The plaintiffs in such suits are seeking compensation for alleged personal injury and property damage. In connection with the Acquisition, ConAgra agreed to partially reimburse us, subject to a cap, for fees and expenses we incur in connection with such lawsuits. Subsequent to November 23, 2003, another lawsuit not covered by the ConAgra cost sharing agreement was filed in the Circuit Court of Washington County, Mississippi against us and Apollo Management, L.P. (“Apollo”), which lawsuit relates to the same alleged releases from the Greenville, Mississippi facility. While discovery in the Greenville litigations is not yet complete, based on information available to us at this time we do not believe that such litigations, if adversely determined, would have a material adverse effect on our business, financial condition, results of operations, or liquidity.
REGULATORY LICENSES AND APPROVALS
As a seller and distributor of crop production inputs, we are subject to registration requirements under the Federal Insecticide, Fungicide and Rodenticide Act and related state statutes, which require us to provide information to regulatory authorities regarding the benefits and risks of the products we sell and distribute, and to periodically update that information. Risk information supplied to governmental authorities by us or others could result in the cancellation of products or in limitations on their use. In addition, these laws regulate information contained in product labels and in promotional materials, require that products are manufactured in adherence to manufacturing specifications, and impose reporting and recordkeeping requirements relating to production and sale of certain pesticides. Non-compliance with these environmental, health and safety laws can result in significant fines, penalties, or restrictions on our ability to sell our products. Based on our experience to date, these requirements are not expected to have a material adverse effect on our business, financial condition, results of operations, or liquidity.
AVAILABLE INFORMATION
We make available free of charge on our web site, www.uap.com, our annual reports on Form 10-K, quarterly reports on Form 10-Q, and current reports on Form 8-K, and amendments to those reports filed or furnished pursuant to Section 13(a) or 15(b) of the Securities Exchange Act of 1934 (the “Exchange Act”), as soon as reasonably practicable after we electronically file such material with, or furnish it to, the SEC. On the investor relations page of our web site we also maintain certain corporate governance documents, including the Company’s codes of conduct, and our board of director’s various committee harters. We do not intend for the information found on our web site to be part of this document. c
11

Item 1A. Risk Factors. You should carefully consider the risk factors set forth below as well as the other information contained in this Report. The risks described below are not the only risks facing us. Additional risks and uncertainties not currently known to us or those we currently deem to be immaterial may also materially and adversely affect our business, financial condition, cash flow, or results of operations. Any of the following risks could materially adversely affect our business, financial condition, cash flow, or results of operations.
Our and our customers’ businesses are subject to seasonality and this may affect our revenues, carrying costs, and collection of receivables. Our and our customers’ businesses are seasonal, based upon the planting, growing and harvesting cycles, and the inherent seasonality of the industry we serve could have a material adverse effect on our business. During fiscal 2006, 2005, and 2004, greater than 75% of our net sales occurred during the first and second fiscal quarters of each year because of the condensed nature of the planting and growing seasons. Because interim period operating results reflect the seasonal nature of our business, they are not indicative of results expected for the full fiscal year. In addition, quarterly results can vary significantly from one year to the next due primarily to weather-related shifts in planting schedules and purchase patterns. We incur substantial expenditures for fixed costs throughout the year and substantial expenditures for inventory in advance of the spring planting season.
Seasonality also relates to the limited windows of opportunity that our customers have to complete required tasks at each stage of crop cultivation. Should events such as adverse weather or transportation interruptions occur during these seasonal windows, we would face the possibility of reduced revenue without the opportunity to recover until the following season. In addition, because of the seasonality of agriculture, we face the risk of significant inventory carrying costs should our customers’ activities be curtailed during their normal seasons. The seasonality of our industry can also affect the amount of customer bad debt that may result on our books and can negatively impact our accounts receivable collections.
Weather conditions may materially impact the demand for our products and services. Weather conditions have a significant impact on the farm economy and, consequently, on our operating results. Weather conditions affect the demand and, in some cases, the supply of products, which in turn may have an impact on our prices. For example, weather patterns such as flood, drought, or frost can cause crop failures that in turn affect the supply of feed and seed and the marketing of grain products, as well as the demand for chemicals, fertilizer, seed, and other agronomic supplies. In recent years, we have experienced unusually severe weather conditions, including hurricanes, ice storms, floods, wind damage, and a summer dearth of water and pasture in some states. Adverse weather conditions can also impact the financial position of agricultural producers who do business with us, including producers to whom we extend credit. This, in turn, may adversely affect the ability of those producers to pay their obligations to us in a timely manner. Accordingly, the weather can have a material effect on our business, financial condition, cash flow, or results of operations.
Our industry is very competitive and increased competition could reduce our sales and profit margins. We operate in a highly competitive and fragmented industry, particularly with respect to price and service. Our principal competitors in the distribution of crop production inputs include agricultural cooperatives, international fertilizer producers, major grain companies, independent distributors, and brokers. Some of our competitors may have greater financial, marketing, and research and development resources, and/or better name recognition than we do and can better withstand adverse economic or market conditions. In addition, as a result of increased pricing pressures caused by competition, we may experience reductions in the profit margins on sales or may be unable to pass future material price increases on to our customers, each of which would reduce profit margins. Government regulation and agricultural policy may affect the demand for our products and therefore our financial viability. Existing and future government regulations and laws may greatly influence how we operate our business, our business strategy, and ultimately, our financial viability. Existing and future laws may impact the amounts and locations of pesticide and fertilizer applications. The Clean Water Act and the equivalent state and local water pollution control laws are designed to protect water quality. Pesticide and fertilizer applications have been identified as a source of water pollution and are currently regulated and may be more closely regulated in the future. This regulation may lead to decreases in the quantity of pesticides and fertilizer applied to crops. The application of fertilizer can also result in the emissions of nitrogen compounds and particulate matter into the air. Compliance with future requirements to limit these emissions under the Clean Air Act and the equivalent state and local air pollution control laws may affect the quantity and/or timing of fertilizer used by our customers.
12

U.S. governmental policies and regulations may directly or indirectly influence the number of acres planted, the level of inventories, the mix of crops planted, crop prices, and the amounts of and locations where pesticides and fertilizer may be applied. The market for our products could also be affected by challenges brought under the Endangered Species Act and by changes in regulatory policies affecting genetically modified seeds.
Our industry is dependent on farm expenditures for crop inputs. Factors that affect the levels of crop input spending could adversely impact our business. We operate in the agricultural inputs distribution industry. Our industry depends on farm expenditures for crop inputs, which in turn is dependent upon planted acreage in the United States. The amount of crop input expenditures and planted acreage can be impacted by the following factors:
• grain prices; • crops planted in other parts of the world including Brazil and Argentina; • the types of crops planted in the U.S., which have various levels of input spending requirements; • government subsidies; and • our customer’s net income levels, which can be impacted by the above factors as well as interest rates, labor costs,
fuel prices, and crop input costs.
Our growth within the agricultural inputs distribution industry is partially dependent upon acquisitions, which could adversely affect our future performance. The growth in net sales and operating income of our business depends in part on our ability to expand through acquisitions and on our ability to assimilate new businesses and locations into our existing operations successfully. Our failure to do this could adversely impact our future financial performance. Please refer to “Item 7. Management’s Discussion and Analysis of Financial Condition and Results of Operations - Building upon our Distribution Network” for more information.
We are subject to expenses, claims, and liabilities under environmental, health and safety laws and regulations. We operate in a highly regulated environment. As a producer and distributor of crop production inputs, we must comply with federal, state, and local environmental, health, and safety laws and regulations. These regulations govern our operations and our storage, handling, discharge, and disposal of a variety of substances. Our operations are regulated at the federal level under numerous laws, including the Clean Air Act, the Clean Water Act, the Resource Conservation and Recovery Act, the Occupational Safety and Health Act, and at the state level under analogous state laws and regulations. As a formulator, seller, and distributor of crop production inputs, we are also subject to registration requirements under the Federal Insecticide, Fungicide and Rodenticide Act and related state statutes, which require us to provide information to regulatory authorities regarding the benefits and risks of the products we sell and distribute, and to update that information. Risk information supplied to governmental authorities by us or others could result in the cancellation of products or in limitations on their use. In addition, these laws govern information contained in product labels and in promotional materials, require that products are manufactured in adherence to manufacturing specifications, and impose reporting and recordkeeping requirements relating to production and sale of certain pesticides. Non-compliance with these environmental, health, and safety laws can result in significant fines, penalties, or restrictions on our ability to sell or transport products.
Under the Comprehensive Environmental Response, Compensation, and Liability Act of 1980, we could be held jointly and severally responsible for the removal or remediation of any hazardous substance contamination at facilities that we currently own or operate, at facilities that we owned or operated in the past, at neighboring properties to which such contamination has migrated from our facilities, and at third party waste disposal sites to which we have sent wastes. We could also be held liable for natural resource damages.
We may incur substantial costs to comply with these environmental, health, and safety law requirements. We also may incur substantial costs for liabilities arising from past releases of, or exposure to, hazardous substances. From time to time claims have been made against us alleging injury arising out of human exposure to these substances or other damage, including property damages. Currently, four such claims are pending in relation to our Platte facility. In addition, we may discover currently unknown environmental problems or conditions. The continued compliance with environmental laws, the discovery of currently unknown environmental problems or conditions, changes in environmental, health, and safety laws, and regulations or other unanticipated events may subject us to material expenditures or liabilities in the future.
13

Our substantial indebtedness could adversely affect our financial condition and impair our ability to operate our business or pay dividends on our common stock. As of February 26, 2006, we had $306.3 million of outstanding indebtedness, consisting of $203.5 million of the 8 1/4% Senior Notes and $102.8 million of the 10 3/4% Senior Discount Notes. There were no obligations then outstanding related to our revolving credit facility.
We are a highly leveraged company and this level of leverage could have important consequences, including the following: • It may limit our ability to borrow money or sell stock to fund our working capital, capital expenditures, and debt
service requirements. • It may limit our flexibility in planning for, or reacting to, changes in our business. • We may be more highly leveraged than some of our competitors, which may place us at a competitive
disadvantage. • It may make our financial results more vulnerable to a downturn in our business or the economy. • It will require us to dedicate a substantial portion of our cash flow from operations to the repayment of our
indebtedness, thereby reducing the availability of our cash flow for other purposes, such as payments of dividends on our common stock.
• It may materially and adversely affect our business and financial condition if we are unable to service our indebtedness or obtain additional financing, as needed.
In addition, the indenture governing the 8 1/4% Senior Notes, the indenture governing the 10 3/4% Senior Discount Notes, and the revolving credit facility contain financial and other restrictive covenants discussed below that may limit our ability to engage in activities that may be in our long-term best interest. Our failure to comply with those covenants could result in an event of default, which, if not cured or waived, could result in the acceleration of all of our debt. Restrictive covenants in the agreements governing our indebtedness may restrict our ability to pursue our business strategies or pay dividends on our common stock. The revolving credit facility, the indenture governing the 8 1/4% Senior Notes, and the indenture governing the 10 3/4% Senior Discount Notes limit our ability and the ability of our restricted subsidiaries, among other things, to:
• incur additional indebtedness or contingent obligations; • pay dividends or make distributions to our stockholders; • repurchase or redeem our stock; • make investments; • grant liens; • make capital expenditures; • enter into transactions with our stockholders and affiliates; • sell assets; and • acquire the assets of, or merge or consolidate with, other companies.
In addition, the revolving credit facility requires us to maintain an interest coverage ratio and minimum EBITDA (as defined in our revolving credit facility), if revolving credit availability drops below $40.0 million. Although we have historically always been able to maintain this financial ratio and minimum EBITDA, we may not be able to maintain this ratio and minimum EBITDA in the future. Covenants in the revolving credit facility may also impair our ability to finance future operations or capital needs or to enter into acquisitions or joint ventures or engage in other favorable business activities.
If we default under the revolving credit facility under certain circumstances, the lenders could require immediate payment of the entire principal amount. These circumstances include, among other things, a change of control, default under agreements governing our other indebtedness, material judgments in excess of a specified amount, or breach of representations and warranties. Any default under the revolving credit facility or agreements governing our other indebtedness could lead to an acceleration of debt under our other debt instruments that contain cross-acceleration or cross-default provisions. If the lenders under the revolving credit facility require immediate repayment, we will not be able to repay them and also repay our other indebtedness in full. Our ability to comply with these covenants and restrictions contained in the revolving credit facility and other agreements governing our other indebtedness may be affected by changes in the economic or business conditions or other events beyond our control.
14

On May 3, 2006, we launched a tender offer for our 10 3/4% Senior Discount Notes and the 8 1/4% Senior Notes in order to refinance our long-term debt and obtain consents to eliminate most of the restrictive covenants from the indentures. We cannot assure you that the tender offer and consent solicitation will be successful. See “Item 7. Management’s Discussion and Analysis of Financial Condition and Results of Operations – Recent Developments,” for more information regarding the refinancing of our long-term debt.
Our profitability depends significantly on rebates from our suppliers. If we are unsuccessful in earning, negotiating, or collecting rebates, it could have an adverse impact on our business. We receive rebates from chemical and seed suppliers based on programs offered to all of their customers. The programs vary based on product type and specific supplier practice. The majority of the rebate programs run on a crop year basis, typically from October 1st to September 30th, although other periods are sometimes utilized. The majority of these rebates are product-specific and are based on our sales of that product in a given crop year. Our ability to earn, negotiate, and collect rebates is critical to the success of our business. Generally, we sell the chemicals and seed we purchase from suppliers at a reduced margin, with the profit from any sales of such products being made primarily from rebates from suppliers. We price our products to our customers based on the amount of rebates we expect to receive at year-end. However, the amount of rebates we earn and the nature of our rebate programs are determined by our suppliers and are directly related to the performance of our business. If our sales in any crop year are lower than expected, either because of poor weather conditions, increased competition, or for any other reason, we may earn fewer rebates, and our gross margins may suffer. Additionally, our suppliers may reduce the amount of rebates offered under their programs, or increase the sales goals or other conditions we must meet to earn rebates to levels that we cannot achieve. Finally, our ability to negotiate individually for additional rebates may cease or become limited, and our efforts to collect cash rebates periodically throughout the year may be unsuccessful. The occurrence of any of these events could have an adverse impact on our margins, net income, or business.
For more information, see “Item 7. Management’s Discussion and Analysis of Financial Condition and Results of Operations – Critical Accounting Policies and Estimates – Vendor Rebate Receivables” and Note 1 in Notes to Financial Statements.
Our success depends on a limited number of key employees and we may not be able to adequately replace them if they leave. We believe that the success of our business strategy and our ability to operate profitably depend on the continued employment of our senior management team. The loss of the services of some of these key employees could have a material adverse effect on us. See “Executive Officers of the Registrant”, immediately following “Item 4. Submission of Matters to a Vote of Security Holders.”
UAP Holding Corp. is a holding company and we will rely on our subsidiaries for cash to pay dividends on our common stock. UAP Holding Corp. has no direct operations and no significant assets other than ownership of 100% of the stock of United Agri Products, Inc. Because UAP Holding Corp. conducts its operations through its subsidiaries, UAP Holding Corp. depends on those entities for dividends and other payments to generate the funds necessary to meet its financial obligations and to pay dividends with respect to the common stock. Legal and contractual restrictions in the revolving credit facility and other agreements governing current and future indebtedness of UAP Holding Corp.’s subsidiaries, as well as the financial condition and operating requirements of UAP Holding Corp.’s subsidiaries, may limit UAP Holding Corp.’s ability to obtain cash from its subsidiaries. All of UAP Holding Corp.’s subsidiaries are separate and independent legal entities and have no obligation whatsoever to pay any dividends, distributions, or other payments to UAP Holding Corp.
Our largest stockholder influences us and its interests may conflict with or differ from our and/or your interests in the future. As of May 10, 2006, Apollo and its affiliates beneficially owned approximately 17% of our common stock. In addition, representatives of Apollo currently occupy three of the seven seats on our board of directors. As a result, Apollo has the ability to influence all matters requiring stockholder approval, including the election of our directors and the approval of significant corporate transactions such as mergers, tender offers, and the sale of substantially all of our assets. The interests of Apollo and its affiliates, as holders of common stock, could conflict with or differ from your interests. For example, Apollo could influence us to increase the amount of dividends payable with respect to our common stock, or to make acquisitions, or pursue restructurings or other transactions in ways that could increase our leverage or otherwise impair our creditworthiness. In addition, Apollo could pursue acquisition opportunities that may be complementary to our business, and as a result, those acquisition opportunities may not be available to us.
15

Further, we anticipate that as Apollo continues to sell shares of common stock and further reduces its beneficial ownership or ceases to be a beneficial owner of our common stock altogether, some or all of the Apollo representatives will no longer serve on our board of directors. While we expect that over time the board and our stockholders will be able to replace or elect new directors to fill any vacancies created by the resignation of those directors affiliated with Apollo, any sudden vacancies could be disruptive to senior management and the remaining board members, which could have an adverse effect on us.
Item 1B. Unresolved Staff Comments. N
one.
16

Item 2. Properties. Our properties are located in major crop-producing regions of the United States and Canada. We are headquartered in Greeley, Colorado, and we operate three formulation facilities located throughout the United States. The following table lists our principal locations and the square footage along with the production capacity in terms of square footage:
Location
Owned/Leased
Function
Building(s) Square Footage
Formulating/Production Square Footage
Greeley, Colorado..................................... Leased Headquarters 47,753 N/A Greeley, Colorado..................................... Owned Formulating 67,100 11,500 Greenville, Mississippi ............................. Owned Formulating 291,000 57,000 Billings, Montana ..................................... Owned Formulating 61,071 20,320
We sold a substantial portion of the assets at a formulation facility located in Fremont, Nebraska in October 2004, and are actively marketing the remaining assets and buildings at this time. Since May 2005, we have ceased all operations at the Fremont, Nebraska facility. In addition, we closed a formulation facility located in Caldwell, Idaho in October 2004, and sold that property in October 2005.
In addition, as of February 26, 2006, we owned or leased approximately 340 properties that are used to maintain inventory, distribute, and sell our products to our customers. We determine the number of distribution and storage facilities as those managed by a single location manager. Because there may be more than one property that we own or lease managed by a location manager, our approximately 340 distribution and storage facilities are less than the total number of leased and owned properties. We also utilize other miscellaneous facilities in our distribution business, mainly for seasonal storage. We operate these properties through the five primary geographic regions as noted below:
Region
States/Provinces Served
Owned
Leased
Northeast CT, DE, IL, IN, KY, MA, MD, ME, MI, MO, NH, NJ, NY, OH, PA, RI, VA, VT, WI, WV 42 52
Southeast AL, AR, FL, GA, MO, MS, NC, SC, TN 20 64
West AK, AZ, CA, CO, HI, ID, KS, LA, MO, NE, NM, NV, OK, OR, TX, UT, WA, WY 37 54
Midwest IA, MN, MT, ND, NE, SD, WY 35 27
Canada AB, BC, MN, NB, NS, ON, PEI, QU, SK 5 7
Administrative CO — 1
Total 139 205
Mortgages on 34 of our owned properties secure our obligations under the revolving credit facility.
We believe that our facilities are well maintained, suitable for our business, and occupy sufficient space to meet our operating needs. As a part of our normal business, we regularly evaluate our locations’ financial and operational performance and site suitability, and may relocate a location or consolidate locations that are redundant, located in a market that is under performing, or otherwise deemed unsuitable. We do not believe that any single location, leased or owned, is material to our operations.
17

Item 3. Legal Proceedings. In addition to the matters discussed above under “Item 1. Business—Environmental Matters,” we are involved in periodic litigation in the ordinary course of our business, including lawsuits brought by employees and former employees alleging discriminatory practices, intellectual property infringement claims, product liability claims, property damage claims, personal injury claims, contract claims, and worker’s compensation claims. We do not believe that there are any pending or threatened legal proceedings, including ordinary litigation incidental to the conduct of our business and the ownership of our properties that, if adversely determined, would have a material adverse effect on our business, financial condition, results of operations, or liquidity. However, we cannot assure you that future litigation will not adversely affect our business, financial condition, cash flow, or results of operations.
Item 4. Submission of Matters to a Vote of Security Holders. None.
Executive Officers of the Registrant The executive officers of UAP Holding Corp. are listed as follows. There are no family relationships among them.
Name
Age
Date First Elected Executive Officer
Position
L. Kenneth Cordell ........ 48 2003 President, Chief Executive Officer and Director Bryan S. Wilson............. 46 2003 President, Distribution David W. Bullock .......... 41 2003 Executive Vice President and Chief Financial Officer David Tretter.................. 49 2003 Executive Vice President, Procurement Kevin Howard................ 39 2004 Executive Vice President, Products Company Todd A. Suko................. 39 2003 Vice President, General Counsel and Secretary Alan E. Kessock............. 46 2006 Chief Accounting Officer
BUSINESS EXPERIENCE L. Kenneth Cordell has been the President and a director of UAP Holding Corp. and United Agri Products, Inc. since the closing of the Acquisition on November 24, 2003, and became the Chief Executive Officer of United Agri Products in December 2003 and of UAP Holding Corp. in January 2004. He joined UAP in 2001 and was promoted to President and Chief Operating Officer in February 2002. Prior to joining UAP, Mr. Cordell worked for FMC Agricultural Products Group from 1992 to 2001, serving most recently as Director of the North American Agricultural Products Group. Mr. Cordell also held various positions in the agricultural units of BASF (1989 to 1992) and Rohm & Haas (1979 to 1989).
Bryan S. Wilson has been the President, Distribution of UAP Holding Corp. and United Agri Products, Inc. since January 2004. He joined UAP in September 2002 as President and General Manager, Products and Non-Crop. Prior to joining UAP, Mr. Wilson worked for BASF from 1987 to 2002, holding various positions both domestically and internationally, serving most recently as President of Microflo, Inc., a subsidiary of BASF.
David W. Bullock has been Executive Vice President of UAP Holding Corp. and United Agri Products, Inc. since the closing of the Acquisition on November 24, 2003, and became the Chief Financial Officer of United Agri Products in December 2003 and of UAP Holding Corp. in January 2004. He joined UAP in June 2002 as Senior Financial Officer. Prior to joining UAP, Mr. Bullock worked for FMC Agricultural Products Group from 1995 to 2002, serving most recently as Controller of the North American agriculture business. Mr. Bullock also held various financial positions with Air Products and Chemicals (1991 to 1995).
David Tretter has been Executive Vice President, Procurement for UAP Holding Corp. and United Agri Products, Inc. since the closing of the Acquisition on November 24, 2003. He joined UAP in July 1985 as Fertilizer Manager and has held various positions in sales management, general management, and executive management since that time. Prior to joining UAP, Mr. Tretter was Vice President of Operations for Pasquales Food in Birmingham, AL.
Kevin Howard has been the Executive Vice President, Products Company of UAP Holding Corp. and United Agri Products, Inc. since January 2004. Prior to joining UAP, Mr. Howard worked for BASF from 1997 through 2003, serving most recently as Vice President of Operations for Microflo Inc. (a division of BASF). Prior to joining BASF, Mr. Howard held various sales and marketing positions with Sandoz from 1990 through 1996.
Todd A. Suko has been the Vice President, General Counsel and Secretary of UAP Holding Corp. and United Agri Products, Inc. since the Acquisition on November 24, 2003. He joined United Agri Products in February 2001 as Associate Counsel
18

and was promoted to Vice President Legal and Regulatory Services and Corporate Counsel in October 2002. Prior to joining United Agri Products, he practiced law at McKenna & Cuneo, LLP in Washington, D.C. from 1996 to 2001.
Alan E. Kessock has been Chief Accounting Officer of UAP Holding Corp. and United Agri Products, Inc. since April 2006. He joined UAP in March 2006 as Corporate Controller. Prior to joining UAP, he served as the Director of Retail Planning and Analysis at Circuit City Stores, Inc. Prior to joining Circuit City, Inc., Mr. Kessock served as Vice President and Treasurer for Affordable Residential Communities from February to August 2005. Prior to that time, Mr. Kessock served in various positions at Ultimate Electronics, Inc., including Controller, Senior Vice President of Finance, Chief Financial
fficer, and Senior Vice President of Operations, from 1985 to 2004. O
19
PART II
Item 5. Market for Registrant’s Common Equity, Related Stockholder Matters, and Issuer Purchases of Equity Securities.
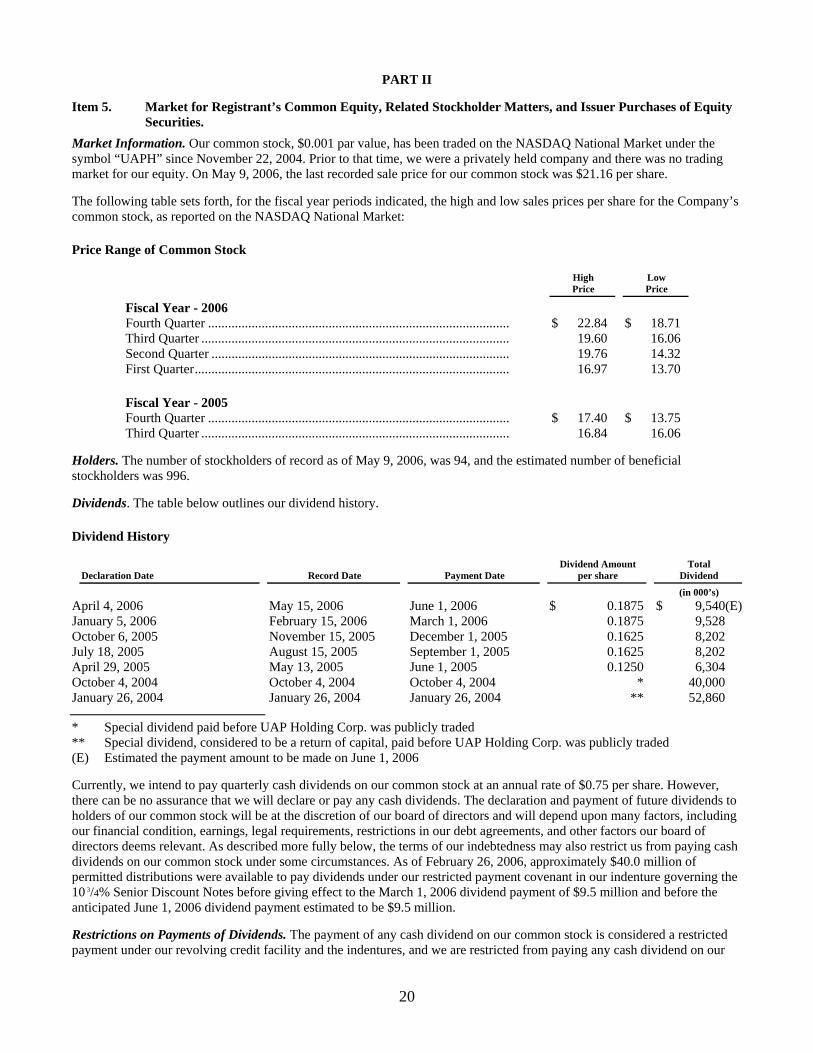
Market Information. Our common stock, $0.001 par value, has been traded on the NASDAQ National Market under the symbol “UAPH” since November 22, 2004. Prior to that time, we were a privately held company and there was no trading market for our equity. On May 9, 2006, the last recorded sale price for our common stock was $21.16 per share.
The following table sets forth, for the fiscal year periods indicated, the high and low sales prices per share for the Company’s common stock, as reported on the NASDAQ National Market:
Price Range of Common Stock
High Price
Low Price
Fiscal Year - 2006
Fourth Quarter .......................................................................................... $ 22.84 $ 18.71 Third Quarter ............................................................................................ 19.60 16.06 Second Quarter ......................................................................................... 19.76 14.32 First Quarter.............................................................................................. 16.97 13.70 Fiscal Year - 2005
Fourth Quarter .......................................................................................... $ 17.40 $ 13.75 Third Quarter ............................................................................................ 16.84 16.06
Holders. The number of stockholders of record as of May 9, 2006, was 94, and the estimated number of beneficial stockholders was 996.
Dividends. The table below outlines our dividend history.
Dividend History
Declaration Date
Record Date
Payment Date
Dividend Amount per share
Total Dividend
(in 000’s) April 4, 2006 May 15, 2006 June 1, 2006 $ 0.1875 $ 9,540(E)January 5, 2006 February 15, 2006 March 1, 2006 0.1875 9,528 October 6, 2005 November 15, 2005 December 1, 2005 0.1625 8,202 July 18, 2005 August 15, 2005 September 1, 2005 0.1625 8,202 April 29, 2005 May 13, 2005 June 1, 2005 0.1250 6,304 October 4, 2004 October 4, 2004 October 4, 2004 * 40,000
nuary 26, 2004 January 26, 2004 January 26, 2004 ** 52,860 Ja * Special dividend paid before UAP Holding Corp. was publicly traded ** Special dividend, considered to be a return of capital, paid before UAP Holding Corp. was publicly traded (E) Estimated the payment amount to be made on June 1, 2006
Currently, we intend to pay quarterly cash dividends on our common stock at an annual rate of $0.75 per share. However, there can be no assurance that we will declare or pay any cash dividends. The declaration and payment of future dividends to holders of our common stock will be at the discretion of our board of directors and will depend upon many factors, including our financial condition, earnings, legal requirements, restrictions in our debt agreements, and other factors our board of directors deems relevant. As described more fully below, the terms of our indebtedness may also restrict us from paying cash dividends on our common stock under some circumstances. As of February 26, 2006, approximately $40.0 million of permitted distributions were available to pay dividends under our restricted payment covenant in our indenture governing the 10 3/4% Senior Discount Notes before giving effect to the March 1, 2006 dividend payment of $9.5 million and before the anticipated June 1, 2006 dividend payment estimated to be $9.5 million.
Restrictions on Payments of Dividends. The payment of any cash dividend on our common stock is considered a restricted payment under our revolving credit facility and the indentures, and we are restricted from paying any cash dividend on our
20

common stock unless we satisfy certain conditions. The terms of the indentures governing the 10 3/4% Senior Discount Notes and United Agri Products’ 8 1/4% Senior Notes due 2011 restrict our ability to declare and pay dividends as follows:
• we may not pay dividends if an event of default under the indentures has occurred and is continuing; • the aggregate amount of dividends payable by us generally cannot exceed $25.0 million plus 50% of our
cumulative consolidated net income (as defined in the indentures) since November 24, 2003, plus 100% of any amounts contributed to our common equity capital or received from the sale of any equity interest less 100% of net losses, if any; and
• as a condition to making dividend payments, we must be able to incur $1.00 of additional indebtedness under the fixed charge coverage ratio test in the indentures.
The terms of our revolving credit facility also restricts our ability to declare and pay dividends as follows: • aggregate amount of dividends payable by us generally cannot exceed $25.0 million plus 50% of the cumulative
consolidated net income (as defined in the revolving credit facility) of United Agri Products and its subsidiaries since November 24, 2003, plus 100% of any amounts contributed to our common equity capital or received from the sale of any equity interest;
• immediately prior to and immediately following the dividend, at least $40.0 million must be available for borrowing under the revolving credit facility; and
• no event of default under the revolving credit facility has occurred or is continuing or would result after giving effect to such dividend.
In addition, we depend on dividends from United Agri Products in order to make divided payments on our capital stock. See “Item 7. Management’s Discussion and Analysis of Financial Condition and Results of Operations—Liquidity and Capital Resources—Holding Company.”
If we replace our existing revolving credit facility and enter into a new senior secured term loan facility, the restrictions described above will be amended and we will have other restrictions on our ability to declare and pay dividends. See “Item 7. Management’s Discussion and Analysis of Financial Condition and Results of Operations - Recent Developments” for more information regarding the refinancing of our debt.
Recent Sales of Unregistered Securities. Set forth below is certain information regarding securities issued by UAP Holding Corp. during fiscal 2006, including the consideration, if any, received by UAP Holding Corp. for such issuances:
During fiscal year 2006, employees exercised 380,058 stock options awarded under our 2003 Stock Option Plan at an exercise price of approximately $2.56 per share, for an aggregate exercise price of $972,000.
The issuances described above were deemed exempt from registration under the Securities Act in reliance on Rule 701 and Section 4(2) promulgated there under as transactions pursuant to compensatory benefit plans and contracts relating to compensation. The recipients of securities in each such transaction represented their intention to acquire the securities for investment only and not with a view to or for sale in connection with any distribution thereof and appropriate legends were affixed to the share certificates and other instruments issued in such transactions. All recipients either received adequate information about the Company or had access, through employment or other relationships, to such information. There were no underwriters employed in connection with any of the transactions set forth above in “Recent Sales of Unregistered Securities.”
For additional information on our common stock related to compensation, see “Item 12. Security Ownership of Certain Beneficial Owners and Management.”
21
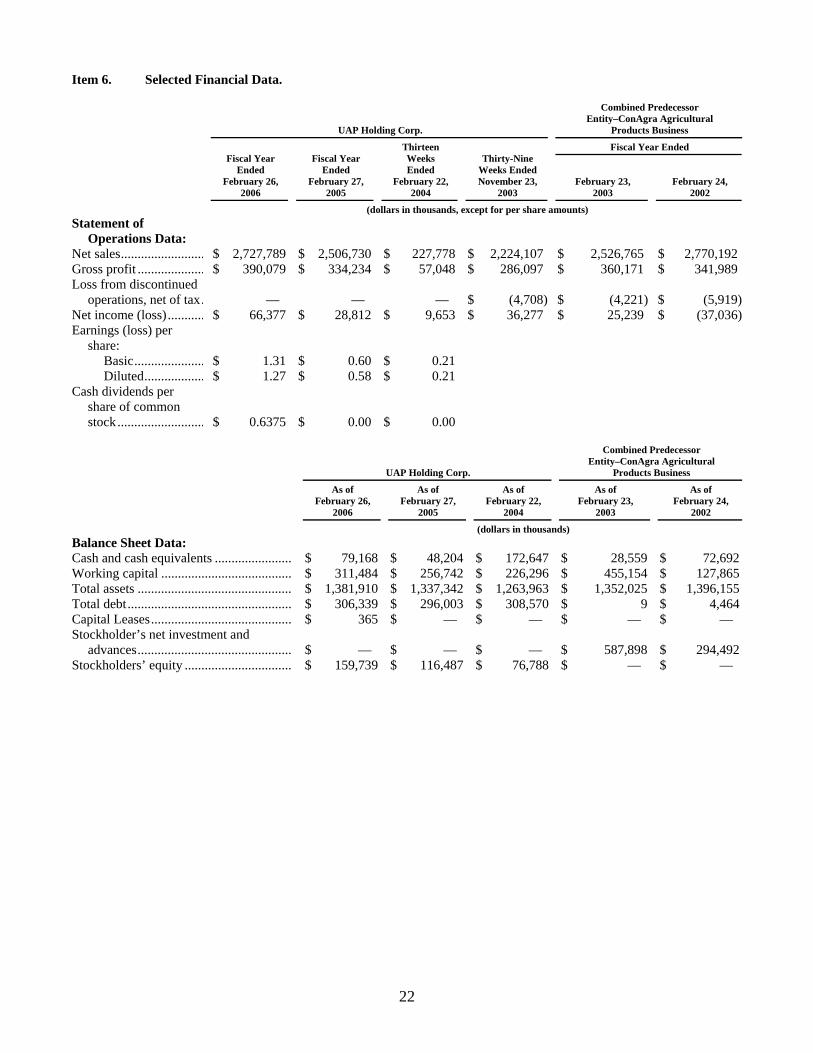
Item 6. Selected Financial Data.
UAP Holding Corp.
Combined Predecessor Entity–ConAgra Agricultural
Products Business
Fiscal Year Ended
Fiscal Year Ended
February 26, 2006
Fiscal Year Ended
February 27,2005
Thirteen Weeks Ended
February 22,2004
Thirty-Nine Weeks Ended November 23,
2003
February 23, 2003
Februar y 24,2002
(dollars in thousands, except for per share amounts) Statement of
Operations Data:
Net sales......................... $ 2,727,789 $ 2,506,730 $ 227,778 $ 2,224,107 $ 2,526,765 $ 2,770,192 Gross profit .................... $ 390,079 $ 334,234 $ 57,048 $ 286,097 $ 360,171 $ 341,989 Loss from discontinued
operations, net of tax. — — — $ (4,708) $ (4,221) $ (5,919)Net income (loss)........... $ 66,377 $ 28,812 $ 9,653 $ 36,277 $ 25,239 $ (37,036)Earnings (loss) per
share:
Basic..................... $ 1.31 $ 0.60 $ 0.21
Diluted.................. $ 1.27 $ 0.58 $ 0.21
Cash dividends per share of common stock.......................... $ 0.6375 $ 0.00 $ 0.00
UAP Holding Corp.
Combined Predecessor Entity–ConAgra Agricultural
Products Business
As of February 26,
2006
As of February 27,
2005
As of February 22,
2004
As of February 23,
2003
As of February 24,
2002
(dollars in thousands) Balance Sheet Data:
Cash and cash equivalents ....................... $ 79,168 $ 48,204 $ 172,647 $ 28,559 $ 72,692 Working capital ....................................... $ 311,484 $ 256,742 $ 226,296 $ 455,154 $ 127,865 Total assets .............................................. $ 1,381,910 $ 1,337,342 $ 1,263,963 $ 1,352,025 $ 1,396,155 Total debt................................................. $ 306,339 $ 296,003 $ 308,570 $ 9 $ 4,464 Capital Leases.......................................... $ 365 $ — $ — $ — $ — Stockholder’s net investment and
advances.............................................. $ — $ — $ — $ 587,898 $ 294,492 S
tockholders’ equity ................................ $ 159,739 $ 116,487 $ 76,788 $ — $ —
22

Item 7. Management’s Discussion and Analysis of Financial Condition and Results of Operations. We intend for this Management’s Discussion and Analysis of Financial Condition and Results of Operations (“MD&A”) to provide the reader with information that will assist in understanding UAP, our consolidated and combined financial condition, liquidity and capital resources, and results of operations for the periods presented. You should read this MD&A in conjunction with our consolidated and combined financial statements and the accompanying notes thereto appearing elsewhere in this Report.
On November 24, 2003, UAP Holding Corp. acquired the United States and Canadian agricultural inputs businesses of ConAgra Foods in a series of transactions referred to in this Report as the “Acquisition.” In this Report, the term “ConAgra Agricultural Products Business” means the entities that were historically operated by ConAgra Foods as an integrated business, which included a wholesale fertilizer company and other international crop distribution businesses that we did not acquire in the Acquisition. The businesses not acquired are reflected as discontinued operations within the ConAgra Agricultural Products Business financial statements.
The following discussion and analysis of our financial condition and results of operations covers, in part, periods prior to the Acquisition. Accordingly, the discussion and analysis of historical periods prior to November 24, 2003, do not reflect the significant impact that the Acquisition had on us.
In addition, the statements in the discussion and analysis regarding industry outlook, our expectations regarding the performance of our business, our liquidity and capital resources, and the other non-historical statements in the discussion and analysis are forward-looking statements. See “Forward Looking Statements” and “Item 1A. Risk Factors.”
Our Business We are the largest independent distributor of agricultural inputs and professional non-crop products in the United States and Canada. We strive to be the distributor of choice in our industry and earn the trust of our customers and suppliers by providing high quality products at competitive prices, supported by consistent and reliable service, and expertise. Our customers include farmers, commercial growers, regional dealers, and consumers in the professional non-crop market. Over 90,000 customers purchased products or services from us during fiscal 2006.
We market a comprehensive line of products, including chemicals, fertilizer, and seed manufactured by the world’s leading agricultural input companies, including BASF, Bayer, ConAgra International Fertilizer Company, Dow, DuPont, Monsanto, and Syngenta. In addition to our product offering, we provide a broad array of value-added services including crop management, biotechnology advisory services, custom blending, inventory management, and custom applications of crop inputs. The products and services we offer are critical to our customers because they lower the overall cost of crop production and improve crop quality and yield.
In addition to the products we purchase from our suppliers for resale, we also source, formulate, package, market, and distribute over 220 brands of proprietary and private label products. These products allow us to obtain a higher gross margin than from the other branded products we distribute. Sales of our proprietary and private label chemical and seed products accounted for 14.3% of our total chemical and seed sales in fiscal 2006 compared to 13.3% in fiscal 2005.
Our operations entail a network of approximately 340 sales and distribution facilities and three formulation plants strategically located in major crop-producing areas of the United States and Canada. Our integrated distribution network enables our 1,100 salespeople to provide our customers with a broad range of products and reliable service. As a result of our broad scale, we provide leading agricultural and professional product input companies with an efficient means to access a highly fragmented customer base of farmers, growers, and professional non-crop consumers.
Our and our customers’ businesses are highly seasonal, based upon the planting, growing, and harvesting cycles. During the last three fiscal years, greater than 75% of our net sales occurred during the first and second fiscal quarters of each year because of the condensed nature of the planting season. As a result of the seasonality of sales, we experience significant fluctuations in our revenues, net income, and net working capital levels throughout our fiscal year.
The Agricultural Inputs Distribution Industry We operate in the highly competitive agricultural inputs distribution industry. Our industry depends on farm expenditures for crop inputs, which in turn is dependent upon planted acreage in the United States and Canada. Over the last fifteen years, agricultural input expenses in the United States grew at a compound annual growth rate of 3.3%, based on historical data obtained from the Economic Research Service of the USDA. Planted acreage has been relatively flat over the last fifteen years, leading to a relatively stable but very competitive industry for crop inputs.
23

The key drivers of our industry include: continued world population growth; the use of more effective chemicals and fertilizer; stable planted acreage; the trend towards larger and more efficient farms; the increased production of renewable fuels from corn, soybeans, and other crops; and the increased use of biotechnology in the production of seed. The three primary product areas of the agricultural input and professional non-crop markets are chemicals, fertilizer, and seed.
Our principal competitors in the distribution of crop production inputs include agricultural cooperatives, national and international fertilizer producers, major grain companies, independent distributors, and brokers. We, along with other agricultural input distributors, represent the main route-to-market for agricultural and professional non-crop input manufacturers and fill a critical need in the U.S. and Canadian agricultural and professional non-crop input markets by allowing suppliers to economically access a highly fragmented customer base of growers, dealers, and professional non-crop customers. In each of our local markets, we typically compete with two or more distributors on the basis of breadth of product offering, the ability to provide “one-stop shopping” with customized local products and services, our sales-force’s knowledge of and relationships with our customers, and price. Additionally, we compete with our industry peers for talented employees in the areas of sales and operations.
Our industry in general is affected by a number of factors including, but not limited to, cost to distribute products, customer financial condition, local and national laws and regulations, economic conditions, employment, inflation, political climate, interest rates, fuel prices, and weather patterns.
Our opportunities within the industry include the use of our national distribution network to further participate in the growing fertilizer and seed markets as we extend those product offerings to existing customers, continue expanding our proprietary and private label lines of chemicals and seed, grow market share where gaps exist through sales-force penetration, adding or acquiring locations, and gaining additional efficiencies in working capital and expenses.
Market Conditions and Outlook Approximately 326 million acres, on average over the past fifteen years, were planted per year in principal crops according to the USDA. During this period, no year’s planted acreage deviated more than 2.5% from the average, providing a stable base for the agricultural inputs industry. The last two years have seen total acres planted in principal crops fall slightly below average, with 2005 acres planted at just under 318 million. Although planted acreage dropped in recent years, agricultural input spending during that same two year period rose approximately 12%. Acres forecast to be planted in 2006, according to the most recent survey by Informa Economics, Inc., are expected to increase over last year by approximately 1%.
According to the most recent forecast by the Economic Research Service of the USDA, crop input expenses for 2006 are expected to be $32.8 billion, a 5.1% increase over 2005. Fertilizer and seed combined make up approximately 74% of the total industry, with growth rates of 7.8% and 4.0%, respectively, forecast for 2006. However, because we are a distributor of fertilizer, our opportunity to capture increased gross profits related to the forecast appreciation in the fertilizer market is decreased since we typically pass through higher product costs and only retain a specific per ton margin.
The charts below summarize the historical data related to crop input expenses, acres planted, and crop input expenses per acre.
24

Despi riincome. Bconditionssignificant 2005. The culmination of lower government payments, higher
itability, and improve working capital through the following
our data indicates an opportunity, we have the potential to add sales personnel and/or locations and assets to fill in gaps in ur coverage.
er of 2006, we acquired two retail locations from independent distributors. Both ere
te sing crop input expenses per acre planted, the two-year period of 2004 and 2005 created unprecedented farm oth crop and livestock commodities experienced exceptionally favorable market price and/or production . However, the most recent available data from the Economic Research Service of the USDA, forecasts a decline in 2006 net farm income compared to
interest rates, higher fuel expenses, and higher fertilizer and crop input costs, combined with lower forecasted prices for crop and livestock commodities are the reasons for the expected reduction. While 2006 is currently not forecast to be as strong as 2004 and 2005, net farm income is projected to be slightly above the 10-year average. Crop input expenses represent approximately 14% of the total farm production budget. Because crop input expenses are a relatively small percentage of the farm production budget, it is difficult to predict what impact, if any, this may have on 2006.
Ethanol made from corn and bio-diesel made from soybeans may provide a future alternative to our country’s dependency on foreign based petroleum. Ethanol production has more than doubled since 2001 and is continuing to grow rapidly. The Energy Policy Act of 2005 requires 7.5 billion gallons of renewable fuels to be used in the nation’s highway fuel supply by2012. More ethanol and bio-diesel production should equate to increased corn and soybean acres planted.
Strategic Initiatives We will continue to seek to grow our business, improve profprincipal strategies:
• Expanding our distribution network and leveraging our scale; • Growing our presence in fertilizer, seed, and our proprietary and private label products; and • Targeting continued profitability enhancement through working capital and expense management.
Building upon our Distribution Network–One of our key initiatives is to grow our business by leveraging our size and leading market share across North America. We study our market share by state, county, and customer, and develop sales initiatives at local and regional levels to address any gaps and opportunities we have in our distribution network for chemicals, fertilizer, and seed. Where
o• During the fourth fiscal quart
locations were identified as part of our gaps analysis strategy and will expand our network to customers we wnot previously serving. We will continue to analyze and pursue additional acquisition candidates as appropriate opportunities arise in line with our strategy.
25

Fertilizer and Seed Revenue Growth–We have experienced revenue growth in both of these product areas and believe there are co nbelieve th to leve ly placin xnurturing presence i xist. We will also leverage our growth in the fertilizer business by nurturing relationships with f il
Proprietarsupplier b product of e continue to work with nearly all of our ke su
Working C o improve the financial performance of our business. We monitor performance regularly on key operating statistics such as inventory efficiency,
verall return on invested capital. This information will continue to the
es throu ing capital ma on and best ptied to var
CompanyOur manaoperationa peers wheBecause oKPIs were ement team in fiscal 2003 and have been utilized and refined since that time.
The four m•
•
• the r
days sale n hand, days inventory on hand, and days payables on hand. res
-tax return in percentage terms on our invested capital, defined as our average trade working capital plus s such as net property, plant and equipment and other investments.
• Hurricanes Katrina and Rita have impacted industries in numerous ways. The agricultural inputs distribution
pply sed
nti ued growth opportunities going forward. As seed varieties continue to be enhanced through biotechnology, we ey will serve as a growth platform due to the increased value-added nature of their sale to the customer. We intend
orage our growth in the seed business through: advanced technical training f our sales-force, hiring and strategicalg e perienced salespeople, using incentive compensation plans incorporating seed-specific performance goals,
our relationships with our seed suppliers, and targeting new retail and wholesale opportunities to enhance our sales n regions where gaps e
ert izer suppliers and by making modest investments in storage and blending facilities in regions where gaps exist.
y and Private Label Business–Our proprietary and private label products offer higher gross margins than the randed products we sell. We currently market over 220 proprietary branded products and have a broad proprietaryfering in each of our core product areas, including professional non-crop. W
y ppliers on additional private label opportunities.
apital and Expense Management–We believe we are well positioned to continue t
credit, operating expenses, gross profit generation, and oenable us to manage expenses and reduce average levels of working capital as a percent of net sales by concentrating onfollowing: earlier collection of supplier rebates, extending payable terms with key suppliers, continuing inventory efficienci
gh SKU reduction efforts and centralized purchasing, evaluating our suppliers on a total return basis including worknagement, continuing to focus on credit policies and procedures to maximize profitability, and using competitiractices among our operating divisions to drive overall focus on working capital and expense management that are iable compensation plans.
Performance Measures gement uses a number of metrics and key performance indicators (KPIs) to assess and track our financial and l performance. Our operating managers’ performances are judged using our defined KPIs and compared with theirn determining achievement towards company targets. Incentive compensation is tied to achieving our KPI goals. f the seasonal nature of our business, we view all of our KPIs on a rolling 12 month average basis. Our current developed by our manag
ost important KPIs that we measure are the following: Product Mix – We define product mix as the percentage of agricultural chemical products sold from each of our suppliers’ brands, including our proprietary and private label brands. Expense Coverage Ratio – Expense coverage ratio measures the ratio of total gross profit to total operating expenses excluding bad debt and interest expense. It is a measure that quantifies the efficiency of a dollar spent on operating expenses. Average Trade Working Capital as a Percentage of Net Sales – Average trade working capital as a percent of sales represents the twelve month average of working capital (excluding cash and short-term debt) divided bytwelve month total of net sales. As a sub-set of average trade working capital we also have KPIs established fo
s o• Pre-Tax Return on Invested Capital – Pre-tax return on invested capital is an all encompassing KPI that measu
our prelong term asset
Factors Impacting Our Results in Fiscal Year 2006 During fiscal 2006, several events took place that had or may have an impact on our business including the following:
industry has seen an impact on several fronts. Following the hurricanes, the prices of diesel fuel and gasoline spiked to record high levels at the time. As a result, we experienced approximately a 46% increase in our fuel expenses, or $2.5 million, on comparable gallons during our third and fourth quarters compared to the same period last year. For the full fiscal year, our total fuel expenses were higher by approximately 34%, or $4.6 million, compared to last year. Natural gas prices also increased dramatically following the hurricanes due to suconcerns. Natural gas is a key ingredient in the manufacturing of nitrogen based fertilizer. Nitrogen ba fertilizers such as anhydrous ammonia, urea, and UAN solutions, experienced dramatic price increases per ton. The high per ton prices, along with greater volume, increased fertilizer sales during the third and fourth quarters.
26

27
ofit amount per ton.
f
es ate that $0.4 million remains to be expensed
before this restructuring is completed during fiscal 2007. • During the second half of fiscal 2006, we completed the expansion of our fertilizer terminal in Quincy, Illinois.
We expect this Mississippi River terminal to contribute to our goal of increased fertilizer sales to our existing and new customers because of its additional capacity and strategic location in the Midwestern corn-belt. This facility expansion was first identified as an opportunity through a gaps analysis of our existing fertilizer distribution network.
Please review the section “Results of Operations” below for a more detailed explanation of our financial and operational performance.
Recent Developments On February 28, 2006, we sold our retail locations in western Canada to JRI Limited. We will continue to supply JRI Limited with agricultural inputs per a supply agreement negotiated as part of the sale. This sale had no impact on our fiscal 2006 results of operations and we expect the impact to fiscal 2007 to be negligible.
On March 3, 2006, we purchased the remaining 50% share of our joint venture in UAP Timberland. This purchase had no impact on our fiscal 2006 results of operations. Starting with the first quarter of fiscal 2007, our accounting treatment of UAP Timberland will change from the equity method (previous to fiscal 2007) to being consolidated into our results of operations. In fiscal 2006, $2.6 million of our income from the royalties, service charges and other income and expenses category was from the unconsolidated earnings of our affiliate UAP Timberland. See Note 2 in Notes to Financial Statements.
On May 3, 2006, UAP Holding Corp. and United Agri Products commenced tender offers for the outstanding 10 3/4% Senior Discount Notes and the outstanding 8 1/4% Senior Notes, respectively. In connection with the tender offers, the companies are also soliciting consents from the holders of the notes to eliminate most of the restrictive covenants in the indentures under which the notes were issued. The consummation of the tender offers and consent solicitations are subject to a number of conditions.
In addition, United Agri Products intends to replace its existing revolving credit facility and enter into a new senior secured term loan facility, the proceeds of which will be used to pay the tender offer consideration and related expenses, and for general corporate purposes. On May 2, 2006, United Agri Products, entered into a commitment letter with two financial institutions who agreed to provide and syndicate the amended credit facilities.
However, the higher costs per ton diluted our gross margin percentage on sales as we generally price to a fixed pr
• On September 19, 2005, we announced a restructuring of our organization and management. As part of this restructuring, we consolidated ten of our regional distribution organizations into five. We also closed one regionalfinance center, further centralizing and consolidating various accounting and administrative functions. As part othis restructuring, approximately 115 employees located throughout the United States were terminated. Expensrelated to this restructuring for the year totaled $1.3 million. We estim

28
RESULTS OF OPERATIONS
Analysis of Consolidated and Combined Statements of Earnings
UAP Holding Corp.
Combined Predecessor
Entity–ConAgra Agricultural
Products Business
Percent Change
Fifty-Two Weeks Ended February 26,
2006
Fifty-Three Weeks Ended February 27,
2005
Thirteen Weeks Ended February 22,
2004
Thirty-Nine Weeks Ended November 23,
2003
FY’06 vs.
FY’05
FY’05 vs.
FY’04
(dollars in thousands, except per share data) Net sales................................................................. $ 2,727,789 $ 2,506,730 $ 227,778 $ 2,224,107 8.8% 2.2%
Cost of goods sold .................................... 2,337,710 2,172,496 170,730 1,938,010 7.6% 3.0%
Gross profit .................................. 390,079 334,234 57,048 286,097 16.7%
-2.6%
Selling, general & administrative expenses 273,023 255,983 39,690 211,373 6.7% 2.0%(Gain) loss on sale of fixed assets ............ (1,307) (1,110) 44 (9,764) 17.7% -88.6%Royalties, service charges & other (income) and expenses (29,427) (26,652) (8,200) (11,082) 10.4% 38.2%Restructuring costs ................................... 1,606 903 — — 77.9% NM Corporate allocations: Selling, general & administrative expenses — — — 8,983 NM NM
39.1%
-6.2%
Operating income .................................................. 146,184 105,110 25,514 86,587
Third party interest expense ..................... 37,340 43,601 8,197 704 -14.4% 389.8%Finance related & other charges ............... 330 17,062 1,875 — -98.1% 810.0%Corporate allocations: Finance charges.... — — — 19,830 NM NM
144.1%
-45.5%Income before income taxes.................................. 108,514 44,447 15,442 66,053Income tax expense .................................. 42,137 15,635 5,789 25,068 169.5% -49.3%
Income from continuing operations ...................... 66,377 28,812 9,653 40,985 130.4%
-43.1%
(Loss) from discontinued operations, net of tax — — — (4,708) NM NM Net income............................................................. $ 66,377 $ 28,812 $ 9,653 $ 36,277 130.4% -37.3%
Earnings per share:
Basic earnings per share ........................... $ 1.31 $ 0.60 $ 0.21 118.3% NM Diluted earnings per share ........................ $ 1.27 $ 0.58 $ 0.21 119.0% NM
NM = not meaningful
Effective tax rate....................................................
38.8%
35.2%
37.5%
38.0%
Comparisons as a percent of net sales:
Gross margin 14.3% 13.3% 25.0% 12.9%
Selling, general & administrative expenses 10.0% 10.2% 17.4% 9.5%
Operating income 5.4% 4.2% 11.2% 3.9%

Fifty-Two Weeks Ended February 26, 2006, Compared to Fifty-Three Weeks Ended February 27, 2005 Net Sales. Sales increased to $2,727.8 million for the fifty-two weeks ended February 26, 2006 (“fiscal 2006”), compared to $2,506.7 million for the fifty-three weeks ended February 27, 2005 (“fiscal 2005”).
Sales of chemicals increased to $1,633.9 million in fiscal 2006 from $1,580.8 million in fiscal 2005. Gains in the midwest, Texas, the midsouth, and the southeast, helped overcome lower professional product sales and lower chemical tolling revenue due to the closing of two non-strategic formulation facilities that had provided toll-manufacturing services. Shipments of Monsanto bulk herbicides increased compared to the prior year. We now invoice these sales directly, which during the first two quarters of fiscal 2005 were commissioned agent transactions. Higher volumes of glyphosate herbicides more than offset lower end user unit prices for glyphosate products, while insecticide and fungicide treatments increased compared to fiscal
005 due to an increase in disease and insect infestations. 2 Sales of fertilizer rose to $682.1 million in fiscal 2006 from $565.3 million in fiscal 2005. The increase was driven by higher pricing, combined with slightly higher volumes as wet weather during the fall fertilizer application season in late fiscal 2005 delayed the timing of some fall fertilizer application to early fiscal 2006. Additionally, a better fall fertilizer season in fiscal 2006, especially in the upper midwest geography, contributed to the volume increase compared last year.
Sales of seed rose to $349.3 million in fiscal 2006 from $302.9 million in fiscal 2005, due to volume growth on both third party and proprietary brands and higher prices due to increased sales of seed with enhanced traits. Volume gains were achieved in the two major crops of corn and cotton.
Sales of proprietary chemical and seed products were 14.3% of total chemical and seed sales in fiscal 2006 versus 13.3% in fiscal 2005.
Sales of other products increased to $62.5 million in fiscal 2006 from $57.7 million in fiscal 2005 primarily due to higher application fee revenue, which was partially due to the delayed fertilizer season from the fall of fiscal 2005 to the spring of fiscal 2006. Increased transportation revenue from our Canadian and upper midwest locations also contributed to the increase in other sales compared to last year.
Cost of Goods Sold. Cost of goods sold was $2,337.7 million in fiscal 2006, compared to $2,172.5 million in fiscal 2005. Gross profit (net sales less cost of goods sold) was $390.1 million in fiscal 2006, compared to $334.2 million in fiscal 2005. Gross margin (gross profit as a percentage of net sales) was 14.3% in fiscal 2006, compared to 13.3% in fiscal 2005. The increase in gross profit and gross margin was due partially to an increase in cost of sales of $17.4 million in fiscal 2005, resulting from the purchase accounting for the Acquisition. At the Acquisition, the inventory on our books was written up $21.1 million to fair market value. As this inventory was sold, it increased cost of goods sold by $17.4 million in fiscal 2005. Additionally, gross profit increased due to increased proprietary product sales, on which we earn a much higher gross margin, as well as growth in all other categories, most notably seed. The overall gross margin percentage increase was moderated by higher costs for fertilizer nutrients and fuel prices. Gross profit includes supplier rebates, which are accrued monthly based on actual sales at the most likely estimated rates by supplier, then adjusted as necessary, typically in our third and fourth quarters. See the discussion in “Critical Accounting Policies and Estimates” titled “Vendor Rebate Receivables” for a further discussion of the factors involved in our rebate accruals.
Selling, General and Administrative Expenses. Selling, general and administrative (SG&A) expenses increased to $273.0 million in fiscal 2006 from $256.0 million in fiscal 2005. SG&A expenses as a percentage of net sales decreased to 10.0% of sales during fiscal 2006 compared to 10.2% of sales during fiscal 2005. The increase in dollars spent was due to higher professional expenses associated with becoming an independent public company, higher insurance costs, fewer recoveries of bad debts, and increased vehicle expenses including fuel, partially offset by one extra week in fiscal year 2005. The SG&A expenses in fiscal 2005 included $0.8 million of management fees paid to Apollo.
Royalties, Service Charges and Other Income and Expenses. These items include royalty income generated by our proprietary products group, service charge income from customers who do business with us on terms, and equity earnings in an unconsolidated subsidiary, as well as other items. Other income increased to $29.4 million in fiscal 2006 from $26.7 million in fiscal 2005. The increase in income was primarily due to higher royalty income during fiscal 2006, slightly offset by a gain on a post closing settlement of an acquisition during fiscal 2005. Higher royalties are a result of the market success of those products from which we receive royalty payments. Additionally, lower service charge income in fiscal 2006, due to an overall improved accounts receivable portfolio, was partially offset by increased equity earnings from UAP Timberland, a 50% owned unconsolidated subsidiary, as compared to last year.
29
Restructuring Costs. Restructuring costs in fiscal 2006 were $1.6 million compared to $0.9 million in fiscal 2005. The restructuring costs that occurred during fiscal 2006 were mainly related to severance expenses and contract termination costs associated with our management reorganization and administrative consolidation announced on September 19, 2005. The restructuring costs that occurred in fiscal 2005 were primarily severance expenses and other associated costs with the closure of two formulation facilities.
Third Party Interest Expense. Interest expense was $37.3 million in fiscal 2006, compared to $43.6 million in fiscal 2005, a decrease of $6.3 million. Interest expense includes interest on the 8 1/4% Senior Notes and the 10 3/4% Senior Discount Notes, interest and fees on the revolving credit facility, amortization of initial revolving credit facility fees, and costs relating to the issuance of the 8 1/4% Senior Notes and the 10 3/4% Senior Discount Notes. Part of the $6.3 million decrease related to interest expense in fiscal 2005 of $1.9 million, paid on the final Acquisition settlement payment to ConAgra Foods. Also, fiscal year 2005 included interest on $21.5 million of 8 1/4% Senior Notes redeemed in December of 2004. Additional savings in fiscal 2006 relate to lower average daily revolving balances which were partially offset by higher interest rates compared to last year.
Finance Related and Other Charges. There were $0.3 million of finance related and other charges in fiscal 2006 related to a secondary offering completed on March 9, 2006 by Apollo and certain current and former members of UAP’s management. In fiscal year 2005, finance related and other charges of $17.1 million consisted of charges related to the Acquisition, the Common Stock Offering, and related financing activities. Included in finance related and other charges for fiscal 2005 were $6.1 million in fees and expenses from the abandonment of our proposed offering of income deposit securities; $5.6 million of non-accountable charges paid to ConAgra Foods related to the Acquisition; $2.7 million of fees and expenses related to the secondary offering of our stockholders’ common stock in November 2004; $1.8 million in redemption premiums; and $0.9 million in charge offs of the unamortized issuance costs associated with the early redemption of $21.5 million of 8 1/4% Senior Notes on December 29, 2004.
Income Taxes. The effective income tax rate was 38.8% for fiscal 2006 compared with 35.2% for fiscal 2005. The lower tax rate in fiscal 2005 was due largely to dividends paid on shares of stock held in a rabbi trust which qualified as compensation expense for tax purposes. This was partially offset by non-deductible secondary offering costs associated with the Common Stock Offering. During fiscal year 2006, the company’s estimated blended state tax rate net of federal tax benefit declined from 4.7% to 3.5% as a result of completing the reorganization announced during the year.
Fifty-Three Weeks Ended February 27, 2005, Compared to Fifty-Two Weeks Ended February 22, 2004 Net Sales. Sales increased to $2,506.7 million in the fifty-three weeks ended February 27, 2005 (“fiscal 2005”), compared to $2,451.9 million for the fifty-two weeks ended February 22, 2004 (“fiscal 2004”).
Sales of chemicals increased to $1,580.8 million in fiscal 2005 from $1,579.7 million in fiscal 2004. The increase was primarily due to gains in chemical sales gains in the midsouth, southwest, and southeast regions, and a change in the way Monsanto bills its bulk herbicide business. Offsetting these gains were lower professional non-crop sales, lower chemical tolling revenue due to the rationalization of several non-strategic formulation facilities that provided toll manufacturing services, lower sales in our Canadian business as they focused on higher margin proprietary products, and lower prices on glyphosate.
Sales of fertilizer rose to $565.3 million in fiscal 2005 from $526.2 million in fiscal 2004, due to higher pricing that was offset by slightly lower volumes due to wet weather which delayed the timing of the fall fertilizer applications from the fall to the winter and early spring.
Sales of seed rose to $302.9 million in fiscal 2005 from $258.9 million in fiscal 2004, due to volume growth on both third party and proprietary brands and higher prices due to increased sales of seed with enhanced traits. Volume gains were achieved in the three major crops of corn, soybeans, and cotton.
Sales of proprietary chemical and seed products were 13.3% of total chemical and seed sales in fiscal 2005 versus 12.2% in scal 2004. fi
Sales of other products decreased to $57.7 million in fiscal 2005 from $87.1 million in fiscal 2004, primarily due to the rationalization of feed product lines which were integrated into several retail and wholesale locations in Montana in fiscal 2004. Slightly lower application fee revenue in fiscal 2005 versus fiscal 2004, due to the delayed fertilizer season, also contributed to lower sales of other products.
Cost of Goods Sold. Cost of goods sold was $2,172.5 million in fiscal 2005, compared to $2,108.7 million in fiscal 2004. Gross profit (net sales less cost of goods sold) was $334.2 million in fiscal 2005, compared to $343.1 million in fiscal 2004.
30

Gross margin (gross profit as a percentage of net sales) was 13.3% in fiscal 2005, compared to 14.0% in fiscal 2004. At the Acquisition, due to purchase accounting, the inventory on our books was written up $21.1 million to fair market value. As this inventory was sold, it increased cost of sales by $17.4 million in fiscal 2005 and $3.7 million in fiscal 2004. Higher costs of fertilizer nutrients during the year and higher fuel prices also slightly decreased overall margins. Partially offsetting these were better gross profits due to increased proprietary products sales and growth in seed. Gross profit includes rebates. Rebates earned are finalized in our third and fourth quarters and the accrual is adjusted as necessary. Rebates are accrued monthly based on actual sales at the most likely estimated rates by suppliers.
Selling, General and Administrative Expenses. SG&A expenses increased to $256.0 million in fiscal 2005 from $251.1 million in fiscal 2004. SG&A expenses were 10.2% of sales during fiscal 2005 and 10.2% of sales during fiscal 2004. The increase was due to higher personnel costs and professional expenses associated with becoming an independent public company, one extra week in the current fiscal year, and $0.8 million of management fees paid to Apollo. This was partially offset by lower location expenses and recoveries of bad debt.
Royalties, Service Charges and Other Income and Expenses. These items include royalty income generated by our proprietary products group, service charge income paid by customers who do business with us on terms, and equity earnings in an unconsolidated subsidiary, as well as other items. Other income increased to $26.7 million in fiscal 2005 from $19.3 million in fiscal 2004. The increase in income was due to higher royalty income during fiscal 2005 as a result of the transition of some private labels from a UAP brand to a third party brand where UAP receives a royalty on all sales.
Restructuring Costs. Restructuring costs in fiscal 2005 were $0.9 million. There were no restructuring costs during fiscal 2004. The restructuring costs in fiscal 2005 were primarily severance expenses and other associated costs from the closure of two formulation facilities.
Corporate Allocations—Selling, General and Administrative. Corporate allocations for fiscal 2004 include charges that had been allocated by ConAgra Foods and recorded as an expense for corporate services, including executive, finance and tax. Expenses incurred by ConAgra Foods and allocated to the ConAgra Agricultural Products Business were determined based on the specific services being provided or were allocated based on ConAgra Foods’ investment in the ConAgra Agricultural Products Business in proportion to ConAgra Foods’ total investment in its subsidiaries. Such expenses are included in allocated SG&A expenses and were $9.0 million in fiscal 2004.
Third Party Interest Expense. Interest expense was $43.6 million in fiscal 2005, which related primarily to the 8 1/4% Senior Notes, the 10 3/4% Senior Discount Notes, and our revolving credit facility. Interest expense also includes amortization of initial revolving credit facility fees and costs relating to the issuance of the 8 1/4% Senior Notes and the 10 3/4% Senior Discount Notes. Interest expense for the period also includes interest of $1.9 million paid on the final settlement payment to ConAgra Foods. For fiscal 2004, third party interest expense was $8.9 million, which related to interest on the 8 1/4% Senior Notes, the 10 3/4% Senior Discount Notes, our revolving credit facility, and other miscellaneous interest.
Finance Related and Other Charges. Other charges of $17.1 million consist of charges related to the Acquisition, the Common Stock Offering, and related financing activities. Included in other charges for fiscal 2005 are $6.1 million in fees and expenses from the abandonment of our proposed offering of income deposit securities; $5.6 million of non-accountable charges paid to ConAgra Foods related to the Acquisition; $2.7 million of fees and expenses related to the secondary offering of our stockholders’ common stock in November 2004; and $1.8 million in redemption premiums and $0.9 million in charge offs of amortized issuance costs associated with the early redemption of $21.5 million of 8 1/4% Senior Notes on December 29, 2004. For fiscal 2004, other charges include $1.9 million transition services agreement expenses with ConAgra Foods related to the Acquisition.
Corporate Allocations—Finance Charges. Corporate allocations also include finance charges that have been allocated by ConAgra Foods based on ConAgra Foods’ investment in the ConAgra Agricultural Products Business in proportion to ConAgra Foods’ total investment in its subsidiaries. ConAgra Foods allocated finance costs of $19.8 million in fiscal 2004.
Income Taxes. The effective income tax rate was 35.2% for fiscal 2005 compared with 37.9% for fiscal 2004. The reduction in rate is due largely to differences generated by the dividends paid on shares of stock held in the rabbi trust which qualified as compensation expense for tax purposes. This was offset by non-deductible secondary offering costs associated with the Common Stock Offering. Sales of stock from the rabbi trust in the Common Stock Offering also qualified as compensation expense for federal and state income tax purposes, but did not generate a permanent tax difference for financial reporting purposes. Instead, for financial reporting purposes the tax effect of the aggregate difference between the price at which a share of our common stock was initially credited to the rabbi trust and the price at which such share of our common stock was subsequently distributed from the rabbi trust in the Common Stock Offering was credited to additional paid-in capital.
31

Seasonality and Quarterly Fluctuations Our business is highly seasonal. In general, sales and operating income are highest during the first and second quarters which represent peak months in the planting and growing seasons of crops in the United States and Canada. Sales are substantially lower during the third and fourth quarters when we may incur net losses. In fiscal 2006 and fiscal 2005, greater than 75% of our net sales and greater than 100% of our net income were generated in the first and second quarters of the year.
We typically have a build-up of product inventories and accounts payable during the fourth quarter in anticipation of the peak selling season. Because of our high accounts receivable balances and payments to suppliers for inventory sold during the first and second quarters, our peak borrowing usually occurs during the third quarter. Our peak accounts receivable collections and advances from customers typically occur in the third and fourth quarters following the harvest of our customer’s annual crop. The following tables present certain quarterly data for fiscal years 2006 and 2005. We have included income statement and balance sheet data as well as sales by product category for the most recent eight quarters to allow for a meaningful comparison of the seasonal fluctuations in these amounts. In our opinion, this information reflects all normal and recurring adjustments considered necessary for a fair presentation of this data. Due to the seasonal nature of the agricultural inputs industry, the results of any one or more quarters are not necessarily a good indication of results for an entire fiscal year or of continuing trends.
Fiscal Quarter 2006
(dollars in thousands) Fiscal Quarter 2005
First
Second
Third
Fourth
First
Second
Third
Fourth
Statement of Income Data
Net sales.............................. $1,356,910 $ 757,459 $ 323,089 $ 290,331 $1,258,489 $ 703,981 $ 267,157 $ 277,103 Gross profit ......................... 168,752 110,273 50,542 60,512 135,734 107,022 17,322 74,156 Operating income (loss)...... 90,206 47,566 (3,755) 12,167 56,023 47,380 (32,290) 33,997 Net income (loss) ................ 49,387 23,309 (9,348) 3,029 25,522 21,796 (30,922) 12,416 Net sales % of total fiscal
year................................. 49.7% 27.8% 11.8% 10.6% 50.2% 28.1% 10.7% 11.1%Gross profit % of total
fiscal year ....................... 43.3% 28.3% 13.0% 15.5% 40.6% 32.0% 5.2% 22.2%Operating income % of
total fiscal year ............... 61.7% 32.5% -2.6% 8.3% 53.3% 45.1% -30.7% 32.3%Net income % of total fiscal
year................................. 74.4% 35.1% -14.1% 4.6% 88.6% 75.6% -107.3% 43.1% Balance Sheet Data
$ 10,495
$ 52,595
$ —
$ 72,117
$ —
$ —
$ —
$ — Marketable securities ..........Total receivables, net .......... 1,009,097 798,477 616,957 288,878 896,057 706,795 531,171 234,824 Product inventories, net ...... 681,913 515,352 536,640 730,771 594,079 449,602 490,649 697,134 Vendor prepayments ........... 33,360 18,958 22,056 69,841 32,243 27,585 32,957 149,010 Advances from customers... 50,007 27,270 86,256 279,239 49,083 16,990 72,560 271,195 Trade payables .................... 1,167,681 828,106 543,931 524,068 947,122 539,585 459,325 551,672 Short term debt.................... — — 148,965 — 42,123 180,299 211,556 55 Long term debt.................... 298,456 301,151 303,713 306,339 311,432 312,759 315,190 295,948 Net working capital............. 302,968 322,786 306,600 311,483 264,598 297,691 225,857 256,742
(dollars in thousands) Fiscal Quarter 2006
Fiscal Quarter 2005
First
Second
Third
Fourth
First
Second
Third
Fourth
Net Sales by Product Category
Chemicals ........................... $ 723,540 $ 570,455 $ 180,229 $ 159,638 $ 724,083 $ 533,619 $ 158,887 $ 164,199 Fertilizer.............................. 336,427 146,844 112,867 85,999 280,745 128,539 85,135 70,869 Seed .................................... 276,298 22,671 14,940 35,408 233,611 26,360 14,482 28,469 Other ................................... 20,645 17,489 15,053 9,286 20,050 15,463 8,653 13,566
Total.................................... $1,356,910 $ 757,459 $ 323,089 $ 290,331 $1,258,489 $ 703,981 $ 267,157 $ 277,103
32

LIQUIDITY AND CAPITAL RESOURCES
Overview Liquidity is defined as the ability to generate adequate amounts of cash to meet current cash needs. We assess our liquidity in terms of our ability to generate cash to fund our operating activities, taking into consideration the seasonal nature of our business. Significant factors which could affect our liquidity include the following:
• cash flows generated from operating activities; • the adequacy of available bank lines of credit; • dividend payments; • capital expenditures; • acquisitions; and • the ability to attract long-term capital with satisfactory terms.
Our principal liquidity requirements are for working capital, consisting primarily of receivables, inventories, prepaid expenses, reduced by accounts payable and accrued expenses; capital expenditures; debt service; and dividends on our common stock. We will fund our liquidity needs, including dividend payments, with cash generated from operations and, to the extent necessary, through borrowings under our revolving credit facility. In addition, we expect to fund any growth capital expenditures with cash generated from operations, reductions in working capital, and incremental debt.
As of February 26, 2006, we had no balance outstanding under our revolving credit facility compared to $0.1 million outstanding balance at February 27, 2005. The revolving credit facility is included in our financial statements as short-term debt. We believe that our cash flows from operating activities and borrowing capabilities under our revolving credit facility will be sufficient to meet our liquidity requirements in the foreseeable future, including funding of capital expenditures, debt service payments, and our intended dividend payments on our common stock.
If our cash flows from operating activities are insufficient to fund dividend payments at intended levels, we will need to reduce or eliminate dividends or, to the extent we are permitted to do so under our debt agreements, fund dividends with borrowings or from other sources. If we use working capital or permanent borrowings to fund dividends, we will have less cash available for future dividends and other purposes, which could negatively impact our financial condition, our results of operations, and our ability to maintain or expand our business. Additionally, our revolving credit facility will mature in 2008. If we are unable to refinance such indebtedness prior to its stated maturity, we will be required to use cash to repay such indebtedness, and we may not have sufficient cash available to us at that time. Even if we have sufficient cash, such a repayment would sufficiently decrease the amount of cash, if any, that is available to pay dividends.
Historical Cash Flows Prior to fiscal 2005, the ConAgra Agricultural Products Business’ sources of cash were primarily cash flows from operations and advances received from ConAgra Foods. As a result of the Acquisition, our ongoing operations require availability of funds to service debt, fund working capital and meet capital expenditure requirements. We currently finance and expect to continue to finance these activities through cash flows from operations and from amounts available under our revolving credit facility. The information presented for fiscal 2004 has been derived by combining the cash flow activity of the Successor for the thirteen weeks ended February 22, 2004, with the cash flow activity of the Predecessor for the thirty-nine
eeks ended November 23, 2003. w Cash flows provided by (used in) operating activities totaled $62.1 million in fiscal 2006, $(1.4) million in fiscal 2005, and $311.2 million in fiscal 2004. Fiscal 2006 net cash flow provided by operations was driven by net income of $66.4 million and a reduction of prepayments to suppliers of $79.2 million. Cash flow benefits in fiscal 2006 were partially offset by uses of cash primarily due to increases in inventory purchases and accounts receivable of $(36.5) million and $(53.1) million, respectively. Fiscal 2005 cash used in operations was due primarily to an increase in prepayments made to suppliers of $(91.1) million as well as increased purchases of inventory of $(54.6) million and increases in accounts receivable of $(63.5) million. These cash uses were partially offset by cash provided by increased accounts payable and other current liabilities of $136.0 million, and net income of $28.8 million. Fiscal 2004 cash provided by operations was due primarily to a reduction of prepayments to suppliers of $126.5 million, inventory reductions related to the Acquisition of $93.2 million and net income of $50.6 million.
Cash flows used in investing activities totaled $15.2 million in fiscal 2006, $68.7 million for fiscal 2005, and $610.9 million for fiscal 2004. Additions to property, plant and equipment were $16.2 million in fiscal 2006, compared to $14.9 million in fiscal 2005, and $15.3 million for fiscal 2004. During fiscal 2006, we completed various projects related to acquisitions and
33

the expansion of our business totaling approximately $8.2 million, while the remaining spending was for infrastructure replacement, cost reduction, and computer hardware and software projects. Most notably, we acquired two distribution locations from two independent distributors during our fourth fiscal quarter and we also completed the expansion of our Mississippi River fertilizer terminal in Quincy, Illinois in the fall of calendar 2005. Comparatively in fiscal 2005, most of our large capital expenditures were for transition projects to enable our separation from our former parent, ConAgra Foods, and for our subsystem replacement project, which we continued to roll out on a phased approach by geography and completed in fiscal 2006. The post-closing settlement to ConAgra Foods in June 2004 accounted for $58.2 million of the investing activity in fiscal 2005. The high level of cash used in investing activities in fiscal 2004 was due to the Acquisition.
Cash flows provided by (used in) financing activities were $(17.1) million in fiscal 2006, compared to $(54.8) million in fiscal 2005, and $443.8 million in fiscal 2004. Cash flows used in financing activities in fiscal 2006 represent $22.7 million of cash dividends on our common stock, slightly offset by the change in our check float on zero balance accounts compared to fiscal 2005. We actively manage our cash balances which results in check float on zero balance accounts. Cash flows used in financing activities in fiscal 2005 reflect approximately $43.1 million of net proceeds (net of underwriting discounts and commissions and estimated offering expenses) received from the primary issuance of our common stock on November 29, 2004, which was offset by a $40.0 million special dividend to common stockholders paid on October 4, 2004, redemption of $34.6 million of preferred stock from ConAgra Foods during fiscal 2005, and a $21.5 million redemption of 8 1/4% Senior Notes on December 29, 2004. Cash flows provided by financing activities in fiscal 2004 included the contribution of equity by Apollo and issuance of long-term debt in connection with the Acquisition. Financing activities in fiscal 2004, prior to the Acquisition period, were primarily limited to net investments by ConAgra Foods and bank overdrafts.
Credit Facility and Other Long-Term Debt. In connection with the Acquisition, United Agri Products entered into a five-year $500.0 million asset-based revolving credit facility. The revolving credit facility also provides for a $20.0 million revolving credit sub facility for United Agri Products Canada Inc. (“UAP Canada”) and a $50.0 million letter of credit sub-facility.
At February 26, 2006, there was $334.4 million of total borrowing capacity under the revolving credit facility and United Agri Products had aggregate borrowing availability thereunder of $310.3 million (after giving effect to $24.1 million of letters of credit under the sub-facility). On November 29, 2004, the revolving credit facility was amended and restated in connection with the consummation of the Common Stock Offering. The interest rates with respect to revolving loans under the revolving credit facility, as amended and restated, are based, at United Agri Products’ option, on either the agent’s index rate plus an applicable index margin of between 0.50% and 1.00% or upon LIBOR plus an applicable LIBOR margin of between 1.75% and 2.25%. As of the date of this Report, the applicable index margin is 0.50% and the applicable LIBOR margin is 1.75%. United Agri Products also pays an unused line fee margin of between 0.25% and 0.375% multiplied by the difference between (x) the maximum amount of the revolving credit facility (as it may be reduced from time to time) and (y) the average daily balance of revolving loans for the preceding months. These applicable margins are in each case subject to prospective adjustment on a quarterly basis due to a change in the Company’s ratio of funded debt to EBITDA (on a consolidated basis). Following an event of default, all amounts owing under the revolving credit facility will bear interest at a rate per annum equal to the rate otherwise applicable thereto plus an additional 2.0%.
The obligations under the revolving credit facility are (or, in the case of future subsidiaries, will be) guaranteed by UAP Holding Corp. and each of its existing and future direct and indirect U.S. subsidiaries. The obligations under the revolving credit facility are secured by a first priority lien on or security interest in, subject to certain exceptions, substantially all of UAP Holding Corp.’s, United Agri Products’, and UAP Canada’s properties and assets and the properties and assets of each of the other guarantors. The revolving credit facility contains customary representations, warranties, covenants, and events of default.
Due to the seasonal nature of our business, the amount of borrowings outstanding under the revolving credit facility varies significantly throughout our fiscal year. During fiscal 2006, outstanding borrowings (net of cash on hand) reached a period end peak of $276.3 million on October 23, 2005, while cash on hand reached a period end peak of $79.2 million (with no borrowings under the revolving credit facility) on February 26, 2006. Our average period end borrowings (net of cash on hand) for fiscal 2006 were approximately $22.2 million.
As of February 26, 2006, we were in compliance with all covenants under our revolving credit facility.
On December 16, 2003, United Agri Products issued $225.0 million aggregate principal amount of 8 1/4% Senior Notes which mature on December 15, 2011. On December 29, 2004, United Agri Products redeemed $21.5 million principal amount of its 8 1/4% Senior Notes (together with accrued interest and liquidated damages of $0.1 million and redemption premiums of $1.8 million).
34

On January 26, 2004, UAP Holding Corp. issued $125.0 million aggregate principal amount at maturity of 10 3/4% Senior Discount Notes which mature on July 15, 2012.
See the “Recent Developments” section above for information regarding the refinancing of our debt.
Obligations and Commitments As part of our ongoing operations, we enter into arrangements that obligate us to make future payments under contracts such as lease agreements, debt agreements, and unconditional purchase obligations (i.e., obligations to transfer funds in the future for fixed or minimum quantities of goods or services at fixed or minimum prices, such as “take-or-pay” contracts). We enter into unconditional purchase obligation arrangements in the normal course of business to ensure that adequate levels of sourced product are available to us. The following is a summary of our contractual obligations as of February 26, 2006:
Payments Due in Fiscal Year Ending February
Contractual Obligations:
Total
2007
2008
2009
2010
2011
2012 and beyond
Long-term debt ...................(dollars in thousands)
. $ 328,500 $ — $ — $ — $ — $ — $ 328,500 Interest payments on long
term debt ......................... 161,479 16,789 16,789 30,504 30,226 30,226 36,945 Operating lease obligations.. 21,175 6,554 4,700 2,754 1,597 984 4,586 Other long-term obligations. 236 84 79 40 33 — — Unconditional purchase
obligations....................... 5,792 5,782 — — 10 — — Capital lease obligations ...... 532 60 60 60 60 292 —
Total ........................... $ 517,714 $ 29,269 $ 21,628 $ 33,358 $ 31,926 $ 31,502 $ 370,031
We have excluded from the table above potential lease and other potential contract obligations over the next five years of approximately $59.0 million because the relevant contracts are cancelable within one year.
Our $500.0 million revolving credit facility has a five-year term and will mature in 2008.
As of February 26, 2006, we had $24.1 million of un-drawn letters of credit. The 8 1/4% Senior Notes were issued on December 16, 2003, and the proceeds from this offering were used to repay the entire principal amount, plus accrued interest, incurred in connection with a $175.0 million unsecured senior bridge loan facility. United Agri Products entered into the senior bridge loan facility on November 24, 2003, and used borrowings thereunder to fund, in part, the Acquisition. On December 29, 2004, $21.5 million of the 8 1/4% Senior Notes were redeemed with proceeds from the Common Stock Offering.
UAP Holding Corp. issued $125.0 million aggregate principal amount at maturity of the 10 3/4% Senior Discount Notes on January 26, 2004. The 10 3/4% Senior Discount Notes were issued at a price of 65.992% of the principal amount thereof, resulting in gross proceeds to UAP Holding Corp. of approximately $82.5 million. The original issue discount accretes to par value in 2008. At such time, interest will accrue at 10 3/4% per annum and will be payable in cash semi-annually in arrears commencing on July 15, 2008. As of February 26, 2006, the accreted value was $102.8 million.
See the “Recent Developments” section above for information regarding the refinancing of our debt.
Capital Expenditures Capital expenditures were $16.2 million for fiscal 2006, compared to $14.9 in fiscal 2005, and $15.3 million in fiscal 2004. During fiscal 2006, we completed various projects related to acquisitions and the expansion of our business totaling approximately $8.2 million, while the remaining spending was for infrastructure replacement, cost reduction, and computer hardware and software projects. Most notably, we acquired two distribution locations from two independent distributors during our fourth fiscal quarter and we also completed the expansion of our Mississippi River fertilizer terminal in Quincy, Illinois in the fall of calendar 2005. Comparatively in fiscal 2005, most of our large capital expenditures were for transition projects to enable our separation from our former parent, ConAgra, and for our subsystem replacement project, which we continued to roll out on a phased approach by geography and completed in fiscal 2006. We expect we will finance all capital expenditures with cash generated from operations, reductions in working capital, or incremental debt.
35

Holding Company As a holding company, our investments in our operating subsidiaries, including United Agri Products, constitute substantially all of our operating assets. Consequently, our subsidiaries conduct all of our consolidated operations and own substantially all of our operating assets. Our principal source of the cash required to pay our and our subsidiaries’ obligations and to repay the principal amount of our and our subsidiaries’ obligations, including the 10 3/4% Senior Discount Notes, is the cash that our subsidiaries generate from their operations and our borrowings under the revolving credit facility. Our subsidiaries are separate and distinct legal entities and have no obligations to make funds available to us. The terms of the agreements governing our existing indebtedness generally restrict our subsidiaries from paying dividends, making loans or other distributions, and otherwise transferring assets to us. Furthermore, our subsidiaries are permitted under the terms of the revolving credit facility and the indentures governing the 8 1/4% Senior Notes and 10 3/4% Senior Discount Notes to incur additional indebtedness that may severely restrict or prohibit the making of distributions, the payment of dividends, or the making of loans by such subsidiaries to us. We cannot assure you that the agreements governing our current and future indebtedness will permit our subsidiaries to provide us with sufficient dividends, distributions, or loans to fund scheduled interest and principal payments on our indebtedness when due. If we consummate an acquisition, our debt service requirements could increase. We may need to refinance all or a portion of our indebtedness on or before maturity. We cannot assure you that we will be able to refinance any of our indebtedness on commercially reasonable terms or at all. Dividend Policy See the table in Item 5. labeled “Dividend History,” which outlines our dividend history since the Acquisition.
We intend to pay quarterly cash dividends on our common stock at an annual rate of $0.75 per share.
On April 4, 2006, our board of directors declared a quarterly dividend on our common stock in the amount of $0.1875 per share of common stock. The record date for the dividend payment was May 15, 2006, and the payment date will be June 1, 2006.
There are no assurances that we will declare or pay any cash dividends in the future. The declaration and payment of future dividends to holders of our common stock is at the discretion of our board of directors and depends upon many factors including our financial condition, earnings, legal requirements, restrictions in our debt agreements, and other factors our board of directors deems relevant. The terms of our indebtedness, including the revolving credit facility and the indentures governing the 8 1/4% Senior Notes and the 10 3/4% Senior Discount Notes, may also restrict us from paying cash dividends on our common stock under some circumstances. As of February 26, 2006, approximately $40 million of permitted distributions were available to pay dividends under our restricted payment covenant in our indenture governing the 10 3/4% Senior Discount Notes before giving effect to the March 1, 2006 dividend payment of $9.5 million and before the anticipated June 1, 2006 dividend payment estimated to be $9.5 million.
In the past, cash flow from our operating activities has been highly variable, resulting in negative cash flow during certain periods. Because of the variability, if our cash flow from operating activities is insufficient to fund dividend payments at intended levels, we may need to reduce or eliminate dividends or, to the extent permitted by our debt agreements, fund all or part of the dividends with additional debt or other sources of cash. To the extent we pay dividends, the amount of cash available to us to pay principal of, and interest on, our outstanding debt will be reduced. A failure to pay principal of, or interest on, our debt would constitute an event of default under the applicable debt agreements giving the holders of the debt the right to accelerate its maturity. If any of our debt is accelerated, we may not have sufficient cash available to repay it in full and we may be unable to refinance it on satisfactory terms or at all. An event of default under debt agreements, or an acceleration of the debt hereunder, could also trigger an event of default under other debt agreements. Furthermore, if we fund dividends with additional debt, our interest expense will increase which may cause a further reduction in the amount of cash available to us. Subject to certain restrictions in the indentures governing the 8 1/4% Senior Notes and the 10 3/4% Senior Discount Notes, that additional debt could be secured and therefore effectively be senior to the 8 1/4% Senior Notes and the 10 3/4% Senior Discount Notes.
Trading Activities As of February 26, 2006, and February 27, 2005, we had no outstanding derivative contracts. However, subject to limitations set forth in our debt agreements, we may, in the future, enter into derivative contracts to limit our exposure to changes in interest rates, foreign currency exchange rates, and commodity prices.
Critical Accounting Policies and Estimates The process of preparing our consolidated and combined financial statements in accordance with U.S. generally accepted accounting principles (GAAP), requires management to make estimates, judgments, and assumptions that affect the amounts
36

reported and the accompanying note disclosures. The estimates made by management are based on historical experience combined with management’s understanding of current facts and circumstances. Management identifies critical accounting estimates as:
• those that require the use of assumptions about matters that are inherently and highly uncertain at the time the estimates are made; and
• those for which changes in the estimates, judgments, or assumptions, or the use of different estimates, judgments,
and assumptions, could have a material impact on our consolidated and combined results of operations or financial condition.
Management has discussed the development, selection, and disclosure of critical accounting policies and estimates with the Audit Committee of our board of directors. We believe that our most critical accounting policies and estimates, those which are both important to the portrayal of our financial condition and results of operations and require the most difficult, subjective, complex, or significant judgment on the part of management, are the following:
• Allowance for Doubtful Accounts; • Inventory Valuation and Reserves; and • Vendor Rebate Receivables.
For a discussion of the Company’s significant accounting policies, refer to Note 1 in “Notes to Financial Statements.”
Allowance for Doubtful Accounts. Our allowance for doubtful accounts reflects reserves against customer receivables, reducing customer receivables to net amounts expected to be collected. Management uses significant judgment in estimating uncollectible amounts, taking into consideration factors such as current overall economic conditions, industry-specific economic conditions, historical customer performance, and anticipated customer performance.
We estimate uncollectible receivables as a percentage of net sales based on our historical bad debt experience and establish a general reserve accrual as sales are made. Our allowance for doubtful accounts is adjusted based on credit evaluations of specific customer receivables, taking into account a variety of factors, including customer credit worthiness, past payment performance, changes in a customer’s ability to meet their financial commitments, and any collateral that we hold. We also make adjustments if additional information or collateral from the customer substantiates the basis for a change. Additionally, some customers may have insurance that is assigned to us in the event of crop disasters and there may also be government disaster payments.
While we have a large customer base that is geographically dispersed, our business is seasonal, like our customers’ businesses, and is based on crop specific planting, growing, and harvesting needs. A decrease in crop yields and/or commodity prices in the markets in which we operate may result in higher than expected uncollectible accounts, and therefore we may need to revise estimates for doubtful accounts. To the extent that our historical credit experience is not indicative of future performance or other assumptions used by management do not prevail, the allowance for doubtful accounts could differ significantly, resulting in either higher or lower future provisions (or credits) for doubtful accounts. Management believes our processes effectively address our exposure for doubtful accounts. However, changes in the economy, industry, or specific customer conditions may require adjustment to the allowance for doubtful accounts recorded by us.
Inventory Valuation and Reserves. Inventory consists primarily of chemicals, fertilizer, and seed products purchased from our suppliers for resale to our customers. We record inventory at the lower of cost or market. We maintain a perpetual inventory system, which we reconcile to physical counts at each location periodically.
Our inventory reserves are comprised of a reserve for vendor rebates and a reserve for slow-moving or obsolete inventory.
Our vendor rebate reserve relates to our vendor rebates receivable, see “Vendor Rebate Receivables” below. We account for rebates as a reduction of the prices of the supplier’s products and therefore as a reserve against inventory valuation until we sell the product, at which time such rebates reduce cost of goods sold in our income statement and the reserve against inventory is equally reduced. As of February 26, 2006, and February 27, 2005, we had $25.0 million and $19.1 million, respectively, of reserves against inventory valuation related to rebates paid on purchases which had not yet been sold and therefore unearned.
Each fiscal quarter, we analyze our company-wide inventory against historical sales of inventory products to determine whether individual items are obsolete or slow moving. A reserve is then established based on this analysis. The reserve is intended to reflect the value of inventory that we may not be able to sell at a profit. As of February 26, 2006, and
37

February 27, 2005, we had $5.4 million and $6.7 million, respectively, of reserves against inventory related to slow-moving and obsolete inventory items.
In evaluating the adequacy of our reserve for slow-moving and obsolete inventory we consider a combination of factors, including but not limited to:
• the level of inventory in relationship to historical sales by product based on product sales at both the geographic region and Company levels;
• the product’s registration status with state and federal authorities; • our ability to return excess or obsolete inventory items to our suppliers in exchange for credit or other more salable
products; • the impact of favorable or unfavorable weather conditions, insect pressures, or plant disease outbreaks on a
product’s usage during the most recent growing season; • the product’s shelf-life or expiration date; • changes in customer preferences due to new, improved, or competing products; and • geographical location.
Our reserve for slow-moving and obsolete inventory requires significant management judgement and may periodically require adjustment as changes in the above factors occur.
Vendor Rebate Receivables. We account for rebates in accordance with the Emerging Issues Task Force Issue 02-16, “Accounting by a Customer (Including a Reseller) for Certain Consideration Received from a Vendor.” At the beginning of each crop year, we enter into agreements with many of our suppliers providing for rebates upon the achievement of specified volume purchasing or sales levels. Most of these rebates are covered by binding arrangements or published programs. Rebates that are probable and reasonably estimable are accrued at expected rates based on total estimated crop year performance. Rebates that are not probable or estimable are accrued when certain milestones are achieved. Rebates not covered by binding agreements or published vendor programs are accrued when conclusive documentation of right of receipt is obtained. By the fiscal year end, we have received substantially all of the rebates due us for the prior crop year, and rebate income is adjusted accordingly.
We accrue rebates as part of our cost of sales, primarily for chemical and seed products. Historically, more than 85% of the rebates earned were from our chemical suppliers. As of February 26, 2006, rebates receivable are for the current crop year, which began as early as September 2005 and may end as late as January 2007, depending on the supplier. Rebates based on the amount of materials purchased are offset in cost of goods sold as inventory is sold. Rebates that are based on the amount of sales volume are offset to cost of goods sold when earned based on our experience with the supplier and our anticipated sales volume of the supplier’s products.
Due to the nature of rebate programs, estimates of rebates earned can vary significantly from period to period, and when comparing interim periods of the current and prior year, and more likely than not will trail sales. Due to a combination of factors as compared to last year, including changes in vendor programs, the Company’s new rebate tracking system, and improved operating performance that led to a greater probability of achieving higher rebate levels, the Company accrued a larger proportion of rebate earnings earlier in fiscal 2006 as compared to fiscal 2005. Because of the nature of rebate programs and the amount of rebates available are determined by our suppliers, there can be no assurance that historical rebate trends will continue.
Off-Balance Sheet Arrangements We use off-balance sheet arrangements (e.g. operating leases) where the economics and sound business principles warrant their use. We periodically enter into letters of credit and other similar arrangements as part of transactions in the ordinary course of our business. For information, see “Obligations and Commitments” above.
Related Party Transactions As part of the Acquisition, we entered into a seller transition services agreement with ConAgra Foods pursuant to which we would perform certain information technology, accounting, office support, and other services for ConAgra Foods. In addition, we granted to ConAgra Foods and its international subsidiaries an exclusive two-year license to use certain of our trademarks and trade names outside the United States and Canada. ConAgra Foods paid us an aggregate fee of $0.8 million during fiscal 2005 for the license and the services provided by us under the seller transition services agreement. The seller transition services agreement was terminated by ConAgra Foods on September 30, 2004, other than with respect to the
38

license to ConAgra Foods to use certain of our trademarks and trade names. The license to use certain of our trademarks and trade names was extended through November 30, 2006, by letter agreement dated March 25, 2005, between ConAgra Foods, UAP Holding Corp., and United Agri Products, Inc.
As part of the Acquisition, we and ConAgra Foods entered into a buyer transition services agreement pursuant to which ConAgra Foods would provide certain information technology and other administrative services to us for a period of one year. As consideration for these services, we paid ConAgra Foods a non-accountable charge of $7.5 million, $1.9 million of which was recognized in fiscal 2004. For the year ended February 27, 2005, $5.6 million in expense was recognized by us for the non-accountable charges. Additional services were provided on a fee for usage basis of $2.8 million for services during the transition and are accounted for in selling, general and administrative expenses. The buyer transition services agreement expired on November 23, 2004, in accordance with its terms.
Prior to the Acquisition, expenses incurred by ConAgra Foods and allocated to us were determined based on the specific services that were provided or were allocated based on ConAgra Foods’ investment in us in proportion to ConAgra Foods’ total investment in its subsidiaries. In addition, ConAgra Foods charged us finance charges on ConAgra Foods’ investment in and advances to us. Management believes that such expense allocations were reasonable. It is not practical to estimate the expenses that would have been incurred by us if we had operated on a stand-alone basis. Corporate allocations included allocated selling, general and administrative expenses of $9.0 million for the thirty-nine weeks ending November 23, 2003. Allocated finance charges were $19.9 million for the thirty-nine weeks ending November 23, 2003.
Under the terms of a management consulting agreement (the “Management Agreement”) dated as of November 21, 2003, between United Agri Products, Inc. and Apollo, United Agri Products, Inc. retained Apollo to provide certain management consulting and financial advisory services, for which United Agri Products, Inc. paid Apollo an annual management fee of $1.0 million, paid quarterly in fiscal 2005. In connection with the Common Stock Offering, the Management Agreement was terminated and United Agri Products, Inc. paid Apollo a $3.5 million transaction fee on November 29, 2004.
As of November 21, 2003, Apollo owned approximately 95% of UAP Holding Corp.’s outstanding common stock. Following the consummation of the Common Stock Offering on November 29, 2004, Apollo owned approximately 34% of UAP Holding Corp.’s outstanding common stock. As of March 9, 2006, following a secondary offering transaction, Apollo
wned approximately 17% of UAP Holding Corp.’s outstanding common stock. o Item 7A. Quantitative and Qualitative Disclosures about Market Risk. Market risks affecting our business are exposure to changes in energy prices, interest rates, and foreign currency exchange rates.
Changes in energy prices have a direct impact on our fuel costs. The national average per gallon spot price of diesel fuel increased from approximately $2.02 to $2.47 and the spot price of gasoline increased from approximately $1.88 to $2.24 as of February 27, 2005, and February 26, 2006, respectively. These price increases impact our supply chain and selling expenses. Based on our usage mix of these two fuels, we estimate that on average we have experienced a 30% price increase in fuel costs year over year. Combined with a small percentage increase in gallons used during fiscal 2006, our expenses related to fuel were up $4.6 million compared to the prior year. Based on our historic usage, a $0.14 increase in the annual average per gallon price of fuel would increase our fuel expense by $1.0 million. Higher fuel prices also affect our customers such that higher expenses for fuel and higher prices for fertilizer inputs may reduce the cash or credit available to our customers with which they purchase other inputs or services from us.
Our on-hand inventory of fertilizer products has price risk related to changes in energy prices. Our total fertilizer inventories on hand were approximately $140.4 million and $120.5 million as of February 26, 2006, and February 27, 2005, respectively. Of our total fertilizer inventory approximately $77.0 million and $64.6 million as of February 26, 2006, and February 27, 2005, respectively, were considered by the fertilizer industry to be nitrogen based and therefore more price sensitive to the price of natural gas. Natural gas is the key ingredient in the manufacture of these products. While a direct relationship cannot be established due to alternative sources of fertilizer products, such as imports, or substitute products, price risk does exist.
Our average period end borrowings under the revolving credit agreement (net of cash on hand) for fiscal 2006 were approximately $22.2 million. The revolving credit facility is affected by changes in interest rates. Based upon the amount of our average period end borrowings (net of cash on hand) for fiscal 2006, a one percentage point change in the assumed weighted average interest rate on such credit facility would change our annual interest expense by $0.2 million.
Our foreign currency risk is limited primarily to the exchange rate differential in the Canadian and US dollar. The exchange rate was 0.8711 and 0.8074 at February 26, 2006, and February 27, 2005, respectively. The exchange rate varied between 0.7851 and 0.8788 during fiscal 2006. A 1% change in the exchange rate would have approximately a $0.4 million impact on the balance sheet value. 39

Item 8. Financial Statements and Supplementary Data.
UAP HOLDING CORP. INDEX TO FINANCIAL STATEMENTS
PageNo.
Report of Independent Registered Public Accounting Firm ............................................................................ 48
Consolidated Balance Sheets at February 26, 2006, and February 27, 2005 ................................................... 49
Consolidated and Combined Statements of Earnings for the fiscal years ended February 26, 2006, and February 27, 2005, the thirteen week period ended February 22, 2004 (Successor), the thirty-nine week period ended November 23, 2003 (Predecessor) .............................................................................................................. 50
Consolidated and Combined Statements of Cash Flows for the fiscal years ended February 26, 2006, and February 27, 2005, the thirteen week period ended February 22, 2004 (Successor), the thirty-nine week period ended November 23, 2003 (Predecessor).................................................................................................... 51
Consolidated Statements of Stockholders’ Equity for the fiscal years ended February 26, 2006, and February 27, 2005, the thirteen week period ended February 22, 2004 (Successor), and Statement of Stockholder’s Net Investment and Advances for the thirty-nine week period ended November 23, 2003 (Predecessor) ........ 52
N
otes to Financial Statements.......................................................................................................................... 53
40
REPORT OF INDEPENDENT REGISTERED PUBLIC ACCOUNTING FIRM
To the Board of Directors and Stockholders of UAP Holding Corp. Greeley, Colorado
We have audited the accompanying consolidated balance sheets of UAP Holding Corp. and subsidiaries (the “Company”) as of February 26, 2006 and February 27, 2005, and the related consolidated statements of earnings, stockholders’ equity, and cash flows for each of the years ended February 26, 2006 and February 27, 2005 and the thirteen week period ended February 22, 2004. We have also audited the accompanying combined statements of earnings, stockholder’s net investment and advances, and cash flows of ConAgra Agricultural Products (a division of ConAgra Foods, Inc.) (the “Predecessor”), for the thirty nine week period ended November 23, 2003. Our audits also included the financial statement schedules listed in the Index at Item 15. These financial statements and financial statement schedules are the responsibility of the Company’s management. Our responsibility is to express an opinion on the financial statements and financial statement schedules based on our audits.
We conducted our audits in accordance with the standards of the Public Company Accounting Oversight Board (United States). Those standards require that we plan and perform the audit to obtain reasonable assurance about whether the financial statements are free of material misstatement. An audit includes examining, on a test basis, evidence supporting the amounts and disclosures in the financial statements. An audit also includes assessing the accounting principles used and significant estimates made by management, as well as evaluating the overall financial statement presentation. We believe that our audits provide a reasonable basis for our opinion.
In our opinion, such consolidated financial statements present fairly, in all material respects, the financial position of UAP Holding Corp. and subsidiaries as of February 26, 2006 and February 27, 2005, and the results of their operations and their cash flows for each of the years ended February 26, 2006 and February 27, 2005 and the thirteen week period ended February 22, 2004, and the results of operations and cash flows for the thirty nine week period ended November 23, 2003 of the combined predecessor entity – ConAgra Agricultural Products Business, in conformity with accounting principles generally accepted in the United States of America. Also, in our opinion, such financial statement schedules, when considered in relation to the basic consolidated financial statements taken as a whole, present fairly, in all material respects, the information set forth therein.
We have also audited, in accordance with the standards of the Public Company Accounting Oversight Board (United States), the effectiveness of the Company’s internal control over financial reporting as of February 26, 2006, based on Internal Control—Integrated Framework issued by the Committee of Sponsoring Organizations of the Treadway Commission and our report dated May 10, 2006 expressed an unqualified opinion on management’s assessment of the effectiveness of the Company’s internal control over financial reporting and an unqualified opinion on the effectiveness of the Company’s internal control over financial reporting.
DELOITTE & TOUCHE LLP
Denver, Colorado May 10, 2006
41

UAP HOLDING CORP. CONSOLIDATED BALANCE SHEETS
(dollars in thousands except share and per share amounts)
UAP Holding Corp.
Februar y 26,2006
February 27,2005
ASSETS
Current assets:
Cash and cash equivalents..................................................................................... $ 79,168 $ 48,204 Receivables, less allowance for doubtful accounts of $12,770 and $13,749......... 288,879 234,824 Inventories............................................................................................................. 730,771 697,134 Deferred income taxes........................................................................................... 21,168 17,263 Vendor prepay....................................................................................................... 69,841 149,010 Other current assets ............................................................................................... 16,123 8,753
Total current assets ...................................................................................... 1,205,950 1,155,188 Property, plant and equipment ........................................................................................ 114,991 104,745
Less accumulated depreciation.............................................................................. (24,676) (15,080)
Property, plant and equipment, net .............................................................. 90,315 89,665 Goodwill ......................................................................................................................... 27,167 34,645 Intangible assets, net ....................................................................................................... 26,121 25,894 Deferred income taxes .................................................................................................... 9,951 6,967 Debt issue costs, net........................................................................................................ 17,155 20,259 Investment in unconsolidated affiliates .......................................................................... 4,166 4,071 Other assets..................................................................................................................... 1,085 653
Total assets .................................................................................................. $ 1,381,910 $ 1,337,342
LIABILITIES AND STOCKHOLDERS’ EQUITY
Current liabilities:
Short-term debt...................................................................................................... $ — $ 55 Accounts payable .................................................................................................. 819,071 822,867 Other accrued liabilities ........................................................................................ 73,962 72,164 Income taxes payable ............................................................................................ — 3,252 Deferred income taxes........................................................................................... 1,433 108
Total current liabilities................................................................................. 894,466 898,446 Long-term debt ............................................................................................................... 306,339 295,948 Other non-current liabilities............................................................................................ 1,890 2,871 Deferred income taxes .................................................................................................... 19,476 23,590 Commitments and contingencies (note 11)
Stockholders’ equity:
Common stock, $.001 par value, 90,000,000 shares authorized, 50,814,430 and 50,431,872 issued and outstanding, respectively.............................................. 51 50
Management stock—rabbi trust ............................................................................ 3,956 4,819 Additional paid-in capital...................................................................................... 117,392 109,863 Retained earnings (deficit) .................................................................................... 32,606 (1,535)Accumulated other comprehensive income........................................................... 5,734 3,290
Stockholders’ equity .................................................................................... 159,739 116,487
Total liabilities and stockholders’ equity ........................................... $ 1,381,910 $ 1,337,342
The accompanying notes are an integral part of the financial statements.
42

UAP HOLDING CORP. CONSOLIDATED AND COMBINED STATEMENTS OF EARNINGS
(dollars in thousands except share and earnings per share amounts)
Combined Predecessor
Entity- ConAgra
Agricultural Products Business
UAP Holding Corp.
Fiscal Ye r Fiscal Ye r Thirteen Weeks Thirty-Nine Weeks Ended Novembe 23,
aEnded
aEnded Ended
February Februar February 26,2006
y 27,2005
22,2004
r2003
Net sales...................................................................... $ 2,727,789 $ 2,506,730 $ 227,778 $ 2,224,107 Costs and expenses:
Cost of goods sold............................................. 2,337,710 2,172,496 170,730 1,938,010
Gross profit .............................................. 390,079 334,234 57,048
286,097 Selling, general and administrative expenses.... 273,023 255,983 39,690 211,373 (Gain) loss on sale of assets .............................. (1,307) (1,110) 44 (9,764)Royalties, service charges and other (income)
and expenses................................................. (29,427) (26,652) (8,200) (11,082)Restructuring Costs ........................................... 1,606 903 — — Corporate allocations: Selling, general and
administrative expenses................................ — — — 8,983
Operating income........................................................ 146,184 105,110 25,514
86,587 Third party interest expense .............................. 37,340 43,601 8,197 704 Finance Related and Other Charges .................. 330 17,062 1,875 — Corporate allocations: Finance charges............. — — — 19,830
Income from continuing operations before income taxes ....................................................................... 108,514 44,447 15,442 66,053
Income tax expense..................................................... 42,137 15,635 5,789 25,068
Income from continuing operations ............................ 66,377 28,812 9,653 40,985 Loss from discontinued operations, net of tax ............ — — — (4,708)
Net income.................................................................. $ 66,377 $ 28,812 $ 9,653 $ 36,277
Earnings per share:
Basic.................................................................. $ 1.31 $ 0.60 $ 0.21
Diluted............................................................... $ 1.27 $ 0.58 $ 0.21
Cash dividends declared per share of common stock . $ 0.6375 $ 0.00 $ 0.00
Weighted average shares outstanding:
Basic.................................................................. 50,494,690 48,041,306 46,902,351
Diluted............................................................... 52,252,512 49,734,144 46,902,351
The accompanying notes are an integral part of the financial statements.
43

UAP HOLDING CORP. CONSOLIDATED AND COMBINED STATEMENTS OF CASH FLOWS
(dollars in thousands)
UAP Holding Corp.
Combined Predecessor
Entity-ConAgra Agricultural
Products Business
Fiscal Year Ended
February 26,2006
Fiscal Year Ended
February 27,2005
Thirteen Weeks Ended
February 22, 2004
Thirty-Nine Weeks Ended November 23,
2003
Operations
Net Income..................................................................................... $ 66,377 $ 28,812 $ 9,653 $ 36,277 Loss from discontinued operations................................................ — — — (4,708)
66,377 28,812 9,653 40,985
Adjustments to reconcile net income to net cash provided by operating activities:
Depreciation...................................................................... 11,043 12,553 3,103 9,845 Amortization of intangibles .............................................. 1,367 1,749 377 1,540 Amortization of debt issuance costs ................................. Accretion of discount on notes .........................................
4,400 5,424 — 1,080
— 10,391 8,878 —
Gain on sales of fixed assets............................................. (1,307) (1,110) 44 (9,764)Equity in (earnings) losses of unconsolidated affiliates... (95) (113) (1,754) (154)Stock compensation .......................................................... 792 — — — Other non-cash items ........................................................ Deferred taxes ...................................................................
— — 2,953 23,858
8,645 (2,207) 1,490 —
Change in operating assets and liabilities:
Receivables .......................................................... Inventories............................................................
(53,070) (63,519) 316,325 (283,052) (36,473) (54,612) (144,933) 238,151
Vendor prepay...................................................... 79,169 (91,061) (56,179) 182,643 Other current and noncurrent assets .................... 382 14,086 (28,916) (17,694)Accounts payable, accrued liabilities and noncurrent
liabilities ........................................................ (18,692) 136,005 290,277 (275,873)
Net cash provided by (used for) operations
.......................................................... 62,077 (1,418) 415,888 (104,728)Investing
Acquisition payment to ConAgra Foods, Inc. .................. — (58,236) (614,075) — Additions to property, plant and equipment ..................... (16,246) (14,934) (6,970) (8,350)Proceeds from sales of assets............................................ Purchase of business .........................................................
2,354 4,489 3,517 —
15,057 (1,350) — (41)
Net cash provided by (used for) investing (15,242) (68,681) (617,528) 6,666 Financing
Checks not yet presented .................................................. 5,999 — (11,632) 11,632 Net borrowings of revolving line of credit ....................... (55) 55 — — Debt issuance costs ........................................................... (1,297) (2,015) — — Long-term debt issued, net of costs .................................. — — 459,164 — Long-term debt redemption .............................................. Series A preferred stock issued.........................................
— (21,500) (175,000) — — — 60,000 —
Series A preferred stock redemption ................................ — (34,620) (25,380) — Proceeds from sales of common stock offering, net of costs
.................................................................................... — 43,144 120,000 — Proceeds from exercise of stock options .......................... 1,009 150 — — Common stock dividend ................................................... Net investment and advances............................................
(22,708) (40,000) (52,860) — — — — 57,871
Net cash provided by (used for) financing
.......................................................... (17,052) (54,786) 374,292 69,503
Net change in cash and equivalents............................................................ 29,783 (124,885) 172,652 (28,559)Net effect of exchange rates on cash and equivalents................................ 1,181 442 (5) —
Net change in cash and cash equivalents 30,964 (124,443) 172,647 (28,559)Cash and cash equivalents at beginning of period ..................................... 48,204 172,647 — 28,559
Cash and cash equivalents at end of period................................................ $ 79,168 $ 48,204 $ 172,647 $ —
Supplemental disclosure of cash flow information:
Cash paid during the year for interest............................... $ 24,825 $ 31,837 $ 1,546 $ — Cash paid during the year for income taxes ..................... $ 41,178 $ 18,670 $ — $ — Dividends declared but not yet paid ................................. $ 9,528 $ — $ — $ —
The accompanying notes are an integral part of the financial statements.
44

UAP HOLDING CORP. CONSOLIDATED STATEMENTS OF STOCKHOLDERS’ EQUITY AND COMBINED STOCKHOLDER’S NET
INVESTMENT AND ADVANCES (dollars in thousands)
Combined Predecessor Entity-ConAgra
Agricultural Products Business
Investm nt eand
Advances
Foreign Currency
Translation adjustment
Stockholder’s Net
Investment and Advances
Balance at February 24, 2003. ................................ . 588,147 (249) 587,898 Comprehensive income (loss):
Net Income..................................... 36,277 — 36,277 Foreign currency translation
adjustment................................ — 302 302
Total comprehensive income ........................ 36,277 302 36,579
Net investment and advances ..................... 27,522 — 27,522
Balance at November 23, 2003 ............................... $ 651,946 $ 53 $ 651,999
UAP Holding Corp.
Class A Common
Stock
AdditionalPaid in Capital
Rabbi Trust
Retained Earnings
Accumula ed tOther
Comprehen ive sIncome
Total Stockhold s’ er
Equity
Thirteen Weeks Ended February 22, 2004
Balance at November 23, 2003 ............................... $ — $ — $ — $ — $ — $ — Acquisition of common stock.................................. 47 114,403 — — — 114,450 Dividend to stockholders ......................................... — (52,860) — — — (52,860)Stock issued to management-Rabbi Trust ............... — — 5,550 — — 5,550 Comprehensive income (loss):
Net Income..................................... — — — 9,653 — 9,653 Foreign currency translation
adjustment................................ — — — — (5) (5)
Total comprehensive income (loss)............ — — — 9,653 (5) 9,648
Balance at February 22, 2004.................................. $ 47 $ 61,543 $ 5,550 $ 9,653 $ (5) $ 76,788
Fiscal Year Ended February 27, 2005
Balance at February 22, 2004.................................. $ 47 $ 61,543 $ 5,550 $ 9,653 $ (5) $ 76,788 Stock issued to management-Rabbi Trust ............... — — 885 — — 885 Dividend to stockholders ......................................... — — — (40,000) — (40,000)Exercise of stock options......................................... — 150 — — — 150 Stock and stock options income tax benefits........... — 3,413 — — — 3,413 Common stock offering, net of offering expenses
of $3,793............................................................ 3 43,141 — — — 43,144 Rabbi Trust distribution........................................... — 1,616 (1,616) — — — Comprehensive income
Net Income.................................................. — — — 28,812 — 28,812 Foreign currency translation adjustment .... — — — — 3,295 3,295
Total comprehensive income...................... — — — 28,812 3,295 32,107
Balance at February 27, 2005.................................. $ 50 $ 109,863 $ 4,819 $ (1,535) $ 3,290 $ 116,487
Fiscal Year Ended February 26, 2006
Balance at February 27, 2005.................................. $ 50 $ 109,863 $ 4,819 $ (1,535) $ 3,290 $ 116,487 Dividend to stockholders ......................................... — — — (32,236) — (32,236)Exercise of stock options......................................... 1 1,008 — — — 1,009 Stock and stock options income tax benefits........... — 4,866 — — — 4,866 Rabbi Trust distribution........................................... — 863 (863) — — — Restricted stock unit ve ting...................................s . — 792 — — — 792 Comprehensive income
Net Income.................................................. — — — 66,377 — 66,377 Foreign currency translation adjustment .... — — — — 2,444 2,444
Total comprehensive income...................... — — — 66,377 2,444 68,821
Balance at February 26, 2006.................................. $ 51 $ 117,392 $ 3,956 $ 32,606 $ 5,734 $ 159,739
The accompanying notes are an integral part of the financial statements.
45

UAP HOLDING CORP. NOTES TO FINANCIAL STATEMENTS
Fiscal Year Ended February 26, 2006, Fiscal Year Ended February 27, 2005, Thirteen Weeks Ended February 22, 2004, and Thirty-Nine Weeks Ended November 23, 2003
Unless the context requires otherwise, all references to “Company,” “we,” “us,” “ours,” and “UAP” refer specifically to UAP Holding Corp. and its consolidated subsidiaries. Additionally, all references to UAP Holding Corp. refer specifically only to UAP Holding Corp., excluding its subsidiaries, all references to “United Agri Products” refer specifically only to United Agri Products, Inc., and its subsidiaries, and all references to “United Agri Products, Inc.” refer specifically to United Agri Products, Inc., excluding its subsidiaries.
We operate on a 52- or 53-week fiscal year. Fiscal years are identified in this Report according to the calendar year in which they ended. Our fiscal years 2006, 2005, and 2004 ended on February 26, 2006, February 27, 2005, and February 22, 2004, respectively. Our fiscal years 2006 and 2004 contained 52 weeks, and our fiscal year 2005 contained 53 weeks.
1. Description of the Business and Summary of Significant Accounting Policies Business. UAP Holding Corp. is the largest independent distributor of agricultural and professional non-crop inputs in the United States and Canada. We market a comprehensive line of products including chemicals, fertilizer, and seed to farmers, commercial growers, and regional dealers. We have approximately 340 distribution, storage, and sales locations. We also have three formulation facilities where we blend products primarily for sale by our distribution facilities.
UAP Holding Corp. was initially formed by ConAgra Foods, Inc. (“ConAgra”) through a series of acquisitions, beginning in May 1978 with the acquisition of a 49% interest in a group of companies engaged in the domestic distribution of agricultural chemicals. ConAgra Foods purchased the remaining 51% from several remaining stockholders in 1980. In 1983, UAP acquired AgChem, Inc., and in 1985 acquired Cropmate Company Inc. UAP expanded its business into Canada through the 1988 purchase of Pfizer Canada, and in 1991 acquired Donnell Agriculture. After a series of additional acquisitions, on November 24, 2003, ConAgra Foods sold UAP and its related businesses to us.
On November 24, 2003, Apollo Management, L.P (“Apollo”), ConAgra, and we consummated a transaction in which we acquired ConAgra Foods’ United States and Canadian Agricultural Products Businesses, excluding its wholesale fertilizer and other international crop distribution businesses, which we refer to as the “Acquisition.” The entities that were historically operated by ConAgra Foods as an integrated business, which includes businesses that were not acquired in the Acquisition, are referred to collectively as the “ConAgra Agricultural Products Business” or “Predecessor.” Those entities that were actually acquired in the Acquisition and are being operated by UAP Holding Corp. are referred to as the “Successor.”
On November 29, 2004, we consummated the initial public offering of our common stock, (the “Common Stock Offering”) which is traded under the symbol “UAPH” on the NASDAQ National Market.
Accounting principles generally accepted in the United States of America (“GAAP”) require our operating results prior to the Acquisition, the periods prior to November 23, 2003, to be reported as the results of the “Predecessor” in our financial statements. Our operating results subsequent to the Acquisition are presented as the results of the “Successor” and include the thirteen week period from November 24, 2003, through February 22, 2004, the fifty-three week period ended February 27, 2005, and the fifty-two week period ended February 26, 2006.
Principles of Consolidation. The consolidated financial statements include our accounts and the accounts of all our wholly-owned subsidiaries. Significant intercompany balances and transactions have been eliminated. Investments in 50% or less owned affiliates over which we do not have the ability to exercise significant control are accounted for using the equity method. During fiscal years 2006, 2005, and 2004, we did not have any “less than 20% owned” investments in affiliates accounted for under the equity method.
Fiscal Year. Our fiscal year operates on a 52- or 53-week period ending on the last Sunday in February. Our fiscal years 2006 and 2004 contained 52 weeks while our fiscal year in 2005 contained 53 weeks. The additional week in 2005 fiscal year was included in the first quarter.
Seasonality. Our and our customers’ businesses are seasonal, based upon the planting, growing, and harvesting cycles. During fiscal years 2004 through 2006, more than 75% of our net sales occurred during the first and second fiscal quarters of each year because of the condensed nature of the planting season. As a result of the seasonality of sales, we experience significant fluctuations in our revenues, income, and net working capital levels. In addition, weather conditions can significantly vary quarterly results.
46

Since our suppliers typically operate on a crop year, which is a different year than our fiscal year, our rebate agreements with our suppliers are estimated throughout the year and adjusted in our fiscal third and fourth quarters. These adjustments can impact our margin percentages by quarter. Also, our customers operate on a crop year and payments are cyclical throughout the year. Accordingly, our results of operations over any one quarter are not necessarily indicative of the results to be expected over the full fiscal year.
Use of Estimates. The preparation of financial statements in conformity with accounting principles generally accepted in the United States of America requires management to make estimates and assumptions. These estimates or assumptions affect reported amounts of assets, liabilities, revenue, and expenses as reflected in the financial statements. Actual results could differ from those estimates and the differences could be material. Estimates are also required for other items.
Cash and Cash Equivalents. We consider all highly liquid investments with maturities of three months or less when purchased to be cash equivalents.
Receivables and Allowance for Doubtful Accounts. Our receivables include receivables from customers, less allowances for doubtful accounts, vendor rebates receivable, and miscellaneous receivables. As of February 26, 2006, and February 27, 2005, the net receivables from customers were $228.4 million and $192.5 million, respectively, vendor rebates receivable were $44.2 and $23.1 million, respectively, and miscellaneous receivables were $16.3 million and $19.2 million, respectively.
Allowance for Doubtful Accounts. To establish our allowance for doubtful accounts, we evaluate the collectibility of specific accounts receivable based upon a variety of factors, including customer credit worthiness, past payment performance, and collateral that we hold. We adjust the bad debt expense accordingly. We estimate uncollectible receivables based on the historical bad debt experience and establish a general reserve accrual as sales are made. The specific estimates are adjusted when we are aware of changes in a customer’s ability to meet their financial commitments. We also make changes when we have additional information or collateral from the customer that substantiates the basis for a change. Some customers may have insurance that is assigned to us in the event of crop disasters and there may also be government disaster payments.
While we have a large customer base that is geographically dispersed, a decrease in crop yields and/or commodity prices in the markets in which we operate may result in higher than expected uncollectible accounts, and therefore we may need to revise estimates for bad debts. To the extent that our historical credit experience is not indicative of future performance or other assumptions used by management do not prevail, the allowance for doubtful accounts could differ significantly, resulting in either higher or lower future provisions (or credits) for doubtful accounts. At February 26, 2006, and February 27, 2005, the allowance for doubtful accounts totaled $12.8 and $13.7 million respectively. Vendor Rebate Receivables. At the beginning of each crop year, we enter into agreements with many of our suppliers providing for rebates upon the achievement of specified volume purchasing or sales levels. Most of these rebates are covered by binding arrangements or published programs. Rebates that are probable and reasonably estimable are accrued at expected rates based on total estimated crop year performance. Rebates that are not probable or estimable are accrued when certain milestones are achieved. Rebates not covered by binding agreements or published vendor programs are accrued when conclusive documentation of right of receipt is obtained. By the fiscal year end, we have received substantially all of the rebates due us for the prior crop year, and rebate income is adjusted accordingly.
We accrue rebates as part of our cost of sales, primarily for chemical and seed products. As of February 26, 2006, rebates receivable are for the current crop year, which began as early as September 2005 and may end as late as January 2007, depending on the supplier. Rebates based on the amount of materials purchased are offset in cost of goods sold as inventory is sold. Rebates that are based on the amount of sales volume are offset to cost of goods sold when earned and are based on our experience with the supplier and our anticipated sales volume of the products.
Due to the nature of rebate programs, estimates of rebates earned can vary significantly from period to period and when comparing interim periods of the current and prior year, and more likely than not will trail sales. Due to a combination of factors as compared to last year, including changes in vendor programs, the Company’s new rebate tracking system, and improved operating performance that led to a greater probability of achieving higher rebate levels, the Company accrued a larger proportion of rebate earnings earlier in fiscal year 2006 as compared to fiscal year 2005.
Inventory and Inventory Reserves. Inventory consists primarily of chemicals, fertilizer, and seed products purchased from our suppliers for resale to our customers. We record inventory at the lower of cost or market. We maintain a perpetual inventory system, which we reconcile to physical counts at each location periodically.
The cost of inventory at our distribution locations is carried either at average cost or first in, first out (FIFO). The proportion of total inventory reported on an average cost basis was approximately 91.9% and 23.7%, as of February 26, 2006 and
47

February 27, 2005, respectively. The change from FIFO to average cost had no material impact on our consolidated balance sheets or consolidated and combined statement of earnings. Inventory produced at our formulation facilities is valued using the standard cost method.
Our inventory reserves are comprised of a reserve for vendor rebates and a reserve for slow-moving or obsolete inventory.
Our vendor rebate reserve relates to our vendor rebates receivable for those rebates based on purchases (see “Vendor Rebate Receivables” above). We account for these rebates as a reduction of the prices of the supplier’s products and therefore as a reserve against inventory valuation until we sell the product, at which time such rebates reduce cost of goods sold in our income statement and the reserve against inventory is equally reduced. As of February 26, 2006, and February 27, 2005, we had $25.0 million and $19.1 million, respectively, of reserves against inventory valuation related to rebates paid on purchases which had not yet been sold and therefore unearned.
Each fiscal quarter, we analyze our inventory against historical sales of inventory products to determine which SKU items may be obsolete or slow moving. A reserve is then established based on this analysis. The reserve is intended to reflect the value of inventory that we may not be able to sell at a profit. As of February 26, 2006, and February 27, 2005, we had $5.4 million and $6.7 million, respectively, of reserves against inventory related to slow-moving and obsolete inventory items.
In evaluating the adequacy of our reserve for slow-moving and obsolete inventory, we consider a combination of factors including but not limited to:
• the level of inventory in relationship to historical sales by product based on product sales at both the geographic region and Company levels;
• the product’s registration status with state and federal authorities; • our ability to return excess or obsolete inventory items to our suppliers in exchange for credit or other more salable
products; • the impact of favorable or unfavorable weather conditions, insect pressures, or plant disease outbreaks on a
product’s usage during the most recent growing season; • the product’s shelf-life or expiration date; • changes in customer preferences due to new, improved, or competing products; and • geographical location.
Our reserve for slow-moving and obsolete inventory requires significant management judgement and may periodically require adjustment as changes in the above factors occur.
Prepayments to Vendors. Prepayments to vendors consist of payments for inventory that has not yet been received. We are able to obtain discounts by prepaying for product and taking it later, when needed. When the inventory is received, it is valued at the published purchase price net of the applicable discount.
Other Current Assets. Other current assets as of February 26, 2006, consist of $8.0 million of prepaid expenses and $8.1 million of assets held for sale. Assets held for sale relate to a portion of Canadian retail operations sold during the first quarter of fiscal year 2007 – of which $4.8 million is for inventory, $3.3 million is for property, plant and equipment. No depreciation is recognized on assets held for sale. These assets are reviewed for impairment as part of our long lived asset impairment review. See Note 16 “Subsequent Events” for more information on the sale of our Canadian retail operations.
Property and Equipment. Property and equipment are recorded at cost and depreciated using the straight-line method based on the following estimated useful lives of the assets:
Land improvements ..........................................................................................
15 - 40 years Buildings........................................................................................................... 15 - 40 years Machinery and equipment ................................................................................ 5 - 10 years Furniture, fixtures, office equipment, and other ............................................... 3 - 7 years
Maintenance and repair costs are charged to expense as incurred. Renewals and improvements that extend the useful lives of assets are capitalized. Gains or losses are recognized upon disposition. Depreciation of property and equipment totaled $11.0 million, $12.6 million, $3.1 million, and $9.8 million in fiscal year 2006, fiscal year 2005, the thirteen weeks ended February 22, 2004, and the thirty-nine weeks ended November 23, 2003, respectively.
48

Impairment of Long-Lived Assets Other than Goodwill. We periodically evaluate the recoverability of the carrying amount of long-lived assets to be held and used, other than goodwill and purchased intangible assets with indefinite useful lives, whenever events or changes in circumstances indicate the carrying amounts of such assets may not be fully recoverable. We evaluate events or changes in circumstances based on a number of factors including operating results, business plans and forecasts, general industry trends and economic projections, and anticipated cash flows. An impairment is assessed when the undiscounted expected future cash flows derived from an asset are less than its carrying amount. In that event, an impairment charge is recognized to the extent the carrying value of the asset exceeds its fair value. We recognized an impairment charge of $0.1 million for fiscal 2006 related to property held for sale. No impairment charges were recognized for fiscal 2005, or fiscal 2004. Goodwill. Goodwill represents the excess of the purchase price paid over the fair value of the net assets acquired in connection with the business acquisitions plus costs of acquisition. Goodwill is not amortized. In accordance with SFAS No. 142, “Goodwill and Other Intangible Assets,” we test goodwill for impairment annually or whenever events or changes in circumstances indicate that the carrying amount may not be fully recoverable. We completed our annual goodwill impairment test as of November 27, 2005, and determined that there was no impairment as of that date. We may be subject to earnings volatility if goodwill impairment occurs at a future date. At February 26, 2006, and February 27, 2005, goodwill totaled $27.2 million and $34.6 million, respectively. During 2006, we reduced goodwill $7.4 million to reflect the reduction of the deferred tax liability established in the initial acquisition purchase price allocation based on further refinement of the tax basis of various assets and liabilities.
Intangible Assets, Net. Intangible assets consist primarily of assets acquired in the Acquisition and are recorded at their respective fair market values in accordance with SFAS No. 141, “Business Combinations.” Our intangible assets consist of finite and indefinite-lived assets. Finite lived intangible assets are tested for impairment as noted above under “Impairment of Long-Lived Assets Other than Goodwill” and are amortized using the straight-line method based on their estimated useful lives as follows:
EPA registrations .....................................................................................................
10 years Customer relationships ............................................................................................ 10 years Non-compete agreements ........................................................................................ 5 years Other ........................................................................................................................ 5 years
Indefinite-lived assets are not amortized but tested for impairment in accordance with SFAS No. 142, “Goodwill and Other Intangible Assets.” No impairment of indefinite-lived intangible assets was recognized in fiscal 2004, 2005, or 2006.
Debt Issuance Costs. Our debt issuance costs net of amortization were $17.2 million and $20.3 million at the end of fiscal years 2006 and 2005 respectively. Our debt issuance costs consisted of costs associated with United Agri Products’ revolving credit facility, United Agri Products’ 8 1/4% Senior Notes due 2011 (the “8 1/4% Senior Notes”), and our 10 3/4% Senior Discount Notes due 2012 (the “10 3/4% Senior Discount Notes”). Deferred financing costs are being amortized on a straight-line basis over the terms of the debt, which approximates the effective interest method, to which the costs relate, and the related amortization is recorded to interest expense and other amortization expenses.
Investments in Unconsolidated Affiliates. Our investments in unconsolidated affiliates consist of a 50% ownership in a joint venture which is accounted for using the equity method of accounting. Our proportionate share of income resulting from this investment is included in our operating income under “Royalties, service charges, and other (income) and expenses.”
Our investment was $4.2 million at February 26, 2006, and $4.1 million at February 27, 2005. Our equity in unconsolidated affiliate earnings was $2.6 million in fiscal year 2006, $1.5 million in fiscal year 2005, and $0.2 million in fiscal year 2004.
Products sold between us and our unconsolidated affiliate are sold at cost in order to eliminate any profit on these transactions. Total related net sales were $3.7 million, $4.7 million, and $8.2 million in fiscal years 2006, 2005, and 2004 respectively.
We purchased the non-owned balance of this joint venture in March 2006 (see Note 16 “Subsequent Events”). This purchase ill result in the future consolidating of this affiliate’s financial statements with those of UAP Holding Corp. w
Accounts Payable. Accounts payable includes payables to our vendors for goods we have received. At the end of the crop season, some of our vendors generally agree to repurchase our inventory that is currently on hand and then allow us to repurchase such inventory under new terms. When customers give us advances, sometimes in exchange for a future discount, it is included in accounts payables.
49

Other Current Accrued Liabilities. Other accrued liabilities include liabilities for expenses, claims incurred but not yet billed, and self-insurance reserves and environmental reserves as set forth below. It also includes “Checks not yet presented,” which represents bank accounts with negative balances due to outstanding checks not yet presented to the bank. We may also provide additional discounts and cash payments to customers that meet certain target programs, which are accrued in this account.
• Self-Insurance Reserves. We are self-insured for certain losses and expenses within the retentions of our insurance policies for claims relating to workers’ compensation, employee medical, automobile, general and product liability, and crop claims as well as claims for which we are not insured (“self-insured losses”). We maintain stop loss coverage to limit the exposure that could arise out of such claims. Self-insurance losses for claims filed and claims incurred but not reported are accrued based upon our estimates of the aggregate liability for uninsured claims using loss development factors and actuarial assumptions followed in the insurance industry and our historical loss development experience. Our reserves for self-insured losses were $7.5 million on February 26, 2006, and $8.0 million on February 27, 2005. To the extent the projected losses resulting from claims incurred as of February 26, 2006, differs from the actual development of such losses in future periods, our self-insurance reserves could differ significantly, resulting in either higher or lower future self-insurance expenses.
• Environmental Reserves. Environmental costs, other than those of a capital nature, are accrued at the time the exposure becomes known and costs can reasonably be estimated. Costs are accrued based upon management’s estimates of all direct costs, after taking into account reimbursements by third parties. We do not accrue liabilities for unasserted claims that we do not reasonably believe are probable or for which we do not believe it is possible to develop an estimate of the range of reasonably possible environmental loses due to uncertainties regarding the status of laws, regulations, enforcement policies, the impact of other potentially responsible parties, technology, information related to individual sites, and other factors. Our environmental reserves were $1.5 million and $1.3 million as of February 26, 2006, and February 27, 2005, respectively. To the extent the projected future development of losses resulting from environmental claims incurred as of February 26, 2006, differs from the actual development of such losses in future periods, our environmental reserves could differ significantly, resulting in either higher or lower future expense.
Other Noncurrent Accrued Liabilities. • Asset Retirement Obligations. SFAS No. 143, “Accounting for Asset Retirement Obligations,” requires
us to record an asset and related liability for the costs associated with the retirement of long-lived tangible assets when a legal obligation to retire the asset exists. This includes obligations incurred as a result of the acquisition, construction, or normal operation of a long-lived asset. In March 2005, the Financial Accounting Standards Board (FASB) issued FASB Interpretation No. 47 (FIN 47) “Accounting for Conditional Asset Retirement Obligations,” providing final guidance that clarifies how companies should account for asset retirement obligations at fair value at the time the liability is incurred. Accretion expense is recognized as an operating expense using the credit-adjusted risk-free interest rate in effect when the liability was recognized. The associated asset retirement obligations are capitalized as part of the carrying amount of the long-lived asset and depreciated over the estimated remaining useful life of the asset, generally for periods ranging from 5 to 40 years. The majority of our asset retirement obligations relate to environmental testing and potential property restoration costs.
Fair Values of Financial Instruments. Unless otherwise specified, we believe the carrying amount of financial instruments pproximate their fair value. a
Revenue Recognition. Sales revenue is recognized when the earnings process is complete, which is generally when title and risk of ownership are transferred to our customers. In all cases, we apply the following criteria in recognizing revenue: persuasive evidence of an arrangement exists, delivery has occurred or services have been rendered, the selling price is fixed or determinable and collection is reasonably assured. Sales revenue is recognized as the net amount to be received after deducting estimated amounts for discounts, trade allowances, customer rebates, and product returns. Other income items of service fee income and royalty income are recognized when earned and received.
Concentration of Credit Risk. The majority of our sales are credit sales, which are made primarily to customers whose ability to pay is dependent, in part, upon the weather conditions and general economic conditions in the areas in which they operate. Concentration of credit risk with respect to trade accounts receivable is limited by the large number of customers comprising our customer base and the geographic regions in which they operate. We perform ongoing credit evaluations of our customers and in certain situations obtain collateral sufficient to protect our credit position.
Shipping and Handling Fees and Costs. We include shipping and handling fees billed to customers in net sales. Shipping and handling costs associated with inbound freight are capitalized to inventories and relieved through cost of sales as
50

inventories are sold. Shipping and handling costs associated with outbound freight are included within distribution and delivery expense as part of cost of goods sold.
Income Taxes. Income taxes at the enacted rate are provided for the tax effects of transactions reported in the financial statements and consist of taxes currently due and deferred taxes related primarily to differences between the basis of assets and liabilities for financial and income tax reporting. The deferred tax assets and liabilities represent the future tax return consequences of those differences, which will either be deductible or taxable when the assets and liabilities are recovered or settled. Deferred taxes are also provided for operating loss carry forwards and credit carry forwards in those instances in which it is more likely than not that the loss or credit carry forward will reduce future taxes. Deferred taxes are not provided for non-tax deductible goodwill in accordance with SFAS 109, “Accounting for Income Taxes.” Deferred taxes are adjusted to reflect any changes in enacted rates applicable to our company in the period in which the rate is effective.
Earnings Per Share. Earnings per share are based on the weighted average number of shares of common stock outstanding during the period.
Fiscal Year Ended
February 26, 2006
Fiscal Year Ended
February 27, 2005
Thirteen Weeks Ended February 22,
2004
(in thousands, except per share data)
Net Income .................................................................... $ 66,377 $ 28,812 $ 9,653
Weighted average shares of common stock outstanding used in computing basic earning per share................ 50,494,690 48,041,306 46,902,351
Net effect of dilutive stock options and RSUs............... 1,757,822 1,692,838 —
Weighted average shares of common stock used in computing diluted earnings per share ....................... 52,252,512 49,734,144 46,902,351
Basic earnings per share ................................................ $ 1.31 $ 0.60 $ 0.21Diluted earnings per share ............................................. $ 1.27 $ 0.58 $ 0.21
Dividends. We paid dividends per share of $0.125 on June 1, 2005, $0.1625 per share on September 1, 2005, and December 1, 2005, and declared a dividend of $.1875 per share payable on March 1, 2006, to holders of record as of February 15, 2006. On October 4, 2004, prior to our initial public offering, we paid a special dividend of $40.0 million to holders of record of our common stock as of October 4, 2004. As of such date, we had sufficient retained earnings to pay such dividend. We paid a special dividend of $52.9 million to holders of record of our common shares on January 16, 2004, as a return of capital.
Stock Based Compensation—Successor Stock Plan. We account for employee stock option plans in accordance with Accounting Principles Board Opinion (“APB”) No 25, “Accounting for Stock Issued to Employees.” Accordingly, no stock based compensation expense is reflected in net income, as options granted under these plans have an exercise price equal to the market value of the underlying common stock on the date of the grant. SFAS No. 123, “Accounting for Stock-Based Compensation” (SFAS No. 123), as amended, allows, but does not require companies to record compensation cost for fixed stock option plans using a fair value based method. As permitted by SFAS No. 123, we elected to continue to account for compensation cost for our fixed stock option plans using the intrinsic value based method under APB No. 25. See the “Recently Issued Accounting Pronouncements” section of this Note for a discussion of recently issued rules regarding accounting for share-based payments. The following table sets forth pro forma information as if compensation cost had been determined consistent with the requirements of SFAS No. 123.
51

Stock Based Compensation—Deferred Compensation Plan:
UAP Holding Corp.
Combined Predecessor Entity–ConAgra
Agricultural Products Business
Stock-Based Compensation
Fiscal Year Ended
February 26, 2006
Fiscal Year Ended
February 27, 2005
Thirteen Weeks Ended
February 22, 2004
Thirty-Nine Weeks Ended
Novembe 23, r2003
(dollars in thousands, except per share amounts)
Net Income as reported ....................................... $ 66,377 $ 28,812 $ 9,653 $ 36,277 Add: Total stock-based employee
compensation expense as reported ....... 792 — — — Less: Total stock-based employee
compensation expense determined under fair-value-based method for all awards, net of tax............................................... (826) (513) (35) —
Pro forma net income ....................................... $ 66,343 $ 28,299 $ 9,618 $ 36,277
Basic earnings per share:
As reported ................................................ $ 1.31 $ 0.60 $ 0.21 $ — Pro forma................................................... $ 1.31 $ 0.59 $ 0.21 $ —
Diluted earnings per share:
As reported ................................................ $ 1.27 $ 0.58 $ 0.21 $ — Pro forma................................................... $ 1.27 $ 0.57 $ 0.21 $ —
Deferred Compensation—Rabbi Trust. We account for deferred compensation arrangements placed in a “rabbi trust” in accordance with EITF 97-14: “Accounting for Deferred Compensation Arrangements Where Amounts Earned Are Held in a Rabbi Trust and Invested.”
Reclassifications. Certain prior year restructuring cost amounts in the consolidated financial statements have been reclassified to conform to the current year presentation. These reclassifications had no net impact on previously reported results of operations.
Recently Issued Accounting Pronouncements. • In March 2005, the Financial Accounting Standards Board (FASB) issued FASB Interpretation No. 47,
“Accounting for Conditional Asset Retirement Obligations”, (FIN 47), which provides clarification with respect to the timing of liability recognition for legal obligations associated with the retirement of tangible long-lived assets when the timing and/or method of settlement of the obligation are conditional on a future event that may or may not be within the control of the entity. FIN 47 also clarifies that we are required to recognize a liability for such an obligation when incurred if the liability’s fair value can be reasonably estimated. FIN 47 had no material impact on our financial statements.
• In December 2004, the FASB issued SFAS No. 123 (revised 2004), “Share-Based Payment” (SFAS 123R), requiring that the compensation cost relating to share-based payment transactions be recognized in the financial statements. The cost is to be measured based on the fair value of the equity or liability instruments issued. SFAS 123R is effective for fiscal years that begin after June 15, 2005. We have adopted SFAS 123R effective February 27, 2006, and currently expect to use the modified prospective method of adoption and therefore will not restate our prior-period results. Under the modified prospective method, awards that are granted, modified, or settled after the date of adoption are measured and accounted for in accordance with SFAS 123R. Unvested equity-classified awards that were granted prior to the effective date of SFAS 123R should continue to be accounted for in accordance with SFAS 123, except that amounts must be recognized in the financial statements. We currently estimate that the adoption of SFAS 123R will have no material impact on fiscal year 2007 earnings per share. Future compensation cost will be impacted by various factors, including the number of awards granted and their related fair value at the date of grant.
• In November 2004, the FASB issued Statement of Financial Accounting Standards No. 151, “Inventory Costs, an Amendment of ARB No. 43, Chapter 4” (SFAS 151) which clarifies that abnormal amounts of idle facility expense, freight, handling costs, and wasted materials (spoilage) should be recognized as current-period charges. In addition, SFAS 151 requires that allocation of fixed production overhead to inventory be based on the normal
52

capacity of the production facilities. SFAS 151 is effective for inventory costs incurred during fiscal years beginning after June 15, 2005. We do not expect the adoption of SFAS 151 to have a material effect on our consolidated financial statements.
2. Royalties, Service Charges and Other Income and Expenses Royalties, service charges and other income and expenses consist of the following:
UAP Holding Corp.
Combined Predecessor
Entity–ConAgra Agricultural
Products Business
Fiscal Year Ended
February 26, 2006
Fiscal Year Ended
February 27, 2005
Thirteen Weeks Ended
February 22, 2004
Thirty-Nine Weeks Ended November 23,
2003
(dollars in thousands) Royalties, service charges and other (income) and
expenses
(Gain) on sale of leased assets......................... $ (2,007) $ (1,416) $ (464) $ (758)Royalty (income)............................................. (11,600) (8,751) (117) (1,040)Service charge (income).................................. (8,823) (10,114) (3,204) (7,621)Currency translation ........................................ (594) (389) (116) (2,402)Earnings of unconsolidated affiliates .............. (2,612) (1,534) (2,657) 2,857 Miscellaneous (income) .................................. (3,791) (4,448) (1,642) (2,118)
Total ......................................................................... $ (29,427) $ (26,652) $ (8,200) $ (11,082)
3. Finance related and other charges Finance related and other charges are composed of costs and fees related to the Acquisition, the Common Stock Offering, and related financing activities. These charges relate to obtaining funding or the termination of funding or other financial transaction agreements.
UAP Holding Corp.
Combined Predecessor
Entity–ConAgra Agricultural
Products Business
Fiscal Year Ended
February 26,2006
Fiscal Year Ended
February 27,2005
Thirteen Weeks Ended
February 22, 2004
Thirty-Nine Weeks Ended November 23,
2003
(dollars in thousands) Finance related and other charges:
Non-accountable charges paid to ConAgra relating to the Acquisition ..................................................... $ — $ 5,625 $ 1,875 $ —
Abandonment of Income Deposit Securities offering — 6,147 — — Costs relating to our Common Stock Offering ......... 330 2,667 — — Premium payable with respect to notes redeemed .... — 1,774 — — Write-off of debt issuance costs on note redemption — 849 — —
Total ......................................................................... $ 330 $ 17,062 $ 1,875 $ —
53
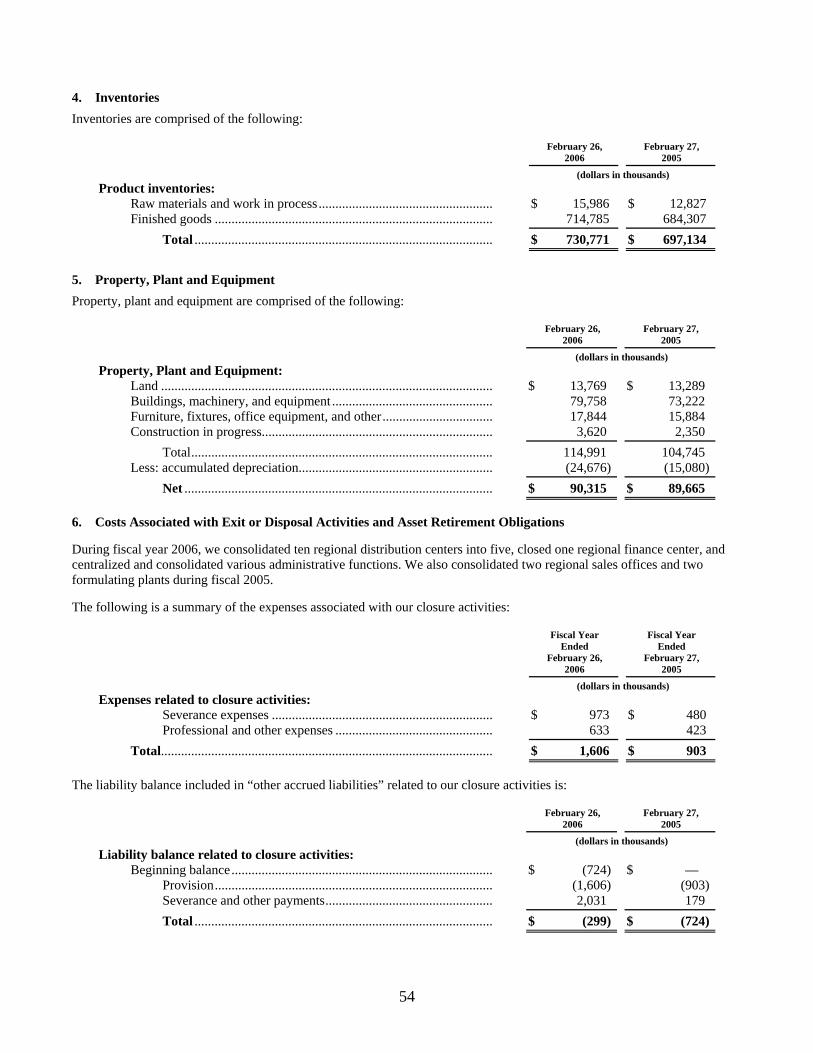
4. Inventories Inventories are comprised of the following:
February 26,2006
February 27,2005
Product inventories: (dollars in thousands)
Raw materials and work in process.................................................... $ 15,986 $ 12,827 Finished goods ................................................................................... 714,785 684,307
Total ......................................................................................... $ 730,771 $ 697,134
5. Property, Plant and Equipment Property, plant and equipment are comprised of the following:
February 26,2006
February 27,2005
Property, Plant and Equipment: (dollars in thousands)
Land ................................................................................................... $ 13,769 $ 13,289 Buildings, machinery, and equipment ................................................ 79,758 73,222 Furniture, fixtures, office equipment, and other................................. 17,844 15,884 Construction in progress..................................................................... 3,620 2,350
Total.......................................................................................... 114,991 104,745 Less: accumulated depreciation.......................................................... (24,676) (15,080)
Net ............................................................................................ $ 90,315 $ 89,665
6. Costs Associated with Exit or Disposal Activities and Asset Retirement Obligations
During fiscal year 2006, we consolidated ten regional distribution centers into five, closed one regional finance center, and centralized and consolidated various administrative functions. We also consolidated two regional sales offices and two formulating plants during fiscal 2005.
The following is a summary of the expenses associated with our closure activities:
Fiscal Year Ended
February 26,2006
Fiscal Year Ended
February 27,2005
(dollars in thousands) Expenses related to closure activities:
Severance expenses .................................................................. $ 973 $ 480 Professional and other expenses ............................................... 633 423
Total................................................................................................... $ 1,606 $ 903
The liability balance included in “other accrued liabilities” related to our closure activities is:
February 26,2006
February 27,2005
(dollars in thousands) Liability balance related to closure activities:
Beginning balance.............................................................................. $ (724) $ — Provision................................................................................... (1,606) (903)Severance and other payments.................................................. 2,031 179
Total ......................................................................................... $ (299) $ (724)
54

As of February 26, 2006, we have incurred $1.2 million of the total estimated costs of $1.3 million for the restructuring activities begun in fiscal year 2005. For the restructuring activities begun in fiscal year 2006, we have incurred $1.3 million of the total estimated costs of $1.7 million.
We also have asset retirement obligations related to SFAS No. 143, “Accounting for Asset Retirement Obligations.” Cash flow revisions relate to updated and refined estimates of the cost of property restoration and environmental remediation costs at both owned and leased facilities, based on a study done in fiscal 2006.
UAP Holding Corp.
Combined Predecessor
Entity–ConAgra Agricultural
Products Business
Fiscal Year Ended
February 26, 2006
Fiscal Year Ended
February 27, 2005
Thirteen Weeks Ended
February 22, 2004
Thirty-Nine Weeks Ended November 23,
2003
(dollars in thousands) Asset Retirement Obligations:
Beginning balance .................................................... $ 2,411 $ 2,343 $ — $ — Obligations incurred........................................ 3 — 2,314 — Obligations settled........................................... — (74) — — Accretion expense ........................................... 70 115 29 — Cash flow revision........................................... (2,222) 27 — —
Ending Balance ....................................................... $ 262 $ 2,411 $ 2,343 $ —
7. Other Identifiable Intangible Assets Other identifiable intangible assets are as follows:
February 26, 2006
February 27, 2005
Gross CarryingAmount
Accumulated Amortization
Net
Gross Carrying Amount
Accumulated Amortization
Net
(dollars in thousands) Intangible Assets:
Amortizing intangible assets
EPA registrations................... $ 5,450 $ (1,226) $ 4,224 $ 5,450 $ (681) $ 4,769 Customer relationships .......... 3,150 (709) 2,441 3,150 (394) 2,756 Non-compete agreements ...... 1,459 (459) 1,000 459 (459) — Other ...................................... 3,151 (1,095) 2,056 2,350 (588) 1,762
Total ............................ $ 13,210 $ (3,489) $ 9,721 $ 11,409 $ (2,122) $ 9,287
Non-amortizing intangible assets
Trademarks ............................ 14,000 — 14,000 14,000 — 14,000 Other ...................................... 2,400 — 2,400 2,607 — 2,607
Total ............................ $ 16,400 $ — $ 16,400 $ 16,607 $ — $ 16,607
Total................................................ $ 29,610 $ (3,489) $ 26,121 $ 28,016 $ (2,122) $ 25,894
The amortization period is 10 years for acquired customer relationships and EPA registrations and 5 years for non-compete agreements and other. The fiscal year 2006 increase in other identifiable intangible assets is related to the asset purchase of two small businesses during the year. At February 26, 2006, the weighted average period for amortizing intangible assets on a combined basis is 7.4 years.
The aggregate amortization expense for the fiscal years ended February 26, 2006, and February 27, 2005, was $1.4 million and $1.7 million respectively, and $0.4 million for the thirteen weeks ended February 22, 2004. Based on our intangible asset base on February 26, 2006, we estimate that our total annual amortization expense will be approximately $1.7 million for each of the next three fiscal years, and approximately $1.2 million for each of the subsequent two fiscal years.
55

8. Income Taxes We estimate that we will have a foreign tax credit carryover of $0.7 million, of which $0.2 million and $0.5 million will expire at the end of fiscal year 2015 and fiscal year 2016 respectively. We currently believe it is more likely than not that we will fully utilize this carryover before it expires. We have determined that the effective blended state tax rate, before considering the federal tax benefit for deduction of state taxes, applicable to our reorganized business has decreased from 7.2% to 5.3%. An adjustment to deferred taxes recorded at the 7.2% was made in in the fourth quarter of fiscal 2006 with the ssociated benefit of $0.4 million being recorded as a reduction in tax expense. a
The following table summarizes our income tax provision:
UAP Holding Corp.
Combined Predecessor
Entity–ConAgra Agricultural
Products Business
Fiscal Year Ended
February 26, 2006
Fiscal Year Ended
February 27, 2005
Thirteen Weeks Ended
February 22, 2004
Thirty-Nine Weeks Ended November 23,
2003
Income tax provision (benefit): (dollars in thousands)
Current:
U.S. federal ......................................................... $ 38,050 $ 9,456 $ (15,784) $ 23,119 U.S. state ............................................................. 3,832 1,578 (1,804) 1,949 Outside United States .......................................... 2,462 3,111 (482) —
Total Current.............................................. 44,344 14,145 (18,070) 25,068 Deferred:
U.S. federal ......................................................... (2,081) 1,806 21,975 — U.S. state ............................................................. (424) 286 1,884 — Outside United States .......................................... 298 (602) — —
Total Deferred............................................ (2,207) 1,490 23,859 —
Total ............................................................................. $ 42,137 $ 15,635 $ 5,789 $ 25,068
UAP Holding Corp.
Combined Predecessor
Entity–ConAgra Agricultural
Products Business
Fiscal Year Ended
February 26, 2006
Fiscal Year Ended
February 27, 2005
Thirteen Weeks Ended
February 22, 2004
Thirty-Nine Weeks Ended November 23,
2003
Factors causing income taxes to differ from U.S. federal statutory rate:
(dollars in thousands)
U.S. federal statutory rate ............................................. $ 37,981 $ 15,555 $ 5,405 $ 23,119 Dividends on shares of stock held in a rabbi trust ........ (387) (1,601) — — State income taxes ........................................................ 3,408 1,864 618 1,717 Foreign credits .............................................................. (461) (580) — — Non-deductible offering expense.................................. — 933 — — Other ............................................................................. 1,596 (536) (234) 232
Total ............................................................................. $ 42,137 $ 15,635 $ 5,789 $ 25,068
56

UAP Holding Corp.
February 26,2006
Februar 27, y2005
(dollars in thousands) Deferred income tax balances related to:
Allowances ...................................................................................................................... $ 7,287 $ 2,687 Inventory.......................................................................................................................... 7,589 8,996 Accrued expenses ............................................................................................................ 6,091 4,977 Pension and other post retirement benefits ...................................................................... 201 603
Total current deferred tax assets ........................................................................ 21,168 17,263 High yield bond interest................................................................................................... 6,920 3,490 Accrued expenses ............................................................................................................ 202 957 Depreciation and amortization......................................................................................... — 236 Foreign tax credit carryover............................................................................................. 661 371 Rabbi trust........................................................................................................................ 2,168 1,913
Total long-term deferred tax assets .................................................................... 9,951 6,967
Total deferred tax assets................................................................................................ 31,119 24,230
Other current liabilities .................................................................................................... (1,433) (108)
Total current deferred tax liabilities .................................................................. (1,433) (108)Depreciation and amortization......................................................................................... (2,422) (2,111)Basis difference—acquired assets.................................................................................... (17,049) (21,479)Other long-term liabilities................................................................................................ (5) —
Total long-term deferred tax liabilities............................................................... (19,476) (23,590)
Total deferred tax liabilities.......................................................................................... (20,909) (23,698)
Net deferred tax assets................................................................................................... $ 10,210 $ 532
9. Related Party Transactions
Prior to the Acquisition, ConAgra’s executive, finance, tax, and other corporate departments performed certain administrative and other services for the Company. Expenses incurred by ConAgra and allocated to us were determined based on specific services being provided or were allocated based on ConAgra’s investment in us in proportion to ConAgra’s total investment in its subsidiaries. In addition, ConAgra charged us finance charges on ConAgra’s investment in us and net intercompany advances. While management believes that such expense allocations were reasonable, it is not practical to estimate the expenses that would have been incurred by us if we had operated on a stand-alone basis.
As part of the Acquisition, we paid ConAgra a non-accountable charge of $7.5 million. For the year ended February 27, 2005, and the thirteen-week period ended February 22, 2004, expenses of $5.6 million and $1.9 million, respectively, were recognized. The non-accountable charges are included in finance related and other charges. Additionally, ConAgra provided certain information technology and other administrative services on a fee for usage basis of $2.8 million for services performed during the transition. This transition services agreement expired on November 24, 2004, in accordance with its terms.
United Agri Products was party to a management consulting agreement (the “Management Agreement”) dated as of November 21, 2003, with funds affiliated with Apollo Management V, LP (Apollo). Under the terms of the Management Agreement, United Agri Products retained Apollo to provide certain management consulting and financial advisory services, for which United Agri Products paid Apollo an annual management fee of $1.0 million in quarterly payments of $250,000. In particular, the Management Agreement required Apollo to advise United Agri Products concerning matters relating to proposed financial transactions, acquisitions, and other senior management matters related to the business, administration, and policies of United Agri Products and its affiliates. In addition, as consideration for arranging the Acquisition and the preparation of a registration statement with respect to an exchange offer for United Agri Products’ 8 1/4% Senior Notes due 2011, United Agri Products paid Apollo a fee of $5.0 million in January 2004, which was capitalized as part of the Acquisition. Upon consummation of the Common Stock Offering, United Agri Products also paid Apollo a transaction fee of $3.5 million. The Management Agreement had, by its terms, an initial term of seven years, which commenced on November 21, 2003. Concurrently with the closing of the Common Stock Offering and payment of the aforementioned transaction fee and all other amounts payable to Apollo under the Management Agreement, the Management Agreement was terminated in its entirety.
57

As of February 22, 2004, Apollo owned approximately 95% of our outstanding common stock. At February 26, 2006, and February 27, 2005, Apollo owned approximately 34% of our outstanding common stock. During March 2006, Apollo’s ownership was reduced to approximately 17% (See Note 16 “Subsequent Events”).
10. Debt Total long-term debt as of February 26, 2006, and February 27, 2005, consisted of the following:
February 26,2006
February 27,2005
(dollars in thousands) Total debt:
Revolving credit facility......................................................................................... $ — $ 55 8 1/4% Senior Notes................................................................................................. 203,500 203,500 10 3/4% Senior Discount Notes ............................................................................... 102,839 92,448
Total ............................................................................................................. 306,339 296,003 Less: current portion
Revolving credit facility......................................................................................... — 55
Total long term............................................................................................ $ 306,339 $ 295,948
Our $500.0 million asset based revolving credit facility has a five-year term and is scheduled to expire in 2008. At February 26, 2006, there was $334.4 million of total borrowing capacity under the revolving credit facility and aggregate borrowing availability there under of $310.3 million (after giving effect to $24.1 million of letters of credit under the sub-facility).
The revolving credit facility also contains the following financial covenants: • If and for so long as aggregate borrowing availability is less than $40.0 million, UAP Holding Corp. and its
subsidiaries will be required to have EBITDA of at least $70.0 million, measured as of the last day of each month for the trailing twelve-month period then ended.
• If and for so long as aggregate borrowing availability is less than $40.0 million, UAP Holding Corp. and its subsidiaries will be required to maintain a fixed charge coverage ratio of not less than 1.1 to 1.0, measured as of the last day of each month for the trailing twelve-month period then ended.
The obligations under the revolving credit facility are secured by a first priority lien on or security interest in, subject to certain restrictions, substantially all of UAP Holding Corp.’s, United Agri Products, and UAP Canada’s properties and assets.
The 8 1/4% Senior Notes were issued on December 16, 2003, and are due December 15, 2011. The proceeds from such offering were used to repay the entire principal amount, plus accrued interest, incurred in connection with a $175.0 million unsecured senior bridge loan facility. United Agri Products, Inc. entered into the senior bridge loan facility on November 24, 2003, and used borrowings thereunder to fund, in part, the Acquisition. On December 29, 2004, $21.5 million of the 8 1/4% Senior Notes were redeemed with proceeds from the Common Stock Offering. In addition, United Agri Products, Inc. may redeem some or all of the remaining 8 1/4% Senior Notes at a redemption price that may include a redemption premium and a make-whole premium. UAP Holding Corp. issued $125.0 million aggregate principal amount at maturity of 10 3/4% Senior Discount Notes on January 26, 2004, that are due July 15, 2012. The 10 3/4% Senior Discount Notes were issued at a price of 65.992% of the principal amount thereof, resulting in gross proceeds to UAP Holding Corp. of approximately $82.5 million. The original issue discount accretes to par value in 2008. At such time interest will accrue at 10 3/4% per annum and will be payable in cash semi-annually in arrears commencing on July 15, 2008. As of February 26, 2006, the accreted value was $102.8 million. In addition, we may redeem some or all of the 10 3/4% Senior Discount Notes at any time after January 15, 2008, at a redemption price that may include a redemption premium.
Please see Note 16 “Subsequent Events” for additional information regarding the refinancing of our debt.
Our debt agreements, including the revolving credit facility and the indentures governing the 8 1/4% Senior Notes and 10 3/4% Senior Discount Notes, contain certain customary representations, warranties, and affirmative covenants. In addition, the debt agreements contain customary negative covenants restricting UAP Holding Corp.’s ability and the ability of its subsidiaries to, among other things:
• incur additional indebtedness;
58

• pay dividends or make other distributions; • make certain investments; • incur liens; and • sell all or substantially all of UAP Holding Corp.’s assets or merge with or into other companies.
As of February 26, 2006, approximately $40.4 million of permitted distributions were available under our dividend payment covenant in our indenture governing the 10 3/4% Senior Discount Notes.
Maturities of debt for each of the five years subsequent to February 26, 2006, are as follows:
Fiscal Year Ending
(dollars in thousands)
2007 ....................................................................................................................... $ 0 2008 ....................................................................................................................... 0 2009 ....................................................................................................................... 0 2010 ....................................................................................................................... 0 2011 ....................................................................................................................... 0 2012 and thereafter ................................................................................................ 328,500
Total............................................................................................................. $ 328,500
Based on current market rates primarily provided by outside investment bankers, the fair value of the 8 1/4% Senior Notes and the 10 3/4% Senior Discount Notes at February 26, 2006, was estimated at $328.8 million.
11. Commitments and Contingencies
We lease certain facilities and transportation equipment under agreements that expire at various dates. We expect that, in the normal course of our business, leases that expire will, where necessary, be renewed or replaced by other leases. Substantially all leases require the payment of property taxes, insurance, and maintenance costs in addition to rental payments. Capital leases are not significant. Rent expense under all operating leases was $40.0 million in fiscal 2006, $39.1 million in fiscal 2005, and $8.9 million and $32.1 million in the thirteen weeks ended February 22, 2004, and thirty-nine weeks ended
ovember 23, 2003, respectively. N A summary of non-cancelable operating lease commitments for fiscal years following February 26, 2006, is as follows:
Fiscal Year
(dollars in thousands)
2007 ....................................................................................................................... $ 6,554 2008 ....................................................................................................................... 4,700 2009 ....................................................................................................................... 2,754 2010 ....................................................................................................................... 1,597 2011 ....................................................................................................................... 984 2012 and thereafter ................................................................................................ 4,586
Total............................................................................................................. $ 21,175
We have excluded potential lease obligations over the next five years of approximately $53.6 million from the table above, as the relevant leases are cancelable within one year.
We had letters of credit outstanding at February 26, 2006, of $24.1 million.
We are a party to a number of lawsuits and claims arising out of the operation of our businesses. Our management believes the ultimate resolution of such matters should not have a material adverse effect on our financial condition, results of operations, or liquidity.
In some cases, third parties (including government reimbursement funds and insurers) may contribute to the costs of cleanup at certain sites. ConAgra has agreed to provide us with a partial reimbursement of costs that we may incur in the future relating to any cleanup requirements arising out of pre-closing environmental conditions at our Greenville, Mississippi facility. On October 14, 2002, December 23, 2002, and December 31, 2002, three separate lawsuits were filed in the Circuit Court of Washington County, Mississippi against our subsidiary, Platte Chemical Company (“Platte”), and certain former
59

employees of Platte, relating to alleged releases from Platte’s Greenville, Mississippi facility. The plaintiffs in such suits are seeking compensation for alleged personal injury and property damage. In connection with the Acquisition, ConAgra agreed to partially reimburse us, subject to a cap, for fees and expenses we incur in connection with such lawsuits. Subsequent to November 23, 2003, another lawsuit not covered by the ConAgra cost sharing agreement was filed in the Circuit Court of Washington County, Mississippi against us and Apollo, which lawsuit relates to the same alleged releases from the Greenville, Mississippi facility. While discovery in the Greenville litigations is not yet complete, based on information available to us at this time we do not believe that such litigations, if adversely determined, would have a material adverse effect on our business, financial condition, results of operations, or liquidity.
12. Employee Benefit Plans Management Incentive Program. We have a management incentive plan for key officers and employees, based on growth, profitability, individual performance of each operating center and key performance metrics. Amounts charged to expense totaled $23.4 million in fiscal 2006, $24.7 million in fiscal 2005, and $2.8 million and $21.5 million in the thirteen weeks ended February 22, 2004, and the thirty-nine weeks ended November 23, 2004, respectively. These costs exclude related payroll taxes and benefits.
On November 17, 2004, our board of directors approved the 2004 Long-Term Incentive Plan. During fiscal year 2006, we recorded $0.8 million of expense for stock awards issued under the plan. No 2004 plan awards were granted in prior years.
Predecessor Retirement Pension Plans. The Predecessor had defined benefit retirement plans for eligible salaried and hourly employees. Benefits were based on years of credited service and average compensation or stated amounts for each year of service. The Predecessor funded these plans in accordance with the minimum and maximum limits established by law. Employees of the company also participate in defined benefit and defined contribution plans sponsored by ConAgra.
Successor Retirement Plans. Retirement Program for Canadian Employees United Agri Products Canada, Inc. (“UAP Canada”), one of our subsidiaries, currently has two retirement plans for employees of UAP Canada. They are eligible to participate in these plans after completing one year of service. One plan is an optional RRSP/DPSD Defined Contribution plan. UAP Canada will match 50% of an employee’s first 6% of contributions to the plan.
The second plan is a Defined Benefit plan. UAP Canada is responsible for funding this plan and is currently contributing at a rate of 7.1% of payroll. Benefits are based on years of credited service and average compensation in the last 5 years of service. We assumed the plan assets and obligations of the UAP Canadian Pension Plan as reported under the Predecessor. Components of the Canadian Pension Plan are reported below.
60

The change in pension benefit costs is as follows:
UAP Holding Corp.
Combined Predecessor
Entity–ConAgra Agricultural
Products Business
Fiscal Year Ended
February 26, 2006
Fiscal Year Ended
February 27, 2005
Thirteen Weeks Ended
February 22, 2004
Thirty-Nine Weeks Ended November 23,
2003
(dollars in thousands) Pension benefit costs
Service cost for benefits earned during the year .... $ 359 $ 426 $ 55 $ 165 Interest cost on benefit obligations ........................ 276 202 42 126 Assumed return on plan assets............................... (218) (187) (41) (124)Recognized net actuarial loss................................. — — 16 49
Pension benefit cost—company plans.......... 417 441 72 216 Pension benefit cost—multi employer plans ......... — — — 7,052
Total pension benefit cost................. $ 417 $ 441 $ 72 $ 7,268
Actuarial assumptions
Discount rate.......................................................... 5.75% 6.00% 6.50% 6.50%Assumed long-term rate of return on plan assets ... 6.50% 6.50% 7.75% 7.75%Annual long-term rate of compensation increase... 3.50% 4.50% 5.50% 5.50%
The expected return on assets represents management’s best estimate of the long-term rate of return on plan assets applied to the fair value of plan assets. The Company establishes its estimate of the expected rate of return on plan assets based on the fund’s target asset allocation and estimated long-term rates of return for each asset class. Estimated rates of return are based on expected returns from fixed income securities which take into account bond yields. An equity risk premium is then applied to estimate equity returns. Differences between expected and actual return are included in actuarial gains and losses.
61
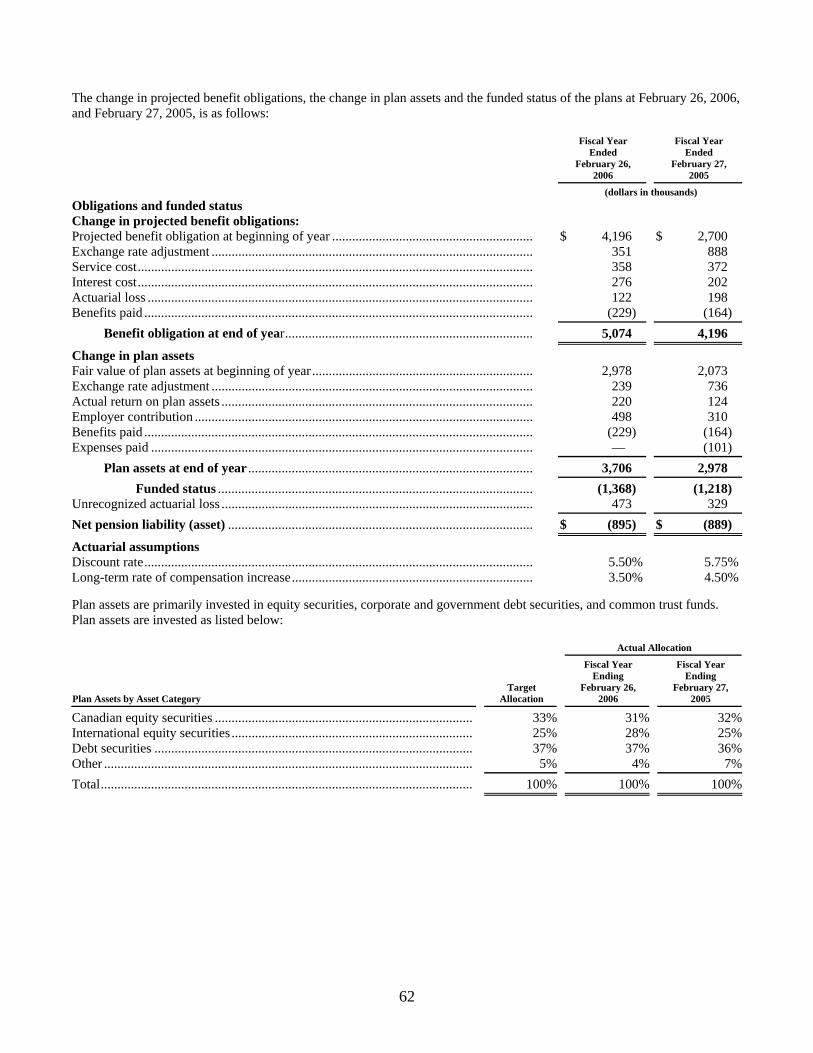
The change in projected benefit obligations, the change in plan assets and the funded status of the plans at February 26, 2006, and February 27, 2005, is as follows:
Fiscal Year Ended
February 26, 2006
Fiscal Year Ended
February 27, 2005
Obligations and funded status (dollars in thousands)
Change in projected benefit obligations:
$ 4,196
$ 2,700 Projected benefit obligation at beginning of year ............................................................ Exchange rate adjustment ................................................................................................ 351 888 Service cost...................................................................................................................... 358 372 Interest cost...................................................................................................................... 276 202 Actuarial loss ................................................................................................................... 122 198 Benefits paid .................................................................................................................... (229) (164)
Benefit obligation at end of year.......................................................................... 5,074 4,196
Change in plan assets
Fair value of plan assets at beginning of year.................................................................. 2,978 2,073 Exchange rate adjustment ................................................................................................ 239 736 Actual return on plan assets ............................................................................................. 220 124 Employer contribution ..................................................................................................... 498 310 Benefits paid .................................................................................................................... (229) (164) Expenses paid .................................................................................................................. — (101)
Plan assets at end of year ..................................................................................... 3,706 2,978
Funded status .............................................................................................. (1,368) (1,218) Unrecognized actuarial loss ............................................................................................. 473 329
Net pension liability (asset) ........................................................................................... $ (895) $ (889)
Actuarial assumptions
Discount rate.................................................................................................................... 5.50% 5.75%Long-term rate of compensation increase........................................................................ 3.50% 4.50%
Plan assets are primarily invested in equity securities, corporate and government debt securities, and common trust funds. Plan assets are invested as listed below:
Actual Allocation
Plan Assets by Asset Category
Target Allocation
Fiscal Ye r aEnding
Februar y 26,2006
Fiscal Ye r aEnding
February 27,2005
Canadian equity securities ............................................................................. 33% 31% 32%International equity securities ........................................................................ 25% 28% 25%Debt securities ............................................................................................... 37% 37% 36%Other .............................................................................................................. 5% 4% 7%
Total............................................................................................................... 100% 100% 100%
62

Expected cash flows are as follows:
Expected Cash Flows
Fiscal Year
Amount
(dollars in thousands)
Expected employer contributions for fiscal year ending February .................................. 2007 $ — Expected benefit payments for fiscal year ending February ............................................ 2007 $ 154
2008 $ 157
2009 $ 159
2010 $ 163
2011 $ 165
Next 5 years $ 881
Retirement Program for Domestic Employees. We maintain the United Agri Products, Inc. Retirement Income Savings Plan. Participants who meet certain eligibility requirements may make contributions and receive company matching and discretionary contributions under this plan. We match 66.66% of the amount participants elect to contribute to the plan up to 6% of their pay. We have the following contribution obligations as part of the plan:
• Annual Retirement and Performance Discretionary Contribution that is allocated among all eligible participants as provided under the terms of the plan.
• Transition Contribution that is allocated annually through 2008 to those eligible participants who were age 50 or greater and had 10 or more years of service upon our divestiture from ConAgra Foods.
Amounts charged to expense for this plan total $7.1 million for fiscal 2006, $8.1 million for fiscal 2005, and $10.5 million for the combined thirteen weeks ended February 22, 2004, and thirty-nine weeks ended November 23, 2003.
There is no Defined Benefit pension plan for domestic employees.
13. Stock Plans Certain of our employees participate in our 2003 Stock Option Plan (“2003 Plan”). This plan provides for the granting of options to our employees, directors, and consultants for the purchase of shares of our common stock. The exercise price, term, and other terms and conditions of the option are determined by our board of directors (or its compensation committee) when the option is granted. Options granted under the plan consist of three tranches, A, B, and C, each with different vesting requirements. They generally expire eight years after the grant date. As of February 26, 2006, all options granted under the plan were granted at fair market value at the date of the grant and have an exercise price of approximately $2.56 per share.
The aggregate number of Tranche A, B, and C options granted under the 2003 Plan was 3,066,400 as of February 26, 2006, and February 27, 2005, and 2,904,025 as of February 22, 2004. The Tranche B options and Tranche C options became fully vested in connection with the consummation of the Common Stock Offering in fiscal year 2005. As of February 26, 2006, there were 2,028,621 options vested, which included 329,863 Tranche A options, 849,379 Tranche B options, and 849,379 Tranche C options. There were 519,516 and 828,535 unvested Tranche A options as of fiscal year-end 2006 and 2005 respectively. There were 354,970 and 216,765 shares available for award grant purposes under the plan as of February 26, 2006, and February 27, 2005, respectively. No 2003 Plan options had vested as of February 22, 2004.
As of February 27, 2005, non-executive members on our board of directors had been granted options to purchase 351,762 shares of our common stock under our 2004 Non-Executive Director Stock Option Plan, all of which vested immediately, and 58,627 of which were exercised in fiscal year 2005. As of February 26, 2006, 293,135 options were vested and 234,517 shares of common stock remained available for award grant purposes under this plan. There was no activity in the 2004 Non-executive Director Stock Option Plan during fiscal year 2006.
The income tax benefit received from the exercise of stock options was $0.3 million in fiscal year 2005 and $2.6 million in fiscal year 2006. These amounts were credited to additional paid-in capital.
63

The changes in the outstanding stock options under the 2003 Plan and the 2004 Non-Executive Director Stock Option Plan during the year ended February 26, 2006, February 27, 2005, and the thirteen weeks ended February 22, 2004, are summarized below:
Stock options
Shares subject to option
Weighted- average exerciseprice per share
Beginning balance November 23, 2003.................................................................... — $ — Granted............................................................................................................ 2,904,025 $ 2.56 Exercised......................................................................................................... — $ —
$ 2.56 Balance at February 22, 2004 (No shares vested and exercisable) ........................... 2,904,025 Granted............................................................................................................ 514,137 $ 2.56 Exercised......................................................................................................... (58,627) $ 2.56
$ 2.56 Balance at February 27, 2005 (2,531,000 shares vested and exercisable) ................ 3,359,535 Granted............................................................................................................ — $ — Exercised......................................................................................................... (380,058) $ 2.56 Forfeited .......................................................................................................... (138,205) $ 2.56
$ 2.56 Balance at February 26, 2006 (2,321,756 shares vested and exercisable) ................ 2,841,272
The following table sets forth information about the fair value of each option grant on the date of grant using the Black-Scholes option pricing model and the weighted-average assumptions used for such grants for the 53 weeks ended February 27, 2005, and the thirteen weeks ended February 22, 2004.
Fiscal Year
2005
2004
Date of Grant ....................................................................................... April 2004 November 2003 Expected Volatility .............................................................................. 0.00% 0.00% Expected life (years) ............................................................................ 5.00 5.00 Risk-free interest rate........................................................................... 3.39% 3.28% Dividend yield ..................................................................................... 0.00% 0.00% Weighted average fair value of options ............................................... $0.39 $0.38
Our stockholders approved a Long-Term Incentive Plan (the “2004 Plan”) on November 17, 2004. Subject to the applicable share limits of the 2004 Plan, the shares available for award grant purposes under the 2004 Plan generally may be used for any type of award authorized under that plan including options, stock appreciation rights, restricted stock, restricted stock units, stock bonuses, and other forms of awards granted or denominated in UAP Holding Corp.’s common stock or units
presenting common stock. re Activity under the 2004 plan is as follows:
2004 Plan Stock Awards
Shares subject to option
Weighted- average grant
price per share
Balance at February 27, 2005 ...................................................................................... — $ — Granted – Restricted Stock Units ....................................................................... 249,575 $ 15.97 Exercised............................................................................................................ — $ — Forfeited – Restricted Stock Units ..................................................................... (25,525) $ 15.94
$ 15.97 Balance at February 26, 2006 (No shares vested)........................................................ 224,050
Fiscal year 2006 awards granted under the 2004 Plan vest over a four year period. Compensation expense is recognized over the vesting periods based on the market value of our common stock on the date of the award. Total compensation expense recognized during fiscal year 2006 was $0.8 million. Additional paid-in capital is increased as compensation expense is recognized.
We maintain three deferred compensation plans for the benefit of certain members of management and the board of directors, the 2003 Deferred Compensation Plan (the “2003 DCP”), which was adopted in connection with the Acquisition, the 2004 Deferred Compensation Plan (the “2004 DCP”), which was adopted on April 2, 2004, and the 2005 Director Deferred
64

Compensation Plan (the “Director DCP”) which was adopted on April 29, 2005. The 2003 DCP provides for the crediting of deferred shares for each executive who entered into a retention agreement at the time of the Acquisition. The 2004 DCP provides for the crediting of deferred shares for each member of management who waived the right to receive a cash bonus for the 2004 fiscal year. The Director DCP allows our non-employee directors to elect to defer payment of all or a portion of their fees and have such amounts credited under the plan in the form of deferred shares. Our board of directors (or its compensation committee) may also grant our non-employee directors deferred shares under the Director DCP. Shares delivered under the Director DCP in respect of an award of deferred shares are charged against the share limits of our 2004 Long Term Incentive Plan.
Each deferred share represents the right to receive one share of common stock on the applicable payment date, subject to adjustment in the event of a stock split or similar event affecting UAP Holding Corp.’s common stock. Deferred shares become payable upon a termination of the executive’s employment, certain changes in control of UAP Holding Corp. and certain offerings of UAP Holding Corp.’s common stock (based upon certain piggyback rights contained in the Management Incentive Agreement). The plans prohibit the assignment of the deferred shares except upon an executive’s death. The company established a trust (the “Rabbi Trust”) to hold the assets of the 2003 DCP, the 2004 DCP, and the Director DCP. The assets of the Rabbi Trust are subject to the claims of the company’s creditors in the event of the company’s insolvency. All participants in the 2003 and 2004 DCP plans executed a lock-up agreement, pursuant to which they agreed not to engage in any transaction involving the company’s securities prior to the date which was six months after the close of the Common Stock Offering. As shares in the Rabbi Trust are released to participants under the terms of the trust agreement, the Company receives a tax deduction for the excess of fair value of the shares over the participants’ basis therein. This tax benefit is credited to additional paid-in capital as it is realized.
14. Business Segment and Related Information Management has organized the Company around the Proprietary and Private Label Products and Distribution organizations, but it manages the Company as a single segment engaged in the sale of agricultural inputs to growers and regional dealers. The Proprietary and Private Label Products organization primarily focuses on the sourcing of private label and proprietary products for sale by the Distribution division and its operations are tightly integrated with those of the Distribution organization. When making management decisions to allocate resources, the anticipated results of the Proprietary and Private Label Products organization are aggregated with those of Distribution to arrive at an outcome. Combined performance is also considered when making operating decisions, such as procurements, logistics, warehousing, pricing, terms, sales, personnel, management goals and incentives, and supplier relations. In summary the Company views the Proprietary and Private Label Products organization as one component of the procurement, logistics, and supply chain functions of the Company.
The two organizations meet the aggregation criteria as outlined in SFAS 131, having similar 1) economic characteristics, 2) products and services, 3) customers, 4) distribution channels, and 5) regulatory environments.
Because of the integrated nature of the two Divisions and the meeting of the aggregation criteria and most of the quantitative thresholds as defined in SFAS 131, we have determined that the Company has one reporting segment, engaged in the sale of agricultural inputs to growers and regional dealers.
65

Net sales and long-lived assets by geographical area are as follows:
UAP Holding Corp.
Combined Predecessor
Entity–ConAgra Agricultural
Products Business
Fiscal Year Ended
February 26, 2006
Fiscal Year Ended
February 27, 2005
Thirteen Weeks Ended
February 22, 2004
Thirty-Nine Weeks Ended November 23,
2003
(dollars in thousands) Net sales:
United States ................................................... $ 2,646,436 $ 2,435,165 $ 217,976 $ 2,128,545 Canada............................................................. 81,353 71,565 9,802 95,562
Total ...................................................... $ 2,727,789 $ 2,506,730 $ 227,778 $ 2,224,107
February 26, 2006
February 27, 2005
Long-lived assets:
United States ................................................... $ 175,380 $ 178,055
Canada............................................................. 580 4,098
$ 182,153
Total ...................................................... $ 175,960
Net sales by product category are as follows:
UAP Holding Corp.
Combined Predecessor
Entity–ConAgra Agricultural
Products Business
Fiscal Year Ended
February 26, 2006
Fiscal Year Ended
February 27, 2005
Thirteen Weeks Ended February 22,
2004
Thirty-Nine Weeks Ended November 23,
2003
Net sales by product category: (dollars in thousands)
Chemicals........................................................... $ 1,633,862 $ 1,580,789 $ 136,100 $ 1,443,600 Fertilizer ............................................................. 682,137 565,287 65,826 460,336 Seeds .................................................................. 349,318 302,922 16,819 242,123 Other................................................................... 62,472 57,732 9,033 78,048
Total ......................................................... $ 2,727,789 $ 2,506,730 $ 227,778 $ 2,224,107
No single customer accounted for more than 1% of our net sales in fiscal 2006, fiscal 2005, the thirteen weeks ended February 22, 2004, or the thirty-nine weeks ended November 23, 2003. Net sales by geographical area are based on the location of the facility producing the sales.
Long-lived assets consist of property, plant and equipment, net of depreciation, goodwill, amortizable intangibles, and other assets. Long-lived assets by geographical area are based on location of facilities.
15. Equity Common Stock. The company issued common stock to Apollo and to certain members of management upon the acquisition from ConAgra in November of 2003. We consummated our initial public offering of common stock, on November 29, 2004, which consisted of a primary offering of 3,125,000 shares and a secondary offering of 28,428,125 shares. We did not receive any of the proceeds from the secondary offering. In the aggregate, the selling stockholders received approximately $427.0 million of net proceeds from the secondary offering. As of November 21, 2004, Apollo owned approximately 95% of our outstanding common stock. Following the consummation of the Common Stock Offering, Apollo owned approximately 34% of our outstanding common stock. As of February 26, 2006, Apollo owned approximately 34% of our outstanding common stock. On March 9, 2006, Apollo sold common stock in a secondary offering pursuant to an existing registration statement. Following this sale, Apollo owned approximately 17% of our outstanding common stock. 66

Rabbi Trust. On November 23, 2003, various members of our management held 2,169,229 deferred shares in the 2003 DCP. The participants in the 2003 DCP were credited with such deferred shares after deferring $5.5 million in retention bonuses payable in connection with the Acquisition. In March 2004, the 2004 DCP was credited with 345,893 deferred shares. The participants in the 2004 DCP were credited with such deferred shares after deferring $885,000 in bonuses due to the participants. The Rabbi Trust governs the 2003 DCP and the 2004 DCP. The Rabbi Trust was credited with one share of our common stock for each deferred share interest held by the management participants in the 2003 DCP and the 2004 DCP. In connection with the Common Stock Offering, 631,656 shares of our common stock were released from the Rabbi Trust, and these shares were subsequently sold in the Common Stock Offering. An additional 337,401 shares were released from the Rabbi Trust and sold during fiscal year 2006. As of February 26, 2006, there were 1,546,065 shares of our common stock remaining in the Rabbi Trust. The shares of common stock held by the Rabbi Trust are issued and outstanding, and therefore participate in dividends and are included in the calculation of the weighted average share computation.
Dividends declared. On January 5, 2006, our board declared a quarterly dividend on our common stock in the amount of $0.1875 per share. The record date for the dividend payment was February 15, 2006, and the payment date was March 1, 2006. We paid quarterly dividends of $0.1625 per share on December 1, 2005, and September 1, 2005, and; on June 1, 2005, we paid a quarterly dividend of $0.125 per share.
On January 16, 2004, we paid a special dividend of $52.9 million, which was considered to be a return of capital. On October 4, 2004, we paid a dividend of $40.0 million to stockholders of our common stock.
See Note 16 “Subsequent Events” regarding subsequent dividends declared.
Preferred stock. In connection with the Acquisition, we issued $60.0 million of Series A Redeemable Preferred Stock to ConAgra Foods. We redeemed (i) approximately $26.4 million of Series A Redeemable Preferred Stock on January 26, 2004, with a portion of the proceeds from the offering of our 10 3/4% Senior Discount Notes due 2012, (ii) approximately $20.0 million of Series A Redeemable Preferred Stock on October 4, 2004, with a portion of the proceeds of a $60.0 million dividend from United Agri Products, and (iii) the remaining approximately $13.6 million of Series A Redeemable Preferred Stock on November 29, 2004, in connection with the Common Stock Offering. Upon consummation of the Common Stock Offering, we eliminated the Series A Redeemable Preferred Stock in its entirety. 16. Subsequent Events On February 28, 2006, we sold a portion of our western Canadian operations. Our retail locations in western Canada were sold to JRI Company. We will continue to supply JRI Company with agricultural inputs per a supply agreement negotiated as part of the contract for sale. This sale had no impact on our fiscal 2006 results of operations and we expect the impact to 2007 to be negligible.
On March 3, 2006, we closed on the purchase of the remaining 50% share of our joint venture with UAP Timberland. This purchase had no impact on our fiscal 2006 operating results but will contribute in fiscal year 2007 when its financial statements will be consolidated with those of UAP Holding Corp.
On March 9, 2006, certain funds affiliated with Apollo Management V, L.P., a major stockholder of the Company, and current and former employees, including certain members of our management sold 9,322,858 of the Company’s common shares in a secondary offering pursuant to an existing registration statement. The sale, from which the Company received no proceeds, represented approximately 18.5% of the current shares outstanding. Following this sale, Apollo owned approximately 17% of our outstanding common stock. Our management team’s beneficial ownership of the company, including vested options, decreased to approximately 6%.
On April 4, 2006, our board declared a quarterly dividend on our common stock in the amount of $0.1875 per share of common stock. The record date for the dividend payment is May 15, 2006, and the payment date will be June 1, 2005.
On April 8, 2006, 505,420 restricted share units were granted to certain employees and management pursuant to our 2004 Long-Term Incentive Plan. Of these grants, 233,375 restricted share units vest ratably over three years and 274,125 vest ratably over four years. Vesting occurs on each of the three or four anniversaries of their grant dates, as applicable. Compensation expense is recognized over the requisite service periods based on the market value of our common stock on the date of the award.
On May 3, 2006, UAP Holding Corp. and United Agri Products commenced tender offers for the outstanding 10 3/4% Senior Discount Notes and the outstanding 8 1/4% Senior Notes, respectively. In connection with the tender offers, the companies are also soliciting consents from the holders of the notes to eliminate most of the restrictive covenants in the indentures under which the notes were issued. The consummation of the tender offers and consent solicitations are subject to a number of conditions.
67
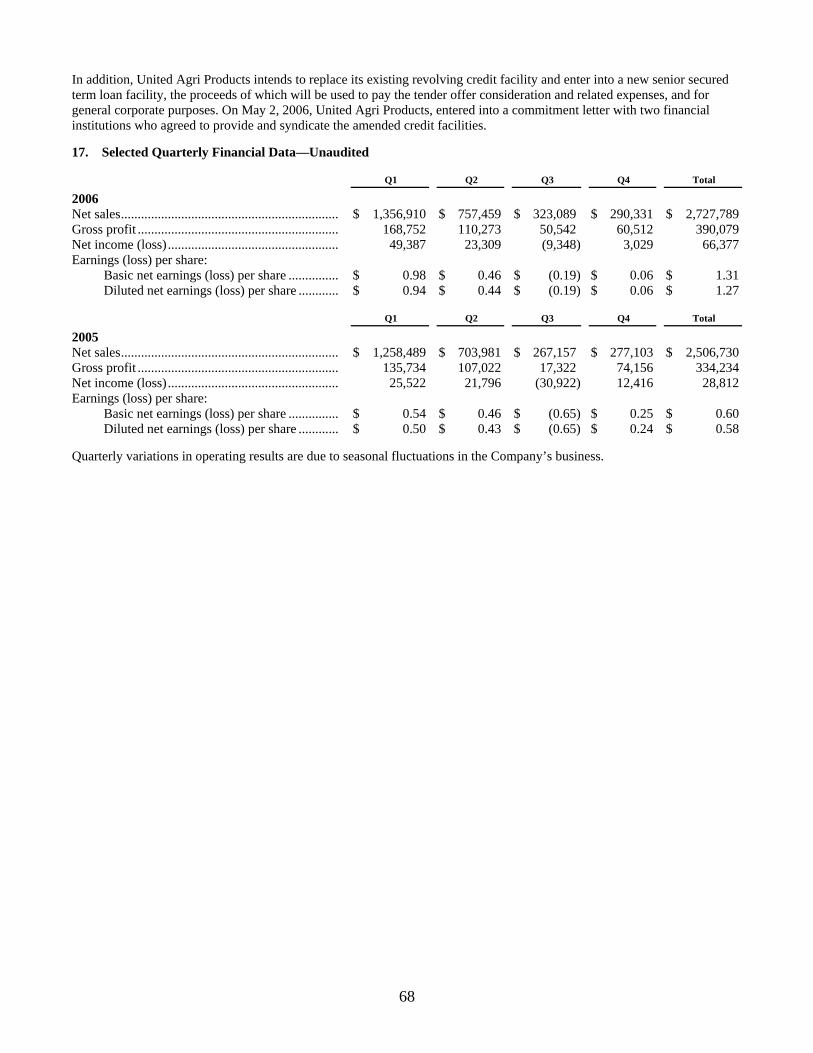
In addition, United Agri Products intends to replace its existing revolving credit facility and enter into a new senior secured term loan facility, the proceeds of which will be used to pay the tender offer consideration and related expenses, and for general corporate purposes. On May 2, 2006, United Agri Products, entered into a commitment letter with two financial
stitutions who agreed to provide and syndicate the amended credit facilities. in 17. Selected Quarterly Financial Data—Unaudited
Q1
Q2
Q3
Q4
Total
2006
$ 1,356,910
Net sales................................................................. $ 757,459 $ 323,089 $ 290,331 $ 2,727,789 Gross profit ............................................................ 168,752 110,273 50,542 60,512 390,079 Net income (loss)................................................... 49,387 23,309 (9,348) 3,029 66,377 Earnings (loss) per share:
$ 1.31 Basic net earnings (loss) per share ............... $ 0.98 $ 0.46 $ (0.19) $ 0.06 Diluted net earnings (loss) per share ............ $ 0.94 $ 0.44 $ (0.19) $ 0.06 $ 1.27
Q1
Q2
Q3
Q4
Total
2005
Net sales................................................................. $ 1,258,489 $ 703,981 $ 267,157 $ 277,103 $ 2,506,730
Earnings (loss) per share:
Gross profit ............................................................ 135,734 107,022 17,322 74,156 334,234 Net income (loss)................................................... 25,522 21,796 (30,922) 12,416 28,812
Basic net earnings (loss) per share ............... $ 0.54 $ 0.46 $ (0.65) $ 0.25 $ 0.60 Diluted net earnings (loss) per share ............ $ 0.50 $ 0.43 $ (0.65) $ 0.24 $ 0.58
Quarterly variations in operating results are due to seasonal fluctuations in the Company’s business.
68

Item 9. Changes in and Disagreements with Accountants on Accounting and Financial Disclosures.
None.
Item 9A. Controls and Procedures.
UAP Holding Corp’s. management, including the Chief Executive Officer and Chief Financial Officer, conducted an evaluation of the effectiveness of our disclosure controls and procedures as of the end of the period covered by this Report. Based upon that evaluation, the Chief Executive Officer and the Chief Financial Officer concluded that such disclosure controls and procedures were effective as of the end of the period covered by this Report in alerting them on a timely basis to material information relating to UAP Holding Corp. required to be included in UAP Holding Corp’s. periodic filings under the Exchange Act. There have been no changes that have materially affected, or are reasonably likely to materially affect, UAP Holding Corp’s. internal control over financial reporting that have occurred during the period covered by this Report.
69
Management’s Report on Internal Control Over Financial Reporting
UAP Holding Corp. management is responsible for establishing and maintaining adequate internal control over financial reporting as defined in Rules 13a-15(f) and 15d-15(f) under the Securities Exchange Act of 1934. UAP Holding Corp’s. internal control over financial reporting is a process designed to provide reasonable assurance regarding the reliability of financial reporting and the preparation of financial statements for external purposes in accordance with generally accepted accounting principles. UAP Holding Corp’s. internal control over financial reporting includes those policies and procedures that:
(i) pertain to the maintenance of records that, in a reasonable detail, accurately and fairly reflect the transactions and dispositions of UAP Holding Corp’s. assets;
(ii) provide reasonable assurance that transactions are recorded as necessary to permit preparation of financial statements in accordance with generally accepted accounting principles, and that receipts and expenditures of the company are being made only in accordance with authorizations of UAP Holding Corp’s. management and directors; and
(iii) provide reasonable assurance regarding prevention or timely detection of unauthorized acquisition, use of disposition of UAP Holding Corp’s assets that could have a material effect on the financial statements.
Because of its inherent limitations, internal control over financial reporting may not prevent or detect misstatements. Also, projections of any evaluation of effectiveness to future periods are subject to the risk that controls may become inadequate because of changes in conditions, or that the degree of compliance with the policies or procedures may deteriorate.
Management assessed the effectiveness of UAP Holding Corp’s internal control over financial reporting as of February 26, 2006. In making this assessment, management used the criteria set forth by the Committee of Sponsoring Organizations of the Treadway Commission (COSO) in Internal Control-Integrated Framework.
Based on this assessment, management determined that UAP Holding Corp. maintained effective internal control over financial reporting as of February 26, 2006.
There has been no change in our internal control over financial reporting during the fourth fiscal quarter of fiscal 2006 that has materially affected or is reasonably likely to materially affect our internal control over financial reporting.
Management’s assessment of the effectiveness of UAP Holding Corp’s internal control over financial reporting as of February 26, 2006, has been audited by Deloitte & Touche LLP, an independent registered public accounting firm, as stated
their attestation report which follows. in
70

REPORT OF INDEPENDENT REGISTERED PUBLIC ACCOUNTING FIRM
To the Board of Directors and Stockholders of UAP Holding Corp. Greeley, Colorado We have audited management’s assessment, included in the accompanying Management’s Report on Internal Control Over Financial Reporting, that UAP Holding Corp. and subsidiaries (the “Company”) maintained effective internal control over financial reporting as of February 26, 2006, based on criteria established in Internal Control—Integrated Framework issued by the Committee of Sponsoring Organizations of the Treadway Commission. The Company’s management is responsible for maintaining effective internal control over financial reporting and for its assessment of the effectiveness of internal control over financial reporting. Our responsibility is to express an opinion on management’s assessment and an opinion on the effectiveness of the Company’s internal control over financial reporting based on our audit. We conducted our audit in accordance with the standards of the Public Company Accounting Oversight Board (United States). Those standards require that we plan and perform the audit to obtain reasonable assurance about whether effective internal control over financial reporting was maintained in all material respects. Our audit included obtaining an understanding of internal control over financial reporting, evaluating management’s assessment, testing and evaluating the design and operating effectiveness of internal control, and performing such other procedures as we considered necessary in the circumstances. We believe that our audit provides a reasonable basis for our opinions. A company’s internal control over financial reporting is a process designed by, or under the supervision of, the company’s principal executive and principal financial officers, or persons performing similar functions, and effected by the company’s board of directors, management and other personnel to provide reasonable assurance regarding the reliability of financial reporting and the preparation of financial statements for external purposes in accordance with generally accepted accounting principles. A company’s internal control over financial reporting includes those policies and procedures that (1) pertain to the maintenance of records that, in reasonable detail, accurately and fairly reflect the transactions and dispositions of the assets of the company; (2) provide reasonable assurance that transactions are recorded as necessary to permit preparation of financial statements in accordance with generally accepted accounting principles, and that receipts and expenditures of the company are being made only in accordance with authorizations of management and directors of the company; and (3) provide reasonable assurance regarding prevention or timely detection of unauthorized acquisition, use or disposition of the company’s assets that could have a material effect on the financial statements. Because of the inherent limitations of internal control over financial reporting, including the possibility of collusion or improper management override of controls, material misstatements due to error or fraud may not be prevented or detected on a timely basis. Also, projections of any evaluation of the effectiveness of the internal control over financial reporting to future periods are subject to the risk that the controls may become inadequate because of changes in conditions, or that the degree of compliance with the policies or procedures may deteriorate. In our opinion, management’s assessment that the Company maintained effective internal control over financial reporting as of February 26, 2006, is fairly stated, in all material respects, based on the criteria established in Internal Control—Integrated Framework issued by the Committee of Sponsoring Organizations of the Treadway Commission. Also in our opinion, the Company maintained, in all material respects, effective internal control over financial reporting as of February 26, 2006, based on the criteria established in Internal Control—Integrated Framework issued by the Committee of Sponsoring Organizations of the Treadway Commission. We have also audited, in accordance with the standards of the Public Company Accounting Oversight Board (United States), the accompanying consolidated financial statements as of and for the year ended February 26, 2006, of the Company and our report dated May 10, 2006, expressed an unqualified opinion on those financial statements. DELOITTE & TOUCHE LLP Denver, Colorado May 10, 2006
71

Item 9B. Other Information. None.
72

PART III
Item 10. Directors and Executive Officers of the Registrant. Information relating to the Directors of UAP Holding Corp., as well as information relating to compliance with Section 16(a) of the Securities Exchange Act of 1934, will be contained in our definitive Proxy Statement involving the election of the Directors which will be filed with the SEC pursuant to Regulation 14A not later than 120 days after February 26, 2006, and such information is incorporated herein by reference. Certain other information relating to the Executive Officers of UAP holding Corp. appears in Part I of this Report under the heading “Executive Officers of the Registrant.”
The members of the Audit Committee of our Board of Directors are Messrs. Rickertsen, Miklich and Schumann. All of the members of our audit committee qualify as independent directors under the applicable listing standards of the NASDAQ Stock Market and the SEC’s rules and regulations. In addition, our board of directors has determined that Mr. Miklich is an “audit committee financial expert” as defined by the SEC’s rules.
UAP Holding Corp’s Code of Business Conduct is available, free of charge, on our website www.uap.com under the heading “Investor Relations” (see “Corporate Governance”/ “Committees & Charters”), or by writing to UAP Holding Corp., 7251 W. 4th Street, Greeley Colorado 80634, c/o Vice President and Corporate Secretary. UAP Holding Corp.’s Code of Business Conduct applies to all of UAP’s directors, officers (including the Chief Executive Officer, Chief Financial Officer and Controller) and employees. Amendments to or waivers of the Code of Business Conduct granted to any of our directors or executive officers will be published on our website within five business days of such amendment or waiver.
Item 11. Executive Compensation. Information relating to executive compensation is contained in the Proxy Statement referred to above in “Item 10. Directors and Executive Officers of the Registrant,” and such information is incorporated herein by reference.
Item 12. Security Ownership of Certain Beneficial Owners and Management. Information relating to security ownership of certain beneficial owners and management, equity compensation plans and related stockholder matters is contained in the Proxy Statement referred to above in “Item 10. Directors and Executive Officers of the Registrant,” and such information is incorporated herein by reference.
Item 13. Certain Relationships and Related Transactions. Information relating to certain relationships and related transactions is contained in the Proxy Statement referred to above in “Item 10. Directors and Executive Officers of the Registrant,” and such information is incorporated herein by reference.
Item 14. Principal Accountant Fees and Services. Information relating to fees paid to and service performed by Deloitte and Touche LLP in fiscal years 2006 and 2005 and our Audit Committee’s pre-approval policies and procedures with respect to non-audit services is contained in the Proxy Statement referred to above in “Item 10. Directors and Executive Officers of the Registrant,” and such information is incorporated herein by reference.
73

PART IV
Item 15. Exhibits and Financial Statement Schedules. (4) (1) Financial Statements The following financial statements of UAP Holding Corp. (Successor) and the ConAgra Agricultural Products Business (Predecessor), together with the Report of Independent Registered Public Accounting Firm, are included in Part II, Item 8 of this Report:
• Report of Independent Registered Public Accounting Firm • Consolidated Balance Sheets at February 26, 2006, and February 27, 2005 • Consolidated and Combined Statements of Earnings for the fiscal years ended February 26,
2006, February 27, 2005, the thirteen week period ended February 22, 2004 (Successor), and the thirty-nine week period ended November 23, 2003 (Predecessor).
• Consolidated Statements of Stockholders’ Equity for the fiscal years ended February 26, 2006, February 27, 2005, the thirteen week period ended February 22, 2004 (Successor), and Combined Statement of Stockholder’s Net Investment and Advances for the thirty-nine week period ended November 23, 2003 (Predecessor).
• Consolidated and Combined Statements of Cash Flows for the fiscal years ended February 26, 2006, February 27, 2005, the thirteen week period ended February 22, 2004 (Successor), and the thirty-nine week period ended November 23, 2003 (Predecessor).
• Notes to Financial Statements
(2) Financial Statement Schedules Schedule 1—Condensed Financial Information of Registrant Schedule 2—Valuation and Qualifying Accounting
(3) Exhibits
No. Item
3.1 Certificate of Incorporation of UAP Holding Corp. dated as of October 28, 2003 (incorporated by reference to Exhibit 3.1 to UAP Holding Corp.’s Registration Statement on Form S-4 dated March 5, 2004 (File No. 333-113345)).
4.2
3.2 Certificate of Amendment dated November 24, 2003 to the Certificate of Incorporation of UAP Holding Corp. (incorporated by reference to Exhibit 3.2 to UAP Holding Corp.’s Registration Statement on Form S-4 dated March 5, 2004 (File No. 333-113345)).
3.3 Certificate of Designation, Preferences and Rights of Series A Redeemable Preferred Stock dated November 24, 2003 (incorporated by reference to Exhibit 3.3 to UAP Holding Corp.’s Registration Statement on Form S-4 dated March 5, 2004 (File No. 333-113345)).
3.4 By-Laws of UAP Holding Corp. as adopted on October 29, 2003 (incorporated by reference to Exhibit 3.4 to UAP Holding Corp.’s Registration Statement on Form S-4 dated March 5, 2004 (File No. 333-113345)).
3.5 Amended and Restated Certificate of Incorporation of UAP Holding Corp. filed with the Secretary of State of the State of Delaware on November 17, 2004 (incorporated by reference to Exhibit 3.5 to Amendment No. 6 to UAP Holding Corp.’s Registration Statement on Form S-1 dated November 18, 2004 (File No. 333-114278)).
3.6 Certificate of Elimination of Series A Redeemable Preferred Stock (incorporated by reference to Exhibit 3.1 to UAP Holding Corp.’s Current Report on Form 8-K dated December 3, 2004 (File No. 000-51035)).
3.7 Amended and Restated Bylaws of UAP Holding Corp. (incorporated by reference to Exhibit 3.2 to UAP Holding Corp.’s Current Report on Form 8-K dated December 3, 2004 (File No. 000-51035)).
4.1 Indenture dated as of January 26, 2004 between UAP Holding Corp. and JPMorgan Chase Bank, as trustee (incorporated by reference to Exhibit 4.5 to UAP Holding Corp.’s Registration Statement on Form S-4 dated March 5, 2004 (File No. 333-113345)).
Registration Rights Agreement, dated as of January 26, 2004, by and among UAP Holding Corp. and UBS
74

Securities LLC, Goldman, Sachs & Co. and Bear, Stearns & Co. Inc. (incorporated by reference to Exhibit 4.7 to UAP Holding Corp.’s Registration Statement on Form S-4 dated March 5, 2004 (File No. 333-113345)).
4.3 Indenture dated as of December 16, 2003, among United Agri Products, Inc., the Guarantors named therein and JPMorgan Chase Bank, as trustee (incorporated by reference to Exhibit 4.4 to United Agri Products, Inc.’s Registration Statement on Form S-4 dated January 5, 2004 (File No. 333-111710)).
4.4 Registration Rights Agreement, dated as of December 16, 2003, by and among United Agri Products, Inc., the guarantors listed on the signature pages attached thereto, and UBS Securities LLC, Goldman, Sachs & Co. and Bear, Stearns & Co. Inc. (incorporated by reference to Exhibit 4.6 to United Agri Products, Inc.’s Registration Statement on Form S-4 dated January 5, 2004 (File No. 333-111710)).
4.5 Amended and Restated Credit Agreement, dated as of November 29, 2004, by and among United Agri Products, Inc. and United Agri Products Canada, Inc., as borrowers, the other persons party thereto that are designated as credit parties, General Electric Capital Corporation, as Agent, L/C Issuer and a Lender and GE Canada Finance Company, as Canadian Agent, and the other financial institutions party thereto (incorporated by reference to Exhibit 4.1 to UAP Holding Corp.’s Current Report on Form 8-K dated December 3, 2004 (File No. 000-51035)).
4.6 First Consent and Limited Waiver and Amendment to Amended and Restated Credit Agreement, dated as of February 28, 2006, by and among United Agri Products, Inc., United Agri Products Canada Inc., as borrowers, the other persons party thereto that are designated as credit parties, General Electric Capital Corporation, as the initial L/C Issurer and Agent, GE Canada Finance Holding Company as Canadian Agent, and the other financial institutions party thereto (incorporated by reference to Exhibit 10.1 to UAP Holding Corp.’s Current Report on Form 8-K dated March 3, 2006 (File No. 000-51035)).
10.1 Seller Transition Services Agreement, dated as of November 24, 2003, by and between ConAgra Foods, Inc., UAP Holding Corp., United Agri Products, Inc. and each other company listed on the signature page thereto (incorporated by reference to Exhibit 10.2 to United Agri Products, Inc.’s Registration Statement on Form S-4 dated January 5, 2004 (File No. 333-111710)).
10.2 Indemnification Agreement, dated as of November 24, 2003, by and among ConAgra Foods, Inc., United Agri Products, Inc., United Agri Products Canada Inc., 2326396 Canada, Inc., AG-Chem, Inc., Balcom Chemicals, Inc., UAP 23, Inc., Cropmate Company, CSK Enterprises, Inc., GAC 26, Inc., UAP 27, Inc., Genmarks, Inc., Grower Service Corporation (New York), HACO, Inc., Loveland Industries, Inc., Loveland Products, Inc., Midwest Agriculture Warehouse Co., Ostlund Chemical Co., Platte Chemical Co., Pueblo Chemical & Supply Co., Ravan Products, Inc., S.E. Enterprises, Inc., Snake River Chemicals, Inc., Transbas, Inc., Tri-River Chemical Company, Inc., Tri-State Chemicals, Inc., Tri-State Delta Chemicals, Inc., UAP/GA AG Chem, Inc., UAPLP, Inc., UAP 22, Inc., UAP Receivables Corporation, United Agri Products—Florida, Inc., United Agri Products Financial Services, Inc., Verdicon and YVC, Inc. (incorporated by reference to Exhibit 10.3 to United Agri Products, Inc.’s Registration Statement on Form S-4 dated January 5, 2004 (File No. 333-111710)).
10.3 Fertilizer Supply Agreement, dated as of November 24, 2003, between ConAgra International Fertilizer Company and United Agri Products, Inc. (incorporated by reference to Exhibit 10.4 to United Agri Products, Inc.’s Registration Statement on Form S-4 dated January 5, 2004 (File No. 333-111710)).
10.4 International Supply Agreement, dated as of November 24, 2003, between United Agri Products, Inc. and ConAgra Foods, Inc. (incorporated by reference to Exhibit 10.5 to United Agri Products, Inc.’s Registration Statement on Form S-4 dated January 5, 2004 (File No. 333-111710)).
10.5 Buyer Release Agreement, dated as of November 24, 2003, between ConAgra Foods, Inc. and the Acquired Companies (as defined therein) (incorporated by reference to Exhibit 10.6 to United Agri Products, Inc.’s Registration Statement on Form S-4 dated January 5, 2004 (File No. 333-111710)).
10.6 Seller Release Agreement, dated as of November 24, 2003, between ConAgra Foods, Inc. and UAP Holding Corp. (incorporated by reference to Exhibit 10.7 to United Agri Products, Inc.’s Registration Statement on Form S-4 dated January 5, 2004 (File No. 333-111710)).
10.7 2003 Stock Option Plan of UAP Holding Corp. (incorporated by reference to Exhibit 10.8 to United Agri Products, Inc.’s Registration Statement on Form S-4 dated January 5, 2004 (File No. 333-111710)).
10.8 Registration Rights Agreement, dated as of November 24, 2003, between UAP Holding Corp. and the Apollo Investors (incorporated by reference to Exhibit 10.15 to UAP Holding Corp.’s Registration Statement on Form S-4 dated March 5, 2004 (File No. 333-113345)).
75
10.9 2003 Deferred Compensation Plan of UAP Holding Corp (incorporated by reference to Exhibit 10.17 to UAP Holding Corp.’s Registration Statement on Form S-4 dated March 5, 2004 (File No. 333-113345)).
10.10 2004 Deferred Compensation Plan of UAP Holding Corp. (incorporated by reference to Exhibit 10.18 to Amendment to 5 to UAP Holding Corp.’s Registration Statement on Form S-1 dated November 9, 2004 (File No. 333-114278)).
10.11 2004 Non-Executive Director Stock Option Plan of UAP Holding Corp. (incorporated by reference to Exhibit 10.19 to Amendment to 5 to UAP Holding Corp.’s Registration Statement on Form S-1 dated November 9, 2004 (File No. 333-114278)).
10.12 Management Incentive Agreement, dated as of November 29, 2004, by and among UAP Holding Corp. and the holders listed on the signature pages hereto (incorporated by reference to Exhibit 10.1 to UAP Holding Corp.’s Current Report on Form 8-K dated December 3, 2004 (File No. 000-51035)).
10.13 Letter Agreement dated as of November 29, 2004, regarding termination of Management Consulting Agreement between United Agri Products, Inc. and Apollo Management V, L.P. (incorporated by reference to Exhibit 10.2 to UAP Holding Corp.’s Current Report on Form 8-K dated December 3, 2004 (File No. 000-51035)).
10.14 2004 Long-Term Incentive Plan of UAP Holding Corp. (incorporated by reference to Exhibit 10.3 to UAP Holding Corp.’s Current Report on Form 8-K dated December 3, 2004 (File No. 000-51035).
10.15 Letter Agreement, dated December 23, 2004, amending and restating the Letter Agreement, dated as of November 29, 2004, regarding termination of Management Consulting Agreement between United Agri Products, Inc. and Apollo Management V, L.P. (incorporated by reference to Exhibit 10.21 to Amendment No. 1 to United Agri Products, Inc.’s Registration Statement on Form S-4 dated December 23, 2004 (File No. 333-111710)).
10.16 UAP Retirement Income Savings Plan, effective November 24, 2003 (incorporated by reference to Exhibit 10.1 to UAP Holding Corp’s Current Report on Form 8-K dated July 28, 2005, (File No. 333-113345)).
10.17 Separation and General Release Agreement, dated January 10, 2006, between Robert A. Boyce and UAP Distribution, Inc. (incorporated by reference to Exhibit 10.1 to UAP Holding Corp.’s Current Report on Form 8-K dated January 13, 2006 (File No. 000-51035)).
21.1 Subsidiaries of UAP Holding Corp.
23.1 Consent of Independent Registered Public Accounting Firm
31.1 Certification of Chief Executive Officer pursuant to Rule 15d-14(a) of the Securities Exchange Act of 1934, as adopted pursuant to Section 302 of the Sarbanes-Oxley Act of 2002.
31.2 Certification of Chief Financial Officer pursuant to Rule 15d-14(a) of the Securities Exchange Act of 1934, as adopted pursuant to Section 302 of the Sarbanes-Oxley Act of 2002.
32.1 Certification of Chief Executive Officer pursuant to 18 U.S.C. Section 1350, as adopted pursuant to Section 906 of the Sarbanes-Oxley Act of 2002.
32.2 Certification of Chief Financial Officer pursuant to 18 U.S.C. Section 1350, as adopted pursuant to Section 906 of the Sarbanes-Oxley Act of 2002.
76

SIGNATURES
Pursuant to the requirements of Section 13 or 15(d) of the Securities Exchange Act of 1934, the registrant has duly caused this report to be signed on its behalf by the undersigned, thereunto duly authorized on the 11th day of May, 2006.
UAP HOLDING CORP. (Registrant) By: /S/ L. KENNETH CORDELL
L. Kenneth Cordell
President, Chief Executive Officer and Director
Pursuant to the requirements of the Securities Exchange Act of 1934, this report has been signed below by the following persons on behalf of the registrant and in the capacities and on the dates indicated.
Signature
Title
Date
/S/ L. KENNETH CORDELL
L. Kenneth Cordell President, Chief Executive Officer and
Director (principal executive officer) May 11, 2006
/S/ DAVID W. BULLOCK
David W. Bullock Executive Vice President and Chief
Financial Officer (principal financial and accounting officer)
May 11, 2006
/S/ JOSHUA J. HARRIS
Joshua J. Harris Director May 11, 2006
/S/ MARC E. BECKER
Marc E. Becker Director May 11, 2006
/S/ CARL J. RICKERTSEN
Carl J. Rickertsen Director May 11, 2006
/S/ STAN PARKER
Stan Parker Director May 11, 2006
/S/ THOMAS MIKLICH
Thomas Miklich Director May 11, 2006
/S/ WILLIAM H. SCHUMANN III
William H. Schumann III Director May 11, 2006
77

Schedule 1
UAP HOLDING CORP. CONDENSED BALANCE SHEETS
(dollars in thousands except share and per share amounts)
UAP Holding Corp. February 26, 2006
UAP Holding Corp. February 27, 2005
ASSETS
Current assets:
Cash and cash equivalents................................................................... $ 54 $ 3 Receivables of nonconsolidated affiliates ........................................... 42,090 25,287 Other current assets ............................................................................. 1,733 1,443
Total current assets .................................................................... 43,877 26,733 Deferred income taxes .................................................................................. 9,089 5,404 Debt issue costs, net...................................................................................... 3,082 3,152 Investment in nonconsolidated affiliates....................................................... 216,596 174,374 Other assets................................................................................................... 113 147
Total assets ................................................................................................... $ 272,757 $ 209,810
LIABILITIES AND STOCKHOLDERS’ EQUITY
Current liabilities:
Accounts payable ................................................................................ 1 3 Dividends Payable............................................................................... 9,528 — Other accrued liabilities ...................................................................... 650 872
Total current liabilities............................................................... 10,179 875
Long-term debt ............................................................................................. 102,839 92,448
Stockholders’ equity:
Common stock, $.001 par value, 90,000,000 shares authorized, 50,814,430 and 50,431,872 issued and outstanding, respectively..................... 51 50
Management stock—rabbi trust .......................................................... 3,956 4,819 Additional paid-in capital.................................................................... 117,392 109,863 Retained earnings (deficit) .................................................................. 32,606 (1,535)Accumulated other comprehensive loss .............................................. 5,734 3,290
Total stockholders’ equity ......................................................... 159,739 116,487
Total liabilities and stockholders’ equity ......................... $ 272,757 $ 209,810
See Notes to Financial Statements in Item 8. Financial Statements and Supplementary Data
78
UAP HOLDING CORP. CONDENSED STATEMENT OF EARNINGS
(dollars in thousands except share and earnings per share amounts)
Fiscal Year Ended February 26, 2006
Fiscal Year Ended February 27, 2005
Thirteen Weeks Ended February 24, 2004
Net sales....................................................................... $ — $ — $ — Costs and expenses: — — —
Cost of goods sold.............................................. — — —
Gross profit ............................................... — — — Selling, general and administrative (income)
expenses ........................................................ (291) 1,448 725
Operating income (loss)............................................... 291 (1,448) (725)Third party interest expense ............................... 10,485 11,274 1,080 Finance related and other charges ...................... 330 8,814 —
Income (loss) from continuing operations before income taxes ........................................................................ (10,524) (21,536) (1,805)
Income tax (benefit)..................................................... (3,844) (11,093) (667)
Income (loss) from continuing operations ................... (6,680) (10,443) (1,138)Equity in earnings of affiliates..................................... 73,057 39,255 10,791
Net income................................................................... $ 66,377 $ 28,812 $ 9,653
Earnings (loss) per share:
Basic................................................................... $ 1.31 $ 0.60 $ 0.21
Diluted................................................................ $ 1.27 $ 0.58 $ 0.21
Weighted average shares outstanding:
Basic................................................................... 50,494,690 48,041,306 46,902,351 Dilute
d................................................................ 52,252,512 49,734,144 46,902,351
See Notes to Financial Statements in Item 8. Financial Statements and Supplementary Data
79

UAP HOLDING CORP. CONDENSED STATEMENTS OF CASH FLOWS
(dollars in thousands)
Fiscal Year Ended February 26, 2006
Fiscal Year Ended February 27, 2005
Thirteen Weeks Ended February 22, 2004
Operations
$ 9,653 Net income................................................................... $ 66,377 $ 28,812
Adjustments to reconcile net income to net cash provided by operating activities:
34
Amortization of intangibles................................ — — Amortization of debt issuance costs ................... 193 455 — Accretion of discount on notes........................... 10,391 8,878 1,080 Equity in earnings of nonconsolidated affiliates (42,222) 16,417 (10,791)Deferred tax (benefit) ......................................... (3,685) (5,403) — Change in operating assets and liabilities........... 7,861 6,802 720
Net cash provided by operations............... 38,949 55,961 662
Investing
Acquisition of ConAgra Agricultural Products Business......................................................... — — (120,000)
Net cash used for investing ................................ — — (120,000)
Financing
(12)
(3,680)Debt issuance costs ............................................ (396)Due (from) nonconsolidated affiliates................ (16,803) (25,287) (580)Long-term debt issued, net of costs.................... — — 82,500 Series A preferred stock redemption .................. — (34,620) (25,380)Common stock issued, net of costs .................... — — 120,000 Proceeds from sales of common stock offering, net
of costs........................................................... — 43,144 — Proceeds from exercise of stock options and
additions to rabbi trust ................................... 1,009 150 — Common stock dividend..................................... (22,708) (40,000) (52,860)
Net cash provided by (used for) financing (38,898) (56,625) 120,000
Net change in cash and equivalents ............................. 51 (664) 662 Net effect of exchange rates on cash and equivalents.. — 5 —
Net change in cash and cash equivalents............ 51 (659) 662 Cash and cash equivalents at beginning of period ....... 3 662 —
Cash and cash equivalents at end of period ................. $ 54 $ 3 $ 662
Supplemental disclosure of cash flow information:
Cash paid during the year for interest ................ $ — $ — $ — Cash paid during the year for income taxes ....... $ — $ — $ —
See Notes to Financial Statements in Item 8. Financial Statements and Supplementary Data
80

Schedule 2 Allowance for doubtful receivables
Beginningof period
Charged to Income
Deductions
Balance atClose of Period
ConAgra Agricultural Products Business:
Thirty-nine weeks ended November 23, 2003
Allowance for doubtful receivables ............................................. $ 34,694 $ 14,093 $ 2,869(a) $ 45,918
UAP Holding Corp
Thirteen weeks ended February 22, 2004
Allowance for doubtful receivables ............................................. $ 45,918 $ (12,710) $ 5,880(a) $ 27,328 Year ended February 27, 2005
Allowance for doubtful receivables ............................................. $ 27,328 $ (6,562) $ 7,017(a) $ 13,749 Year Ended February 26, 2006
A llowance for doubtful receivables ............................................. $ 13,749 $ (2,538) $ (1,559)(a) $ 12,770
( ) Bad debts charged off, less recoveries a
81

Exhibit 21.1
List of Subsidiaries of UAP Holding Corp.
EXACT NAME OF SUBSIDIARY AS SPECIFIED IN ITS CHARTER
STATE OR OTHER JURISDICTION OF INCORPORATION OR ORGANIZATION
Loveland Industries, Inc. Colorado Loveland Products, Inc. Colorado Platte Chemical Co. Nebraska Snake River Chemicals, Inc. Idaho Transbas, Inc. Tennessee United Agri Products, Inc. Delaware UAP Distribution, Inc. Delaware United Agri Products Canada Inc. Canada UAP Timberland, LLC Delaware
82
Exhibit 23.1
CONSENT OF INDEPENDENT REGISTERED PUBLIC ACCOUNTING FIRM
We consent to the incorporation by reference in Registration Statement No. 333-131080 on Form S-3 and Registration Statement No. 333-133261 on Form S-8 of our reports dated May 10, 2006, relating to the financial statements and financial statement schedules of UAP Holding Corp. and subsidiaries (the “Company”) and ConAgra Agricultural Products (a division of ConAgra Foods, Inc.) (the “Predecessor”) and Management’s Report on Internal Control over Financial Reporting, appearing in this Annual Report on Form 10-K of UAP Holding Corp. and subsidiaries for the year ended February 26, 2006.
DELOITTE & TOUCHE LLP Denver, Colorado May 10, 2006
83
Exhibit 31.1
CERTIFICATION PURSUANT TO RULE 13a-14(a) OF
THE SECURITIES EXCHANGE ACT OF 1934 AS ADOPTED PURSUANT TO
SECTION 302 OF THE SARBANES-OXLEY ACT OF 2002
I, L. Kenneth Cordell, certify that:
1. I have reviewed this annual report on Form 10-K of UAP Holding Corp.;
2. Based on my knowledge, this report does not contain any untrue statement of a material fact or omit to state a material fact necessary to make the statements made, in light of the circumstances under which such statements were made, not misleading with respect to the period covered by this report;
3. Based on my knowledge, the financial statements, and other financial information included in this report, fairly present in all material respects the financial condition, results of operations, and cash flows of the registrant as of, and for, the periods presented in this report;
4. The registrant’s other certifying officer and I are responsible for establishing and maintaining disclosure controls and procedures (as defined in Exchange Act Rules 13a-15(e) and 15d-15(e)) and internal control over financial reporting (as defined in Exchange Act Rules 13a-15(f) and 15d-15(f)) for the registrant and have:
a. Designed such disclosure controls and procedures, or caused such disclosure controls and procedures to be designed under our supervision, to ensure that material information relating to the registrant, including its consolidated subsidiaries, is made known to us by others within those entities, particularly during the period in which this report is being prepared;
b. Designed such internal controls over financial reporting, or caused such internal control over financial reporting to be designed under our supervision, to provide reasonable assurance regarding the reliability of financial reporting and the preparation of financial statements for external purposes in accordance with generally accepted accounting principles;
c. Evaluated the effectiveness of the registrant’s disclosure controls and procedures and presented in this report our conclusions about the effectiveness of the disclosure controls and procedures, as of the end of the period covered by this report based on such evaluation; and
d. Disclosed in this report any change in the registrant’s internal control over financial reporting that occurred during the registrant’s most recent fiscal quarter (the registrant’s fourth fiscal quarter in the case of an annual report) that has materially affected, or is reasonably likely to materially affect, the registrant’s internal control over financial reporting; and
5. The registrant’s other certifying officer and I have disclosed, based on our most recent evaluation of internal control over financial reporting, to the registrant’s auditors and the audit committee of the registrant’s board of directors (or persons performing the equivalent functions):
a. All significant deficiencies and material weaknesses in the design or operation of internal control over financial reporting which are reasonably likely to adversely affect the registrant’s ability to record, process, summarize, and report financial information; and
b. Any fraud, whether or not material, that involves management or other employees who have a significant role in the registrant’s internal control over financial reporting.
Date: May 11, 2006
By:
/s/ L. Kenneth Cordell
L. Kenneth Cordell President and Chief Executive Officer
Principal Executive Officer
84

Exhibit 31.2
CERTIFICATION PURSUANT TO RULE 13a-14(a) OF
THE SECURITIES EXCHANGE ACT OF 1934 AS ADOPTED PURSUANT TO
SECTION 302 OF THE SARBANES-OXLEY ACT OF 2002
I, David W. Bullock, certify that:
1. I have reviewed this annual report on Form 10-K of UAP Holding Corp.;
2. Based on my knowledge, this report does not contain any untrue statement of a material fact or omit to state a material fact necessary to make the statements made, in light of the circumstances under which such statements were made, not misleading with respect to the period covered by this report;
3. Based on my knowledge, the financial statements, and other financial information included in this report, fairly present in all material respects the financial condition, results of operations, and cash flows of the registrant as of, and for, the periods presented in this report;
4. The registrant’s other certifying officer and I are responsible for establishing and maintaining disclosure controls and procedures (as defined in Exchange Act Rules 13a-15(e) and 15d-15(e)) and internal control over financial reporting (as defined in Exchange Act Rules 13a-15(f) and 15d-15(f)), for the registrant and have:
a. Designed such disclosure controls and procedures, or caused such disclosure controls and procedures to be designed under our supervision, to ensure that material information relating to the registrant, including its consolidated subsidiaries, is made known to us by others within those entities, particularly during the period in which this report is being prepared;
b. Designed such internal controls over financial reporting, or caused such internal control over financial reporting to be designed under our supervision, to provide reasonable assurance regarding the reliability of financial reporting and the preparation of financial statements for external purposes in accordance with generally accepted accounting principles;
c. Evaluated the effectiveness of the registrant’s disclosure controls and procedures and presented in this report our conclusions about the effectiveness of the disclosure controls and procedures, as of the end of the period covered by this report based on such evaluation; and
d. Disclosed in this report any change in the registrant’s internal control over financial reporting that occurred during the registrant’s most recent fiscal quarter (the registrant’s fourth fiscal quarter in the case of an annual report) that has materially affected, or is reasonably likely to materially affect, the registrant’s internal control over financial reporting; and
5. The registrant’s other certifying officer and I have disclosed, based on our most recent evaluation of internal control over financial reporting, to the registrant’s auditors and the audit committee of the registrant’s board of directors (or persons performing the equivalent functions):
a. All significant deficiencies and material weaknesses in the design or operation of internal control over financial reporting which are reasonably likely to adversely affect the registrant’s ability to record, process, summarize, and report financial information; and
b. Any fraud, whether or not material, that involves management or other employees who have a significant role in the registrant’s internal control over financial reporting.
Date: May 11, 2006
By: /s/ David W. Bullock
David W. Bullock Executive Vice President a d n
Chief Financial Officer Principal Financial Officer
85

Exhibit 32.1
CERTIFICATION PURSUANT TO SECTION 906 OF THE SARBANES-OXLEY ACT OF 2002
(18 U.S.C. 1350)
In connection with the Annual Report of UAP Holding Corp. (the “Company”) on Form 10-K for the year ending February 26, 2006, as filed with the Securities and Exchange Commission (the “Report”), I, L. Kenneth Cordell, President and Chief Executive Officer of the Company, hereby certify, pursuant to Section 906 of the Sarbanes-Oxley Act of 2002 (18 U.S.C. 1350), that, to my knowledge:
(1) The Report fully complies with the requirements of Section 13(a) or 15(d) of the Securities Exchange Act of 1934, as amended; and
(2) The information contained in the Report fairly presents, in all material respects, the financial condition and results of operations of the Company.
Date: May 11, 2006
By:
/s/ L. Kenneth Cordell
L. Kenneth Cordell President and Chief Executive Officer
Principal Executive Officer
86

Exhibit 32.2
CERTIFICATION PURSUANT TO SECTION 906 OF THE SARBANES-OXLEY ACT OF 2002
(18 U.S.C. 1350)
In connection with the Annual Report of UAP Holding Corp. (the “Company”) on Form 10-K for the year ending February 26, 2006, as filed with the Securities and Exchange Commission (the “Report”), I, David W. Bullock, Executive Vice President and Chief Financial Officer of the Company, hereby certify, pursuant to Section 906 of the Sarbanes-Oxley Act of 2002 (18 U.S.C. 1350), that, to my knowledge:
(1) The Report fully complies with the requirements of Section 13(a) or 15(d) of the Securities Exchange Act of 1934, as amended; and
(2) The information contained in the Report fairly presents, in all material respects, the financial condition and results of operations of the Company.
Date: May 11, 2006
By:
/s/ David W. Bullock
David W. Bullock Executive Vice President a d n
Chief Financial Officer Principal Financial Officer
87