uc berkeley center for the built environment -...
TRANSCRIPT
eScholarship provides open access, scholarly publishingservices to the University of California and delivers a dynamicresearch platform to scholars worldwide.
Center for the Built EnvironmentUC Berkeley
Peer Reviewed
Title:Moving Air for Comfort
Author:Arens, Edward, Center for the Built Environment, University of California, BerkeleyTurner, StephenZhang, Hui, UC BerkeleyPaliaga, Gwelen
Publication Date:05-08-2009
Series:Indoor Environmental Quality (IEQ)
Publication Info:Indoor Environmental Quality (IEQ), Center for the Built Environment, Center for EnvironmentalDesign Research, UC Berkeley
Permalink:http://escholarship.org/uc/item/6d94f90b
Additional Info:Original Citation: ASHRAE Journal, May 51 (25), 8 – 18, 2009 1
Keywords:Air speed, air movement preference, standard, draft limit, warming environment, ceiling fan
Abstract:Moving air has long been used to provide comfort in warm environments. Provision for indoor airmovement was one of the wellsprings of traditional architectural design in warm regions, affectingbuilding form, components, and equipment over millennia. However, this design option has fadedfrom practice since the advent of air-conditioning, in which the focus has been on controllingtemperature and humidity. Despite the fact that air movement can be an energy efficient alternativeto air cooling, it became viewed more as a possible source of undesirable draft, and comfortstandards came to set room airspeed limits very low, even for temperatures as warm as 26ºC(79ºF). An exception was granted if the airspeed source was under personal individual control,such as a window in a private office, or a desk fan, but only above 26 ºC (79ºF).

ASHRAE Journal, May 2009, pp 8 – 18 1
Moving Air for Comfort
Edward Arens, Stephen Turner, Hui Zhang, Gwelen Paliaga
Moving air has long been used to provide comfort in warm environments. Provision for indoor
air movement was one of the wellsprings of traditional architectural design in warm regions,
affecting building form, components, and equipment over millennia. However, this design
option has faded from practice since the advent of air-conditioning, in which the focus has been
on controlling temperature and humidity. Despite the fact that air movement can be an energy-
efficient alternative to air cooling, it became viewed more as a possible source of undesirable
draft, and comfort standards came to set room airspeed limits very low, even for temperatures as
warm as 26ºC (79ºF). An exception was granted if the airspeed source was under personal
individual control, such as a window in a private office, or a desk fan, but only above 26 ºC
(79ºF).
The need to improve buildings’ energy efficiency and CO2 footprint has opened this situation to
reexamination. Air conditioning is now one of the largest end-uses of energy in developed
countries, and much of the world’s current development is in tropical or subtropical regions. We
must look closely at all opportunities to reduce the energy consumed in providing comfort. The
use of air movement is one of these opportunities. In cool environments, drafts are certainly a
problem, but how true is this for temperatures that are neutral or warm? If drafts are not a
problem at these temperatures, might we resume using air movement as a means of cooling
occupants?
Recent studies of occupied buildings give very consistent evidence that large percentages of
occupants would prefer more air movement than what they currently have, and very small
percentages would prefer less. This is true in all conditions that occupants perceived as warm,
thermally neutral, and even slightly cool. In terms of temperature, there is small risk of draft,
and a strong preference for more air movement above 22.5ºC (72.5ºF).
Responding to these findings, new provisions in ASHRAE Standard 551 allow for elevated air
speed to broadly offset the need to cool the air in warm conditions.
Building occupants’ air movement preferences
Under ASHRAE sponsorship, field studies of occupant comfort in buildings worldwide have
been assembled in a database2. In this database, there are 11 studies (comprising 53 buildings
and 6148 sets of data) that included direct questions about the occupants’ air movement
preference. These studies, from Montreal, Honolulu, and Sydney, Kalgoorlie, and Townsville in
Australia, are used for the analyses presented below. The six Honolulu buildings are all schools,
and all the others are office buildings. Except for two naturally ventilated schools and one
mixed-mode office in Sydney, all the buildings are fully air-conditioned.
Table 1 lists occupants’ stated air movement preference by the thermal sensation they reported at
the same time. They are also arranged into two speed ranges: V<0.2 m/s (39 fpm; 0.44 mph)
ASHRAE Journal, May 2009, pp 8 – 18 2
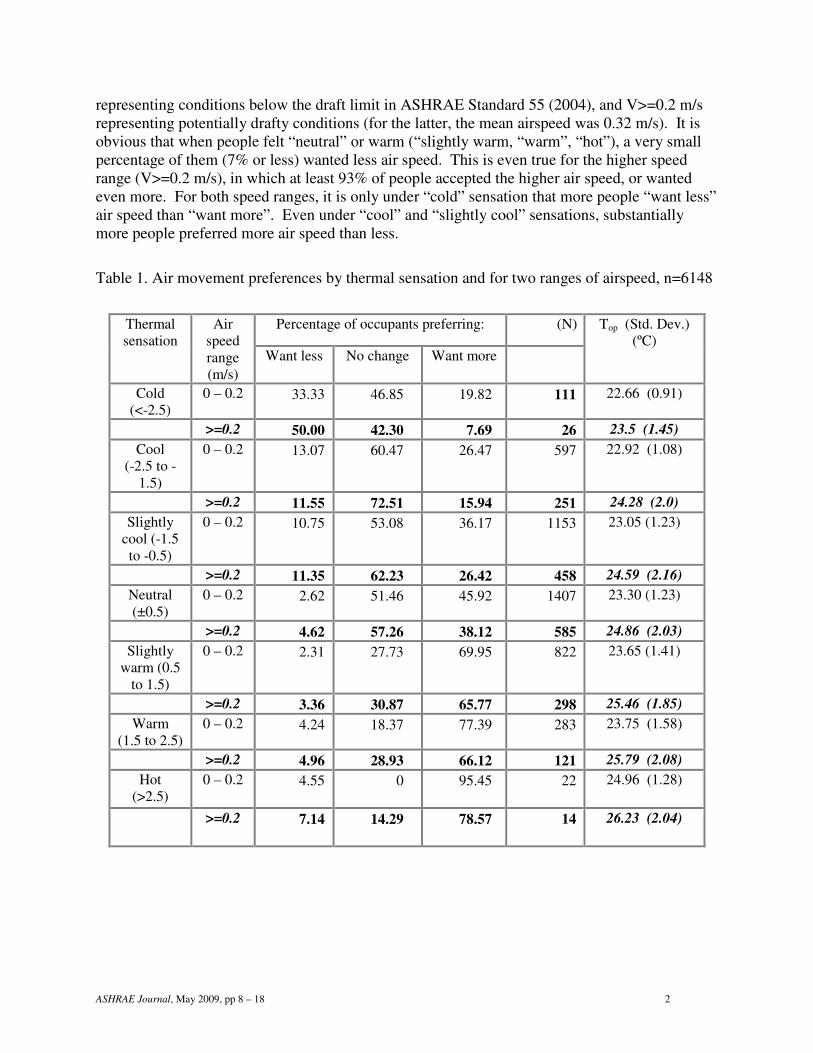
representing conditions below the draft limit in ASHRAE Standard 55 (2004), and V>=0.2 m/s
representing potentially drafty conditions (for the latter, the mean airspeed was 0.32 m/s). It is
obvious that when people felt “neutral” or warm (“slightly warm, “warm”, “hot”), a very small
percentage of them (7% or less) wanted less air speed. This is even true for the higher speed
range (V>=0.2 m/s), in which at least 93% of people accepted the higher air speed, or wanted
even more. For both speed ranges, it is only under “cold” sensation that more people “want less”
air speed than “want more”. Even under “cool” and “slightly cool” sensations, substantially
more people preferred more air speed than less.
Table 1. Air movement preferences by thermal sensation and for two ranges of airspeed, n=6148
Percentage of occupants preferring: (N) Thermal
sensation Air
speed
range
(m/s)
Want less No change Want more
Top (Std. Dev.) (ºC)
Cold (<-2.5)
0 – 0.2 33.33 46.85 19.82 111 22.66 (0.91)
>=0.2 50.00 42.30 7.69 26 23.5 (1.45)
Cool (-2.5 to -
1.5)
0 – 0.2 13.07 60.47 26.47 597 22.92 (1.08)
>=0.2 11.55 72.51 15.94 251 24.28 (2.0)
Slightly
cool (-1.5
to -0.5)
0 – 0.2 10.75 53.08 36.17 1153 23.05 (1.23)
>=0.2 11.35 62.23 26.42 458 24.59 (2.16)
Neutral (±0.5)
0 – 0.2 2.62 51.46 45.92 1407 23.30 (1.23)
>=0.2 4.62 57.26 38.12 585 24.86 (2.03)
Slightly
warm (0.5
to 1.5)
0 – 0.2 2.31 27.73 69.95 822 23.65 (1.41)
>=0.2 3.36 30.87 65.77 298 25.46 (1.85)
Warm (1.5 to 2.5)
0 – 0.2 4.24 18.37 77.39 283 23.75 (1.58)
>=0.2 4.96 28.93 66.12 121 25.79 (2.08)
Hot (>2.5)
0 – 0.2 4.55
0
95.45
22
24.96 (1.28)
>=0.2 7.14 14.29 78.57 14
26.23 (2.04)

ASHRAE Journal, May 2009, pp 8 – 18 3
The associated operative temperatures are also shownA. Under the same thermal sensation
category, the operative temperature for the higher airspeed is between 1.5 – 2 K (3 – 4ºF) higher
than the temperature for lower speed. This difference illustrates the tradeoff between air speed
and temperature in producing equivalent levels of comfort.
Air movement preference for people feeling neutral to slightly warm
The following figures summarize air movement preferences in the thermal sensation range of –
0.7 to 1.5. A sensation of -0.7 is a little cooler than the usual definition of ‘neutral’, but it
matches the cool end of the Category III range (for acceptable existing buildings) in the
European standard CEN 152513. The figures exclude sensations above 1.5 because, although
Table 1 shows that air movement is clearly welcome when sensation is above 1.5, this sensation
is too warm for normal office environments and ideally would not happen often. The –0.7 to 1.5
range should give a conservative estimate of air movement preference for neutral and slightly
warm people.
Figure 1: Under the sensation range (-0.7 to 1.5), far more people (52%) wanted more air
movement than less air movement (3%). The percentage wanting more was greater than the
percentage preferring “no change”.
Want Less: 3%
Want More: 52%
No Change: 45%
Figure 1. Air movement preference (sensation –0.7 to 1.5), all airspeeds. (n = 3230)
A The operative temperature is a measure combining the air temperature, affecting the body by
convection, and the surface temperatures of the surroundings, affecting the body by radiant
exchange. It is defined as the uniform temperature of an imaginary black enclosure in which an
occupant would exchange the same amount of heat by radiation plus convection as in the actual
nonuniform environment.
ASHRAE Journal, May 2009, pp 8 – 18 4
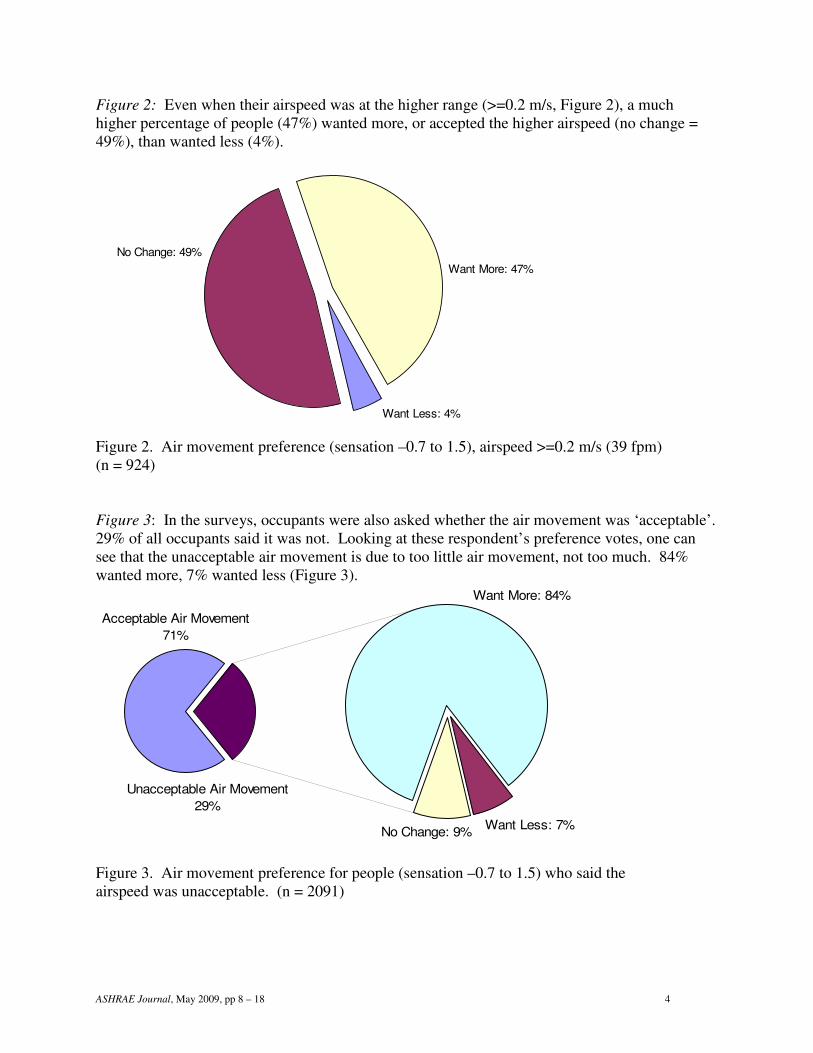
Figure 2: Even when their airspeed was at the higher range (>=0.2 m/s, Figure 2), a much
higher percentage of people (47%) wanted more, or accepted the higher airspeed (no change =
49%), than wanted less (4%).
Want Less: 4%
Want More: 47%
No Change: 49%
Figure 2. Air movement preference (sensation –0.7 to 1.5), airspeed >=0.2 m/s (39 fpm)
(n = 924)
Figure 3: In the surveys, occupants were also asked whether the air movement was ‘acceptable’.
29% of all occupants said it was not. Looking at these respondent’s preference votes, one can
see that the unacceptable air movement is due to too little air movement, not too much. 84%
wanted more, 7% wanted less (Figure 3).
Want Less: 7%No Change: 9%
Want More: 84%
Acceptable Air Movement
71%
Unacceptable Air Movement
29%
Figure 3. Air movement preference for people (sensation –0.7 to 1.5) who said the
airspeed was unacceptable. (n = 2091)

ASHRAE Journal, May 2009, pp 8 – 18 5
Figure 4: When people felt the airspeed was not acceptable, and when they were experiencing
the higher range (>=0.2 m/s), did they feel the speed was too much and therefore not acceptable?
Figure 4 shows that for the higher speed range, when people said that they felt the speed was not
acceptable, the unacceptability was still due to insufficient air movement. The percentage
wanting more (73%) is still far more than the percentage wanting less (17%). The difference is
now smaller but it is still very clear that the great majority found the speed unacceptable because
there wasn’t enough, even with the speed in the higher range.
Acceptable Air Movement
78%
Unacceptable Air Movement
22%
Want More: 73%
Want Less: 17%No Change: 10%
Figure 4. Air movement preference for people (sensation –0.7 to 1.5) who said the
airspeed was unacceptable, V>=0.2 m/s. (n = 324)
We also calculated the draft risk percentage (DR) for all the database’s occupants based on the
equations provided in the previous ASHRAE Standard, using airspeed, temperature, and
turbulence intensity as inputs. Then we look at the air movement preference for those people
when their DR >20% (thermal sensation again within –0.7 and 1.5, n=172), the percentage
wanting less air speed was 8%, 59% wanted no change, and 33% wanted more. The result is that
92% of the population that were predicted to feel a draft actually accepted their airspeed or
wanted it higher.
Summarizing these ASHRAE field study results, it is clear that for sensations -0.7 to 1.5, air
movement should be encouraged in these air conditioned buildings. The air movement should
not be made so great that it leaves people feeling cold, but a certain amount of it does answer a
basic need found in the surveys, and can offset an increase in temperature in the space. Similar
results have been found for a building in which occupants have personal or group control over
window ventilation4.

ASHRAE Journal, May 2009, pp 8 – 18 6
Provisions for elevated air speed in Standard 55
ASHRAE Standard 55 now provides a two-step procedure for setting a comfort zone for
temperature, radiation, humidity, and air movement. Both steps of this process can be carried
out using the ASHRAE Comfort Tool5 (available from ASHRAE publications), or interpolated
from figures in the standard. The first step, unchanged from the previous standard, combines air
temperature and radiant temperature in the index ‘operative temperature’ as defined above,
which is then combined with humidity to produce comfort zones for still air conditions displayed
on a psychrometric chart. This step uses the PMV human heat balance model, combining these
environmental variables with the occupant’s clothing level (expressed in the insulation unit ‘clo’)
and activity level (expressed in the metabolic rate unit ‘met’)6,7
.
The second step evaluates elevated air speeds. It uses a different model that better accounts for
convective cooling of the body. The Standard Effective Temperature (SET) thermophysiological
model is based on longstanding ASHRAE research and practice6,8
. Equal heat balance and skin-
wettedness for different airspeeds can be plotted in terms of SETB contours. If one starts with
the underlying PMV comfort zone, these SET contours form the boundaries of an air-movement
comfort zone in which air speed is plotted against operative temperature.
Figure 5. Elevated air speed for warm air temperatures
B
temperature, standard effective (SET): the temperature of an imaginary environment at 50% RH, <0.1 m/s air
speed, and with mean radiant temperature equal to air temperature, in which the total heat loss from the skin of an
imaginary occupant with an activity level of 1.0 met and a clothing level of 0.6 clo is the same as that from a person
in the actual environment, with actual clothing and activity level.
ASHRAE Journal, May 2009, pp 8 – 18 7
These steps are shown in Figure 5, taken from the new standard. Figure 5 shows two example
comfort zones, for the clothing insulation levels: 0.5 clo (e.g., summer short-sleeved shirt and
slacks) and 1.0 clo (winter heavy business suit), and the sedentary activity level of 1.1 met.
These clo and met levels have been traditionally used in the Standard’s first figure, which plots
PMV-based still-air comfort zones on a psychrometric chart. In Figure 5, those zones are
transposed to the bottom of the y-axis, in the region defined as ‘still air’ (0.1 to 0.15 m/s), for
50% relative humidity. The comfort zones each extend from -0.5 PMV (the thermal sensation
midway between ‘neutral’ and ‘slightly cool’) and +0.5 (between ‘neutral’ and ‘slightly warm’).
One can see some temperature dependence on airspeed within this still-air region, as predicted
by the PMV model.
Comfort envelope: Starting with these still-air zones, 0.5 and 1.0 clo comfort envelopes for air
speeds above 0.15 m/s are generated using the SET model. SET contours of equal heat-loss
relate a range of air speeds and temperatures to the equivalent PMV value in the still-air zones.
These two comfort envelopes can be interpolated to roughly account for other clothing levels,
but in practice, envelopes for any clothing, activity, and humidity level would be more accurately
determined using the ASHRAE Thermal Comfort Tool.
Limits to air speed: Figure 5 provides additional limits not based on SET. These are divided
into two categories, with and without local control.
(1) With local control. The full equal heat-loss envelope for a given clothing level in Figure 5
applies when control of local air speed is provided to occupants. For control over their local air
speed, control directly accessible to occupants must be provided for every 6 occupants (or less)
or for every 84 square meters (900 square feet) (or less). The range of control shall encompass
air speeds suitable to maintain comfort for sedentary occupants. The air speed should be
adjustable continuously or in maximum steps of 0.25 m/s (50 fpm) as measured at the occupant’s
location.
(2) Without Local Control. Within the equal heat-loss envelope, if occupants do not have control
over the local air speed in their space, limits apply as shown by the light gray area in Figure 5.
They apply for light, primarily sedentary office activities. For other types of activities or
occupancies, such as retail or warehousing, these limits may differ or not be necessary. There is
little quantitative information available for other types of occupancies.
For operative temperatures above 25.5 ºC (77.9 ºF), the upper limit to air speed is 0.8 m/s (160
fpm).
Below 22.5 ºC (72.5 ºF), the limit is 0.15 m/s (30 ft/min) in order to avoid cold discomfort due to
draft. 0.15 m/s is the upper limit of the ‘still air’ zone, and is coincidentally equal to the airspeed
self-generated by an office worker at 1.2 met.
Between 22.5 and 25.5 ºC (72.5 ºF and 77.9 ºF), the allowable speed follows an equal-SET curve
dividing the light and dark gray areas. This local-control boundary between 22.5 and 25.5 ºC is

ASHRAE Journal, May 2009, pp 8 – 18 8
not linked to any PMV comfort zone, but is based on temperatures that have been observed in
office field studies to cause virtually no risk of draft9.
Using a temperature-based local-control boundary provides a substantial practical advantage in
environmental control: decentralized air movement sources (like ceiling fans) can be
manufactured or retrofitted with temperature-based speed controllers for automatic control of
common spaces.
It is worth noting that the 1 clo zone in Figure 5 represents a higher level of clothing than is
typical for situations in which air-movement cooling is used. For more typical summer clothing
levels such as 0.5 and 0.6 clo, the limits to airspeed and temperature will be determined by the
cool-side SET boundary of the comfort zone, not by this occupant-control boundary.
Air speed measurement: Above 22.5 ºC (72.5 ºF), the overall heat balance of the body
determines comfort. For this, the standard uses the average air speed of the three measurement
heights that represent the seated occupied zone -- 0.1, 0.6, and 1.1 m (4, 24, and 43 inches).
Measurements should be taken in the occupants’ estimated vicinity. To prevent anyone from
attempting to use the standard to justify cold-air dumping from poorly designed HVAC supply
air outlets, the coldest temperature in the occupied zone must be used to represent the entire
zone. This also renders it improbable that cold air distribution systems can be used as the source
of elevated air movement because they are likely to produce cold air jets.
Below 22.5 ºC (72.5 ºF), the problem is avoiding thermal discomfort on a local, usually
unclothed, part of the body. The SET and PMV models do not distinguish between clothed and
unclothed portions of the body, so the following conservative approach is adopted: the maximum
mean air speed of the three measurement heights, and the lowest air temperature is used for the
SET calculations, thereby over-predicting the whole-body cooling to a level that more closely
approximates the cooling of the most affected local part.
There is no longer a requirement to measure turbulence intensity for determining draft risk.
Validation: In lab studies where airspeed has been imposed on people, conditions on the cool
side of the ‘without local control’ (light gray zone) boundary have been found to be comfortable,
even recommended as optima10,11,12
. Imposed air movement does not appear to be a problem at
these temperatures. This is also supported in the ASHRAE field database described above: for
airspeeds above 0.4 m/s and air temperatures between 22.5 and 25.5 C, 32% wanted more air
movement, 59% no change, and only 9% wanted less.
On the warm side of 25.5 ºC (77.9 ºF), ceiling fan studies (with no occupant control) have found
1 m/s (197 fpm, 2.2 mph) acceptable to 77% of subjects13
and above (95%14
, 80-100%15
). A
frontal desktop breeze of 0.8 m/s air speed produced an acceptability level of 80%10
. Subjects in
preferred airspeed studies16,17,18
often chose airspeeds well above 1 m/s. Fountain19
summarized
many of these studies, from which one can see that the SET-based curves in Std 55 represent the
laboratory results well.
ASHRAE Journal, May 2009, pp 8 – 18 9
Air speed requirements for industrial occupancies: Standard 55 has also added an informative
appendix to address more strenuous indoor activities than office work, such as industrial work.
For such work in hot environments, sweating may be acceptable to the occupants. Elevated
airspeeds provide high rates of cooling by sweat evaporation. Using SET as described above,
hot conditions with high airspeeds may be equated to their temperature equivalents at lower
airspeeds. There is no specified limit to air speed in this range.
Impact in practice
The new provisions allow designers to use fans, stack, or window ventilation to offset
mechanical cooling, or in some climates to supplant it entirely. The following two examples are
of offices using ceiling fans.
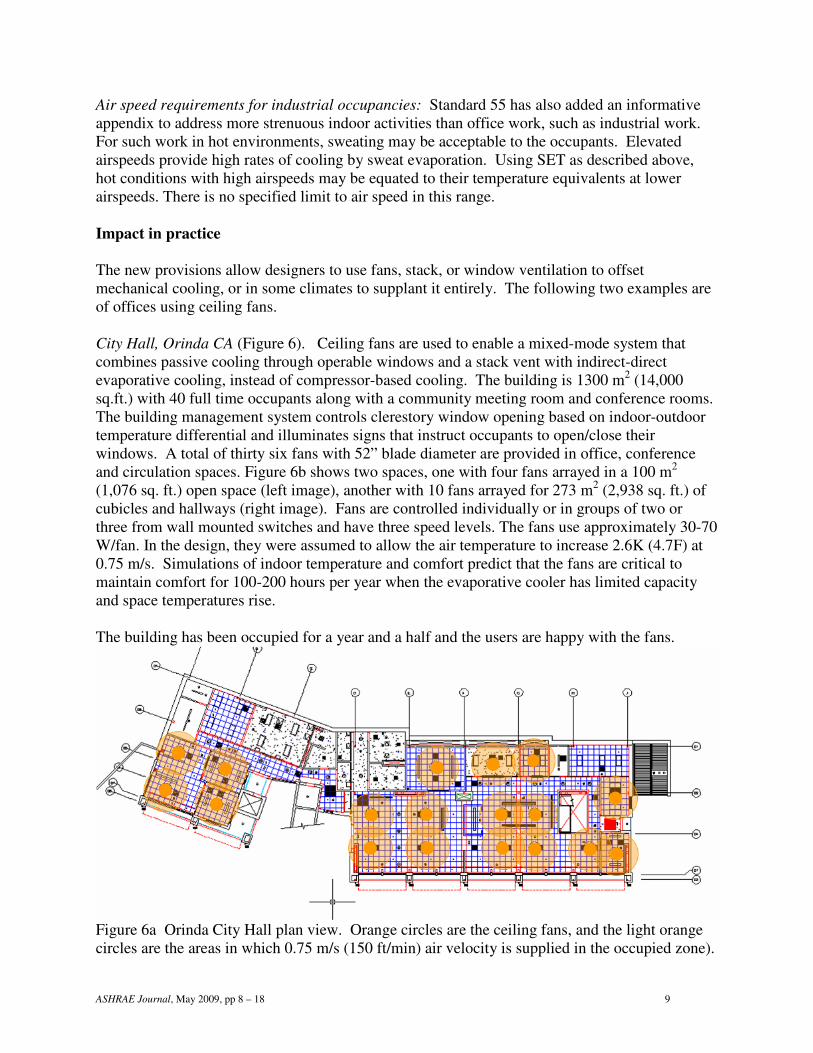
City Hall, Orinda CA (Figure 6). Ceiling fans are used to enable a mixed-mode system that
combines passive cooling through operable windows and a stack vent with indirect-direct
evaporative cooling, instead of compressor-based cooling. The building is 1300 m2 (14,000
sq.ft.) with 40 full time occupants along with a community meeting room and conference rooms.
The building management system controls clerestory window opening based on indoor-outdoor
temperature differential and illuminates signs that instruct occupants to open/close their
windows. A total of thirty six fans with 52” blade diameter are provided in office, conference
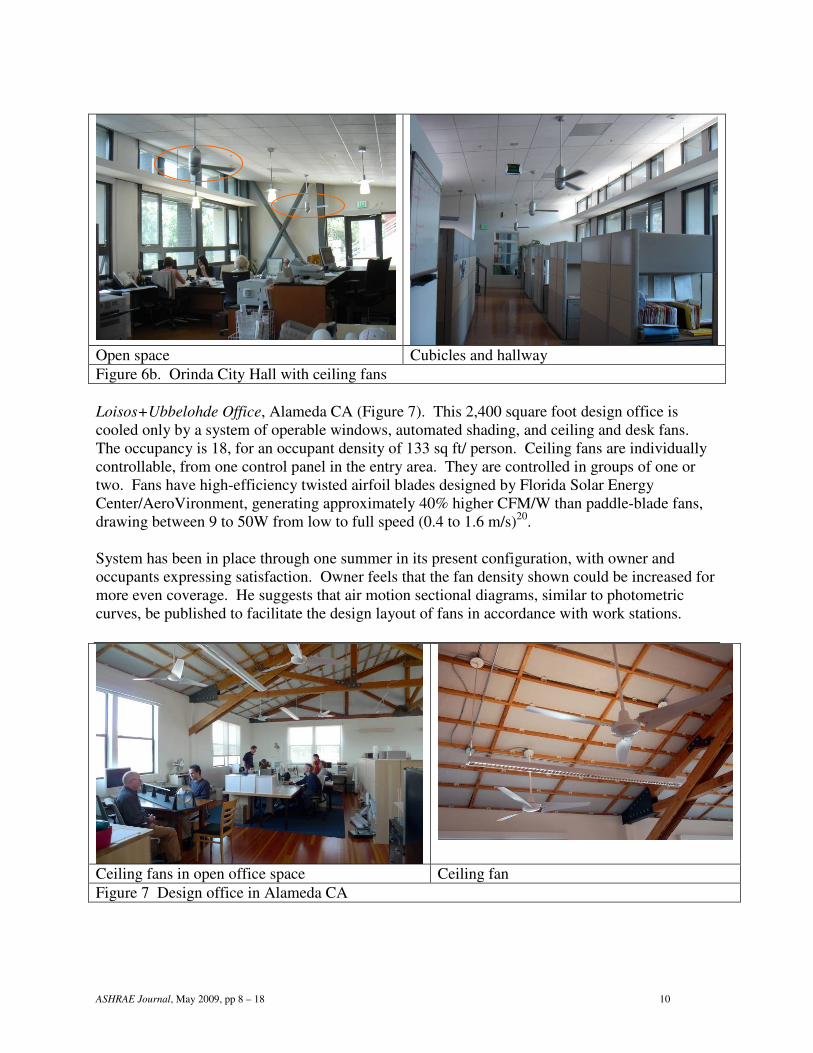
and circulation spaces. Figure 6b shows two spaces, one with four fans arrayed in a 100 m2
(1,076 sq. ft.) open space (left image), another with 10 fans arrayed for 273 m2 (2,938 sq. ft.) of
cubicles and hallways (right image). Fans are controlled individually or in groups of two or
three from wall mounted switches and have three speed levels. The fans use approximately 30-70
W/fan. In the design, they were assumed to allow the air temperature to increase 2.6K (4.7F) at
0.75 m/s. Simulations of indoor temperature and comfort predict that the fans are critical to
maintain comfort for 100-200 hours per year when the evaporative cooler has limited capacity
and space temperatures rise.
The building has been occupied for a year and a half and the users are happy with the fans.
Figure 6a Orinda City Hall plan view. Orange circles are the ceiling fans, and the light orange
circles are the areas in which 0.75 m/s (150 ft/min) air velocity is supplied in the occupied zone).
ASHRAE Journal, May 2009, pp 8 – 18 10
Open space Cubicles and hallway
Figure 6b. Orinda City Hall with ceiling fans
Loisos+Ubbelohde Office, Alameda CA (Figure 7). This 2,400 square foot design office is
cooled only by a system of operable windows, automated shading, and ceiling and desk fans.
The occupancy is 18, for an occupant density of 133 sq ft/ person. Ceiling fans are individually
controllable, from one control panel in the entry area. They are controlled in groups of one or
two. Fans have high-efficiency twisted airfoil blades designed by Florida Solar Energy
Center/AeroVironment, generating approximately 40% higher CFM/W than paddle-blade fans,
drawing between 9 to 50W from low to full speed (0.4 to 1.6 m/s)20
.
System has been in place through one summer in its present configuration, with owner and
occupants expressing satisfaction. Owner feels that the fan density shown could be increased for
more even coverage. He suggests that air motion sectional diagrams, similar to photometric
curves, be published to facilitate the design layout of fans in accordance with work stations.
Ceiling fans in open office space Ceiling fan
Figure 7 Design office in Alameda CA

ASHRAE Journal, May 2009, pp 8 – 18 11
Conclusions
Standard 55-2009 includes new provisions for using air movement to offset warm air
temperatures. They are based on field studies that consistently demonstrate that in neutral and
warm environments, people want more air speed. The SET model is used to generate comfort
zones in which elevated air speed offsets warm air temperature. New criteria for group local
control are specified. The new air movement provisions assist the design of both passive and
mechanical systems such as natural ventilation, thermal mass cooling, evaporative cooling, and
mixed-mode HVAC. Two examples are given of applications in open-plan offices.
Acknowledgements
The authors wish to acknowledge Tyler Hoyt and Elliot Nahman for their assistance with the
statistical analysis and graphics.
References
1. ANSI/ASHRAE Standard 55-2009, Thermal Environmental Conditions for Human
Occupancy.
2. de Dear, R.”A global database of thermal comfort field experiments.” ASHRAE Transactions
104(1b), pp 1141-1152.
3. EN 15251. 2007. Indoor environmental input parameters for design and assessment of
energy performance of buildings addressing indoor air quality, thermal environment,
lighting and acoustics. European Committee for Standardization, Brussels. 51 pp.
4. Zhang, H., E. Arens, S. Abbaszadeh Fard, C. Huizenga, G. Paliaga, G. Brager, L. Zagreus.
2007, “Air movement preferences observed in office buildings.” International Journal of
Biometeorology 51, pp 349 – 360.
5. Fountain M, C. Huizenga. 1996. “A thermal comfort prediction tool.” ASHRAE Journal,
September, 39-42.
6. ASHRAE Handbook of Fundamentals, 2005, Chapter 8: Physiological principles and thermal
comfort.
7. Fanger, O. 1970. Thermal Comfort. Danish Technical Press, Copenhagen, 244p.
8. Gagge, A, A. Fobelets, L. Berglund. 1986. “A standard predictive index of human response
to the thermal environment.” ASHRAE Transactions 86(2), pp 709-731.
9. Toftum, J. 2004. “Air movement – good or bad?” Indoor Air 14, pp 40-45.
10. Gong, N., K. Tham, A. Melikov, D. Wyon, C. Sekhar, D. Cheong. 2005 “Human perception
of local air movement and the acceptable air velocity range for local air movement in the
tropics.” Indoor Air 2005, Beijing, September 4 – 9, pp 452 – 456.
11. Wigo, H., 2009, “Effect of intermittent air velocity on thermal and draught perception during
transient temperature condition.” International Journal of Ventilation 7(1), pp 1473 – 3315.
12. Zhang, H., E. Arens, D. Kim, E. Buchberger, F.Bauman, C. Huizenga. 2009. “Comfort,
perceived air quality, and work performance in a low-power task-ambient conditioning
system.” Building and Environment, in press.
13. McIntyre, D.A. 1978. “Preferred air speed for comfort in warm conditions.” ASHRAE
Transactions 84(2), pp 263--277.
14. Rohles, F., S. Konz, B. Jones. 1983, “Ceiling fans as extenders of the summer comfort
envelope.” ASHRAE Transactions 89(1), pp 245-263.
15. Scheatzle, D et al. 1989, “Expanding the summer comfort envelope with ceiling fans in hot,
arid climates.” ASHRAE Transactions 95(1), pp 269-280.
ASHRAE Journal, May 2009, pp 8 – 18 12
16. Arens, E., T. Xu, K. Miura, H. Zhang, M. Fountain, F. Bauman. 1998. “A study of occupant
cooling by personally controlled air movement.” Energy and Buildings 27, pp 45 – 59.
17. Kubo, H., Isoda, N., H. Enomoto-Koshimizu. 1997. “Cooling effect of preferred air velocity
in muggy conditions.” Building and Environment 32(3), pp 211-218.
18. Tanabe, S., K. Kimura. 1989. “Thermal comfort requirements under hot and humid
conditions.” Proceedings of the First ASHRAE Far East Conference on Air Conditioning in
Hot Climates, Singapore, ASHRAE, pp 3-21.
19. Fountain, M., E. Arens. 1993. “Air movement and thermal comfort.” ASHRAE Journal,
August, pp 26 – 30.
20. Parker, D., M. Callahan, J. Sonne, G. Su. 1999. “Development of a high efficiency ceiling
fan ‘the Gossamer Wind’.” FSEC-CR-1059-99, Florida Solar Energy Center, 14pp.