ufz discussion papers 2012 lehmann... · publisher: helmholtz-zentrum für umweltforschung gmbh...
TRANSCRIPT

Publisher: Helmholtz-Zentrum für Umweltforschung GmbH - UFZ Permoserstr. 15 04318 Leipzig ISSN 1436-140X
UFZ Discussion Papers
Department of Economics 18/2012
The Political Economy of the Peruvian Urban Water Sector
Simon Felgendreher, Paul Lehmann
December 2012

The Political Economy of the Peruvian Urban Water Sector
Simon Felgendreher1, Paul Lehmann2
December 2012 1 Simon Felgendreher, Department of Economics, University of Gothenburg, [email protected] 2 Paul Lehmann, Department of Economics, Helmholtz Centre for Environmental Research – UFZ, Leipzig, [email protected]
Table of Contents 1. Introduction ......................................................................................................................................... 4
2. Theoretical Framework ....................................................................................................................... 5
2.1. The principal agent perspective ................................................................................................... 5
2.2. Focus on the Water Sector ........................................................................................................... 9
2.3. Adapting the theoretical framework to the water sector ............................................................ 9
2.4. Examples of water sector regulation and reforms ..................................................................... 11
3. Background ........................................................................................................................................ 15
3.1. The structure of the urban water sector .................................................................................... 15
3.2. The political system of Peru ....................................................................................................... 17
4. Qualitative Analysis ........................................................................................................................... 18
4.1. Methodology .............................................................................................................................. 18
4.2. Actors, Challenges and Necessary Reforms ............................................................................... 19
4.2.1. Main Actors and Stakeholders ............................................................................................ 19
4.2.2. General Problems and Challenges ....................................................................................... 20
4.2.3. Reform suggestions ............................................................................................................. 22
4.3. Political Economic Analysis ......................................................................................................... 23
4.4. Results ........................................................................................................................................ 24
5. Quantitative Analysis ......................................................................................................................... 26
5.1. Panel Study ................................................................................................................................. 26
5.1.1. Political Business Cycles and Partisan Effects ..................................................................... 26
5.1.2. Budget Cycles and Partisan Effects in the Peruvian water sector ....................................... 27
5.1.3. Data ..................................................................................................................................... 29
5.1.4. Results ................................................................................................................................. 30
5.2. Cross municipal study ................................................................................................................. 33
5.2.1. The median voter theorem ................................................................................................. 34
5.2.2. Adaption to the Peruvian context ....................................................................................... 35
5.2.3. Data ..................................................................................................................................... 36
5.2.4. Results ................................................................................................................................. 37
6. Conclusion ......................................................................................................................................... 41
References ............................................................................................................................................. 46

Abbreviations
IBT Increasing Block Tariffs
INEI National Institute of Statistics and Information
MEF Ministry of Finance and Economy
MHCS Ministry of Housing, Construction and Sanitation
OMP Optimized Master Plan
ONPE National Office of Electoral Processes
SUNASS National Superintendency of Sanitation Services
WSC Water Supply Company

4
1. Introduction According to the World Health Organization (2008), each year 1.8 million people die as a consequence of diarrhoeal diseases and 17% of the child mortality can be attributed to gastro-intestinal infections. As Jalan and Ravaillon (2003) have shown in their country study for India, the occurrence and duration of this kind of diseases can be significantly reduced for children if the household is connected to piped water infrastructure. In Peru, 7% of the urban population still lacks such a connection and 25% are not connected to the sewerage system exposing these parts of the population to a high risk of gastric diseases (SUNASS, 2011a). Besides the cost of illnesses and increased mortality, the lack of access to tap water leads to costs associated with travel time to the next water source and the purchase of water from tank lorries which is normally much higher than the price of tap water due to monopoly pricing. Bauer and Villaverde (2011) estimate the costs for Lima, the capital of Peru, to be equivalent to approximately 150 US Dollar for additional travel time and 90 US Dollar for overpricing of private providers annually per person. Hence, not having access to piped water leads to considerable costs for the affected part of the Peruvian population and their level of clean water consumption is inefficiently low compared to the quantity consumed with a tap water connection. On the other hand, the water prices charged by the supply companies of piped water are in general not high enough to cover the maintenance costs and not sufficient to provide the necessary funds for network expansions to connect unattended neighbourhoods (Bauer and Villaverde, 2011).
The weak infrastructure and poor service level of the water companies decreases the overall welfare of the Peruvian society to a suboptimal level. As explained in detail later in the study, there are indications that these shortcomings can be attributed at least in part to governance failures of politicians and their interventions that do not serve the objective to improve the performance of the sector. Thus, the aim of this study is to shed light on the political influence in the Peruvian water sector and to explain the behaviour of its stakeholders by political economic theory.
To achieve this goal, two different empirical approaches are carried out. The first one uses a set of expert interviews to examine qualitatively the challenges of the water sector that could be mitigated by policies of the central government. In a second step, the analysis tries to explain with the help of political economic theory why these policies have not been implemented yet. The results show that especially the lack of awareness of the decision-makers and the fear of resistance of special interest groups refrain politicians from promoting sector reforms.
The second part of the analysis focuses on the municipal level of the government and its political behaviour. First, it tries to identify how politicians influence the water price setting and to what extent they are responsible for the inefficient water pricing in Peru. Insights in this area can serve as a foundation for future institutional design to limit potential political interference. Second, it uses the setting of the Peruvian water sector for an empirical analysis of political economic theory and to test if the results from previous research can be transferred to the municipal level of a developing country. In order to achieve these goals, two different data sets and quantitative approaches are used. In the first approach, a panel data set of Peruvian municipalities and their water companies is exploited. I test whether the water price setting is influenced by election cycles and if parties differ in their capability to set prices that are sufficiently high to guarantee an adequate water provision.

5
The results suggest that water prices tend to be higher in the first year after municipal elections, indicating that price adjustments are postponed until election campaigns are over. Besides, water companies under the influence of regional parties seem to charge on average higher tariffs than water companies which are governed by parties that only act on a local level. In the second approach, I use census data of the year 2007 to test the median voter theorem and examine if differences in water tariffs can be explained by differences in the income distribution between regions. My results find no evidence that such a relationship prevails and that the median voter theorem is applicable to the Peruvian urban water sector.
The study starts with a theoretical framework that is built on previous research on regulation and political economy. It is followed by an overview of the Peruvian water sector and the political system of the country in the following section. In section four, the qualitative analysis is presented. In section five the quantitative approaches are carried out. It starts by a test for political budget cycles and partisan effects followed by an examination of the median voter theorem. Finally, section six discusses the results and concludes.
2. Theoretical Framework In the following section a literature review of the public choice theory is presented that tries to explain the behaviour of different actors in the regulatory process. It is followed by a more specific approach for the regulation and reform outcome of the water sector. All these insights are then used in subsection 2.3 to develop a theoretical framework for the behaviour of politicians in the water sector regulation.
2.1. The principal agent perspective One of the first authors who viewed the regulatory process from an economic perspective was Stigler (1971). Even before the concept of rent seeking was formalized by Krueger (1974) and Buchanan et al. (1980), he saw politicians as suppliers of regulation with selfish objectives. On the example of motor trucking he showed that regulation does not only occur in industries with natural monopolies but also in competitive industries. The reason is that the latter can profit from regulation that implements artificial market-entry barriers which impede additional competition. One key finding of the author was that it is easier for sectors with concentrated ownership to influence the regulator because the cost to organise collective action is lower compared to more disperse industries or consumers. Peltzman (1976) formalizes the model of Stigler and distinguishes three types of actors: a politician who is in charge of the regulation, producers and consumers. The politician receives utility in the form of votes from the consumers and financial support from the producers that the politician can for instance use to finance its next election campaign. If the politician allows the price in a regulated industry to increases, the politician loses votes and her utility decreases. On the other hand, it leads to an increase of the utility because the profits of the producers increase and the financial support from this group rises. In equilibrium, the price will be at the point where the marginal vote gain equals the marginal loss of power from the producers. Thus, the regulated price is in between the competitive and the monopoly price. In this model, monopolistic industries will attract regulation because the politician can maximize its utility by trading off the interest between producers and consumers and not because she wants to maximize total welfare.
With regard to a sector where the monopoly is owned by the government to provide a basic good, like the water industry in many countries, it is possible to imagine a case where the industry has no

6
incentive to maximize its profits and lobby for higher prices. In such a situation, the politician would not receive financial transfers from the industry for excess prices but is rewarded by the consumers if the prices are set relatively low. Here, it might occur that the prices fall below the level where the prices cover the maintenance and investment costs, if the politician does not take the financial sustainability of the industry in its utility function into account.
In his analysis, Becker (1983) and Becker (1985) focuses on the role of interest groups and how they influence the regulatory outcome. Each member of an interest group spends money or effort on political activities to lobby for her interests. The optimal level of pressure of each group depends on how the effort of the group affects the utility of the members. The larger the group, the higher is the incentive for each individual to circumvent the participation of the groups’ activities and to free-ride. Hence, the cost of producing pressure increases with the group size because it becomes more costly for the group to prevent individuals from free-riding. Besides, the size of the deadweight loss of regulation is crucial in determining the policy outcome. If the deadweight cost for society is relatively high, interest groups that do not profit from the policy have a strong incentive to lobby against it. Thus, the higher the deadweight cost the more resistance it will create and the power of the interest group in favour of it diminishes.
North (1990) criticises the concept of Becker and argues that his models built on the assumption of rationality of the actors. He points out that this rationality implies two underlying assumptions. First, it assumes that the actors are perfectly informed about the consequences of their behaviour. In the case of the model of Becker (1983) this means for instance that each interest group can foresee how much it will gain or lose by a change in policy and which other lobby group is driving this development. Second, transaction costs of the political bargaining process are neglected and the process is assumed to be efficient. North (1990) reviews these assumptions critically. Concerning the first assumption of perfect information he argues that in reality actors do not understand perfectly how policies will affect them. This has different reasons. First of all, actors have only access to limited information and are therefore unable to assess each policy adequately. For instance, the welfare losses to society caused by trade barriers are often not known and understood by the broad public. Secondly, even for a fairly well informed actor it is nearly impossible to predict exactly how a policy change will affect the different groups in society. Besides these informative boundaries, North points out another interesting shortcoming of the rationality assumption. The assumption implies that all agents have the same rational understanding of the political processes. This assumption neglects completely the influence of ideologies in the decision-making process. How agents perceive their environment and how they interpret the information received depends strongly on their underlying ideological beliefs. Thus, the decision process of an actor should not be seen as a completely rational process but rather as a subjective choice based on normative preferences. With respect to transaction costs, North argues that it important to include them in the analysis of the decision process. Especially due to imperfect competition in politics, the political ‘market’ tends to be relatively inefficient which leads to relatively high transaction costs in the bargaining process. The size of the transaction costs to agree on new policies depends to a large extend on the structure of the political institutions and their decision mechanisms.
In another approach Tirole (1986) and Laffont and Tirole (1991) focus on the role of asymmetric information and how it can lead to side-payments. The authors start their analysis with a three-tier model where a benevolent government assigns a regulatory authority to find out the true production costs of a firm. The government decides on the wage of the regulator and the terms of the regulated
7
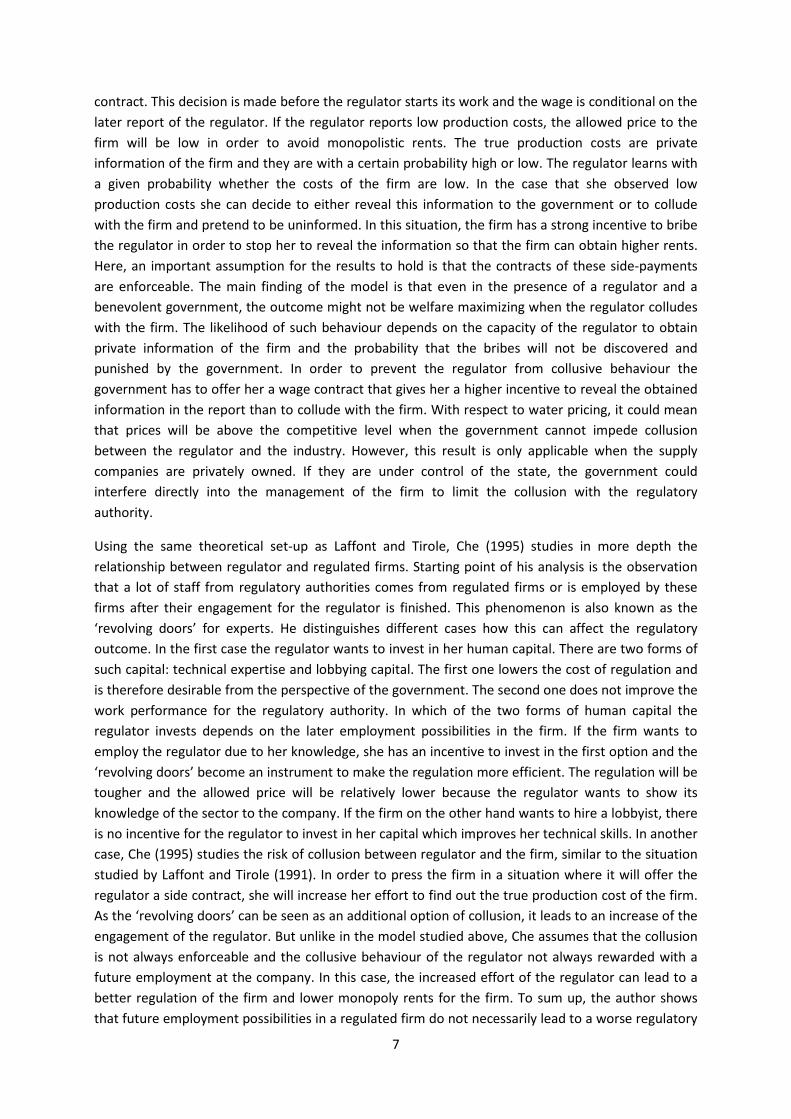
contract. This decision is made before the regulator starts its work and the wage is conditional on the later report of the regulator. If the regulator reports low production costs, the allowed price to the firm will be low in order to avoid monopolistic rents. The true production costs are private information of the firm and they are with a certain probability high or low. The regulator learns with a given probability whether the costs of the firm are low. In the case that she observed low production costs she can decide to either reveal this information to the government or to collude with the firm and pretend to be uninformed. In this situation, the firm has a strong incentive to bribe the regulator in order to stop her to reveal the information so that the firm can obtain higher rents. Here, an important assumption for the results to hold is that the contracts of these side-payments are enforceable. The main finding of the model is that even in the presence of a regulator and a benevolent government, the outcome might not be welfare maximizing when the regulator colludes with the firm. The likelihood of such behaviour depends on the capacity of the regulator to obtain private information of the firm and the probability that the bribes will not be discovered and punished by the government. In order to prevent the regulator from collusive behaviour the government has to offer her a wage contract that gives her a higher incentive to reveal the obtained information in the report than to collude with the firm. With respect to water pricing, it could mean that prices will be above the competitive level when the government cannot impede collusion between the regulator and the industry. However, this result is only applicable when the supply companies are privately owned. If they are under control of the state, the government could interfere directly into the management of the firm to limit the collusion with the regulatory authority.
Using the same theoretical set-up as Laffont and Tirole, Che (1995) studies in more depth the relationship between regulator and regulated firms. Starting point of his analysis is the observation that a lot of staff from regulatory authorities comes from regulated firms or is employed by these firms after their engagement for the regulator is finished. This phenomenon is also known as the ‘revolving doors’ for experts. He distinguishes different cases how this can affect the regulatory outcome. In the first case the regulator wants to invest in her human capital. There are two forms of such capital: technical expertise and lobbying capital. The first one lowers the cost of regulation and is therefore desirable from the perspective of the government. The second one does not improve the work performance for the regulatory authority. In which of the two forms of human capital the regulator invests depends on the later employment possibilities in the firm. If the firm wants to employ the regulator due to her knowledge, she has an incentive to invest in the first option and the ‘revolving doors’ become an instrument to make the regulation more efficient. The regulation will be tougher and the allowed price will be relatively lower because the regulator wants to show its knowledge of the sector to the company. If the firm on the other hand wants to hire a lobbyist, there is no incentive for the regulator to invest in her capital which improves her technical skills. In another case, Che (1995) studies the risk of collusion between regulator and the firm, similar to the situation studied by Laffont and Tirole (1991). In order to press the firm in a situation where it will offer the regulator a side contract, she will increase her effort to find out the true production cost of the firm. As the ‘revolving doors’ can be seen as an additional option of collusion, it leads to an increase of the engagement of the regulator. But unlike in the model studied above, Che assumes that the collusion is not always enforceable and the collusive behaviour of the regulator not always rewarded with a future employment at the company. In this case, the increased effort of the regulator can lead to a better regulation of the firm and lower monopoly rents for the firm. To sum up, the author shows that future employment possibilities in a regulated firm do not necessarily lead to a worse regulatory

8
outcome. If the regulated price is higher or lower in the presence of ´revolving doors´ depends on the reasons why the firm wants to employ a former regulator and the possibility to enforce side contracts in the case of collusion.
Based on the experiences of infrastructure reforms in the 1990s in developing countries, Laffont (2005) reviews the model presented by Tirole (1986) and Laffont and Tirole (1991) critically. His first observation is that the capacity of regulatory bodies is often limited in developing countries. As a result, it is more difficult for the regulator to get informed about the true cost structure of the firm. To give the firm an incentive to reveal its information nevertheless, the government has to offer a contract with a positive rent in the case with low costs. As a result, the firm will on average retain higher rents compared to the case where the regulator has more capacities to get access to the cost structure of the firm. The second observation of the author is the limited accountability of authorities in developing countries. Concerning the regulator, this means that the risk of being discovered and punished when colluding with the firm is lower compared to systems where the accountability is high. There are two options the government has to counteract the higher tendency of the regulator to collude. The first one is to increase the wage of the regulator in order to raise her incentive to reveal the true information. The second option is to lower the incentive for the firm to bribe the regulator. This is only possible when the government increases the rents for the regulated firms in the case of low costs. Thus, the profit gap for the firm between the contract in the case of high costs and the contract for low costs decreases and with it the incentive to bribe the regulator. As a consequence, the allowed price of the firm must be higher than it would be if the regulator had more capacities.
Furthermore, Laffont (2005) argues that ‘non-commitment’ has to be considered in developing countries. With this term he describes the risk for firms that a government breaks a contract and forces the firm to renegotiate it to its disadvantage. Extending the model discussed above he shows that this leads to underinvestment by the firm because the government cannot credibly guarantee the recovery of the sunk costs of the investments. Especially in the water sector this can signify that necessary investments to maintain and improve the sanitation infrastructure is not carried out if the government cannot credibly convince the company that it will respect its property rights. A final issue which is especially problematic in developing countries is the limited fiscal efficiency of the governments. Compared to developed countries the opportunity cost to collect taxes is often high due to inefficient tax systems. In such a situation it might appear as a relatively efficient way to collect public funds through the taxation of the profits of a regulated firm. In order to make sure that the firm attains sufficient profits, the regulated prices have to be high enough to create these profits. Hence, according to the author, prices in regulated industries should be relatively higher in developing countries in order to allow the government to obtain public funds in a relatively efficient way. However, fiscal inefficiency also leads to other implications for the government as Estache and Wren-Lewis (2009) note. According to them, fiscal inefficiency does not only increase the cost of collecting taxes but also makes the redistribution of financial resources amongst consumers more difficult. Thus, if the objective of a government is to redistribute resources and this is not possible through the tax system, keeping prices for basic goods down might seem like an option. Especially the latter argument seems relevant in the water sector. As Komives (2006) notes, water tariffs in many developing countries are designed as increasing block tariffs (IBT) with the goal to cross-subsidies the poor.

9
2.2. Focus on the Water Sector In their analysis Saleth and Dinar (2004) try to identify factors that influence water sector institutions in a reform situation. In contrast to the classical public choice approaches presented above, the authors do not develop a full scale model that tries to explain the behaviour of different actors theoretically. Instead, they focus on the broad ´institutional environment´ and do not examine the behaviour of individual political actors.
According to the authors, the institutional environment is defined as “a set of fundamental, political, social and legal rules that establish the basis of production, exchange, and distribution.” The authors implicitly define a reform as a change of these institutional rules. Influencing factors that favour or impede reforms can be exogenous and endogenous to the water sector. Exogenous factors are factors which have no direct links to the water sector, such as economic growth or natural catastrophes but have an impact on the water sector and the reform process. Endogenous factors are found within the water sector like efficiency of the water institutions or the general lack of sufficient water resources. How these factors affect the reform process depends on their impact on the transaction and the opportunity cost, according to the authors. Transaction costs are understood as the cost implied by the reform process. This could be for instance the bargaining process to reach an agreement, but also the administration cost of the implementation of such an agreement. If reforms are bundled, these costs can be decreased due to economies of scale. On the other hand, the opportunity cost is the loss of foregone opportunities to change the current situation and increase welfare.
Both, the transaction and the opportunity cost of a water sector reform are not fixed but depend on the development of the underlying exogenous and endogenous factors. If for instance the water supply situation deteriorates due to a persistent drought, this can lead to a decrease in the transaction cost because the political resistance to a reform decreases and an agreement becomes easier to obtain. At the same time, the loss of not acting and finding a solution to the crisis increases when the current situation deteriorates. Hence, if the gap between opportunity and transaction cost increases because of a change of the underlying factors, the possible welfare gains of a water sector reform increase and with it the possibility to implement such a reform.
2.3. Adapting the theoretical framework to the water sector In the following, a draft of a theoretical framework is presented that tries to explain the behaviour of politicians in the water sector. It builds mainly upon the public choice literature presented in subsection 2.1 but incorporates transaction and opportunity costs in the utility function of the actors following the idea of Saleth and Dinar (2004).
Let us first assume a situation where a politician of the executive level has to decide whether she wants to get engaged into a water sector reform project or not. Examples of such reforms from different countries are presented in the next subsection. For instance, it could signify the promotion of a new bill, allowing private investment or strengthening the regulation of the sector by an independent regulatory authority. We assume that the politician is not completely driven by self-interest, but not completely altruistic in her behaviour either. Thus, her overall utility includes both components, the utility to society the reform project would bring, 𝑈𝑆𝑂𝐶, and the private utility of the politician, 𝑈𝑃𝑅𝐼𝑉. The latter can consist of financial benefits, like donations or bribes from interest groups or non-financial benefits like increased popularity. The weight of the respective utility component in the utility function of the politician, 𝑈𝑃𝑂𝐿, depends on how far its attitude is selfish. If

10
the individual is completely altruistic, the parameter 𝛼 in the function below is equal to one and its private utility does not matter at all. If she is only driven by self-interest, 𝛼 takes the value zero and the utility to society is neglected in the utility function.
1. 𝑈𝑃𝑂𝐿 = 𝛼 𝑈𝑆𝑂𝐶�𝑂𝐶𝑅𝑒𝑓𝑜𝑟𝑚,𝑇𝐶𝑅𝑒𝑓𝑜𝑟𝑚�+ (1 − 𝛼)𝑈𝑃𝑅𝐼𝑉
The specific benefits to society of a reform, 𝑈𝑆𝑂𝐶 , vary from case to case and are often hard to quantify. However, from a qualitative perspective it is possible to determine influencing factors that influence the gain in utility of structural changes. These factors can be categorized on their effect on the opportunity and the transaction cost of a reform. The opportunity cost is defined as the cost to society if a reform is not carried out. It describes therefore the costs associated to foregone gains that the society will miss if it does not implement the reform. Hence, according to Saleth and Dinar (2004) they are the “net social costs of the status quo”. The higher the gains of a reform, the higher will be the opportunity cost in the case that the reform is not carried out. The transaction cost on the other hand is the cost of changing the institutional environment. The more efficient the political system, the lower will be the transaction costs. This implies that there is a consensus in society on the reform policies and no interest group can block the initiative for a long period. Therefore, the net social gain of a reform is the absolute value of the difference between the opportunity cost and the transaction cost of a reform. Examples of factors that can influence both, the opportunity and the transaction costs are discussed in the next subsection.
In a similar way it is possible to identify factors that influence the private utility, 𝑈𝑃𝑅𝐼𝑉, of the politician. As mentioned before, the politician can extract monetary and non-monetary benefits from the engagement for a sector reform, so-called ´ego rents´. To which extent a politician can extract these rents depends to a large extent on the interests of the stakeholders in the reform process, named lobby groups in the following.
2. 𝑈𝑃𝑅𝐼𝑉 = 𝐸𝑔𝑜𝑅𝑒𝑛𝑡𝑠 (𝑈𝐿𝑜𝑏𝑏𝑦 �𝑂𝐶𝐿𝑜𝑏𝑏𝑦,𝑇𝐶𝐿𝑜𝑏𝑏𝑦�)
If the utility of a specific lobby group, 𝑈𝐿𝑜𝑏𝑏𝑦, is affected by a reform, the group has an interest to interfere in the decision process. More precisely, it means that the group tries to influence the politician directly in its decision. The politician will only take the lobby group into account if it affects its ego rents. This effect on the politicians’ utility can be either positive or negative. If the lobby exerts pressure and threatens the politician with public resistance or defamation, the ego rents will be negatively affected. On the other hand, the group can also try to win the attention of the politician by supporting her or her party financially or promoting her popularity in another way. How far this influence is tolerated and permitted depends on the respective political culture and legal system of the specific country where the reform is carried out. Besides the constraints set by society, the extent to which the utility of a group is affected by the reform is crucial when determining to which degree it will exert influence on the politician. If for instance high profits are at stake for private water companies, we can imagine that the companies will use a considerable amount of resources to ´convince´ the politician. Thus, the opportunity cost, i.e. the net private cost of not carrying out the reform for a lobby group determines the degree of mobilising resources. In the equation these specific opportunity costs of a lobby group a named 𝑂𝐶𝐿𝑜𝑏𝑏𝑦. The higher 𝑂𝐶𝐿𝑜𝑏𝑏𝑦 is for a lobby group, the more effort the group will make to influence the politician in its decision. On the other hand, the transaction costs for exerting influence, 𝑇𝐶𝐿𝑜𝑏𝑏𝑦 are decisive when considering the utility of a stakeholder. For instance, a privatisation of the water and sanitation supply might

11
decrease the utility of each member of society slightly. But if the cost of organizing is high, due to the big quantity of persons affected, the net private gain of lobbying might be overall negative, because the transaction cost of getting organised is higher than the opportunity cost. Hence, a situation can arise where the utility to society of a reform is negative, but it is carried out nevertheless because the transaction costs of lobbying against the reform are much higher for the society than the transaction costs for the respective companies.
Plugging in the private utility function of the politician in her overall utility function yields
3. 𝑈𝑃𝑂𝐿 = 𝛼 𝑈𝑆𝑂𝐶�𝑂𝐶𝑅𝑒𝑓𝑜𝑟𝑚,𝑇𝐶𝑅𝑒𝑓𝑜𝑟𝑚�+ (1 − 𝛼) 𝐸𝑔𝑜𝑅𝑒𝑛𝑡𝑠 (𝑈𝐿𝑜𝑏𝑏𝑦�𝑂𝐶𝐿𝑜𝑏𝑏𝑦𝑇𝐶𝐿𝑜𝑏𝑏𝑦�)
This function is used in the following to explain the behaviour of politicians in a reform process. We start by analysing examples from different countries before focusing on the case of Peru.
2.4. Examples of water sector regulation and reforms In their approach described above, Saleth and Dinar (2004) distinguish between endogenous and exogenous factors influencing water sector reforms. Even though it is theoretically interesting to separate factors in these categories, for a practical analysis it is not very reasonable because it is hard to clearly determine which factors are outside the water sector and the factors are interrelated with each other, as the authors note as well. Therefore, I will disregard this distinction in the following analysis. In addition, Saleth and Dinar (2004) see the factors only as drivers for reforms but do not consider the fact that factors can also constitute hurdles to reforms in specific situation. For instance donor pressure can trigger a reform process but at the same time it can also lead to strong opposition in the public as it is seen as foreign interference in national issues. Thus, in the following examination of different experiences explaining factors can have a positive as well as a negative influence on the reform process. An overview of the main explanatory factors is given in table 1 whereas the following paragraph gives a verbal description of the parameters. The classification of factors in the table as well as the verbal description is along the lines of Saleth and Dinar (2004) but includes several amplifications. Besides, an overview of the main stakeholder in the sector is given, if there is obtainable information.
In her analysis of the Australian water sector reforms taken place in the mid-1990s McKay (2005) shows that the main factors in favour of the implementation have been problems within the water sector and a general reform of the political system. Droughts and an unsustainable use of the disposable water resources led to water scarcity and salinity problems which increased the pressure on political actors to change the existing system of water allocation. This increased the opportunity costs for society of not acting. At the same time, a reform of the political system gave more power to the federal level. This provided the basis for fundamental reforms also in the water sector and decreased the transaction costs. Besides these factors, it is important to mention that the transaction costs of the reform were relatively low compared to other countries, as Australia had already well- functioning institutions and a legal framework of water rights distribution in the sector.
In the case of Chile, most of the reforms which shape the water sector until today were carried out after the introduction of the new constitution in 1980, as Hearne and Donoso (2005) describe it. The following Water Code from 1981 that lays out the regulation of the water sector emerged under a strong ideological influence of neoliberal ideas of the ruling military government. Hence, the focus on property rights protection, market forces and private sector investments in the Water Code reflect

12
this way of thinking. However, it is important to note that the reforms in Chile took place under an authoritarian regime where the politicians did not have to take into account the reactions of the public or an electorate when implementing the reforms. Therefore, the transaction costs of implementing the reform were exceptionally low. Lobby groups could only interfere in the process to a very limited extent as the media was censured and the Civil Society excluded from the decision-making process. This fact makes Chile somehow a special case and difficult to transfer the results to other countries.
An interesting case are the attempts of water sector reform since the mid-1990s in Ghana described by Whitfield (2006). Through an economic crisis in the country starting in the late 1970s, also the water sector was strongly affected. As a consequence, necessary investments were not undertaken and skilled workers could not be longer employed leading to a severe deterioration of the water supply infrastructure. Hence, the opportunity costs of changing the prevalent structure were high. With the support of the World Bank, concepts to reform the water sector were elaborated beginning in 1994 to achieve privatisation of the water companies. However, when the bidding process for concessions started in the year 2000, an NGO started to campaign against the privatisation arguing that it would lead to price increases especially for the poor and criticising the intervention of foreign actors like the World Bank. The World Bank made no attempts to encounter the critique publicly and showed no sensitivity for the negative impact their statements had in the media. This decreased the prestige of politicians promoting the reform and decreased there private utility as a consequence. Hence, the deficient communication and the lack of a public defence of the advantages of the reform programme can be seen as an important hurdle for the implementation of water sector reforms in Ghana.
A description of the water sector of Honduras in the 1990s is given by Strand (1998). He identifies the main driving factors for a sector reform as international donor organizations like the World Bank and the Inter-American Development Bank which advised the government to pursue policies to improve the situation in the sector. This expertise decreased the transaction cost of engaging in a reform process. The main problem of the sector at the time of the study was the low recovery and the under-pricing of water leading to a situation where the state-owned water suppliers had to be constantly subsidised by the central government. As a consequence, no funds for necessary investments in the water infrastructure and the maintenance were available. Even though the opportunities for welfare increments for overall society seem large no reforms had been carried out until the point of the study. The author explains this situation with the strong opposition of the union of water sector workers which feared to lose their privileges in the case of a reform. Thus, the high opportunity costs of this specific lobby group on the one hand and the low transaction cost to organise on the other hand made it a very powerful stakeholder blocking the reform. Furthermore, households who already have access to piped water would have to bear a part of the cost of investment for new connections without profiting of it. Thus, the political costs for politicians to promote water sector reforms seem to be a hurdle for the implementation of policy changes in the sector.
In Delhi, the capital of India a water sector reform was worked out starting in 2004. Following the description of Singh (2008) the main problems leading to awareness that a structural reform was necessary were under-pricing of water and inefficient management of the supply companies. The too low prices for water could not cover the operations and maintenance costs. This did not only cause deficits of the supply companies, but also impeded necessary investments to connect new, often
13
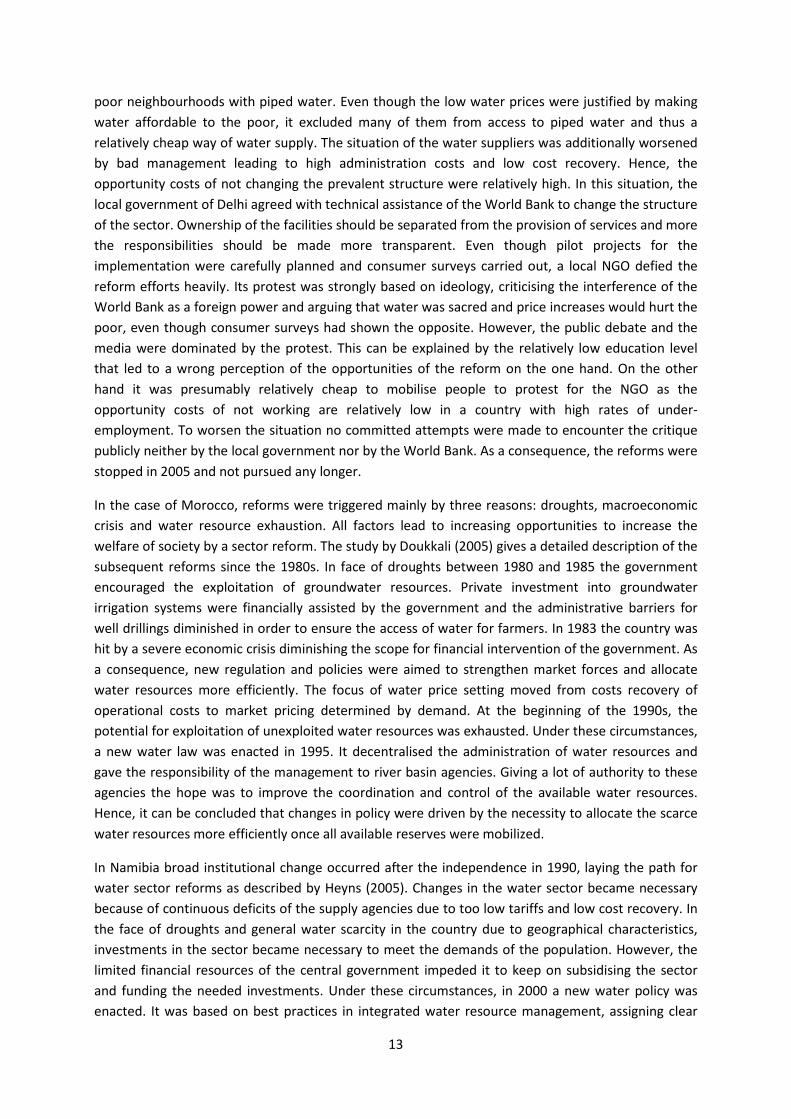
poor neighbourhoods with piped water. Even though the low water prices were justified by making water affordable to the poor, it excluded many of them from access to piped water and thus a relatively cheap way of water supply. The situation of the water suppliers was additionally worsened by bad management leading to high administration costs and low cost recovery. Hence, the opportunity costs of not changing the prevalent structure were relatively high. In this situation, the local government of Delhi agreed with technical assistance of the World Bank to change the structure of the sector. Ownership of the facilities should be separated from the provision of services and more the responsibilities should be made more transparent. Even though pilot projects for the implementation were carefully planned and consumer surveys carried out, a local NGO defied the reform efforts heavily. Its protest was strongly based on ideology, criticising the interference of the World Bank as a foreign power and arguing that water was sacred and price increases would hurt the poor, even though consumer surveys had shown the opposite. However, the public debate and the media were dominated by the protest. This can be explained by the relatively low education level that led to a wrong perception of the opportunities of the reform on the one hand. On the other hand it was presumably relatively cheap to mobilise people to protest for the NGO as the opportunity costs of not working are relatively low in a country with high rates of under-employment. To worsen the situation no committed attempts were made to encounter the critique publicly neither by the local government nor by the World Bank. As a consequence, the reforms were stopped in 2005 and not pursued any longer.
In the case of Morocco, reforms were triggered mainly by three reasons: droughts, macroeconomic crisis and water resource exhaustion. All factors lead to increasing opportunities to increase the welfare of society by a sector reform. The study by Doukkali (2005) gives a detailed description of the subsequent reforms since the 1980s. In face of droughts between 1980 and 1985 the government encouraged the exploitation of groundwater resources. Private investment into groundwater irrigation systems were financially assisted by the government and the administrative barriers for well drillings diminished in order to ensure the access of water for farmers. In 1983 the country was hit by a severe economic crisis diminishing the scope for financial intervention of the government. As a consequence, new regulation and policies were aimed to strengthen market forces and allocate water resources more efficiently. The focus of water price setting moved from costs recovery of operational costs to market pricing determined by demand. At the beginning of the 1990s, the potential for exploitation of unexploited water resources was exhausted. Under these circumstances, a new water law was enacted in 1995. It decentralised the administration of water resources and gave the responsibility of the management to river basin agencies. Giving a lot of authority to these agencies the hope was to improve the coordination and control of the available water resources. Hence, it can be concluded that changes in policy were driven by the necessity to allocate the scarce water resources more efficiently once all available reserves were mobilized.
In Namibia broad institutional change occurred after the independence in 1990, laying the path for water sector reforms as described by Heyns (2005). Changes in the water sector became necessary because of continuous deficits of the supply agencies due to too low tariffs and low cost recovery. In the face of droughts and general water scarcity in the country due to geographical characteristics, investments in the sector became necessary to meet the demands of the population. However, the limited financial resources of the central government impeded it to keep on subsidising the sector and funding the needed investments. Under these circumstances, in 2000 a new water policy was enacted. It was based on best practices in integrated water resource management, assigning clear

14
responsibilities to the institutions, decentralizing the power and commercialising water rights in the agricultural sector. Even though the reform was well designed, the implementation did not fulfil its expectations, due to sufficient trained personal to implement the policy both on a technical and institutional level.
Similarly to the case of Namibia, water sector reforms in South Africa in the 1990s took place after the end of the apartheid regime and the broad adjustment of institutions to meet the needs of the majority of the population. In 1994 a new constitution was enacted and free elections took place giving all South Africans the right to vote for the first time. At the same time, water demand increased while some parts of the country were affected by droughts, making the need for reform apparent. During the reform process, the responsibility of water resources was decentralized and the introduction of farmer-operated irrigation systems was encouraged. Furthermore, the institutional conditions were adjusted enabling the trade of water resources.
Both the Namibian and the South African experience can be well analysed from the perspective of the transaction cost theory. In both cases the overall political transformation process, changing the ruling power structure and questioning old behavioural attitudes lowered the transaction costs for sector reforms. At the same time, the welfare increasing opportunities of policy changes increased because the needs of before marginalised parts of the population were taken into account. Thus, the opportunity costs outweighed the transaction costs and triggered the reforms in the water sector.
Table 1: Cross-country analysis of influencing factors of water sector reforms
Influencing Factors
Australia Chile Ghana Honduras India Morocco Namibia South Africa
Sri Lanka
Water scarcity/ conflicts
X X X X
Financial crisis in the water sector
X X X X X X
Macroeconomic crisis
X X X
Political reforms X X X X
Donor Organizations
X X X X
Influence of Ideology
X X X X
Human resources X X
Communication X X X
Own illustration following (Saleth and Dinar, 2005)
The more gradual reform process taken place in Sri Lanka is illustrated by Samad (2005). In the agricultural sector, water tariffs were introduced in 1984 in order to recover funds and improve the maintenance and operation of the irrigation infrastructure. The reform was mainly due to an

15
economic crisis making it impossible for the government to subsidise the water sector any longer. The adoption started successfully with cost recovery rates up to 90% but because the funds were not allocated as promised and the farmers could not notice an improvement of the infrastructure, the recovery rate declined in the following years. Under these circumstances and the comprehension that local institutions were too weak to administer the funds efficiently, the government changed its strategy and gave the farmers the possibility to take over the responsibility of the irrigation systems. In return, they did not have to pay any longer fees for the maintenance. The new system was introduced with technical support of different international aid organizations but the results were not entirely satisfactory. For political reasons, the government continued to subsidise the water infrastructure and the self-organization of farmers to balance the costs and profits of investments did not function very well. In 1993 new attempts to reform the sector were made with political assistance of the Asian Development Bank and the American aid organization USAID. This assistance decreased the transaction cost for the government because the consulting service was provided for free. The consultations resulted in a draft of a new water law in the year 2000, among others creating independent water authorities and decentralizing the responsibilities of the water management. Although a variety of stakeholders including NGOs were included in the decision process, the proposed law was heavily criticised in the public media. The government was accused to implementing the reform from the top without considering the concerns of the citizens. The failure to translate political documents into the local languages and insensitivity to recognize the importance of the topic for the population were seen as proofs that the government was more interested to satisfy the donors than the own citizens. As a consequence of the public outcry the government did not continue its effort to enact the law and withdrew the proposal.
3. Background In the following, this study will focus on possibilities of water and sanitation sector reform in Peru and an in-depth analysis of the political situation in the country. Before delving into details, background information on the structure of the water sector and the political system is presented.
3.1. The structure of the urban water sector Politically, Peru is divided in 24 departments. These departments are subdivided in provinces and on the municipal level in districts. From a total of 1833 districts, 314 are supplied with water by one of the 50 urban water supply companies (WSC). Altogether, these companies are responsible for the supply of water and waste water infrastructure of 18.4 million people, which accounts for 62% of the total Peruvian population. Since 1994, the responsible regulatory authority for all these 50 WSC is the National Superintendency of Sanitation Services (SUNASS). The remaining rural districts and its people are supplied with water from small rural suppliers that do not underlie any regulation (SUNASS, 2011a).
The urban water supply companies are owned by the local governments of the municipalities where they operate with two important exceptions: The first one is the water supply company of Lima, SEDAPAL that is owned by the central government. It is by far the biggest WSC and accounts with more than one million connections for 43% of all the clients supplied by the urban WSC. The second exception is the water company in the department of Tumbes in the north of the country that has been privatized and operates under a concession contract (SUNASS, 2011a). The regulator SUNASS is in charge to calculate a tariff structure for a five year period that incorporates the operational costs

16
and expenses for investments. Additionally, management and performance objectives are set that should be accomplished under the tariff scheme. To improve the infrastructure, the proposed tariff structure normally schedules tariffs increases. However, the water supply companies have been free to adopt the proposed tariffs and its increments. The decision-making body is the meeting of shareholders where the mayors of the municipalities that own the company come together. This has led to a situation where in many cases the water companies did not adjust their tariffs as proposed by SUNASS (SUNASS, 2006b). SUNASS on its part depends on the council of the ministers which constitutes the executive power on the national level. This council, where all national ministers are represented, appoints the commission that elects the president of SUNASS for a five year term (Bauer and Villaverde, 2011).
The tariffs of the WSC are designed as increasing block tariffs (IBT), i.e., the price charged per cubic meter of water increases at certain thresholds. Thus, the first units of consumption are the cheapest and the price increases with consumption. The idea is to cross- subsidise poor consumers by charging higher prices per cubic meter of water for the larger quantities consumed, which is supposed to be associated with higher capacity to pay. However, the subsidies are not well targeted to the poor as all consumers benefit from the low initial tariff. Moreover, it is not guaranteed that wealth is necessarily correlated with water consumption as it does not take into account the number of family members and the fact that poor households often share one water connection (SUNASS, 2006b). This so-called error of exclusion is high in many developing countries. For Peru, Komives et al. (2006) estimate it to be 60%. This means that 60% of the entitled consumers do not benefit from the subsidy. As the authors point out, one of the main reasons is the lack of metering in poor neighbourhoods. In Peru, 45% of the households did not have a meter in 2010 (SUNASS, 2011b). For these households the amount of the monthly invoice is assigned based on estimates. This process offsets the cross-subsidies for poor consumer groups. Hence, Komives at al. (2006) conclude that IBTs do not fulfil its redistributive objective. On the contrary, the authors show that IBTs are in reality regressive making the poor to pay more for water than rich households as a proportion of the income.
In comparison with the most efficient water companies in Latin America, the level of cost coverage through tariff payments is much lower for the Peruvian companies. The ratio of the average water tariff divided by the average provision cost is around 70% lower for the Peruvian WSC compared to the most efficient companies (SUNASS, 2006a). This leaves insufficient financial resources for investments that are necessary to improve the service quality and to increase the number of water and wastewater connections (SUNASS, 2006b). In the catchment area of the urban WSC, on average 86% of the population had access to piped water in 2007, but only 77% had sewerage connections. Besides, less than 30% of the wastewater received any treatment before it was discharged in the environment (Pastor and Pérez, 2009). To close this gap and provide all urban households with a piped water and wastewater connection, investments of 3.5 billion US- Dollars are necessary until the year 2021 (SUNASS, 2012). Hence, it can be said that substantial investments in the water sector are necessary to improve and extend the water infrastructure to a satisfactory level. Therefore, the average tariffs should be high enough to cover operational costs, investments, taxes and remuneration for the inverted capital.
The development of different average water prices is depicted in the graph below. The upper grey line is the average price of Aguas Andinas, the water supplier of Santiago de Chile. It shares a similar geographic location as Lima and its price development is therefore suitable to compare it with

17
SEDAPAL (shown by the light blue line). We can see that the price level in the Chilean capital has been higher but both tariffs tended to increase over the last decade. In contrast, the remaining 49 Peruvian urban water companies do not indicate an upward water price trend. The real water tariff decreases gradually between 2003 and 2007 before increasing slightly again. This decrease can be explained by relatively high inflation during this period that was not incorporated in the nominal tariff structure. The graphical illustration does not allow for a deduction of the adequate water price for the 49 water companies. But with the investments in mind that are necessary to achieve improvements in the sector, it is reasonable to conclude that the actual price development is not suitable to achieve financial sustainability.
Figure 1: Development of Average Water Prices
Note: The average water price is the real price in year 2000 Peruvian Sol Source: Aguas Andinas (2012), SUNASS
Even though the decision on water price-setting should be based on economic foundations, there are several possibilities for political actors to influence the determination of charges in the Peruvian water sector. As the companies are property of the respective municipalities, the mayors normally are part of their board of management and can influence their economic decisions. Thus, they can directly exert pressure on the chief executive to refrain from price increments. On the other side the determination of price increases by the regulator, which should be based on economic principles, can be altered through lobbying of the central government. However, the latter case of interference in the decision-making process of SUNASS seems to be a specific problem of the water supplier in the capital, SEDAPAL. Here, the central government is very sensitive to changes of its tariff structure, because it affects large parts of the population SUNASS (2006b). To get an idea of the political situation and its main characteristics, the next subsection gives a short overview of the political and the election system of Peru.
3.2. The political system of Peru In Peru, regional elections take place every four years. On this occasion, regional, provincial and district councils are elected. The system is majoritarian giving the half plus one seat in the respective council to the winning party or list. This majority gives the winning party the possibility to appoint the mayor (ONPE, 2007). For individuals between 18 and 70 years old, voting is mandatory. In the case of
0,50
1,00
1,50
2,00
2,50
3,00
2000 2001 2002 2003 2004 2005 2006 2007 2008 2009 2010Average 49 Water Companies (Peru)SEDAPAL (Lima)Aguas Andinas (Santiago de Chile)

18
non-assistance, a fee has to be paid of approximately 20 US- Dollar (Ley No. 28859, 2006). This legislation led to an increase of the turnout in the last decades from around 75% in the 1990s to approximately 82% in the time period studied (Tanaka and Rojas, 2010).
Since the 1990s, new political parties have been founded in a climate of strong distrust into politics and its established actors. These parties can be characterized by the lack of clear ideological positions. Instead, they have focused more on specific topics such as decentralisation or combating corruption. Parties have been created mainly to promote a certain charismatic leader at a specific election and not to establish long-term relations with the electorate. Hence, for the period of this study it is not possible to define a stable party system with clear positions in an ideological left – right spectrum. In addition to these parties, provincial movements exist that compete on sub-national elections. Their degree of organization is minor and their volatility over time is often higher compared to the more established political parties. On the district level, also local political movements can be found. These organisations are normally only created for the period of the election campaign with the objective to promote a specific candidate (Vergara, 2011). Thus, they cannot compete on regional and provincial elections due to the spatial limitation of their political activity. To sum up, the presence of heterogeneous organizations complicates the coordination in the political decision-taking process due to the fragmentation of the representatives in power. Furthermore, the short periods for which especially regional and local political movements are created can impede the implementation of long term policies that are necessary in many areas such as the water sector (ONPE, 2010).
4. Qualitative Analysis In the following, a qualitative analysis of the main barriers of water sector reform and the under-pricing of water and sanitation services is carried out. The analysis starts with an overview of the methodological approach before presenting the results of the analysis.
4.1. Methodology The aim of the qualitative analysis is to identify the main actors in the Peruvian urban water and sanitation sector and explain their political behaviour. A focus of the study is on the question why necessary sector reforms have not been carried out. To be able to examine this latter question, it is required to start by identifying the biggest problems and challenges in the Peruvian water sector.
In order to achieve this goal, qualitative expert interviews were carried out. The interviews took place during a fieldtrip in the period from March until May 2012 in Peru. The interviews were semi-structured following an outline of guiding questions depicted in the appendix A1. Depending on the interview partner, supplementary questions were asked to clarify an answer or profit from the special knowledge of the interview partner. The duration of the interviews varied between 20 and 70 minutes, depending on time constraints and the willingness to answer of the respective person interviewed. Prior to the field trip, a first draft of the questionnaire was designed and adapted in detail during the first week of the fieldtrip. At the same time, potential interview partners were contacted via email. Individuals who seemed suitable were either already known from previous field visits or were acquired through so-called ´snowballing´. The method is described in detail by Reuber and Pfaffenbach (2005) and relies on personal recommendations of potential interview partners during the first interviews.

19
The selection of interview partners followed the idea of Gläser and Laudel (2009) who state four criteria a person must fulfil to count as an adequate expert. The criteria are i) that the individual has relevant information, ii) that the person is likely to provide detailed information, iii) that the person is willing to give the information and iv) that the individual is available for an interview. According to these criteria, potential interview partners were selected and contacted. Due to existing relations before the field trip and support of the water programme PROAGUA of the German development agency, almost all persons contacted were available for an interview. Therefore we can exclude a selection bias where only individuals with certain preferences were willing to attend an interview. A list of the organisations from which members were interviewed is given in appendix A2. As can be seen, almost all organisations have either links to the national or foreign governments, like the regulator SUNASS or the German development bank KfW. The only non-governmental interview partners came from the University of the Pacific and the law office Carriles and Vidal. However, it should be noted that the first interview partner is the former president of SUNASS and the law office did consulting work for PROAGUA programme in the past. Thus, these two interview partners should not be seen as completely impartial either. Contacting more independent organisations resulted fruitless, either because such organisations do not exist or established stakeholders that were asked for contact information had no established links. Therefore, it should be kept in mind that the selection of interview partners followed certain constraints when studying the results of the next subsection.
All interviews were audio recorded and digital sound files produced. After the interview a detailed record was noted down, containing all essential statements that were made during the talk. These records serve as the base for the following analysis and are available from the authors on request.
4.2. Actors, Challenges and Necessary Reforms This section starts by giving an overview of the main actors in the urban water and sanitation sector in the country, before naming the main problems in the sector. It is followed by a list of possible reform approaches that could lead to improvements in the sector. All the information presented is based on opinions and points of view expressed in the interviews. The respective interview number of the person who forwarded the information is mentioned at the end of each sentence in square brackets.
4.2.1. Main Actors and Stakeholders On the level of the Central Government, three institutions are decisive powers of the executive. The Ministry of Finance and Economy (MEF) is responsible for the funds that are allocated to the sector for the finance of infrastructure projects [7, 10]. Besides, it gives credit guarantees for loans by foreign lenders like the World Bank in the sector [10]. Its priority is to increase the coverage of water and sanitation access [5]. Furthermore, a focus is to improve the service quality and to manage the public funds more efficiently [5]. The administration of the funds is done by the Ministry of Housing, Construction and Sanitation (MHCS). The MHCS transfers the funds to the respective WSC and supervises its investment [4]. The funds are mainly given directly to the respective WSC in the country with the objective of improve and extend the infrastructure [10]. Besides, it issues legal norms the water companies have to comply [4]. As the MEF, its priority is to extend the coverage of piped water and improve the service quality [7]. Here, the current focus is to improve the rural water infrastructure and support the small rural water providers to get access to public funds [10]. The highest executive body is the Council of Ministers (CoM). It decides on the president of SUNASS but

20
in how far it exerts influence on the regulator is hard to say [6]. Its main objective seems to be to extend the access to water and sanitation services in the population and exert pressure on the responsible ministries to achieve these goals [6].
The regulatory authority SUNASS is responsible to determine the tariffs and decide on increments [8]. The tariff increments are written down in an Optimized Master Plan (OPM) and linked to the achievement of certain management goals that have to be fulfilled [8, 10]. The OPM also includes a plan of investments, describing which projects should be carried out and how they are financed [8]. The time horizon of the OPM is up to 30 years, whereas the tariff increments are fixed for a period of five years [2, 3, 9]. The know-how and the capacity of the regulator are good and the long-term planning has increased in the last years [1, 9]. Around 80% of the WSC have already implemented OPMs [2]. However, the views differ on the extent of power to force the implementation of the OPMs and the political influence on the decisions of the SUNASS. While some argue that with the OPM there exist no longer the possibility of political inference [2, 7] others admit at least for the case of SEDAPAL that political pressure is exerted [3, 8].
The water supplier of the capital, SEDAPAL has an exceptional position among the urban water supply companies. It is owned by the central government and therefore a member of the MHCS is in the directory of the board of the company [2]. In the last years the priority has been to increase the coverage of piped water and invest in new infrastructure projects [2]. The other urban WSC are in contrast controlled by the respective municipality and its mayor [2]. Even though tariff increases should be implemented automatically since 2006, sometimes mayors try to impede such increases for political reasons [5]. Their behaviour towards the sector is often driven by populist ideas to keep the water tariffs low, which counteracts the objective of long term planning [2, 5, 10].
International donor organisations offer mainly financial support and technical assistance to the sector [1, 5, 9]. Even though their overall impact is described as positive, in some cases a lack of coordination, especially in the rural areas is noticed [1, 8, 10]. Besides, some actors are driven by their own interests and views and do not consider sufficiently the sustainability of their investments [1, 8]. This is especially the case for small NGOs that do not coordinate their work with the ministries. In contrast, private investors play only a minor role in the water sector [1]. Even though some plants operate under concession contracts and one company has been privatised, a broad engagement has not yet occurred, due to a difficult political environment [1].
Citizens have the possibility to participate on public audiences where the respective company presents its plans on infrastructure projects and tariff increases [7, 10]. In general, there are no organised NGOs that try to interfere in the urban water sector, but a general unease towards private investment is perceived in the population [9, 10]. Here, a special interest group are workers of the WSC that fear to lose their jobs in the case of privatisations [10].
4.2.2. General Problems and Challenges The key problem of the sector seems to be the political interference on various levels in the water and sanitation sector [2, 3, 4, 5, 8, 9]. On the one hand, especially local politicians interfere in the management of the water companies [4, 5]. Hence, investments are often not made on a technical foundation but on political reasoning, which impedes long term planning and development of the infrastructure [4, 5]. In some cases, funds of the companies are used for purposes that do not serve the objectives of the company [4]. Besides, the interference leads to a high rotation of managers who

21
are often replaced arbitrarily [5, 8, 9]. Thus, the personal often does not have sufficient time to acquire the necessary specific knowledge of the water sector that is indispensable for good management [9]. At the same time, management staff is not always selected based on its qualification, but on political reasoning that decreases the management performance additionally [9].
Besides, the general remuneration scheme is too low to attract well-trained personal [1, 2, 9]. This applies for both management and technical staff [2, 9]. Furthermore, the size of most of the companies is too small [1, 5, 8, 9]. Therefore, the companies have relatively high transaction costs for their operation and cannot benefit from scale effects [5, 8]. An additional problem is the bureaucratic requirements the companies have to fulfil [3, 4]. As many ministries and governmental organizations demand information and reports from the companies, this paperwork binds many capacities. Especially small companies are affected severely by this as they do not have sufficient human resources to deal with the requests [4]. Besides, the norms the WSC has to comply to are designed for governmental organizations and not for companies. As a consequence, the WSC often react with a delay to changes in their business environment [3].
The political interference and the low capacities of the personal affect also the implementation of investments [4, 5, 9]. Therefore, investments have often been inefficient, especially in the case of the programme “Agua para todos” [4]. Even if new plants are built, it often lacks of a long-term financing to secure the operation and well-trained staff to run the plants [4, 5].
In the case of SEDAPAL, some difficulties differ from the challenges of other WSC in the rest of the country. For instance, the size of the water supplier in the capital seems to be too big rather than too small [1]. This impedes an adaption of the business and to provide an adequate service when the environment changes [1]. Besides, the political pressure on the management is apparently exerted directly from the central government [5]. This leads to similar management problems as described above, especially with respect to inefficient investments and the lack of continuity in the management structure [4, 5].
The general opinion on the level of the water tariffs differs between the actors in the sector. While representatives of the regulator confirm that the tariffs are high enough to cover the maintenance costs and are sustainable for companies that have a OPM, other interview partners disagree [2, 3]. They argue that the tariffs are lower than in any other South American country and that the general level is too low especially to cover investment costs [1, 4, 5, 7]. The regulator confirms that on average 60% of the investment capital is donated and the cost is therefore not included in the tariff [2]. However, this can lead to problems where financial resources are promised in order to keep the tariff down but are not provided in time to execute the planned investments [5].
With respect to the tariff structure, most actors agree that the prevalent IBT structure is inadequate to subsidise the poor [1, 3, 6, 8, 8, 10]. A difficulty is that the subsidies of low consumption quantities are not well-targeted towards the poor and the error of exclusion and inclusion is high [1, 3, 8, 10].
Besides, many actors agree that people would be willing to accept price increases in non-poor areas when the service quality improves at the same time [1, 2, 3, 4, 7, 9]. This would require good communication and transparent information how the additional funds are used, as the general distrust of mismanagement is high [5, 10]. The prevalent information method is the use of public audiences where representatives of the respective water company and SUNASS present their plans

22
on investments and tariff increments. These audiences are criticised by some, as they have only informative character and it is not binding to adjust the plans according to the feedback of the audience [4]. Besides, the representativeness of the audiences can be doubt, as the attendance is voluntary. If only certain groups are present and express their points of view, it can bias the decision-makers [5]. Also, it is not certain that the information is spread by this information policy [5].
In the case of SEDAPAL, the tariff increases have been too low in the last years to guarantee the financial sustainability of the investments made [5, 6]. In contrast to the regulation of the other water company, there seems to be political interference on the regulator to incorporate values in the tariff formula that impede adequate tariff increments [5, 6, 8].
4.2.3. Reform suggestions In view of the challenges described above, the following analysis focuses on four necessary reforms that can be deduced from the statements made during the interviews. Approaches to these reforms are outlined below and are based on opinions of the interview partners. On some issues there seems to be consensus how reforms should be carried out whereas the views on the right approach differ on others.
Many stakeholders agree on the necessity to merge all water companies in each region to one big company. The idea of such a regionalization is to limit the influence of local politicians and profit from scale effects [1, 2, 4, 5, 8]. As some politicians and managers will lose their power when companies are merged, it is necessary to offer incentives to counteract the resistance of these groups [4, 5, 8]. The MCHS could take an active role in this task, as it is the responsible institution to allocate the funds to the sector [1].
Additionally, it is necessary to reform the remuneration scheme and let the water companies decide how much they pay to their personal [1, 3, 9]. This is an example where the bureaucratic regulation could be limited by the responsible MEF [2]. If companies are in general more independent in their decisions, they could also react faster to changes in their business environment [3]. In that case the water companies would also be responsible for their performance and liable to their consumers [9]. If there is obvious miss-management at a company and its management are not able to fulfil certain standards, it is necessary to set rules how a central institution can intervene [7, 10].
Besides, some stakeholders would prefer more private investments in the sector with the possibility to assign concession contracts to private companies [1, 2, 3]. Until now, the political circumstances impede a broader participation of private firms in the water sector [3]. Here, the MHCS could promote the engagement of the private sector, using its investment agency to facilitate the transactions [1].
With respect to the water tariff design, stakeholders in the sector agree that the current system of increasing blocks is not well-targeted to the poor as described above. However, there is no consensus on the way a better tariff system should be structured. One possibility is to classify the districts according to their wealth levels and subsidise then the water tariff based on the average affordability of a district [1]. Another way is to use statistical data bases to assess the wealth level of each household, making a more detailed subsidy of the water bill possible [3, 10]. A third possibility is to refrain from cross-subsidising water tariffs. Instead people in need should receive general welfare grants that could increase the income of poor households and give them the possibility to pay for water [6, 8].

23
Except of the first reform suggestion of regionalising the water companies, the latter three reforms are valid for both the 49 water companies distributed in the country and SEDAPAL, the water company responsible for the supply of the capital. After having described the challenges of the water sector and approach of reforms suggested by the stakeholders, the next subsection examines why reforms are not carried out from a political economy perspective.
4.3. Political Economic Analysis The following analysis is based on the theoretical framework developed above and is carried out to examine what impedes advances in the sector and why necessary reforms are not carried out. In equation (3), the utility function of a politician is given. It consists of a trade-off between the utility a reform will bring to society and private benefits for the politician of promoting a reform. Both components depend on different opportunity and transaction costs as discussed in detail in subsection 2.3.
A reform that was mentioned by almost all stakeholders to be necessary is a regionalization of the water companies. As described above, the opportunity cost for society of not executing such a reform seem to be high. Especially the political interference by local politicians seems to impede that management and investment decisions are made with the necessary long-term perspective. Besides, the inadequate selection of human resources and the fast rotation of managers decrease the performance additionally. A further positive effect of a regionalization could be that the position of SUNASS would be strengthened, because local politicians lose their power to disturb the implementation of higher tariffs. Also, companies could benefit from scale effects if companies were merged to bigger entities. In view of the benefits of such a reform, the transaction costs seem to be rather small. As most stakeholders on the central level agree on the necessity of such a reform, the process to issue concepts of an implementation of the regionalization could be executed during a relatively short time span without a long process of opinion formation. Besides, the responsible MHCS has the financial resources and power to trigger such a reform process and set the right incentives to the water companies to merge. Moreover, the executive level could count on support by international actors when preparing such a reform, reducing the transaction costs additionally. Thus, the first component in the utility function of a politician, 𝑈𝑆𝑜𝑐 , i.e. the net social gain of a reform, can be estimated to be positive when water companies are merged to bigger entities. However, as none of the interview partners of the ministries mentioned a special need of such a reform, it seems likely that the executive decision-makers have a lack of awareness of the benefits of a regionalization.
The second term on the right hand side of equation (3) shows that the influencing factors on the private utility of a politician are gains from lobby groups. The biggest group affected by the reform is the population in the respective region that would benefit in the middle and long run from a better infrastructure and better service. Though, the transaction costs to get informed about such a complex reform and to get organized can be assumed to be relatively high and even exceed the benefits for each individual. This could explain why there has not been any mobilisation and pressure on politicians from this side to carry out such a reform. On the other hand, municipal mayors benefit from the status quo as they have power on the WSC. Thus, a reform that withdraws or decreases their influence on the companies can be seen as a decrease of their utility. In contrast, the transaction costs to oppose the changes can be seen as relatively low for local politicians. They often dispose of a political organisation that is able to mobilise people and create sentiments in the local

24
population against structural changes. Hence, it is likely that it is worth for politicians on the municipal level to fight against a reform if they fear to lose power. A similar behaviour can be expected of employees of the water companies if they fear to lose their relatively secure jobs. If they are organized in unions, the costs to organise opposition against a reform is low. An additional advantage of both, local politicians and workers is the fact that it is easier for them to influence the attitude of the local population than for the central government. This could restrain politicians from the central government to promote a regionalisation reform as they fear resistance from local groups. Another reform mentioned is the deregulation of the remuneration of water company employees. The opportunities of getting better personal employed in the sector are big, but it would probably only pay-off in the medium and long term, as it needs time until the staff is recruited and the effect is noticed in the performance. In contrast, in the short term higher salaries will lead to an increase of the expenditures of the companies. To finance these extra costs, tariff increases might be necessary. This might be a reason why decision makers refrain from such a deregulation, even though the transaction costs are probably low, as the MEF could design a new remuneration scheme easily. Thus, the overall change in utility for society can be expected to be positive even though it might take time until the benefits materialise. With respect to interest groups influencing the private utility of a politician with their actions, no organised group would probably resist a reform of the remuneration scheme. However, a possible increase of water tariffs might damage the image and therefore decrease the utility of politicians on the central level.
Furthermore, a facilitation and support of private sector engagement was mentioned by some stakeholders. For an estimation of the benefits of such an engagement, experiences from other countries and the few incidences within the country should be evaluated carefully. Under the condition that positive opportunities of more private sector engagement exist, it should be considered. The political transaction costs to promote such an engagement seem to be low, because an agency for such tasks is already operating under the supervision of the MHCS. The consequences for the private utility of politicians are not clear. Sentiments against private investments in the population could be used to organise resistance by workers who fear to lose their job and are relatively good organised. Hence, every private engagement should include negotiations with the workers of the companies to guarantee their support and an information campaign that counteracts resentments in the population.
A reform of the tariff structure changing the current increasing block design might bear opportunities to fulfil distributive objectives. The aim of such a reform would be that the subsidy reaches the poor with more precision than the current system that fails in doing so. However, the transaction costs to implement a reform are probably high as well, because currently no consensus of a good policy design exists. As can be seen above, views among stakeholders differ which could delay the decision-making process. With respect to the private utility, a new subsidy scheme that discriminates between the wealth levels of individuals and makes neighbours pay different tariffs can lead to disconcertment and envy. Especially water companies are therefore opposed to such a change in the tariff structure and will lobby against it.
4.4. Results From the previous analysis of hurdles for institutional reforms in the Peruvian urban water sector it is possible to deduce some recommendations that should be kept in mind when implementing a specific policy.
25
With respect to a reform that regionalises the water companies, the possibility for a utility gain for society seems to be given. Here, it is important to raise the awareness of the responsible decision-makers and sensitise them for the necessity of such a reform. On the other hand, lobby groups have to be included in the reform process in order to avoid resistance on the local level that could damage the image of politicians of the central level. Especially the points of view of municipal mayors in power of the WSC and unions of the workers should be taken into account. If incentives are set right and the plans of a reform are communicated well, it could lower the resistance on the local level.
The reform of the remuneration scheme could improve the performance of the sector and bears therefore possibilities to increase the utility of the affected population. Again, a problem can be the lack of awareness of the necessity of the executive policy-makers. This lack combined with the short term costs and possible tariff increases that could decrease their private utility could be the reason why they shy away from such a reform. Here, the responsible politicians have to be sensitised and if a reform is carried out, information has to be made available for the population in order to guarantee a transparent process.
If private investments prove to be beneficial for the service and infrastructure quality in the sector, they should be promoted in certain areas. When allowing firms to enter the sector, it is important to give guarantees to employees of the water companies that they will not lose their jobs. Additionally, detailed information about the benefits of the private engagement and transparent concession contracts are essential in order to counteract negative sentiments in the population against the private sector. Here, a well-planned communication strategy is needed to convey the information to the population. This could prevent the responsible politicians from losing their prestige and credibility when promoting such a reform.
When examining the tariff structure, it is evident that a reform is needed to implement a tariff system that supports poor citizens with more precision. However, the transaction costs of a new norm can be quiet high as no consensus on the right approach prevails among the actors in the sector. Additionally, a reform with a heterogeneous tariff might lead to protests that could make politicians refrain from such a policy. Therefore, regardless of the actual design of a new tariff structure, it should be tested in pilot regions before implementing it on a broad scale in order to gain experience and anticipate shortcomings. This could help to minimise ex post opposition to a new structure, so that the private utility of the responsible politicians is not affected negatively.
When regarding the main goals of the main political actors in the sector, the MHCS and the MEF, it seems that they focus on the extension of the infrastructure to give more people access to piped water, especially in the rural area. Although such short-term policies are definitely necessary, the executive institutions should be encouraged to get also engaged in more complex changes in the sector, like the reform suggestions discussed above. Especially because the pay-off of such policies only materialises in the long run and is therefore less evident, politicians should be sensitised to the benefits of such reforms.

26
5. Quantitative Analysis In the following, two different data sets are used to search for empirical evidence for opportunistic behaviour on the local level of the urban water sector. The approach chosen is quantitative analysis that differs from the interview based analysis of the previous section.
5.1. Panel Study In this first part I will use a panel data set of price and performance changes of the WSC to explore if differences between the companies can be explained by the theory of political business cycles. I will start by describing the main features of the model and relevant previous research before adapting the theory to the Peruvian environment.
5.1.1. Political Business Cycles and Partisan Effects One of the first to study the impact of elections on economic decision was Nordhaus (1975). He focuses in his analysis on the trade-off between unemployment and inflation, usually depicted in the Phillips curve. Voters are supposed to be unemployment and inflation averse, but do not understand fully the relationship between the two. Furthermore, the author argues that inflation reacts with a lag to a change in the unemployment rate. This gives the policy maker the chance to increase employment before elections while the negative consequence of an increased inflation will only become visible after the ballot. In equilibrium this behaviour leads to political business cycles that imply deflating policies directly after the election and an emphasis on employment policies when Election Day approaches. Rogoff (1990) contests that expansionary monetary policy before elections will have any impact on the real economy and thus on employment rate as agents will anticipate the more restrictive inflationary policies following the pre-election period. Therefore, he focuses on the role of fiscal policies in the election process in his study of political budget cycles. Contrary to Nordhaus, he argues that cyclical economic policy does not necessary decrease welfare but might serve as a signal about the ability of the politician in office. If the incumbent is able to lower taxes or increase expenditure before elections she might also be in general more able to react to the requests of the voters. Therefore, it might be rational for voters to support politicians that carry out cyclical spending even though there policies are driven by an opportunistic attitude and not due to their party ideology.
Another theory that tries to explain the outcome of the political process is the concept of partisan effects. It assumes that differences in fiscal policy can be explained by different party ideologies. It has been first empirically tested by Hibbs (1977). Taking again the trade-off between unemployment and inflation of the Phillips curve as a starting point of his analysis, he showed that left-wing governments had a priority to drive the unemployment rate down whereas centre and rightist parties were more concerned about high inflation. Thus, partisan models explain differences in policy outcome at least in part by different priorities of the governing parties.
One study that examines whether there exist political business cycles on sub-national government levels is the work by Kneebone and McKenzie (2001) where a data set of Canadian provinces is used. Additionally to the study of cyclical expenditures they test empirically if the behaviour differs between parties with different ideological background. Their advantage of using a panel of different provinces compared to a cross-country data set is the similar institutional environment over the whole sample. Therefore, the risk of omitted variables biasing their results decreases. Their empirical findings on political budget cycles support the idea of Rogoff (1990) described above. Budget deficits occur more often in the year before an election and spending of the provincial governments

27
increases compared to other years. In addition, their results give some hints that there exist partisan effects. For instance, liberal parties tend to lower sales taxes while there is no such evidence for other political parties.
Shi and Svensson (2006) focus in their study on differences between developing and develop countries in the budget cycles. Their results analysing a broad cross-country panel data set show that fiscal deficits are significantly larger in developing countries than in developed countries in the year before elections. This difference in the cycling behaviour is explained by the authors by higher rents for staying in office and a lower share of informed voters in developing countries, making opportunistic behaviour for politicians more profitable. A recent paper studying opportunistic and partisan effects in Brazilian municipalities has been published by Sakurai and Menezes-Filho (2011). They find evidence for increased expenditure in election years compared to non-election years, supporting the idea of opportunistic behaviour. When distinguishing between left, centre and rightist parties, the results for the behaviour in the election year do not differ. But interestingly, left-wing parties tend to spend significantly less on the municipal level compared to centrist parties. Thus, they find evidence for both, opportunistic and ideology-influenced behaviour in the South American country.
The only study that empirically tests for evidence of political considerations in the water sector is the work done by Madhoo (2004). He tests if the price increases for potable water are lower in an election years compared to others in Mauritius. His data set consists of time series data from 1975 to 1997. As there is a single authority in charge to decide on the potable water tariff for the whole island, he has only one observation per year on changes of the tariffs and no variation between municipalities. His analysis does not find statistically significant evidence for political business cycles in the water sector.
In the next section I will come up with an empirical strategy to test for political budget cycles and partisan effects in the Peruvian water sector.
5.1.2. Budget Cycles and Partisan Effects in the Peruvian water sector Following the idea of Rogoff (1990) and the empirical approach of Kneebone and McKenzie (2001), I will examine if there exist cycling behaviour and partisan effects in the Peruvian urban water sector. In my view, the examination of the water sector on a municipal level is suitable to study these effects. First of all, an increase of water charges affects the whole electorate directly and is observable to everybody as these decisions have to be published in the official newspaper (El Peruano, 2012). Secondly, the revenues of the municipal governments depend on a very large extend on transfers from the central government. Governments on the local level cannot decide on any tax but only collect certain charges for services. Thus, the decision on water charges is one of the few important ways, how to interfere in the amount of levies in their municipality. Though municipalities do not have the possibility to subsidise water charges by increasing taxes, they can reallocate funds they received from the central government for their budget or other purposes. Another possibility is to postpone necessary investments or maintenance in the water sector so that low water charges do not cause deficits in the municipal budget.
My first hypothesis is that water tariffs are dependent on electoral cycles. I expect that water tariffs are significantly lower in election years compared to non-election years. The second hypothesis is that water tariff changes depend on party characteristics of the mayors that have control over the

28
respective WSC. As described earlier, the political party system in Peru cannot be depicted in a typical left- right scheme. However, their different characteristics with respect to the spatial coverage can be used to distinguish broadly between local, regional and national movements. There are different ways why the party characteristics could be important for the price setting in the water sector. As mentioned above, especially local political movements are often only created for one election campaign in order to promote a certain candidate. Once in office, their political decisions might be also relatively short-sighted compared to nation-wide parties that have at least the objective to persist over time. To a lesser extent, these short-sighted policies might also be expected from regional movements. With respect to water tariffs this behaviour would be expressed by postponing tariff increases in the short term to gain popularity. Hence, I expect that tariff increases are negatively correlated with local political movements.
Elections are assumed to be exogenous as they take place in regular four year intervals simultaneously in all municipalities, independently of political events. In my basic estimation I will estimate two models. The first specification focuses on election year effects whereas the second centres partisan effects. The reason for using two different models is that I have to use different parameters to control for year fixed effects.
To test for political business cycles, I will use the following basic model:
4. 𝑊𝑃𝑖𝑡 = 𝛼 + 𝛽1𝐸𝑙𝑒𝑐𝑡𝑖𝑡 + 𝛽2𝑃𝑜𝑠𝑡𝐸𝑙𝑒𝑐𝑡𝑖𝑡 + 𝜇𝑖 + 𝜀𝑖𝑡
where 𝑖 stands for the data of the respective WSC, 𝑡 refers to the year. The dependent variable 𝑊𝑃𝑖𝑡 denotes the real water price deflated by the GDP deflator. On the right hand side, 𝛼 is the intercept, µ𝑖 refers to the WSC fixed effect and 𝜀𝑖𝑡 is the random error term. The independent dummy variable 𝐸𝑙𝑒𝑐𝑡𝑖𝑡 takes the value one if t is an election year and zero otherwise. Respectively 𝑃𝑜𝑠𝑡𝐸𝑙𝑒𝑐𝑡𝑖𝑡 is one in a post-election year and zero otherwise. In the second specification I will add a vector 𝑋𝑡 that contains variables to control for changes in the country-wide macroeconomic conditions, namely the GDP growth rate, the budget balance of the central government and the growth rate of broad money. The reason using these variables and not a parameter controlling for general year fixed effects is that the latter one would be strongly correlated with the election and post-election year dummies making the results invalid. In a further extension, I will insert dummies to test as well for partisan effects in the same specification. All model specifications are estimated by OLS and use heteroskedacticity and autocorrelation-consistent standard errors.
To test for partisan effects specifically I will estimate the equation
5. 𝑊𝑃𝑖𝑡 = 𝛼 + 𝛽1𝑅𝑒𝑔𝑖𝑜𝑛𝑎𝑙𝑖𝑡 + 𝛽2𝑁𝑎𝑡𝑖𝑜𝑛𝑎𝑙𝑖𝑡 + 𝜇𝑖 + 𝛿𝑡 + 𝜀𝑖𝑡
where the dummy variable 𝑅𝑒𝑔𝑖𝑜𝑛𝑎𝑙𝑖𝑡 takes the value one if the party that has control over the WSC is a regional movement and zero otherwise. Following the same logic, the dummy 𝑁𝑎𝑡𝑖𝑜𝑛𝑎𝑙𝑖𝑡 takes the value one if the ruling party is a country-wide organisation and zero otherwise. Thus, the omitted category when both dummies are zero implies that a local party is in power. Additionally, the model includes the variable 𝛿𝑡 controlling for year fixed effects. In subsequent extensions of the model I will include the interaction terms 𝐿𝑜𝑐𝑎𝑙𝑖𝑡 ∗ 𝐸𝑙𝑒𝑐𝑡𝑖𝑡, 𝑅𝑒𝑔𝑖𝑜𝑛𝑎𝑙𝑖𝑡 ∗ 𝐸𝑙𝑒𝑐𝑡𝑖𝑡 and 𝑁𝑎𝑡𝑖𝑜𝑛𝑎𝑙𝑖𝑡 ∗ 𝐸𝑙𝑒𝑐𝑡𝑖𝑡 to test if the parties differ in their attitude towards water price changes before elections. In later specifications I will use a benchmarking score as a dependent variable to examine the robustness of my results.

29
5.1.3. Data In the panel data water tariffs from 47 out of 50 companies were included for the time period from 2000 until 2010. The companies excluded are SEDAPAL and the water company in the department of Tumbes that are not controlled by the municipalities as explained above. Additionally, I exclude the company EPS Grau that is in a process of restructuration after it went bankrupt in the year 2000 (EPS Grau, 2012). Data on water tariffs is available from the water regulation authority SUNASS. Due to the tariff design of increasing block tariffs there is not one single tariff but the exact tariff depends on the amount consumed per month and on consumer characteristics whether it is for domestic or other purposes. Therefore, in the regression data on the average tariff is used. It is defined as the average charge billed for one cubic meter of water. This amount might vary slightly over time due to changes in the consumption of the different consumer groups even though there is no change in the nominal tariffs (SUNASS, 2006a). But as there is no reliable information available on the nominal tariff structure of each WSC over the whole period studied, I use this average tariff as a proxy for changes in the tariff structure. Descriptive statistics of this on all follwing variables can be found in the table 3.1 below. Out of 517 observations on water tariffs, 59 observations or 11.2% were missing. As can be seen in figure A3 in the appendix, most of the missing values can be attributed to the first six years, whereas afterwards missing data is only reported for the year 2008. Because of this pattern I can assume that the missing data is not correlated with my exogneous variables like for instance municipal elections that were held in 2002, 2006 and 2010.
The control variables on the GDP growth rate, the budget balance of the central government and the growth rate of broad money were downloaded from the online data catalogue of the World Bank. The GDP growth rate is expressed in percentage and calculated in constant local currency. The budget balance of the central government is the cash surplus or deficit in percentage of GDP. The growth rate of broad money approximates the money supply of the central bank and is the sum of currency outside banks (World Bank, 2012).
Table 3.1: Summary Statistics of the Panel data set Variable
Observations Mean Standard Deviation Min Max
Real Water Price* 458 0.8777 0.4121 0.0631 2.4786 GDP Growth (in %)
11 5.6296 3.1505 0.2149 9.8034
Budget balance (in %) 11 -0.3068 1.5811 -2.053 1.9993 Broad Money Growth (in %) 11 10.3512 9.4672 -2.404 23.2174 Benchmarking Score 511 56.5931 11.9112 11 88.1 Note: The real water price is deflated to year 2000 Peruvian Sol
The benchmarking score used for a robustness test later, is an index assembled of twelve indicators that shows the performance of each water company. The indicators can be classified in two categories, where the first group consists of outcome parameters and the second measures the competitiveness of the firms. In the benchmarking index each parameter is weighted equally. The benchmarking serves as a tool to compare and improve the performance in the water sector and has been issued by SUNASS since 1998 (SUNASS, 2011a).
The data on provincial and district elections and elected mayors were obtained from the National Office of Electoral Processes (ONPE). The time period covered includes three elections in the years

30
2002, 2006 and 2010. Elections always took place on the third Sunday in November so that I define these years as election years. The new elected municipal councils and mayors took office the first of January of the following year so that the post-election year dummy takes the value one for the years 2003 and 2007 where price data is available (Ley de Elecciones Municipales, 1997). Information about the ruling party for the years from 2000 until 2003 was additionally obtained from the election results in 1998.
For the determination whether a political movement is of local, regional or national coverage no scientific source is available. Therefore, a simple decision rule to classify the parties is applied. If a political movement nominates only candidates in one province it is classified as a local movement. If a movement is only present in one department it is qualified as a regional movement. All other parties are assigned to be national parties. A number of shareholders of a water company can vary between one and 40 municipalities. The information about the exact shareholders of each company was searched from the respective web-page. In the case it was not published there or the absence of such a page, the companies were contacted directly via phone calls. For each shareholding municipality, the governing party in the period from 2000 until 2010 was identified and the geographical party type was assigned according to the decision rule described above. In the next step, I identified which party type had the power in the meeting of shareholders. If for instance parties of local political coverage had at least 50.1% of the shares, the water company is assigned to be governed by local parties during this election period. In the case where it is not possible to determine which type of party has the ruling power over the WSC, because no party type hold over 50% of the shares in an election period, the respective observations were deleted from the sample. This explains why specifications testing for partisan effects have a smaller sample size. Descriptive statistics on the distribution of the parties governing the water companies are shown in the table below.
Table 3.2: Types of party in power of the water companies Ruling Party Type
Local Regional National
Number of Observations 115 104 186 Share of all observations 28.40% 25.68% 45.93% Total 405
5.1.4. Results Table 3.3 shows the results of the regressions examining the effect of elections on the water tariffs. In the first column, no controls for the general economic trend are included in the model and only the dummy variables for the election year and the year after are considered. In the second column, the variables GDP growth, the budget balance of the central government and the growth rate of the broad money are added. To test for budget cycles and partisan effects in the same model, column three includes also dummy variables indicating the geographical coverage of the specific party. In some cases it was not possible to determine which party type had control over the company. These observations were excluded, reducing the sample size in the last specification of table 3.3.

31
Table 3.3: Political Budget Cycles Exogenous Variables
(1) (2) (3)
Elect -0.0254 0.0228 0.0256 (0.0161) (0.0178) (0.0198) PostElect -0.0168 0.0300** 0.0292* (0.0144) (0.0144) (0.0165) GDP Growth 0.00185 0.00454 (0.00420) (0.00471) Budget Balance -0.0331*** -0.0342*** (0.00651) (0.00725) BroadMoney -0.00300** -0.00442*** (0.00129) (0.00142) Regional 0.0785* (0.0395) National 0.0411 (0.0325) Observations 458 458 405 Year FE? No No No Company FE? Yes Yes Yes Adjusted R2 0.00124 0.189 0.189 Note: Dependent variable is the real water price in year 2000 Peruvian Sol. Robust standard errors in parentheses *** p<0.01, ** p<0.05, * p<0.1
In the first column, the dummy variables for the election year and the post-election year are both not statistically significant. When adding controls for the general economic trend in column two, the post-election year dummy gets positive and significant at a 5% level. The estimator indicates that water prices were on average 0.03 Peruvian Sol higher in post-election years compared to others. In column three, where I test additionally for partisan effects, the significance level of the estimator decreases to 10%. The results of the election year dummy indicate in all three specifications that the water prices are not significantly lower for election periods. Both, the central governments’ budget balance and the broad money growth rate are strongly correlated with the real water price in column two and three. Thus, these variables seem suitable to control for the general time trend. With regard to the estimators for partisan effects, it seems that water prices are higher for water companies that are under control of regional parties. If this relationship holds is examined in detail in the next table. Column one in table 3.4 does not control for underlying conditions that change over time and might influence water prices. In this specification, only the partisan dummies are included, being both insignificant. When controlling for time fixed effects in column two, the estimator for regional movements gets significant at a 5% level. It indicates that water tariffs are on average around 0.09 Peruvian Sol (0.03 US-Dollar) per m3 higher for companies governed by regional parties compared to
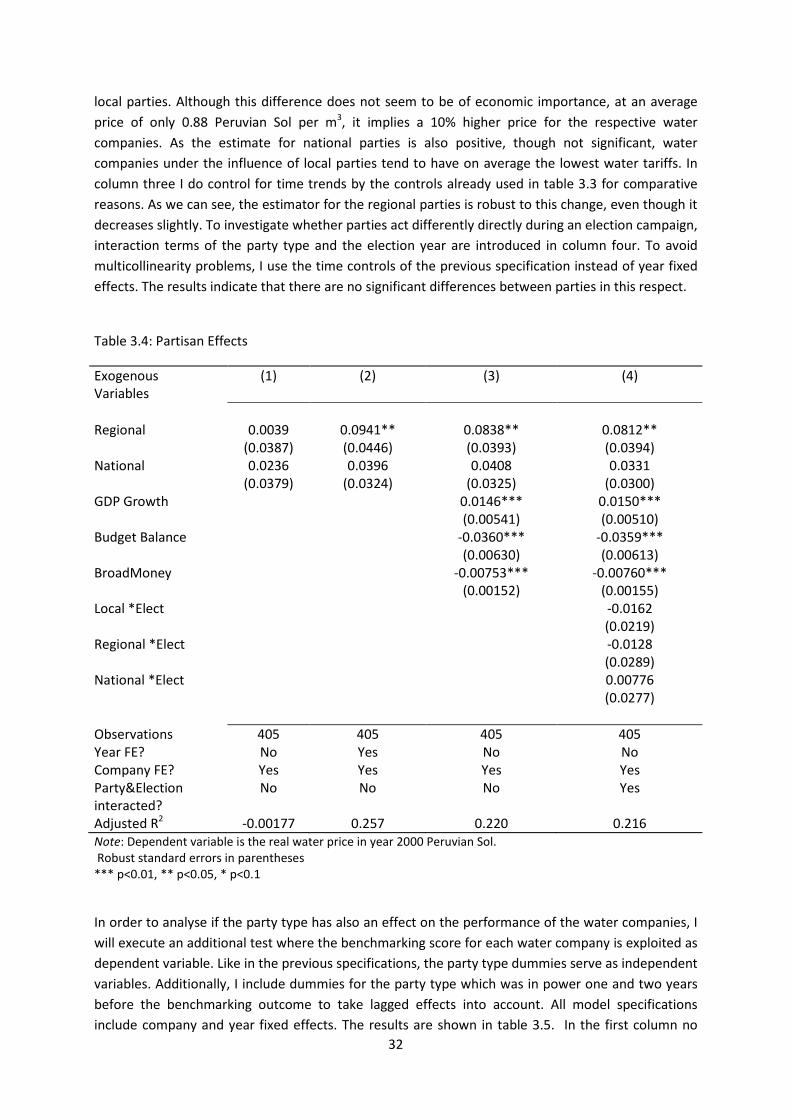
32
local parties. Although this difference does not seem to be of economic importance, at an average price of only 0.88 Peruvian Sol per m3, it implies a 10% higher price for the respective water companies. As the estimate for national parties is also positive, though not significant, water companies under the influence of local parties tend to have on average the lowest water tariffs. In column three I do control for time trends by the controls already used in table 3.3 for comparative reasons. As we can see, the estimator for the regional parties is robust to this change, even though it decreases slightly. To investigate whether parties act differently directly during an election campaign, interaction terms of the party type and the election year are introduced in column four. To avoid multicollinearity problems, I use the time controls of the previous specification instead of year fixed effects. The results indicate that there are no significant differences between parties in this respect.
Table 3.4: Partisan Effects
Exogenous Variables
(1) (2) (3) (4)
Regional 0.0039 0.0941** 0.0838** 0.0812** (0.0387) (0.0446) (0.0393) (0.0394) National 0.0236 0.0396 0.0408 0.0331 (0.0379) (0.0324) (0.0325) (0.0300) GDP Growth 0.0146*** 0.0150*** (0.00541) (0.00510) Budget Balance -0.0360*** -0.0359*** (0.00630) (0.00613) BroadMoney -0.00753*** -0.00760*** (0.00152) (0.00155) Local *Elect -0.0162 (0.0219) Regional *Elect -0.0128 (0.0289) National *Elect 0.00776 (0.0277) Observations 405 405 405 405 Year FE? No Yes No No Company FE? Yes Yes Yes Yes Party&Election interacted?
No No No Yes
Adjusted R2 -0.00177 0.257 0.220 0.216 Note: Dependent variable is the real water price in year 2000 Peruvian Sol. Robust standard errors in parentheses *** p<0.01, ** p<0.05, * p<0.1
In order to analyse if the party type has also an effect on the performance of the water companies, I will execute an additional test where the benchmarking score for each water company is exploited as dependent variable. Like in the previous specifications, the party type dummies serve as independent variables. Additionally, I include dummies for the party type which was in power one and two years before the benchmarking outcome to take lagged effects into account. All model specifications include company and year fixed effects. The results are shown in table 3.5. In the first column no

33
lagged variables are included. The second specification includes one-year lags in the change of the performance whereas column three considers two-year lags as well. As can be seen from the results, none of the variables is statistically significant at standard levels of confidence. Hence, there does not seem to be a relationship between party type and the performance of the water companies. In contrast to the water price setting, the results of table 3.5 suggest that mayors do not tend to interfere in other operational decisions of the water companies.
Table 3.5: Partisan Effects in the Performance of the companies Exogenous Variables
(1) (2) (3)
Regional 1.138 0.490 0.523 (1.460) (1.548) (1.551) National 0.447 0.763 0.669 (1.128) (1.087) (1.075) Regionalt-1 0.943 0.714 (1.172) (1.314) Nationalt-1 -0.402 0.247 (1.014) (1.190) Regionalt-2 0.301 (1.359) Nationalt-2 -0.835 (1.200) Observations 511 510 509 Year FE? Yes Yes Yes Company FE? Yes Yes Yes Adjusted R2 0.457 0.458 0.457 Note: The dependent variable is the Benchmarking Score Robust standard errors in parentheses *** p<0.01, ** p<0.05, * p<0.1
To sum up, the results show some evidence for political cycling behaviour. Even though prices are not significantly lower in election years, they tend to be higher in the years after the election. This might be an indication that price increases are most likely to be implemented during the first year when the new government is in office. With regard to partisan effects, regional parties implement higher water tariffs than local parties. It might be an indication that local political movements have a relative short- term utility-maximizing attitude towards water tariffs, endangering the financial sustainability of the water supply. This short-sighted behaviour might be due to the short life span that their political movements encounter.
5.2. Cross municipal study In this section I will use a data set of different municipalities for the year 2007 to test the theory of the median voter. The advantage of using a sample of only one year is that the data available is much better because a census was carried out in this specific year and therefore more detailed information on the municipal level is available. I start by describing the theoretical implications and previous research in the field before adapting the setting to the Peruvian circumstances and giving a description of the data set used.

34
5.2.1. The median voter theorem The idea of a decisive median voter in the political process goes back to the analysis of Hotelling (1929) who showed that the products offered on a market with one-dimensional preferences of the consumers converge to the taste of the consumers in the middle without becoming exactly identically. Downs (1957) applies the model to the ‘market’ of political platforms offered by different parties which are assumed to be only interested in maximizing their number of votes gained. Additionally, he assumes that platforms can be placed on a one dimensional line from left to right and that the position of the voters along this line has a single peak. If we take a two party system and allow both parties to adjust their platform according to the voter´s preferences, the political agendas will converge to the platform preferred by the median voter. This result only holds under the assumption that the density function of voter´s preferences is single peaked.
Meltzer and Richard (1981) use the median voter theorem to explain the variation in the size of governments by differences in the income distribution of the voters. Starting point of their analysis is the observation that income distributions are in general right-skewed. As a consequence, the median income is below the mean income. Hence, if there exists a voting procedure where the majority of votes is below the mean, this majority will be in favour of redistribution policies that taxes high incomes relatively high. The more skewed the income distribution, the higher will be the redistribution from the high to the low income voters.
Timmins (2002) adjusts the model developed by Meltzer and Richard to adapt it to the municipal environment and to test it empirically. In his analysis of Californian municipalities he tries to find evidence why rational municipal managers cross- subsidise water consumption even though this behaviour implies deadweight losses to the communities. As the author shows, water charges are highly regressive, i.e., the amount paid for the water bill as a share of the income decreases with an increase of the income. This contrasts water charges from other income sources of Californian municipalities, such as sales or property taxes that increase with an increase in income. In his model, the municipal manager has now the possibility to cross- subsidise the water price by revenues from the income tax. This policy implies redistribution from high to low incomes because poor households are not affected by higher taxes in the same way as high incomes. According to the median voter theorem, voters in relatively unequal municipalities will prefer higher cross- subsidies relative to more equal ones, because the distance between the median and the mean income will be larger. If the municipal mayors are office motivated and react to the preferences of the voters water prices will be relatively lower in more income disperse communities compared to municipalities where the income distribution is more equal.
Timmins tests this hypothesis empirically using a data set of 95 Californian municipalities for the year 1990. It includes data on the water prices and supply costs of the water utilities, municipal water use and household characteristics. As a dependent variable, he takes the mark-up on water sales defined as the difference between water price and marginal cost, divided by the marginal cost. As a measure of the variance of the income distribution, the author takes the distance between the log-mean income and the log-median income. Thus, if the hypothesis holds, a higher variance in income should be negatively correlated with the mark-up on water sales. The author finds evidence for such a relationship. For municipally owned water utilities the elasticity of the price mark up to a change in the income variance is between -1.25 and -1.81, depending on the exact model specification. These values are statistically significant on a 10% level.

35
In the following section I will adapt the model described above to the Peruvian circumstances and test it empirically.
5.2.2. Adaption to the Peruvian context The aim of the examination of the water sector in Peru is to test the median voter theorem with regional data in a developing country. My hypothesis is that the water tariff depends on the income distribution. The higher the inequality and thus the distance between the median and the mean income, the higher will be the subsidy of the water tariff. To my knowledge there is no other study that has done this so far for the municipal level of a developing country and therefore it could shed light whether this economic theory is also applicable in this context.
If the median voter theorem holds, regions with a more unequal income distribution are supposed to have relatively lower water charges to spare low income households from high costs at the expense of investments in other sectors or an improved overall water infrastructure. Thus, more inequality in the income distribution should be negatively correlated with the price mark up on the operation costs as in the study of Timmins (2002). To test this hypothesis empirically, I will use the following regression function for my baseline estimation
6. 𝑊𝑅𝑖 = 𝛼 + 𝐺𝐶𝑖𝛽1+ 𝑌𝑖 + 𝜀𝑖
where the dependent variable 𝑊𝑅𝑖 is the ´work relation´. It divides the operational costs by the total revenue of the company.1 The higher the coefficient and thus the operational cost in relation to the total revenue, the less capital is available for investments in the sector. A lower coefficient is therefore associated with a higher mark-up on the water charges. On average the work relation for the WSC in Peru took a value of 68% in 2003 while it was only 51% for the most efficient companies in South America (SUNASS, 2006b).
As I do not have data on the median and mean income on district level, I will use the Gini coefficient to approximate the distance between the two. If the hypothesis of the median voter holds, a higher Gini coefficient, meaning larger income inequality, should be positively correlated with the work relation. In the regression, 𝐺𝐶𝑖 is the variable for the weighted Gini coefficient of the area in which the respective WSC operates and 𝛽1 is the slope parameter. The vector 𝑌𝑖 consists of a set of control variables. It includes the geographical location of the WSC, the share of specific housing types in a region and the number of connections of each company to control for the differences in size. The housing types are the percentage of people living in detached houses, apartment blocks and multi-family houses. By including these housing types I control for unobservable socioeconomic characteristics of the municipalities and the varying costs the WSC have for delivering water to the respective housing type. The controls are successively added. Finally, 𝜀𝑖 is the error term of the regression.
With respect to the water tariffs, I assume that consumers only observe the invoice they receive at the end of the month for their water consumption and do not understand or care for the way it is calculated. Thus, they have no information about the tariff design which originally was thought to subsidise the poor but does not achieve this goal as explained in detail in section2.1. Therefore,
1 Operational costs are total operational costs deduced by depreciation and provisions for doubtful outstanding bills. For a detailed description of the calculation of the work relation see SUNASS (2006a) p.21

36
consumers do not lobby for a more adequate tariff structure but take it as given and are only concerned about the amount they have to pay at the end of the month.
5.2.3. Data The data of the Gini coefficient, housing characteristics and the access to piped water of the households are available from the National Institute of Statistics and Information, INEI. In 2007, the INEI carried out a census collecting detailed information about the socioeconomic characteristics of the population and the housing conditions. Besides, the annual household survey was carried out focusing on socioeconomic variables important for the design and evaluation of social policy. These two studies were the main sources to create detailed poverty maps on municipal level by the INEI that served as my data source for the variables named above (INEI, 2007). This data source was also exploited to get information on the Theil index and the share of total poor in a municipality. Both variables are used for robustness checks in later specifications. A person is defined to be poor if it is below the poverty line, indicating that the individual is not able to acquire goods to satisfy its basic needs. The respective values are calculated for each department by the INEI (2007).
Table 4.1: Descriptive Statistics of cross-municipal data Variable Obser-
vations Mean SD Min Max
Work Relation
50 0.8456 0.1586 0.54 1.51
Gini Coefficient
50 0.3285 0.0864 0.2388 0.8045
Theil Index
50 0.1759 0.0463 0.1003 0.2989
Share of population w/o access to piped water (in %)
50 11.8852 12.2853 1.37 65.27
Number of Connections 50 55,807 169,697 2,150 1,194,879 Detached houses
50 0.8739 0.0656 0.7356 0.9882
Apartment Blocks
50 0.0231 0.0285 0.0003 0.1468
Multifamily houses
50 0.0259 0.0193 0.0014 0.0686
Share of total poor (in %) 50 36.7498 16.2577 14.2471 78.0046 Operative cost per volume billed
50 1.1994 0.5559 0. 37 3.35
The information of the work relation, geographic location, benchmarking score, the number of connection of a company and the districts in which the supply companies operate were obtained from the regulator SUNASS. It has been either downloaded directly from their web page or gathered from technical documents available on request from the regulator. The same applies for the operative cost per volume billed, used as a control variable in a later specification. For the determination of the geographical location three regions are distinguished namely the coastal, the Andean and the Amazonian region. Even though the coastal region constitutes only 11% of the surface of the country, 55% of the population lived in this area in 2007. The Andean region represents 32% of the area and 32% of the population lived here whereas the Amazonian is the most sparsely populated region with only 13% of the population living in an area that consists of 58% of

37
the surface of the country (INEI, 2012). Descriptive statistics of the variables used can be found in the table below.
Table 4.2: Distribution of water companies over regions Region
Coast Andean Amazonian Total
Number of companies 17 23 10 50 Share of companies 34% 46% 20% 100%
In my basic analysis I include data on all 50 urban water companies and do not omit the three critical ones. The reason is that I do not examine explicitly the political influence of the municipal mayors here and there might be other channels through which political influence is exerted on the other water companies as well.
5.2.4. Results Table 4.3 shows the results of the regressions testing the median voter theorem. In column one no control variables are included. The specification in column two includes controls for the share of specific housing types and the size of the water company, whereas additional dummies to control for the geographical location are introduced in column 3. Here, the Amazonian region serves as a reference.
In the first specification, the estimate for the Gini coefficient is -0.427, indicating a decrease of the work relation by almost half a percentage point if the Gini increases by one percentage point. Thus, the price mark-up is higher in more unequal regions contrary to the hypothesis of the median voter theorem. By adding controls the estimator of the Gini decreases gradually; first to -0.381 and then to -0.217 but continues to be significant at a 5%-level. This might give some indication that the negative value of the estimator is due to omitted variables where it is not yet controlled for in the model specification. With regard to the control variables, the share of people living in apartment blocks seems to be an important factor influencing the work relation: If the share of apartment blocks increases, the work relation decreases. This relationship seems to be driven by the fact that it is relatively cheaper to connect these households where a lot of people live close to each other compared to more disperse residences. Another significant control variable is the parameter that controls for the geographic specifics of the Andean region in column three. It shows that in this region the work relation is on average 0.12 percentage points lower than in the Amazonian region, which is the reference in the model.

38
Table 4.3: Baseline Results Exogenous Variables
(1) (2) (3)
Gini -0.427** -0.381** -0.217** (0.189) (0.173) (0.103)
Detached Houses -0.520
(0.439) -0.767* (0.411)
Apartment Blocks -2.790*** (0.620)
-2.467*** (0.856)
Multifamiliy Houses -0.748 (0.969)
-1.146 (0.969)
Connections -3.02e-08 (5.80e-08)
-1.51e-07* (7.85e-08)
Andean Region -0.124** (0.0464)
Coastal Region 0.0203 (0.0618) Observations 50 50 50 Adjusted R2 0.0346 0.258 0.418 Note: The dependent variable is the Work Relation Robust standard errors in parentheses *** p<0.01, ** p<0.05, * p<0.1
To test if the positive relationship between the price mark-up and inequality holds, the basic model specification is alterd. The results are given in table 4.4. The estimates for the different housing types are not reported because the results do not differ from the previous analysis. As a first change, the three water companies that are not under the direct influence of the municipalities were deleted from the sample, in the same way it is done in the panel study2. As we can see, the estimate of the Gini coefficient is no longer significant even though the sign is still negative. One explanation for the prevailing negative correlation between inequality and the work relation could be that I do not control for the efficiency of the water companies. A high work relation can be a sign for too low revenues but also for relatively high expenditures. Therefore, I introduce the quotient of operational cost per billed volume produced as a control variable for the efficiency level. The results of the new specification are depicted in column two. The additional control variable is not statistically significant and does not change the estimator for the Gini coefficient either. The results remain insignificant when using the labour cost per billed volume produced as another proxy for the efficiency level (estimates reported in table A4 in the appendix). Thus, not omitting a control variable for the efficiency level in the previous specifications does not seem to be the explaining factor for the unexpected positive correlation between price mark-up and income inequality.
In all the regressions run before, the assumption was that the Gini coefficient is a good proxy for the distance between the median and the mean income. A characteristic of the Gini is its higher 2 The three companies are SEDAPAL, Aguas de Tumbes and EPS Grau

39
sensitivity to changes in the middle of the income distribution than to changes on the margins. But in order to approximate the distance between the median and the mean voter correctly it is crucial to take also changes in extreme incomes sufficiently into account and not weight them disproportionally. An index where the sensitivity is constant over changes in the whole distribution is the Theil index (Cowell and Jenkins, 1995). Just as the Gini it can take values between one and zero where the first represents total inequality and the latter total equality. Therefore, in column three and four the Theil index instead of the Gini is used as a proxy for inequality. Compared to the Gini estimates in column one and two, the standard errors for the Theil estimates quadruple whereas the estimates itself converge to zero. Thus, the way how I approximate the distance between the median and the mean voter seems to be crucial. A possible reason why the results differ from the study of Timmins (2002) could be that the correlation between general wealth and inequality is different. It might be the case that in Peru poorer municipalities have also a more equal income distribution and the opposite is true for California. If the wealth has also an influence on the price mark-up than this could explain the different outcomes. Therefore, the regressions in column three and four in table A4 in the appendix include the share of total poor in a municipality as a proxy for the wealth level. The estimates for the additional control variable are not significant and they do not change the estimate of the Gini and Theil index either. Hence, structural differences in the correlation between inequality and wealth do not seem to be driving factor why the results differ from Timmins (2002).
Table 4.4: Extended Analysis Exogenous Variables
(1) (2) (3) (4)
Gini -0.168 -0.164 (0.116) (0.113) Theil Index 0.0309 0.0505 (0.469) (0.484)
Connections -7.61e-07**
(3.50e-07) -7.18e-07* (3.63e-07)
-8.49e-07** (3.94e-07)
-8.03e-07** (3.93e-07)
Andean Region -0.118** (0.0475)
-0.126** (0.0465)
-0.131** (0.0488)
-0.139*** (0.0479)
Coastal Region 0.0377 (0.0681)
0.0391 (0.0676)
0.0280 (0.0681)
0.0302 (0.0675)
Operative costs -0.0173 -0.0190 (0.0463) (0.0485) Observations Controlling for housing type?
47
Yes
47
Yes
47
Yes
47
Yes Adjusted R2 0.388 0.375 0.379 0.367 Note: The dependent variable is the Work Relation Robust standard errors in parentheses *** p<0.01, ** p<0.05, * p<0.1
In the following, I test an additional hypothesis related to the median voter theorem. As described in the introduction, the cost for potable water is highest for households that do not have access to

40
piped water. Thus, we would expect that these households put the most pressure on politicians to implement network extensions. Additionally, they should be in favour of promoting higher water tariffs to provide the required funding. If this part of the population is able to influence the preference of the median voter, a higher share of people that do not have access to piped water should be positively correlated with the price mark-up on the tariff. Regressions to test this hypothesis are shown in table 4.5. The model specification is the same as in the baseline model testing the median voter theorem, but instead of using the Gini, I will use the percentage of people without access to piped water as explanatory variable. In addition, the share of total poor is used as a control variable in column three to avoid an omitted variable bias in case that the share of people without water connection is correlated with the wealth in a municipality. If my hypothesis holds, I would expect the sign of this coefficient to be negative and statistically significant. As we can see from the different specifications in table 4.5 none of the estimates for the explanatory variable is significantly different from zero. Hence, the results do not support my hypothesis. People without access to piped water do not seem to be able to lobby for their interest and exert pressure on the responsible politicians to provide sufficient funds for the necessary network expansions.
Table 4.5: Influence of the unconnected population on the water prices Exogenous Variables
(1) (2) (3)
Share of population 0.00248 0.00187 0.00160 w/o acces to piped water (0.00184) (0.00170) (0.00154)
Connections -7.77e-07**
(3.77e-07) -6.50e-07 (4.42e-07)
Andean Region -0.125** (0.0512)
-0.136*** (0.0480)
Coastal Region 0.0210 (0.0698)
0.0517 (0.0772)
Total Poor 0.00163 (0.00137) Observations 47 47 47 Controlling for housing type? Yes Yes Yes Adjusted R2 0.0177 0.403 0.401 Note: The dependent variable is the Work Relation Robust standard errors in parentheses *** p<0.01, ** p<0.05, * p<0.1
To resume the results of the previous regressions, the first results showed a positive correlation between inequality and the mark-up on water prices, contrary to the findings of Timmins (2002) and the prediction of the median voter model. When adding control variables, the relationship is no longer statistically significant. Varying the index for inequality from the Gini to the Theil index, the correlation is no longer positive. This highlights how sensitive the results are to changes in the way inequality is measured. The Gini, weighting changes in extreme incomes lower than similar changes in the middle of the income distribution should be handled with care to use it as a proxy for this specific purpose. In total, my results do not support the hypothesis of the median voter in the water tariff setting. The results of the first regressions in table 4.3 indicating that the opposite of the

41
hypothesis is true can be attributed to omitted variables in the specifications and the specific characteristics of the Gini coefficient. In an additional approach, testing whether people without access to piped water are able to influence the water price setting I cannot find any evidence that such a relationship exists.
6. Conclusion In the first part of this study, a qualitative analysis of the main actors, challenges and reform necessities in the Peruvian urban water sector was carried out. Therefore, expert interviews were conducted. One crucial problem seems to be the political interference of local politician in the management of the water companies. This leads to short term investment decisions, a high rotation of management personal and a weakening of the position of the regulatory authority to implement its regulation on tariffs and financial planning. Merging the companies on a regional level and withdrawing the power of the mayors could mitigate this problem. Besides, an increased size of the companies would lead to scale effects that could improve the management additionally. Furthermore, problems in the sector seem to be the low remuneration of personal that is insufficient to attract well-trained staff, the lack of private investment possibilities and a tariff structure that is not well-targeted to subsidies the poor. In these areas, policy changes should be considered. Using a theoretical framework to explain the behaviour of political actors in the sector, it is possible to identify key factors that impede the implementation of these reforms. One crucial issue seems to be that politicians seem to prefer policies with a short term impact like for instance infrastructure project. In contrast, they refrain from nstitutional reforms that require a longer time horizon. A reason for this behaviour seems to be that politicians have a lack of awareness for the benefits of such changes and discount utility gains that are obtained in the future too much. Hence, the utility gains for society perceived by a politician and included in its utility function are too low. On the other hand, specific lobby groups on the local level, like municipal mayors, seem to be able to organise resistance to structural changes that affect their utility negatively. Additionally, there exist sentiments against certain policies in the population, like private sector engagement. These factors can affect the private utility of the political actors negatively when promoting reforms and might explain their inaction. In order to facilitate and promote reforms, the sensitivity of the responsible politicians towards the complex problems in the sector should be raised. This can lead to a better evaluation of the true benefits of reforms in the process of decision-making. With respect to the private utility of the political actor, better and more transparent information in combination with new communication strategies might mitigate existing fears in the population. Besides, the interests of local lobby groups should be taken into account when designing new policies in order to prevent resistance.
The second section of this study sought empirical evidence of political influence on the municipal level in the water sector. In the first part, exploiting a panel data set of municipality-owned water companies, I tested for political budget cycles and partisan effects. The results suggest that water prices tend to be higher in post- election years. Thus, mayors might postpone necessary price increments until the election campaign is over and seem to be more willing to adjust the prices in the first year of their term in office compared to other years. However, the results should be handled with care as the data set only includes two post-election periods. Testing for partisan effects in the sector, I found that local parties tend to implement lower water tariffs compared to parties that are of regional extent. A possible explanation for this conduct could be the short life-span of local parties

42
which is normally limited to one election cycle. Though, there are also other possible explanations for this behaviour. Local party mayors might have a lower awareness of the needs of the water sector or be more exposed to lobbying from certain interest groups. To explore in detail why parties differ in the implementation of water tariffs is therefore left for further research. If the cycling behaviour in the water price setting is confirmed in the future, it can be advisable to withdraw the legal responsibility of the water companies from the municipalities to an entity that makes its decisions solely based on operational considerations. This could lead to a more efficient management and facilitate a long term planning for the companies with the final goal of providing the whole population with access to piped water. To study whether the theories of political budget cycles and partisan effects are in general applicable to the Peruvian municipal level, an empirical examination including parameters of municipal revenues and expenditure would be necessary, similar to the studies carried out by Kneebone and McKenzie (2001) and Sakurai and Menezes-Filho (2011). Such an analysis is beyond the scope of this study, but my results provide some evidence that further research in this direction might be fruitful.
The second part of the quantitative approach analysed the relationship between income inequality and the water price setting in Peruvian municipalities. Contrary to the results of Timmins (2002), my analysis does do not support the median voter theorem. As I showed, the different results cannot be attributed to general differences in the wealth structure. One possible explanation might be the existing tariff structure of increasing blocks. If the population perceives this structure to be beneficial for the poor, the median voter in a relatively unequal municipality might be in favour of relatively high water tariffs, assuming that it puts a higher burden on the rich. Nevertheless, the results of the analysis are interesting as they illustrate that it is not necessarily possible to transfer findings of political economic theory to the context of a developing country. However, it should be kept in mind that the sample used for the analysis included at most 50 observations, weakening the convergence assumption of the standard errors for the estimation strategy. If additional data on rural water supply companies becomes available in the future, the empirical analysis could be extended. Furthermore, when more detailed information on the income distribution and the preferences becomes accessible, a more sophisticated analysis would be possible. For instance, Brunner and Ross (2010) test a model with two different public good demand types and find evidence that heterogeneous demands prevail. Deeper insights in this area could not only help to adapt the theory to reality but also help us to better understand how democratic decision processes can explain public good provision.

43
Annex A1: Guiding Questions
Principal Question: What are the main factors and actors in the water sector ¿ How do they influence the decision to determine the water tariffs?
1. What is the biggest question and most urgent in the water sector?
2. What is your opinion on the level of the water tariffs from an economic point of view?
3. What are the most important political actors in the determination process of the water tariff?
4. What must happen so that a politician advocates water tariff increases? Do you know examples?
5. What reforms are the most pressing to achieve that the decision process of the water tariffs gets more adequate?
6. What is the role of other groups except from the political actors with respect to the determination of the water tariffs?

44
A2: List of Interview partners
Interview Number
Name Profession Institution Date of interview
1. Jose Luis Bonifaz
University Professor Universidad del Pacífico 14.03.2012
2. Iván Lucich
Tariff expert SUNASS 16.03.2012
3. Fernando Laca
Director General SUNASS 20.03.2012
4. Julio Vidal
Sector Lawyer Law office Carriles & Vidal 21.03.2012
5. Iris Marmanillo
Sanitation Water Sector Coordinator for Peru
World Bank 28.03.2012
6. Anonym
Tarff Specialist SEDAPAL 28.03.2012
7. José Luis Becerra Silva
National Directorate for Sanitation
Ministry of Housing, Construction and Sanitation
02.03.2012
8. Gustavo Mendez
Senior Water and Sanitation Specialist
KfW Bank 03.04.2012
9. Wagner Vasquez
General Director Water Supply Company Moyobamba
09.04.2012
10.
Jorge Guibo
Directorate for Public Investment
Ministry of Economy and Finance
27.04.2012

45
A3: Missing Water Price Data
Note: Elections were held in the years 2002, 2006 and 2010
A4: Additional Robustness Checks
Exogenous Variables
(1) (2) (3) (4)
Gini -0.144 -0.193 (0.119) (0.134) Theil Index 0.0661 -0.106 (0.338) (0.432)
Connections -2.69e-07 -3.54e-07 -5.75e-07 -6.43e-07 (3.0e-07) (3.3e-07) (4.13e-07) (4.4e-07) Andean Region -0.137*** -0.148*** -0.128*** -0.143*** (0.0339) (0.0374) (0.0435) (0.0459) Coastal Region 0.0140 0.00445 0.0774 0.0627 (0.0488) (0.0497) (0.0780) (0.0775)
Labour Costs per billed volume
-0.146 (0.104)
-0.136 (0.102)
Total Poor 0.00209 0.00204 (0.00159) (0.00152)
Observations 42† 42† 47 47 Controlling for Housing Type? Yes Yes Yes Yes Adjusted R2 0.503 0.491 0.396 0.385 Note: Dependent variable is the Work Relation Robust standard errors in parentheses †Small sample size due to missing values *** p<0.01, ** p<0.05, * p<0.1
02468
1012
2000 2001 2002 2003 2004 2005 2006 2007 2008 2009 2010
Missing Values

46
References
AGUAS ANDINAS. 2012. Memorias [Online]. Available: http://www.aguasandinas.cl/inversionistas/informacion-financiera/memorias [Accessed 25. April 2012.
BAUER, A. & VILLAVERDE, D. 2011. El Valor Económico y Social de las Inversiones Sostenibles en Agua y Saneamiento en el Perú. Deutsche Gesellschaft für Internationale Zusammenarbeit (GIZ) GmbH.
BECKER, G. S. 1983. A theory of competition among pressure groups for political influence. The Quarterly Journal of Economics, 98, 371.
BECKER, G. S. 1985. Public policies, pressure groups, and dead weight costs. Journal of public economics, 28, 329-347.
BRUNNER, E. J. & ROSS, S. L. 2010. Is the Median Voter Decisive? Evidence from Referenda Voting Patterns. Journal of Public Economics, 94, 898-910.
BUCHANAN, J. M., TOLLISON, R. D. & TULLOCK, G. 1980. Toward a theory of the rent-seeking society, Texas A & M Univ Pr.
CHE, Y. K. 1995. Revolving doors and the optimal tolerance for agency collusion. The Rand journal of economics, 378-397.
COWELL, F. A. & JENKINS, S. P. 1995. How much inequality can we explain? A methodology and an application to the United States. The Economic Journal, 421-430.
DOUKKALI, M. R. 2005. Water institutional reforms in Morocco. Water Policy, 7, 71-88. DOWNS, A. 1957. An economic theory of political action in a democracy. The Journal of Political Economy, 65,
135-150. EL PERUANO. 2012. Diario Oficial El Peruano [Online]. Lima, Peru. Available:
http://www.elperuano.pe/Edicion/noticia-subiran-tarifas-39212.aspx [Accessed 16.04.2012 2012]. EPS GRAU. 2012. Portal de la EPS GRAU S.A. [Online]. Available:
http://www.epsgrau.com.pe/index.php?opt=quienes [Accessed 22 May 2012. ESTACHE, A. & WREN-LEWIS, L. 2009. Toward a theory of regulation for developing countries: Following jean-
jacques laffont's lead. Journal of Economic Literature, 47, 729-770. GLÄSER, J. & GAUDEL, G. 2009. Experteninterviews und qualitative Inhaltsanalyse als Instrument
rekonstruierender Untersuchungen, Wiesbaden, VS Verlag für Sozialwissenschaften. HEARNE, R. R. & DONOSO, G. 2005. Water institutional reforms in Chile. Water Policy, 7, 53-69. HEYNS, P. 2005. Water institutional reforms in Namibia. Water policy, 7, 89-106. HIBBS JR, D. A. 1977. Political parties and macroeconomic policy. The American Political Science Review, 1467-
1487. HOTELLING, H. 1929. Stability in competition. The economic journal, 39, 41-57. INEI 2007. Mapa de Pobreza Provincial y Distrital. Instituto Nacional de Estatística e Informática. INEI. 2012. Aspectos Geográficos del Perú [Online]. Instituto Nacional de Estatística e Informática. Available:
http://www1.inei.gob.pe/biblioineipub/bancopub/Est/Lib0347/N25/GEOGRAF.htm [Accessed 24 May 2012.
JALAN, J. & RAVALLION, M. 2003. Does piped water reduce diarrhea for children in rural India? Journal of econometrics, 112, 153-173.
KNEEBONE, R. D. & MCKENZIE, K. J. 2001. Electoral and partisan cycles in fiscal policy: An examination of Canadian provinces. International Tax and Public Finance, 8, 753-774.
KOMIVES, K., HALPERN, J., FOSTER, V., WODON, Q. & ABDULLAH, R. 2006. The distributional incidence of residential water and electricity subsidies.
KRUEGER, A. O. 1974. The political economy of the rent-seeking society. The American Economic Review, 64, 291-303.
LAFFONT, J. J. 2005. Regulation and development, Cambridge Univ Pr. LAFFONT, J. J. & TIROLE, J. 1991. The politics of government decision-making: A theory of regulatory capture.
The Quarterly Journal of Economics, 106, 1089. LEY DE ELECCIONES MUNICIPALES 1997. In: PERÚ, C. D. L. R. D. (ed.). LEY NO. 28859 2006. Ley que suprime las restricciones civiles, comerciales, administrativas y judiciales; y
reduce las multas en favor de los ciudadanosomisos al sufragio. In: PERÚ, C. D. L. R. D. (ed.). MADHOO, Y. N. 2004. Political economy of water pricing policy: Empirical evidence from public utilities in
Mauritius. Water resources research, 40, W07301. MCKAY, J. 2005. Water institutional reforms in Australia. Water Policy, 7, 35-52. MELTZER, A. H. & RICHARD, S. F. 1981. A rational theory of the size of government. The Journal of Political
Economy, 914-927. NORTH, D. C. 1990. A transaction cost theory of politics. Journal of Theoretical Politics, 2, 355.

47
ONPE 2007. Elecciones Regionales y Municipales 2006 - Informe de resultados. Lima, Peru: Oficina Nacional de Procesos Electorales, ONPE.
ONPE 2010. Competencia electoral en el ámbito provincial. Lima, Peru: Oficina Nacional de Procesos Electorales, ONPE.
PASTOR, C. & PÉREZ, P. 2009. El reto de la infraestructura la 2018. Instituto Peruano de Economía. PELTZMAN, S. 1976. Toward a more general theory of regulation. National Bureau of Economic Research
Cambridge, Mass., USA. REUBER, P. & PFAFFENBACH, C. 2005. Methoden der empirischen Humangeographie. Braunschweig: Das
geographische Seminar. SAKURAI, S. N. & MENEZES-FILHO, N. 2011. Opportunistic and partisan election cycles in Brazil: new evidence at
the municipal level. Public Choice, 148, 233-247. SALETH, R. M. & DINAR, A. 2004. The institutional economics of water: a cross-country analysis of institutions
and performance, Edward Elgar Pub. SALETH, R. M. & DINAR, A. 2005. Water institutional reforms: theory and practice. Water Policy, 7, 1-19. SAMAD, M. 2005. Water institutional reforms in Sri Lanka. Water Policy, 7, 125-40. SHI, M. & SVENSSON, J. 2006. Political budget cycles: Do they differ across countries and why? Journal of Public
Economics, 90, 1367-1389. SINGH, A. 2008. Political Economy of Reforms: Learning from the Delhi Water Sector Experience, World Bank
Publications. STIGLER, G. J. 1971. The theory of economic regulation. The Bell journal of economics and management science,
3-21. STRAND, J. & INSTITUTT, U. I. O. S. 1998. Water Pricing in Honduras: A political economy analysis, Citeseer. SUNASS 2006a. Aprueban Sistema de Indicadores de las empresas de Servicios de Saneamiento. In: DIRECTIVO,
C. (ed.). SUNASS 2006b. Un reto pendiente - Infraestructura de Agua Potable y Alcantarillado Urbano en el Perú,
Superintendencia Nacional de Servicios de Saneamiento, SUNASS. SUNASS 2011a. Benchmarking Regulatorio de las EPS. SUNASS 2011b. Micromedicion. SUNASS 2012. Informe de Gestión 2007 - 2011. Lima, Peru: Superintendencia Nacional de Servicios de
Saneamiento, SUNASS. TANAKA, M. & ROJAS, V. 2010. La dinámica" neodualista" de una democracia sin sistema de partidos: La
situación de la democracia en el Perú. Revista de ciencia política (Santiago), 30, 87-114. TIMMINS, C. 2002. Does the median voter consume too much water? Analyzing the redistributive role of
residential water bills. TIROLE, J. 1986. Hierarchies and bureaucracies: On the role of collusion in organizations. JL Econ. & Org., 2, 181. VERGARA, A. 2011. United by Discord, Divided by Consensus: National and Sub-national Articulation in Bolivia
and Peru, 2000–2010. Journal of Politics in Latin America, 3, 65-93. WHITFIELD, L. 2006. The politics of urban water reform in Ghana 1. Review of African political economy, 33,
425-448. WORLD BANK 2012. Data Catalog. World Bank. WORLD HEALTH ORGANIZATION 2008. Water Quality Interventions to Prevent Diarrhoea: Coste and Cost-
effectiveness, World Health Organization, Public Health and the Environment.