uk infrastructure investment and finance from a …€¦ · 1 inderst advisory - discussion paper...
TRANSCRIPT

1
Inderst Advisory - Discussion Paper 2017
UK Infrastructure Investment and Finance
from a European and Global Perspective
Georg Inderst
May 2017
Abstract
This study provides an overview of UK infrastructure investment and finance in an international
context, yielding interesting facts and insights for both investors and policy makers worldwide.
The UK is one of the leading countries in terms of private sector involvement in infrastructure,
with several decades’ experience in regulating privatized utilities and in developing public-
private partnerships (PPP). It has attracted substantial European and global capital, and London
is a major market place for the infrastructure and green business.
However, the UK has also seen decades of weak spending by the state (and taxpayers) on
infrastructure. The country needs more investment when public budgets are already stretched.
The question is whether private capital will be so easily available in future, especially from
institutional and foreign investors.
JEL classification: E22, F21, G15, G18, G22, G23, G28, H54, L9, O16
Key words: infrastructure investment, infrastructure finance, project finance, public-private
partnerships, institutional investors, pension funds, infrastructure policy
Working Papers disseminate the findings of research in progress by the author(s) and are
published to exchange ideas and stimulate discussion. Comments and corrections welcome.
© Inderst Advisory, London, UK
Contact author: [email protected], www.georginderst.com

2
Contents
1 Introduction ............................................................................................................................... 3
2 The historical perspective .......................................................................................................... 4
2.1 Investment trends .............................................................................................................. 5
2.2 Development of UK infrastructure investment .................................................................. 6
3 Infrastructure investment needs ............................................................................................... 9
4 Quality and attractiveness for investors .................................................................................. 12
5 Ownership and control ............................................................................................................ 15
6 Supply of private capital .......................................................................................................... 17
6.1 Corporate finance and the RAB model............................................................................. 19
6.2 Project finance .................................................................................................................. 22
7 Public-private partnerships ..................................................................................................... 24
7.1 UK’s PFI model .................................................................................................................. 25
8 Infrastructure funds ................................................................................................................. 27
9 Institutional investors as financiers ......................................................................................... 28
9.1 Direct investment and foreign investors .......................................................................... 30
9.2 Barriers and challenges .................................................................................................... 32
10 UK infrastructure policies ..................................................................................................... 33
10.1 The National Infrastructure Plan ...................................................................................... 34
10.2 PF2 and Scotland’s NPD .................................................................................................... 37
10.3 Infrastructure financing initiatives ................................................................................... 38
11 Policy recommendations ...................................................................................................... 43
12 Summary and conclusions ................................................................................................... 44
12.1 The UK in international comparison................................................................................. 46
12.2 Lessons for investors and policy makers .......................................................................... 47
References ....................................................................................................................................... 49

3
1 Introduction
This study provides an overview of the financing of infrastructure investment in the UK in a
European, global and historical context. It evaluates the structure and development of private
infrastructure finance in the UK, and makes comparisons with other advanced economies in the
EU and the “G7+” (i.e. the G7 countries plus Australia). This broad, international perspective on a
country at a critical point in its history yields useful insights for both policy makers and investors.
The UK has been a leading country for private capital investments in infrastructure for several
decades. In the 1980s, the UK pioneered the widespread privatisation of energy and water
utilities as well as telecommunication, from which the UK model of regulated asset base (RAB)
evolved. It is also seen as one of the most mature countries for public-private partnerships (PPP),
especially in the form of the Private Finance Initiative (PFI) for social infrastructure.
At the same time, the UK gained a reputation for chronic under-investment in its economy and,
in parts, also for poor infrastructure, especially in transport. Since the financial crisis and
recession in 2007-2009, infrastructure has moved to the core of the political discussion, leading
to various attempts to spur more investment. The government initially prioritised finding private
sources of finance but there are signs of a change in policy sentiment towards higher public
spending.
This paper will discuss several key questions: How is the UK positioned in international
comparison? What are the country’s experiences with private capital involvement in
infrastructure? What is being done about the investment gap? Will the UK remain a favoured
investment destination and financial market and business location?
The paper takes a broad view on the evidence available and summarizes the key features of UK
infrastructure. It is structured the following way. Section 2 provides a historical perspective on
UK investment trends. Estimates for future infrastructure needs are reported in Section 3 while
Section 4 looks at the state of UK infrastructure and its attractiveness for investment. Section 5
summarises what is known about the ownership and control of UK infrastructure.
Section 6 turns to the supply and composition of private capital, i.e. corporate finance and
project finance. Section 7 looks at the facts for UK PPPs and PFI in a European and global context
whereas Section 8 covers the growing importance of specialist infrastructure funds. Institutional
investors, their role and challenges in infrastructure investment, are discussed in Section 9.
Section 10 moves on to the new UK policy approaches with national infrastructure plans, the
evolving project pipeline, the revised PF2 model and recent financing initiatives. A synthesis of

4
recommendations is given in Section 11. Section 12 summarises the findings and conclusions,
with a short characterisation of the UK in the international context, and lessons for policy
makers and investors.
2 The historical perspective
The UK is a country of early industrialization and urbanization with extensive construction of
infrastructure, much of which was built during the 19th century. Some early networks, such as
waterways, railways, and electricity grids, were not only innovative but also long-lasting. For
example, 40 per cent of London’s water mains are over 100 years old. The average age of sewers
in England and Wales is now about 70 years (HM Treasury 2010).
Infrastructure investment has fluctuated considerably over time in terms of volume, structure
and the source of financing. In Victorian times, railways and most other infrastructure projects
were built and financed privately. Post World War II, a large proportion of infrastructure was
nationalised. In the 1970s, public investment started to falter, as in other Western developed
countries, and “cracks were beginning to show” (Helm 2013).
In a radically different policy approach, telecom, water, gas, electricity, airports and rail assets
were privatised in the 1980s. As a result, the state-owned enterprises’ (SOE) share of GDP fell
from about 11% to 2% between 1979 and 1997 (European Commission 2016). The development
and operation of economic infrastructure1 became, to a large extent, the responsibility of the
private sector, much of it regulated by independent institutions (“regulators”). However, some
infrastructure remains in the public sector, such as roads, London’s transport network, and flood
defence. Also, there were some policy reversals, for example when the government retook
control of the railway network in 2002.
In the 1990s, the focus shifted to social infrastructure where new ways of financing through
private capital emerged. The UK developed extensive experience with PPPs, especially through
PFI, for a broad range of public services such as schools and hospitals. PFI is an alternative
procurement method where the private sector finances, builds and operates infrastructure,
while the public sector pays for services over the project life under a long term concession
agreement (“availability payments”).
1 In this paper, a common distinction of economic infrastructure (primarily transport, energy, water and waste, telecommunications and digital networks) and social infrastructure (schools, universities, hospitals, care homes etc.) is used.

5
Post financial crisis, infrastructure investment has moved up the political agenda and economic
infrastructure sectors once more became a priority. The UK state has become more
“interventionist” and “activist” in its infrastructure policies. It has developed “National
Infrastructure Plans” (NIP) and project pipelines (since 2010) as well as new institutions and
policy instruments. At the same time, PFI was reformed into the successor model PF2.
Given the difficult state of public finances, private capital was expected to continue playing a
core role in infrastructure. Several financing initiatives were launched to attract more investors
to infrastructure in a country “open for business”. In fact, international investors have been
flocking into the UK to buy real estate and infrastructure assets in recent years.
The EU referendum in June 2016 led to new uncertainties over “Brexit”, with an immediate
devaluation of Sterling and thus a cheapening of UK assets. The new administration seems to re-
emphasize public spending in both economic and social infrastructure. However, the room for
fiscal manoeuvre is limited, and one can expect that more private capital will be sought, in
particular from domestic institutional investors.
2.1 Investment trends
For some time now, the UK has been widely perceived as a “low investment country” compared
to its own historical standards and to other countries. Reasons given include the change in the
structure of the economy towards services, the slashing of (central and local) public investment
budgets, and poor capital spending by privatised industries.
Figure 1: Gross fixed capital formation (% GDP)
Source: World Bank (2017)
Capital investment levels have been on a declining trend in most industrial countries for several
decades. The UK has been 2-4% below the EU and OECD average over the last two decades in
terms of overall gross fixed capital formation (GFCF) (infrastructure and non-infrastructure) as a

6
percentage of national income (Figure 1). The UK average over the last five years (2011-2015)
was about 16% of GDP, the lowest in G7+ countries (Italy 18%, USA 19%, Germany 20%, France
22%, Japan 23%, Canada 24% and Australia 27%) (World Bank 2017). (See Table 1 for a simple
overview of the relative size of the UK economy in 2016.)
The UK’s public investment in particular declined during the 1970s and 1980s, partly due to the
privatisation of several key sectors, but also because of the reduction in public house-building.
The UK was consistently below EU and OECD average until the financial crisis. Public Sector Net
Investment (PSNI) was counter-cyclically lifted to 3.4% of GDP in 2009-10 but fell back again to
1.7% of GDP (£32bn) in 2015-16. A small rise is forecast to 2.2% by 2021 (OBR 2017).
Table 1: Size of the UK economy relative to the EU and the world (April 2017)
Source: ONS, Eurostat, IMF, Author
Note: In this report, £ refers to Pound Sterling, € to Euro, $ to US Dollar
2.2 Development of UK infrastructure investment
Figures for infrastructure investment developments are not readily available and any statistics
need to be interpreted with great care. As in other countries, there is no official statistical
definition of infrastructure investment. Estimates depend on a number of assumptions, e.g. the
exact definition of “infrastructure”, the coverage of sectors and the availability of data. Not only
the term “infrastructure” but also “investment” means different things to different people in
different contexts in economics and financial practice.2 There are still a number of conceptual
and data issues in this field and there is much scope for better statistics and more research.
2 Many figures are used in public discourse but it is not always clear what they mean. For example, “infrastructure” can refer to transport infrastructure only, to all economic infrastructure, or all social and economic infrastructure. Depending on the database, whole sectors may be included or excluded, e.g. telecommunication and digital networks. Also, there are major grey areas such as energy generation, utility conglomerates, infrastructure-related services or real estate sectors (including student homes, government offices buildings, stadiums and others entertainment buildings). Finally, data are frequently incomplete and not always transparent; data sources are often proprietary or expensive. (Beeferman and Wain 2012, Inderst 2013, Inderst et al. 2012).
Region Currency GDP 2016 of which Source
unit (bn) UK (bn) in % (April 2017)
UK £ 1865 ONS
EU € 14820 2367 16.0% Eurostat
World $ 75278 2629 3.5% IMF
G7 + Australia $ 35705 2629 7.4% IMF

7
According to McKinsey (2013), there has been a downward trend in economic infrastructure
investment in the developed world, from 3.6% of GDP in 1980 to 2.8% in 2008, but spending has
been rising in emerging economies, driven by China. Among advanced nations, the USA and the
EU both spent 2.6% of GDP; spending in Japan was much higher, at about 5% of GDP.
UK infrastructure investment has been weak compared to peer countries (Figure 2). OECD/ITF
calculations of investment (GFCF) in four infrastructure sectors (energy, water, transport and
communications) see the UK at around 2% of GDP in the 1990s and around 2¾% in recent years.
This is about one percentage point behind the OECD average (HM Treasury 2011). In transport
equipment, UK investment (0.6% of GDP) ranks lowest in the OECD countries (the OECD average
is 2.1%) (TUC 2016).
Figure 2: Economic infrastructure investment (% GDP)
Source: ITF (2017)
In an analysis of EU countries by Wagenvoort et al. (2010), the UK’s economic infrastructure
investment was about 2.5% of GDP over the period 2006-2009, below the EU average of 2.9%
(old member states pre-2004). Spending on social infrastructure amounted to about 1% of GDP
in both the EU and UK. Using a narrower definition, EIB (2016a) found lower values for EU
infrastructure investments, falling below 2% of GDP in the years 2012-2015 (of which 0.6% of
GDP for social infrastructure).3
3 Wagenvoort et al (2010) use Eurostat statistics of (government and total) gross fixed capital formation in infrastructure sectors, a measure that includes some non-infrastructure spending such as machinery and equipment, and intellectual property products. Therefore, these figures can be regarded as an “upper bound” of infrastructure investment. EIB (2016a) uses new Eurostat data in “other buildings and structures”, which is one of six asset types within GFCF. In 2014, Eurostat implemented the national accounting framework to the new European System of National and Regional Accounts (ESA 2010). EIB (2016a) is excluding the UK and six other EU countries because of lack of data.

8
The UK government provided estimates of annual economic infrastructure investment – both
public and private - of £49bn between 2010/11 and 2014/15 (2.8% of GDP). The figure is up from
£42bn (2.5% of GDP) in the previous five years (HM Treasury 2016a).
Using a broader definition of infrastructure (including extraction, manufacturing and social), PwC
(2015a) estimated a $4tn spending globally, i.e. about 5.4% of GDP. The UK’s spending is
calculated as £72bn in 2014, i.e. about 4% of GDP.4 It is expected to grow to £100bn by 2025
(3.8% of GDP).
UK infrastructure construction
For the UK, more specific data on infrastructure construction spending (public and private) are
available. It fluctuates around 1% of GDP, with peaks in the early 1990s (Channel Tunnel) and
around the 2012 Olympic Games. The sectoral compositions saw a remarkable fall in road
building (CECA 2013). There was also a dramatic shift in the construction activity to the private
sector in the 1980s and 1990s, when the share of public construction fell to 30-40%. However,
public construction has recovered somewhat in recent years (Figure 3).
Figure 3: Output in the UK construction industry (by type of work, £m)
Source: ONS (2017)
UK infrastructure capital stock
According to the ONS (2016) estimates, the valuation of the UK public infrastructure in 2015 was
£592bn (32% of GDP), of which £237bn were owned by the central government, £323bn by local
4 “Our definition of infrastructure is wide-ranging, encompassing a number of broad sectoral groupings and economic activities. We cover the sectors traditionally classified as infrastructure, such as transportation and utilities, but also analyse enabling capital projects in sectors such as extraction, manufacturing and social infrastructure.” (PwC 2015a)

9
government, and £33bn by public non-financial corporations. In addition, £467bn was recorded
for private non-financial corporations and £2bn for other institutions, resulting in a total value of
£1061bn, i.e. 58% of GDP.5
International comparison on the infrastructure stock and flows of services are not readily
available (Grice 2016). There is some evidence that the UK has a relatively low infrastructure
capital stock to GDP ratio. McKinsey (2013), e.g., found a value of 57% for the UK while most
major countries are around 70%. (Notable exceptions are “over-investing” Japan (179%) and
“under-investing” Brazil (16%)).
A similar picture emerges from Arcadis (2015) in their Global Built Asset Wealth Index that uses a
much wider definition of tangible fixed capital investment, including infrastructure investment,
construction, investments in plant and machinery. In 2015, the UK fell back to rank 13 out of 32
countries assessed, with a total value of $5tn. In terms of built assets per capita, the UK is in
place 17 behind all G7+ countries. Similar to the USA, it is an “undercapitalized” country, offering
an opportunity for future productive investment.
In summary, Western OECD have economies experienced a downward trend in fixed capital
investment since the 1970s. The UK has been hovering around the bottom end of its peer
countries. Investment in economic infrastructure is comparatively low at 2.5-2.8% of GDP, with
social infrastructure spending estimated at around 1% of GDP. As a result, the UK infrastructure
capital stock is roughly 10% lower than the average of advanced countries. There has also been a
trend from public to private infrastructure construction spending over the last three decades but
this may have come to a halt.
3 Infrastructure investment needs
That there should be more and better infrastructure is widely agreed. However, infrastructure
investment needs are not easily quantifiable.6 Future spending is required not only to maintain
existing but also to build new infrastructure. Most estimates concentrate on the investment
5 For an estimate of the “valuation of UK public infrastructure”, the ONS points at the National Balance Sheet dataset that provides estimates of the UK’s fixed non-financial assets. “Other structures” of fixed assets include roads, railways, pipelines, bridges and sports stadiums. Some assets may no longer be counted as being part of the public sector, for example as a result of privatisation (ONS 2015a). 6 Most published global estimates are based on a small number of original studies (e.g. by the OECD and World Bank) that tried to quantify infrastructure investment needs some time ago. There are two basic approaches: top-down and bottom-up. The first is based on the development of macro-statistics such as GDP and capital stock. The second is based on “micro-economic” information, such as regional and sectoral case studies, planning documents from local entities or expert assessments.

10
needs to keep pace with “normal” economic and demographic growth. Building “greener”
infrastructure for climate change mitigation and adaptation or to meet low-carbon targets
requires additional resources. The same is true when other targets for social and human
development are introduced that would require upgrades to existing infrastructure. As an
indication, the transport (21%) and energy (35%) account for much of UK’s greenhouse gas
emissions (HM Treasury 2010).
UK projections
For the UK, Helm (2009) calculated infrastructure investment requirements for Britain of £434bn
to 2020 (Table 2). This sectoral approach covers the bulk of economic infrastructure. Energy will
require over 60% of investment, half of which in renewable energy. Over a quarter would be
needed in transport and about 10% in water. Including other sectors (e.g. mobile networks and
masts, air traffic control, postal services), the aggregate figure for required investment could rise
to about £500bn, i.e. an annual spend of £50bn (3% of GDP, in 2009 prices).
These figures are considered crude and conservative approximations of minimum investments
needs, and do not include social infrastructure. Subsequently, the Institute of Directors (2010)
published similar estimates, adding up to £500bn over ten years: £300bn for energy (including
energy efficiency measures), £130bn for transport, £40bn for water and £30bn for
communications (including fibre optic networks, faster broadband).
Table 2: Infrastructure investment required in Britain by 2020
Source: Helm (2009)
International comparisons of needs
Global projections for economic infrastructure investment requirements range from a moderate
annual 2.5% of GDP to an ambitious 4.5% and beyond. Core estimates appear to be around 3.5%
to 3.8% until 2030, including emerging markets (Inderst 2013 and the literature quoted there). A
Sector Requirement Cost (£ bn)
Energy Replacement requirement 42
Energy Investment in the networks 65
Energy Renewables 136
Energy Energy efficiency 21
Transport Rail networks and high speed lines 69
Transport London transport 32
Transport Roads 9
Transport Air transport 10
Communications Nationwide roll-out of Fibre / Very High Speed DSL 5
Water Water and sewerage networks 37
Water Flood and coastal defences 8
Total 434

11
cautious projection for developed countries of 3% of GDP would result in an annual amount of
roughly £55bn (in 2016 prices) for the UK. The OECD estimate for the UK is 3.5% of GDP, i.e.
about £65bn.
The European Commission has, over the years, increased substantially its estimates of economic
infrastructure investment needs in the EU. A figure of €2tn up to 2020 was used in 2015, or an
annual amount of €400bn on average, i.e. around 2.7% of GDP. EIB (2016b) identified
investment needs in strategic infrastructure to achieve competitiveness and sustainable long-
term growth in the EU of nearly €700bn per year (4.6% of GDP in 2016 prices). The actual
spending is just over half of that, leaving an annual investment gap of €335bn.
For the USA, a region of a comparable size to the EU, ASCE (2016) estimated economic
infrastructure investment needs are $3.6tn until 2025, i.e. an annual $360bn, or about 2% of
GDP. Over half of that should go to surface transport and a quarter to electricity. In addition,
schools, public parks and recreation would need an annual $100bn, or about 0.5% of GDP.
(Telecommunication and digital, health and other social infrastructure are not included in this
assessment). To close the $2tn infrastructure investment gap, spending would need to rise from
2.5% of GDP to 3.5% of GDP over ten years.
The NIP pipeline
Starting in 2010, the UK government published a series of National Infrastructure Plans (NIP)
with annual updates, called National Infrastructure Development Plans (NIDP) since 2016. They
outline the direction of the infrastructure policy and produce an “infrastructure pipeline”, i.e.
(public and private) projects planned or underway.
The early plans covered seven key sectors (transport, energy, communications/digital, water,
waste, flood and intellectual capital). Upstream oil and gas projects were added in 2014, and
social infrastructure and housing in 2016. The latest 2016 plans set out over 700 projects and
programmes with a value of £500bn over an indefinite period, half of which (with a value of
£300bn) should be completed by 2020-21. The annual amount of about £60bn is divided
between £53bn (about 2.8% of GDP) for economic infrastructure and £7bn (0.4% of GDP) for
social infrastructure (HM Treasury 2016c).7
Overall, the UK’s future economic infrastructure needs are (conservatively) estimated to be
somewhat higher in future (i.e. increase from about 2.5% of GDP to 3-3.5% of GDP, or £55-65bn
per annum in 2016 prices). Social infrastructure could need another 1-1.5% of GDP, i.e. £20-25bn 7 The (low) social infrastructure figures exclude a planned PF2 pipeline of unknown size that is expected in 2017. (For simplicity, these percentage figures do not factor in growth projections.)

12
per annum. Additional requirements, e.g. for climate change policies or higher social targets,
would come on top of that.
4 Quality and attractiveness for investors
Infrastructure is there to provide services to people and businesses. There is not only a
quantitative but also a qualitative aspect to these services. How good is UK infrastructure? And
for investors, the key question is: How good is the UK as a place to invest in infrastructure?
The quality of infrastructure of a country can be assessed in very different ways. Some reports
rely more on a selection of “objective” data, others on subjective opinions including surveys and
expert commentary. Some studies are purely national while others create international league
tables. Here are examples of some better known indicators.
Domestic quality assessments
The Confederation of British Industry (CBI) has run an annual infrastructure survey since 2011. In
the CBI (2016) survey, 44% of the 728 senior UK business executives questioned found that
infrastructure quality had improved in the previous five years; 23% thought it had deteriorated.
However, with the exception of digital infrastructure, respondents were sceptical about
improvements over the next five years, especially in aviation, energy and roads. Furthermore,
only 26% were satisfied with the current state of their local infrastructure, 46% were dissatisfied.
The Institution of Civil Engineers’ “state of the nation” report, running since the year 2000, is
compiled using expertise from their members and “external stakeholders” across infrastructure
sectors. ICE (2014) ranked water and strategic transport (including rail, highways, ports, airports)
as B, waste as C+, energy and flood management as C- and local transport as D- (were A is best
and E is worst). Back in 2003, infrastructure was generally marked as D+, with low marks for
waste (D), energy (D+), rail (D) and urban regeneration (D).8
International comparisons
The World Economic Forum Global Competitiveness Report uses a mixed approach of statistical
information and opinions of business leaders worldwide. The message for the UK is mixed (and
somewhat confusing). WEF (2016) ranks the UK in 7th place (out of 138 countries) for overall
8 ASCE (2017) undertakes a similar exercise for the USA with similar poor results. The overall rating of US infrastructure is D+. Rail moved up to a B rating, whereas bridges, ports, and solid waste got a C+. All other categories had an unsatisfactory D rating.

13
competitiveness, and in 9th place for the sub-indicator “infrastructure”. On the latter, it is in the
mid-field of the G7+, just behind Japan, Germany and France but ahead of the USA, Canada,
Australia and Italy.9 The WEF survey also includes a question regarding the executives’ opinion of
the “quality of overall infrastructure”. Here the UK performs rather poorly (24th), only beating
Australia (33) and Italy (57) of its G7+ peers. It is less clear why the subjective assessment of the
UK looks so much worse than the combined infrastructure sub-indicator for competitiveness.
An alternative New Global Index of Infrastructure (Donaubauer et al. 2014) that only uses
objective data (without input from surveys) sees the UK in 10th position out of 140 countries and
in the middle of its peer group (behind Germany, USA, Canada and Japan but ahead of France,
Australia and Italy). The UK is ranked 9th for transport, 8th for ICT but only 32nd for energy.
“Financial infrastructure” is another new aspect in this index with the UK in 8th place.
Noteworthy that the UK’s position in 2010 has hardly changed since 1990 and 2000.
There are also sector-specific indicators available. The World Bank Logistics Performance Index
(World Bank 2016) evaluates the performance on domestic and international trade logistics. One
sub-indicator is “infrastructure”, i.e. quality of trade and transport related infrastructure (e.g.,
ports, railroads, roads, information technology). The UK is ranked 5th out of 160 countries in
2016, and 2nd within G7+ behind Germany.
Environmental indices also have some relevance for the infrastructure discussion. For example,
the Yale University’s Environmental Performance Index (EPI 2016) places the UK 12th of 180.
Within the G7+, only France is ahead of the UK. Top rankings for wastewater and electricity
access are contrasted by weaker ratings for air pollution, carbon emissions and carbon intensity.
Infrastructure investment conditions
The macro-environment of the UK has been considered one of the most favourable in the world
for some time.10 In terms of investment conditions, the positives include the stability of the
political system, clear property rights, a proven regulatory system, strong financial markets and
investor base, and high credit ratings (Citibank 2016). Uncertainties arise, for example, from
9 The “infrastructure pillar” in the WEF (2016) survey gives a weight of half for transport and half for electricity and telephone infrastructure, i.e. no inclusion of water and waste, social or other infrastructure. Looking at the three objective components, UK statistics are relatively good for air passenger transport capacity (global rank 3) and fixed telephone network (8) but very poor for mobile phone subscriptions (56). Among the six subjective assessments of infrastructure, the (perceived) quality of electricity supply (rank 11) and the quality of ports (12) compare relatively well. The quality of air transport infrastructure (18), railroads (19) and especially roads (27) are seen as less competitive. 10 Credit ratings by major rating agencies early 2017: Moody’s Aa1, S&P AA, Fitch AA, DBRS AAA, JCR AAA, Dagon A+. Most agencies downgraded the UK after the EU referendum in June 2016.

14
(actual and potential) policy reversals (e.g. in energy), the relationship with the EU and questions
over its own regional constitutions.
Some private sector reports evaluate the investment conditions and attractiveness of UK
infrastructure. In general, the UK does relatively well in these surveys, and has also been able to
attract real investment flows into infrastructure.
The Arcadis (formerly Harris) Global Infrastructure Investment Index (Arcadis 2016) aims at
ranking countries according to their relative attraction to infrastructure investors in the long run
(5+ years).11 The consultancy firm puts the UK in position 9 out of 41 countries in 2016,
improving from 10th in 2014 and 13th in 2012. It is behind Canada and the USA but ahead of
Australia, Japan and the other large EU countries.
The Nabarro Infrastructure Index (Nabarro 2016) is another measure of infrastructure
investment attractiveness.12 The UK is ranked top out of 25 countries by the law firm. Among the
factors of strength are the relatively high degree of private sector participation in infrastructure
projects, the “ease of doing business” and “national stability”.
The G20’s Global Infrastructure Hub developed an “InfraCompass” that identifies the key drivers
of successful infrastructure planning and delivery in various jurisdictions (GIH 2017). Three
drivers are related to policy (governance, regulatory, permits) and three related to delivery
(plan, procure, deliver). The United Kingdom broadly performs above the average among
developed countries in most of the 38 metrics.
Some indices, however, contain warning signals. For example, the Renewable Energy Country
Attractiveness Index (RECAI) has seen the UK’s position gradually deteriorating in recent years. In
the latest edition (Ernst & Young 2017), the UK is in place 10, down from place 5 in 2010. This is
mainly due to the volatile government energy policies. Among G7+, only Canada (11th) and Italy
(18th) are currently ranked lower.
To sum it up, quality assessments of the infrastructure in the UK give a mixed picture. National
surveys rate most of UK infrastructure rather poorly. In international surveys, the country is seen
in the mid-field of comparable economies with a great variation across sectors: water and waste
11 This assessment is based on national statistics and open source data focused on anticipated investment, ease of doing business and comparable levels of investment risk. The ranking uses 24 indicators across five categories (economy, business environment, risk, infrastructure, finance). 12 It indicates which jurisdictions promise to be the most fertile for infrastructure investments, and which have delivered in the past. The index collates quantitative information on each market based on 13 individual indicators that are grouped in six sub-indices: credit and stability, sustainability and innovation, tax environment, national stability, ease of doing business and private participation rate sub-index.
15
tend to look solid, energy about average, but there are also rather poor transport networks. In
contrast, UK infrastructure is widely considered as an attractive investment target but there are
warning signals on the horizon. Social infrastructure is rarely covered by such assessments
although that would be desirable.
5 Ownership and control
Who owns UK infrastructure? Since privatisation, the utility companies have undergone a shift in
ownership. Many listed companies were acquired by large global utility corporate entities and
then, in more recent years, infrastructure funds, sovereign wealth funds (SWFs) und pension
funds (Helm and Tindall 2009). These new “specialist infrastructure investors” now control 56%
of the water and sewerage industry, the major airports, as well as many electricity and gas
distribution networks (PwC 2015b).
In 2010, the Office of Fair Trading (OFT 2010) undertook a one-off stock-take of the ownership
and control of UK economic infrastructure. It analysed over 200 companies operating in four
economic infrastructure sectors (energy, water, transport and communications). 42% of UK
infrastructure companies are listed, 29% of which are listed in the UK (such as the well-known
energy or water utilities) and 13% on a foreign stock exchange (such as RWE, Veolia). 31% are
under private ownership, e.g. by an infrastructure or private equity fund, pension fund or bank.
18% are owned by local or central government, and 9% by not-for-profit organisations.
There are significant differences across sectors. Listed companies are prominent in energy and
telecommunications. There is greater involvement of private companies in water, waste, ports,
airports and car parks. And there is a relatively high proportion of not-for-profit operators in the
rail sector (primarily because of Network Rail) and in ports (trust ports).13 Given cross holdings
and indirect investments, it is difficult to work out the ultimate owner of UK infrastructure but
the OFT (2010) report gives some indications. Domestic institutional investor ownership is about
one third.14 Over the last ten years, there has been a move away from UK listed companies
towards infrastructure funds and overseas owners. Overseas ownership is approximately 38%.
Foreigners appear strongly represented in airports and waste but less so in the rail sector.
13 When the government re-took control over the rail network in 2002, Network Rail was created as a formally private “not for dividend” company with government guarantee. Following the implementation of the ESA10 in 2014, it was reclassified as a central government body. Discussions are ongoing about full nationalisation or full privatisation (e.g. Wellings 2016). 14 For example, pension funds hold 7% of UK infrastructure (of which 3% privately and 4% via listed companies). In this calculation, insurance companies only hold listed companies (4%) while infrastructure funds (10%) and private equity funds (2%) only have private holdings.

16
The magazine Financial News (Cobley 2014) undertook an update of the 234 regulated assets in
the UK as identified by the OFT in 2010. The proportion held by infrastructure and pension funds
rose from 22% to 28% between 2010 and 2013, while the share owned by listed companies
dropped further from 30% to 25%. It is also worth noting that the ownership of stocks on the
London Stock Exchange (LSE) by overseas investors has risen from under 10% in the 1960s-1980s
to 31% in 1998, and to 54% in 2014 (of which 26% from Europe) (ONS 2015b).
Foreign direct investment
The UK has been successful in attracting investors from overseas. “The UK starts from a strong
position, as the leading location for Foreign Direct Investment (FDI) in Europe” (HM Government
2017, p. 79). A high proportion of FDI goes into infrastructure industries.15 Some of FDI goes into
new projects. According to FT (2016), in 2016 and 2015, the UK received $53bn and $35bn of
greenfield FDI, a share of 34% and 28% of Europe. The UK is the leading destination for wind
power projects, with investment peaking in 2015 at almost $8bn. As for the future, Pinsent
Masons (2014) expect particularly strong inflows from China into UK real estate and
infrastructure until 2025 (£105bn, of which £43.5bn into energy and £35.5bn in transport).
The high degree of non-domestic ownership in infrastructure is seen as problematic by various
sides (e.g. Raco 2016). The UK water sector is a popular example. Of the 10 privatised water
companies, only three remain listed on the LSE. Six are unlisted water companies, and one
(Welsh Water) is run as a not-for-profit company (Allen and Pryke 2016). Many rail companies
are run by Dutch, French, German, Italian or Chinese companies (Topham 2017).
Foreign ownership of “critical” sectors or industries, including “strategic infrastructure” is subject
of political discussions in many places. Several Western countries have introduced FDI limitations
or review procedures to protect national interests and security, e.g. France, the USA, Italy,
Canada or Australia (UNCTAD 2016).
In conclusion, the UK’s infrastructure has a remarkably broad mix of owners. As a result of the
privatisations in the 1980s, only about one third is left in public hands, most notably the roads.
Specialist investors such as SWFs, infrastructure funds, private equity and pension funds have
increased their exposures in recent times. The UK has been very open for FDI. About 40% of the
country’s infrastructure is owned by foreign investors although this varies widely across sectors.
15 “The UK reached a total of $1,606 billion (£975 billion) last year in Foreign Direct Investment (FDI) stock, which is almost $500 billion more than any other European country. Over half of the £975 billion FDI in the UK in 2013-14 is in energy or other infrastructure schemes, also creating 31,261 jobs.” (HM Treasury 2014, p. 110).

17
6 Supply of private capital
Let us now turn to the supply of capital for UK infrastructure and its composition. The public
sector was central to the ownership, financing, and delivery of infrastructure services post-World
War II. The traditional approach relies on governments using its revenue (either from taxes or
borrowing) to finance new or upgrade existing infrastructure. The design and construction can
be procured through competitive tenders from private firms but the state still owns and
operates projects after completion.
Private participation rose in several countries from the 1980s as a result of privatisations and,
from the 1990s, with PPP schemes. Today, most developed countries, with the notable
exception of Japan, have a higher share of private financing in infrastructure than developing
countries. For example, in the EU, the ratio of public to private financing is roughly 1:2 to 1:3 in
the old member states (Wagenvoort et al. 2010). There are different dimensions to the supply of
capital for infrastructure (Figure 4):
Figure 4: Sources of infrastructure finance
Source: Author
1. There are public or private sources of finance. Public capital comes from central, regional,
local and other government institutions, plus national and international development banks,
such as UK Green Investment Bank or the European Investment Bank (EIB).
2. Private capital is provided in two main forms: corporate finance (financed “on balance sheet”
from the own resources of operating or service companies) and project finance, a contractual
financing arrangement that is particularly important in infrastructure.16
16 Project finance is the financing of long-term infrastructure, industrial, extractive, environmental and other projects or public services (including social, sports and entertainment PPPs) based upon a limited recourse financial structure where project debt and equity used to finance the project are paid back from the cash flow generated by the project (typically, a special purpose entity (SPE) or vehicle (SPV)).

18
3. Within corporate finance, one can distinguish between listed (publicly traded) and unlisted
(privately traded) companies. Within project finance, one can distinguish between PPP and
non-PPP arrangements. PPPs are a form of project finance that involves a contract between a
public sector authority and a private party to provide a public project or service.17
4. There is typically a mix of equity and debt (loans and bonds) finance. Infrastructure and PPP
projects in particular are often highly leveraged.
5. Infrastructure companies can operate in a regulated or unregulated business.
From an investor perspective, this results in a multi-dimensional universe of equity and debt
finance, listed and unlisted investment vehicles, direct and indirect (e.g. funds) investment
routes. Table 3 presents the main investment instruments used in the market.
Table 3: Infrastructure investment vehicles
Source: Author
Funding and financing of UK infrastructure
In the discussion of infrastructure, the terms “funding” and “financing” are often used
interchangeably, even in official and academic documents, which can create considerable
confusion. It is advisable to clearly separate the definitions:
Funding: the ultimate revenue source (who ultimately pays for infrastructure, i.e. the
users/consumers or taxpayers (via some form of state budget), or a combination of both.
17 Depending on the constituency, such schemes are referred to as PPP, P3 or PFI. Typically, a public sector consortium forms a SPV to develop, build, maintain and operate the asset for the contracted period. The risk-sharing depends on the specific contract.

19
Financing: the provision of upfront capital for an infrastructure, which is primarily an
intermediary activity. There are public, private or combined sources of finance.
About 70% of the UK economic infrastructure is estimated to be funded by private sources.
There are examples of public funding (most roads), private funding (e.g. major airports, cable
networks, energy, water and sewerage, commercial waste disposal) or mixed public/private (e.g.
Network Rail). Table 4 gives an overview of both the current funding and the financing (and
regulatory) regimes across economic infrastructure sectors in the UK.
Table 4: UK economic infrastructure funding and financing models
Source: HM Treasury (2016b)
We now look at the main building blocks of data, keeping the various conceptual and data issues
in mind in relation to the information available.
6.1 Corporate finance and the RAB model
Traditional corporate finance is the dominant force in private infrastructure finance in the UK,
much of it regulated by independent institutions according to the UK model of “regulated asset
base” (RAB) (Box 1).18 Most of the investment in regulated sectors is “on balance sheet”. The
same is true for developers in unregulated sectors, such as waste management, ports, major
airports, oil & gas, and traditionally also in electricity generation.
18 In the RAB model, private (or corporatized state-owned) companies act as the infrastructure manager: they own, invest in and operate infrastructure assets. The manager receives charges revenue from users and/or subsidies to fund its operations and recoup investment costs. To control a natural monopoly, an economic regulator is established to provide efficiency incentives and to cap prices, revenue, rates or return received by the infrastructure manager to improve social welfare (Makovšek and Veryard 2016).

20
Box 1: The UK model of utility regulation
The British model of independent utility regulation started with the Littlechild Report on telecom
regulation in 1983. It set out the key aspects of the regulatory framework for Oftel, the new
telecom regulator, in connection with the privatisation of British Telecom. Since then,
independent economic regulators have also been established for other sectors (UKRN 2014):
- electricity and natural gas: Office of the Gas and Electricity Markets (Ofgem)
- water: Water Services Regulation Authority (Ofwat for England)
- large airports: Civil Aviation Authority (AAA)
- railways: Office of Rail Regulation, since 2015 Office of Rail and Road (ORR)19
- broadcasting, telecommunications and postal industries: Office of Communications (Ofcom)
- regional regulators (e.g. The Utility Regulator, regulating electricity, gas, water and sewerage
industries in Northern Ireland).
The RAB model was developed to value existing assets as a part of the privatisation process. It is
used mainly for (economic) sectors funded by user/consumer payments. The RAB model was
also proposed for social infrastructure but the UK governments have favoured a PPP model in
those sectors.
The main characteristics of the UK regulatory system are private ownership, competition,
independence and “light-handedness”. The central feature of the “incentive-based” price
regulation in the British utility model is the periodic resetting of regulated prices (5-8 years) in
the light of forward looking efficiency gains and investment requirements, using an expected
weighted average cost of capital (WACC) (Stern 2014).
In terms of investment, it has brought significant amounts of capital into infrastructure at both a
low cost and a long-term basis (Helm 2009). Some sectors did better than others. For example,
£126bn has been invested in water infrastructure alone since privatisation, according to the
National Audit Office (NAO). The UK regulated networks also received a vote of confidence from
infrastructure investors who invested an estimated $66bn between 2002 and 2015, of which
$52bn in water and waste (First State Investments 2016). Nonetheless, under-investment has
remained a much discussed issue in UK regulated infrastructure.
19 Since 2015, ORR is also responsible for monitoring and enforcing the performance and efficiency of Highways England (which was previously the Highways Agency). Highways England maintains, renews, operates and improves the strategic road network – the motorways and main “A” roads in England.
21
Listed infrastructure equity
Companies listed on public exchanges are sizeable owners of infrastructure assets, providers of
infrastructure services and investors in infrastructure projects. They range from specialist
businesses to diversified conglomerates. In the UK, utilities have been an important element of
stock markets since their privatisation; they have substantial weight in investor universes and
indices. UK regulated firms have an enterprise value of over £150bn (HM Treasury 2016b).
The UK All Share Index had a market capitalisation of $2.2tn as of end 2016. The five stocks in
the telecoms (£82bn) and the seven stocks in the utilities sectors (£79bn) had market weightings
of 3.7% and 3.5% respectively. Transport infrastructure is barely represented in the UK listed
stock universe, in contrast to some countries on the Continent. In addition, there are a number
of listed infrastructure funds (e.g. 3i, HICL, IPP, GCP, John Laing) that invest at least part of their
assets in the UK. The AIC (2017) lists seven infrastructure funds (£8.4bn), six renewable energy
funds (£3.6bn) and three utility/water funds (£0.2bn) with a total market capitalization of over
£12bn, i.e. a combined weight of about 0.5% of the stock market.
Summing up the various segments, infrastructure stocks (in a broad definition) represent about
9% on the London stock market, and about 11% in relation to GDP. In addition, there are
corporations in other sectors such as construction (e.g. Balfour Beatty, Carillion) or oil & gas that
undertake infrastructure investments, at least as part of their activities.
Infrastructure companies constitute about 5-6% of global stock markets (S&P 2007, Inderst
2010). With the emergence of the infrastructure investment theme in the mid-2000s, the major
index providers all started to offer specialist infrastructure indices. Today, global infrastructure
stock market indices contain a diverse range of infrastructure (and utilities) companies with a
market capitalisation up to $3tn.20
Indices vary greatly in terms of country weightings. The weighting of the UK is typically in the
range of 5-10% (GLIO 2017).21 At the end of 2016, National Grid was by far the largest UK stock
in global listed infrastructure indices. Other stocks appearing include United Utilities, Severn
Trent, SSE, Centrica, Pennon, Inmarsat and Vodafone.
20 There are differences between indices in terms of the size and number of stocks included, the countries and regions covered, and the particular index methodology. The main differences concern the selection of sectors and sub-sectors for such indices, especially telecom companies and diversified utilities. Some indices contain over 80% utility stocks. 21 For example, the UK weighting in the Dow Jones Brookfield Global Infrastructure Index is 8.5%, in the S&P Global Infrastructure Index 5.8%, in the MSCI World Infrastructure Index 6.5% and in the FTSE Global Infrastructure Index 5.4% at the end of 2016.

22
Corporate bonds
Utility and telephone companies in the UK regularly issue corporate bonds (fixed coupon and
index-linked) that have traditionally been popular with institutional and individual investors.
Infrastructure bond indices were unknown in the past except in Canada and in the US municipal
bond market. Given the increasing investor interest in infrastructure debt, new global indices are
being created in this field. For example, the Dow Jones Brookfield Global Infrastructure
Corporate Bond Index was started in 2015 and the Markit iBoxx infrastructure bond indices for
investment grade corporate bonds in $, € and £ in 2016.
To recap, around 70% of UK infrastructure is estimated to be financed by private sources of
capital. Traditional corporate finance is the dominant force; much of it is regulated by
independent institutions in the UK RAB model. Listed companies play an important role for
infrastructure investment. In international comparison, one can note a strong presence of
privatised utility and telecom stocks (weighting of nearly 10% on the LSE), and a near-absence of
transport in the UK public listings. Social infrastructure is widely absent from the stock markets
everywhere. The UK has a weighting of 5-10% in global infrastructure indices. London is also one
of the main markets for listed infrastructure funds.
6.2 Project finance
Project finance has traditionally been used for both private and public infrastructure. Project
finance statistics are often used for representations of private finance developments in
infrastructure. However, it should be noted that project finance reaches beyond infrastructure,
and infrastructure investment goes much further than project finance.
According to Dealogic (2015), the global project finance volume (equity and debt) was $408bn
from about 1100 deals in 2014. Annual volumes have fluctuated in the region of $400bn in
recent years. The regional shares tend to fluctuate considerably over the years, especially in
Europe. European project finance volumes have been in the range of $60-110bn since the late-
2000s. Europe has relatively high share of renewable energy and social project deals (social
infrastructure is typically included in project finance databases (Inderst 2013)).
The UK is one of the leading countries for project finance although activity fluctuates. The UK
was in fifth position in 2014 in the country rankings behind the USA, India, Australia and Brazil.
The volume of $18bn from 48 deals gave the UK a market share of 23% within Europe and 4%
globally. In 2013 (2012), the UK was in fourth (fifth) position with a market share of 45% (27%)
within Europe and 8% (5%) globally.

23
InfraDeals (2016) collects data on project finance transactions in infrastructure sectors. UK deal
volumes were $52bn in the year 2015 and $41bn in 2014. This leaves the UK with a global
market share of 15% in 2015 and 16% in 2014. Transport (share of 35% in value terms),
renewables (28%) and water & waste (22%) are the largest sectors. Social infrastructure has a
share of 9% in the UK.
Project finance debt market
Europe is notoriously “bank-centric” in its infrastructure finance. Project finance debt markets
took a hit during the financial crisis, especially in Europe including the UK. Many banks are still in
the process of repairing their balance sheets. With Basel III regulation, European banks were said
to be less willing and able to finance over longer maturities. However, there has been some
recovery in the commercial loan market in recent times, not the least boosted by very
expansionary monetary policies. Also, some non-European banks, e.g. Japanese banks, have
continued to offer long-term loans to infrastructure projects.
The data provider Thomson Reuters (2017) concentrates on project finance loans. The global
loan volume in 2015 was $231bn from 765 deals; the European volume was $87bn from 335
deals. The UK posted 72 transactions with a loan volume of $18bn in 2015. The UK’s market
share in 2015 (2014) was 21% (24%) within Europe and 8% (6%) globally.
Project bonds and green finance
Project bonds22 constitute about 10% of global project debt in the long term. They are
historically more common in North America than in Europe. As an example, Canada is a country
with a well-established project bond market, and a history of insurance companies being long-
term investors in them. Project bond markets came to a near standstill during the financial crisis
with the demise of “monoline” insurance companies but new issues have recovered over the last
few years. Some help was given by the Europe 2020 Project Bond Initiative by the EU and the
EIB. It aimed at kick-starting an ailing capital market and at facilitating more private finance of
infrastructure projects (European Commission 2011).23
22 Project bonds are debt instruments issued by project finance companies for investment by institutional investors and other financial institutions. They are often tradable on secondary markets but can also be private placements. 23 Credit enhancements in the form of a subordinated instrument (either a loan or a contingent facility) should make senior bonds more attractive for institutional investors. Many investors require an investment grade rating (i.e. above “BB”), if not a “single A”, as a minimum requirement.
24
According to InfraDeals (2016), the UK placed project bonds with a value of $2.9bn and $4.7bn in
capital markets in 2015 and 2014, i.e. 6% and 12% of the infrastructure project finance deal
volume. Examples include social housing and student accommodation in the UK.
“Green finance” has been rising strongly in recent years, including the issuance of “green” or
“climate bonds”. The definition of green bonds varies in several respects, and it includes both
corporate and project bonds. The City of London (2016) counted 39 green bonds listed on the
LSE, raising $9.3bn in seven currencies. Furthermore, 38 green companies have raised $10bn,
including 14 renewable investment funds and 12 alternative fuel companies.
In summary, there have been strong fluctuations in the global project finance markets. The UK
project finance volume is sizeable compared to GDP (about 1-2%). The UK also has an above-
average market share of deals within Europe and worldwide. The European market for project
bonds has revived since 2013 but is still very small. London is a centre of the global project
finance and green bond business.
7 Public-private partnerships
Public–private partnerships (PPP) have become increasingly relevant for public infrastructure
investment, as an alternative to spending by the governments or private-sector infrastructure
companies. The UK and Australia were early adopters of PPPs in the 1990s, with PPPs accounting
for around 10% and 5% of public investment in infrastructure (OECD 2014a). Many other
countries followed, including Canada that developed one of the most efficient PPP models.
Global PPP volumes were in the region of US $ 60-100bn in total in recent years. According to
Dealogic (2015), the 2014 total volume was $72bn, compared to $95bn and $63bn in previous
years. The share of PPP within project finance ranges is traditionally 15-25%. Western Europe
was the leading region in terms of PPP, with a market share of 25% in 2014, 28% in 2013 and
24% in 2012.
The European PPP Expertise Centre (EPEC) reported PPP figures for the European markets in the
region of €12bn-21bn since 2009, i.e. around 0.1% of GDP. The best years were 2005 to 2008. In
2016, the volume was €12bn, down from €15.6bn in 2015. However, the number of deals was up
from 49 to 69. The UK was the largest market with a volume of €3.8bn in 2016 (EPEC 2017). In
the past, the UK accounted for nearly half of European PPP volumes but the share has declined
substantially due to the sharp fall in PFI deals in social infrastructure.
Over the five year period 2012 – 2016, the UK and France posted the highest number of deals.
In terms of volume, the UK volume is €24.8bn, equivalent to about 0.2% of GDP. It has the

25
highest market share over the five years of 31% of the European volume of €78.8bn, followed by
Turkey (25%), France (12%), Italy (7%) and the Netherlands (7%) (Figure 5). Within EU countries,
the UK’s share is 42%. Transport is by far the strongest sector in terms of volume across Europe
while the highest number of (smaller) deals is in social infrastructure, especially education.
Figure 5: The European PPP market by country over the period 2012-2016 (€bn)
Source: EPEC (2017)
Europe’s PPP bond market is rather small and underdeveloped. There was an exception in the
UK, where PFI bonds were more common before the financial crisis, typically “wrapped” or
guaranteed by a ‘monoline’ insurer. Institutional investors reportedly bought approximately
£15bn of bonds issued by PPP project companies in the UK between 1997 and 2008. PPP bonds
have re-emerged since 2013.
7.1 UK’s PFI model
In the UK, PPPs are not used for all infrastructure sectors but are concentrated on social
infrastructure, municipal waste management and on transport projects, e.g. some motorways,
tunnels and bridges (starting with the Channel Tunnel by a French-British consortium in 1986).
The UK Private Finance Initiative (PFI) is a form of PPP. It was announced in 1992 to enable the
use of private money to deliver the design, construction and servicing of a range of public
infrastructure.24 After a review of PFI, the UK Government set out a new approach called PF2 in
2012. This procurement method accounted for about 25% of public sector capital investment
24 Most of UK PFI follows the DBFO model (design, build, finance and operate) or BOOT model (build, own, operate, transfer) of private sector participation. There are other PPP contractual schemes in place in many other countries (see, e.g., Engel et al. 2015, RICS 2013).

26
between 2000 and 2012. PFI has been dominant in some sectors, accounting for 70% of schools
and 60% of hospitals (TheCityUK 2014).
UK Government statistics show that 716 PFI projects had reached financial close to the end of Q1
2016, with an aggregate capital value of £59.4bn. The value of PFI projects has been declining in
recent years from a peak of £7.2bn in 2006 to around £1bn since 2013 (Figure 6). The number of
projects has dropped from 50-70 annually during the period 1999-2007 to less than 10 per
annum (HM Treasury 2016d). This is a fall from about 0.5% of GDP to less than 0.1%.
Figure 6: PFI project numbers and capital values
Source: HM Treasury (2016d)
Over the period 1992-2012, the majority of PFI went into social infrastructure: hospitals £13.5bn
(share of 24%), schools £12.1bn (21%) and offices (e.g. fire & police, courts, service centres)
5.1bn (9%) (TheCityUK 2014). However, the health and education sectors saw particularly
pronounced declines in recent years. In terms of economic infrastructure, transport projects had
a total capital value of about £7.6bn (share of 13%) and waste treatment £4.7bn (8%) over the
20 years. In terms of size, only 6 projects had a capital value above £1bn. Most of the large
projects were concentrated in defence or in transport.
To sum it up, European PPPs suffered under the financial crisis and recession. In the UK, policy
changes for PFI also contributed to the setback. PFI volumes have fallen back from about 0.5% of
GDP in 2006 to less than 0.1%. The UK had in the past produced nearly half of Europe’s PPP
volumes, primarily driven by social infrastructure, but the share has declined to about 30%,
equivalent to about 0.2% of GDP. Transport PPPs still play a smaller role in the UK than on the
Continent. PPP bonds have re-emerged over the last few years.

27
8 Infrastructure funds
Since the emergence of the infrastructure investment theme in the mid-2000, much of the focus
has been on private infrastructure investments, especially on infrastructure equity funds. In
recent years, interest has also risen in debt funds, and in direct investments in infrastructure
projects and companies by large investors. We now take a look at some figures for the capital
raised by such funds, the volume of deals they generate, and the UK investor base in this field.
Specialist funds
Dedicated infrastructure funds were first created in Australia in the 1990s, and were typically
listed funds. Since the mid-2000s, private equity-type, closed-end infrastructure funds have been
growing in Europe, the USA and elsewhere. Data provider Preqin reports over $300bn unlisted
infrastructure assets under management at the end of 2015 from over 400 funds globally (Preqin
2016a). Early in 2017, a further 168 funds went on the market, seeking $102bn in new capital.
The majority are equity funds but lately private debt funds have been growing on the market. 95
unlisted debt funds have reached financial close since 2006 with an aggregate volume of $43bn.
The UK-based unlisted infrastructure fund market is the largest in Europe, with roughly half the
capital raised for Europe-based infrastructure funds over the last three years (Preqin 2016b). The
database records 113 UK-based funds that reached financial close since 2006 with a combined
volume of £51bn, i.e. about £6bn per year on average. Preqin also found 66 asset managers with
headquarters in the UK in 2013 in charge of 91 funds with an aggregate capital of $69bn, giving
the UK a global market share of 22%. The unlisted infrastructure market shows a high degree of
concentration. Macquarie Infrastructure and Real Assets (considered a manager with UK
headquarter in this survey) manages 40% of these assets.
As an alternative data source, Willis Towers Watson (2016) reported $375bn in infrastructure
funds managed by 58 infrastructure fund managers globally. 45% of them are based in Europe,
32% in North America, 18% in Asia and 5% elsewhere. The largest manager, Macquarie Group
(considered to be domiciled in Australia in this survey) controls a quarter of the assets under
management, totalling $95bn. There are 14 UK infrastructure fund managers in the survey of
602 alternative asset managers, with a total infrastructure volume of $41bn, i.e. a combined
market share of 11%. The three largest UK-domiciled funds are InfraRed Capital Partners (assets
under management $6.8bn), Hermes ($5.1bn) and Aviva ($4.4bn).
Deals by infrastructure funds
Preqin registered around 1000 deals per annum worldwide with a reported annual deal value
around $200bn in the years 2013-2016, of which about 40% are in Europe. The UK is by far the

28
most important market in Europe, with over half of the deals and nearly half of the transaction
values over the period 2008-2015. There are about 100-250 UK deals per annum, and the annual
reported deal value is about £25bn on average over the last decade, i.e. 1.5% of GDP (Figure 7).
Renewable energy and social infrastructure constitute the highest numbers of UK transactions.
Volumes are influenced by some larger transport and other energy deals, e.g. the Hinkley Point C
(a deal worth £18bn) and the Thames Tideway Tunnel (£4.2bn). In international comparison, the
UK has recently been strong in several sectors (e.g. number 1 in social infrastructure, airports
and wind power, and number 2 behind France in nuclear energy).
Figure 7: Number and Value of UK Infrastructure Deals, 2006- April 2016
Source: Preqin (2016b)
Overall, private equity investments by specialist infrastructure funds have become an
increasingly important financing vehicle for infrastructure projects. The UK gets about half of
European and around one fifth of the global deals, with a volume of 1-2% of GDP. It has a
particularly strong presence in social infrastructure and green energy. More recently,
infrastructure debt investing has become more popular. London is an financial centre with a high
share of headquarters of infrastructure fund managers.
9 Institutional investors as financiers
Institutional investors traditionally play an important role in the UK for capital markets and the
economy. However, the importance of UK institutional investors on the UK stock market has
been falling for some time. UK insurance companies held about 6% of the UK stock market in
2014, UK pension funds about 3%, which is much less than in the 1980s (ONS 2015a).

29
The main reason is a sharp trend towards “de-risking” that has an important side-effect on the
provision of capital for infrastructure investment. To illustrate this: the asset allocation of UK
pension funds to domestic equities was down by about two thirds to 16% between 2001 and
2015 (UBS 2016). Assuming, for simplicity, that 10% of the stock market is infrastructure-related,
this implies a holding of 1.6% instead of 4.6% in utility stocks, i.e. a reduction of about £60bn.
Preqin (2016b) keeps 237 UK-based infrastructure investors in the database with total assets of
£4.8tn. 60% of the UK universe invests indirectly into infrastructure via unlisted funds, 21% in
listed funds and 19% directly. Private pension funds are more strongly represented among
infrastructure investors in the UK (33%) than on the Continent (17%). The opposite is true for
insurance companies. The share of UK direct investors in infrastructure projects is markedly
smaller than in the rest of the Europe (29%).
Among the global top 100 infrastructure investors, 12 are UK based (Preqin 2015), the largest
being the insurers Legal & General (with infrastructure assets of $4.6bn), Prudential/M&G
($3.1bn), and the USS pension scheme ($3.2bn). A different investor survey calculated by S&P
(2016) lists 11 UK names among the top 100 global infrastructure investors with combined assets
of about €9bn. The largest investors on this list are USS, Lloyds Banking and BT Group.
Pension funds
There are no precise figures available on pension funds’ investments in infrastructure. In general,
the asset allocation is still low, as one can deduct from the pieces of evidence available on
unlisted or private investments in infrastructure. To start with the leading countries, Australian
and large Canadian pension funds have been pioneers in this field since the 1990s and early
2000s. The average asset allocation to unlisted (or private) infrastructure is estimated at 5-6% of
assets in these two leading countries (Inderst and Della Croce 2013). In Europe, some larger
pension funds started dedicated infrastructure investments in the mid-2000s, and the number of
investors has been rising since. Other regions have followed.
Willis Towers Watson (2016) found $127bn of global pension fund investments in infrastructure
funds with the top 100 alternative managers. The OECD (2016) survey collected data from 99
large pension funds and public pension reserve funds, 23 of which provided data on their
infrastructure allocations. It revealed $74bn of unlisted infrastructure equity and $11bn of
infrastructure debt investments. However, infrastructure assets were only about 1% of the asset
allocation of the full universe of funds.
Mercer (2016), a consultancy firm, surveyed 1100 institutional investors in 14 countries with
total assets of €930bn. The survey is biased towards the UK investors, who held 56% of assets in
30
2016. 5% of investors had holdings in infrastructure with an average asset allocation of 4%
among them. Large schemes are much more likely to invest in infrastructure than smaller ones.
UK pension funds
UK pension schemes own assets of about £2tn, i.e. over 100% of GDP. The majority of pension
schemes investors (still) have little or no investments in this field, especially smaller ones. UBS
(2015) shows an average infrastructure allocation of 1.5% by UK corporate and 1% by local
authority schemes. The PLSA (2016) finds about 20% of a sample of 125 UK “defined benefit”
(DB) funds invested in infrastructure, with an allocation of less than 2% of assets among them.
Furthermore, it can be assumed that infrastructure constitutes only a minimal part of the rising
number of “defined contribution” (DC) schemes.
However, the UK pension funds activity has risen over the past few years. Data collected from
Local Government Pension Schemes (LGPS) show that their infrastructure holdings have more
than doubled from 148 in 2015 to 388 in 2016, with a market value up from £1.8bn to £4.5bn,
i.e. about 2% of assets (Long 2016).
In Preqin’s database, around 130 UK (private and public) pension funds are reported to be active
in infrastructure (Preqin 2016b). The average asset allocation to infrastructure by the reporting
funds is 3.6%; the target asset allocation is 4.8%. The largest schemes in this respect are USS
(£3bn), BT (£1.7bn), Railways (£1.3bn) and the TfL Pension Fund (£0.4bn).
Insurance companies
UK insurance company assets are about £1.9tn (ABI 2015). Traditionally, insurers hardly had any
investments in unlisted infrastructure assets. Across Europe, a volume of €11.7bn (based on 13
European insurance companies’ survey responses) is reported for 2011, only a tiny fraction (of
about 0.1%) of the €7.4tn of assets (Insurance Europe 2013). However, many European and UK
insurers and their asset management subsidiaries have lately become more active, especially on
the infrastructure debt side. Traditional bank loans have in some places been substituted by
direct private loans from non-bank institutions.
9.1 Direct investment and foreign investors
The “Canadian model” of infrastructure investing has received much attention. It consists of
taking direct stakes in infrastructure companies, internal asset management (or by controlled
subsidiaries) and strong governance principles (Inderst and Della Croce 2013). It has been
followed by large pension funds especially in Australia, the Netherlands, Northern Europe and

31
elsewhere. There are several examples of direct ownership such funds in the UK.25 With a few
exceptions, UK institutional investors have joined this trend rather late. Several UK pension
funds are known to hold equity stakes directly.26
Direct investments are being undertaken by all sorts of other investors, such as SWFs,
investment funds and wealth managers. Developers, contractors and industrial corporations
have also become active in this space. They often co-invest as consortia, syndicates or in other
forms of co-operation. A substantial part of direct investments come from abroad. Table 5 lists
some examples.
According to Preqin, over 60% of SWF now invest in infrastructure. They have increased their
interests in UK infrastructure in recent years. The UK and the US were the leading destinations
for direct SWF investments between 2007 and 2014 with a share of 16% each (TheCityUK 2015).
For the most part, SWFs have historically been active in existing assets rather than new,
greenfield projects.27
Table 5: Examples of recent Non-EU Investment in UK Infrastructure
Source: TheCityUK (2015)
25 For example, Canadian pension funds (OMERS, OTPP, CPP) invested in UK ports, water companies, telecom, airports, HS and others. Gatwick Airport has the private equity firm GIP as main shareholder, with several SWFs (Abu Dhabi) and pension funds as co-investors (US CalPERS, Australian Futures Fund, Korean National Pension Service). 26 They include the BT Pension scheme in Thames Water, and the USS in Heathrow and the National Air Traffic Services. The Environment Agency pension fund invests via funds in in renewable energy and energy efficiency. 27 There are examples of holdings of UK utility assets such as the China Investment Corporation (CIC) and Abu Dhabi Investment Authority’s investments in Thames Water. In 2012, CIC also acquired a stake in Heathrow Airport. Safe Investment Company invested in Affinity Water in 2012 and in BP in 2010. The Singaporean GIC has investments in UK ports and water. (TheCityUK 2015, City of London 2013)

32
9.2 Barriers and challenges
The general barriers and constraints in infrastructure investment for institutional investors,
especially pension funds, have flagged in the past (e.g. Inderst (2009), Della Croce (2011),
Panayiotou and Medda (2014)). There are constraints on the supply side (e.g. regulatory
uncertainties, lack of suitable projects), demand side (e.g. investor resources and capability), and
in the intermediation process (e.g. inappropriate, expensive fund vehicles). In the UK, one factor
is the enormous segregation of the pensions system and the lack of scale of individual funds.
The UK pension system works with “prudent person” principles, and does not have hard
investment limits on asset classes (other than on portfolio concentration). The regulatory
hurdles are relatively low in international comparison. Alonso et al. (2016) constructed an “Index
of regulatory liberalization for the investment of pension funds in infrastructure”. The UK and
Australia are in 6th place. Only Canada has less restrictive regulation among the G7+ countries.
However, risk management has become tighter over the years in the face of the maturing
membership, widespread underfunding of DB schemes, new accounting rules, and the
introduction of The Pension Regulator and the Pension Protection Fund. Therefore, most
pension funds have a preference for lower-risk brownfield assets and social PFI investments with
public availability payments.
Insurance companies in the UK have solvency rules to respect, and feel a strict regulatory corset.
Here too is a preference for lower risk assets, especially investment grade infrastructure debt.
Many insurers consider Solvency II regulation as a stumbling block for less liquid investments
such as infrastructure debt. The European Insurance and Occupational Pensions Authority
(EIOPA) has softened the rules for certain categories of lower risk infrastructure assets (equity
and debt, project and corporate) in 2015 and 2016.
The list of potential risks for investors is long. Most UK investors have, so far, avoided greenfield
infrastructure as they are concerned or unknowledgeable about development and construction
risks. Lack of scale is symptomatic of the supply in social infrastructure, with a median value of
PFI of less than £50m. Some investors are nervous about assets that are exposed to competitive
conditions, or volatile demand, especially in transport (e.g. M6 toll road). Some famous headline
failures are also seen as a warning signal.28 Political, regulatory and reputational risks are a
general concern for trustees and boards everywhere.
28 There have been some prominent cases of transport projects that left their mark. In Australia, pension funds and other investors faced losses with the Cross City Tunnel. The Eurotunnel was an early example of a transport PPP in Europe that was costly to initial investors as a result of cost overrun, over-optimistic
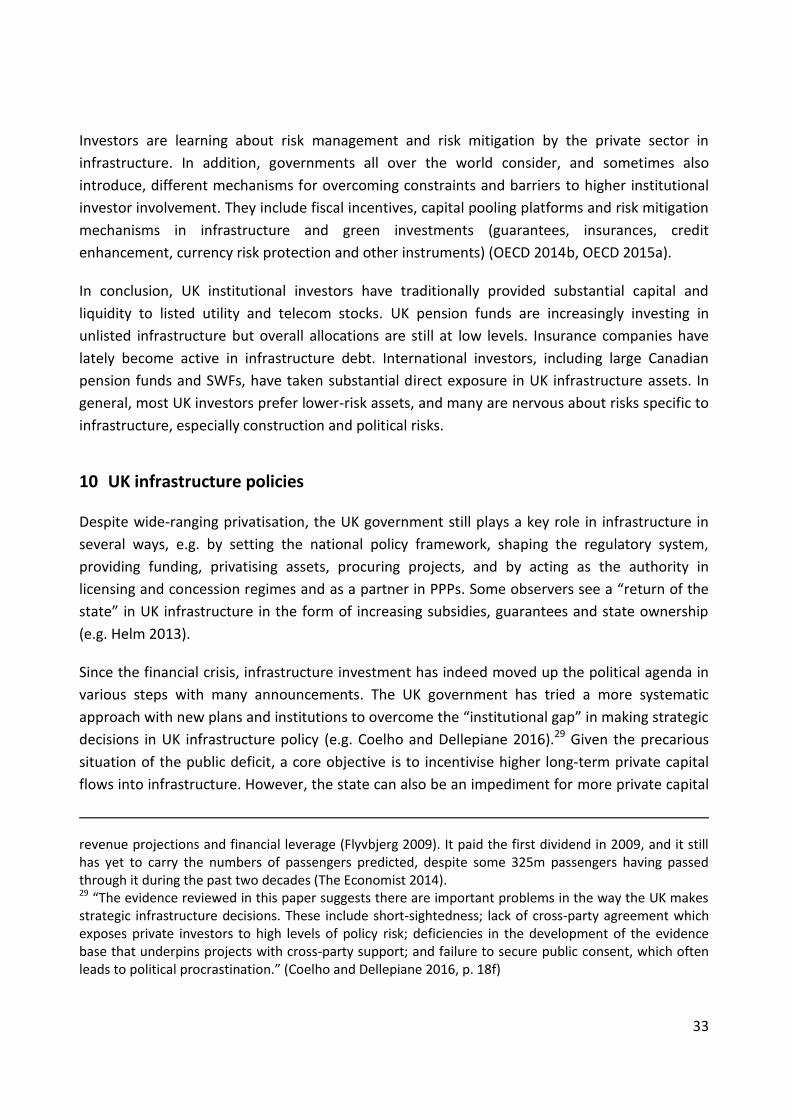
33
Investors are learning about risk management and risk mitigation by the private sector in
infrastructure. In addition, governments all over the world consider, and sometimes also
introduce, different mechanisms for overcoming constraints and barriers to higher institutional
investor involvement. They include fiscal incentives, capital pooling platforms and risk mitigation
mechanisms in infrastructure and green investments (guarantees, insurances, credit
enhancement, currency risk protection and other instruments) (OECD 2014b, OECD 2015a).
In conclusion, UK institutional investors have traditionally provided substantial capital and
liquidity to listed utility and telecom stocks. UK pension funds are increasingly investing in
unlisted infrastructure but overall allocations are still at low levels. Insurance companies have
lately become active in infrastructure debt. International investors, including large Canadian
pension funds and SWFs, have taken substantial direct exposure in UK infrastructure assets. In
general, most UK investors prefer lower-risk assets, and many are nervous about risks specific to
infrastructure, especially construction and political risks.
10 UK infrastructure policies
Despite wide-ranging privatisation, the UK government still plays a key role in infrastructure in
several ways, e.g. by setting the national policy framework, shaping the regulatory system,
providing funding, privatising assets, procuring projects, and by acting as the authority in
licensing and concession regimes and as a partner in PPPs. Some observers see a “return of the
state” in UK infrastructure in the form of increasing subsidies, guarantees and state ownership
(e.g. Helm 2013).
Since the financial crisis, infrastructure investment has indeed moved up the political agenda in
various steps with many announcements. The UK government has tried a more systematic
approach with new plans and institutions to overcome the “institutional gap” in making strategic
decisions in UK infrastructure policy (e.g. Coelho and Dellepiane 2016).29 Given the precarious
situation of the public deficit, a core objective is to incentivise higher long-term private capital
flows into infrastructure. However, the state can also be an impediment for more private capital
revenue projections and financial leverage (Flyvbjerg 2009). It paid the first dividend in 2009, and it still has yet to carry the numbers of passengers predicted, despite some 325m passengers having passed through it during the past two decades (The Economist 2014). 29 “The evidence reviewed in this paper suggests there are important problems in the way the UK makes strategic infrastructure decisions. These include short-sightedness; lack of cross-party agreement which exposes private investors to high levels of policy risk; deficiencies in the development of the evidence base that underpins projects with cross-party support; and failure to secure public consent, which often leads to political procrastination.” (Coelho and Dellepiane 2016, p. 18f)

34
investment in power stations, airports and roads, e.g. by excessive planning restrictions and
other regulations (IEA 2016).
In 2010, Infrastructure UK was created as a division of HM Treasury, to advise the Government
on long-term infrastructure planning, and facilitate private sector investment in projects. Given
the relatively high cost of building infrastructure in the UK, an Infrastructure Cost Review was
undertaken that found potential savings of £2-3bn a year. In 2016, Infrastructure UK was merged
with the Major Projects Authority (MPA) to form the new Infrastructure and Projects Authority
(IPA). It supports project development and delivery across the whole of government.
A National Infrastructure Commission (NIC) was set up in 2015 to provide the government with
impartial, expert advice on major infrastructure challenges and to identify long-term
infrastructure needs of the country. It was established as an Executive Agency of HM Treasury in
early 2017 but should act independently (NIC 2017). In 2016, the NIC published reports on High
Speed North, Smart Power, London Transport, a Cambridge-Oxford corridor and 5G
telecommunications. Once in every Parliament, it has to produce a National Infrastructure
Assessment, including the economic (but not social) infrastructure needs for the next 30 years.
The first report is expected in 2018.
Upgrading infrastructure is also an important part of a “new industrial strategy” to improve
productivity and growth across the whole country.30 2016 has seen further commitments by the
UK government, claiming that “central government economic infrastructure investment will now
rise by almost 60 per cent between 16/17 (£14 billion) and 20/21 (£22 billion)” (HM Government
2017). Furthermore, the NIC has been advised to plan on the basis that government
infrastructure spending will be between 1 and 1.2% of GDP between 2020 and 2050.
An independent body, the National Audit Office (NAO), scrutinises individual public spending
decisions on behalf of the UK Parliament, and makes policy recommendations.
10.1 The National Infrastructure Plan
The latest pipeline of the National Infrastructure Plan (HM Treasury 2016c) combines and
consolidates the previously separated infrastructure pipeline with the construction pipeline. In
terms of value, the pipeline is concentrated in the energy (around 41% incl. oil & gas) and
30 “There has been an historic lack of clear long-term thinking in the Government’s approach to national infrastructure strategy – in how we join up at a national level, and in a way that more consistently considers the interdependencies of infrastructure sectors. This has contributed to the disjointed provision of infrastructure and a legacy of underinvestment.” (HM Government 2017, p. 51-52)

35
transport sectors (28%). 15% goes into utilities (incl. regulated water, electricity and gas
distribution and transmission) and 3% into communication (Table 6).
Over 60% of the projects and programmes in the pipeline (excluding oil & gas) are in
construction. The “Priorities to 2020/21” list includes prominent projects such the High Speed 2,
Crossrail 2, Hinckley Point C nuclear power and the Thames Tideway Tunnel sewer. Energy
projects appear to be particularly back-loaded, due to three planned nuclear power stations with
a value of £46bn, and other “post 2020 spend” on electricity generation of £69bn.
Social sectors, newly added in 2016, amount to £50bn, i.e. around 10% of the pipeline value, of
which 3% in housing & regeneration, 4% in education, 3% in defence and less than 1% in health.
The latest additions in 2016 are £2.6bn transport improvements out of a £23bn National
Productivity Investment Fund (NPIF), a new £2.3bn Housing Infrastructure Fund and a new
£0.4bn Digital Infrastructure Investment Fund.
Table 6: National Infrastructure and Construction Pipeline (by sector)
Source: HM Treasury (2016c)
Financing the infrastructure pipeline
About 39% of the pipeline (£191bn) will be financed by the public sector, 55% by the private
sector (£272bn) and 6% via a PPP (£27bn) (HM Treasury 2016b). For the shorter term plans up to
2021, the percentages are 43% public, 51% private and 8% PPP. The public share is considerably
higher than projections in the earlier years (e.g. 21% in the NIP 2014). This is due to the
consolidation of the construction pipeline, the inclusion of social infrastructure, the additional
government spending plans, and other changes.
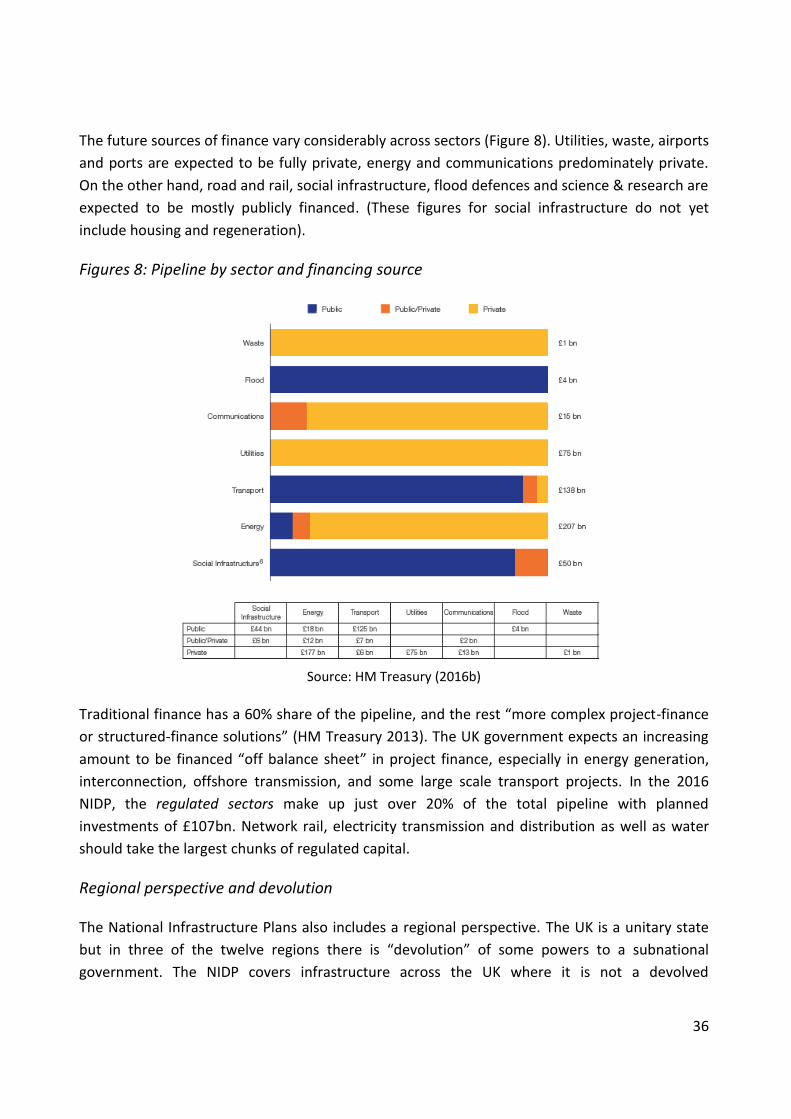
36
The future sources of finance vary considerably across sectors (Figure 8). Utilities, waste, airports
and ports are expected to be fully private, energy and communications predominately private.
On the other hand, road and rail, social infrastructure, flood defences and science & research are
expected to be mostly publicly financed. (These figures for social infrastructure do not yet
include housing and regeneration).
Figures 8: Pipeline by sector and financing source
Source: HM Treasury (2016b)
Traditional finance has a 60% share of the pipeline, and the rest “more complex project-finance
or structured-finance solutions” (HM Treasury 2013). The UK government expects an increasing
amount to be financed “off balance sheet” in project finance, especially in energy generation,
interconnection, offshore transmission, and some large scale transport projects. In the 2016
NIDP, the regulated sectors make up just over 20% of the total pipeline with planned
investments of £107bn. Network rail, electricity transmission and distribution as well as water
should take the largest chunks of regulated capital.
Regional perspective and devolution
The National Infrastructure Plans also includes a regional perspective. The UK is a unitary state
but in three of the twelve regions there is “devolution” of some powers to a subnational
government. The NIDP covers infrastructure across the UK where it is not a devolved

37
responsibility to the Northern Ireland Assembly, Scottish Parliament or Welsh Assembly. The
arrangements are complex and vary across regions and sectors. For example, responsibility for
investment in roads infrastructure is fully devolved; other sectors have different splits of
responsibilities. Devolved administrations produce their own infrastructure plan (e.g. The
Scottish Government 2015, Welsh Government 2012, Northern Ireland Executive 2012).
London is another exception because it has greater powers than other local authorities, e.g. no
other authority has an entity similar to Transport for London. The NIDP 2016 talks about a
“devolution revolution currently underway including in London, the Northern Powerhouse, and
the Midlands Engine” (HM Treasury 2016a, p. 10). Local governments play an important role in
the provision of infrastructure investment and services. They contribute more to gross fixed
capital formation than the central government (Local Government Group 2010).
10.2 PF2 and Scotland’s NPD
Opinions on PFI were polarized from the beginning. Some see it as a reference model for the
world31. Many countries around the world certainly looked at the UK experience (see, e.g., Blanc-
Brude 2012, RICS 2013). Others dislike PFI, and PPPs in general, for all sorts of reasons, ranging
from the technical to the ideological.
PFI was criticized for many reasons: for being too expensive, too opaque, too slow and too
inflexible. According to critics, the private sector could make windfall gains while the risk transfer
and potential future liabilities for the public sector were unclear.32 Some projects were
unsuitable for PFI while there was an incentive to offload them from the public books. “Value for
money” was not good enough for the taxpayers (Reform 2009, ACE 2012, Hall 2015, OECD
2015c).33
After 2010, the new government reviewed PFI (including a report by the NAO (2011), and set out
a modified approach - called PF2 - in 2012 (HM Treasury 2012b). PF2 tries to address the
criticisms with a number of changes, including:
31 “The UK developed PFI model is used as a reference around the world: the UK has led the world in the development of PFI contracts…Throughout the EU, governments are setting up private finance units, based on the UK.” (HM Treasury 2008) 32 The Office of Budget Responsibility (OBR) estimated that the present value of obligations for future PFI payments is £190bn, or 2.1% of GDP; £114 resting with central government, £72bn with local authorities and £4bn with public corporations (OBR 2016). 33 Vecchi et al. (2013) analysed the cost-efficiency of Private Finance Initiatives (PFIs) in the UK health sector facilities. Expected returns by the private sector exceed the underlying cost of capital by far (about 9% on average), despite the “low risk” nature of availability-based payments by the public sector.

38
- the public sector will keep a minority equity stake
- third party funding competitions for a portion of equity
- debt solutions other than bank loans should be considered
- procurement is to be cheaper and faster, with a maximum duration of 18 months
- standardised documentation in the procurement process
- service contracts should be more flexible (making renegotiation easier)
- measures to improve transparency for both public and private partners.
However, some risks are transferred back to the public sector, and most of PF2 is still outside the
normal public accounts.
The uptake of PF2 has so far been slow. 46 schools in the £4.4bn Priority Schools Building
Programme (PSBP) are being delivered via PF2. The £340m PF2 Midland Metropolitan Hospital
should be opened in 2018. The government announced the development of a new pipeline of
projects that are suitable for delivery through PF2 (HM Treasury 2016b).
Scotland developed an alternative to PFI, the non-profit distributing (NPD) model (Box 2).
Box 2: Scotland’s and Wales’ NPD model
Scotland produced the first Infrastructure Investment Plan in the country in 2008, with updates
in 2011, 2013 and 2015 (The Scottish Government 2015). The Scottish Futures Trust (SFT) was
established in 2008 to help ensure better value for taxpayers’ money in the delivery of public
infrastructure projects. SFT announced a £3.5bn pipeline of revenue-financed infrastructure
projects to 2020.
In 2010, the Scottish Government introduced a new Non-Profit Distributing (NPD) model as an
alternative to the traditional PFI model. It is being used to fund projects in three main sectors –
further education, health and transport. The NPD model aims to eliminate uncapped equity
returns and limit returns to a reasonable rate set through competition.
Wales published its own infrastructure plan in 2012 (Welsh Government 2012). In 2014, the NPD
model was adopted by the devolved government for Wales with a £500bn schools programme.
The 2016 pipeline comprised 365 investments across both public and private sectors, including in
the non-devolved areas of rail and energy, with a value of more than £40bn.
10.3 Infrastructure financing initiatives
Many projects stalled following the financial crisis and recession. The UK Government started a
series of infrastructure financing initiatives, including risk mitigation and capital pooling schemes

39
for institutional investors, to revive infrastructure investment, especially in new and climate
change-related projects.
The NAO (2015a) mentions several other mechanisms to support private financing of public
assets that change the risk allocation between the private sector, taxpayer and consumer:
Traffic and volume guarantees (e.g. Mersey Gateway Bridge 2014)
Contracts for Difference (CfDs) (introduced as part of the Electricity Market Reform 2013)
Direct lending by government departments
Debt-issuance by government-owned companies (such as Network Rail)
Government-owned financial institutions (such as the GIB)
Financial guarantees (such as the UKGS).
UK Guarantees Scheme
A four-year UK Guarantees Scheme (UKGS) of £40bn was launched in 2012 to encourage private
investment in UK infrastructure. Through this scheme, the UK Government gives guarantees for
debt investors in qualified projects during the construction and post-construction phase. This is
effectively swapping project risk for sovereign risk. The terms are “commercial”; the sponsor is
charged a fee in line with market rates and project risk. It aims at avoiding “crowding-out”
commercial finance. The UKGS was initially planned to run until 2014, and later extended to
2016, 2021 and then to 2026.
UKGS is available for a broad range of economic and social infrastructure sectors, including
housing. By the end of 2016, nine guarantees were issued worth £1.8bn with a total capital value
of projects of £4bn (£750m of which for London’s Northern Line extension). Three more
guarantees were approved. UKGS has also supported another 24 pre-qualified projects to reach
financial close by providing advice, support or commitment without ultimately providing a
guarantee (HM Treasury 2016b).
In 2015, the National Audit Office undertook a review of the UKGS at an early stage and gave
several recommendations, especially on a more rigorous assessment that guarantees are really
needed. It found that “the Scheme provides stronger protection to lenders than comparable
European state schemes, which provide credit enhancement but not a full sovereign guarantee
of principal and interest.” (NAO 2015b, p. 5)
Green Investment Bank
In 2012, the Green Investment Bank (GIB) was set up and capitalized with public funds. The UK
Government was the sole shareholder with committed funding of £3.8bn. The GIB invests “on a
commercial basis” in innovative, environmentally friendly projects where there is a lack of

40
sufficient support from private markets. It also aims at “crowding in” additional finance from
private investors. The focus is initially on three sectors: offshore wind, waste and bioenergy,
energy efficiency.
By the end of 2016, GIB had committed £2.8bn to 83 green infrastructure projects and funds,
mobilising over £8bn of private capital. GIB established an Offshore Wind Fund in 2014, which
raised over £1bn, and invested in five operational wind farms, making it the largest renewable
fund in the UK. Investors include UK pension funds and several other international asset owners.
In April 2017, the GIB was privatised and sold to Macquarie Bank for £2.3bn.
Other policy interventions
There are further UK government interventions and initiatives in the area of green investment,
social infrastructure, taxation and other areas. Some examples include:
A range of policy mechanisms to support the transition to a clean energy system, including
Contracts for Difference (CfDs) for low-carbon energy generation. CfDs set a fixed price for
low-carbon (including nuclear) electricity generators. These are long-term, legally-binding
agreements that should stabilise prices, and help reduce risk and lower the cost of capital.
Among the social infrastructure initiatives, the Priority School Building Programme (PSBP) by
the Education Funding Agency was launched to improve the condition of the schools most in
need of urgent repair. There are two phases of the programme covering a total of 537
schools, 46 of which use private finance (all in phase 1) and the rest use capital grants.
In 2016, some local authorities were given the power to raise business rates by a new
“infrastructure supplement” of maximum 2% to be used for local infrastructure projects.
Project-specific support packages; an example of which is the Thames Tideway Tunnel.34
Institutional investor initiatives
There are “huge infrastructure demands and hungry institutional funds – link them” (Heseltine
2012). Several other institutional investor related initiatives have emerged.
34 The £4.2bn project was structured as a hybrid between project financing and utility financing, with a custom-made regulatory framework providing revenues from the start of construction, and a bespoke government support package (GSP) was structured to cover high impact, low probability risks. The GSP includes contingent equity, debt and insurance support in specific circumstances. This has allowed the TTT project to successfully raise around £1.3bn of equity, a £1bn revolving loan facility, a £700m EIB loan and £450m index-linked forward purchase bonds.
41
An Insurers’ Infrastructure Investment Forum was set up by the UK Government to promote an
increased engagement in infrastructure by UK insurance companies. In December 2013, six
insurers – Aviva, Friends Life, Legal & General, Prudential, Scottish Widows and Standard Life –
said they would work alongside partners with the aim of delivering £25bn of investment in UK
infrastructure in the next five years. By the end of 2015, they had invested over £5bn in
infrastructure projects (HM Treasury 2016a).
The Pension Infrastructure Platform (PIP) has been in development since 2011, following a
Memorandum of Understanding between the Government and UK pension funds. Signatories
included the National Association of Pension Funds (NAPF), the Pension Protection Fund and a
group of public and private pension schemes (three of the ten original investors dropped out in
the early stages). PIP is a not-for-profit entity that is formally independent of the Government.
PIP should facilitate UK pension funds, especially smaller ones, to invest more in UK
infrastructure assets. It aims to pool pension assets and invest them (directly or indirectly) in
infrastructure projects, with a view to generating long-dated, inflation-linked returns of the
order of RPI inflation plus 2-5%, with relatively low leverage and low risk. It should operate on a
low cost basis (0.5% fee).
A size of £20bn over ten years had been envisaged initially. The target is currently to raise £2bn
of capital from UK pension funds. The first PIP fund started in 2013/4 with Dalmore Capital as
investment manager in the “secondary market” and a portfolio of 41 PFI projects, mostly in
hospitals and schools. At the end of 2016, PIP had established three funds, with combined
commitments of over £1bn, including a solar PV fund with Aviva, and a multi-strategy
infrastructure fund with two different risk profiles and a low minimum investment hurdle.
In 2015, the government called for proposals to merge assets of the 89 existing local government
pension schemes (LGPS) (about £220bn) into six pools to deliver efficiencies, cost savings and
develop their capacity and capability to be major infrastructure investors. The “British Wealth
Funds” should contain at least £25bn of scheme assets each. The stated ambition of the pools
for infrastructure investment is in the range 5-10% of assets over the long term.
In the meantime, increased collaboration has started, e.g. with the formation of the Local
Pensions Partnership (LPP) by two LGPS. More specifically on infrastructure, in 2015, two large
public funds, Greater Manchester Pension Fund and London Pensions Fund Authority, started an
infrastructure joint venture, GLIL, with a joint allocation of £500bn to invest in UK infrastructure
projects. It was later joined by three more LGPS, West Yorkshire, Merseyside and Lancashire
County, to increase the pool to £1.3bn.

42
Municipal Bonds
The municipal bonds market is still very small in the UK. Following examples in other countries,
the UK Municipal Bonds Agency was founded in 2014 to help local councils to finance their
investment in projects including infrastructure and housing. It is a public limited company,
owned by local councils and the Local Government Association. It aims at diversifying the
financing sources of local authorities and reducing financing costs. Currently, 75% of local
authority borrowing comes from the Public Works Loan Board (PWLB), part of the Debt
Management Office (DMO).
European institutions and initiatives
Furthermore, and this is often overlooked, there are international initiatives at work in the UK,
most importantly from EU institutions. The European Investment Bank (EIB) has been a
significant source of finance for UK infrastructure projects. The EIB increased lending to the UK
to a record £5.6bn in 2015 and £5.5bn in 2016 (about 0.3% of GDP), mostly in infrastructure and
environment. EIB investments accumulated to about £25bn over the last five years, and over
£100bn since 1973.
The EIB is owned by the 28 member states of the EU with a subscribed capital of €243bn of
which €21bn is paid in. The UK has a share of 16%, i.e. €3.4bn paid in. It continued to approve
and sign financing deals with UK projects after the EU referendum 2016 (including a £750m loan
to National Grid and a £400m loan to Anglian Water).
Following the Europe 2020 Project Bond Initiative, the European Commission announced the
Investment Plan for Europe (“Juncker-Plan”) at the end of 2014. It is intended to facilitate
€315bn of investments, especially in infrastructure and for SMEs. Part of the plan is the
European Fund for Strategic Investments (EFSI) with a €16bn guarantee from the EU budget,
complemented by a €5bn allocation of the EIB’s own capital.
In 2016, the Commission proposed to increase the guarantees to €26bn and €7.5bn
respectively, in order to mobilize more private capital with a multiplier of 15, and an overall
investment target over €500bn.35 By the end of 2016, the UK was third largest beneficiary of EFSI
funds (behind Italy and France), i.e. €2.9bn for 19 infrastructure and innovation projects,
including the smart meters roll-out, the Midland Metropolitan Hospital and two windfarms.
35 EFSI has been integrated into the EIB Group. Projects supported by EFSI are subject to the normal EIB project cycle and governance. However, it has the specific objective of addressing the market failure in risk-taking which hinders investment in Europe, and it should increase the volume of higher risk projects supported by the EIB Group.

43
The LGTT Cooperation agreement, signed in January 2008, aims to increase the participation of
private sector involvement in the financing of Trans-European Transport Network Infrastructure
(TEN-T). In the UK, the London Gateway Port (TEN) was closed with the help of LGTT in 2011.
In 2009, the EU adopted the EU 2020 climate and energy package with some binding legislation
that sets three key targets: 20% cut in greenhouse gas emissions (from 1990 levels), 20% of EU
energy from renewables (plus 10% share of renewables in the transport sector) and 20%
improvement in energy efficiency by 2020. In 2014, these targets were raised and extended to
40%, 27% and 27% respectively. The UK Climate Change Act 2008 sets a legal framework for the
UK to cut greenhouse gas emissions to 80% below 1990 levels by 2050.
In summary, the UK governments have undertaken various steps to turn around infrastructure
investment in recent years, including National Infrastructure Plans and project pipelines. New
institutions and policy instruments were set up, as well as a reformed PPP model (PF2). Given
the difficult state of public finances, a core objective remains to facilitate more long-term private
capital flows into infrastructure. A number of financing initiatives have been started, including a
guarantee scheme, a green investment bank, and new platforms for institutional investors. Some
initiatives have moved faster than others. Furthermore, European institutions and initiatives
have provided important flows of finance for the development of UK infrastructure.
11 Policy recommendations
OECD recommendations
In its recommendations for the UK, the OECD has identified better infrastructure, especially
transport infrastructure, as key priority for policy reforms year by year. Low investment in public
infrastructure has contributed to congestion, hampering productivity. Key recommendations
include (OECD 2015b, Pisu et al. 2015, Égert et al. 2009, ITF 2017):
further enhancement of long-term infrastructure strategy and planning
improvements of roads by introducing user-paid tolls, and of railways by ensuring the
arms-length responsibility for awarding rail franchises
addressing supply constraints in energy; clarification of the Electricity Market Reform and
climate change policies
more investment in digital infrastructure to bridge the regional digital divide
development of public-private partnerships (PPP) and public guarantees for privately
financed infrastructure projects
recording PPP assets and liabilities in the government fiscal accounts.

44
Further recommendations
In the discussions around the new direction of UK policy since the financial crisis and the EU
referendum, many additional reform measures for funding and financing infrastructure have
been proposed from different sides. A (non-exhaustive) list of major changes would include:
extensive user charges for roads36
re-nationalization of infrastructure (especially rail, water)37
full privatisation of railway
more radical interventions in the energy sector (e.g. competition, price caps, capacity)
major reforms to increase the housing stock, including social housing
a national investment, infrastructure or development bank (similar to KfW in Germany,
CDC in France, CDP in Italy, etc.) (e.g. LSE 2013)
credit enhancement for greenfield projects with UK project or “infrastructure bonds”
“asset recycling” (i.e. more privatisation of existing infrastructure assets to the private
sector, where the funds are being used for building new infrastructure)
extension of the regulated asset base model (RAB) to other sectors
changes to regulatory regimes for investors and banks (e.g. Solvency II, Basel III)
changes to the tax regime to support infrastructure investments
a full national balance sheet, including the infrastructure capital stock, depreciation and
investment flows (new, upgrade, maintenance).
12 Summary and conclusions
The UK has been a leading country for private capital investments in infrastructure for several
decades. It had been pioneering widespread privatisations of utilities in the 1980s, from which
the UK model of “regulated asset base” (RAB) evolved. It has also developed substantial
experience in PPPs since the 1990s, especially in the form of the PFI model for social
infrastructure. At the same time, the country gained a reputation for chronic under-investment
and, in parts, also for poor infrastructure, especially in transport. Since the financial crisis and
36 “Why is it that other infrastructure – for example, water – is funded by private sector capital through privately owned, independently regulated utilities, but roads in Britain still call on the public finances for funding?” (Speech by Prime Minister David Cameron 19 December 2012) 37 “I never envisaged that when it came to nationalising I would be outdone by a Conservative Chancellor. The only difference between us is that I would like to bring services like rail back into the ownership of the British people but the Chancellor wants to sell them to the People’s Republic of China.” (Speech by Shadow Chancellor John McDonnell, 24 November 2015)

45
recession in 2007-2009, infrastructure has moved to the core of the political discussion, leading
to several attempts to spur more investments – so far with mixed success.
Advanced economies have experienced a downward trend in fixed capital investment since the
1970s. The UK has been hovering around the bottom end of its peer countries in terms of
infrastructure investment, with a comparatively low 2.5-2.8% of GDP spent on economic
infrastructure and around 1% on social infrastructure. There has been a dramatic shift from
public to private infrastructure construction spending over the last three decades but this may
have come to a halt.
The UK’s future economic infrastructure needs are (conservatively) estimated to be somewhat
higher in future (i.e. to increase to 3-3.5% of GDP, or £55-65bn per annum). Social infrastructure
could need another 1-1.5% of GDP, or £20-25bn per annum. Additional requirements, e.g. for
climate change policies or higher social targets, would come on top of that.
Quality assessments of the infrastructure in the UK give a mixed picture. National surveys rate
most of UK infrastructure rather poorly, especially in transport. In international surveys, the
country is seen in the mid-field of comparable economies with a great variation across sectors. In
contrast, the UK is widely considered as an attractive investment target.
The ownership of UK’s infrastructure is remarkably diverse. Only about one third of it is left in
public hands, most notably the roads. Foreign investors own about 40% of economic
infrastructure although this varies widely across sectors. The UK has been very open for FDI.
Specialist investors such as SWFs, infrastructure, private equity and pension funds have
increased their exposures in recent times.
An estimated 70% of UK infrastructure is financed by private capital. Traditional corporate
finance is the dominant force; much of it is regulated by independent regulators. Listed
companies play an important role for infrastructure investment. In international comparison,
one can note a strong presence of privatised utility and telecom stocks (weighting of nearly 10%
on the LSE) while transport and social infrastructure are nearly absent.
The UK also has an above-average market share of project finance deals (about 1-2% of GDP)
within Europe and worldwide. PPPs worldwide suffered under the financial crisis and recession.
In the UK, policy changes also contributed to the setback. UK PFI volumes have fallen back from
about 0.5% of GDP in 2006 to less than 0.1%. The UK’s share of Europe’s PPP volumes has
declined to about 30%, i.e. 0.2% of GDP. Transport PPPs play a smaller role in the UK than on the
Continent. The EU and UK market for project bonds has revived since 2013 but is still very small.

46
Private equity investments by specialist infrastructure funds have become an increasingly
important financing vehicle for infrastructure projects. The UK obtains about half of European
and around one fifth of the global deals, with a volume of 1-2% of GDP. It has a particularly
strong presence in social infrastructure and green energy. More recently, infrastructure debt
investing has become more popular especially by insurance companies.
UK institutional investors have traditionally provided substantial capital and liquidity to listed
utility and telecom stocks. UK pension funds are increasingly investing in unlisted infrastructure
but overall allocations are still at low levels. International investors, including large Canadian
pension funds and SWFs, have taken substantial direct exposure in UK infrastructure assets.
Most UK investors prefer lower-risk assets, and many are nervous about risks specific to
infrastructure, especially construction, regulatory and political risks.
Successive UK governments have undertaken various steps to turn around infrastructure
investment in recent years, including “National Infrastructure Plans” and project pipelines, as
well as new institutions and policy instruments, and a reformed PPP model (PF2).
Given very tight public budgets, a core objective remains to facilitate more long-term private
capital flows into infrastructure. A number of financing initiatives have been started, including a
guarantee scheme, a green investment bank, and new platforms for institutional investors. Some
initiatives have moved faster than others. Often overlooked, European institutions and initiatives
have provided important flows of finance for the development of UK infrastructure.
The UK has a strong presence in the global infrastructure, project finance, green bond and PPP
market. London is also one of the main markets for listed infrastructure funds, and an
investment centre with a high share of headquarters of the financial industry involved in
infrastructure.
12.1 The UK in international comparison
In the international context, the investment and financing of UK infrastructure in the UK can
today be characterized in the following way:
1. Britain used to be a country of great industrial, engineering and infrastructure building
history. However, it has experienced decades of relatively weak public investment, and its
“creaky infrastructure” (The Economist) may hinder future growth prospects and
competitiveness.
2. The country’s infrastructure is highly (but not uniformly) privatised, with about 70% in
private and 40% in foreign hands today. Given the poor outlook for public finances, it will
remain highly dependent on private capital for the financing of infrastructure.

47
3. There is long experience in terms of regulating privatised utilities with independent
institutions. The UK model “regulated asset base” model has been adjusted over time.
4. The UK is also one of the countries with the highest expertise in developing PPPs, especially
in social infrastructure. However, the UK model of PFI was halted, reviewed and replaced by
PF2 with limited success, so far.
5. Attempts to find relief for the “housing crisis” have shown little success, especially in social
and affordable housing where the jobs are.
6. Infrastructure policies have been considered as comparatively predictable in the
international context. This despite major shifts and sporadic interventions that have occurred
over time, e.g. in transport (especially the running of rail networks) and energy (including
renewable energy and climate policies).
7. The policy attention has been swinging between economic and social infrastructure over the
years. As many other countries post financial crisis, the UK government has tried a more
systematic approach with infrastructure plans, project pipelines, new institutions and
financing initiatives. It is early days for an assessment.
8. Most domestic institutional investors have traditionally been keen investors in listed utility
stocks and bonds but have been relatively late in seeking investment opportunities in the
unlisted market sector, especially for greenfield projects.
9. The country has, so far, been seen as one of the most attractive investment targets by
international investors. This is mainly due to an open, investor-friendly environment with
clear property rights, a working judiciary system, and a relatively stable political framework.
10. London is a major global centre of the financial industry, also for infrastructure and green
finance, not the least helped by the access to the common European market.
12.2 Lessons for investors and policy makers
Different countries have different approaches to the organization of their infrastructure
investment, and the attraction of private and foreign capital for it. There are useful lessons to be
learnt from the UK for policy makers, asset owners and the financial industry, in the UK and
other countries.
Major positive lessons from the UK experience include:
Importance of a stable political system and macro economy
Solid institutional and legal environment, clear property rights
Highly developed capital markets, with a strong and diverse investor base
Open borders for overseas infrastructure developers, operators and investors
Strong private sector involvement in infrastructure, both via privatisations and PPPs
Proven regulatory system for utilities, telecoms, and other infrastructure sectors

48
Long experience with PPPs, especially in social infrastructure with availability payments;
PPPs in particular require time and a high degree of trust to succeed.
Financial centre with high private sector capacity and international expertise.
There are also lessons learnt the hard way in the UK, and there are warning signals on the
horizon:
Long-term decline in public infrastructure investment, and its negative effects on the
infrastructure capital stock, the economy and society
Connected to this, also loss of capabilities in design and implementation of infrastructure
policies in central and local government
“Shadow accounting” for PPPs that is counterproductive longer-term
A major intermediation issue between investor needs (for low-risk, operating, brownfield
assets) and the financing needs for new, higher-risk, greenfield projects
A fragmented pension scene (with “de-risking”, shifting to DC, and with weak governance
structures) that is long overdue for consolidation
Policy inconsistencies (e.g. between prudential regulation of investors, and the quest for
long-term investment in infrastructure)
Policy reversals (e.g. rail, PFI, energy policies, Brexit) and policy delays (e.g. airports)
Questions over EU market access (and beyond), standards, regulations and connections;
uncertainties over openness of the country, not the least for skilled people
Currency volatility
Future of the political system and the country’s constitution.
In a nutshell, the UK has for some time been living on the combination of an ageing
infrastructure, weak spending by the state (and taxpayers) and strong private sector
involvement in infrastructure finance. The country’s creaky infrastructure needs more
investment when public budgets are already stretched. The question is whether private capital
will be as easily available in future as in the past, especially from trusting institutional and
foreign investors.

49
References
ABI (2015), UK Insurance & Long Term Savings. Key Facts. Association of British Insurers.
ACE (2012), Performance of PFI. 1996-2010: lessons learned. Association for Consultancy and Engineering.
AIC (2017), Investment companies tables. The Association of Investment Companies. Retrieved March 2017.
Allen, J. and Pryke, M. (2016), Offshoring the nation’s water. In: Raco, M. (2016) (Ed.), Britain for sale? Perspectives on the costs and benefits of foreign ownership. The Smith Institute.
Alonso, J., Arellano, A. and Tuesta, D. (2016), Pension Fund Investment and Financial Regulation. In: Mitchell, O., Maurer, R. and Orszag, M., Retirement System Risk Management: Implications of the New Regulatory Order. Oxford University Press.
Arcadis (2015), Global Built asset Wealth Index 2015.
Arcadis (2016), Third Global Infrastructure Investment Index 2016.
ASCE (2016), Failure to Act. Closing the Infrastructure Investment Gap for America’s Future. American Society of Civil Engineers.
ASCE (2017), Report Card for America’s Infrastructure. American Society of Civil Engineers.
Beeferman, L. and Wain, A. (2012), Defining Matters. Harvard Law School Paper.
Blanc-Brude, F. (2012), Pension Fund Investment in Social Infrastructure. Edhec-Risk Institute.
CBI (2016), Thinking Globally. Delivering Locally. CBI-AECOM Infrastructure Survey 2016.
CECA (2013), Securing our economy: The case for infrastructure. CECA and Cebr, London.
Citibank (2016), Infrastructure for Growth. Citi GPS: Global Perspectives & Solutions.
City of London (2013), Institutional Investment in the UK from Emerging Markets. Special Interest Paper.
City of London (2016), Globalising Green Finance: The UK as an International Hub.
Cobley, M. (2014), Privately held share of UK infrastructure climbs steadily. Financial News, 25 November 2013.
Coelho, M. C. and Dellepiane, S. (2016), Power, Transport, Aviation and Water: the Political Economy of Infrastructure in the UK. University of Strathclyde, International Public Policy Institute, Occasional Paper.
Dealogic (2015), Project Finance Review. Full Year 2014.
Della Croce, R. (2011), Pension Funds Investment in Infrastructure: Policy Actions. OECD Working Papers on Finance, Insurance and Private Pensions, No. 13.
50
Donaubauer, J., Meyer, B., Nunnenkamp, P. (2014), A New Global Index of Infrastructure. Kiel Institute for the World Economy, Working Paper No. 1929, June 2014.
Égert, B., Kozluk, T. and Sutherland, D. (2009), Infrastructure and Growth: Empirical Evidence. OECD Economics Department Working Papers, No. 685.
EIB (2016a), Investment and Investment Finance in Europe. Financing productivity growth. European Investment Bank.
EIB (2016b), Restoring EU competitiveness. 2016 Updated version. European Investment Bank.
Engel, E., Fischer, R., Galetovic, A., The Economics of Public-Private Partnerships. A Basic Guide. Cambridge University Press 2014.
EPEC (2017), Market Update. Review of the European PPP Market in 2016.
EPI (2016), 2016 Environmental Performance Index. Yale University.
Ernst & Young (2017), Renewable energy country attractiveness index (RECAI). May 2017.
European Commission (2011), Stakeholder Consultation Paper on the Europe 2020 Project Bond Initiative. Commission Staff Working Paper, February 2011.
European Commission (2016), State-Owned Enterprises in the EU: Lessons Learnt and Ways Forward in a Post-Crisis Context. European Economy Institutional Paper 31, July 2016.
First State Investments (2016), Infrastructure regulation: the road ahead. Research Paper.
Flyvbjerg, B. (2009), Survival of the unfittest: why the worst infrastructure gets built - and what we can do about it. Oxford Review of Economic Policy, Vol. 25, No. 3.
FT (2016), The FDI Report 2016. Financial Times, FDI Intelligence.
GIH (2017), InfraCompass. Set your infrastructure policies in the right direction. Global Infrastructure Hub In cooperation with KPMG.
GLIO (2017), Global Listed Infrastructure Total Returns & Breakdowns. Global Listed Infrastructure Organisation.
Grice, J. (2016), National accounting for infrastructure. Oxford Review of Economic Policy, Vol. 12(3), pp. 431-445.
Hall, D. (2015), Why Public-Private Partnerships Don’t Work. PSIRU.
Helm, D. (2009), Infrastructure, investment and the economic crisis, in: Helm, D., Wardlaw, J., Caldecott, B., Delivering a 21st Century Infrastructure for Britain, Policy Exchange, London.
Helm, D. (2013), British infrastructure policy and the gradual return of the state. In: Oxford Review of Economic Policy, Vol. 29, No. 2, pp. 287-306.
Helm, D. and Tindall, T. (2009), The evolution of infrastructure and utility ownership and its implications. Oxford Review of Economic Policy, Vol. 25(3), pp. 411-434.

51
Heseltine, M. (2012), No Stone Unturned. Lord Heseltine Report.
HM Government (2017), Building our Industrial Strategy. Green Paper, January 2017.
HM Treasury (2008), Infrastructure procurement: delivering long-term value.
HM Treasury (2010), National Infrastructure Plan.
HM Treasury (2011), National Infrastructure Plan.
HM Treasury (2012a), National Infrastructure Plan: update.
HM Treasury (2012b), A new approach to public private partnerships.
HM Treasury (2013), National Infrastructure Plan.
HM Treasury (2014), National Infrastructure Plan.
HM Treasury (2016a), National Infrastructure Delivery Plan 2016-2021.
HM Treasury (2016b), National Infrastructure Delivery Plan 2016-2021. Funding and Finance Supplement.
HM Treasury (2016c), National Infrastructure and Construction Pipeline. Analysis.
HM Treasury (2016d), Private Finance Initiative and Private Finance 2 projects: 2016 summary data. December 2016.
ICE (2014), The State of the Nation, Infrastructure 2014. Institution of Civil Engineers.
IEA (2016), Infrastructure spending and economic growth. Institute of Economic Affairs, November 2016.
Inclusive Prosperity Commission (2015), Report of the Commission on Inclusive Prosperity. Center for American Progress, January 2015
Inderst, G. (2009), Pension Fund Investment in Infrastructure. OECD Working Paper on Insurance and Private Pensions, No. 32.
Inderst, G. (2010), Infrastructure as an asset class. EIB Papers, Vol. 15, No. 1.
Inderst, G. (2013), Private Infrastructure Finance and Investment in Europe. EIB Working Papers, 2013, No. 2.
Inderst, G., Kaminker, Ch., Stewart, F. (2012), Defining and Measuring Green Investments. OECD Working Papers on Finance, Insurance and Private Pensions, No.24.
Inderst, G. and Della Croce, R. (2013), Pension Fund Investment in Infrastructure: a Comparison between Australia and Canada. OECD Working Papers on Finance, Insurance and Private Pensions, No. 32.
InfraDeals (2016), InfraDeals trend report: 2015.
Institute of Directors (2010), Infrastructure – mind the gap! London.

52
Insurance Europe (2013), Funding the future: Insurers’ role as institutional investors.
ITF (2017), Strategic Infrastructure Planning. International Transport Forum/OECD.
Kolev, A. (2013), Structural developments of gross fixed investment in Europe. In: Investment and Investment Finance in Europe. European Investment Bank.
Local Government Group (2010), Funding and Planning for Infrastructure.
Long, N. (2016), Global WOW: the 388 infrastructure funds doing battle for LGPS cash revealed. Modern Investor, 1 November 2016.
LSE Growth Commission (2013), Investing for Prosperity. Report of the LSE Growth Commission.
Makovšek, D. and Veryard, D. (2016), The Regulatory Asset Base and Project Finance Models. International Transport Forum, Discussion Paper, 2016/01.
McKinsey (2013), Infrastructure productivity: How to save $1 trillion a year. McKinsey Global Institute.
Mercer (2016), European Asset Allocation Survey.
Mor, F. (2017), Infrastructure policies and investment. House of Commons Library, March 2017.
Nabarro (2016), Nabarro Infrastructure Index: Bridging the gap.
NAO (2011), Lessons from PFI and other projects. National Audit Office, HC 920.
NAO (2013), Planning for economic infrastructure. National Audit Office, HC 595.
NAO (2015a), The choice of finance for capital investment. National Audit Office, Briefing.
NAO (2015b), UK Guarantee scheme for infrastructure. National Audit Office, HC 909.
NIC (2017), National Infrastructure Commission framework document. January 2017.
Northern Ireland Executive (2012), Investment Strategy for Northern Ireland 2011-21.
OBR (2016), Financial sustainability analytical paper: Public sector balance sheet. Office for Budget Responsibility, July 2016.
OBR (2017), Public Finances Databank. March 2017.
OECD (2014a), Pooling of Institutional Investors Capital – Selected Case Studies in unlisted equity infrastructure.
OECD (2014b), Private Financing and Government Support to promote Long-term Investments in Infrastructure.
OECD (2015a), Mapping Channels to Mobilise Institutional Investment in Sustainable Energy, Green Finance and Investment. OECD Publishing, Paris.
OECD (2015b), OECD Economic Surveys, United Kingdom.
53
OECD (2015c), OECD Review of Public Governance of Public-Private Partnerships in the United Kingdom.
OECD (2016), Annual Survey of Large Pension Funds and Public Pension Reserve Funds 2015.
OFT (2010), Infrastructure Ownership and Control Stock-take. Office of Fair Trading Report 1290, December 2010.
ONS (2015a), Value of UK infrastructure. Office of National Statistics, 3 December 2015. https://www.ons.gov.uk/aboutus/transparencyandgovernance/freedomofinformationfoi/valueofukinfrastructure
ONS (2015b), Ownership of UK Quoted Shares: 2014.
ONS (2016), The UK national balance sheet: 2016 estimates. Office for National Statistics, 18 August 2016.
ONS (2017), Output in the Construction Industry explorable datasets. April 2017.
Panayiotou, A. and Medda, F. (2014), Attracting private sector participation in infrastructure investment: the UK case. Public Money & Management, Vol. 34(6), pp. 425-431.
Pinsent Masons (2014), China Invests West. Pinsents Masons and Cebr, London.
Pisu, M., Pels, P. and Bottini, N. (2015), Improving Infrastructure in the United Kingdom. OECD Economics Department Working Papers, No. 1244.
PLSA (2016), PLSA annual survey 2016. Pensions and Lifetime Savings Association.
Preqin (2015), The Top
00 Investors in Infrastructure. Infrastructure Spotlight, June 2015.
Preqin (2016a), 2016 Preqin Global Infrastructure Report. London.
Preqin (2016b), The UK Infrastructure Market. London.
PwC (2015a), Capital project and infrastructure spending. Outlook to 2025. Research findings.
PwC (2015b), The role and impact of specialist investors in UK infrastructure.
Raco, M. (2016) (Ed.), Britain for sale? Perspectives on the costs and benefits of foreign ownership. The Smith Institute.
Reform (2009), Road to Recovery.
Rhodes, Ch. (2014), Infrastructure Policy, House of Commons Library, 9 Dec 2014.
RICS (2013), The Global Infrastructure Challenge: The Role of PPP in a New Financial and Economic Paradigm.
S&P (2007), Listed infrastructure Assets – A Primer, Standard & Poor’s.
S&P (2016), IPE Real Estate, Special Issue: Real Assets 2016.

54
Stern, J. (2014), The British Utility Regulation Model: Its Recent History and Future Prospects. CCRP Working Paper No 23, City University London.
Subacchi, P., Pickford, S., Tentori, D. and Huang, H. (2014), Building Growth in Europe. Chatham House Report.
TheCityUK (2014), Infrastructure 2014. Financial Market Series.
TheCityUK (2015), Sovereign Wealth Funds. Financial Markets Series.
The Economist (2014), Channel tunnel’s 20th birthday holds lesson on big projects. 5 May 2014.
The Scottish Government (2015), Infrastructure Investment Plan 2015.
Thomson Reuters (2017), Project Finance Review. Full Year 2016.
Topham, G. (2017), British rail is nationalised all over again – by foreign states. The Guardian, 1 April 2017.
TUC (2016), UK languishing near bottom of OECD rankings for investment in vital infrastructure. Trades Union Congress, 16 November 2016.
UBS (2016), Pension Fund Indicators 2016.
UKRN (2014), UK Regulated Infrastructure. An Investor Guide. UK Regulators Network.
UNCTAD (2016), World Investment Report 2016. Investor Nationality: Policy Challenges.
Vecchi, V., Hellowell, M. and Gatti, S. (2013), Does the private sector receive an excessive return from investments in health care infrastructure projects? Evidence from the UK, Health Policy, 110-2, pp. 243-270.
Wagenvoort, R., De Nicola, C and Kappeler, A. (2010), Infrastructure Finance in Europe: Composition, Evolution and Crisis Impact. EIB Papers, Vol. 15, No. 1.
WEF (2016), The Global Competitiveness Report 2016–2017. World Economic Forum.
Wellings, R. (2016), Without Delay. Getting Britain’s railways moving. IEA Discussion Paper No.69.
Welsh Government (2012), Wales Infrastructure Investment Plan for Growth and Jobs.
Willis Towers Watson (2016), Global Alternatives Survey 2016.
World Bank (2016), Connecting to Compete 2016. Trade Logistics in the Global Economy.
World Bank (2017), World Development Indicators. Retrieved March 2017.
□