uk oil and gas reserves and resources
TRANSCRIPT

as at end 2020
UK Oil and GasReserves and Resources

This publication can be found on the OGAs website: https://www.ogauthority.co.uk/news-publications/publications/.
© OGA Copyright 2021
URN
You may re-use this information (not including logos) free of charge in any format or medium, under the terms of the Open Government Licence.
To view this licence, visit: www.nationalarchives.gov.uk/doc/open-government-licence/
or write to the: Information Policy Team, The National Archives, Kew, London TW9 4DU
or email: [email protected]
Enquiries to:
Oil and Gas Authority
21 Bloomsbury Street
London
WC1B 3HF
Email: [email protected]
Published by the Oil and Gas Authority
Contents
1. Introduction and executive summary 3
2. UK Reserves and Resources 5
3. Oil and gas reserves and contingent resources progression 6
4. Detailed breakout of oil and gas reserves and contingent resources 10
5. Prospective Resources 15
Appendices 19
A. Data sources 19
B.Reservesandresources–OGAclassification–ComparisonofOGAvsSPEPRMS 19
C.PlayListings 21
D.Metricversionsoftables 22

31. Introduction and executive summary | UK Oil and Gas Reserves and Resources as at end 2020
1. Introduction and executive summary
Official government forecasts suggest that oil and gas will remain an important and critical part of our energy mix for the foreseeable future, as we transition to net zero1.
1 https://assets.publishing.service.gov.uk/government/uploads/system/uploads/attachment_data/file/931323/updated-energy-and-emissions-projections-2019.pdf2 https://www.ogauthority.co.uk/media/6522/emissions-intensity-comparison-of-ukcs-gas-production-and-imported-lng-and-pipelined-gas-v2.png3 https://www.ogauthority.co.uk/media/7105/the-oga-strategy.pdf4 https://www.ogauthority.co.uk/the-move-to-net-zero/5 https://www.ogauthority.co.uk/media/7568/decarbonising-oil-gas-production-in-the-ukcs.pdf
Managing the basin’s declining production to maximise value from the United Kingdom Continental Shelf (UKCS) is still vital to meet our energy demands as long as they exist, as well as reducing reliance on imports and their associated carbon footprint2.
The purpose of this annual report is to provide an estimate of the UKCS’s remaining recoverable petroleum resources.
The OGA believes that maximising the economic recovery of the UK’s remaining oil and gas need not be in conflict with the energy transition and that the industry has the skills, technology and capital to help unlock the solutions required to help the UK achieve net zero.
In light of the UK’s need to maintain a secure energy supply which supports and contributes to the country’s net zero ambition, the OGA has an updated strategy3 and has continued implementing a programme to embed net zero considerations into its core work4. This includes a requirement for industry to help the government achieve the net zero target, as well as developing new benchmarking to track and monitor industry’s performance in line with their production emissions commitments5.

4 1. Introduction and executive summary | UK Oil and Gas Reserves and Resources as at end 2020
Thereportfinds:
6 https://www.ogauthority.co.uk/data-centre/data-downloads-and-publications/production-projections7 Note that this figure is subject to revision as a result of future appraisal activity
• The UK’s petroleum reserves remain at a significant level. The OGA’s estimate for proven and probable (2P) UK reserves as at end 2020 is 4.4 billion boe, 0.8bn boe lower than as at end 2019. On the basis of current production projections6, this could sustain production from the UKCS to 2030.
• In 2020, about 570 mmboe were produced, 270 million boe (mmboe) were added to 2P reserves, reductions to existing field forecasts totalled -450mmboe which equates to a reserve replacement ratio of -33%. Less than 100 mmboe were matured by the granting of consent to 3 new field developments and 4 field development plan addenda.
• The UK’s contingent resource level is significant with a central estimate of discovered undeveloped resources of 6.8 billion boe. Much of this resource is in mature developed areas.
• In aggregate, UKCS petroleum reserves and discovered resources are both approximately 70% oil and 30% gas, when expressed in oil equivalent terms.
• Exploration success in 2020 delivered an addition of 212 million boe to the total of contingent resources7. A key part of exploration Stewardship is now to progress the many attractive opportunities within the prospective resource portfolio into drill-ready prospects, and into subsequent discoveries.
• The mean prospective resources in mapped leads and prospects are estimated as 3.7 billion boe. This is supplemented by an additional mean prospective resource of 11.2 billion boe estimated to reside in plays outside of mapped leads and prospects.
52. UK Reserves and Resources | UK Oil and Gas Reserves and Resources as at end 2020
2. UK Reserves and Resources
The OGA estimate for remaining UK recoverable petroleum resources, include Reserves, Undeveloped Resources and undiscovered petroleum resources. A total of some 45.9 billion boe of oil and gas had been produced from the UKCS by the end of 2020.
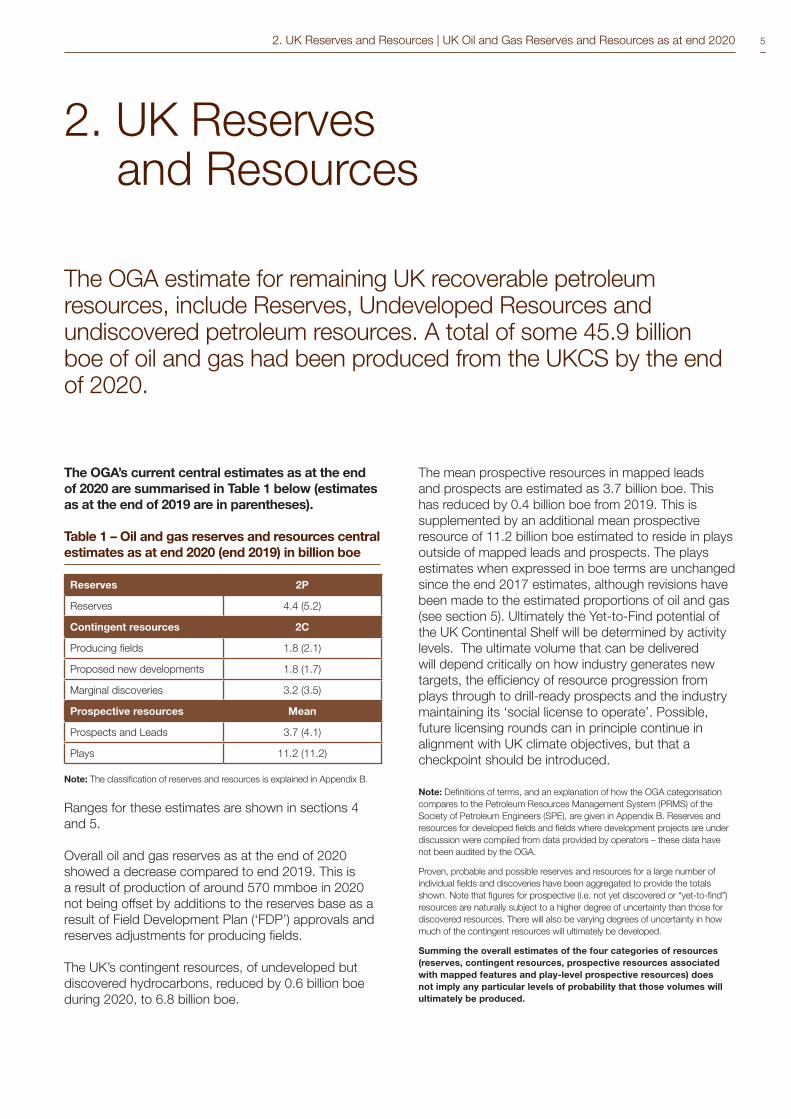
The OGA’s current central estimates as at the end of 2020 are summarised in Table 1 below (estimates as at the end of 2019 are in parentheses).
Table 1 – Oil and gas reserves and resources central estimates as at end 2020 (end 2019) in billion boe
Reserves 2P
Reserves 4.4 (5.2)
Contingentresources 2C
Producing fields 1.8 (2.1)
Proposed new developments 1.8 (1.7)
Marginal discoveries 3.2 (3.5)
Prospective resources Mean
Prospects and Leads 3.7 (4.1)
Plays 11.2 (11.2)
Note: The classification of reserves and resources is explained in Appendix B.
Ranges for these estimates are shown in sections 4 and 5.
Overall oil and gas reserves as at the end of 2020 showed a decrease compared to end 2019. This is a result of production of around 570 mmboe in 2020 not being offset by additions to the reserves base as a result of Field Development Plan (‘FDP’) approvals and reserves adjustments for producing fields.
The UK’s contingent resources, of undeveloped but discovered hydrocarbons, reduced by 0.6 billion boe during 2020, to 6.8 billion boe.
The mean prospective resources in mapped leads and prospects are estimated as 3.7 billion boe. This has reduced by 0.4 billion boe from 2019. This is supplemented by an additional mean prospective resource of 11.2 billion boe estimated to reside in plays outside of mapped leads and prospects. The plays estimates when expressed in boe terms are unchanged since the end 2017 estimates, although revisions have been made to the estimated proportions of oil and gas (see section 5). Ultimately the Yet-to-Find potential of the UK Continental Shelf will be determined by activity levels. The ultimate volume that can be delivered will depend critically on how industry generates new targets, the efficiency of resource progression from plays through to drill-ready prospects and the industry maintaining its ‘social license to operate’. Possible, future licensing rounds can in principle continue in alignment with UK climate objectives, but that a checkpoint should be introduced.
Note: Definitions of terms, and an explanation of how the OGA categorisation compares to the Petroleum Resources Management System (PRMS) of the Society of Petroleum Engineers (SPE), are given in Appendix B. Reserves and resources for developed fields and fields where development projects are under discussion were compiled from data provided by operators – these data have not been audited by the OGA.
Proven, probable and possible reserves and resources for a large number of individual fields and discoveries have been aggregated to provide the totals shown. Note that figures for prospective (i.e. not yet discovered or “yet-to-find”) resources are naturally subject to a higher degree of uncertainty than those for discovered resources. There will also be varying degrees of uncertainty in how much of the contingent resources will ultimately be developed.
Summingtheoverallestimatesofthefourcategoriesofresources(reserves, contingent resources, prospective resources associated with mapped features and play-level prospective resources) does not imply any particular levels of probability that those volumes will ultimately be produced.

6 3. Oil and gas reserves and contingent resources progression | UK Oil and Gas Reserves and Resources as at end 2020
3. Oil and gas reserves and contingent resources progression
3.1UKCSreservesandresourcesprogressionin2020
Figure 1, below, illustrates the progression of resources and reserves between the major categories during 2020.
• Six new discoveries from exploration successes in 2020 added 212 mmboe to the contingent resource base.
• Three new Field Development Plans (FDPs) consented to in 2020 and four FDP addenda (FDPAs) for incremental projects in producing fields resulted in less than 100 million boe movement from contingent resources to reserves. The low oil price and Covid-19 pandemic resulted in the deferral of some projects.
• Production during 2020 of around 570 mmboe resulted in an reduction in (remaining) reserves.
Figure 1 Reserves and Resources Progression
6.8unsanctioned
4.4sanctioned
45.9produced to date
2020changes
0.2
0.1
0.6
Prospects Leads and Plays
Billion boe added from new discoveries in 2020
Billion boe moved into sanctioned from project approvals in 2020
Billion boe produced in 2020 with 80% production efficiency
3.7prospective resources in
mapped prospects and leads
11.2 in plays
(Numbers in billion boe as at end 2020)

73. Oil and gas reserves and contingent resources progression | UK Oil and Gas Reserves and Resources as at end 2020
3.2 Reserves progression
Reserves reduced from 5.2 billion boe as at end 2019 to 4.4 billion boe as at end 2020. This was a result of:
• Production during 2020 of 570 mmboe
• Three new field developments consented to and four FDP addenda for incremental projects in producing fields in 2020 resulted in less than 100 million boe movement from contingent resources to reserves.
• A net reduction to the reserves estimates for producing fields of ca -450 mmboe (positive additions from other in-field activities, improved field performance and life of field extension (CoP deferral), but with offsetting downward revisions in other fields and life of field reductions (CoP acceleration).
Figure2:2Preservechangesfromend 2019 to end 2020
3.3Contingentresourcesprogression
• The UK’s contingent resources represents a significant opportunity to progress discovered resources to development. There was a 0.6 billion boe reduction in the central estimate of total contingent resources during 2020, the overall estimate is 6.8 billion boe. There were several changes within the contingent resources categories, as a result of:
• Six new discoveries from exploration successes in 2020 adding 212 mmboe to the contingent resource base.
• Three new field developments consented to in 2020 resulted in less than 100 mmboe movement from contingent resources to reserves
• The sanction of a number of incremental projects in producing fields resulting in the movement of contingent resources to reserves
• A number of other adjustments made by operators resulting in an overall decrease in contingent resources in producing fields.
Figure3:2Cresourcechangesfrom end 2019 to end 2020
Ca. 100 mmboe of the proposed new developments subsequently moved from contingent resources to the Reserves category as a result of development projects being sanctioned and approved during 2020. Appraisal and technical studies have reduced the marginal discoveries estimated resources by ca.-200mmboe.

8 3. Oil and gas reserves and contingent resources progression | UK Oil and Gas Reserves and Resources as at end 2020
3.4 Production and reserves replacement trends
Reserves replacement ratio
This provides an indication of how current production levels are being replenished through the maturation of contingent resources and exploration discoveries into reserves.
The underlying reserves replacement ratio in 2020 was -33%. Less than 100 mmboe of reserves were added as a result of three Field Development Plans and four Field Development Plan addenda consents, while around 450 mmboe were removed as a result of revised estimates of existing fields. This compares to production of around 570 mmboe in 2020. This can be expected during a period of low oil price in a declining, mature basin.
Figure 4 below shows how 2P reserves and the reserves replacement ratio have changed over the last 21 years. It can be seen there is a large variation in the reserves replacement ratio from year to year, partly as a result of oil price fluctuations. The negative reserves replacement ratio in 2015 was a result of the OGA re-categorising certain types of project from reserves to contingent resources. Prior to 2015, DECC and its predecessors included in the reserves category projects that had not yet been sanctioned but were expected to be sanctioned in the near future. This is permitted under the SPE PRMS (the “Justified for Development” category), however the OGA now includes projects in the reserves category only where the project has been sanctioned by the participants and the OGA has issued a Development and Production Consent.
Figure4:Oilandgas2Preservesreplacement
Figure 5 below shows how production and the central estimate of reserves have changed in the last 8 years. As can been seen, overall the UK reserves have decreased.
Figure5:2Preservesandproduction2013to2020

93. Oil and gas reserves and contingent resources progression | UK Oil and Gas Reserves and Resources as at end 2020
3.5EstimatedUltimateRecoveryhistorictrends
Estimated Ultimate Recovery (EUR) is defined as production (to date) plus (remaining) reserves. Figures 6 and 7 shows how the EUR from the UKCS based on known reserves (proven, probable and possible) has evolved over time for oil and gas fields, respectively.
EUR increased significantly from 1970 to 1990, indicating that exploration success was adding to the contingent resource base and significant contingent resources were being matured to reserves. However,
in recent times the trend has reduced considerably and now is almost flat, because of low maturation of contingent resources to reserves and the low level of discoveries.
It should be noted that the drops observed in EUR in 2015 are because of the change in the OGA’s approach to defining reserves described earlier in this section.
Figure6:OilEstimatedUltimateRecoveryvstime(toend2020)
Figure7:GasEstimatedUltimateRecoveryvstime(toend2020)

10 4. Detailed breakout of oil and gas reserves and contingent resources | UK Oil and Gas Reserves and Resources as at end 2020
4. Detailed breakout of oil and gas reserves and contingent resources
In this section, ranges for the estimates of oil and gas reserves and contingent resources are presented. The gas reserves and contingent resources for proposed new field developments are categorised according to whether they are “dry gas”, “gas from gas condensate fields”, or “associated gas from oil fields”. The oil and gas reserves and contingent resources are also split out by area (Northern North Sea (NNS), Central North Sea (CNS), Southern North Sea (SNS), Irish Sea (IS) and West of Shetland (WoS)).
4.1 Ranges for oil and gas reserves and contingent resources
Oil and gas reserves can be classed into three categories (proven, probable and possible, or 1P, 2P and 3P) depending on the level of confidence that they will eventually be produced (see Appendix B for definitions). Contingent resources can similarly be classed as 1C, 2C, 3C depending on confidence level.
The following tables indicate the split of petroleum liquids and gas reserves and resources and the 1P/2P/3P and 1C/2C/3C ranges according SPE PRMS definitions as given in Appendix B. Proven, probable and possible reserves and resources for a large number of individual fields and discoveries have been aggregated to provide the totals shown. Summing the overall estimates of the three categories of reserves and resources does not imply any particular levels of probability that those volumes will ultimately be produced. The ranges tabulated below should be considered as indicative of the various underlying uncertainties.
UK remaining reserves and contingent resources are both approximately 70% oil and 30% gas when expressed in oil equivalent terms. It should be noted that the split of oil and gas in the total production during 2020 is approximately 60% oil and 40% gas.
Table 2 – Oil and gas reserves and resources as at end 2020 (2019) in billion boe
Reserves 1P 2P 3P
Reserves 2.8 (3.6) 4.4 (5.2) 5.4 (6.3)
Contingentresources 1C 2C 3C
Producing fields 1.3 (1.4) 1.8 (2.1) 2.5 (3.0)
Proposed new developments
1.3 (1.3) 1.8 (1.7) 2.5 (2.4)
Marginal discoveries 1.3 (1.5) 3.2 (3.5) 6.3 (6.7)
Total contingent resources
3.9 (4.1) 6.8 (7.4) 11.3 (12.2)
Note: The classification of reserves and resources is explained in Appendix B.

114. Detailed breakout of oil and gas reserves and contingent resources | UK Oil and Gas Reserves and Resources as at end 2020
Table 3 – Oil reserves and resources as at end 2020 (2019) in billion boe
Oil 1P 2P 3P
Oil reserves 2.0 (2.5) 3.1 (3.6) 3.7 (4.4)
Oil contingent resources 1C 2C 3C
Producing fields 0.9 (1.1) 1.2 (1.5) 1.6 (2.0)
Proposed new developments
1.2 (1.1) 1.6 (1.5) 2.1 (2.1)
Marginal discoveries 0.7 (0.8) 2.0 (2.1) 4.1 (4.3)
Total contingent resources
2.8 (3.0) 4.8 (5.1) 7.8 (8.4)
Table 4 – Gas reserves and resources as at end 2020 (2019) in billion boe
Gas 1P 2P 3P
Gas reserves 0.8 (1.1) 1.3 (1.6) 1.7 (1.9)
Gas contingent resources 1C 2C 3C
Producing fields 0.3 (0.3) 0.6 (0.7) 0.9 (0.9)
Proposed new developments
0.2 (0.2) 0.2 (0.3) 0.4 (0.4)
Marginal discoveries 0.5 (0.6) 1.2 (1.4) 2.2 (2.5)
Total contingent resources
1.0 (1.1) 2.1 (2.3) 3.5 (3.8)
Due to rounding, subtotals may not exactly equal the sum or difference of the values entered elsewhere in the table
Versions of the above tables in metric units (million tonnes of oil and billions cubic metres of gas) are presented in Appendix D.
4.2 Gas reserves distribution by type
Figure 8 indicates how UKCS gas reserves are distributed between dry gas fields (primarily located in the SNS), gas from gas condensate fields and associated gas from oil fields (both primarily located in the CNS, NNS and WoS).
The largest contribution to future gas production is expected to come from gas condensate fields. These fields tend to be produced at constant rates throughout the year (periods of planned and unplanned downtime apart), compared to dry gas fields where production rates can be higher during periods of peak demand (e.g. in winter) and lower during periods of low demand (e.g. in summer). Also gas condensate fields need oil export infrastructure to convey their produced liquids to market. About 75% of the condensate gas reserves and resources lie in the CNS.
Figure8:DistributionofUKCSgasreservesandresources (central case)

12 4. Detailed breakout of oil and gas reserves and contingent resources | UK Oil and Gas Reserves and Resources as at end 2020
Tables 5 and 6 indicate the range of resources associated with gas reserves and contingent resources in proposed new developments.
Table5–Gasreservesbyfieldtypeasatend2020(2019)inbcf
Fields in production or under development1Pbcf
2Pbcf
3P bcf
Gasreservesfromdrygasfields
Southern basin (i.e. SNS) 1486 (1645) 2587 (2696) 3523 (3499)
Other areas 164 (225) 271 (343) 337 (456)
Gasreservesfromgascondensatefields 2403 (3154) 3810 (4627) 4597 (5300)
Gasreservesfromassociatedgasfromoilfields 643 (1135) 1152 (1521) 1420 (1736)
Table6–Gascontingentresourcesbyfieldtypeasatend2020(2019)inbcf
Fields where proposed development plans are under discussion
1Cbcf
2Cbcf
3Cbcf
Gasresourcesfromdrygasfields
Southern basin (i.e. SNS) 541 (572) 847 (813) 1410 (1116)
Other areas 2 (71) 32 (100) 63 (124)
Gasresourcesfromgascondensatefields 128 (128) 224 (213) 348 (301)
Gasresourcesfromassociatedgasfromoilfields 215 (237) 310 (400) 523 (627)

134. Detailed breakout of oil and gas reserves and contingent resources | UK Oil and Gas Reserves and Resources as at end 2020
4.3 Petroleum resource distribution by geographic area
Figures 9 and 10 show the distribution of UK oil and gas reserves and contingent/discovered resources by area. Indicatively, most oil reserves are within the CNS and WoS areas with significant gas potential in the CNS.
Figure9:Oilreservesandresourcesbyarea(2P/2C)
Figure10:Gasreservesandresourcesbyarea(2P/2C)
14 5. Prospective Resources (Yet-to-Find) | UK Oil and Gas Reserves and Resources as at end 2020
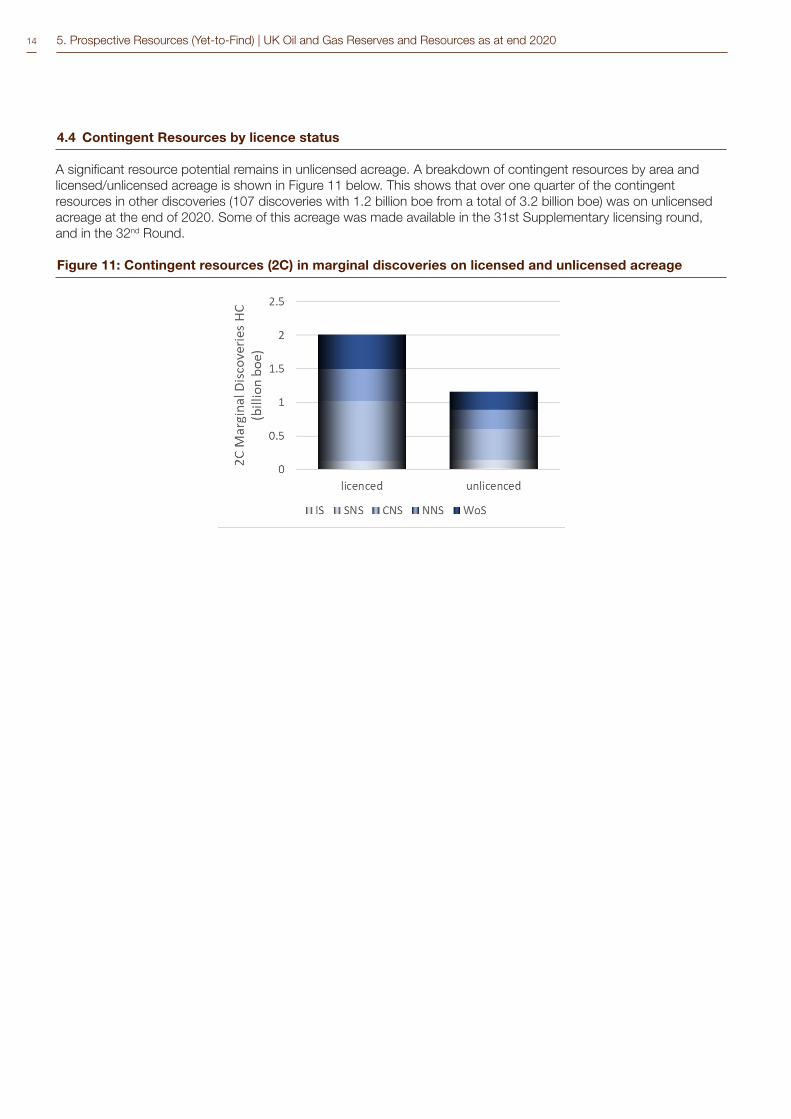
4.4 ContingentResourcesbylicencestatus
A significant resource potential remains in unlicensed acreage. A breakdown of contingent resources by area and licensed/unlicensed acreage is shown in Figure 11 below. This shows that over one quarter of the contingent resources in other discoveries (107 discoveries with 1.2 billion boe from a total of 3.2 billion boe) was on unlicensed acreage at the end of 2020. Some of this acreage was made available in the 31st Supplementary licensing round, and in the 32nd Round.
Figure11:Contingentresources(2C)inmarginaldiscoveriesonlicensedandunlicensedacreage

155. Prospective Resources (Yet-to-Find) | UK Oil and Gas Reserves and Resources as at end 2020
5. Prospective Resources (Yet-to-Find)
5.1Summary
8 UK Oil and Gas Reserves and Resources as at end 2017 https://www.ogauthority.co.uk/media/5126/oga_reserves__resources_report_2018.pdf
The overall Prospective Resource figures, when expressed in billions of boe, are less than last years’ estimates. The OGA estimates that the Mean Yet-to-Find Prospective Resources of leads and prospects in the inventory is 3.7 billion barrels of oil equivalent (Bboe). Within this inventory, a range of volume outcomes is possible, as illustrated in Table 5.1.
The main reasons for this reduction are removal of features from the Lead, Prospect, and Drill Ready Prospect categories as these features mature with technical work and are subsequently reclassified, including being drilled. Drilled features are removed from the Prospective Resources category and discoveries are classified in the Contingent Resources category.
Table 5.1 – Prospective Resources Associated with Leads&Prospects,withCut-Offs
UKCS P90 Mean P10
Total Prospective Resources (Bnboe)
2.4 3.7 5.2
All values calculated stochastically using the Monte Carlo method, with no dependencies. Volumes are risked recoverable prospective resources. 10 million boe unrisked volume cut-off (30 million boe unrisked West of Shetland) and 15% Geological Chance of Success (CoS) cut-off applied.
Leads and prospects included in table 5.1 meet a volume threshold of 10 million boe Mean Prospective Resources (or a 30 million boe mean volume cut-off West of Shetland) and have an estimated technical (geological) chance of success greater than 15%. These thresholds are consistent with drilling activity taking place under current market conditions. It is important to recognise that the final Prospective Resource that industry is able to deliver will depend on the interplay of a number of other factors which will vary spatially and temporally, including economics, infrastructure status, capital availability, technology development, social and environmental factors, and a host of other constraints and enablers including future Climate Compatibility Checkpoints as recommended in the Government review of oil and gas Licensing.
The Prospective Resources available in the Lead and Prospect Inventory are potentially supplemented by an additional 11.2 Bboe of Mean Prospective Resources that are estimated in plays where the Industry has yet to map leads and prospects systematically, partly due to the need for improved geophysical datasets (see table 5.4). By their nature, these resources are more speculative, with greater risk, but also greater opportunities for value creation due to the impact of successful de-risking of chance factors that are shared among a collection of related leads and prospects (play risk).
It is important to recognise that these estimates reflect the current state of subsurface knowledge, limited by the extent of the work that could be performed by the OGA, and that the figures will be revised over time as work on the prospect inventory and play portfolio matures.
5.2Methodology
During 2017/18, the OGA made substantial changes to the methodology by which the UK’s Yet-to-Find Prospective Resources are estimated, using industry best-practices and building upon the legacy inventory of leads and prospects inherited from the OGA’s predecessor organisations, and maintained by the British Geological Survey (BGS).
The Yet-to-Find estimate now also includes Prospective Resources added through Play Analysis, building upon the OGA’s regional geoscience initiatives and activities including the Government-Funded Seismic Programmes, the Regional Mapping Project (delivered by Lloyds Register), and post-doctoral research projects (delivered by Heriot-Watt University, the University of Aberdeen and the University of Durham).
A more detailed description of the methodology used is set out in the OGA’s 2018 reserves and resources report8.

16 5. Prospective Resources (Yet-to-Find) | UK Oil and Gas Reserves and Resources as at end 2020
5.3 Results
All volumes presented in this section (including tables and figures) are risked recoverable prospective resources in the UK Continental Shelf (UKCS). Onshore and unconventional hydrocarbon resources are not included in the assessment. Ultimately the Yet-to-Find potential of the UK Continental Shelf will be
determined by activity levels. The ultimate volume that can be delivered will depend critically on how industry generates new targets, the efficiency of resource progression from plays through to drill-ready prospects and maintaining a ‘social licence to operate’.
LeadandProspect-LevelProspectiveResources
The lead and prospect inventory held by the OGA currently contains almost 3300 features derived largely from operator evaluations, supplemented by in-house evaluations.
It would be reasonable to expect that only a subset of this resource base could be produced commercially, since ultimate recovery will be limited by a number of factors. To model which leads and prospects the industry would consider to be viable targets from a geological perspective, the OGA used a simple set of cut-offs that are consistent with recent drilling activity and so capture features that may, if matured to a drill-ready status, be targeted under current market conditions. This is illustrated in Table 5.2 which shows the outcome of applying a 10 million boe volume cut-off (increased to 30 million boe West of Shetland) and a 15% geological chance of success cut-off. The application of these cut-offs results a reduction in the feature count to a figure (ca. 500 features) that is more consistent with the UKCS’s history of approximately 2,500 offshore exploration wells to date.
Table 5.2.A and figure 12 present prospective resources by basin with 15% Geological Chance of Success (CoS) and 10 million boe volume cut-offs applied (30 million boe West of Shetland). The volume cut-off is applied to the Mean Prospective Resource estimate for each feature.
Table 5.2.B shows the distribution of Prospective Resources by Resource Category with cut-offs applied. In order to progress towards drill-ready status, leads and prospects must mature successfully via technical work programmes. The number of drill-ready prospects is equivalent to around 4 to 5 years-worth of drilling activity at 2020 rates, which is unlikely to meet the OGA’s current Key Performance Indicator of discovering an additional 200 million boe of resource per year (as a five-year rolling average) through exploration, although this metric has been met in the last two years with low levels of drilling activity due, primarily, to larger HPHT discoveries.
In Table 5.2.A and 5.2.B the oil equivalent volumes and total prospective resources have been updated to reflect the movement of features between Resource Categories and removal of drilled opportunities from prospective resources category.

175. Prospective Resources (Yet-to-Find) | UK Oil and Gas Reserves and Resources as at end 2020
Table5.2–ProspectiveResourcesAssociatedwithLeads&Prospects,withCut-Offs
A)Lead&Prospect-LevelProspectiveResources,byBasin(withcut-offsapplied*)
BasinOilEquivalent(billionboe)
P99 P90 P50 Mean P10 P1 % GasFeature Count
West of Shetland 0.0 0.2 0.5 0.8 1.6 5.3 30% 43
Northern North Sea 0.2 0.3 0.5 0.5 0.9 2.0 15% 91
Central North Sea 0.8 1.1 1.6 1.8 2.5 5.3 19% 282
Southern North Sea 0.1 0.2 0.4 0.5 0.9 2.1 98% 57
East Irish Sea 0.0 0.0 0.0 0.0 0.1 0.6 75% 4
Total Prospective Resources 1.9 2.4 3.3 3.7 5.2 9.6 29% 477
B)Lead&Prospect-LevelProspectiveResources,byResourceCategory(withcut-offsapplied*)
ResourceCategoryOilEquivalent(billionboe)
P99 P90 P50 Mean P10 P1 % GasFeature Count
Leads 0.8 1.1 1.2 2.1 3.3 7.7 33% 257
Prospects 0.5 0.7 1.1 1.2 1.2 2.8 27% 180
Drill-ready Prospects 0.0 0.1 0.2 0.4 0.6 2.7 27% 40
Total Prospective Resources 1.9 2.4 3.3 3.7 5.2 9.6 29% 477
Notes: All totals calculated stochastically using Monte Carlo method, with no dependencies (i.e. totals are not calculated arithmetically). Volumes are risked recoverable prospective resources.*10 million boe unrisked volume cut-off (30 million boe West of Shetland; unrisked) and 15% Geological Chance of Success (CoS) cut-off applied.

18 Appendices | UK Oil and Gas Reserves and Resources as at end 2020
Figure12:MeanProspectiveResourcesassociatedwithleadsandprospectsandP90-P10ranges(withcutoffsapplied*)
Play-LevelProspectiveResources
In 2017/2018, the OGA invested substantial effort in systematically estimating the prospective resources at a play level that lie outside of mapped leads and prospects, adopting industry best-practice methods. As at the lead and prospect level, risked prospective resources have been modelled stochastically to produce a range of volume estimates, which can be categorised in various ways, most simply at a basin level (Table 5.4). A high-level list of plays is appended to this report in Appendix C.
Table5.4–Play-LevelProspectiveResources
BasinOilEquivalent(billionboe)
P99 P90 P50 Mean P10 P1
West of Shetland 2.0 3.1 4.6 4.7 6.3 7.8
Rockall Trough 0.0 0.3 2.1 2.5 5.1 8.6
Northern North Sea 0.2 0.4 0.8 0.9 1.7 2.7
Central North Sea 0.6 0.9 1.4 1.5 2.1 2.8
Mid North Sea High 0.0 0.1 0.5 0.5 1.1 1.6
Southern North Sea 0.2 0.4 0.8 0.8 1.2 1.6
East Irish Sea 0.0 0.0 0.0 0.0 0.1 0.3
SW Britain 0.0 0.0 0.2 0.3 0.6 1.0
Total 11.2
Notes: Play-Level Prospective Resources by Basin, no volume or Chance of Success (CoS) cut-offs applied, Total calculated using Monte Carlo with no dependencies. Volumes are risked recoverable prospective resources. Northern North Sea includes East Shetland Platform, SW Britain includes SW Approaches and Cardigan Bay. Mid North Sea High includes Forth Approaches Basin.

19Appendices | UK Oil and Gas Reserves and Resources as at end 2020
APPENDICES
Appendix A
Data sources
The data for both developed fields and development projects under discussion were compiled from data provided by operators via the OGA’s annual UKCS Stewardship Survey. The Survey also collected data on contingent resources in producing fields – these data were not collected prior to 2016.
The end 2020 survey covered:
• 272 producing fields
• 11 projects where an FDP had been approved but production had not yet started
• 23 other projects where FDPs were under discussion as at the end of 2020
Data for unsanctioned discoveries where no development project is under discussion (referred to as potential additional resources in previous Department of Energy and Climate Change reports) were not collected via the UKCS Stewardship Survey.
The methodology for deriving estimates for prospective resources is presented in Appendix C.
Conversionfactors:
The approach used to calculate barrels of oil equivalent is based upon the following (approximate) conversion factors:
1 tonne of crude oil = 7.5 barrels of oil equivalent 1 cubic metre of gas = 35.315 cubic feet of gas
1 cubic foot of gas = 1/5,800 barrels of oil equivalent
9 https://www.spe.org/industry/reserves.php
Appendix B
ComparisonofOGAterminologywithSPEPRMS
The OGA has sought to adjust its definitions and they are now more closely aligned with those recommended by the Petroleum Resources Management System (PRMS) of the Society of Petroleum Engineers (SPE). The full definitions associated with this classification system can be found in SPE PRMS 2005 (updated 2018)9.
The OGA now classifies reserves and resources into the following main categories: reserves, contingent resources and prospective resources, with further sub classes aligned with SPE PRMS as laid out in Figure 13.
Figure13:ComparisonofOGAclassificationswithSPEPRMS
SPEPRMS
Range of Uncertainty
Tota
l pet
role
um in
itia
lly in
pla
ce (P
IIP)
DIs
cove
red
PIIP
ProductionProjectMaturity Sub-classes
Commercial
Reserves
On Production
Approved for Development
Justified for Development
Sub
-Commercial
ContingentResources
Development Pending
Development on Hold
Development Unclarified
Development Not Viable
Unrecoverable
Und
sco
vere
d
PIIP
Prospective resources
Prospect
Lead
Play
Unrecoverable
Increasing
ChanceofCommerciality
OGAclassification
Lower (1P)
Central (2p)
Upper (3P)
Data Source
ReservesFields in production or under
development
UKStewardshipsurvey
Lower (1C)
Central (2C)
Upper (3C)
ContingentResources
ContingentResources inproducingfields
Proposed new developments
MarginalDiscoveriesOGA in house
Lower Mean Upper
OG
A in
ho
use
Prospective Resources
Prospects
Leads
Plays

20 Appendices | UK Oil and Gas Reserves and Resources as at end 2020
Reserves
These are discovered, remaining volumes that are recoverable and commercial. They can be proven, probable or possible, depending on confidence level.
In the UKCS Stewardship Survey, operators were asked to provide reserves data in accordance with the following definitions for fields in production or under development (which are broadly in line with previous DECC guidance)
• Proven(1P):Reserves that, on the available evidence, are virtually certain to be technically and commercially producible, i.e. have a better than 90% chance of being produced
• Probable(2P): Reserves that are not yet proven, but which are estimated to have a better than 50% chance of being technically and commercially producible
• Possible(3P):Reserves that at present cannot be regarded as probable, but which are estimated to have a significant – more than 10% but less than 50% – chance of being technically and commercially producible
Contingentresources
Contingent resources are those quantities of petroleum estimated to be potentially recoverable from known accumulations, but the applied project(s) are not yet considered mature enough for commercial development.
The “contingent resources in producing fields” represent discovered undeveloped resources in the field determined areas.
The “contingent resources in proposed new developments” represent discovered undeveloped potential in new field developments under consideration.
The “contingent resources in marginal discoveries” represent undeveloped discoveries where no development proposals are currently being proposed, in licensed and unlicensed areas.
IntheUKCSStewardshipSurvey,operatorswere asked to provide information on contingent resourcesinfutureplanneddevelopments:
• In producing fields (including incremental projects)
• Where development plans are under discussion but have not yet been approved
Contingentresourcesinotherdiscoveries:
• The OGA assessed contingent resources in other discoveries based on in-house information compiled from a variety of sources
Resourceconfidencelevelsaredefinedasfollows:
• 1C: Resource volumes that on the available evidence, are virtually certain to be technically producible, i.e. have a better than 90% chance of being producible
• 2C: Resource volumes that are not yet 1C, but which are estimated to have a better than 50% chance of being technically producible
• 3C: Resource volumes that at present cannot be regarded as 2C, but which are estimated to have a significant – more than 10% but less than 50% – chance of being technically producible and has an associated well location and plan.

21Appendices | UK Oil and Gas Reserves and Resources as at end 2020
Prospective resources
Undiscovered potentially recoverable resources in mapped leads and prospects that have not yet been drilled, plus those undiscovered potentially recoverable resources that are estimated to reside in plays for which there are few or no mapped features.
Prospective resource category definitions:
• A Lead is a trapping feature that is associated with a speculative volumetric and chance-of-success assessment and requires additional seismic analysis/acquisition or other key data in order to progress to a prospect.
• A Prospect-Under-Evaluation is a robust trap that has been mapped with a higher degree of confidence using good quality seismic and other key data.
• A Drill-Ready-Prospect requires no further evaluation and has an associated well location and plan.
AppendixC
CentralNorthSea&MorayFirth
• Eocene (Proven)• Paleocene (Proven)• Upper Cretaceous (Proven)• Lower Cretaceous (Proven)• Upper Jurassic (Proven)• Middle Jurassic (Proven)• Lower Jurassic (Proven)• Triassic (Proven)
• Devonian (Proven)
Plays not included: Rotliegend, Carboniferous.
Forth Approaches Basin
• Carboniferous (Unproven)
• Rotliegend (Unproven)
Plays not included: Zechstein Dolomites.
MidNorthSeaHigh
• Zechstein (Proven)• Rotliegend (Unproven)• Carboniferous (Unproven)
• Devonian (Unproven)
NorthernNorthSeaandEastShetlandPlatform
• Eocene (Proven)• Upper Paleocene (Proven)• Middle Jurassic (Proven)
• Lower Jurassic (Proven)
• Triassic (Proven)
• Devonian (Unproven)Plays not included: Upper Jurassic interpreted as fully mapped therefore excluded. Upper & Lower Cretaceous excluded as these have been interpreted to be non-reservoir bearing intervals. Intervals younger than Eocene excluded due to biodegredation risk.

22 Appendices | UK Oil and Gas Reserves and Resources as at end 2020
WestofShetland(Faroe-ShetlandBasin)
• Paleocene (Proven)• Upper Cretaceous (Proven)• Lower Cretaceous (Proven)• Jurassic (Proven)
• Triassic (Proven)Plays not included: Fractured Basement.
Rockall Trough
• Triassic (Unproven)• Middle Jurassic (Unproven)• Upper Jurassic (Unproven)• Lower Cretaceous (Unproven)
• Paleocene (Partially Proven)
SouthernNorthSea
• Triassic (Proven)• Zechstein (Proven)• Rotliegend (Proven)
• Carboniferous (Proven)
Plays not included: Intra-Carboniferous, Tight-Gas.
SouthWestBritain(includingSWApproaches&CardiganBay)
• Triassic (Unproven)• Middle Jurassic (Proven)
• Permian (Unproven)Plays not included: Carboniferous
Appendix D
Table D3 Oil reserves and resources as at end 2020 in million tonnes
Oil 1P 2P 3P
Oil reserves 262 411 490
Oil contingent resources 1C 2C 3C
Producingfields 124 159 210
Proposed new developments 154 210 285
Marginaldiscoveries 99 264 547
Total contingent resources 377 633 1042
Table D4 Gas reserves and resources as at end 2020 in billion cubic metres
Gas 1P 2P 3P
Gas reserves 133 221 280
Gas contingent resources 1C 2C 3C
Producingfields 55 104 150
Proposed new developments 25 40 66
Marginaldiscoveries 88 195 359
Total contingent resources 168 339 575

23Appendices | UK Oil and Gas Reserves and Resources as at end 2020
TableD5Gasreservesbyfieldtypeasat end 2020 in billion cubic metres
Fields in production or under development
1P 2P 3P
Gasreservesfromdrygasfields
Southern basin 42 73 100
Other areas 5 8 10
Gas reserves from gas condensatefields
68 108 130
Gas reserves from associated gasfromoilfields
18 33 40
TableD6Gascontingentresourcesbyfieldtype as at end 2020 in billion cubic metres
Fields where proposed development plans are under discussion
1C 2C 3C
Gasresourcesfromdrygasfields
Southern basin 15 24 40
Other areas 0 1 2
Gas resources from gas condensatefields
4 6 10
Gas resources from associated gasfromoilfields
6 9 15

www.ogauthority.co.uk
Copyright © Oil and Gas Authority 2021
Oil and Gas Authority is a limited company registered in England and Wales with registered number 09666504 and VAT registered number 249433979. Our registered office is at 21 Bloomsbury Street, London, United Kingdom, WC1B 3HF