ukraine grain and feed update revisions for marketing … gain publications/grain...gain report –...
TRANSCRIPT

THIS REPORT CONTAINS ASSESSMENTS OF COMMODITY AND TRADE ISSUES MADE BY
USDA STAFF AND NOT NECESSARILY STATEMENTS OF OFFICIAL U.S. GOVERNMENT
POLICY
Date:
GAIN Report Number:
Approved By:
Prepared By:
Report Highlights:
Ukraine has completed planting grains for the 2017 spring campaign. Weather conditions featuring low
levels of soil moisture and frost in some regions have created conditions for lower-than-expected yields
in general. Post estimates that total grain production for Marketing Year (MY) 2017/18 will fall below
the record levels achieved over the last few MYs. Ukraine remains an active grain exporter, with wheat
and barley exports already reaching record levels for MY2016/17. Exporters continue to diversify their
market destinations. This is particularly notable for exports of corn and wheat flour, where there is a
decreasing reliance on a small number of large buyers.
Denys Sobolev, Agricultural Specialist
Dwight Wilder, Agricultural Attaché
Revisions for Marketing Year 2016/17
Grain and Feed Update
Ukraine
UP1714
6/26/2017
Required Report - public distribution

GAIN Report – UP1714 – Grain and Feed Update Page 2 of 18
UNCLASSIFIED USDA Foreign Agricultural Service
Post:
Production
For a more comprehensive outlook of the Ukrainian grain market please refer to our GAIN Report
UP1709. This report is mainly concentrated on changes that occurred during the second half of
MY2016/17.
According to a report provided by the Ministry of Agricultural Policy and Food of Ukraine (MAPF),
Ukrainian farmers have planted: 177 thousand hectares (ha) of spring wheat, 1.5 million ha of spring
barley, and 4.5 million ha of corn as of June 13, 2017. These areas combined with winter grains
planted areas, as reported by the State Statistics Service of Ukraine (SSSU) at the end of 2016 (see
GAIN Report UP1709 for more details), as well as available information about planting areas on the
Crimean Peninsula (217 thousand ha of barley, 294 thousand ha of wheat and 2.5 thousand ha of
corn), form the basis for estimated production areas for individual grain crops reflected in USDA’s
Production, Supply and Distribution (PSD) data (see relevant section at the end of the report for more
details).
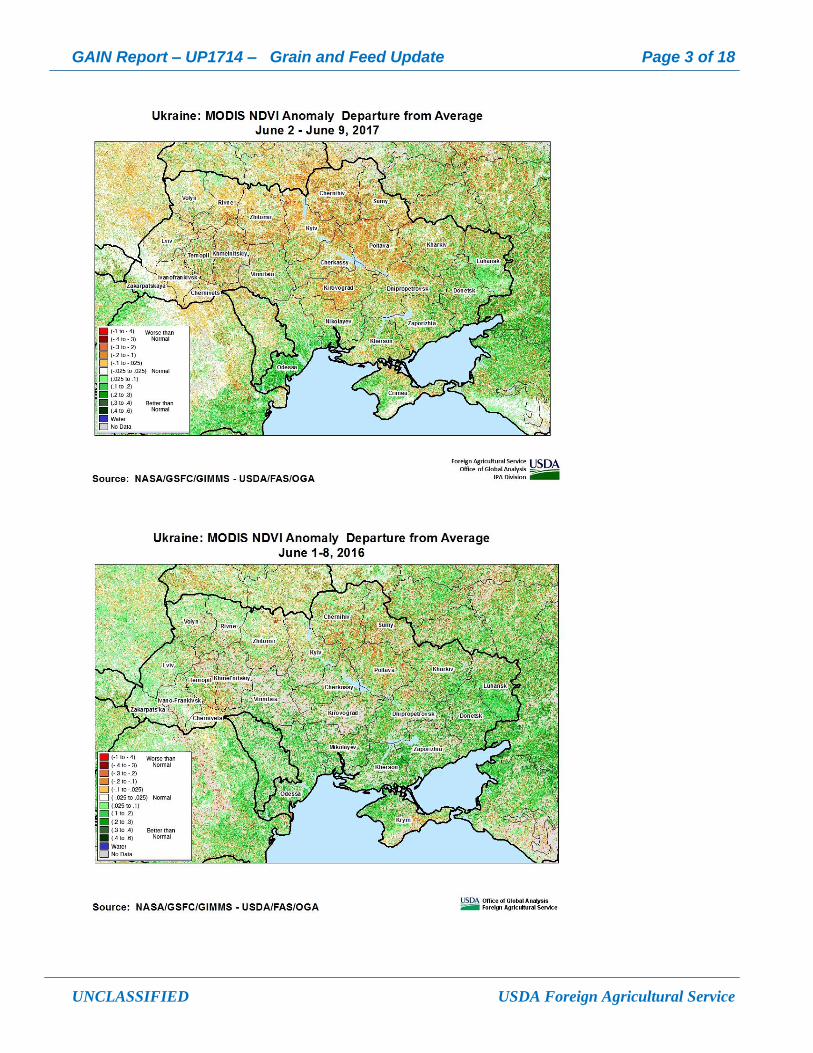
Below is a map of Ukraine generated by satellite imagery that depicts the normalized difference
vegetation index (NDVI) as of early June 2017. Overall, the picture looks considerably less
favorable compared to the same period in 2016, but similar to 2015. So far, there is far less green
color index throughout the country at this point in the crop cycle. At the same time, there is a higher
than normal area displaying white and yellow indices throughout the central-north and west, which
indicates worse than normal vegetative growth, and very likely lower yields in those regions of
Ukraine.
Kiev
GAIN Report – UP1714 – Grain and Feed Update Page 3 of 18
UNCLASSIFIED USDA Foreign Agricultural Service

GAIN Report – UP1714 – Grain and Feed Update Page 4 of 18
UNCLASSIFIED USDA Foreign Agricultural Service
These NDVIs were used to approximate the individual yield estimates for regions of Ukraine and
finalized as estimated production numbers in PSD tables (see relevant section at the end of the report
for more details).
It should be noted that according to industry representatives there were quality issues with corn
harvested late in the fall 2016. And corn harvested in spring 2017 did not match the quality
requirements of the national standards. The current situation with dry weather could lower wheat
yields; however it could boost of milling quality wheat share of total output compared to the 2016
crop.
Trade
For more detailed information about exports of wheat, barley, and rye for MY2015/16 please refer to
our previous GAIN Report UP1709.
Bumper production volumes in 2016 for all major grains (except for rye) translated into increased
export volumes. According to the MAPF report, Ukraine exported 17.3 million metric tons (MMT)
of wheat; 20.1 MMT of corn; 5, 3 MMT of barley; 7.6 thousand metric tons (MT) of rye and 368
thousand MT of wheat flour for local MY2016/17 (July 2016-June 2017 for all mentioned crops) as
of 21 June, 2017. It is notable that exports of wheat, barley, and wheat flour hit record marks.
According to information from the State Fiscal Service of Ukraine (SFSU), for July 2016-March
2017, wheat exports grew by 13 percent compared to the same period of the previous MY. Wheat

GAIN Report – UP1714 – Grain and Feed Update Page 5 of 18
UNCLASSIFIED USDA Foreign Agricultural Service
exports have been diversified by shipping over one third of total exportable volume to South Asia
(predominantly India and Bangladesh) while reducing volumes shipped to the EU by nearly one half.
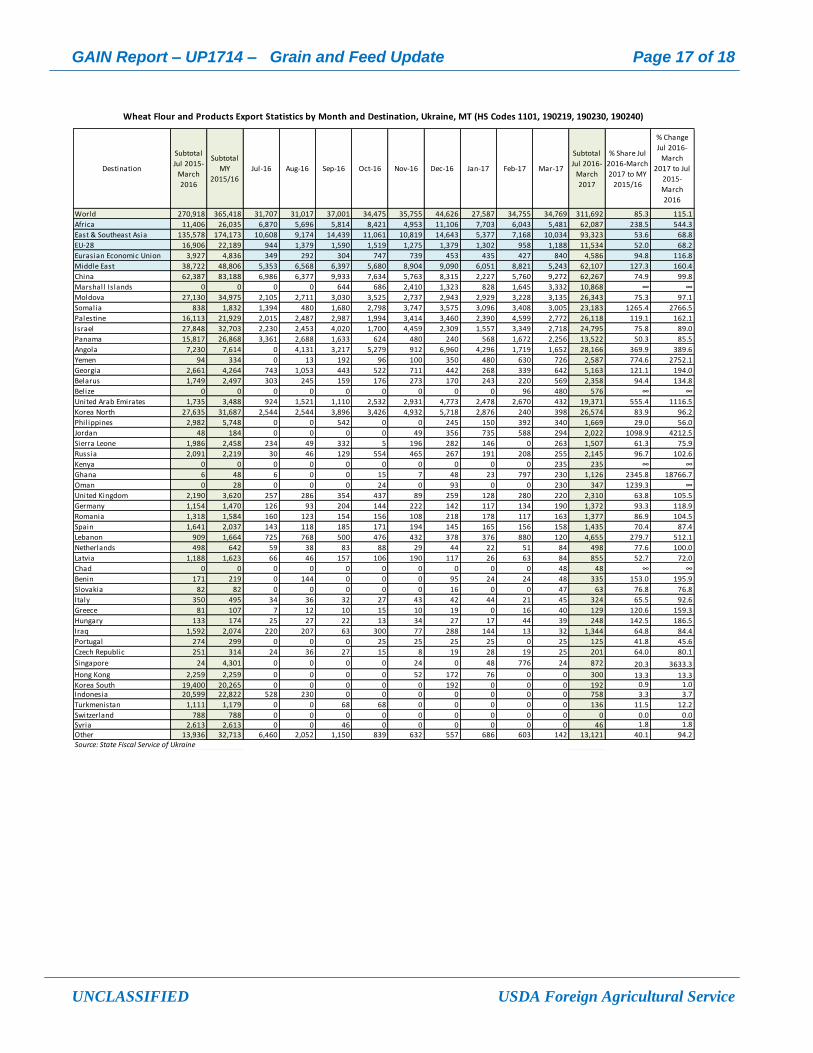
Wheat flour exports grew by 15 percent for July 2016-March 2017, compared to the same period of
the previous MY, according to SFSU. A major change among export destinations occurred as a
result of the 5.5-fold increase of exports to Africa at the expense of a 40-percent decrease of exports
to traditional buyers in East and Southeast Asia -- predominantly China, North Korea and South
Korea. An interesting feature of Ukrainian exports to Africa is that they have shipped to a half a
dozen countries across the continent with volumes varying widely -- from 23 thousand MT to
Somalia, down to only 48 MT to Chad. This is likely a sign that Ukrainian flour producers are
targeting the African market to increase future market share.
For July 2016-March 2017, barley exports grew by almost 21 percent compared to the same period of
the previous MY, according to SFSU. The major driver behind this growth was a 2.7-fold increase in
exports to Africa -- mainly the countries of Libya, Algeria and Tunisia.
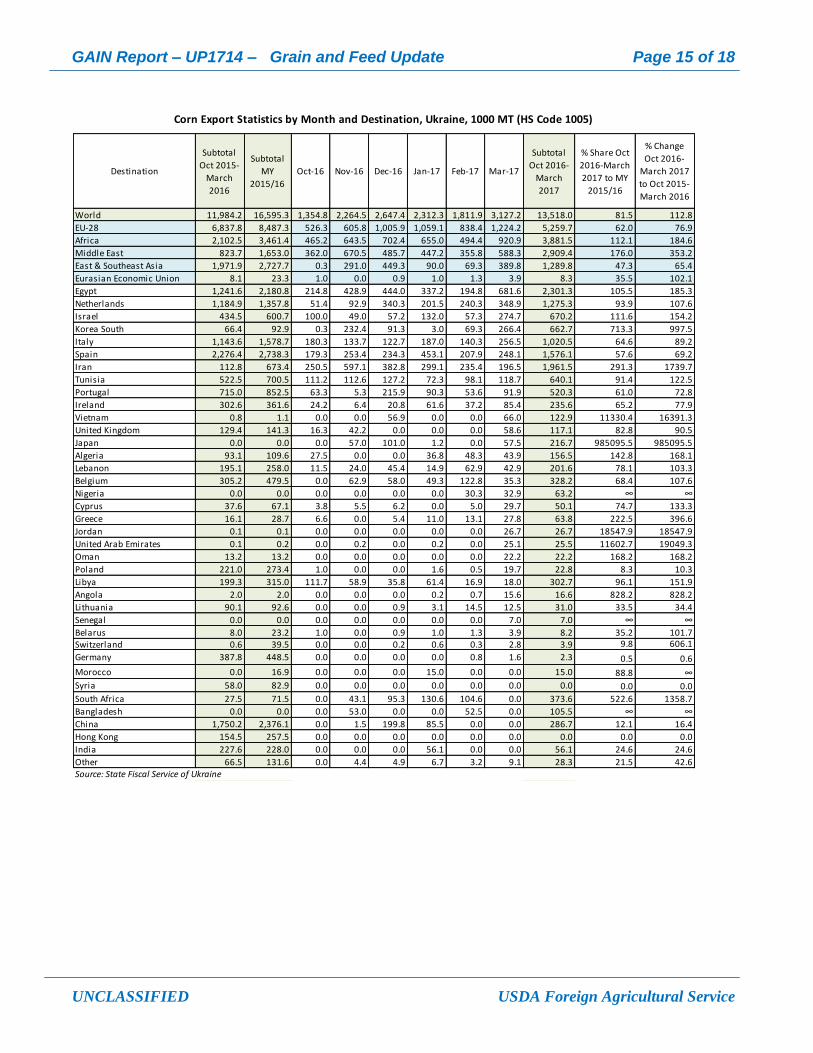
According to SFSU, corn exports grew by almost 13 percent between October 2016-March 2017,
compared to the same period of the previous MY. Ukrainian exporters lost their positions in East
and Southeast Asia after a decrease in demand from the Chinese market -- down to 286 thousand MT
from 1.7 MMT the same period of the previous MY. This amount was practically redirected to South
Korea, Vietnam, and Japan. Another factor supporting corn exports was a boost of shipments to the
Middle East -- mainly to Iran, which bought almost 2 MMT, compared to 113 thousand MT for the
same period of the previous MY.
Consumption
For a more detailed description of grain consumption in Ukraine please refer to our GAIN Report
UP1709.
Post has further decreased wheat and rye food consumption for MY2016/17 against the previous
estimate, based on ever-decreasing volumes of bread production in the country (please refer to graph
below for more details).

GAIN Report – UP1714 – Grain and Feed Update Page 6 of 18
UNCLASSIFIED USDA Foreign Agricultural Service
Despite decreasing bread volumes, wheat flour production for MY2016/17 remains stable (see graph
below), supported by growing exports of this commodity (please refer to Trade Section for more
details).

GAIN Report – UP1714 – Grain and Feed Update Page 7 of 18
UNCLASSIFIED USDA Foreign Agricultural Service
The decrease of bread production for MY2016/17 (please refer to Production of Bread and Bread
Products graph above) resulted in cuts to FSI consumption for wheat and rye in the PSD tables.
These two crops are mainly intended for food consumption, particularly milling and baking (please
see the graph below).
Rye feed consumption levels have been kept at a minimum for MY2016/17 on the grounds that only
a small fraction of this crop is used for feed purposes (please refer to Structure of Domestic
Consumption graph above). Post maintains the same level for MY2017/18 as estimated production
volumes would not likely sustain increased feed consumption of this crop. Growth of rye feed
consumption could only happen under an unlikely scenario involving a drop in its FSI consumption
due to drastic changes in consumption patterns of the local population.
SSSU’s reports lowered animal numbers in the country: a 9.3-percent decrease in pig numbers and a
1.4-percent increase for poultry for December-May 2017. The economic situation in the country does
not suggest increased consumption of products of animal origin in 2017. Moreover, reports of the
local Veterinary Service on outbreaks of African Swine Fever suggest a further decrease of pig herd
sizes in 2017. Based in these assumptions, Post decreased the country’s total feed consumption by
around 5 percent for MY2016/17 compared to MY2015/16, and another 3 percent for MY2017/18
compared to MY2016/17.
Stocks
Ending stocks for all grains at the end of MY2016/17 showed traditional depletion to minimal levels
due to active exports of corn, wheat and barley. Rye stocks hit new lows caused by decreasing
production of this crop for two consecutive MYs in a row. Wheat stocks were lower than usual due to
active exports of both wheat and flour for MY2016/17 (please refer to Trade Section for more
details).

GAIN Report – UP1714 – Grain and Feed Update Page 8 of 18
UNCLASSIFIED USDA Foreign Agricultural Service

GAIN Report – UP1714 – Grain and Feed Update Page 9 of 18
UNCLASSIFIED USDA Foreign Agricultural Service
Production, Supply and Distribution Data
Estimated wheat flour, pasta, and bakery exports/imports have been added to export volumes for

GAIN Report – UP1714 – Grain and Feed Update Page 10 of 18
UNCLASSIFIED USDA Foreign Agricultural Service
wheat -- in wheat grain equivalent, calculated by multiplying the product weight by 1.368.
Grain production numbers include Crimean Peninsula production numbers. Please refer to the
Production section of this report for more information.
Barley:
Post’s production estimate is 24 percent higher than USDA’s official data for MY2017/18, based on
higher yield estimates. This revision leads to increased Post numbers compared to USDA’s official
data for: exports by 17 percent; feed and residual consumption by 26 percent; and FSI consumption
by 7 percent.
Post’s export estimate is 3 percent lower than USDA’s official data for MY2016/17, based on
available import data (please refer to Author Defined section at the end of the report for more
details).
Post’s Feed and Residual estimates are 7 percent higher than USDA’s official data for MY2016/17,
due to low volumes of wheat available for this purpose resulting from active exports (please refer to
Trade section for more details).
Post’s FSI estimates are also 7 percent higher than USDA’s official data for MY2016/17, based on
stable demand from domestic processors.
Corn:
Post’s production estimate is 11 percent lower than USDA’s official data for MY2017/18, based on
lower yield estimates. This revision leads to decreased Post numbers compared to USDA’s official
data for exports by 12 percent, and Feed and Residual consumption by 14 percent, for MY2017/18.
Post’s import estimate is revised 30 percent lower and Post’s export estimate is revised 6 percent
higher than USDA’s official data for MY2016/17, based on available trade data (please refer to
Author Defined section at the end of the report for more details).
Rye:
Post’s production estimate is 6 percent lower than USDA’s official data for MY2017/18, based on
lower yield estimates.
Post’s export estimate is 20 percent lower than USDA’s official data for MY2016/17, based on
available export data (please refer to Author Defined section at the end of the report for more
details).
Post’s Feed and Residual estimates are 80 percent lower than USDA’s official data both for
MY2016/17 and MY2017/18, based on the rationale discussed in the Consumption section of this
report.

GAIN Report – UP1714 – Grain and Feed Update Page 11 of 18
UNCLASSIFIED USDA Foreign Agricultural Service
Post’s FSI estimates are 8 percent higher than USDA’s official data for MY2016/17, and 11 percent
lower for MY2017/18, based on stable demand from domestic processors.
Wheat 2015/2016 2016/2017 2017/2018
Market Begin Year Jul 2015 Jul 2016 Jul 2017
Ukraine USDA
Official New Post
USDA Official
New Post USDA
Official New Post
Area Harvested 7115 7110 6450 6463 6600 6578
Beginning Stocks 5678 5678 3348 3303 2083 1987
Production 27274 27332 26800 26854 25000 25250
MY Imports 27 24 35 30 25 28
TY Imports 27 24 35 30 25 28
TY Imp. from U.S. 0 0 0 0 0 0
Total Supply 32979 33034 30183 30187 27108 27265
MY Exports 17431 17431 17800 17800 14500 14500
TY Exports 17431 17431 17800 17800 14500 14500
Feed and Residual 5100 5200 3600 3700 3900 4000
FSI Consumption 7100 7100 6700 6700 6700 6700
Total Consumption 12200 12300 10300 10400 10600 10700
Ending Stocks 3348 3303 2083 1987 2008 2065
Total Distribution 32979 33034 30183 30187 27108 27265
Yield 3.8333 3.8442 4.155 4.155 3.7879 3.8386
(1000 HA) ,(1000 MT) ,(MT/HA)
Corn 2015/2016 2016/2017 2017/2018
Market Begin Year Oct 2015 Oct 2016 Oct 2017
Ukraine USDA
Official New Post
USDA Official
New Post USDA
Official New Post
Area Harvested 4085 4084 4250 4252 4400 4483
Beginning Stocks 1819 1819 585 1383 1235 1193
Production 23333 23330 28000 28075 28500 25300
MY Imports 28 29 50 35 25 30
TY Imports 28 29 50 35 25 30
TY Imp. from U.S. 0 1 0 0 0 0
Total Supply 25180 25178 28635 29493 29760 26523
MY Exports 16595 16595 19000 20200 20500 18100
TY Exports 16595 16595 19000 20200 20500 18100
Feed and Residual 6600 5800 7000 6700 6900 5900
FSI Consumption 1400 1400 1400 1400 1400 1400
Total Consumption 8000 7200 8400 8100 8300 7300
Ending Stocks 585 1383 1235 1193 960 1123
Total Distribution 25180 25178 28635 29493 29760 26523
Yield 5.7119 5.7125 6.5882 6.6028 6.4773 5.6435
(1000 HA) ,(1000 MT) ,(MT/HA)

GAIN Report – UP1714 – Grain and Feed Update Page 12 of 18
UNCLASSIFIED USDA Foreign Agricultural Service
Barley 2015/2016 2016/2017 2017/2018
Market Begin Year Jul 2015 Jul 2016 Jul 2017
Ukraine USDA
Official New Post
USDA Official
New Post USDA
Official New Post
Area Harvested 3000 2997 3050 3054 2600 2684
Beginning Stocks 1265 1265 909 747 914 693
Production 8751 8788 9900 9938 7400 9200
MY Imports 5 6 5 8 5 6
TY Imports 5 6 5 8 5 6
TY Imp. from U.S. 0 0 0 0 0 0
Total Supply 10021 10059 10814 10693 8319 9899
MY Exports 4412 4412 5500 5300 3600 4200
TY Exports 4673 4673 5500 5200 3600 4200
Feed and Residual 3200 3400 3000 3200 2700 3400
FSI Consumption 1500 1500 1400 1500 1400 1500
Total Consumption 4700 4900 4400 4700 4100 4900
Ending Stocks 909 747 914 693 619 799
Total Distribution 10021 10059 10814 10693 8319 9899
Yield 2.917 2.9323 3.2459 3.2541 2.8462 3.4277
(1000 HA) ,(1000 MT) ,(MT/HA)
Rye 2015/2016 2016/2017 2017/2018
Market Begin Year Jul 2015 Jul 2016 Jul 2017
Ukraine USDA
Official New Post
USDA Official
New Post USDA
Official New Post
Area Harvested 152 151 144 144 170 169
Beginning Stocks 106 106 75 70 75 54
Production 394 391 390 392 450 423
MY Imports 16 15 0 2 0 1
TY Imports 16 16 0 2 0 1
TY Imp. from U.S. 0 0 0 0 0 0
Total Supply 516 512 465 464 525 478
MY Exports 21 20 10 8 10 10
TY Exports 21 20 10 8 10 10
Feed and Residual 20 2 10 2 10 2
FSI Consumption 400 420 370 400 450 400
Total Consumption 420 422 380 402 460 402
Ending Stocks 75 70 75 54 55 66
Total Distribution 516 512 465 464 525 478
Yield 2.5921 2.5894 2.7083 2.7222 2.6471 2.503
(1000 HA) ,(1000 MT) ,(MT/HA)

GAIN Report – UP1714 – Grain and Feed Update Page 13 of 18
UNCLASSIFIED USDA Foreign Agricultural Service
Author Defined:
Destination
Subtotal
Jul 2015-
March
2016
Subtotal
MY
2015/16
Jul-16 Aug-16 Sep-16 Oct-16 Nov-16 Dec-16 Jan-17 Feb-17 Mar-17
Subtotal
Jul 2016-
March
2017
% Share Jul
2016-March
2017 to MY
2015/16
% Change
Jul 2016-
March
2017 to Jul
2015-
March
2016
World 12,910.2 16,931.3 727.4 3,046.1 2,864.5 2,058.1 1,402.2 1,409.3 1,212.7 840.0 1,052.4 14,612.6 86.3 113.2
Africa 3,847.6 5,271.9 133.2 730.2 643.6 623.0 343.7 153.3 111.3 283.7 555.2 3,577.2 67.9 93.0
EU-28 1,742.4 2,037.3 51.4 138.6 146.9 26.5 99.2 115.4 59.1 51.9 278.0 966.9 47.5 55.5
South Asia 896.1 1,469.5 81.6 513.6 569.0 484.3 368.7 868.7 892.7 366.8 97.7 4,243.1 288.7 473.5
Middle East 1,179.5 1,522.8 70.7 135.9 254.4 109.9 45.4 69.7 85.4 133.0 63.6 967.9 63.6 82.1
East & Southeast Asia 4,958.6 6,300.4 388.5 1,457.4 1,190.6 805.7 542.7 199.8 63.9 4.7 57.8 4,710.9 74.8 95.0
Eurasian Economic Union 0.0 0.0 0.0 0.0 0.0 0.0 0.0 0.0 0.1 0.0 0.0 0.1 232.5 232.5
Egypt 1,567.2 2,642.0 50.8 285.0 175.6 284.4 179.5 84.4 60.7 133.9 363.2 1,617.5 61.2 103.2
Italy 470.6 631.3 12.5 27.4 30.3 21.3 36.6 11.0 49.6 10.3 108.1 307.0 48.6 65.2
Spain 1,038.6 1,110.9 0.0 77.8 75.6 0.0 21.7 101.0 5.2 25.0 95.2 401.4 36.1 38.7
Morocco 481.5 553.2 16.5 162.6 247.2 113.0 96.5 0.0 0.0 26.1 90.9 752.8 136.1 156.3
Tunisia 496.2 566.7 56.5 39.6 75.7 43.9 9.5 39.5 26.0 66.3 75.8 432.8 76.4 87.2
Indonesia 1,044.6 1,739.9 206.6 230.4 310.8 201.6 319.5 70.8 0.2 1.0 56.3 1,397.1 80.3 133.7
India 0.0 52.1 0.0 193.1 217.2 298.0 264.1 814.9 779.9 311.8 52.9 2,932.0 5627.6 ∞
Turkey 105.7 112.0 0.0 2.8 22.5 0.0 1.7 0.0 0.0 0.0 46.4 73.4 65.5 69.4
Bangladesh 896.1 1,417.4 81.6 320.4 348.0 183.4 103.4 53.8 112.8 55.0 44.7 1,303.1 91.9 145.4
Portugal 0.0 0.0 0.0 0.0 0.0 0.0 0.0 0.0 0.0 0.0 29.0 29.0 ∞ ∞
Mauritania 106.2 106.2 0.0 58.4 1.0 0.0 0.0 0.0 0.0 0.0 18.1 77.5 73.0 73.0
Lebanon 207.5 296.1 13.3 15.9 92.2 37.2 10.6 51.8 24.8 14.3 16.8 276.8 93.5 133.4
Greece 60.8 71.8 0.0 0.0 3.2 0.0 0.0 0.0 0.0 12.4 12.3 27.8 38.7 45.7
United Kingdom 13.0 23.9 6.1 4.0 7.0 2.1 3.8 0.0 0.0 0.0 11.4 34.4 143.8 263.3
Cyprus 0.0 9.1 0.0 0.0 0.0 0.0 27.5 0.0 1.8 1.3 8.5 39.0 428.9 ∞
Netherlands 86.1 107.1 4.8 4.3 11.1 0.0 4.1 0.1 0.4 0.2 8.4 33.4 31.2 38.8
Libya 121.2 200.5 9.4 77.3 8.4 47.0 18.2 29.3 6.2 0.0 4.1 199.9 99.7 165.0
Algeria 106.3 106.3 0.0 69.3 12.3 56.1 7.4 0.0 7.4 9.1 3.0 164.7 154.9 154.9
Austria 5.2 6.2 0.0 0.0 0.9 0.0 2.0 1.2 0.0 0.0 2.0 6.1 98.4 115.9
Germany 13.8 19.7 1.0 0.2 5.7 2.2 1.7 1.1 0.6 1.0 1.9 15.3 77.7 110.9Philippines 507.1 745.3 166.0 121.5 205.2 112.2 73.7 2.1 1.6 1.2 1.5 685.0 91.9 135.1
Yemen 36.0 36.0 0.0 0.0 0.0 0.0 0.0 0.0 0.0 0.0 0.4 0.4 1.2 1.2
Switzerland 8.1 8.4 26.2 2.6 1.8 0.5 1.2 0.7 1.4 1.1 0.4 35.8 426.4 443.8Jordan 0.2 53.6 0.0 0.0 0.0 0.0 0.1 0.3 0.1 52.6 0.1 53.1 99.0 26550.5Oman 9.8 31.2 0.0 0.0 0.0 15.3 0.4 0.0 0.0 0.1 0.0 15.7 50.3 160.5
Syria 351.8 351.8 0.0 0.0 0.0 0.0 0.0 0.0 0.0 0.0 0.0 0.0 0.0 0.0
Taiwan 7.3 7.3 0.0 0.0 0.0 0.0 0.0 0.0 0.0 0.0 0.0 0.0 0.0 0.0
Tanzania 16.5 16.5 0.0 0.0 0.0 0.0 0.0 0.0 0.0 0.0 0.0 0.0 0.0 0.0Thailand 2,012.1 2,202.8 3.9 667.1 442.2 294.5 15.2 0.0 60.3 1.9 0.0 1,485.2 67.4 73.8
Vietnam 59.8 59.8 0.0 0.0 0.0 0.0 0.0 0.0 0.0 0.0 0.0 0.0 0.0 0.0United Arab Emirates 14.6 19.6 0.0 0.0 0.3 0.0 0.0 5.0 0.0 0.0 0.0 5.4 27.3 36.6
Sudan 35.4 35.4 0.0 0.0 0.0 0.0 0.0 0.0 0.0 48.3 0.0 48.3 136.3 136.3
Nigeria 0.0 29.9 0.1 0.0 0.0 30.2 32.5 0.0 0.0 0.0 0.0 62.8 209.9 ∞Mexico 252.3 288.0 0.0 69.0 48.4 0.0 0.0 0.0 0.0 0.0 0.0 117.4 40.8 46.5
Romania 27.5 27.5 0.0 21.9 11.0 0.0 0.0 0.0 0.0 0.0 0.0 32.9 119.5 119.5
Saudi Arabia 0.0 0.0 0.0 0.0 60.0 0.0 0.0 0.0 0.0 0.0 0.0 60.0 ∞ ∞
Senegal 0.0 0.0 0.0 0.0 35.5 0.0 0.0 0.0 11.0 0.0 0.0 46.5 ∞ ∞Singapore 15.9 60.8 1.1 2.9 2.8 0.0 0.0 0.0 0.0 0.0 0.0 6.8 11.1 42.5
Somalia 7.9 7.9 0.0 0.0 0.0 0.0 0.0 0.0 0.0 0.0 0.0 0.0 0.0 0.0
South Africa 113.6 156.7 0.0 0.0 0.0 0.0 0.0 0.0 0.0 0.0 0.0 0.0 0.0 0.0Kenya 106.3 150.1 0.0 38.0 41.6 0.0 0.0 0.0 0.0 0.0 0.0 79.6 53.0 74.9Korea South 1,014.9 1,139.6 0.0 426.4 223.7 164.8 126.0 119.0 1.7 0.0 0.0 1,061.7 93.2 104.6Malaysia 160.6 184.6 8.5 9.1 5.8 4.6 8.3 1.6 0.0 0.5 0.0 38.4 20.8 23.9
Iran 0.0 33.6 2.7 0.0 0.0 0.0 0.0 0.0 0.0 0.0 0.0 2.7 8.1 ∞
Israel 453.7 588.7 53.8 117.2 78.8 57.3 32.6 12.6 60.5 66.0 0.0 478.6 81.3 105.5Japan 136.0 156.2 0.0 0.0 0.0 28.0 0.0 6.3 0.0 0.0 0.0 34.3 21.9 25.2
Djibouti 388.8 388.8 0.0 0.0 0.0 0.0 0.0 0.0 0.0 0.0 0.0 0.0 0.0 0.0
Ecuador 10.0 10.0 0.0 0.0 11.4 6.9 0.0 0.0 0.0 0.0 0.0 18.3 183.3 183.3
Estonia 2.9 3.4 0.4 0.0 0.0 0.0 0.0 0.0 0.0 0.0 0.0 0.4 11.6 13.8
Ethiopia 260.3 260.9 0.0 0.0 45.0 45.1 0.0 0.0 0.0 0.0 0.0 90.1 34.5 34.6
Other 79.9 104.7 5.8 2.0 6.2 8.6 4.5 2.9 0.6 0.8 0.9 32.2 30.8 40.3
Wheat Export Statistics by Month and Destination, Ukraine, 1000 MT (HS Code 1001)
Source: State Fiscal Service of Ukraine

GAIN Report – UP1714 – Grain and Feed Update Page 14 of 18
UNCLASSIFIED USDA Foreign Agricultural Service
Destination
Subtotal
Jul 2015-
March
2016
Subtotal
MY
2015/16
Jul-16 Aug-16 Sep-16 Oct-16 Nov-16 Dec-16 Jan-17 Feb-17 Mar-17
Subtotal
Jul 2016-
March
2017
% Share Jul
2016-March
2017 to MY
2015/16
% Change
Jul 2016-
March
2017 to Jul
2015-
March
2016
World 4,044.3 4,412.3 1,015.4 1,210.7 944.9 524.7 298.8 314.1 162.0 202.0 208.4 4,881.1 110.6 120.7
Middle East 2,426.4 2,619.6 681.9 470.0 676.7 289.1 56.6 263.0 85.2 87.1 143.5 2,753.1 105.1 113.5
EU-28 203.2 231.0 23.2 162.5 21.1 15.6 22.9 9.2 3.4 21.5 37.9 317.3 137.4 156.2
Africa 540.5 653.2 215.3 412.7 194.7 200.5 214.2 35.5 66.8 85.8 20.9 1,446.4 221.4 267.6
Eurasian Economic Union 6.9 7.3 0.0 0.5 1.4 3.8 4.9 6.1 6.6 8.6 6.3 38.2 521.5 552.9
East & Southeast Asia 862.8 872.6 91.2 159.7 50.6 10.3 0.0 0.0 0.0 0.0 0.0 311.7 35.7 36.1
Saudi Arabia 2,219.1 2,329.8 526.7 384.1 503.9 198.9 0.5 191.4 66.0 66.0 130.1 2,067.7 88.7 93.2
Cyprus 24.3 42.5 5.5 5.1 13.3 0.0 0.0 8.4 1.2 19.4 22.0 74.9 176.4 308.0
Libya 390.0 445.8 148.2 230.6 101.0 143.2 99.9 35.5 60.5 85.8 15.9 920.8 206.6 236.1
Belarus 6.1 6.1 0.0 0.5 1.4 3.8 4.9 6.1 6.6 7.6 6.1 37.0 601.2 601.2
Lebanon 5.8 13.8 5.6 10.1 14.7 26.6 4.9 3.2 5.1 12.1 5.4 87.8 637.4 1525.7
Israel 77.7 86.4 46.8 14.8 50.6 0.0 0.0 17.2 5.5 7.9 5.0 147.9 171.2 190.2
Egypt 3.3 3.3 0.0 0.0 0.0 0.5 0.0 0.0 0.0 0.0 5.0 5.5 163.2 163.2
Greece 11.8 18.7 0.0 12.0 1.7 0.0 0.0 0.0 0.0 0.0 4.4 18.2 97.0 153.8
Netherlands 3.4 5.0 0.0 2.8 0.0 0.0 1.0 0.1 1.9 0.9 4.2 10.9 218.5 320.1
United Kingdom 1.6 2.7 0.0 0.0 0.4 0.0 1.9 0.0 0.0 0.0 4.0 6.3 230.8 394.5
Turkey 0.0 11.0 9.6 15.6 6.0 0.0 6.9 0.0 8.6 0.0 2.8 49.6 451.3 ∞
Romania 0.0 0.0 0.0 0.0 1.3 0.8 8.5 0.0 0.0 0.0 1.6 12.2 ∞ ∞
Poland 0.0 0.1 0.0 0.0 0.3 7.8 11.1 0.0 0.0 0.0 1.5 20.6 31655.4 46763.6
Armenia 0.8 1.2 0.0 0.0 0.0 0.0 0.0 0.0 0.0 1.0 0.2 1.2 102.3 158.6
Switzerland 0.1 0.1 5.2 0.0 0.0 0.0 0.0 0.1 0.0 0.0 0.1 5.4 6181.8 6181.8
Bahrain 0.3 0.4 0.1 0.0 0.0 0.0 0.0 0.0 0.0 0.0 0.1 0.2 46.8 71.5
Bangladesh 0.0 0.0 0.0 0.0 0.0 5.2 0.0 0.0 0.0 0.0 0.0 5.2 ∞ ∞
China 685.6 685.6 90.2 159.7 50.6 0.0 0.0 0.0 0.0 0.0 0.0 300.5 43.8 43.8
Austria 0.0 0.0 0.0 4.1 0.0 0.0 0.0 0.5 0.0 0.0 0.0 4.6 ∞ ∞
Algeria 121.8 151.3 13.0 82.9 12.6 24.7 86.7 0.0 6.3 0.0 0.0 226.2 149.6 185.8
Andorra 0.0 0.0 0.0 0.0 0.0 0.0 0.0 0.0 0.0 0.0 0.0 0.0 ∞ ∞
Iceland 0.0 0.0 1.6 0.0 0.0 0.0 0.0 0.0 0.0 0.0 0.0 1.6 ∞ ∞
India 0.0 0.0 0.4 0.1 0.0 0.0 0.1 0.0 0.0 0.0 0.0 0.6 ∞ ∞
Indonesia 0.0 0.0 1.0 0.0 0.0 0.0 0.0 0.0 0.0 0.0 0.0 1.0 ∞ ∞
Georgia 0.0 0.0 0.0 0.0 0.0 0.0 0.0 0.0 0.0 0.0 0.0 0.0 258.8 314.3
Germany 0.5 0.5 0.0 0.7 0.0 0.0 0.0 0.2 0.2 1.3 0.0 2.4 502.1 502.1
Qatar 37.5 57.4 0.0 0.0 0.0 0.0 0.0 0.0 0.0 0.0 0.0 0.0 0.0 0.1
Slovakia 0.0 0.0 0.0 0.0 0.0 0.0 0.5 0.0 0.0 0.0 0.0 0.5 ∞ ∞
South Africa 0.0 0.0 0.0 0.0 0.0 0.0 0.0 0.0 0.0 0.0 0.0 0.0 0.0 0.0
Spain 158.6 158.6 5.9 123.5 0.0 0.0 0.0 0.0 0.0 0.0 0.0 129.4 81.6 81.6
Oman 7.2 7.2 0.0 0.0 0.5 11.0 0.0 0.6 0.0 0.0 0.0 12.2 167.7 167.7
Pakistan 5.2 29.6 1.9 5.2 0.4 0.3 0.0 0.2 0.0 0.0 0.0 8.1 27.2 154.5
Moldova 0.2 0.2 0.0 0.0 0.0 0.0 0.1 0.0 0.0 0.0 0.0 0.2 118.3 118.3
Morocco 25.3 25.3 26.5 25.2 49.4 5.9 0.0 0.0 0.0 0.0 0.0 107.1 423.4 423.4
Italy 2.8 2.8 6.6 14.1 4.2 7.0 0.0 0.0 0.0 0.0 0.0 31.9 1145.2 1145.2
Japan 177.2 187.0 0.0 0.0 0.0 10.3 0.0 0.0 0.0 0.0 0.0 10.3 5.5 5.8
Jordan 52.5 86.1 92.6 0.0 30.0 52.5 0.0 50.6 0.0 0.0 0.0 225.6 261.9 429.7
Kazakhstan 0.0 0.0 0.0 0.0 0.0 0.0 0.0 0.0 0.0 0.0 0.0 0.0 ∞ ∞
Kuwait 0.0 0.0 0.0 0.0 43.4 0.0 44.1 0.0 0.0 0.0 0.0 87.5 ∞ ∞
Tunisia 0.0 27.5 27.5 74.1 31.7 26.1 27.5 0.0 0.0 0.0 0.0 186.9 679.6 ∞
United Arab Emirates 25.5 26.3 0.4 45.3 27.6 0.0 0.1 0.0 0.0 0.0 0.0 73.4 279.1 287.7
United States 0.0 0.0 0.0 0.0 0.0 0.0 0.0 0.0 0.0 0.0 0.0 0.0 ∞ ∞Source: State Fiscal Service of Ukraine
Barley Export Statistics by Month and Destination, Ukraine, 1000 MT (HS Code 1003)
GAIN Report – UP1714 – Grain and Feed Update Page 15 of 18
UNCLASSIFIED USDA Foreign Agricultural Service
Destination
Subtotal
Oct 2015-
March
2016
Subtotal
MY
2015/16
Oct-16 Nov-16 Dec-16 Jan-17 Feb-17 Mar-17
Subtotal
Oct 2016-
March
2017
% Share Oct
2016-March
2017 to MY
2015/16
% Change
Oct 2016-
March 2017
to Oct 2015-
March 2016
World 11,984.2 16,595.3 1,354.8 2,264.5 2,647.4 2,312.3 1,811.9 3,127.2 13,518.0 81.5 112.8
EU-28 6,837.8 8,487.3 526.3 605.8 1,005.9 1,059.1 838.4 1,224.2 5,259.7 62.0 76.9
Africa 2,102.5 3,461.4 465.2 643.5 702.4 655.0 494.4 920.9 3,881.5 112.1 184.6
Middle East 823.7 1,653.0 362.0 670.5 485.7 447.2 355.8 588.3 2,909.4 176.0 353.2
East & Southeast Asia 1,971.9 2,727.7 0.3 291.0 449.3 90.0 69.3 389.8 1,289.8 47.3 65.4
Eurasian Economic Union 8.1 23.3 1.0 0.0 0.9 1.0 1.3 3.9 8.3 35.5 102.1
Egypt 1,241.6 2,180.8 214.8 428.9 444.0 337.2 194.8 681.6 2,301.3 105.5 185.3
Netherlands 1,184.9 1,357.8 51.4 92.9 340.3 201.5 240.3 348.9 1,275.3 93.9 107.6
Israel 434.5 600.7 100.0 49.0 57.2 132.0 57.3 274.7 670.2 111.6 154.2
Korea South 66.4 92.9 0.3 232.4 91.3 3.0 69.3 266.4 662.7 713.3 997.5
Italy 1,143.6 1,578.7 180.3 133.7 122.7 187.0 140.3 256.5 1,020.5 64.6 89.2
Spain 2,276.4 2,738.3 179.3 253.4 234.3 453.1 207.9 248.1 1,576.1 57.6 69.2
Iran 112.8 673.4 250.5 597.1 382.8 299.1 235.4 196.5 1,961.5 291.3 1739.7
Tunisia 522.5 700.5 111.2 112.6 127.2 72.3 98.1 118.7 640.1 91.4 122.5
Portugal 715.0 852.5 63.3 5.3 215.9 90.3 53.6 91.9 520.3 61.0 72.8
Ireland 302.6 361.6 24.2 6.4 20.8 61.6 37.2 85.4 235.6 65.2 77.9
Vietnam 0.8 1.1 0.0 0.0 56.9 0.0 0.0 66.0 122.9 11330.4 16391.3
United Kingdom 129.4 141.3 16.3 42.2 0.0 0.0 0.0 58.6 117.1 82.8 90.5
Japan 0.0 0.0 0.0 57.0 101.0 1.2 0.0 57.5 216.7 985095.5 985095.5
Algeria 93.1 109.6 27.5 0.0 0.0 36.8 48.3 43.9 156.5 142.8 168.1
Lebanon 195.1 258.0 11.5 24.0 45.4 14.9 62.9 42.9 201.6 78.1 103.3
Belgium 305.2 479.5 0.0 62.9 58.0 49.3 122.8 35.3 328.2 68.4 107.6
Nigeria 0.0 0.0 0.0 0.0 0.0 0.0 30.3 32.9 63.2 ∞ ∞
Cyprus 37.6 67.1 3.8 5.5 6.2 0.0 5.0 29.7 50.1 74.7 133.3
Greece 16.1 28.7 6.6 0.0 5.4 11.0 13.1 27.8 63.8 222.5 396.6
Jordan 0.1 0.1 0.0 0.0 0.0 0.0 0.0 26.7 26.7 18547.9 18547.9
United Arab Emirates 0.1 0.2 0.0 0.2 0.0 0.2 0.0 25.1 25.5 11602.7 19049.3
Oman 13.2 13.2 0.0 0.0 0.0 0.0 0.0 22.2 22.2 168.2 168.2
Poland 221.0 273.4 1.0 0.0 0.0 1.6 0.5 19.7 22.8 8.3 10.3
Libya 199.3 315.0 111.7 58.9 35.8 61.4 16.9 18.0 302.7 96.1 151.9
Angola 2.0 2.0 0.0 0.0 0.0 0.2 0.7 15.6 16.6 828.2 828.2
Lithuania 90.1 92.6 0.0 0.0 0.9 3.1 14.5 12.5 31.0 33.5 34.4
Senegal 0.0 0.0 0.0 0.0 0.0 0.0 0.0 7.0 7.0 ∞ ∞
Belarus 8.0 23.2 1.0 0.0 0.9 1.0 1.3 3.9 8.2 35.2 101.7Switzerland 0.6 39.5 0.0 0.0 0.2 0.6 0.3 2.8 3.9 9.8 606.1
Germany 387.8 448.5 0.0 0.0 0.0 0.0 0.8 1.6 2.3 0.5 0.6
Morocco 0.0 16.9 0.0 0.0 0.0 15.0 0.0 0.0 15.0 88.8 ∞
Syria 58.0 82.9 0.0 0.0 0.0 0.0 0.0 0.0 0.0 0.0 0.0
South Africa 27.5 71.5 0.0 43.1 95.3 130.6 104.6 0.0 373.6 522.6 1358.7
Bangladesh 0.0 0.0 0.0 53.0 0.0 0.0 52.5 0.0 105.5 ∞ ∞
China 1,750.2 2,376.1 0.0 1.5 199.8 85.5 0.0 0.0 286.7 12.1 16.4
Hong Kong 154.5 257.5 0.0 0.0 0.0 0.0 0.0 0.0 0.0 0.0 0.0
India 227.6 228.0 0.0 0.0 0.0 56.1 0.0 0.0 56.1 24.6 24.6
Other 66.5 131.6 0.0 4.4 4.9 6.7 3.2 9.1 28.3 21.5 42.6
Corn Export Statistics by Month and Destination, Ukraine, 1000 MT (HS Code 1005)
Source: State Fiscal Service of Ukraine

GAIN Report – UP1714 – Grain and Feed Update Page 16 of 18
UNCLASSIFIED USDA Foreign Agricultural Service
Destination
Subtotal
Oct 2015-
March
2016
Subtotal
MY
2015/16
Oct-16 Nov-16 Dec-16 Jan-17 Feb-17 Mar-17
Subtotal
Oct 2016-
March
2017
% Share Oct
2016-March
2017 to MY
2015/16
% Change
Oct 2016-
March 2017
to Oct 2015-
March 2016
World 23,228 28,631 187 886 2,410 2,194 7,940 9,235 22,852 79.8 98.4
EU-28 20,203 24,874 143 886 2,029 2,096 7,353 7,901 20,408 82.0 101.0
Middle East 426 688 0 0 292 54 59 47 452 65.7 106.1
Eurasian Economic Union 0 19 0 0 0 0 0 0 0 0.0 ∞
Romania 7,345 9,108 37 778 1,290 654 3,282 2,637 8,678 95.3 118.1
Hungary 7,788 8,530 84 108 448 714 2,283 2,311 5,948 69.7 76.4
France 4,459 6,087 22 0 279 434 856 2,233 3,824 62.8 85.8
Serbia 2,470 2,809 0 0 71 43 450 1,222 1,786 63.6 72.3
Switzerland 105 105 0 0 0 230 689 382 1,301 1239.0 1239.0
Austria 52 301 0 0 0 46 192 129 367 121.9 705.8
Slovakia 118 173 0 0 0 18 29 94 141 81.5 119.5
Spain 0 76 0 0 0 0 20 64 84 110.5 ∞
Chile 107 206 44 0 18 0 74 64 200 97.1 186.9
Turkey 426 688 0 0 292 54 59 47 452 65.7 106.1
Germany 189 278 0 0 11 0 0 35 46 16.5 24.3
Croatia 84 129 0 0 0 0 0 14 14 10.9 16.7
Poland 0 0 0 0 0 0 0 2 2 ∞ ∞
New Zealand 16 16 0 0 0 0 0 1 1 6.3 6.3
Greece 0 3 0 0 0 0 0 0 0 0.0 ∞
Czech Republic 63 83 0 0 0 0 0 0 0 0.0 0.0
Belarus 0 19 0 0 0 0 0 0 0 0.0 ∞
Bulgaria 0 0 0 0 0 0 2 0 2 ∞ ∞
Italy 0 0 0 0 0 0 0 0 0 ∞ ∞
Mexico 0 5 0 0 0 0 0 0 0 0.0 ∞
Moldova 6 7 0 0 0 0 0 0 0 0.0 0.0
United States 0 5 0 0 0 0 3 0 3 60.0 ∞
Corn Seed Imports to Ukraine by Month and Country of Origin, MT (HS Code 100510)
Source: State Fiscal Service of Ukraine
Destination
Subtotal
Jul 2015-
March
2016
Subtotal
MY
2015/16
Jul-16 Aug-16 Sep-16 Oct-16 Nov-16 Dec-16 Jan-17 Feb-17 Mar-17
Subtotal
Jul 2016-
March
2017
% Share Jul
2016-March
2017 to MY
2015/16
% Change
Jul 2016-
March
2017 to Jul
2015-
March
2016
World 14,071 19,720 0 179 0 0 0 0 150 0 4,266 4,595 23.3 32.7
Bangladesh 7,503 7,503 0 0 0 0 0 0 0 0 4,206 4,206 56.1 56.1
Germany 110 110 0 0 0 0 0 0 0 0 60 60 54.5 54.5
Israel 3,278 3,278 0 0 0 0 0 0 0 0 0 0 0.0 0.0
Lithuania 926 1,120 0 0 0 0 0 0 0 0 0 0 0.0 0.0
Poland 0 65 0 0 0 0 0 0 88 0 0 88 135.4 ∞
South Africa 0 5,389 0 0 0 0 0 0 0 0 0 0 0.0 ∞
Belarus 128 128 0 179 0 0 0 0 0 0 0 179 139.8 139.8
Egypt 2,126 2,126 0 0 0 0 0 0 0 0 0 0 0.0 0.0
Andorra 0 0 0 0 0 0 0 0 0 0 0 0 ∞ ∞
Austria 0 0 0 0 0 0 0 0 62 0 0 62 ∞ ∞
Rye Export Statistics by Month and Destination, Ukraine, MT (HS Code 1002)
Source: State Fiscal Service of Ukraine
GAIN Report – UP1714 – Grain and Feed Update Page 17 of 18
UNCLASSIFIED USDA Foreign Agricultural Service
Destination
Subtotal
Jul 2015-
March
2016
Subtotal
MY
2015/16
Jul-16 Aug-16 Sep-16 Oct-16 Nov-16 Dec-16 Jan-17 Feb-17 Mar-17
Subtotal
Jul 2016-
March
2017
% Share Jul
2016-March
2017 to MY
2015/16
% Change
Jul 2016-
March
2017 to Jul
2015-
March
2016
World 270,918 365,418 31,707 31,017 37,001 34,475 35,755 44,626 27,587 34,755 34,769 311,692 85.3 115.1
Africa 11,406 26,035 6,870 5,696 5,814 8,421 4,953 11,106 7,703 6,043 5,481 62,087 238.5 544.3
East & Southeast Asia 135,578 174,173 10,608 9,174 14,439 11,061 10,819 14,643 5,377 7,168 10,034 93,323 53.6 68.8
EU-28 16,906 22,189 944 1,379 1,590 1,519 1,275 1,379 1,302 958 1,188 11,534 52.0 68.2
Eurasian Economic Union 3,927 4,836 349 292 304 747 739 453 435 427 840 4,586 94.8 116.8
Middle East 38,722 48,806 5,353 6,568 6,397 5,680 8,904 9,090 6,051 8,821 5,243 62,107 127.3 160.4
China 62,387 83,188 6,986 6,377 9,933 7,634 5,763 8,315 2,227 5,760 9,272 62,267 74.9 99.8
Marshall Islands 0 0 0 0 644 686 2,410 1,323 828 1,645 3,332 10,868 ∞ ∞
Moldova 27,130 34,975 2,105 2,711 3,030 3,525 2,737 2,943 2,929 3,228 3,135 26,343 75.3 97.1
Somalia 838 1,832 1,394 480 1,680 2,798 3,747 3,575 3,096 3,408 3,005 23,183 1265.4 2766.5
Palestine 16,113 21,929 2,015 2,487 2,987 1,994 3,414 3,460 2,390 4,599 2,772 26,118 119.1 162.1
Israel 27,848 32,703 2,230 2,453 4,020 1,700 4,459 2,309 1,557 3,349 2,718 24,795 75.8 89.0
Panama 15,817 26,868 3,361 2,688 1,633 624 480 240 568 1,672 2,256 13,522 50.3 85.5
Angola 7,230 7,614 0 4,131 3,217 5,279 912 6,960 4,296 1,719 1,652 28,166 369.9 389.6
Yemen 94 334 0 13 192 96 100 350 480 630 726 2,587 774.6 2752.1
Georgia 2,661 4,264 743 1,053 443 522 711 442 268 339 642 5,163 121.1 194.0
Belarus 1,749 2,497 303 245 159 176 273 170 243 220 569 2,358 94.4 134.8
Belize 0 0 0 0 0 0 0 0 0 96 480 576 ∞ ∞
United Arab Emirates 1,735 3,488 924 1,521 1,110 2,532 2,931 4,773 2,478 2,670 432 19,371 555.4 1116.5
Korea North 27,635 31,687 2,544 2,544 3,896 3,426 4,932 5,718 2,876 240 398 26,574 83.9 96.2
Philippines 2,982 5,748 0 0 542 0 0 245 150 392 340 1,669 29.0 56.0
Jordan 48 184 0 0 0 0 49 356 735 588 294 2,022 1098.9 4212.5
Sierra Leone 1,986 2,458 234 49 332 5 196 282 146 0 263 1,507 61.3 75.9
Russia 2,091 2,219 30 46 129 554 465 267 191 208 255 2,145 96.7 102.6
Kenya 0 0 0 0 0 0 0 0 0 0 235 235 ∞ ∞
Ghana 6 48 6 0 0 15 7 48 23 797 230 1,126 2345.8 18766.7
Oman 0 28 0 0 0 24 0 93 0 0 230 347 1239.3 ∞
United Kingdom 2,190 3,620 257 286 354 437 89 259 128 280 220 2,310 63.8 105.5
Germany 1,154 1,470 126 93 204 144 222 142 117 134 190 1,372 93.3 118.9
Romania 1,318 1,584 160 123 154 156 108 218 178 117 163 1,377 86.9 104.5
Spain 1,641 2,037 143 118 185 171 194 145 165 156 158 1,435 70.4 87.4
Lebanon 909 1,664 725 768 500 476 432 378 376 880 120 4,655 279.7 512.1
Netherlands 498 642 59 38 83 88 29 44 22 51 84 498 77.6 100.0
Latvia 1,188 1,623 66 46 157 106 190 117 26 63 84 855 52.7 72.0
Chad 0 0 0 0 0 0 0 0 0 0 48 48 ∞ ∞
Benin 171 219 0 144 0 0 0 95 24 24 48 335 153.0 195.9
Slovakia 82 82 0 0 0 0 0 16 0 0 47 63 76.8 76.8
Italy 350 495 34 36 32 27 43 42 44 21 45 324 65.5 92.6
Greece 81 107 7 12 10 15 10 19 0 16 40 129 120.6 159.3
Hungary 133 174 25 27 22 13 34 27 17 44 39 248 142.5 186.5
Iraq 1,592 2,074 220 207 63 300 77 288 144 13 32 1,344 64.8 84.4
Portugal 274 299 0 0 0 25 25 25 25 0 25 125 41.8 45.6
Czech Republic 251 314 24 36 27 15 8 19 28 19 25 201 64.0 80.1
Singapore 24 4,301 0 0 0 0 24 0 48 776 24 872 20.3 3633.3
Hong Kong 2,259 2,259 0 0 0 0 52 172 76 0 0 300 13.3 13.3Korea South 19,400 20,265 0 0 0 0 0 192 0 0 0 192 0.9 1.0Indonesia 20,599 22,822 528 230 0 0 0 0 0 0 0 758 3.3 3.7
Turkmenistan 1,111 1,179 0 0 68 68 0 0 0 0 0 136 11.5 12.2
Switzerland 788 788 0 0 0 0 0 0 0 0 0 0 0.0 0.0Syria 2,613 2,613 0 0 46 0 0 0 0 0 0 46 1.8 1.8
Other 13,936 32,713 6,460 2,052 1,150 839 632 557 686 603 142 13,121 40.1 94.2
Wheat Flour and Products Export Statistics by Month and Destination, Ukraine, MT (HS Codes 1101, 190219, 190230, 190240)
Source: State Fiscal Service of Ukraine

GAIN Report – UP1714 – Grain and Feed Update Page 18 of 18
UNCLASSIFIED USDA Foreign Agricultural Service
Destination
Subtotal
Jul 2015-
March
2016
Subtotal
MY
2015/16
Jul-16 Aug-16 Sep-16 Oct-16 Nov-16 Dec-16 Jan-17 Feb-17 Mar-17
Subtotal
Jul 2016-
March
2017
% Share Jul
2016-March
2017 to MY
2015/16
% Change
Jul 2016-
March
2017 to Jul
2015-
March
2016
World 11,587 16,282 1,620 1,742 2,094 2,163 2,425 2,417 1,457 1,839 2,438 18,195 111.7 157.0
Africa 3 5 0 0 0 0 0 0 0 0 0 0 0.0 0.0
East & Southeast Asia 215 277 80 23 0 38 12 43 32 1 28 257 92.8 119.5
EU-28 7,496 10,435 1,143 1,206 1,379 1,269 1,642 1,396 1,021 1,142 1,305 11,503 110.2 153.5
Eurasian Economic Union 1,502 1,816 18 176 137 114 58 175 83 187 206 1,154 63.5 76.8
Middle East 2,263 3,615 377 327 578 738 692 800 317 499 899 5,227 144.6 231.0
Turkey 2,239 3,591 377 327 578 738 692 800 317 499 899 5,227 145.6 233.5
Italy 4,275 6,120 560 771 933 831 1,139 751 686 581 653 6,905 112.8 161.5
Poland 2,460 3,280 426 295 367 342 379 445 296 429 546 3,525 107.5 143.3
Russia 1,492 1,746 18 176 137 56 19 175 20 178 138 917 52.5 61.5
Belarus 10 70 0 0 0 58 39 0 63 9 68 237 338.6 2370.0
Hungary 159 240 71 26 35 7 59 52 3 36 42 331 137.9 208.2
China 124 154 55 6 0 37 11 26 19 1 25 180 116.9 145.2
Czech Republic 66 66 11 0 12 0 0 10 0 10 21 64 97.0 97.0
France 251 308 7 40 8 31 12 29 6 31 17 181 58.8 72.1
Germany 71 85 2 20 6 3 5 8 1 3 7 55 64.7 77.5
Greece 20 23 20 30 5 15 14 17 0 8 6 115 500.0 575.0
Netherlands 19 24 6 4 1 2 2 9 0 7 5 36 150.0 189.5
Belgium 0 6 2 4 0 2 7 3 3 0 4 25 416.7 ∞
Finland 36 44 0 1 0 6 6 3 2 4 3 25 56.8 69.4
Thailand 39 62 1 3 0 0 0 12 0 0 2 18 29.0 46.2
Japan 0 1 0 0 0 0 1 0 0 0 1 2 200.0 ∞
United States 102 115 3 10 0 2 20 2 4 0 0 41 35.7 40.2
Vietnam 51 59 23 14 0 1 0 5 13 0 0 56 94.9 109.8
United Arab Emirates 24 24 0 0 0 0 0 0 0 0 0 0 0.0 0.0
United Kingdom 7 7 0 0 0 0 0 0 0 0 0 0 0.0 0.0
Norway 0 0 0 0 0 2 0 0 0 0 0 2 ∞ ∞
Pakistan 0 0 0 0 0 0 0 0 0 0 0 0 ∞ ∞
Romania 46 59 16 14 0 13 15 4 14 1 0 77 130.5 167.4
Slovakia 23 88 0 0 0 0 0 0 5 5 0 10 11.4 43.5
Spain 1 6 0 0 0 0 0 6 0 0 0 6 100.0 600.0
Sweden 5 7 0 0 0 0 0 0 0 0 0 0 0.0 0.0
Switzerland 13 13 0 0 3 0 4 7 5 0 0 19 146.2 146.2
Latvia 44 61 21 0 0 18 0 50 0 20 0 109 178.7 247.7
Lithuania 0 0 0 0 9 0 0 0 0 8 0 17 ∞ ∞
Mexico 0 0 0 0 0 0 0 0 0 0 0 0 ∞ ∞
Morocco 3 5 0 0 0 0 0 0 0 0 0 0 0.0 0.0
India 0 0 0 0 0 0 0 0 0 0 0 0 ∞ ∞
Israel 0 0 0 0 0 0 0 0 0 0 0 0 ∞ ∞
Croatia 1 1 0 0 0 0 0 0 0 0 0 0 0.0 0.0
Brazil 0 9 0 0 0 0 0 0 0 9 0 9 100.0 ∞
Bulgaria 0 0 0 0 0 0 0 4 0 0 0 4 ∞ ∞
Wheat Flour and Products Import Statistics by Month and Country of Origin, Ukraine, MT (HS Codes 1101, 190219, 190230, 190240)
Source: State Fiscal Service of Ukraine