ukraine: towards social inclusion
DESCRIPTION
This National Human Development Report – Ukraine: Towards Social Inclusion – calls attention to the specifics and the roots of social exclusion in Ukraine, identifies socially excluded groups and proposes a range of recommendations in support to the Government for the development of policies and programmes to address the current barriers to social inclusion for all.TRANSCRIPT

National Human Development Report 2011
Ukraine: Towards Social Inclusion
UNDP_magazine_ENG_v10j.indd 1UNDP_magazine_ENG_v10j.indd 1 04.07.2011 17:40:1504.07.2011 17:40:15

This National Human Development Report – Ukraine: Towards Social Inclusion – calls attention to the specifics and the roots of social exclusion in Ukraine, identifies socially excluded groups and proposes a range of recommendations in support to the Government for the development of policies and programmes to address the current barriers to social inclusion for all. The Report investigates the issue of social inclusion from a human development perspective, treating both concepts – social inclusion and human development – as mutually complementary and reinforcing. The key drivers of social exclusion are examined across core domains of people’s life: political, cultural, economic and social. The Report also provides an account of individual experiences of exclusion that demonstrate the magnitude and severity of the challenges vulnerable individuals face. It also introduces a novel methodology to assess the multidimensional aspects of social exclusion to allow for the effec-tive prioritization and targeting of social inclusion policies.
This Report is one of a series of National Reports in the region dedicated to the subject of social inclusion, developed within the framework of the Regional Human Development Report, Beyond Transition – Towards Inclusive Societies.
For over 20 years – since 1990 – UNDP has published annual Global Human Development Reports, examining the develop-ment trends of most UN member states. In addition, more than 600 National Human Development Reports in 140 countries and a number of Regional Human Development Reports have been produced during this time. In 1995, Ukraine was the first post-Soviet country to publish a National Human Development Report. Since then, eight National Reports have been produced, providing a vision of human development trends in Ukraine.
The Report is an independent publication of UNDP in Ukraine, prepared in close cooperation with national and international experts. The views, conclusions and recommendations are those of the authors and compilers of this document and do not necessarily represent the views of UNDP.
The UN Development Programme is the UN’s global development network, advocating for change and connecting countries to knowledge, experience and resources to help people build a better life. We are on the ground in 176 countries, working with them on their own solutions to global and national development challenges. As they develop local capacity, they draw on the people of UNDP and our wide range of partners.
Since 1993, UNDP has been committed to helping Ukraine on its way to better living standards, prosperity and democracy. We are bringing best international practices to help the government, local authorities and communities to overcome human development challenges and implement e- ective policies in Ukraine. In cooperation with our partners, we support initiatives that work to reduce poverty and improve quality and access to basic social services. UNDP helps in further development of democratic governance, reforming state institutions, protecting the environment, empowering women to play a more active role in decision-making and guaranteeing e- ective local development. In its activities, UNDP ensures a balance between policy and advocacy work, capacity building activities and pilot projects.
More information about UNDP-led activities in Ukraine is available at www.undp.org.ua
ISBN 978-966-2153-61-3Copyright © 2011
UNDP_magazine_ENG_v10j.indd 2UNDP_magazine_ENG_v10j.indd 2 04.07.2011 17:40:1704.07.2011 17:40:17

NATIONAL HUMAN DEVELOPMENT REPORT 2011 3
National Human Development Report Preparation Team
The National Human Development Report 2011 – Ukraine: Towards Social Inclusion – is an independent publication commissioned by the United Nations Development Programme in Ukraine. It was prepared in partnership with the M. V. Ptukha Insti-tute for Demography and Social Studies of the National Academy of Sciences of Ukraine, I. F. Kuras Institute of Political and Ethnic Studies of the National Academy of Sciences of Ukraine and the Ukrainian Center for Social Reforms.
Authors:Ella Libanova (Team Leader, Doctor of Economic Sciences, Director of the M. V. Ptukha Institute for Demography and Social Studies of the National Academy of Sciences of Ukraine, Academician of the National Academy of Sciences of Ukraine), Yuriy Levenets (Lead Author, Doctor of Political Sciences, Director of the I. F. Kuras Institute of Political and Ethnic Studies of the National Academy of Sciences of Ukraine, Academician of the National Academy of Sciences of Ukraine),Olena Makarova (Lead Author, Doctor of Economic Sciences, M. V. Ptukha Insti-tute for Demography and Social Studies of the National Academy of Sciences of Ukraine),Victor Kotygorenko (Lead Author, Doctor of Political Sciences, I. F. Kuras Institute of Political and Ethnic Studies of the National Academy of Sciences of Ukraine), Liudmyla Cherenko (PhD, M. V. Ptukha Institute for Demography and Social Studies of the National Academy of Sciences of Ukraine), Oksana Khmelevska (PhD, M. V. Ptukha Institute for Demography and Social Studies of the National Academy of Sciences of Ukraine), Lidia Tkachenko (PhD, M. V. Ptukha Institute for Demography and Social Studies of the National Academy of Sciences of Ukraine) andOlga Balakirieva (PhD, Ukrainian Institute for Sociological Studies).
Experts and Contributors: Anna Gvelesiani, Hanna Herasimenko, Olga Krykun, Svit-lana Nichiporenko, Nataliya Levchuk, Oleksiy Poznyak, Anna Reut, Oleksandr Vasy-lyev and Ludmila Grygoryeva (M. V. Ptukha Institute for Demography and Social Studies of the National Academy of Sciences of Ukraine); Natalia Vlasenko, Inna Osipova, Iryna Kalacheva and Inesa Senik (State Statistics Committee of Ukraine); Kurtmolla Abdulganiyev, Vladimir Gordeiko and Olena Ivanova (UNDP in Ukraine).
Management Team: Natalia Sitnikova, Tatyana Bolila and Yevgenia Kalishenko (UNDP in Ukraine).
Coordinator: Katerina Rybalchenko (UNDP in Ukraine).
International Advisors: Balazs Horvath, Andrey Ivanov, Susanne Milcher, Mihail Peleah and Jaroslav Kling (UNDP Bratislava Regional Centre for Europe and the CIS).
UNDP_magazine_ENG_v10j.indd 3UNDP_magazine_ENG_v10j.indd 3 04.07.2011 17:40:1704.07.2011 17:40:17
NATIONAL HUMAN DEVELOPMENT REPORT PREPARATION TEAM4
Consultant: Arkadii Toritsin. Editor: Roo Griffiths.
Informational Support: Eugene Zelenko (UNDP in Ukraine) and Victoria Andrievska (UN in Ukraine).
Cover Design and Graphics: Yevgen Borshch and Pavel Reznikov (VERSTKA-studio).
The Report is a result of numerous consultations, scientific debate, expert discus-sions and focus-groups with vulnerable groups of population. We thank everyone involved in the process of preparation of the Report and for contributions to discus-sions on issues of social inclusion in Ukraine.
Sincere appreciation is owed to Ricarda Rieger, UNDP Country Coordinator, Elena Panova, UNDP Deputy Country Coordinator and Joanna Kazana-Wisniowiecka, Chief of Division, UNDP Regional Bureau for Europe and CIS. We highly appreciate the support provided by Adeline Gonay, Head of UNDP Sub-office in Crimea in finalizing the Report. We also thank Olivier Adam, UN Resident Coordinator and UNDP Resident Representative for his personal commitment and support to the preparation of the Report.
UNDP_magazine_ENG_v10j.indd 4UNDP_magazine_ENG_v10j.indd 4 04.07.2011 17:40:1704.07.2011 17:40:17

NATIONAL HUMAN DEVELOPMENT REPORT 2011 5
Foreword
Social exclusion has many faces. And it can happen to anyone. It can be: a child with a disability who cannot go to school and socialize because there are no ramps or elevators in the building; a young man with HIV who cannot find friends because of fear and stigma; orphans who lack basic life skills and often do not even know how to cook a simple dish or wash clothes; a woman in her fifties who faces discrimina-tion from an employer because of her age; a single mother whose working day is stretched from dawn to midnight – that leaves her wit h no time for herself. There are countless examples of social exclusion.
This National Human Development Report examines issues of social exclusion and its relation human development in Ukraine. It advocates that everyone should have the opportunity to live a long and healthy life, be educated and be free to use their knowledge and talents to shape their own destiny. High levels of human develop-ment cannot be achieved when individuals and groups are excluded socially and face barriers to their participation in the economic, social, cultural and political life.
The National Report is part of a regional initiative that examines economic exclu-sion, exclusion from social services and exclusion from civic and social networks in Europe and Central Asia. In the same manner as the Regional Human Develop-ment Report “Beyond Transition – Towards Inclusive Societies”, this document considers human development as the ultimate goal, and strategies and interven-tions promoting social inclusion as the means for achieving it.
In addition to providing solid research and analysis based on statistical and quali-tative data, this Report makes it possible to see the perspectives of those who are excluded.
The Government of Ukraine has expressed its commitment to building a modern, stable, open and competitive economy, to reforming the country’s public adminis-tration, to address all its citizens’ needs and raise the nation’s welfare. This commit-ment and its actual realization are critically important to address the exclusion of some individuals and groups from the economic, social, cultural and political life.
The Report provides specific recommendations on how to promote social inclu-sion and human development. We hope it will contribute to public debate and will attract the attention of policy-makers, think-tanks, the private sector and civil society to these important issues for achieving human development.
Ricarda RiegerCountry Director
United Nations Development Programme in Ukraine
UNDP_magazine_ENG_v10j.indd 5UNDP_magazine_ENG_v10j.indd 5 04.07.2011 17:40:1704.07.2011 17:40:17
6
UNDP_magazine_ENG_v10j.indd 6UNDP_magazine_ENG_v10j.indd 6 04.07.2011 17:40:1704.07.2011 17:40:17
NATIONAL HUMAN DEVELOPMENT REPORT 2011 7
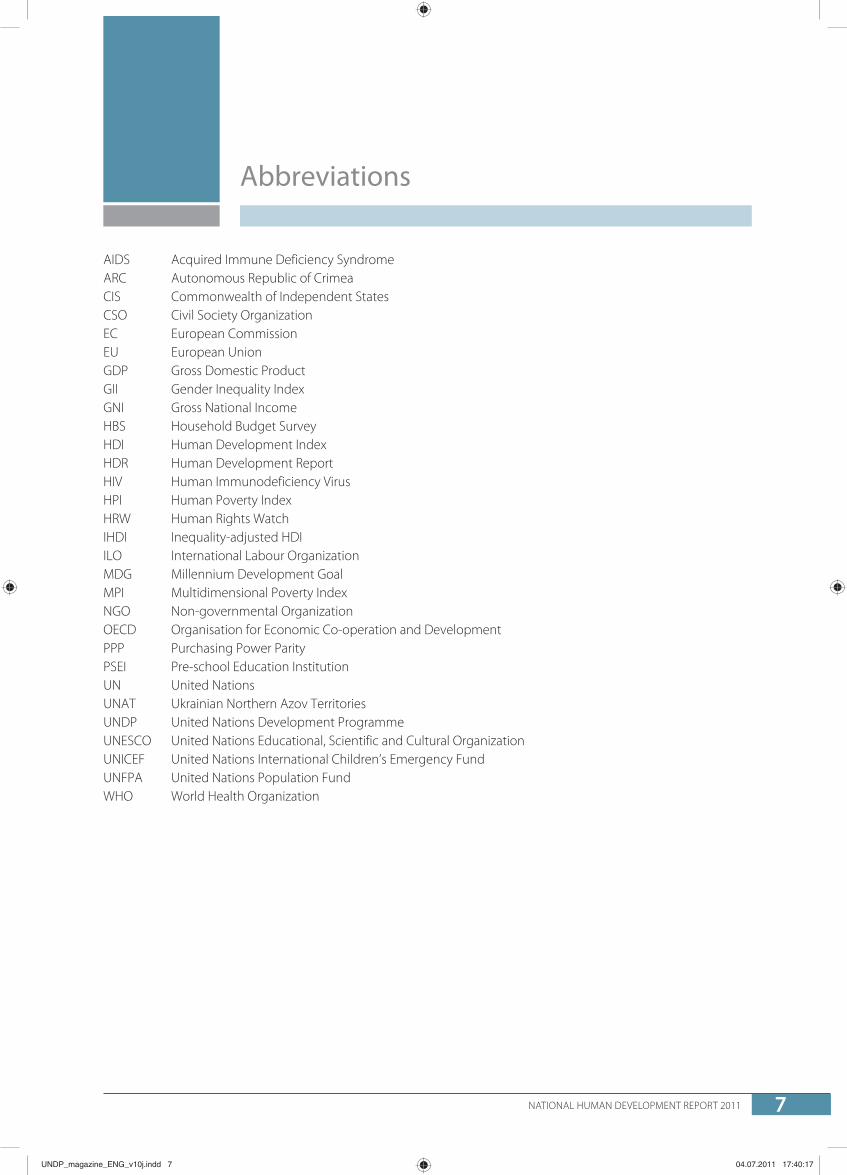
Abbreviations
AIDS Acquired Immune Deficiency SyndromeARC Autonomous Republic of CrimeaCIS Commonwealth of Independent StatesCSO Civil Society Organization EC European CommissionEU European Union GDP Gross Domestic ProductGII Gender Inequality Index GNI Gross National Income HBS Household Budget SurveyHDI Human Development Index HDR Human Development ReportHIV Human Immunodeficiency VirusHPI Human Poverty Index HRW Human Rights WatchIHDI Inequality-adjusted HDI ILO International Labour Organization MDG Millennium Development Goal MPI Multidimensional Poverty Index NGO Non-governmental OrganizationOECD Organisation for Economic Co-operation and DevelopmentPPP Purchasing Power Parity PSEI Pre-school Education InstitutionUN United NationsUNAT Ukrainian Northern Azov Territories UNDP United Nations Development ProgrammeUNESCO United Nations Educational, Scientific and Cultural OrganizationUNICEF United Nations International Children’s Emergency FundUNFPA United Nations Population FundWHO World Health Organization
UNDP_magazine_ENG_v10j.indd 7UNDP_magazine_ENG_v10j.indd 7 04.07.2011 17:40:1704.07.2011 17:40:17

8
UNDP_magazine_ENG_v10j.indd 8UNDP_magazine_ENG_v10j.indd 8 04.07.2011 17:40:1704.07.2011 17:40:17

NATIONAL HUMAN DEVELOPMENT REPORT 2011 9
Table of Contents
Foreword . . . . . . . . . . . . . . . . . . . . . . . . . . . . . . . . . . . . . . . . . . . . . . . . . . . . . . . . . . . . . . . . . . . . . . . . . . . . . . . . 5
Abbreviations . . . . . . . . . . . . . . . . . . . . . . . . . . . . . . . . . . . . . . . . . . . . . . . . . . . . . . . . . . . . . . . . . . . . . . . . . . . . 7
OVERVIEW . . . . . . . . . . . . . . . . . . . . . . . . . . . . . . . . . . . . . . . . . . . . . . . . . . . . . . . . . . . . . . . . . . . . . . . . . . . . . . . . 15
CHAPTER 1Human Development, Social Exclusion and Social Inclusion . . . . . . . . . . . . . . . . . . . . . . . . . . . . . .23
1.1 Introduction . . . . . . . . . . . . . . . . . . . . . . . . . . . . . . . . . . . . . . . . . . . . . . . . . . . . . . . . . . . . . . . . . . . . . . . 23
1.2 Human Development Concept and Measurement . . . . . . . . . . . . . . . . . . . . . . . . . . . . . . . . . . 25
1.3 Defining Social Exclusion . . . . . . . . . . . . . . . . . . . . . . . . . . . . . . . . . . . . . . . . . . . . . . . . . . . . . . . . . . . 27
1.4 Defining Social Inclusion. . . . . . . . . . . . . . . . . . . . . . . . . . . . . . . . . . . . . . . . . . . . . . . . . . . . . . . . . . . . 29
1.5 Relationship between Human Development and Social Exclusion and Social Inclusion . . . . . . . . . . . . . . . . . . . . . . . . . . . . . . . . . . . . . . . . . . . . . . . . . . . . . . . . . . . . . . . . 29
1.6 Social Exclusion in Ukraine . . . . . . . . . . . . . . . . . . . . . . . . . . . . . . . . . . . . . . . . . . . . . . . . . . . . . . . . . . 30
CHAPTER 2Exclusion from Political Life . . . . . . . . . . . . . . . . . . . . . . . . . . . . . . . . . . . . . . . . . . . . . . . . . . . . . . . . . . . . .33
2.1 The Democratic Transition and Participation of the Population in Political Life . . . . . . . 33
2.2 Exclusion from Political Life Faced by Certain Groups of the Population . . . . . . . . . . . . . 39
Conclusions . . . . . . . . . . . . . . . . . . . . . . . . . . . . . . . . . . . . . . . . . . . . . . . . . . . . . . . . . . . . . . . . . . . . . . . . . . . . . 41
CHAPTER 3Exclusion from Cultural Life and Education . . . . . . . . . . . . . . . . . . . . . . . . . . . . . . . . . . . . . . . . . . . . . .43
3.1 Exclusion from Cultural Life . . . . . . . . . . . . . . . . . . . . . . . . . . . . . . . . . . . . . . . . . . . . . . . . . . . . . . . . . 44
3.1 Exclusion from Education . . . . . . . . . . . . . . . . . . . . . . . . . . . . . . . . . . . . . . . . . . . . . . . . . . . . . . . . . . . 48
Conclusions . . . . . . . . . . . . . . . . . . . . . . . . . . . . . . . . . . . . . . . . . . . . . . . . . . . . . . . . . . . . . . . . . . . . . . . . . . . . . 53
CHAPTER 4Exclusion from Economic Life . . . . . . . . . . . . . . . . . . . . . . . . . . . . . . . . . . . . . . . . . . . . . . . . . . . . . . . . . . .55
4.1 Exclusion from the Labour Market . . . . . . . . . . . . . . . . . . . . . . . . . . . . . . . . . . . . . . . . . . . . . . . . . . 57
4.2 Exclusion due to Low Income. . . . . . . . . . . . . . . . . . . . . . . . . . . . . . . . . . . . . . . . . . . . . . . . . . . . . . . 65
4.3 Exclusion due to Poor Housing Conditions . . . . . . . . . . . . . . . . . . . . . . . . . . . . . . . . . . . . . . . . . . 70
Conclusions . . . . . . . . . . . . . . . . . . . . . . . . . . . . . . . . . . . . . . . . . . . . . . . . . . . . . . . . . . . . . . . . . . . . . . . . . . . . . 75
UNDP_magazine_ENG_v10j.indd 9UNDP_magazine_ENG_v10j.indd 9 04.07.2011 17:40:1704.07.2011 17:40:17

TABLE OF CONTENTS10
CHAPTER 5Exclusion from Health Care and Social Protection Systems, Social Networks and Means of Communication . . . . . . . . . . . . . . . . . . . . . . . . . . . . . . . . . . . . . . . . . .77
5.1 Exclusion from the Health Care System . . . . . . . . . . . . . . . . . . . . . . . . . . . . . . . . . . . . . . . . . . . . . 79
5.2 Exclusion from the Social Protection System . . . . . . . . . . . . . . . . . . . . . . . . . . . . . . . . . . . . . . . . 84
5.3 Exclusion from Social Networks . . . . . . . . . . . . . . . . . . . . . . . . . . . . . . . . . . . . . . . . . . . . . . . . . . . . . 90
5.4 Exclusion from Means of Communication. . . . . . . . . . . . . . . . . . . . . . . . . . . . . . . . . . . . . . . . . . . 91
Conclusions . . . . . . . . . . . . . . . . . . . . . . . . . . . . . . . . . . . . . . . . . . . . . . . . . . . . . . . . . . . . . . . . . . . . . . . . . . . . . 93
CHAPTER 6Multidimensional Aspects of Social Exclusion in Ukraine . . . . . . . . . . . . . . . . . . . . . . . . . . . . . . . . .95
6.1 Assessment of Acute Social Exclusion . . . . . . . . . . . . . . . . . . . . . . . . . . . . . . . . . . . . . . . . . . . . . . . 97
6.2 Assessment of Critical Social Exclusion . . . . . . . . . . . . . . . . . . . . . . . . . . . . . . . . . . . . . . . . . . . . . . 99
Conclusions . . . . . . . . . . . . . . . . . . . . . . . . . . . . . . . . . . . . . . . . . . . . . . . . . . . . . . . . . . . . . . . . . . . . . . . . . . . .101
CHAPTER 7Conclusions and Policy Recommendations for the Social Inclusion of All . . . . . . . . . . . . . . . . 103
7.1 Overcoming Exclusion from Political Life . . . . . . . . . . . . . . . . . . . . . . . . . . . . . . . . . . . . . . . . . . .104
7.2 Overcoming Exclusion from Cultural Life and Education . . . . . . . . . . . . . . . . . . . . . . . . . . .104
7.3 Overcoming Exclusion from Economic Life. . . . . . . . . . . . . . . . . . . . . . . . . . . . . . . . . . . . . . . . .105
7.4 Overcoming Exclusion from the Health Care System . . . . . . . . . . . . . . . . . . . . . . . . . . . . . . .107
7.5 Overcoming Exclusion from the Social Protection System . . . . . . . . . . . . . . . . . . . . . . . . . .107
7.6 Overcoming Social Exclusion of Certain Groups of Population. . . . . . . . . . . . . . . . . . . . . .108
REFERENCES. . . . . . . . . . . . . . . . . . . . . . . . . . . . . . . . . . . . . . . . . . . . . . . . . . . . . . . . . . . . . . . . . . . . . . . . . . . . .113
ANNEXES
Calculating the Human Development Indices: Graphic Presentation . . . . . . . . . . . . . . . . . . . .119
Calculating the Human Development Index: Technical Note . . . . . . . . . . . . . . . . . . . . . . . . . . . .121
Share of Excluded Households of Ukraine by Characteristic (%). . . . . . . . . . . . . . . . . . . . . . . . . .123
UNDP_magazine_ENG_v10j.indd 10UNDP_magazine_ENG_v10j.indd 10 04.07.2011 17:40:1704.07.2011 17:40:17
NATIONAL HUMAN DEVELOPMENT REPORT 2011 11
LIST OF FIGURES
3.1 Number of Places in Pre-school Educational Institutions and Number of Children, 1991–2010 (thousands). . . . . . . . . . . . . . . . . . . . . . . . . . . . . . . . . . . . . . . . . . . . . . . . . 49
4.1 Unemployment Levels by Age, 2010 (%) . . . . . . . . . . . . . . . . . . . . . . . . . . . . . . . . . . . . . . . . . . . . 56
4.2 Distribution of the Unemployed by Way of Finding Job, 2010 (%) . . . . . . . . . . . . . . . . . . . 60
4.3 Level of Forced Part-Time Employment, 1995–2010 (%) . . . . . . . . . . . . . . . . . . . . . . . . . . . . . 62
4.4 Distribution of Employed People by Duration of Service at Current Workplace, 2009 (%) . . . . . . . . . . . . . . . . . . . . . . . . . . . . . . . . . . . . . . . . . . . . . . . . . . . . . . . . . . . . . . . . 63
4.5 Representation of Women within Authorities by Category, 2010 (%). . . . . . . . . . . . . . . . . 65
4.6 Gender and Age Pyramid of the Excluded due to Low Income, 2008 (%) . . . . . . . . . . . . 66
4.7 Share of Excluded Households due to Low Income by Number of Children, 2008 (%) . . 67
4.8 Risks of Exclusion of Childless Households due to Low Income against the Average, 2008 (times) . . . . . . . . . . . . . . . . . . . . . . . . . . . . . . . . . . . . . . . . . . . . . . . . . . . 68
4.9 Share of Households Excluded due to Low Income, by Status in the Labour Market, 2008 (%) . . . . . . . . . . . . . . . . . . . . . . . . . . . . . . . . . . . . . . . . . . . . . . . . . . . . . . . . . . . . 68
4.10 Risk of Exclusion due to Low Income against the Average by Presence and Number of People with Higher Education, 2008 (times) . . . . . . . . . . . . . . . 69
4.11 Risks of Excluded due to Low Income against the Average by Educational Level of the Household Head, 2008 (times) . . . . . . . . . . . . . . . . . . . . . . . . . . . . . 69
4.12 Share of Households by Key Characteristics of Exclusion due to Housing Conditions, 2007 (%). . . . . . . . . . . . . . . . . . . . . . . . . . . . . . . . . . . . . . . . . . . . . . . . . . . . . . . 72
4.13 Distribution of Households by Number of Persons per One Room (%) . . . . . . . . . . . . . . . 72
4.14 Share of Households Excluded due to Housing Conditions by Type of Settlement, 2007 (%). . . . . . . . . . . . . . . . . . . . . . . . . . . . . . . . . . . . . . . . . . . . . . . . . . . . . . . . . . . . . . . . 73
5.1 Share of Households Receiving Assistance among Those Entitled, 2009 (%) . . . . . . . . . 86
5.2 Awareness of the Population of Assistance for Children by Household Type, 2008 (%) . . . . . . . . . . . . . . . . . . . . . . . . . . . . . . . . . . . . . . . . . . . . . . . . . . . . . . . . . . . . . . . . . . . . . . 87
5.3 Households without Access to Telephone Services by Settlement Size, 2007 (%) . . . . 92
5.4 Risk of Exclusion Owing to Unavailability of Transport Connections, 2007 (% against Average) . . . . . . . . . . . . . . . . . . . . . . . . . . . . . . . . . . . . . . . . . . . . . . . . . . . . . . . . . . . 92
6.1 Cumulative Share of Households According to Number of Characteristics of Exclusion . . . . . . . . . . . . . . . . . . . . . . . . . . . . . . . . . . . . . . . . . . . . . . . . . . . . . . . . . 96
6.2 Structure of Households with Acute Social Exclusion by Settlement Type, 2007 (%). . 99
6.3 Households with Characteristics of Critical Social Exclusion by Settlement Type, 2007 (%) . . . . . . . . . . . . . . . . . . . . . . . . . . . . . . . . . . . . . . . . . . . . . . . . . . . . . . . . .101
UNDP_magazine_ENG_v10j.indd 11UNDP_magazine_ENG_v10j.indd 11 04.07.2011 17:40:1704.07.2011 17:40:17

TABLE OF CONTENTS12
LIST OF TABLES
1.1 Ukraine’s Human Development Index Trends . . . . . . . . . . . . . . . . . . . . . . . . . . . . . . . . . . . . . . . 26
1.2 Ukraine’s HDI Indicators in 2010 Relative to Selected Countries . . . . . . . . . . . . . . . . . . . . . . 27
2.1 Distribution of Population by Self-assessment of Level of Adaptation to Current Situation (%) . . . . . . . . . . . . . . . . . . . . . . . . . . . . . . . . . . . . . . . . . . . . . . . . . . . . . . . . . . . . . 35
2.2 Distribution of Population by Participation in Voting during Elections (%) . . . . . . . . . . . 35
2.3 Assessment by Population of Activities of Different Political Actors in Protecting Their Interests, 2009 (%) . . . . . . . . . . . . . . . . . . . . . . . . . . . . . . . . . . . . . . . . . . . . . . . . . 36
2.4 Distribution of the Population by Self-assessment of Own Influence on Political Situation (%) . . . . . . . . . . . . . . . . . . . . . . . . . . . . . . . . . . . . . . . . . . . . . . . . . . . . . . . . . . . . 36
2.5 Distribution of Population by Age and Self-assessment of Personal Responsibility for Community Affairs, 2009 (%) . . . . . . . . . . . . . . . . . . . . . . . . . . . . . . . . . . . . . . 37
3.1 Assessment of Major Social Problems of School Environment, 2009 (%) . . . . . . . . . . . . . 51
3.2 Differences in Inaccessibility of Professional Education by Settlement Size, 2007 (%) . . . 52
4.1 Unemployment in Ukraine, 2000–2010 (Average per Year) . . . . . . . . . . . . . . . . . . . . . . . . . . 56
4.2 Levels of Unemployment by Sex and Levels of Education, 2010 (%) . . . . . . . . . . . . . . . . . 58
4.3 Unemployment by Reason, 2000–2010 (%) . . . . . . . . . . . . . . . . . . . . . . . . . . . . . . . . . . . . . . . . . 58
4.4 Households Structure by Types of Settlements, 2008 (%) . . . . . . . . . . . . . . . . . . . . . . . . . . . . 59
4.5 Distribution of Respondents by Evaluation of Personal Career Opportunities in Comparison with Colleagues, 2009 (%) . . . . . . . . . . . . . . . . . . . . . . . . . . . . 65
4.6 Risks of Exclusion due to Low Income of Households of Different Types against the Average, 2008 (times) . . . . . . . . . . . . . . . . . . . . . . . . . . . . . . . . . . . . . . . . . . . . 67
4.7 Risks of Exclusion due to Low Income against the Average by Size of Settlement, 2008 (times) . . . . . . . . . . . . . . . . . . . . . . . . . . . . . . . . . . . . . . . . . . . . . . . . . . . . . . . . . . . . 70
4.8 Risks of Exclusion due to Low Income of Different Types of Households against the Average by Settlement Type, 2008 (times) . . . . . . . . . . . . . . . . . . 70
4.9 Share of Households Suffering from a Shortage of Funds to Maintain Housing, 2007 (%) . . . . . . . . . . . . . . . . . . . . . . . . . . . . . . . . . . . . . . . . . . . . . . . . . . . . . . . . . . . . . . . . . . 74
5.1 Restrictions of Access to Medical Goods and Services Owing to Insufficiency of Funds, 2007 (%) . . . . . . . . . . . . . . . . . . . . . . . . . . . . . . . . . . . . . . . . . . . . . . . . . . . . . 78
5.2 Households with a Member Unable to Access Medical Services as a Share of Total Number of Households with Members in Need of Medical Services, 2010 (%) . . . . . . . . . . . . . . . . . . . . . . . . . . . . . . . . . . . . . . . . . . . . . . . . . . . . . . . . . . 78
5.3 Coverage of Different Types of Households with Social Assistance, 2009 (%) . . . . . . . . . 84
5.4 Matching of a Right for Assistance to Subjective Need for Such Assistance, 2008 (%) . . . . . . . . . . . . . . . . . . . . . . . . . . . . . . . . . . . . . . . . . . . . . . . . . . . . . . . . . . . . . . . . 85
5.5 Reasons why Potential Users Did Not Apply for Assistance, 2009 (%). . . . . . . . . . . . . . . . . 86
5.6 Problems with Purchasing of Goods and Services for Recipients of Assistance (Persons with Disabilities from Childhood and Children with Disabilities), 2009 (%) . . . . . . . . . . . . . . . . . . . . . . . . . . . . . . . . . . . . . . . . . . . . . . . . . . . . . . . . . . 87
5.7 Population Awareness of Types of Targeted Assistance, 2008 (%) . . . . . . . . . . . . . . . . . . . . 88
5.8 Distribution of Population by Spare Time Activity (%) . . . . . . . . . . . . . . . . . . . . . . . . . . . . . . . 91
6.1 Risks of Acute Social Exclusion of Households by Different Demographic Composition, 2007 (% Compared with Average). . . . . . . . . . . . . . . . . . . . . . 97
UNDP_magazine_ENG_v10j.indd 12UNDP_magazine_ENG_v10j.indd 12 04.07.2011 17:40:1704.07.2011 17:40:17

NATIONAL HUMAN DEVELOPMENT REPORT 2011 13
6.2 Households with Characteristics of Acute Social Exclusion by Number of Children and Pensioners, 2007 (%). . . . . . . . . . . . . . . . . . . . . . . . . . . . . . . . . . . . . . . . . . . . . . . . 97
6.3 Risks of Acute Social Exclusion of Households by Presence of Members with Higher Education and Unemployed Members, 2007 (% Compared with Average) . . . . . . . . . . . . . . . . . . . . . . . . . . . . . . . . . . . . . . . . . . . . . . . . . . . . . . . . 98
6.4 Households with Characteristics of Acute Social Exclusion by Presents of Members with Higher Education and Unemployed Members, 2007 (%). . 98
6.5 Risks of Acute Social Exclusion by Settlement Type, 2007 (% Compared with Average) . . . . . . . . . . . . . . . . . . . . . . . . . . . . . . . . . . . . . . . . . . . . . . . . . . . . . . . . 99
6.6 Households with Characteristics of Critical Social Exclusion by Number of Children and Pensioners, 2007 (%). . . . . . . . . . . . . . . . . . . . . . . . . . . . . . . . . . . . . . . 99
6.7 Risks of Critical Social Exclusion of Households by Different Demographic Composition, 2007 (% Compared with Average). . . . . . . . . . . . . . . . . . . . .100
6.8 Risks of Critical Social Exclusion of households by Presence of Members with Higher Education and Unemployed Members, 2007 (% Compared with Average) . . . . . . . . . . . . . . . . . . . . . . . . . . . . . . . . . . . . . . . . . . . . . . . . . . . . . . .100
6.9 Households with Characteristics of Critical Social Exclusion by Presence of Members with Higher Education and Unemployed Members, 2007 (%) . .100
6.10 Risks of Critical Social Exclusion by Settlement Type, 2007 (% Compared with Average) . . . . . . . . . . . . . . . . . . . . . . . . . . . . . . . . . . . . . . . . . . . . . . . . . . . . . . .101
LIST OF BOXES
1.1 Regional Human Development Report, Beyond Transition – Towards Inclusive Societies . . . . . . . . . . . . . . . . . . . . . . . . . . . . . . . . . . . . . . . . . . . . . . . . . . . . . . . . . . . . . . . . . . 24
1.2 Human Development – Classic Definition . . . . . . . . . . . . . . . . . . . . . . . . . . . . . . . . . . . . . . . . . . 25
1.3 “Social Inclusion” and “Human Development” in Ukrainian – Translation of Terms . . . 27
1.4 Human Development and Social Inclusion – Evolving Concepts Centred on People . . . 29
2.1 Exclusion of Homeless People from Public Life . . . . . . . . . . . . . . . . . . . . . . . . . . . . . . . . . . . . . . 40
2.2 Exclusion of Immigrants from Public Life . . . . . . . . . . . . . . . . . . . . . . . . . . . . . . . . . . . . . . . . . . . . 40
3.1 Language Situation in the ARC, the UNAT and Transcarpathia . . . . . . . . . . . . . . . . . . . . . . . 45
3.2 Displays of Prejudice towards Children in the Education System. . . . . . . . . . . . . . . . . . . . . 50
3.3 Exclusion of Street Children from Education. . . . . . . . . . . . . . . . . . . . . . . . . . . . . . . . . . . . . . . . . 51
3.4 Exclusion of Orphans from Education . . . . . . . . . . . . . . . . . . . . . . . . . . . . . . . . . . . . . . . . . . . . . . . 51
3.5 Exclusion from Education of Children with Disabilities. . . . . . . . . . . . . . . . . . . . . . . . . . . . . . . 53
4.1 Unemployment in Small Mono-company Towns: Inhabitant’s View . . . . . . . . . . . . . . . . . 60
4.2 Employment Problems of Orphaned Children. . . . . . . . . . . . . . . . . . . . . . . . . . . . . . . . . . . . . . . 61
4.3 Employment Problems of the Homeless . . . . . . . . . . . . . . . . . . . . . . . . . . . . . . . . . . . . . . . . . . . . 61
4.4 Employment Problems of Immigrants . . . . . . . . . . . . . . . . . . . . . . . . . . . . . . . . . . . . . . . . . . . . . . 61
4.5 Employment Problems of Former Convicts . . . . . . . . . . . . . . . . . . . . . . . . . . . . . . . . . . . . . . . . . 62
4.6 Exclusion due to Income – Evidence from Orphaned Children . . . . . . . . . . . . . . . . . . . . . . 70
4.7 Living Conditions of Street Children. . . . . . . . . . . . . . . . . . . . . . . . . . . . . . . . . . . . . . . . . . . . . . . . . 71
4.8 Living Conditions of Orphaned Children . . . . . . . . . . . . . . . . . . . . . . . . . . . . . . . . . . . . . . . . . . . . 71
UNDP_magazine_ENG_v10j.indd 13UNDP_magazine_ENG_v10j.indd 13 04.07.2011 17:40:1704.07.2011 17:40:17
TABLE OF CONTENTS14
4.9 Living Conditions of the Homeless . . . . . . . . . . . . . . . . . . . . . . . . . . . . . . . . . . . . . . . . . . . . . . . . . . 71
4.10 Living Conditions of Former Convicts . . . . . . . . . . . . . . . . . . . . . . . . . . . . . . . . . . . . . . . . . . . . . . . 71
4.11 Living Conditions of Immigrants . . . . . . . . . . . . . . . . . . . . . . . . . . . . . . . . . . . . . . . . . . . . . . . . . . . . 71
5.1 Street Children – Challenges in Accessing Health Care . . . . . . . . . . . . . . . . . . . . . . . . . . . . . . 80
5.2 Children with Disabilities – Problems in Accessing High-quality Medical Services . . . . 80
5.3 Problems Accessing Medical Services for the Homeless . . . . . . . . . . . . . . . . . . . . . . . . . . . . . 80
5.4 Health Issues of the Homeless . . . . . . . . . . . . . . . . . . . . . . . . . . . . . . . . . . . . . . . . . . . . . . . . . . . . . . 80
5.5 Limited Access to Labour Market for Persons with Disabilities . . . . . . . . . . . . . . . . . . . . . . . 81
5.6 Children with Disabilities – Challenges in Accessing Mainstream Education . . . . . . . . . 81
5.7 Persons with Disabilities – Inaccessibility of Infrastructure . . . . . . . . . . . . . . . . . . . . . . . . . . . 82
5.8 Exclusion Faced by People Living with HIV in the Area of Medical Services. . . . . . . . . . . 83
5.9 The Homeless – Absence of Elementary Amenities and Necessary Information . . . . . . 88
5.10 Сhildren of Ukrainian Labour Migrants – Consequences of Lack of Parent Control . . . 89
5.11 Lack of Tolerance in Society towards Former Convicts. . . . . . . . . . . . . . . . . . . . . . . . . . . . . . . 91
6.1 Methodology of the Data File Composition . . . . . . . . . . . . . . . . . . . . . . . . . . . . . . . . . . . . . . . . . 97
UNDP_magazine_ENG_v10j.indd 14UNDP_magazine_ENG_v10j.indd 14 04.07.2011 17:40:1704.07.2011 17:40:17

NATIONAL HUMAN DEVELOPMENT REPORT 2011 15
Overview
This National Human Development Report, Ukraine: Towards Social Inclu-sion is a part of the Regional Human Development Report, Beyond Transi-tion – Towards Inclusive Societies. It calls attention to the specifics and the roots of social exclusion in Ukraine, identifies socially excluded groups and proposes a range of recommendations in support to the Government for the develop-ment of policies and programmes to address the current barriers to social inclusion for all. The Report investi-gates the issue of social inclusion from a human development perspective, treating both concepts – social inclu-sion and human development – as mutually complementary and rein-forcing. The key drivers of social exclu-sion are examined across core domains of people’s life: political, cultural, economic and social. The Report also provides an account of individual expe-riences of exclusion that demonstrate the magnitude and severity of the chal-lenges vulnerable individuals face. It also introduces a novel methodology to assess the multidimensional aspects of social exclusion to allow for the effec-tive prioritization and targeting of social inclusion policies. Chapter 1 deals with the theoretical foundations of human development, social exclusion and social inclusion, and explains linkages between these para-
digms. It also explains the main focus of the National Report and provides link-ages to the Regional Human Develop-ment Report. Chapter 2 analyses issues related to the participation of both wider and separate groups of the popu-lation in the political life and opportuni-ties to influence government decisions at national and local levels. Chapter 3 analyses access of representatives of different social, ethnic, religious and other groups to cultural values; issues of language policy and satisfaction of religious needs; and issues of access to education at different levels and by different groups. Chapter 4 discusses issues of exclusion from economic life, in particular: from the labour market, due to low income, and due to poor housing conditions. Chapter 5 examines exclusion from social life and unequal access by the population to social protection and health care systems. It also discusses access to means of communication and transportation. Chapter 6 provides an analy sis of the multidimensional aspects of social exclusion in Ukraine, based on an integ ral system of indicators. Chapter 7 provides general recommendations to overcome barriers to social inclusion in Ukrainian society and specific sugges-tions in relation to promoting the inclu-sion of certain vulnerable groups of the population.
Social exclusion covers a wide range of social and economic processes which lead to the isolation of separate people or groups of the population from social links, practices and life styles that are common to society. As a result of social exclusion, some groups of the population do not have the opportunity to fully take advantage of their rights to access education and health care services; to be employed and enjoy adequate living standards; and to satisfy their cultural, religious and social needs. Social exclusion is associated not only with the reproduction of social inequality but also with the disappearance of social links and with identity crisis, which may affect a significant share of the population.
UNDP_magazine_ENG_v10j.indd 15UNDP_magazine_ENG_v10j.indd 15 04.07.2011 17:40:1704.07.2011 17:40:17

OVERVIEW16
Social Exclusion, Social Inclusion and Human Development
UNDP’s first Human Development Report, released in 1990, had a profound impact on how people view social development: the progress of humankind is no longer mea sured by national incomes alone. The Human Development Report 2010, The Real Wealth of Nations: Pathways to Human Develop ment, reconfirmed the importance of the human development paradigm and introduced a revised definition of human development, seen as, “the expansion of people’s freedoms to live long, healthy and creative lives; to advance other goals they have reason to value; and to engage actively in shaping development equitably and sustainably on a shared planet. People are both the beneficia-ries and the drivers of human development, as individuals and in groups”.1
This National Human Development Report introduces the concept of social exclusion, which is relatively new to Ukraine, defined as a process whereby certain indivi-duals are pushed to the edge of society and prevented from participating fully by virtue of poverty; lack of basic competencies and lifelong learning chances; or discrimination. This distances them from job, income and education opportunities as well as social and community networks and activities. They have little access to power and decision-making bodies and thus are unable to partici-pate in the decisions that affect their day-to-day lives.
The Report also introduces the concept of social inclusion as a process which ensures that those at risk of poverty and social exclu-sion gain the opportunities and resources necessary to participate fully in the economic, social and cultural life and to enjoy a standard of living and well-being that is considered normal in the society in which they live.
Social exclusion and inclusion and human development concepts complement each other. High levels of human development cannot be achieved when some groups and individuals are excluded socially and face barriers to their participation in economic, social, cultural and political life. Restrictions in any of these areas are detrimental to freedom of choice, the core of human development. As a result, achieving human development in its entirety means tackling these barriers and facilitating deliberate inclusive processes that expand people’s real freedoms and create
1 UNDP (2010a).
an inclusive society, in which diversities are a source of strength and not of weakness. Consequently, social inclusion is a means to achieve human development.
Exclusion from Political Life
An inclusive society means that all citizens can have their voices heard. Effective political inclusion is ensured by means of complex mechanisms, processes and practices, through which persons and groups articulate their interests and exercise their rights and obligations.
As a result of complex and inter-related transition processes, an environment that promotes the full participation and involve-ment of the population, and especially vulnerable groups, in political processes is not fully established in Ukraine.
The coexistence of new democratic insti-tutions and elements of old Soviet insti-tutions has resulted in slow progress to achieve adequate levels of state transpa-rency and accountability, depoliticising the public administration and adherence to rule of law. The political and economic spheres are still not independent from each other; this means that powerful vested interes ts can capture political processes and advance their narrow economic interests, which affect democratic reforms negatively.
A share of the population appears to be discontent with the effectiveness and quality of current democratic political insti-tutions and processes, thus considers itself excluded from political life. Existing political institutions and practices poorly empower the average Ukrainian to participate in polit-ical processes thus exclude citizens from the process of elaborating socially relevant decisions.
Mass media are not always free, which may limit access to objective and impartial information. There is no spread, across the country, of strong civic organizations that can represent broad societal interests, and espe-cially vulnerable groups, in the democratic process.
Certain groups of the population face barriers to political participation. Low incomes, dependence on state support and paternalistic views of the state tend to limit the political inclusion of the elderly, whose sometimes miserable living condi-tions determine their adherence to “economic voting”, primarily during local
UNDP_magazine_ENG_v10j.indd 16UNDP_magazine_ENG_v10j.indd 16 04.07.2011 17:40:1704.07.2011 17:40:17
NATIONAL HUMAN DEVELOPMENT REPORT 2011 17
elections. Youth are apathetic and distrustful of politi cal processes which exclude them from meaning ful involvement. Old gender stereotypes and weak support to gender equality create barriers to the political inclusion of women: low representation of women in high-level public administration management positions is inconsistent with their high levels of education and employ-ment. Traditional views and limited oppor-tunities for political inclusion beyond elec-tions constrain the rural population. Finally, deep-seated public stereotypes and limited mechanisms to facilitate the participation of marginal groups (homeless, illegal immi-grants, former convicts, others) in the life of society impede their political inclusion.
Exclusion from Cultural Life and Education
Large-scale changes in the structure and nature of individuals’ cultural activities and leisure have occurred in Ukraine during the years since independence. Cultural prac-tices that were very common some time ago, partly because they were heavily subsi-dized, have lost their popularity. At the same time, new elements of culture, such as show-business, pop music industry and entertain-ment industry, are expanding. These new cultural elements, especially when they take extreme forms, may contradict traditional society’s cultural values and createa threat to social harmony.
Differences in cultural practices in the capital, oblast centres and the periphery (small towns and villages) create drivers of exclusion. Residents of cities can access a wide range of resources, such as television, internet, print publications, theatres, cinemas, sport clubs and tourism services, which are often unavailable in rural settlements. Rural inhabitants – one-third of the Ukrainian population – can usually access three or four television channels, wired radio and a local newspaper with limited scope.
Language is one of the most acute factors of cultural exclusion in Ukraine. This issue plays an important role in such areas as the Autono mous Republic of Crimea, the Ukrainian Northern Azov Territories and Transcarpathia, which have concentrated settlements of ethnic minorities. The popu-lation of some of the regions feels that the use of Russian language is spreading to the detriment of Ukrainian or other minorities’ languages. This increases risks of reduced competencies in using native languages and,
at the same time, results in a certain level of cultural exclusion of those groups. Such situa-tion may form the basis for fewer opportuni-ties for inter-ethnic contacts, limited access to cultural resources and inter-ethnic tensions.
Accessibility of quality education is criti-cally important to social inclusion. Overall, the population of Ukraine has access to general secondary and professional, including higher, education. Access to all levels of education is generally not gender based, and there is even some imbalance in favour of women in higher education institutions.
The number of children in pre-school education establishments that not only provide child care services but also prepare for primary school entry has decreased, mainly because of a scaling-down of the pre-school network during the transition period, especially in rural areas. Non-attendanceat a pre-school institution and attendance at an overcrowded pre-school institution both limit a child’s important starting opportuni-ties and may create conditions for exclusion in the future.
The number of secondary school institu-tions has also reduced due to demographic changes in rural areas and cities throughout the country. The state programme for the transportation of pupils to their place of education is, so far, poorly financed. The quality of education is affected by a lack of suitably qualified teachers and of mate-rials and equipment. Such conditions create exclusion of certain groups of children from education, especially those living in rural areas, and ultimately lead to future social and economic exclusion.
The vocational education system in Ukraine is seen as not fully adequate to ensure youth integration into the labour market. Curricula are often not aligned with the needs of potential employers and the changing market; job opportunities for graduates of vocational education institu-tions are therefore limited.
Certain groups, such as the Roma chil-dren, are exposed disproportionately to exclusion from education. Their unsystematic school attendance, generally due to the lack of parents’ awareness of the importance of education for the future life of their children, leads to poor educational outcomes and smaller inclusion prospects.
Children with disabilities also face numerous barriers to inclusion in the educa-tion system: only half of the children and teenagers with physical or mental disabilities attend school. The main factors impeding
UNDP_magazine_ENG_v10j.indd 17UNDP_magazine_ENG_v10j.indd 17 04.07.2011 17:40:1704.07.2011 17:40:17
OVERVIEW18
their integration into mainstream schooling are, primarily, schools’ poor physical accessi-bility and a lack of methodologies adapted to their special needs.
Exclusion from Economic Life
Exclusion from economic life leads to low standards of living and limits opportuni-ties in other areas – namely, accessing high-quality education, receiving adequate health care services and participating in the cultural and social life of society. The key drivers of economic exclusion are: unemployment or low status in the labour market, and low incomes which prevents access to resources, assets and services.
The highest risks of labour market exclu-sion fall on the unemployed, especially the long-term unemployed; on a few categories of the economically inactive population, in particular people who are no longer searching for a job, having lost hope of finding one; and on the employed with non-standard labour contract conditions or a specific nature of work which makes them socially vulnerable.
Youth is one of the most vulnerable groups of population on the labour market. They constitute almost 26 percent of the total number of the unemployed. The low competitiveness on the labour market of this group is conditioned by an absence or insuffi-cient level of working experience. The general unemployment level of the rural population may appear as significantly lower than that in urban areas, as they are, somehow, ensured of employment on agricultural subsidiary plots. Unemployed living in small mono-company towns face particularly high risks of economic exclusion. Economic exclusion may also affect women of active child-bearing age and women of pre-retirement age.
Levels of exclusion from the labour market depend significantly on the indivi-dual’s educational level. The lowest unem-ployment levels are observed among people with complete higher education; the highest unemployment levels are among those with general secondary education. Employment of family members is a pre-condition for social inclusion. The risk of exclusion for households with all members working is 34 percent; that for households with unemployed members is 130 percent of the average. Households with children are the more vulnerable to the risk of social exclusion owing to the presence of long-term unemployed members.
Insufficient income to meet funda-mental needs is traditionally considered as
the main manifestation of economic exclu-sion. If a household’s income per adult is lower than the nationally defined poverty line, that household is considered economi-cally excluded. This was the case, in 2009, for 26.4 percent of the Ukrainian households.This economic exclusion negatively impacts most children below 16 years and people aged 80 and above in a given household. In general, families with minor children face higher risks of economic exclusion because of poverty.
The availability and proper quality of housing which are the basic needs and fundamental human right of all depend on the levels of incomes and purchasing power of households, and is a precondition of social inclusion. More than half the country’s households are excluded in terms of decent housing conditions; around one-third of these are poor. The risks of exclusion increase when a living area is inadequate, when there are not enough separate rooms for all house-hold members, when there is an absence of basic conveniences and when the finan-cial means to maintain housing and pay for communal services is lacking.
Exclusion from Health Care and Social Protection Systems, Social Networks and Means of Communication
An individual’s health is one of the basic human rights necessary for the realization of other rights and, therefore, his or her social inclusion. To ensure that this right is observed, it is important to provide access to health care services for everyone without discrimination.
Although the Constitution of Ukraine guaran-tees the right to receive free of charge health care services, access to health care is de facto restricted by level of income, social status and place of residence. Low income individuals usually cannot afford paying fees to doctors for the provision of better quality services, stay in hospitals and purchase of medicines.
One of the barriers in access to health care services is the long distance to health care institutions. Those who do not access medical assistance when they need it or cannot buy medical goods or medications generally claim that this is because of a lack of medical institutions or pharmacies close to their homes. A shortage of mobile health care, qualified medical personnel, good roads and ambulances is a critical issue, particularly in rural areas.
Poor health and chronic illnesses affect people’s opportunities to enjoy fully their life.
UNDP_magazine_ENG_v10j.indd 18UNDP_magazine_ENG_v10j.indd 18 04.07.2011 17:40:1804.07.2011 17:40:18
NATIONAL HUMAN DEVELOPMENT REPORT 2011 19
Most of those who were sick claim negative consequences on their lives: for instance, 15 percent state that illnesses adversely impact on their everyday working capacity and around 30 percent feel adverse effects on vital activities, e.g. their capacity to carry out physical activities, to visit cultural establish-ments and to live an active life.
Levels of exclusion from the social protec-tion system depend on the specifics of the state’s social programmes and their targeting. Child birth benefits and child benefits until children are three years old are accessed by almost all eligible families. At the same time, only half of poor people benefit from the programme of assistance to low-income families. Moreover, each third household that is not eligible for state social assistance is actually in need of it. A low level of awareness among the population of available social assistance programmes, benefits and support is a barrier to inclusion in the social protec-tion system.
Although persons with disabilities usually receive monetary assistance, they still face problems with purchasing medi-cations, receiving rehabilitation services and accessing special treatment. Over 80 percent of the homeless do not receive social assistan ce, as, often, they do not have iden-tification documents. The majority of labour migrants are excluded from any social protec-tion system, since they live abroad, most of the time illegally. Children of labour migrants suffer from a lack of parental care and support, which may lead to behaviours inconsistent with society’s norms and to their ending up homeless. The social exclusion risks for elderly people are linked to the conditions deter-mining pensions, as well as the existence of family support. Elderly men or women living alone feel isolation as their needs cannot be satisfied in relation to communication, leisure and participation in the life of society.
The exclusion of individuals from their social environment can be both the result of prejudice and antagonism towards them and an absence of means of communication. Around 9 percent of households in Ukraine are socially excluded as a result of poor regular transport connections.
Multidimensional Aspects of Social Exclusion in Ukraine
Traditionally, researchers and policy-makers rely on economic indicators to measure social exclusion. However, both the processes and the outcomes of social exclu-
sion are complex and inter-linked. Indicators reflecting non-economic aspects of exclusion must, therefore, also be taken into considera-tion to obtain a more comprehensive picture of the scale and depth of the problem.
In this context, a total of 18 selected characteristics have been used to measure social exclusion in Ukraine. Their analysis allowed for an identification of acute exclu-sion, relating to households with five or more exclusion characteristics, and of critical exclu-sion, relating to households with seven or more exclusion characteristics.
Acute social exclusion is experienced by 37.7 percent of Ukrainian households. Extremely high risks of social exclusion (2.2 times higher compared with the average and 2.5 times higher compared with fami-lies consisting solely of working-age people) exist for families with many children and pensioners. Higher education is the most important factor determining social inclu-sion. In particular, the presence of at least one adult with higher education in a household decreases the risk of acute social exclusion by 2.7 times (more than twice compared to the average).
Critical exclusion is experienced by 16.9 percent of households. The risk of critical exclu-sion is very high for families with child ren: 2.7 times higher than the average in the country and 2.8 times higher than for families without children. The presence of at least one unem-ployed person in a household results in a 1.7 times higher risk of critical exclusion than for the average and a twice higher risk than for families without unemployed people. Critical exclusion is much more present in rural areas, especially when compared with large cities. Exclusion risks for rural inhabitants exceed the corresponding risks for inhabitants of large cities by 20 percent.
Policy Recommendations for Social Inclusion for All
The National Human Development Report encourages all Ukrainians to under-stand the needs of vulnerable groups and to contribute, each in their own way, to the goal of achieving social inclusion for all.
Social exclusion can affect any member of society; it is not a static phenomenon. Everyone is at risk of being left out of society. Vulnerable groups are indeed over-represented among the socially excluded, but not everyone from these groups is excluded, and not all the excluded are from these groups.
UNDP_magazine_ENG_v10j.indd 19UNDP_magazine_ENG_v10j.indd 19 04.07.2011 17:40:1804.07.2011 17:40:18

OVERVIEW20
Social inclusion policies should include the following components:• Measures to foster general economic and
political reforms aimed at comprehensive improvement of the social and economic situation, sustainable economic growth, provision of all groups with access to basic social services and economic resources, etc.;
• Targeted measures aimed at eliminating barriers to inclusion that specific groups face.There is a need in Ukraine to adopt legis-
lation on social exclusion, which would set forth a legal definition of “social inclusion” and “social exclusion”, taking into account international standards and national specifics. In addition to policies and interventions on social inclusion, the state should actively promote societal diversity and an overall tolerant environment to create a culture of acceptance of multidimensional nature of the modern society.
Overcoming exclusion from political life. Enhancing people’s trust in political institutions is a key task that will define the success of any inclusion policy and become a corners tone of a comprehensive social inclu-sion system.
To facilitate public participation in decision-making and encourage more active involvement in the public life, it is impor-tant to hold awareness-raising interventions to familiarize the population with opportu-nities to be involved in and to monitor the activities of the authorities; to popularize legal knowled ge and rules of behaviour in society; and to ease the registration of non-governmental organization.
It is necessary, in particular, to put in place initiatives which will encourage youth, women and ethnic minorities to participate in political life and elections. The inclusion of immigrants in the Ukrainian society should be another important component of social policy.
Overcoming exclusion from cultural life and education. Preservation and develop-ment of national identity in all spheres of public life is a significant factor in over-coming cultural exclusion. One of the impor-tant priorities should include promotion of an atmosphere of kindness, respect for values, tolerance and cooperation with those with a different ethnic, cultural, language or reli-gious identity.
It is recommended in particular to ensure the comprehensive development and func-tioning of the official Ukrainian language and strengthen its role as a factor of social
inclusion for citizens and groups of citizens of different nationalities, as well as to ensure that the Russian language and other ethnic minorities’ languages have their place in the educational system and can be used freely by their native speakers.
Overcoming exclusion in the field of education can be achieved through equal access of the population to high-quality educational services to improve competitive-ness in the labour market. It is recommended in particular to equip all educational institu-tions with modern computers and internet connections; to develop remedial educational programmes and mechanisms to bring chil-dren and young people who have ended up outside the education system back to school; to develop a system of targeted training of pedagogical personnel for school and pre-school educational institutions in rural areas and small and mono-company towns; and to establish inclusive education for children and young people with special needs. Over-coming inter-settlement differen ces in rela-tion to the quality of education should be a main priority of the state policy of social inclusion.
Overcoming exclusion from economic life. Increasing the motivation of the popu-lation to engage in economic activities, overcoming unemployment and creating opportunities for decent jobs should be Government priorities. Specific policy measures should be developed to improve the existing legal framework; to elimi-nate any provisions that create grounds for discrimination in access to work or in status of employment; and to restruc-ture employment to enhance the role of highly technological production and knowledge-intensive services. It is advi-sable to improve the labour market support services and enhance access to informa-tional resources and communications on the labour market situation.
The focus of policies should not be only on the alleviation of absolute poverty but also on curtailing inequality and the relative poverty of the population. Specific policy actions relate to coordinating the reproduc-tion and stimulating functions of all types of social transfers. Economic stimuli, instead of administrative enforcement, should be utilized to ensure that employers hire young graduates without professional experience as well as other non-competitive individuals. It is also recommended to introduce a progres-sive taxation scale for personal income as a means to decrease social inequality.
UNDP_magazine_ENG_v10j.indd 20UNDP_magazine_ENG_v10j.indd 20 04.07.2011 17:40:1804.07.2011 17:40:18

NATIONAL HUMAN DEVELOPMENT REPORT 2011 21
The affordability of decent housing conditions is crucial to ensure full partici-pation in the life of society. Policies in this area should aim to enhance the availability of housing and decrease the burden of the cost of housing and utility services on the poor’s family budget. It is recommended in particular to develop a social and temporary housing system and to improve access to mortgages (particularly for young families).
Overcoming exclusion from the health care system. Policy to eliminate barriers to inclusion in health care should aim to ensure equal access of the population to adequate medical services regardless of place of resi-dence, income level and other aspects. To achieve this, it is necessary to conduct a struc-tural reorganization of the health care system based on the principles of primary care, and to improve its financing.
The budget funding of the health care system should be maintained within the minimum standards set by legislation and guaranteed by the state. Particular attention in implementing health care reforms should be paid to rural population. Inefficient rural hospitals should be reorganized into centres of primary care.
Overcoming exclusion from the social protection system. The social support system should be modernized and the targeting of the main types of social assistance should be increased. This would allow for an increased coverage of the poor population with rele-vant services, increased amounts of bene-fits and improved social equity in terms of distribution of state funds allocated to social support.
To improve the effectiveness of the social protection system, there is a need to estab-lish a single database of recipients of all types of social assistance, as well as to integrate all social providers into a single network, aimed at the complex provision of social assistance to those in need. To improve the quality of social services, it is important to ensure the development of a dynamic market of social services, de-institutionalize the system of boarding school-type institutions and develop community-based forms of service provision, as well as introduce social contracting and quality standards of social services.
Overcoming exclusion of certain groups of the population. Although the sectoral recommendations provided above address some barriers to social inclusion, it is neces-sary to develop and implement policy and programme interventions addressing the
specific needs of excluded groups and those groups at risk of social exclusion.
Orphaned children. It is recommended to provide children and teenagers deprived of parental care with similar opportunities (including their enrolment in mainstream schools) to obtain high-quality education and labour skills as children living with parents. It is important to ensure, across all boarding school-type institutions, the develop ment of a quality secondary and professional educa-tion system which will trigger genuine labour market opportunities for this target group. In addition, particular attention should be paid to the creation of different family-based models of upbringing: family groups within the orphanage, foster parent models, guardian families.
Families with many children. In order to promote the inclusion of families with many children, it is important to ensure the improve-ment of their financial situation, which entails increasing targeted assistance to such fami-lies taking into account their income level and assisting in the employment of members of these families.
Persons with disabilities. It is recom-mended to improve the provision of a suffi-cient number of rehabilitation services and to create an accessible environment for persons with disabilities through the adap-tation of buildings and roads and residential and public buildings. Children with disabili-ties should be provided with the opportunity to obtain education in mainstream schools with their peers, if possible. To improve the inclusion of people with disabilities in the labour market, it is recommended to enable the adaptation of workplaces to their needs, to develop flexible forms of employment and to provide free access to a general curriculum for orientation and vocational training.
Immigrants. The state immigration policy should aim at promoting harmony among different groups of the population and inte-gration of immigrant groups into Ukrainian society, as well as at convincing the public that it is necessary to implement active immi-gration policy measures.
Children of labour migrants. To address the barriers to social inclusion of children of labour migrants, it is necessary to better focus the attention of social services on these fami-lies. Social service providers should identify these children and their parents or guardians; assess the correctness of documents available on custody and care; find out whether their basic needs are satisfied and what conditions for education, development and leisure are in
UNDP_magazine_ENG_v10j.indd 21UNDP_magazine_ENG_v10j.indd 21 04.07.2011 17:40:1804.07.2011 17:40:18

OVERVIEW22
place; and, if needed, provide various forms of social support.
The Roma population should be included by improving their living conditions and preventing conflicts between them and representatives of other ethnic groups. The state should rely on Roma “elders” who are interested in positive social transformations in their ethnic group and implement a series of measures to improve housing conditions and access to education and to labour market for the Roma.
People living with HIV/AIDS. Social inclusion policy for people living with HIV/AIDS should entail actions aimed at overcoming HIV-related stigmatization and reducing discrimi-nation, along with legal protection for those affected by HIV. It is necessary to address factors such as low awareness, fear, false stereotypes and prejudice towards people with HIV/AIDS by means of educational and general informational initiatives. National HIV/AIDS programmes should be obliged to deliver the full range of prevention, treat-ment, care and support services and be provided with an adequate budget to do so.
Homeless people. State and non-state service providers supporting the homeless should not be limited to the provision of services such as night shelters, nutrition and medical assistance but should also include interventions to help reintegrate homeless people into the society.
The barriers and challenges to social inclusion facing vulnerable groups are complex and multidimensional. The recom-mended interventions are aimed at ensuring the social inclusion of vulnerable individ-uals and groups of the population into the political, cultural, social and economic life of the Ukrainian society. The process of elabora tion of policies and implementation of programmes of social inclusion should be supported by consultations with the representatives of these groups. The recom-mended actions should be implemented by the Government together with local govern-ments, civil society and the private sector. The effectiveness of social inclusion policy and measures can only be ensured through a close collaboration of all members of the Ukrainian society.
UNDP_magazine_ENG_v10j.indd 22UNDP_magazine_ENG_v10j.indd 22 04.07.2011 17:40:1804.07.2011 17:40:18
NATIONAL HUMAN DEVELOPMENT REPORT 2011 23
C H A P T E R
Human Development, Social Exclusion and Social Inclusion1
Social exclusion covers a wide range of social and economic processes which lead to the isolation of separate people or groups of the population from social links, practices and lifestyles. Some groups in society do not have the opportunity to utilize in full their rights to access education and health care services; to be employed and enjoy adequate living standards; and to satisfy their cultural, religious and social needs. Social exclusion is associated not only with the reproduction of social inequality but also with the closing-down of social links and with identity crisis, which may affect a significant share of the population.
Introduction
This National Human Development Report, Ukraine: Towards Social Inclusion is a part of the Regional Human Development Report, Beyond Transition – Towards Inclusive Societies. It calls attention to the specifics and the roots of social exclusion in Ukraine, iden-tifies socially excluded groups and proposes a range of recommendations in support to the Government for the deve lopment of poli-cies and programmes to address the barriers to social inclusion for all. The Report inves-tigates the issue of social inclusion from a human development perspective, treating both concepts – social inclusion and human development – as mutually complementary and reinforcing.
The chapters of the National Report discuss the drivers of social exclusion across core domains of individuals’ life: political, cultural, economic and social. Sectoral analy sis is conducted by examining specific vulnerable groups and their experiences. In particular, the Report addresses the following questions: What are the forms of exclu-sions? What are the drivers and outcomes of exclusion? Which groups are particu-larly affected by exclusion? What exclusion trends are observed? Which new policies and programmes should be put in place to promote social inclusion of all groups of population?
The account of individual experiences of exclusion demonstrates the magnitude and severity of challenges vulnerable indi-viduals face. As the dimensions of exclu-sion exami ned are mutually reinforcing, the Report introduces a novel methodo-
1.1 logy to assess multidimensional aspects of social exclusion which could be used in the process of develop ment of policies and programmes of social inclusion to allow for the prioritization and better targeting of interventions. The Report also provides general recommendations on overcoming barriers to social inclusion in the Ukrainian society and specific suggestions in relation to promoting the inclusion of certain vulne-rable groups of the population.
The National Human Development Report promotes consensus-building in Ukraine, which should involve a range of stakeholders, including vulnerable groups, in designing and implementing programmes on social inclusion. Without the “buy-in” of a large segment of society, no social inclusion programmes will ensure sustainable results. As social inclusion is the responsibility of the whole of society, approaches to engage civil society organizations and the private sector in the effort are suggested.
The Report utilizes multiple sources for its analysis, including the Social Exclusion Survey in the region of Europe and Central Asia, supported by United Nations Devel-opment Programme in 2009, focus group discussions with the number of vulner-able groups, data from the State Statis-tics Committee of Ukraine (such as House-hold Budget Survey (HBS), etc.) and other secondary sources.
The Social Exclusion Survey (2009) was conducted to provide data on the magnitude and determinants of social exclusion, defining social exclusion as resulting from inequalities in terms of access to economic resources; education and employment opportuni-ties; access to and quality of social services;
UNDP_magazine_ENG_v10j.indd 23UNDP_magazine_ENG_v10j.indd 23 04.07.2011 17:40:1804.07.2011 17:40:18

CHAPTER 1. HUMAN DEVELOPMENT, SOCIAL EXCLUSION AND SOCIAL INCLUSION 24
Regional Human Development Report, Beyond Transition – Towards Inclusive Societies
The Regional Human Development Report articulates a single conceptual framework for social inclusion and human development. It treats human development as the ultimate goal and social inclusion as the means to get there.Analytical approach. Defining the excluded is a major challenge both of analyses of social exclusion and of social inclusion policies. The Report distances itself from the traditional group-based approach to assume that each individual has a number of characteristics that can put him or her at risk of social exclusion. Not all individual risks will necessarily materialize as actual social exclusion. Whether or not social exclusion manifests depends on the interaction of risks with a set of drivers which can be institutions and norms, policies or behaviours. Individual risks are also influenced by the local context (the parameters of the local reality shaping individuals’ everyday lives). These include characteristics of the local economy (such as diversity of employment opportunities), history of local conflict, environmental legacy, state of repair of basic infrastructure or distance to the capital or regional centres.The Report develops a new indicator, the Multidimensional Social Exclusion Index, which is experimental in nature and can be adapted to specific country circumstances. This includes 24 indicators reflecting deprivations in three dimensions: economic exclusion; exclusion from social services; and civic exclusion. These should not be understood as “fixed” but rather as a point of departure in national discourses on measuring social exclusion, from which nationally relevant indicators should be selected in an inclusive and participatory way.
Findings More than one-third of the population of the region is socially excluded. The report estimates that, on average, 35 percent of the population in the region experiences social exclusion, ranging from 12 percent in the Former Yugoslav Republic of Macedonia to 72 percent in Tajikistan.Social exclusion is not determined by economic deprivation alone. On the contrary, the three dimensions of social exclusion all make a broadly similar contribution, and each plays a specific, necessary and complementary role in bringing about exclusion as an outcome. As such, in order to tackle social exclusion, all three dimensions of exclusion must be addressed.The share of socially excluded people varies from country to country but the depth of their social exclusion is similar. Despite the wide range of population sizes, GDPs and levels of human development, the intensity of social exclusion is remarkably similar across the six countries. Being socially excluded in the Former Yugoslav Republic of Macedonia or Kazakhstan means facing generally the same number of deprivations. Children, youth, the elderly, the unemployed, those with poor education and people living in rural areas face a larger than average magnitude of social exclusion. Social exclusion is highest for elderly people in all countries, at almost twice the national average, as in Ukraine (43 percent) and the Former Yugoslav Republic of Macedonia (22 percent). On average, 42 percent of children and 35 percent of youth (aged 15–29) in the six countries live in households that experience social exclusion. The share of socially excluded children is particularly high in Tajikistan (73 percent) and the Republic of Moldova (47 percent).Social exclusion outcomes are linked to drivers and local context. The report links the outcome of social exclusion to individual risks, drivers and local context, demonstrating that values and behaviour matter. For example, persons with disabilities constitute an important group at risk of social exclusion. The data allow a correlation of exclusion outcomes for persons with disabilities with the level of the local population’s tolerance of diversity. The magnitude of social exclusion of a person with disabilities ranges from 16 percent when living in a community in which the vast majority of the population is either in favour of, or at least not against, inclusive education, to 30 percent when living in a community less open to educational inclusion (with at least one-third of the population against such measures).Tolerance of corruption increases exclusion outcomes. Magnitude of social exclusion is nine times higher in villages and seven times higher in small towns where most respondents are tolerant of informal side payments not only for medical treatment, education and social benefits but also to for results from local administrations.Social exclusion also has a clear territorial dimension. The further people live away from the capital city, the higher the magnitude of exclusion. The share of people found to be socially excluded is almost four times higher in rural areas than in urban areas. Living in rural areas with fewer job opportunities; limited access to goods, social services and means of transport; and weak social networks adds up to a massive disadvantage, driving more people into cities.Social exclusion is highest in communities that were dominated by one or two companies prior to 1989. If these communities were to diversify their economic base and provide more employment opportunities, their average magnitude of social exclusion would decrease from 18 to 11 percent. Expansion of employment opportunities would be particularly effective in addressing social exclusion among young people. Magnitude of social exclusion for a young person with secondary education in a rural community with only one employment provider is more than three times higher than that for a young person with primary education in a small town with a variety of employers.Recommendations.The Report concludes that social exclusion is a multidimensional phenomenon that can and should be measured. The specifics of the local context have profound implications for social exclusion. Governments need to break the vicious cycle of social exclusion and ensure an enabling environment that curtails the risks of social exclusion and enhances the opportunities for people to participate in society. Focusing on reducing income poverty or economic inclusion alone will not face down the challenge of social exclusion sustainably. The Report therefore argues that social inclusion requires integrated approaches targeting all three dimensions of social exclusion simultaneously – cases where addressing a single individual risk or driver leads to a sustainable and marked reduction in the magnitude of social exclusion would be the exception. As such, approaches based on multiple areas of interventions implemented in a concerted manner are needed, reflecting the complexity and dynamic nature of social exclusion.
1.1BOX
UNDP_magazine_ENG_v10j.indd 24UNDP_magazine_ENG_v10j.indd 24 04.07.2011 17:40:1804.07.2011 17:40:18
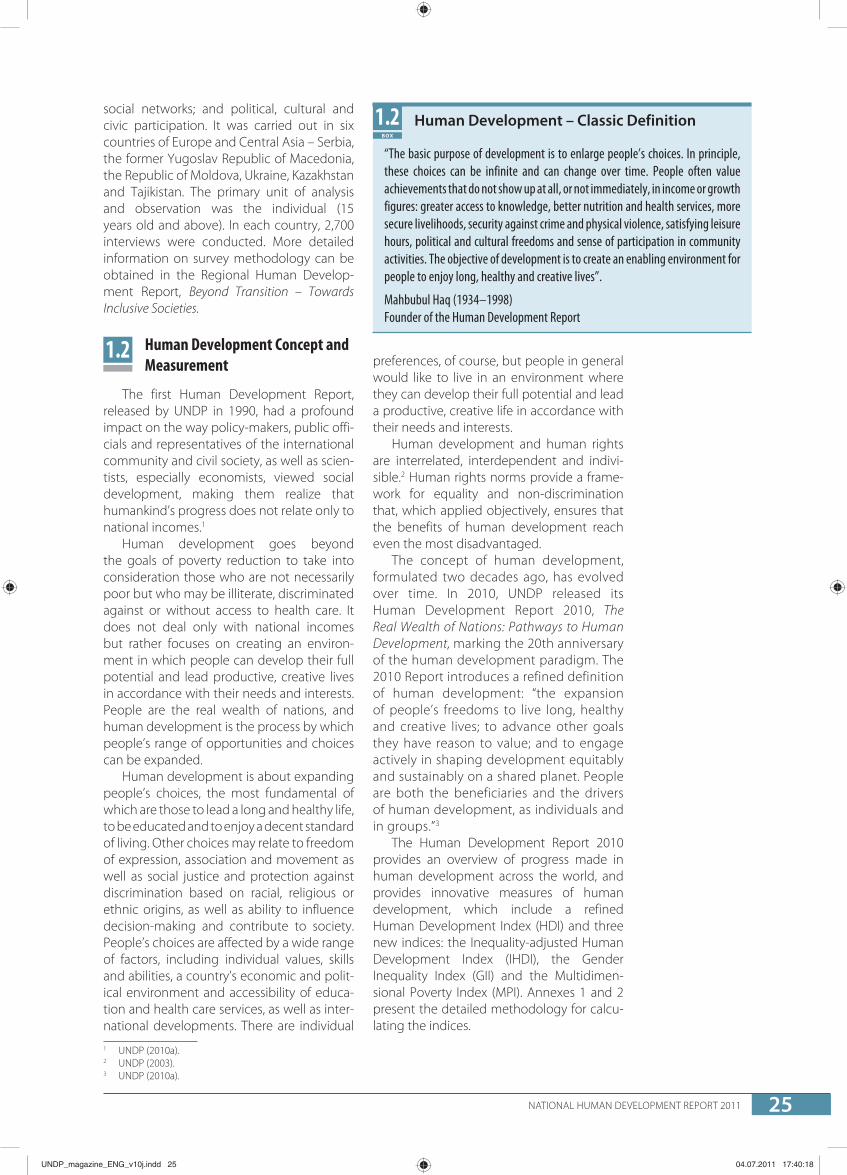
NATIONAL HUMAN DEVELOPMENT REPORT 2011 25
social networks; and political, cultural and civic participation. It was carried out in six countries of Europe and Central Asia – Serbia, the former Yugoslav Republic of Macedonia, the Republic of Moldova, Ukraine, Kazakhstan and Tajikistan. The primary unit of analysis and observation was the individual (15 years old and above). In each country, 2,700 interviews were conducted. More detailed information on survey methodology can be obtained in the Regional Human Develop-ment Report, Beyond Transition – Towards Inclusive Societies.
Human Development Concept and Measurement
The first Human Development Report, released by UNDP in 1990, had a profound impact on the way policy-makers, public offi-cials and representatives of the international community and civil society, as well as scien-tists, especially economists, viewed social development, making them realize that humankind’s progress does not relate only to national incomes.1
Human development goes beyond the goals of poverty reduction to take into consideration those who are not necessarily poor but who may be illiterate, discriminated against or without access to health care. It does not deal only with national incomes but rather focuses on creating an environ-ment in which people can develop their full potential and lead productive, creative lives in accordance with their needs and interests. People are the real wealth of nations, and human development is the process by which people’s range of opportunities and choices can be expanded. 2 3
Human development is about expanding people’s choices, the most fundamental of which are those to lead a long and healthy life, to be educated and to enjoy a decent standard of living. Other choices may relate to freedom of expression, association and movement as well as social justice and protection against discrimination based on racial, religious or ethnic origins, as well as ability to influence decision-making and contribute to society. People’s choices are affected by a wide range of factors, including individual values, skills and abilities, a country’s economic and polit-ical environment and accessibility of educa-tion and health care services, as well as inter-national developments. There are individual 1 UNDP (2010a).2 UNDP (2003).3 UNDP (2010a).
1.2 preferences, of course, but people in general would like to live in an environment where they can develop their full potential and lead a productive, creative life in accordance with their needs and interests.
Human development and human rights are interrelated, interdependent and indivi-sible.2 Human rights norms provide a frame-work for equality and non-discrimination that, which applied objectively, ensures that the benefits of human development reach even the most disadvantaged.
The concept of human development, formulated two decades ago, has evolved over time. In 2010, UNDP released its Human Development Report 2010, The Real Wealth of Nations: Pathways to Human Development, marking the 20th anniversary of the human development paradigm. The 2010 Report introduces a refined definition of human development: “the expansion of people’s freedoms to live long, healthy and creative lives; to advance other goals they have reason to value; and to engage actively in shaping development equitably and sustai nably on a shared planet. People are both the benefi ciaries and the drivers of human develop ment, as individuals and in groups.”3
The Human Development Report 2010 provides an overview of progress made in human development across the world, and provides innovative measures of human development, which include a refined Human Development Index (HDI) and three new indices: the Inequality-adjusted Human Development Index (IHDI), the Gender Inequality Index (GII) and the Multidimen-sional Poverty Index (MPI). Annexes 1 and 2 present the detailed methodology for calcu-lating the indices.
Human Development – Classic Definition
“The basic purpose of development is to enlarge people’s choices. In principle, these choices can be infinite and can change over time. People often value achievements that do not show up at all, or not immediately, in income or growth figures: greater access to knowledge, better nutrition and health services, more secure livelihoods, security against crime and physical violence, satisfying leisure hours, political and cultural freedoms and sense of participation in community activities. The objective of development is to create an enabling environment for people to enjoy long, healthy and creative lives”.
Mahbubul Haq (1934–1998)Founder of the Human Development Report
1.2BOX
UNDP_magazine_ENG_v10j.indd 25UNDP_magazine_ENG_v10j.indd 25 04.07.2011 17:40:1804.07.2011 17:40:18

CHAPTER 1. HUMAN DEVELOPMENT, SOCIAL EXCLUSION AND SOCIAL INCLUSION 26
According to the 2010 Report, Ukraine’s HDI value for 2010 is 0.710, ranking the country at the 69th place out of 169 coun-tries and areas. Ukraine has made progress in recent years in terms of human develop-ment measured on the refined HDI, which is a summary measure for assessing long-term progress on three basic dimensions of human development: a long and healthy life; access to knowledge; and a decent standard of living.4 Between 1990 and 2010, Ukraine’s HDI value increased from 0.690 to 0.710, an increase of 3 percent or an average annual increase of about 0.1 percent. In the same period, Ukraine’s life expectancy at birth decreased by about 1 year, mean years of schooling increased by over 2 years and expected years of schooling increased by over 2 years. Ukraine’s gross national income (GNI) per capita decreased by 27 percent during the same period (Table 1.1).
Ukraine’s HDI is below the average of 0.717 for countries in Europe and Central Asia. It is also below the average of 0.717 for high human development countries. In Europe and Central Asia, Ukraine’s 2010 “HDI neigh-bours”, i.e. countries that are close in HDI rank and population size, are Kazakhstan and the Russian Federation, which ranked 66th and 65th, respectively. 5
The HDI is an average measure of basic human development achievements in a country. Like all averages, it masks inequality in the distribution of human development across the population at the country level. To address this limitation, the HDI is a new measure which takes into account in-country inequality in all three dimensions of the HDI. Ukraine’s HDI for 2010 is 0.710. However, when the value is discounted for inequality, it falls to 0.652, a loss of 8 percent as a result of inequality in the distribution of the dimen-sion indices. Kazakh stan and the Russian
4 Ukrainian experts have developed a national methodology to calculate the HDI at regional level within the country, allowing for the coverage of many more aspects of human development at regional level. See Libanova (2009a).
5 Maternal mortality estimates are those available when preparing the Report. For updated estimates, see WHO (2010).
Federation show losses of 14 percent and 12 percent, respectively.
The GII, also introduced in 2010, reflects women’s disadvantages in three dimen-sions: reproductive health; empowerment; and economic activity. It shows losses in human development as a result of inequality between female and male achievements in these three dimensions. In Ukraine, women hold 8 percent of parliamentary seats. Compared with 96 percent of their male counterparts, 92 percent of adult women have a secondary or higher education. For every 100,000 live births, 18 women die from pregnancy-related causes.5 The adolescent fertility rate is 28 births per 1,000 live births. Female participation in the labour market is 62 percent compared with 73 percent for men. This results in a GII value for Ukraine of 0.463, which means that it ranks 44th out of 138 countries based on 2008 data. Kazakh-stan and the Russian Federation are ranked 67th and 41st, respectively.
Since 1997, the Human Development Reports have presented a Human Poverty Index (HPI), which combines different aspects of non-monetary deprivations. The HPI has contributed to an understanding of poverty but the measure does not capture overlap-ping deprivations that individuals or house-holds may suffer. Therefore, the 2010 Report’s MPI identifies multiple deprivations in the same households in terms of education, health and standard of living.
In Ukraine, 2 percent of the population is multi-dimensionally poor, with an addi-tional 1 percent vulnerable to multidimen-sional poverty. The intensity of deprivation in Ukraine – that is, the average percentage of deprivation experienced by people in multi-dimensional poverty – is 36 percent. The MPI, which is the share of the population that is multi-dimensionally poor, adjusted by the
Ukraine’s Human Development Index Trends
Life expectancy at birthExpected years
of schoolingMean years of schooling
GNI per capita (PPP US$)
HDI value
1990 69.7 12.4 9.1 8,928 0.6901995 67.8 11.9 10.4 4,153 0.6442000 67.4 12.9 10.7 3,882 0.6492005 67.9 14.2 11.1 5,976 0.6962010 68.6 14.6 11.3 6,535 0.710
Source: UNDP (2010a).
1.1TABLE
UNDP_magazine_ENG_v10j.indd 26UNDP_magazine_ENG_v10j.indd 26 04.07.2011 17:40:1804.07.2011 17:40:18

NATIONAL HUMAN DEVELOPMENT REPORT 2011 27
intensity of the deprivations, is 0.008. Kazakh-stan and the Russian Federation have MPIs of 0.002 and 0.005, respectively (Table 1.2).
The Millennium Development Goals (MDGs), including targets and indicators, are based on the concept of human develop ment, each relating to key dimensions of this process. These comprehensive goals, develo ped through a series of global conferen ces and special meetings organized by the United Nations (UN), provide specific targets in all critical areas of human development. They cover reducing hunger and poverty; achieving access to education; promoting gender equality; reducing maternal and child mortality; slowing down the spread of HIV/AIDS and other infectious diseases; ensuring environmental sustainability; and harmonizing foreign aid to developing countries. The MDGs do not cover all areas of human development; they do not mention, for instance, expanding people’s participation in the decisions that affect their lives or increasing their civil and political freedoms.
Providing the same absolute targets for all countries would have meant unrealis tic Goals for some countries and Goals that presented no challenge for others. Conse-quently, the Goals are generally established for each country in accordance with the national specifics of its development and the status of social progress at this moment in time. In these terms of progress towards achieving the MDGs, Ukraine has succeeded in reducing absolute poverty6 from 9 percent in 2005 to 4.5 percent in 2009; however, relative poverty according to the nationally defined poverty line7 has remained stable at a level of 27 percent.8Moreover, the poverty level in rural areas is almost twice as high as in urban areas (38.2 percent vs. 21.5 percent). Ukraine has made significant achievements
6 A share of those whose daily consumption is below US$ 5 (PPP).7 75 percent of the median level of equalized expenditures per reference adult.8 Ministry of Economy of Ukraine (2010).
in meeting the education Goal (although there are issues with the quality of educa-tion) and Goals on maternal health and child mortality. Reaching the Goal related to HIV/AIDS and tuberculosis continues to be a chal-lenge. Ukraine still has the most severe HIV epidemic out of all the countries in Europe and Central Asia. The estimated adult preva-lence of HIV infection is 1.3 percent, the esti-mated number of people living with HIV is 360,000 and the estimated number of HIV-related deaths is 37,000. Meanwhile, gender equality remains an issue: representation of women in Parliament is very low – 8 percent. The exclusion of women from deci-sion-making at the highest political levels is inconsistent with their high levels of partici-pation at lower levels in the public sector. The average wage of a woman was equal to 77.2 percent of that of a man in 2009.8
“Social Inclusion” and “Human Development” in Ukrainian – Translation of Terms
Any application of terms and categories from other languages and their translation cause numerous difficulties. In particular, the “human development” concept, which has been used in Ukraine for over two decades, is usually translated as ”людський розвиток” or “розвиток людського потенціалу”, even though the translation “гуманітарний (гуманістичний) розвиток” seems quite possible and to reflect the essence of the concept.“Social exclusion” was introduced into circulation well after, so there are no established Ukrainian equivalents yet. Purely linguistic foundations suggest “соціальне відчудження, соціальне відсторонення, соціальне відторгнен-ня, соціальна ексклюзія, виключення із суспільного життя, ізольованість, десоціалізація”. Correspondingly, “social inclusion” is “соціальне залучення, залучення до суспільного життя, соціальна інтеграція, соціальна інклю-зія, соціальне включення”. As for the “social exclusion – social inclusion” idea itself, “соціальне відторгнення – соціальне залучення” seems to be the most accurate.
1.3BOX
Ukraine’s HDI Indicators in 2010 Relative to Selected Countries
HDI value MPI value MPI headcount (%)Intensity of
deprivation (%)Population at risk of multidimensional
poverty (%)
Armenia 0.695 0.008 2.3 36.5 5.5Georgia 0.698 0.003 0.8 35.2 5.3Ukraine 0.710 0.008 2.2 35.7 1.2Azerbaijan 0.713 0.021 5.4 38.6 12.4Kazakhstan 0.714 0.002 0.6 36.9 5.0Russian Federation 0.719 0.005 1.3 38.9 0.8
Source: UNDP (2010a).
1.2TABLE
UNDP_magazine_ENG_v10j.indd 27UNDP_magazine_ENG_v10j.indd 27 04.07.2011 17:40:1804.07.2011 17:40:18
CHAPTER 1. HUMAN DEVELOPMENT, SOCIAL EXCLUSION AND SOCIAL INCLUSION 28
Defining Social Exclusion
Social exclusion is a relatively new concept which lacks a universal definition. It has evolved together with the idea of social rights, rooted in the idea of the European welfare state. In 1974, René Lenoir, Secre-tary of State for Social Issues in Jacques Chirac’s Government in France, defined “the excluded” as people from all social categories who are not included in the social insurance systems of the welfare state: the mentally and physically handicapped, suicidal people, aged invalids, abused children, substance abusers, delinquents, single parents, multi-problem households, marginal asocial persons and other social “misfits”.9
The European Commission (EC) defines social exclusion as “a process whereby certain individuals are pushed to the edge of society and prevented from participating fully by virtue of their poverty, or lack of basic compe-tencies and lifelong learning opportunities, or as a result of discrimination. This distances them from job, income and education opportunities as well as social and commu-nity networks and activities. They have little access to power and decision-making bodies and thus often feeling powerless and unable to take control over the decisions that affect their day to day lives.”10
Social exclusion is a display of the direct violation of basic human rights – the rights to quality education; quality medical services and good health; an acceptable standard of living; access to cultural life; protection of own interests; and, in general, participation in in economic, social, cultural and political life – and a feature of low human development level in a country. Social exclusion means that some people, groups of people or whole communities suffer from a range of interre-lated problems, such as unemployment, low qualifications, low income levels, poor living conditions, high crime rates, family break-down, etc.
The concept of social exclusion high-lights the multidimensionality of disadvan-tage and directs attention to the institutional, political and economic processes that generate social exclusion. In particular, it is about the lack of rights (to education, to health care, to housing, to work, to partici-pate in decision-making) and of opportuni-ties to access these rights even if they are
9 Lenoir (1974), in Sen (2000).10 EC (2004).
1.3declared formally. Poverty, absence of basic competences and opportunities for educa-tion and discrimination can cause not only lack of competitiveness in the labour market but actual exclusion from employment and adequate income and, from social assistance and inclusion in public life. Victims of social exclusion also often feel powerless in relation to decisions related to their own life, with no real influence on decisions within the compe-tence of authorities.
Social exclusion therefore refers to lack of access to resources, rights, goods and services, and inability or limited ability to participate in various aspects of life in society. The unemployed, for instance, may end up in poverty, which is sustained by labour market exclusion, which may lead to financial dependency on social assistance. Economic deprivation limits engagement in community, leisure and family activities and accessing health and social services. This may induce feelings of marginality and of being of little value to society, which leads to feelings of shame and passivity. This in turn may result in to loss of (or retreat from) social networks, a reduction in social contacts and an inability to live according to socially accepted norms and values, causing further stigmatization and discrimination.
Social exclusion has both objective and subjective dimensions and manifestations. For instance, long-lasting unemployment usually causes loss of income and there-fore of the potential to live a standard lifestyle – an objective exclusion. Subjec-tively, lasting unemployment entails loss of social status, often through loss of friends and social contacts in general. It is worth mentioning that subjective and objective features of exclusion by no means always coincide. For instance, there are facts or situations that some people will perceive with extreme acuteness while others may perceive as temporary difficulties. The subjective features of social exclusion often have much more acute consequences than objective features, as is the case in the rela-tionship between subjective and objective poverty.
A developed civil society can offer real opportunities for people to join groups based on demographic, social or geographical features, and thus represents an important level of protection of rights and, correspon-dingly, a safeguard against social exclusion.
UNDP_magazine_ENG_v10j.indd 28UNDP_magazine_ENG_v10j.indd 28 04.07.2011 17:40:1804.07.2011 17:40:18

NATIONAL HUMAN DEVELOPMENT REPORT 2011 29
Therefore, it is difficult to count on effective social inclusion processes or counteraction of social exclusion in Ukraine, given that an efficient civil society is yet to be formed and the vast majority of joint actions of the popu-lation appear to be conducted under the influence of political events and (or) political leaders.
Social exclusion reflects partial or full exclusion of a person (or group of people) from the social structures of society and civil processes, as a consequence of existing (legal or psychological) barriers to the social impor-tance of a person. The “socially excluded” do not necessarily mean representatives of the so-called lower levels of the society, but can also mean any person whose life is deter-mined by levels of indifference among and tight control by other population groups, not by personal choice.
Separate attention should be paid to the so-called “voluntary exclusion” or “self-exclusion”, which appears to emerge from a person’s conscious or semi-conscious actions directed at his/her own exclusion from society.
Social exclusion is multidimensional and complex. Studies of the phenomenon should supplement traditional studies of poverty, since both entail loss of human resources, opportunities and chances in life, which is unacceptable in relation to social justice and sustainable economic growth in the future.11
Defining Social Inclusion
The EC defines social inclusion as “a process which ensures that those at risk of poverty and social exclusion gain the oppor-tunities and resources necessary to partici-pate fully in economic, social and cultural life and to enjoy a standard of living and well-being that is considered normal in the society in which they live. It ensures that they have greater participation in decision-making which affects their lives and access to their fundamental rights.”12
This definition acknowledges the need to offer those outside society’s mainstream a greater say than they have now – that is, greater participation – as a means of achieving the well-being that is considered normal in the society. Thus, the process of social inclusion is the “redistribution of social opportunities” among all segments of the
11 Kieselbach (2003).12 EC (2004).
1.4
population. It is firmly allied with the parallel idea of equality and non-discrimination, as well as empowerment of vulnerable or marginalized persons or groups.
In this perspective, social inclusion strives to redress root causes of social exclusion, such as discriminatory actions, failures in policies and institutions and structural inefficiencies, and involves participation and integration into insti-tutions and social networks. To ensure this, the political and economic processes that generate exclusion should be identified and appro-priate policy and institutional changes made. Thus, social inclusion does not entail simply a reversal of social exclusion status. In this regard, it involves at least two steps: 1) removing barriers in a wide sense – barriers to participa-tion and to access to resources and oppor-tunities; and 2) promoting a change in atti-tudes. Even if legal norms and structures are in place, policies are needed to cultivate solidarity within a community, to counteract entrenched social prejudices and to encourage the partici-pation of individuals who face barriers. All these are important elements of the social inclusion process, to make it long-term and sustainable.
Human Development and Social Inclusion – Evolving Concepts Centred on People
Social inclusion and human development have evolved largely in parallel and are tending towards convergence. Both are people-centred concepts, extending beyond economic growth. Social exclusion, which prevents access through institutional, community and personal barriers to important social goods and services, as a result of deliberate discrimination or lack of capacity to deliver, reduces people’s opportunities and the real freedoms they have to lead a life they have reason to value. The human development perspective adds value to social exclusion. Human development identifies shortcomings and inequalities in opportunities for developing capabilities which contribute to social exclusion outcomes. In addition, it assesses the outcomes of the social inclusion process using a variety of indicators. Human development also takes into account the contextual aspects in improvements in human well-being, going well beyond focusing solely on the excluded population. Social inclusion also adds value to human development through its focus on processes of exclusion (the agents, groups and institutions that exclude). It reinforces the notion of agency that exists within the human development framework by investigating through what mechanisms, as a result of whose actions and why people are excluded. A social inclusion perspective can thus help sharpen strategies for achieving human development by addressing the discrimination, powerlessness, accountability failures and unequal power relationships that lie at the root of every type of social exclusion.
1.4BOX
UNDP_magazine_ENG_v10j.indd 29UNDP_magazine_ENG_v10j.indd 29 04.07.2011 17:40:1804.07.2011 17:40:18

CHAPTER 1. HUMAN DEVELOPMENT, SOCIAL EXCLUSION AND SOCIAL INCLUSION 30
Relationship between Human Development and Social Exclusion and Social Inclusion
Social exclusion and inclusion and human development concepts complement each other. High levels of human development cannot be achieved when some groups and individuals are excluded socially and face barriers to their participation in economic, social, cultural and political life. Restrictions in any of these areas are perceived as detri-mental to freedom of choice, the core of human development. As a result, achieving human development in its entirety means tackling these barriers and facilitating delibe-rate inclusive processes that expand people’s real freedoms and create an inclusive society, in which diversities are a source of strength and not of weakness. Consequently, social inclusion is a means to achieve human devel-opment.
Social exclusion analysis identifies the drivers of exclusion by examining the interac-tions between the individual and the society and its institutions. In this perspective, the analysis should cover legislation, institu-tions, organizations, social networks, values, political preferences, attitudes, etc. While people are sometimes deliberately excluded on the grounds of ethnicity, political affilia-tion, gender, etc., in most cases social exclu-sion occurs as a result of a complex web of social processes in which there are no delibe-rate attempts to exclude. This Report reveals the interplay of institutional, legal and attitu-dinal drivers of exclusion in Ukraine, which include diverse aspects such as long-term unemployment; deregulation of the labour market; strengthening migration processes and processes of social fragmentation; deep-ening poverty; ill-health; and weakening of the role of family as a social institution.
These separate mechanisms and mani-festations of social exclusion usually do not weaken, but rather turn into new drivers of exclusion – a vicious circle of one depriva-tion leading to another leading to persistent multiple exclusions. For example, alcoholism may drive a person to lose his or her links with society and limit opportunities for employ-ment and income generation; vice versa, unemployment, which causes a loss of social status, is often a reason for alcoholism. Social exclusion is usually related to poverty, which in turn leads to a loss of many rights. A person who fights for physical survival on a day-to-day basis has no time or will to be concerned about the social, political or cultural life of
1.5 society. In the absence of opportunities for civil society to influence political processes, some groups are marginalized, meaning their voices and aspirations are not heard or are ignored.
The social exclusion concept offers a comprehensive and wide-ranging analyti cal perspective to identify individuals and groups suffering exclusion and drivers of exclusion as well as to design better-targeted strategies, programmes and interventions to overcome manifestations of discrimination. Consequently, policies and processes are not only sector-specific but also cross-sectoral, focusing on diverse areas such as institutional transformations and changes in public atti-tudes and consciousness.
Social Exclusion in Ukraine
The terms “social exclusion”, “social inclu-sion” and “participation in public life” are not used widely in the expert literature in Ukraine, and they are not reflected in legis-lation, policies and other official documents. In practice, however, Ukrainian legislation and policies address the goals of social inclu-sion and target some identified vulnerable groups (families or individuals). Furthermore, the terms “social rehabilitation”, “social inte-gration” or “integration into the society”, “re-socialization” and “social adaptation” are used in many policy documents.
The Constitution of Ukraine recognizes that every person has the right to free deve-lopment of his or her personality if this does not violate the rights and freedoms of other persons. Citizens have equal constitutional rights and freedoms and are equal before the law. The Constitution of Ukraine affirms that there shall be no privileges or restrictions based on race; colour of skin; political, reli-gious or other beliefs; sex; ethnic and social origin; property status; place of residence; or linguistic or other characteristics. Equal rights are assured to women and men. These provi-sions comply with the European legislation. Freedom of movement; speech, mindset and confession; and association in political parties and civil society organizations (CSOs) is guaranteed to anyone, as are the rights to employment; entrepreneurial activities; social protection; a decent level of living for the individual and his or her family; health care; medical assistance and insurance; an environ-ment safe for life and health; education, etc.
Realization of these rights is ensured through the adoption and execution of sectoral laws, bylaws and other policy instru-
1.6
UNDP_magazine_ENG_v10j.indd 30UNDP_magazine_ENG_v10j.indd 30 04.07.2011 17:40:1804.07.2011 17:40:18

NATIONAL HUMAN DEVELOPMENT REPORT 2011 31
ments. Principles of social inclusion are set by the Laws of Ukraine on State Social Stand-ards and State Social Guarantees (2000); Sub sistence Level (1999); Remuneration of Labour (1995); Education (1991); and on Fundamental Principles of Legislation on Mandatory State Social Insurance; (1998), among others. Specific laws have been devel-oped to support some vulnerable groups, such as on the protection of those harmed by the Chernobyl disaster; military servicemen and women and their family members; people with disabilities; war veterans; persons born in times of war; families with many chil-dren; families with children; labour veterans; pensioners and the elderly; people sick with socially dangerous diseases; migrants; people with temporary disabilities; those affected by job-related accidents or occupational diseases; the unemployed, etc. Meanwhile, the Strategy for Poverty Alleviation by 2010 was adopted in 2001 and a new Programme on Poverty Alleviation till 2015 is being developed. There are programmes aimed at preventing and overcoming social exclusion of certain social groups are in place. However, the implementation of these programmes depends on the recognition by the authori-ties of the importance of these issues, on the one hand, and the availability of budget resources – on the other hand.
The current social protection system in Ukraine has some limitations common to many countries in transition. The state does not provide enough assistance to the
most vulnerable and poor people; at the same time, social protection programmes provide support to too large a group of citi-zens, which is beyond the state’s financial capacity. Social benefits themselves (in the case of insured events or in the form of social assistance) are of a very low value and as such cannot succeed in preventing poverty. The high correlation between different social transfers and levels of wages does not stim-ulate the population to actively participate in economic activity. Political instabili ty and, to an extent, inconsistency of political deci-sions impeded on the modernization of the social protection system aimed at over-coming social exclusion and marginalization of certain groups of population.
Ukraine has declared its goals of building a socially oriented market economy that puts sustainable human development at the core of state social policy and makes it a measure of the country’s economic and social progress. To achieve these objectives, Ukrainian society should unite around ideals of human develop-ment and progress. The European Parliament in 2005 passed almost unanimously a motion asserting the wish of the European Union (EU) to establish closer ties with Ukraine. The Asso-ciation Agreement is currently under nego-tiation, with the aim of deepening Ukraine’s political association and economic integration with the EU. Given the EU’s extensive experi-ence in implementing effective policies and programmes of social inclusion, improved collaboration in this area can help Ukraine.
UNDP_magazine_ENG_v10j.indd 31UNDP_magazine_ENG_v10j.indd 31 04.07.2011 17:40:1804.07.2011 17:40:18
CHAPTER 1. HUMAN DEVELOPMENT, SOCIAL EXCLUSION AND SOCIAL INCLUSION 32
UNDP_magazine_ENG_v10j.indd 32UNDP_magazine_ENG_v10j.indd 32 04.07.2011 17:40:1804.07.2011 17:40:18
NATIONAL HUMAN DEVELOPMENT REPORT 2011 33
C H A P T E R
2 Exclusion from Political Life
Political rights are among the main constitutional rights and freedoms of citizens. The Universal Declara-tion of Human Rights determines that:• Everyone has the right to take part in the Government of his or her country, directly or through freely
chosen representatives.• Everyone has the right of equal access to public service in his or her country.• The will of the people shall be the basis of the authority of Government; this will shall be expressed
in periodic and genuine elections which shall be by universal and equal suffrage and shall be held by secret vote or by equivalent free voting procedures.1
Political inclusion is impossible in the absence of democratic institutions and practices. The notion of democracy broadly implies freedom, equality and efficient control of Government by the citizens, Government’s responsibility towards its citizens, transparency and honesty of political decisions and equal political participation and access to power.2 Democratic institutions and practices should be fair and accountable and protect human rights and basic freedoms.3 They should allow society to identify the most important barriers to accelerated human development and social inclusion, agree on the best solutions to these and implement them in the most efficient manner. In the absence of democratic institutions and practices, there is a serious risk that those responsible for government decisions will be unaware of the true needs of vulnerable and socially excluded groups.The key indicators of exclusion related to political life include: • Level of participation in public and political life; • Ability to influence the governance of a country at national and local levels;• Access to political power.4
1 UN (1948).2 Huntington (1991). 3 UNDP (2002).4 Economist Intelligence Unit (2010).
The Democratic Transition and Participation of the Population in Political Life
Since independence, Ukraine has gone through the complex process of building the foundations of consolidated democracy. During the transition, command economy mechanisms were effectively dismantled and market institutions were established, with most outputs produced by the private sector and exchanged in a market system. A new Constitution of Ukraine and a series of laws establishing the formal foundations of a democratic regime were adopted, and formal democratic human rights institu-tions ensuring regular elections, respect for human rights such as freedom of speech, association and non-discrimination based on gender, race or religion and the promo-
2.1 tion of tolerance and social cohesion were established. Some public administration reforms, including optimization of govern-ment structures, were implemented. Civil society emerged and expanded quickly. Inde-pendent media developed and started to play its important role in terms of checks and balances on the exercise of powers granted to political leaders and public office holders.However, the presence of a legal framework and formal democratic institutions does not ensure a vibrant and well-functioning democracy. In the Economist Intelligence Unit’s Democracy Index, out of the 28 coun-tries in Eastern Europe, 19 recorded a decline in their democracy score between 2008 and 2010. The most significant decline was observed in Ukraine.4
As a result of these complex and interlinked processes, an empowering environment that
UNDP_magazine_ENG_v10j.indd 33UNDP_magazine_ENG_v10j.indd 33 04.07.2011 17:40:1804.07.2011 17:40:18
CHAPTER 2. EXCLUSION FROM POLITICAL LIFE 34
promotes full participation and involvement of the population, and especially vulnerable groups, in political proces ses at the national and local levels has not been fully estab-lished in Ukraine. Traditional authoritarian Soviet values and attitudes on such elements of democracy as open politi cal competition, promotion of independent voice, collabora-tive decision-making and gender equity are still entrenched in current practices.
Political institutions that emerged in the transition process combine elements of new democratic institutions and old Soviet patterns of decision-making. The initial desire to create well-functioning democratic institutions through the replication of tried and trusted Western models has not been fully realized in Ukraine. Although formal institutions with basic features corresponding to those of insti-tutions in advanced industria lized and demo-cratic states have been built, these institutions only partialy shape political actions.
Instead of an institutional vacuum open to any kind of institutional design, reformers faced the resistance of informal networks formed under the Soviet regime. These networks created their own practices and routines as well as their own social ties and patterns of making commitments. As a result, the political and economic spheres are still not separated, leading to the situation that powerful vested interests can capture political processes and advance their own economic interests, which effects democratic reforms negatively. Slow progress to achive adequate levels of state transparency and accountability, the merging of politics and business and weak rule of law are some of problems of the politi cal system in Ukraine, determined to a large extent by insti-tutional legacies. 5 6
Due to these institutional legacies the process of establishment of a market environ-ment and democratic institutions in Ukraine has been controversial. Private property insti-tutions and contract relationships were not protected through effective legal guarantees and were subject to change depending on the political elite in power. Market freedoms and the inviolability of property and human rights were not fully observed.
The old institutions also influenced many citizens’ political behaviour. Many values of the old Soviet system did not lose their tradi-tional legitimacy with the loss of their legality. A significant share of Ukrainians, especially the older generations, were not eager to accept the ideals of democracy and free market and 5 Carothers (2002).6 Hale (2005).
were more inclined to behave according to the traditional values of the Soviet system, such as those of state paternalism, state control of the economy, extensive state social support and privileges for the ruling elite. In the modern Ukrainian reality, some politicians exploited these die-hard institutional expectations and values skilfully and were elected promising unsustainable and poorly targeted social programmes. These politicians attempted to recreate a model of state patron with a collec-tive client population: the patron dispenses valuables to its clients and protects them in exchange for loyalty and support.
Political processes in Ukraine are shaped by competition among economic and political elites and the population’s opportunities to be involved are limited. At the early stages of transformation, the political regime in Ukraine had many features of the Soviet system. Until 2004, it was a hybrid state under a competi-tive authoritarian regime:7 formal democratic institutions and processes such as political parties and elections existed, but the reality showed that political decisions were made through informal coordination and agree-ments.
Large financial and industrial groups emerged at the end of 1990s and became active political players. Their struggle for economic resources and assets, based on “winner takes all” sentiments, made it impossible to put in place a “treaty of elites” as was the case in some post-Soviet and Central European countries. This economic competition among powerful interest groups took place in the political arena, as active and powerful political and financial players joined either presidential or opposition camps. Some experts argue that the driving force of events in 2004 was the pushing out of financial and industrial groups and the middle class, which suffered under the pressure of the bureaucratic apparatus. This suggests that the “Orange Revolution” was not a “systemic break-through” but rather a phase of open confronta-tion within a wider regime cycle, the result of which was the rise to power of the opposition.6
Amendments to the Constitution in 2004–2005 and changes in the ruling elite caused changes in the mechanisms of exer-cising power. The competitive struggle among political actors intensified. Influence over the mass media by high-ranking civil servants was eliminated and replaced with a flexible lobbying policy by media owners – who were also leaders of financial and indus-trial groups, who converted their control of
UNDP_magazine_ENG_v10j.indd 34UNDP_magazine_ENG_v10j.indd 34 04.07.2011 17:40:1804.07.2011 17:40:18

NATIONAL HUMAN DEVELOPMENT REPORT 2011 35
the media into political loyalty to the authori-ties in exchange for economic incentives.
The dual nature of the executive authorities established by the constitutional amendments undermined the mechanisms of administra-tive coordination and strengthe ned political corruption. The weake ning of the vertical power of the execu tive and its unwillingness to exercise direct pressure on the opposi-tion purely on political grounds decreased the influence of administrative factors during the most recent elections. The parliamentary elections of 2006 and 2007 and the presiden-tial elections of 2009 reflected the increased contentiousness of the election process.
Although there have been some improve-ments to formal political institutions and proce s ses, the degree of political transfor-mation was insufficient to develop a system that could withstand the impact of the global economic crisis. The political system has been dominated by competition among interest groups, rent-seeking within state agen-cies, corruption and an expanding shadow economy. Political instability and frequent elec-tions have severely undermined the effective-ness of economic and social policies. Poli tical squabbling between top decision-makers has paralyzed decision-making at a crucial time – when the financial crisis hit the country’s steel industry and banks collapsed. The country has failed to push through its economic reforms and is facing economically and politically chal-lenging gas disputes with Russia.
As a result, society has been through a trans-formation of identity, economy and social struc-
ture that has left a significant share of individuals excluded and unsatisfied with the new political and economic systems. Living conditions have ended up far from their expectations and ideals of citizens. Some groups have not been able to adjust quickly to the rapidly changing envi-ronment, resulting in widely shared feelings of social anxiety and uncertainty.
Some share of the population appeared to be unsatisfied with the effectiveness and quality of current democratic political insti-tutions and processes and considers itself excluded from political life. Only 18 percent of the country’s population considers its level of inclusion in public life during Ukraine’s inde-pendence as sufficient. The rest – at least 67.6 percent – can thus be considered excluded to one extent or another from political processes (Table 2.1).
The political regime formed in Ukraine does not appear to fully empower the popu-lation and vulnerable groups to become included in the political process, resulting in relatively low levels of political participation. Ukrainian citizens realize their right of partici-pation, among others, in the form of electoral activity. Despite the fact that voting does not necessarily relate to political choices, a large percentage of survey respondents (83.6 percent) claim for instance that they partici-pate in electoral voting, against 13.8 percent who do not participate (Table 2.2).
The population perceives that its intere sts and aspirations are not well-represented by political actors; and this, in its turn, under-mines their trust in political institutions. Existing
Distribution of Population by Self-assessment of Level of Adaptation to Current Situation (%)
1997 1999 2001 2003 2007 2009
People actively involved in new life 7.3 7.4 7.2 8.3 16.0 18.0People seeking their place in current life 36.3 36.6 38.0 30.5 32.5 33.6People who do not wish to adapt to the current situation, wait for a turn for the better
44.9 46.7 43.3 36.2 37.6 34.0
People who have not yet decided 11.5 9.3 11.5 25.0 13.9 14.4Source: Institute of Sociology of the National Academy of Sciences of Ukraine (2009).
2.1TABLE
Distribution of Population by Participation in Voting during Elections (%)
Age of respondentAll respondents
15–24 25–49 50–64 65+
Participated in voting 47.5 87.6 92.6 89.3 83.6Did not participate in voting 39.5 11.6 6.5 9.5 13.8Not eligible to vote 10.7 0.2 0.0 0.0 1.6Uncertain 2.3 0.6 0.9 1.2 1.0Total 100.0 100.0 100.0 100.0 100.0
Source: Calculated based on the Social Exclusion Survey (2009).
2.2TABLE
UNDP_magazine_ENG_v10j.indd 35UNDP_magazine_ENG_v10j.indd 35 04.07.2011 17:40:1804.07.2011 17:40:18

CHAPTER 2. EXCLUSION FROM POLITICAL LIFE 36
political institutions and practices do not empower the average Ukrainian to partici-pate in poli tical processes and exclude citi-zens from the process of elaborating socially relevant decisions, including those which affect them directly. 7
The Constitution of 1996 defined a democ ratic framework for the development of a viable political society. Human rights and liberties were set, censure was prohi-bited and the principle of the change of powers through elections was established, as well as other democratic values. However, the mismatch between the formal legisla-tion and the political reality remains a major challenge for democratic development in Ukraine. Insufficient political freedoms mean that the people are not empowered to press for policies that expand social and economic opportunities and make democratic process more transparent and public authorities more accountable. The population of Ukraine cannot identify any political actor (institution)
7 Institute of Sociology of the National Academy of Sciences of Ukraine (2009).
Assessment by Population of Activities of Different Political Actors in Protecting Their Interests, 2009 (%)
Political institutions Assessment
President 3.7Parliament 1.6Prime Minister 5.8Government 2.6Mass media 6.2Local authorities 3.0Trade unions 3.7Heads of enterprises 1.9Army 2.2Law enforcement authorities 2.9Church 8.3Workers of culture and science 1.5Other 1.0None of the above 55.7It is difficult to say 12.5
Source: Institute of Sociology of the National Academy of Sciences of Ukraine (2009).
2.3TABLE
Distribution of the Population by Self-assessment of Own Influence on Political Situation (%)
Age of respondentAll respondents
15–24 25–49 50–65 65+
Evaluated positively 26.3 29.2 34.4 34.9 30.9Evaluated negatively 53.2 58.9 56.2 50.9 55.9Uncertain 20.5 11.9 9.4 14.2 13.2Total 100.0 100.0 100.0 100.0 100.0
Source: Calculated based on the Social Exclusion Survey (2009).
2.4TABLE
that effectively represents and protects their interests (Table 2.3).
Low levels of trust in elected officials leads to a belief that existing inconsistencies in the political sphere cannot be addressed. This results in a widening of the gap between politics and individuals and strengthens conflict risk potential in the Ukrainian society. Despite the fact that a third of the popula-tion feel that they can influence the political situation in Ukraine, nearly 60 percent deny this ability (Table 2.4).
As a result of population’s exclusion from the political sphere, 88 percent of interviewed youth, up to 80 percent of middle-a ged people and 86 percent of the older genera-tion claim that they had not taken part in any civil and political event during the previous 12 months.7
The reform of the political system and of political processes themselves has not, as yet, built a proper rule of law system to support citi-zens’ inclusion in the political process. Public
UNDP_magazine_ENG_v10j.indd 36UNDP_magazine_ENG_v10j.indd 36 04.07.2011 17:40:1804.07.2011 17:40:18

NATIONAL HUMAN DEVELOPMENT REPORT 2011 37
trust in the rule of law appears to be under-mined by widespread informal practices of decision-making, which result in violations of the normative order. During the years since indepen dence, law-abiding behaviour and practices have eroded and the necessity of adhering to a set of rules and official norms has been questioned. To a great extent, such law abiding values are preserved mainly among the elderly. Others feel that the order is not fair and are not ready to comply with its rules. Around 70 percent of those inter-viewed thought that, under such condi-tions, people could commit unfair actions for profit.8 Nevertheless, a large part of the society appears to be disheartened by the disorder and struggles prevailing within the political elite, and looks forward to changes. Rule of law and equality of all people before the law are important for most respondents.
At the same time, as in a number of ex-Soviet countries, this “order” may not necessarily mean the rule of law but a way to restore the control at the expense of a stronger state. The notion that busi-ness does not have the right to intervene in politics defines the new bureaucratic ideology: even if some actions are allowed by law, such as legal participation in political proces ses, they can be done only if allowed by the authorities. From this point of view, the public administration is a privilege of the bureaucracy and should not be scrutinized. In some cases, private business is permitted but only if it is politically loyal and supports the initiatives of the authorities. This exacer-bates political exclusion among socially active age groups and creates ideological grounds for further strengthening bureau-cratic influences on society in general.
The public administration does not have sufficient capacity to identify and address people’s needs and involve them in public consultations. Public involvement in policy-making is used to create consensus, explore
8 Golovakha and Panina (2008).
ideas, improve acceptance of new proposals, find cost-effective policy solutions and increase transparency in decision-making. Line ministries have weak capacity in terms of conducting research, developing effec-tive policy options, conducting ex ante policy assessments and estimating costs and impacts of policy initiatives.
The public administration does not have enough capacity to fully promote participatory approaches to policy-making, and vulnerable groups are rarely involved in state programme design, their implementation and monitoring, as well as in delivery of services at the local level. There is a chance that the upcoming administ-rative and criminal justice system reforms, as well as actions to combat corruption, will promote public engagement and improve opportunities for the vulnerable and excluded to work with administrations. The initiated administrative reform aims at recognazing the system of governance and improving the institutional capacities of state structures. This could restore the predictability of Government proces ses and decisions and advance partici-patory mechanisms as well.
Lack of access to public information. Without good access to quality informa-tion, the average Ukrainian, and especially vulne rable groups, are unable to participate effectively in decision-making processes that affect their lives. Since information is power, establishing an equitable distribution of power needed for strong partnerships and an effective system of checks and balances requires that information be available, rele-vant and reliable.
Reforms in public information-sharing are difficult to achieve. Ukraine’s 1992 Law on Information recognized the right to informa-tion but has been described by international bodies as “confusing” and having overly broad exemptions. A new Access to Public Informa-tion Law and a Law on Information came into force in May 2011. These facilitate better
Distribution of Population by Age and Self-assessment of Personal Responsibility for Community Affairs, 2009 (%)
AgeResponsible Not responsible Undecided
Ukraine In urban or rural area Ukraine In urban or rural area Ukraine In urban or rural area
18–25 24.7 28.5 62.0 58.2 13.3 13.326–40 25.7 30.5 61.2 57.3 13.1 12.241–55 23.5 30.5 61.3 57.2 15.3 12.356+ 21.1 22.9 66.9 66.2 12.0 10.9
Source: Institute of Sociology of the National Academy of Sciences of Ukraine (2009).
2.5TABLE
UNDP_magazine_ENG_v10j.indd 37UNDP_magazine_ENG_v10j.indd 37 04.07.2011 17:40:1804.07.2011 17:40:18
CHAPTER 2. EXCLUSION FROM POLITICAL LIFE 38
access by the citizens of Ukraine to informa-tion on national and local authorities; unify the procedure for journalists’ accreditation; reduce the terms for receiving responses to requests; and cancel the obligation to agree interviews with authorities.
Mass media are not always free, which may limit access to objective and impartial informa-tion. Access to information is a major tool to improve transparency and accoun tability and promote the goals of social inclusion. In the context of restricted freedom of mass media, information provided by the latter run the risk of being disordered; thus they would not be able to perform its watchdog functions. At the same time the public and in parti-cular vulnerable groups would not be able to engage in a timely and effective manner in political processes and ensure the account-ability of officials.
Freedom House rates freedom of the press in Ukraine in 2010 as partly free.9 It finds that the legal framework provides for media freedom and is one of the most progres-sive in Eastern Europe, but also that respect of these laws has remained poor since the Orange Revolution. Journalists have some-times been reported to become the victims of threats, harassment and attacks, and the country’s seemingly weak and politicized crimi nal justice system cannot protect them effectively. As many major media outlets are owned by economic groups, their presenta-tion of information is often distorted in favour of their owners.
An institutionally weak civil society does not have sufficient capacity to address the needs of vulnerable and excluded groups and to promote their interests. At the beginning of the transition, reformers in Ukraine, as in many other post-Soviet states, shared the idea that support to civil society would generate a wide range of CSOs that would participate in public life, strengthening democratic institu-tions and promoting market policies. These expectations proved to be inflated: they did not reflect the institutional, historical and political context of the post-Soviet transition.
The long-term development of a strong and dynamic civil society required a sustai-nably functioning economic system. Economic uncertainty and confrontation within the political elite has pushed civil society issues to the background during the whole period of Ukraine’s independence. The state has not become a leading agent in terms of supporting civil society as the basic
9 Freedom House (2010).
component of democratic transformation in the country. As a result, civil society is still weak and poorly structured, and there is no spread of strong civic organizations that can represent broad societal inte rests, and espe-cially vulnerable groups during negotiations in the democratic process.
In order to facilitate dialogue between Government and civil society, despite short-comings in the development of the latter, a legal framework including all the neces-sary mechanisms and processes was set up. This allowed to improve capacity of both the public administration and CSOs in relation to cooperation and constructive dialogue. However, a number of other areas still need to be addressed to enhance the role of civil society in eliminating barriers to political and social inclusion. The majority of CSOs are supply-driven, responding to external donors’ priorities and resources and less so to the needs of communities. As their agendas are often shaped by their funders, some of them do not emphasize the task of building ties with their constituencies and operate only within a particular set of tasks. As a result, trust in civil society is low, reducing the chances of vulnerable groups to unite their efforts and have their voices and concerns heard through CSOs.
Incomplete decentralization processes have not created effective mechanisms for partici-pating in local decision-making processes. Decentralization means the delegation of tasks, responsibilities, resources and decision-making authority to regions and local levels. It can improve resource allocation and service provision by bringing decision-makers and service providers closer to the citizens. It allows for the communication of the voices of the socially excluded and of vulnerable groups to local decision-makers. It does not, however, automatically lead to improved outcomes for the poor and other disadvantaged groups. Despite progress in the process of decentrali-zation, some limitations are still observed:• Limited authority is provided to the local
public administration, and there is a misalignment of responsibilities among central, regional and local governments, so that local government is not able to fully implement the functions vested in it by the Constitution and laws of Ukraine.
• Local governments have inadequate revenue and spending powers, so they do not have financial capacities commensurate with their functions. In the
UNDP_magazine_ENG_v10j.indd 38UNDP_magazine_ENG_v10j.indd 38 04.07.2011 17:40:1804.07.2011 17:40:18

NATIONAL HUMAN DEVELOPMENT REPORT 2011 39
current system, almost all tax revenues are to go directly to the central state treasury, with some funds then going back to local levels. These large vertical transfers of funds are inefficient and distort incentives.10
• Public administrators are inadequately trained to be responsive to local needs and to the expectations of vulnerable groups. They are often unprepared to promote organized and systematic dialogue among stakeholders, including CSOs, community groups and the private sector, to determine in a participatory manner local priorities and mutual expectation for decentralized governance.
Exclusion from Political Life Faced by Certain Groups of the Population
The elderly. Low incomes, dependence on state support and paternalistic views of the state’s role are some barriers that limit the political inclusion of elderly people. Miserable living conditions of elderly people often define their adherence to “economic voting” prima-rily during local elections. Economic voting is the unlawful practice of providing goods and services to voters in exchange for their vote for heads of local authorities. Quite high elec-toral activity of the elderly impacts the election results and legitimizes authorities that have come to power in such a way.
Youth. Apathy and distrust in political processes distance youth from the main-stream. Political exclusion among youth is conditioned by problems accessing the materials, education, social capital, resources and opportunities to participate in processes of decision-making and local government. Ukraine’s young people are characterized by low electoral participation as well as weak representation in different state authorities (around 5 percent). According to data from the Social Exclusion Survey (2009), the major reason youth have for not voting after the option “do not have the right to vote” is poli-tical apathy – 14.4 percent of those who do not vote are not interested in politics. Young people claim that they do not have the oppor-tunity to become part of social elite networks, to access high levels of decision -making and, correspondingly, to control resources. This worsens their exclusion, decreases their crea-tivity and marginalizes them or pushes them towards emigrating.
10 Independent International Experts Commission (2010).
2.2
Women. Old gender stereotypes and weak support for gender equality create barriers to the political inclusion of women. Soviet political practices, with all their gender décor, which was reflected in the symbolic appoint-ment of women, were entirely patriarchal. This was reflected in the mass consciousness of Ukrainian citizens. During the years since independence, significant changes in terms of views of the role of women in politics have been observed the Ukrainian society.
The Law on Equal Opportunities for Women and Men entered into force on 1 January 2006. Although it established the institutional and legal foundations for gender equality, gender exclusion still has many forms; the most common is in terms of access to political authority. There have been no radical shifts in the participation of women in state authorities in Ukraine. Only 34 women (7.5 percent) were elected to the Parliament of Ukraine in the last convocation. The absence of women in the Government formed in 2010 is also illustrative of this situation.
Low representation of women in high-level political positions is set against their high representation in the public service. In general, women dominate in the public administration: women managers and experts represented 64.8 percent and 79.5 percent of public servants, respectively, at the beginning of 2010 – however these positions are all at lower levels, which require lower qualifications and do not entail significant responsibility. Women are also insufficiently represented in the public administration at local level, where their share among people’s deputies does not exceed 40 percent.
Ukraine has highly competent, well-educated and well-trained women employed in the public administration, with the neces-sary working experience and skills to occupy senior management positions. Gender stereo-types are among the reasons preventing them from advancing in their careers.
Rural population. Traditional views and limited opportunities for political participa-tion beyond elections are some of the barriers to political inclusion facing the rural popula-tion, which comprises 31 percent of Ukraine’s population.13 In rural areas, the economic crisis has aggravated issues of poor social infrastructure, unemployment, poverty and depopulation.
The rural population is rather active in elections, which reflects wide-spread tradi-tions and stereotypes of the Soviet era. But
UNDP_magazine_ENG_v10j.indd 39UNDP_magazine_ENG_v10j.indd 39 04.07.2011 17:40:1804.07.2011 17:40:18

CHAPTER 2. EXCLUSION FROM POLITICAL LIFE 40
political participation is limited to voting and does not involve other mechanisms to influen ce local decision-making and control over activities of the local authorities. According to available data, informal prac-tices are more rooted and stronger in rural than in urban areas and represent a serious barrier to the rationalization and moderni-zation of political processes. The “friend–alien” dichotomy is marked in local elections, making rotation within politi cal and admin-istrative spheres more difficult, as informal groups of influence concentrate resources in their hands and build up tight patron–client relationships with rural populations. 11
Marginalized groups. Deep-seated public stereotypes and limited mechanisms facili-tating participation in the life of society are some of the barriers to the political inclu-sion of marginalized groups, which include those without a permanent place of resi-dence (the homeless), illegal immigrants, former convicts, others. Without identifi-cation (58 percent of children and young people living on the streets have no passport after turning 16 years old) and registration documents, they have no opportunity to get an education, solve housing problems, earn
11 Ukraine joined the Convention on the Status of Refugees in January 2002 and the Protocol on the Status of Refugees in 1967. The country has also ratified the UN Educational, Scientific and Cultural Organization (UNESCO) Declaration on Races and Racial Prejudices (1978), the UNESCO Declaration on the Principles of Tolerance (1995), the European Social Charter (1996), the European Convention on Nationa lity (1997) and the Framework Convention for the Protection of National Minorities (1998). Ukraine signed an agreement with the EU on readmission in 2010.
Exclusion of Homeless People from Public Life
“We are pariahs in society. We are rubbish. I do not feel part of society any more […] I feel part of society only in the reintegration centre. Apart from this, I think there is no society in our country” (Oleksandr, Sumy).“We are treated like dogs. If you do not have identification documents, nobody needs you. And you think it is possible not to suffer when nobody considers you as a person? On the other hand, why should I suffer? You find a place to spend a night and a piece of bread, and then you can enjoy your life. Why are we worse than the others? We are exactly the same as all the others; we have two legs to walk” (Oleksandr, Odesa).
2.1BOX
Exclusion of Immigrants from Public Life
“Everything is about documents. In order to have full rights in Ukraine, one should be a citizen of Ukraine. But if you are not a citizen of Ukraine, then you have no rights. You have absolutely no rights. The only help you can receive is help from your family (Armenians). […] The problem is that we cannot become Ukrainian citizens as of now. We need to live in the country officially for five years. In order to obtain citizenship we need either to get an official job, which is impossible, or to get married to a Ukrainian woman. We cannot get official registration” (Samvel, citizen of Armenia, Zhytomyr).
2.2BOX
an income legally, receive social assistance, access medical and social services or realize their political rights. The results are, under-standably, apathy and a loss of will to stand up for their rights.
There are no mechanisms to ensure the participation of immigrants in political life. The majority of immigrants have left their native country hoping to find a better life.
According to data from the Ministry of Internal Affairs of Ukraine, there are 279,000 foreign residents in the country; according to experts’ assessments, there are 700,000–800,000 illegal immigrants. Immigrants settle down in big cities, mostly in the north and east of Ukraine and close to Kyiv.
These groups face challenges related to their legal status and their access to many social programmes and services. They have to go through complex processes of prepa-ration and legalization of documents and obtain different permits. In addition to bureau-cratic complexities, they may face corruption, particularly among employees of law enforce-ment agencies, while applying for the neces-sary documents. Refugees, for instance, do not have residence, therefore they cannot obtain a decent job, be registered as unemployed or access free training. They also cannot legalize diplomas from foreign universities or confirm qualifications, as Ukraine does not have, yet, the relevant mechanisms for this.
The country’s legal framework protects immigrants from political exclusion and fore-sees criminal prosecution for displays of xenophobia and racism. The Constitution of Ukraine states that foreigners and stateless persons who are in Ukraine on legal grounds enjoy the same rights and freedoms and also bear the same duties as citizens of Ukraine, with the exceptions established by the Consti-tution, laws or international treaties of Ukraine. The Law of Ukraine on the Legal Status of Foreigners, adopted in 2001, defines migrants’ rights to property, education, consciousness and movement and guarantees their personal rights. According to this law, foreigners have the right to take part in all legal associations of individuals except political parties. Conse-quently, persons without citizenship do not have the right to elect or be elected in state authorities or to take part in referendums.11
Despite this supportive legislation, the political inclusion of immigrants is extremely
UNDP_magazine_ENG_v10j.indd 40UNDP_magazine_ENG_v10j.indd 40 04.07.2011 17:40:1804.07.2011 17:40:18

NATIONAL HUMAN DEVELOPMENT REPORT 2011 41
slow and controversial. The local population is not always psychologically ready for the emergence of big enclaves of immigrants, which, in some cases, causes inter-ethnic tension, xenophobia and racism. Mass media contribute to these negative public percep-tions by focusing on immigrants’ criminal activities. These factors contribute to the rela-tive political exclusion of immigrants, due to myths and perceptions, competition on the labour market and informal practices. Around 50 percent of those interviewed had heard about unfriendly attitudes on the part of the local population and 25 percent had witnessed such attitudes.12 Further-more, foreigners had encountered displays of aggression by the police (19 percent of respondents highlighted the attitude of the police towards immigrants as negative).13
Conclusions
An inclusive society entails the ability of all citizens to have their voices heard. Effec-tive political inclusion is ensured by means of complex mechanisms, processes and practices through which citizens and groups articu late their interests and exercise their rights and obligations.
The coexistence of new democratic elements and elements of old Soviet institu-tions in Ukraine has resulted in low levels of state transparency and accountability, inade-quate separation of politics and the public administration and weak rule of law. As a result, the political and economic spheres are still not independent from each other, meaning that powerful vested interests can capture political processes and state institu-tions to advance their economic interests, with negative effects on democratic reform. Meanwhile, old institutions also influence the political behaviour of many citizens.
Existing political institutions and prac-tices mean poor empowerment for the
12 Almashy (2008).13 Eastern European Development Institute (2008).
average Ukrainian to participate in political processes, thus excluding citizens from the process of elaboration of socially relevant decisions, including those which affect them directly. Citizens do not believe that their voice or actions count: more than half of the Ukrainian population does not feel that it has an influence on the political situ-ation. The public administration does not have enough capacity to promote participa-tory approaches to policy-making. Vulner-able groups are rarely involved in Govern-ment operations, including policy design, programme implementation and monitoring and delivery of services at the local level.
Mass media are not always free, which limits access to objective and impartial information and the transparency of polit-ical processes. There is no spread of strong civil organizations that can represent broad societal interests, and especially vulnerable groups, in the democratic process. Incomp-lete decentralization has not established effective mechanisms for participation in local decision-making processes.
There are barriers to political participa-tion for particular groups of the population. Low incomes, dependence on state support and paternalistic views of the state limit the political inclusion of the elderly. Youth are widely apathetic and distrustful of political processes that exclude them from meanin-gful involvement. Old gender stereotypes and weak support for gender equality create barriers to the political inclusion of women. Traditional views and limited opportunities for participation in political life beyond elec-tions are barriers to inclusion of rural popu-lations. Deep-seated public stereotypes and limited mechanisms limit the political inclu-sion of marginalized groups (the homeless, illegal immigrants, former convicts, others). Immigrants face challenges resolving their legal status which mean they cannot access many social programmes and services.
UNDP_magazine_ENG_v10j.indd 41UNDP_magazine_ENG_v10j.indd 41 04.07.2011 17:40:1804.07.2011 17:40:18

CHAPTER 2. EXCLUSION FROM POLITICAL LIFE 42
UNDP_magazine_ENG_v10j.indd 42UNDP_magazine_ENG_v10j.indd 42 04.07.2011 17:40:1804.07.2011 17:40:18

NATIONAL HUMAN DEVELOPMENT REPORT 2011 43
C H A P T E R
3 Exclusion from Cultural Life and Education
In a modern and dynamic world, citizens’ prosperity, as well as a country success depends, among others, on the possibility to use the cultural assets of a society and to ensure favorable conditions for creativity and cultural diversity. The state policy in the cultural sphere should therefore aim at creating such a favourable environment that ensures the inclusion of all. Preventing or overcoming cultural exclusion, that is, limitations to the opportunities of representatives of any social, ethnic, religious or other groups to utilize their cultural achievements and participate in their creation, is important for the development of individuals, society and the state.
In one or another way, cultural exclusion may be pertinent to ethnic Ukrainians, as well as to the national minorities, large and small religious groups and language minorities; groups different in terms of their economic status; migrants; elderly people; sexual minori-ties; people living with HIV; drug users; persons with disabilities; and those who live far from cultural centres.Education systems are traditionally meant to integrate people into systems of socio-cultural values and relation-ships. Education as a social institute ensures that the needs of society are fulfilled in relation to the reproduction and transfer of accumulated know-ledge and skills to younger genera-tions through teaching, upbringing and practical socialization, and helps to elevate younger generations to a higher cultural level. Education also has as a major goal – developing the personality. Experts consider education not only as the most important tool to decrease young people’s innate social inequality and support their upward mobility, but also a condition of their successful inclusion and active partici-pation in social life. Educat ion level is an important factor determining a person’s entrance into the labour market, competitiveness and socio-economic status.
Exclusion from education means the restriction of an individual’s access to education at any level (from pre-school to higher education) and for a specific number of reasons. Interna-tional research identifies the following groups as excluded: children and teenagers who do not have access to education; individuals who drop out from school and do not achieve a sufficient educational level; and indivi-duals who have unsatisfactory or poor grades in school (including children who repeat grades). Those who are at increased risk of exclusion include children and teenagers with special needs (mainly people with physi cal or mental disabilities); migrants; ethnic, language, cultural and religious minori-ties; homeless or working children; beggars; children of refugees; orphans; children living with HIV; child-victims of violence; and children and young people for whom education and voca-tional training do not correspond to their needs and aspirations. It is widely recognized that the level of education is closely correlated with the level of human development. Therefore, the elimination of manifes-tation of exclusion from education, together with that of various institu-tional and financial barriers, is a pre-condition for progress in a society.
UNDP_magazine_ENG_v10j.indd 43UNDP_magazine_ENG_v10j.indd 43 04.07.2011 17:40:1804.07.2011 17:40:18
CHAPTER 3. EXCLUSION FROM CULTURAL LIFE AND EDUCATION 44
Exclusion from Cultural Life
The role of culture in the development of the Ukrainian society is defined by the following factors: • Ensuring the broad access to cultural
assets, including assets of world culture, for the spiritual, aesthetic and educational enrichment of each individual;
• Stimulation of society’s creative potential and cultural capital to foster knowledge-based economy and the development of national creative industries;
• Preservation and actualization of cultural and historic heritage to foster socio-economic development and enrichment of the world’s culture through the national cultural assets;
• Preservation of the cultural diversity of the modern multi-ethnic Ukrainian nation, protecting its unique ethnic components from the impact of globalization and integration and mutual reinforcement of the cultural assets of all groups of population. Sociological studies suggest that large-
scale changes in the structure and nature of individuals’ cultural activities and leisure have occurred in Ukraine since independen ce. Some cultural practices that were wide-spread some time ago, usually largely subsi-dized by the state, have lost their popularity. At the same time, new elements of culture, such as show business, pop music and the entertainment industry, are expanding their influence. Modernization and accelerated cultural changes, especially when they take extreme forms, may have a serious impact on traditional cultural values, and this, in its turn, strengthens exclusion of certain groups of population. 1 2
There are vast and sometimes striking discrepancies in forms of leisure and patterns of cultural consumption between the rich and the poor, which create, to some extent, a threat to social harmony and consolida-tion. Lifestyles and values of the rich often contradict traditional society’s values. These discrepancies, caused by economic gaps in the society, lead to a gap in access to culture; thus, some groups become excluded from the cultural life due to low income (and low capacities to purchase “cultural goods”), distance from cultural centres, poor educa-tion and other factors. The access of disad-
1 Degterenko (2008).2 The only representative source of the data is the All-Ukraine Census of 2001.
3.1 vantaged groups to cultural assets and events should be supported, otherwise the “high art”, such as opera, comfortable modern cinemas and jazz clubs, will remain a “culture for the chosen”, while the majority of the population will access culture only through television and free of charge pre-election shows in city squares.
Differences in cultural practices and life-styles between the capital, oblast centres and the periphery also create threats to exclu-sion. Official statistics of Ukrainian house-holds’ expenditures on culture and leisure indicate the magnitude of these differences: inhabi tants of big cities spent 3.8 times more on culture and leisure than rural area inhabi-tants in 2009. Money is not the only issue: the number of cinemas, libraries and book stores is noticeably smaller in the periphery. Resi-dents of big cities can access culture through a number of channels, such as television, internet, print publications and tourist infra-structure, which are often unavailable in rural settlements. Rural inhabitants (one-third of the Ukrainian population) usually have access to three or four television channels, wired radio and a local newspaper issued once in a weak. Hence, big cities and villages in Ukraine appear to come from different cultural spaces, if not different eras.
Language is among the important factors to determine cultural exclusion of some population groups in Ukraine. This relates above all to language policy, and the status and conditions of studying and using different languages. Whether Ukraine should have only one state language – Ukrainian – or whether Russian should also receive such a status forms part of a political discusson.
The following analysis of ethnic and language situation in communities in such regions of Ukraine as the Autonomous Republic of Crimea (ARC), the Ukrainian Northern Azov Territories1 (UNAT) and Tran-scarpathia, which contain compact settle-ments of national minorities,2 underlines the importance of the language aspect in the context of exclusion.
In the ethnic structure of communities in the ARC, the share of Ukrainians is 24.3 percent; Russians – 58.3 percent; Crimean Tatars – 12.0 percent; Byelorussians – 1.4 percent; Tatars – 0.5 percent; Armenians – 0.4 percent; Bulgarians – 0.1 percent; Greeks – 0.1 percent; and Germans – 0.1 percent. In the UNAT, the share of Ukrainians, according
UNDP_magazine_ENG_v10j.indd 44UNDP_magazine_ENG_v10j.indd 44 04.07.2011 17:40:1904.07.2011 17:40:19

NATIONAL HUMAN DEVELOPMENT REPORT 2011 45
to the All-Ukrainian Census of 2001, is equal to 52.7 percent; Russians – 37.8 percent; Greeks – 4.7 percent; and Bulgarians – 2.3 percent other ethnic communities do not reach even 1 percent (in some rayons of the region, such as Telman, Volodarsk and Pervomaysk, the number of ethnic Greeks varies between 17.5 and 20.1 percent). In Transcarpathia, Ukrainians constitute 80.5 percent of the population; Hungarians – 12.1 percent; Romanians – 2.6 percent; Russians – 2.5 percent; Roma – 1.1 percent; and others to less than 1 percent of the population.3
People’s ethno-linguistic competence and recognition of a certain language as the mother tongue is a qualitative characteristic of communities in the ARC, the UNAT and Transcarpathia. Scientific discourse identi-fies several components of bilingualism as a social phenomenon: language compe-tence (proficiency in mother tongue and other languages); language activities (use of different languages in different life situations); and ethno-language orientation (attitu des towards each of language of society).
In terms of language competence, in the ARC, 62.7 percent of Ukrainians are fluent in Russian as their second language and 75.6 percent are fluent in their national language as the second language. Only 0.2 percent of the region’s non-Ukrainian nationalities named Ukrainian as their mother tongue during the Census of 2001, out of which 3.1 percent Bulgarians; 1.1 percent Germans; 1.1 percent Greeks; 0.9 percent Byelorussians; 0.3 percent Armenians; 0.2 percent Russians; 1.1 percent Tatars; and 0.1 percent Crimean Tatars. 4
Only 0.8 percent of the non-Ukrainian nationalities in UNAT named Ukrainian as their mother tongue during the Census of 2001, out of which18.3 percent Roma; 17.8 percent Poles; 7.1 percent Germans; 6.7 percent Moldovans; 3.3 percent Jews; 3.1 percent Byelorussians; 3.0 percent Bulgar-ians; 2.5 percent Tatars; 2.2 percent Geor-gians 2.2 percent Greeks’; 1.8 percent Arme-nians; and 1.3 percent Russians. These data suggest that the use of the Russian language in multi-ethnic communities of the ARC and the UNAT is, somehow, more intense than in Ukraine in general.
In general, relatively low indicators of studying of and proficiency in the Ukrainian language among the population of the ARC can create some barriers to the social inclu-sion of Crimeans of different ethnic origin at the national level. For instance, graduates of 3 Kuras Institute of Political and Ethnic Studies of the National Academy of Sciences of Ukraine (2008).4 Kuras Institute of Political and Ethnic Studies of the National Academy of Sciences of Ukraine (2008).
general educational institutions, who have insufficient proficiency in the state language, can suffer from lower competitiveness when applying for and studying in higher educa-tional institutions.
In the ARC in the 2010/11 academic year, 13,609 students were taught in Ukrainian in
Language Situation in the ARC, the UNAT and Transcarpathia
In the ARC, 99.7 percent of Russians, 93.0 percent of Crimean Tatars, 67.8 percent of Tatars, 52.9 percent of Armenians, 40.4 percent of Ukrainians, 23.8 percent of Greeks, 18.4 percent of Bulgarians and 17.1 percent of Byelorussians consider their own language the mother tongue. That is twice as many Russians and Crimean Tatars as Ukrainians consider the language of their nationality as their mother tongue. The level of knowledge of the mother tongue among Russian nationality inhabitants of the ARC is around four times, six times and almost eleven times higher than the analogous indicator of representatives of ethnic Greek, Byelorussian and German communities, respectively. In particular, during the All-Ukrainian Census of 2001, 88.7 percent of Germans named Russian language as the mother tongue, as did 81.8 percent of Byelorussians, 77.6 percent of Bulgarians, 71.8 percent of Greeks, 46.1 percent of Armenians, 25.0 percent of Tatars and 5.9 percent of Crimean Tatars. The majority of ARC Ukrainians (59.5 percent) also consider Russian language their mother tongue.
In the UNAT, Russian is considered as the mother tongue by 98.6 percent of Russians, 40.8 percent of Armenians, 38.9 percent of Bulgarians, 36.1 percent of Ukrainians, 32.1 percent of Roma, 25.2 percent of Tatars, 20.6 percent of Georgians, 14.1 percent of Moldovans, 10.5 percent of Byelorussians, 5.3 percent of Germans, 4.9 percent of Greeks, 3.7 percent of Poles and 2.7 percent of Jews. Almost three times as many Russians consider their national language as the mother tongue than Ukrainians do for their national language. Level of knowledge of the mother tongue among Russians is 20 times higher than that for Greek ethnic community.
Therefore, UNAT and ARC communities are characterized by the tendency towards a gradual substitution of national languages as the mother tongue by Russian. In particular, during the All-Ukrainian Census of 2001, 94.0 percent of Jews named Russian language as their mother tongue in UNAT, as did 92.8 percent of Greeks, 87.4 percent of Germans, 86.1 percent of Byelorussians, 78.2 percent of Poles, 78.0 percent of Moldovans, 76.7 percent of Georgians, 71.8 percent of Tatars, 57.8 percent of Bulgarians, 56.7 percent of Armenians and 49.3 percent of Tatars. The majority of Ukrainians in the UNAT (63.8 percent) also considered Russian their mother tongue.
The situation in Transcarpathia is different. 99.2 percent of Ukrainians, 97.1 percent of Hungarians, 99.0 percent of Romanians, 91.7 percent of Russians and 20.5 percent of Roma consider their national languages their mother tongue. Russian language is said to be the mother tongue by 0.5 percent of Ukrainians, 0.2 percent of Hungarians, 0.1 percent of Romanians and 0.2 percent of Roma. Ukrainian is considered the mother tongue by 2.6 percent of Hungarians, 0.5 percent of Romanians, 7.9 percent of Russians and 16.7 percent of Roma.4
3.1BOX
UNDP_magazine_ENG_v10j.indd 45UNDP_magazine_ENG_v10j.indd 45 04.07.2011 17:40:1904.07.2011 17:40:19

CHAPTER 3. EXCLUSION FROM CULTURAL LIFE AND EDUCATION 46
general educational institutions, which repre-sent, 8.1 percent of all students enrolled.
In the same academic year, a total of 318 general educational institutions had Russian as the language of instruction in the ARC. A total of 160 classes with Russian as the language of instruction (3,624 students) were opened in 9 schools with a Ukrainian language instruction system. Another 142 general educational institutions with two languages of instruction (Russian and Ukrainian) had 2,307 classes with Russian as the language of instruction (49,967 students). In 27 general educational institutions with two languages of instruction (Russian and Crimean Tatar), 6,889 people studied with Russian as the language of instruction in 366 classes. In addi-tion, 551 classes (with 12,132 students) with Russian as the language of instruction func-tioned in schools with three languages of tuition (Russian, Ukrainian and Crimean Tatar). Overall, in the 2010/11 academic year 149,793 students, which represent 88.6 percent of all students enrolled, were taught in Russian. The decrease in the number of students studying in Russian can be attributed to both a reduc-tion in the number of students generally and an increase in the number of students with Ukrainian or Crimean Tatar as the language of instruction.
Meanwhile, 15 general educational insti-tutions with Crimean Tatar as the language of instruction (3,115 students), 1 general educational institution with Ukrainian and Crimean Tatar as the languages of instruction, 27 schools with two languages of instruction (82 classes, 882 students) and 34 schools with three languages of instruction (117 classes, 1,365 students) operate in the ARC. Experts state, however, that not the whole education in schools with Crimean Tatar language of instruction is performed in the Crimean Tatar language, due to a lack of handbooks and teachers. Overall, 5,903 students (16.6 percent of all students of Crimean Tatar nationality) are being taught in Crimean Tatar; 29,413 students have Crimean Tatar language as a discipline (82.7 percent of the general number of students of Crimean Tatar nationality).
Insufficiency of textbooks, training mate-rials and qualified teachers is a major obstacle to improving the quality of the Crimean Tatar language study. A total of 88.9 percent of classes with Crimean Tatar as the language of instruction have the necessary amount of textbooks (for classes with Ukrainian as the language of instruction the share is 94.2 percent and for classes using Russian it is 97.8 percent). Opportunities to study their mother
tongue are provided for Crimeans of other nationalities within the general educational institution system.
In the UNAT, 87.8 percentof inhabitants are fluent in Russian as their second language, while 76.6 percent of inhabitants are fluent in the language of their nationality as a second language. Corresponding indicators for the Ukrainian language for the country as a whole look better – 58.1 percent and 96.8 percent, respectively. In Transcarpathia, indicators of language competence are as follows: 26.4 percent of inhabitantsare fluent in Russian as a second language and 1.3 percent are fluent in the language of their nationality as a second language; 45.5 percent of Hungarians are fluent in Ukrainian and 30.4 percent of Hungarians are fluent in Russian; 24.2 percent Romanian are fluent in Ukrainian and 37.5 percent in Russian; and 74.5 percent Russians are fluent in Ukrainian as a second language.
Language competence as a part of the general social potential of ethnic communi-ties of Ukraine should be considered in rela-tion to several aspects.
Socio-cultural aspects. It is important to ensure that all minorities have opportunities to study and use their native languages, and at the same time respect the official national language. A total of 70.1 percent of Russians; 52.3 percent of Byelorussians, 47.7 percent of Germans, 45.4 percent of Greeks; 33.5 percent of Ukrainians; 35.3 percent of Bulgarians; 28.4 percent of Armenians and 21.0 percent of Crimean Tatars in the ARC admitted that they did not know any language except for the one they considered their mother tongue. Figures for the UNAT were 37.5 percent of Russians; 16.7 percent of Byelorussians; 44.0 percent of Germans; 24.4 percentof Greeks; 7.1 percent of Georgians; 21.9 percent of Tatars; 14.2 percent of Poles; 12.0 percent of Moldovans; 23.7 percent of Ukrainians; 22.3 percent of Armenians; and 14.9 percent of Bulgarians.Such a situation could reduce opportunities for inter-ethnic contacts, limit the general cultural competenceof the people and create the basis for inter-ethnic tensions. This, in its turn, would limit the opportunities for human development and would result in cultural and social exclusion.
Educational-cultural aspects. The Soviet legacy in education, when the Ukrainian language was for rural areas and Russian language for urban areas (and fully in the east and south) has left important traces in the current education system. The network of institutions for the study of languages of ethnic groups that are concentrated in parti-
UNDP_magazine_ENG_v10j.indd 46UNDP_magazine_ENG_v10j.indd 46 04.07.2011 17:40:1904.07.2011 17:40:19
NATIONAL HUMAN DEVELOPMENT REPORT 2011 47
cular regions has gradually broadened across the country since the 1990s. In particular, the number of educational institutions for the study of not only the Ukrainian language but also Modern Greek, Bulgarian, German, Crimean Tatar, Hebrew and other languages has gradually increased in the UNAT. This is facilitating a revival of the region’s tradi-tional ethno-cultural environment. Consi-derable attention is being paid to preserving the Greek Urum and Rumei dialects, among others.
Socio-economic aspects. There is a close relationship between “cultural exclusion”, “social exclusion” and “poverty”, as participa-tion in mainstream culture can help reduce poverty levels and reduce social exclusion. For example, individuals may be able to develop skills and trust, improve their level of competitiveness in the labour market and excel in other areas.
Ethnic identity could have both posi-tive and negative impact on the processes of cultural inclusion, for instance influencing ethnic “division of labour” on particular terri-tories. One example comes from the UNAT, where ethnic Greeks are concentrated. The Greeks are involved mainly in intellectual labour: 40 percent of Greeks in Mariupol (3 percent of the city’s population) are “white collar” legislators, higher-level civil servants, managers, professionals, specialists and tech-nical office workers, who are involved mainly in intellectual labour. At the same time, the proportion of “white collars” in the employed population of Mariupol city is less than 37 percent. These indicators are not an excep-tion. Bulgarians in the region (third place in Zaporizhzhia oblast of the UNAT) take up about 30 percent of “white collar” jobs.
The implementation of the Government Programme for the Social and Economic Development of the ARC up to 2017, as well as the Strategy of Socio-Economic Develop-ment of ARC up to 2020 could help in stabi-lizing the ethno-cultural situation in this region in particular. The Programme and the Strategy envisage the following measures to be undertaken in the area of culture: preser-vation, restoration and state registration of monuments of cultural heritage of state and local value; promotion of the right to educa-tion in a native language and creation of proper terms for the educational process through the construction of general and pre-school educational institutions; ensuring the development of the region’s cultural sphere, preservation and enhancement of the existing material and technical base of cultural institu-
tions; providing state support for the devel-opment of the Ukrainian language; support to activities of national cultural associations, and carrying out the restoration and repair of cultural heritage objects.
Exclusion could be also caused by reli-gious beliefs and identities. According to polls conducted by UNDP in 2007 in Crimea, 73 percent of respondents defined themselves as “believers”. There is a wide diversity of churches in the ARC, enabling believers to satisfy their spiritual needs. Meanwhile, opportunities for believers to execute their rights differ in some religious groups, depending on the group size, it solidarity and other factors.
In the ARC, similar to the whole Ukraine, churches were given various opportunities to claim back the property formerly belonging to communities, as well as to educate clergy, conduct services and missionary activities.The number of temples increased by 16.5 times in the period of 1991–2007, though it may still correspond to only 50 percent of the needs. Although there are educational establishments for the main religions, nearly all confessions lack well-educated clergy to cover the whole territory of the ARC. Reli-gious beliefs in Crimea coincide to a large extent with ethnic identities: 72–78 percent of Russians and Ukrainians attribute them-selves to the Orthodox Christianity, and 94 percent of Crimean Tatars – to Islam.
The relationship between the state and the church is a separate issue: some religious groups formulate their own agenda towards the state officials, some even blame authori-ties of favouritism towards other confessions, corruption and lack of coherent state policy in this area. Several issues have been raised by representatives of various confessions, and especially of Islam with regard to the slow return of property.
There are cases when some religious groups blame others in manipulating the legislation, thus gaining advantage and extra resources for development. There is certainly a need to work out a coherent policy with regard to the development of the religious sphere. Such a policy is especially important, because changes in the “spiritual sphere” and the structure of religious organizations are rapid, and many factors have a signifi-cant impact on their dynamics. These factors include, among others, clashes and contro-versies within particular religious groups over the leading role in Ukraine (or in a region), presence and missionary activity from abroad, significant dependence of confessional situa-tion from policies conducted by local authori-
UNDP_magazine_ENG_v10j.indd 47UNDP_magazine_ENG_v10j.indd 47 04.07.2011 17:40:1904.07.2011 17:40:19

CHAPTER 3. EXCLUSION FROM CULTURAL LIFE AND EDUCATION 48
ties, use of religions by some politicians. There-fore, some tendencies among various religious groups may deepen the exclusion of their adherents and limit access to education and cultural assets in Ukraine.
Exclusion from Education
Exclusion in education is a result of the restriction of access of certain people or whole groups to educational resources. Inequality of educational opportunities and unavail-ability of education for different categories of the population can be considered a social problem since it also relates to social fair-ness and equality. At the same time, educa-tion availability is defined not as the ultimate goal but as an important factor in ensuring social integrity and stability. Experts from the Organisation for Economic Co-operation and Development (OECD) define equality in education as the existence of an educational environment in which individuals can consider their options and make life choices taking into account their own talents and skills, and not on the basis of stereotypes, prejudiced hopes and discrimination. In such an educational envi-ronment, economic and social opportunities are provided regardless of gender, ethnicity, race or social situation.5 6 7 8 9 10
Traditional educational models already cannot satisfy the needs of a continuously evolving socio-cultural environment. For example, people with special needs face discrimination in relation to access to, active participation in and successful comple-tion of education at all levels. A new inclu-sive educational model is needed, taking into account multiple disciplines and social aspects of inclusion and linked to many fields, such as social, health care, employ-ment and migration policy, and even policy related to city building and provision of amenities.
In accordance with OECD recom-mendations,6 fairness in the field of educa-tion has two interrelated aspects: 1) equality of opportunities, which means that personal characteristics and conditions (e.g. gender,
5 Meshkova and Zhelezov.6 UN (2008b).7 It is clear that the minimum educational level in Ukraine foresees significantly higher competences. General secondary
education is prescribed by law.8 Citizens of Ukraine are eligible for free of charge education in all state educational institutions regardless of their
gender, race, nationality, social and property stance, occupation, mindset, political party membership, views on religion, confession, health, place of residence and other conditions.
9 Institute for Demography and Social Studies of the National Academy of Sciences of Ukraine and UNICEF (2010).10 Without taking into account extra-mural students.
3.2
socio-economic situation or ethnic back-ground) should not be barriers to the realization of potential in education; and 2) inclusion, which means the existence of a minimum educational level for all people (e.g. proficiency of every person in reading, writing and arithmetic).7 Ensuring the realiza-tion of the right to education by all people is a pre-condition for social inclusion.
The citizens of Ukraine have a wide range of declared rights to education.8 Despite this, there are a number of drivers of exclusion from education, which include the urban-rural divide; disparities in socio-economic development between regions; different household financial capacities; inadequate organization and financial mechanisms in educational institutions; insufficient funds for technical and material provision, for example textbooks and visual aids; incon-sistency between Ukrainian educational methods and international standards; a gap between obtained knowledge and the econo my’s requirements; low wages for pedago gical workers and associated prob-lems with educational institution staff; and more.9
Overall, Ukraine scores fairly high on education indicators (literacy, enrolment rate in secondary education, number of students per 10,000 population). According to HBS 2008 data, 95.4 percent of children aged 15–18 years are students or pupils and 69.5 percent of those aged 15–22 years.10 There are no gender restrictions in accessing any levels of education in Ukraine; among the population enrolled in higher education there is even a gender imbalance in favour of women. Exclusion from education rather occurs in unequal access to high-quality educational services and considerable cross-settlement differentiation of the levels of education.
Pre-school education. The closure of a significant number of pre-school educa-tion institutions (PSEIs) in the 1990s, which was accompanied by an unprecedented decline in the birth rate, is the major reason for a decrease in the level of coverage of chil-dren with pre-school education. In the 1990s, almost 40 percent of state-funded PSEIs were
UNDP_magazine_ENG_v10j.indd 48UNDP_magazine_ENG_v10j.indd 48 04.07.2011 17:40:1904.07.2011 17:40:19

NATIONAL HUMAN DEVELOPMENT REPORT 2011 49
closed, a significant number of them in rural areas owing to the collapse of collective and state farms that funded these.
As a result, 44 percent of school-age child ren, including 33 percent of children in rural areas, do not attend PSEIs in 2010.11 At the same time, in some rural regions PSEIs are half empty. A number of factors contribute to such low enrolment rates: ageing of the rural population; excessively high costs for rural inhabitants of placing a child in a PSEI; and traditions of bringing up children at home before they attend school. However, a signifi-cant share of children from rural areas cannot even attend these institutions as they do not exist – 71 percent of villages with school-age children have no PSEI. In urban areas, there is a shortage of childcare places,12 with from 113 in 1990 to 123 children per 100 spots in 2010. 13
Non-attendance of PSEIs for any reason or attendance of an overcrowded PSEI limits a child’s important starting opportunities. Education of pre-school-age children (five years old), which became obligatory from 2010, is especially important to ensure an equal start in school. In light of the shortage of spots places in PSEIs, general secondary educational institutions provide education to children of pre-school age through special
11 This indicator is at its minimum in Cherkasy and Sumy oblasts (32 percent) and at its maximum (64 percent) in Ivano-Frankivsk oblast.
12 Capacity to increase the number of groups on the basis of operating institutions, which were used widely in previous years, is almost exhausted. As a result, inhabitants of big cities often register their child at birth in a queue to secure a spot in a PSEI.
13 Record-keeping data for children of 6–18 years of age. Record keeping is a function of education authorities. 88.3 percent of chil-dren complete secondary education in general secondary education institutions, 4.7 percent in vocational education institutions and 5.9 percent in central branches of higher education institutions of all accreditation levels in 2010/11 academic year.
groups. In some instances, children visit tradi-tional PSEIs temporarily (for a few hours).
Almost 40 percent of childcare institu-tions are located in modified and adapted buildings and therefore do not have the needed infrastructure. Only 4 percent of them have swimming pools. An absence of necessary equipment hinders children’s balanced development, which is especially important in the context of an increase of hypodynamia and child morbidity. Private or privileged institutions remain unaffordable for the majority of families.
General secondary education. According to the legislation, general secondary educa-tion is mandatory and free of charge in Ukraine. Coverage could be considered complete: 99 percent of children aged 6–18 years are enrolled.13 However, a general decrease in the number of school-age children in rural areas, combined with underdevelopment of the road and transport network, has led to the spread of ungraded schools, which do not organize students formally according to age-based grade levels.
These schools appear to provide a lower quality of education due to poor quality of teaching materials. In addition, in each second village with children of 7–17 years of age there are no schools.In such a case,
Number of Places in Pre-school Educational Institutions and Number of Children, 1991–2010 (thousands)
Source: State Statistics Committee of Ukraine.
3.1FIGURE
UNDP_magazine_ENG_v10j.indd 49UNDP_magazine_ENG_v10j.indd 49 04.07.2011 17:40:1904.07.2011 17:40:19

CHAPTER 3. EXCLUSION FROM CULTURAL LIFE AND EDUCATION 50
children should be provided with public transportation to go to school. Although a special state programme “School Bus” was adopted, each 10th pupil in rural areas is not covered by it due to constant lack of funds, a high number of broken and old vehicles, and absence of hard surface roads.
The lack of suitably qualified teachers and material and equipment is considered as barriers to accessing modern education for Ukrainian children and teenagers, espe-cially in rural areas. In the 2010/11 academic year, only 57.5 percent of general secondary educational institutions have an internet connection, including 45.11 percent of those in rural areas. A full computerization and informatization of general secondary schools would help to decrease the influence of the “geographical distance factor” and narrow the “digital gap” among children, and in particular to overcome the challenges facing children and teenagers from rural and moun-tainous regions and from small towns.
Specialized schools, high schools, lyceums and colleges provide education of much higher quality. These mostly charge fees for studies. These institutions are located mainly in big cities, where inhabitants have significantly higher incomes. As a result, 75.6 percent of respondents estimated that their children’s opportunities were equal to those of other children in the same settlement (6.5 percent estimatedthat they were worse); when comparing them with the opportuni-ties of the majority of children in the country, 65.8 percent considered them equal and 15.5 percent worse.14 15 16
Social tensions among teenagers caused by a desire to be popular among children of the same age were considered an impor-tant element of exclusion by 34.0 percent of respondents. Problems of exclusion of children based on ethnic features, particu-larly displays of discrimination on the side of teachers, are much less acute: 52.2 percent of respondents felt there was no such problem in Ukrainian schools (Table 3.1).
14 Social Exclusion Survey (2009).15 Social Exclusion Survey (2009).16 Institute for Demography and Social Studies of the National Academy of Sciences of Ukraine (2007).
Communication and patterns of sociali-zation among children are not limited by ethnic, religious or cultural boundaries. In parti-cular, 34.7 percent of children communicate constantly with children of another ethnic origin, 33.2 percent with children of another reli-gion and 9.1 percent with immigrants.15 Preju-dices are spread more among older groups and are often related to perceived risks to the health and development of their children resulting from communication (first of all studying), such as with children with disabilities.
Vocational education. The vocational education system could make a positive contri-bution to Ukraine’s economic development by educating and training indivi duals to join the labour market. It continues to play an impor-tant role in the inclusion of vulnerable catego-ries of youth in public life, such as orphans and children in state care. At the end of 2010, these two categories amounted to 30.7 percent of students enrolled in vocational educational institutions, including orphans and children in state care – 4.3 percent; half-orphans – 17.0 percent; individuals with physical and mental disabilities – 1.4 percent; teenagers from low-income families – 7.4 percent; and teen-agers from “problem families” – 2.5 percent.
At the same time, vocational education appears to fail training vulnerable groups of the population sufficiently to integrate them fully into the labour market and thus ensure their social inclusion. Curricula are often not aligned with the needs of potential employers and changing markets; as a consequence, many vocational schools train people for fields where job opportunities are rare.
Higher education. There are no institu-tional obstacles to obtaining a higher educa-tion in Ukraine. The Constitution of Ukraine stipulates that citizens have the right to a free higher education in state and communal higher education facilities, on a competitive basis within higher education standards, if they obtain a certain level of education and qualification at the first time.
The higher education system in Ukraine is constantly developing, ensuring that more youth can access and benefit from it every year. Despite existing popular views pointing to the contrary, higher education institutions are as accessible for rural youth in Ukraine as for urban youth.16 Rural inhabitants have the choice of both future profession and educational institu-tion. However, the lower quality of secondary education in rural areas negatively affects the
Displays of Prejudice towards Children in the Education System
Almost 40 percent of parents consider it unacceptable for children with HIV/AIDS to attend general schools and 30 percent of parents believe children with disabilities should not attend general schools.
3.2BOX
UNDP_magazine_ENG_v10j.indd 50UNDP_magazine_ENG_v10j.indd 50 04.07.2011 17:40:1904.07.2011 17:40:19

NATIONAL HUMAN DEVELOPMENT REPORT 2011 51
chances of being admitted to higher education institutions for rural residents.
Differences in levels of incomes and market relationships have resulted in inequalities in access to professional educa-tion. Currently, a significant part of the population has to cover their own tuition and other related expenses. The majority of the population faces challenges in doing so. Whereas a total of 38.4 percent of the popu-lation admitted a shortage of personal funds for nutritional needs; 35 percent for housing payments; 57.9 percent for medical services; and 58.8 percent for purchasing clothes, 62.2 percent highlighted a shortage of personal funds for educational payments.17 Households with low incomes cannot afford to pay for education for themselves or their children.
The poverty level among those who are too short of funds to obtain a professional education is 1.6 times higher than the average in Ukraine. In general, according to the BHS, in 2009 6.4 percent of households suffered from a shortage of funds to obtain any profes-sional education, in particular 7.5 percent of households in big cities; 3.9 percent of households in small towns; and 6.3 percent of rural households. Therefore, accessi bility of professional education declines with the size of a settlement. Rural households are the most excluded on the basis of shortage of funds to obtain a professional education
17 State Statistics Committee of Ukraine (2006).
Exclusion of Street Children from Education
4 percent of youth aged 10–19 years living and working on the streets have never visited school (the largest number is among the youngest); the majority of street children do not have education documents (certificates or diplomas); 57 percent of children older than 15 years do not have basic secondary education; 86 percent of those aged 18–19 years do not have a secondary education. There are also no specialized programmes for this category of children.
3.3BOX
Exclusion of Orphans from Education
Orphans often do not have the opportunity to study owing to the prejudice of educational institutions and to poverty (“They did not want to accept me in school. They told me that there are no places, there are no rooms in dormitories”; “I did not receive any help in the school and there were no free meals”; “I had to go and make efforts to obtain what I am eligible for”; “I was told that people like me are a burden for them”; “We strove to obtain clothes for three months […] we received it in February […] almost the whole winter we were unclothed”; “They saw that I am from a boarding school and refused […] They were scared as they should provide me with a dormitory and privileges”).
3.4BOX
Assessment of Major Social Problems of School Environment, 2009 (%)
Assessment of the problem
Very serious
Serious enough
Not very serious
Not serious at all
Problem does not exist
No answer Do not know
Low quality of education 16.4 23.2 20.4 8.9 27.4 1.2 2.40Poor equipping of school classrooms, absence of necessary educational materials
16.4 28.6 18.3 11.3 23.0 1.4 0.9
Cruelty, violence 7.2 15.5 14.8 13.4 46.6 1.0 1.4Hooliganism 9.1 21.3 18.8 15.9 31.9 1.6 1.4Drugs 12.6 13.8 10.1 7.9 48.7 2.6 4.4Discipline in classroom 12.0 23.0 23.2 17.1 22.3 1.0 1.2Social tension among teenagers caused by desire to be popular among peers
9.1 25.3 21.5 11.7 26.2 1.9 4.4
Ethnic intolerance among children 5.4 11.0 14.3 11.7 52.5 1.2 3.8Discrimination on side of teachers 6.3 14.8 15.0 12.6 47.1 1.4 2.8Crime and violence in neighbourhood of school (on school territory)
7.2 16.1 15.2 12.0 43.5 1.7 4.4
Other 63.6 27.3 - 9.1 - - -Source: Social Exclusion Survey (2009).
3.1TABLE
(43.1 percent), even though their share within the structure of households is equal to 30.8 percent (Table 3.2). Rural residents face a 1.5 time higher risk of not obtaining a profes-sional education than the average popula-tion in the country and a twice higher risk than that faced by urban inhabitants.
UNDP_magazine_ENG_v10j.indd 51UNDP_magazine_ENG_v10j.indd 51 04.07.2011 17:40:1904.07.2011 17:40:19

CHAPTER 3. EXCLUSION FROM CULTURAL LIFE AND EDUCATION 52
Education of adults. Both systems of life-long education and traditions of individual educational and professional development of adults are underdeveloped in Ukraine. Overall, the population has limited skills in informational technology and telecommu-nications and poor proficiency in foreign languages. As a result of demographic proces ses, the share of older groups, who usually have out-dated know ledge, is increasing constantly. Therefore, leveling of educational opportunities for all people should become one of the tasks of post-graduate education.
Exclusion of Roma population from education. The problem of education of the Roma population is a critical one.18 Just 0.02 percent of Roma in Ukraine have a higher education; 4 percent have a complete general secondary education; 17 percent have basic general secondary education; and 49 percent have a general primary education.19
Poor educational outcomes of Roma chil-dren are the results of unsystematic school attendance; ignorance of individual and home assignments; and lack of parents’ awareness of the importance of quality educati on to the success of their children. Low skills and knowledge result also from the mobility of the Roma population, which means that chil-dren change schools frequently.20 Interviews with Roma parents with children of school age identified the following reasons for poor school attendance: 1) financial difficulties, including the need to make additional out-of-pocket payments at school (66 percent); 2) children disliking attending school (36 percent); and 3) the fact that it is difficult for them to study at school as they do not understand many subjects and concepts (34 percent). In the context of a general antipathy to Roma children, there is a lack of special programmes and interventions to help Roma to succeed in school.
18 Kuras Institute of Political and Ethnic Studies of the National Academy of Sciences of Ukraine (2008).19 Osaulenko (2004).20 Ukrainian Institute of Social Studies.
Differences in Inaccessibility of Professional Education by Settlement Size, 2007 (%)
Distribution by settlement size of households Risk of impossibility of obtaining professional education owing to lack of funds, compared with average All Unable to obtain professional education owing to lack of funds
Big city 43.3 30.9 71.7Small town 25.9 23.7 91.5Village 30.8 45.4 146.5Total 100.0 100.0 100.0
Source: Institute for Demography and Social Studies of the National Academy of Sciences of Ukraine.
3.2TABLE
Exclusion of children with disabilities from education. Exclusion from education of chil-dren with disabilities results from an old prac-tice of educating them in specialized insti-tutions. Since such institutions are located mostly in big cities, children residing far from such centers are often unable to attend them. In particular, 185 specialized pre-school insti-tutions are concentrated mainly in oblast centres. The 30 PSEI that have special groups operate in just 9 regions of the country in 2010.
Only 55 percent of children and teena-gers with physical or mental disabilities attend school. Overall, as of September 2010, 28,623 school-age children (6–18 years of age) have physical or intellectual disabili-ties and do not obtain a general secondary education in Ukraine. Out of that number, 33.5 percent claim health reasons where 0.8 percent quotes other reasons. A total of 0.6 percent study without getting a general secondary education and 65.1 percent study in specia lized institutions for children with intellectual disabilities. This creates barriers to the develop ment of these children and at the same time leads to exclusion of their parents from different areas of public life.
The architectural, educational and communication environment in many higher education institutions of the country remains non-accessible for students with disabilities, constituting a major barrier for them to obtain a higher education. In particular, their architectural configuration prevents access, appropriate sanitary and hygienic installations are absent, curricula and programmes are not modified and methodological support is inadequate to address the needs of this group of learners (e.g. distance learning is underdeveloped). Another important set of barriers deals with perceptions. Some teachers at mainstream schools wrongly believe that the integration
UNDP_magazine_ENG_v10j.indd 52UNDP_magazine_ENG_v10j.indd 52 04.07.2011 17:40:1904.07.2011 17:40:19

NATIONAL HUMAN DEVELOPMENT REPORT 2011 53
of children with disabilities in school would disadvantage other children, who would not receive enough attention from teachers, which, in its turn, would negatively affect their perfor mance.
ConclusionsLarge-scale changes in the structure and
the nature of cultural activities and leisure of citizens have taken place in Ukraine since independence. Modernization and accelerated cultural changes, especially when they take extreme forms, may have a serious impact on traditional cultural values, and this, in its turn, may strengthen exclusion of certain groups of population.
There are vast and sometimes striking discrepancies in forms of leisure and patterns of cultural consumption between the rich and the poor, which create, to some extent, a threat to social harmony and consolidation. These discrepancies, caused by economic gaps in the society, lead to a gap in access to culture; thus, some groups become excluded from the cultural life due to low income (and low capacities to purchase “cultural goods”), distance from cultural centres, poor educa-tion and other factors.
The cultural environment of Ukraine is not sufficiently inclusive of the cultural diversity that is created by the presence of a number of nationality groups. Socio-economic chal-lenges and inadequate state policy create barriers to cultural inclusion and even lead to cultural discrimination against certain groups. Differences in cultural practices in the capital, oblast centres and rayons also create barriers to cultural inclusion for many groups and individuals.
Language is among the important factors to determine cultural exclusion of some groups of population in Ukraine. This relates above all to the language policy, and the status and conditions of studying and
using different languages. Ukraine witnesses fervent debates over the status, learning and use of the Russian language in the country, as well as languages of other ethnic minority in particular regions.
Exclusion from education is a consequence of unequal access of the population to high-quality educational services. The following drivers of exclusion from education include: inequality in access to high-quality education determined by place of residence; insufficient level of inclusion in mainstream education for children and young people with special needs; low levels of material and technical equip-ment and staffing of educational institutions and also underdevelopment of infrastructure; and limited financial capacity of households to cover expenses associated with high-quality professional education.
Barriers to inclusion exist mostly for socially vulnerable groups or at risk groups (children and young persons with disabili-ties; orphans and children in state care; half-orphans; children and teenagers from low-income and “problem” families; repre-sentatives of national minorities; people living with HIV; the homeless, etc.). Inhabit-ants of rural areas also experience exclusion from education, primarily related to the larger scarcity of educational institutions, issues of transportation to these institutions, lower quality of educational services.
Exclusion from Education of Children with Disabilities
Limited access of children and youth with disabilities to education is a key issue that needs to be addressed to ensure their full inclusion in society. There are limited opportunities for children with disabilities to gain a high-quality professional education or professional skills, including self-education and self-improvement during life within chosen activities as well as opportunities to realize acquired knowledge and skills on the labour market, mainly because of an absence of proper infrastructure (not only educational) and special opportunities in educational programmes.
3.5BOX
UNDP_magazine_ENG_v10j.indd 53UNDP_magazine_ENG_v10j.indd 53 04.07.2011 17:40:1904.07.2011 17:40:19

CHAPTER 3. EXCLUSION FROM CULTURAL LIFE AND EDUCATION 54
UNDP_magazine_ENG_v10j.indd 54UNDP_magazine_ENG_v10j.indd 54 04.07.2011 17:40:1904.07.2011 17:40:19

NATIONAL HUMAN DEVELOPMENT REPORT 2011 55
C H A P T E R
4 Exclusion from Economic Life
An objective analysis of economic exclusion is usually rendered difficult by the presence of informal economy, remittances, and poorly targeted and ineffective social transfers. Exclusion from economic life is studied in three main areas that characterize access to a means of livelihood and a level of living standards: partici-pation in the labour market; incomes; and housing conditions.
Exclusion from the labour market. Economic activity (whether in the form of entrepreneurship activity or employment) gives economic status and purchasing power to an individual who, as a conse-quence, can have access to wide opportu-nities for human development. Economic activity and employment are funda-mental human rights and major means of preventing poverty and social exclusion.In Ukraine, as in many countries of the world, the highest risks of exclusion from to the labour market and employ-ment exist for the following groups:• The unemployed, especially the
long-term unemployed;• A few categories of the e conomically
inactive population, in particular those who have stopped looking for a job having lost hope of finding one (“those who have lost faith”);
• The employed with non-standard labour contract conditions or a specific nature of work which makes them socially vulnerable.
Exclusion related to the labour market and employment is analysed using the following indicators: • Unemployment levels, disaggre-
gated by locality type, gender, age group and educational level;
• Share of the overall number of the unemployed who: 1) have lost their jobs for economic reasons; 2) are searching for their first job and have not worked for a long period of time; and 3) have been unemployed for 12 or more months;
• Share within the economically inac-tive population of those who have “lost faith” and similar categories;
• Share within the employed popu-lation of: 1) employees of low-technology and low-productivity sectors of the economy; 2) persons with vulnerable employment status (including those not working on confirmed daily or weekly basis); 3) employees without a perma-nent contract; 4) the self-employed; 5) those employed within the informal sector; and 6) represen-tatives of the basic and low-paid professions;
• Share of persons who are not certain that they will be able to keep their job even in the near future;
• Socio-psychological characteristics of job conditions: 1) self-assessment of relationships with colleagues and managers; 2) gender equality in terms of career promotion; and 3) access to higher positions and higher remuneration.
Exclusion due to low income. Insuffi-cient income, leading to low purchasing power, to meet fundamental needs is traditionally considered as the main manifestation of economic exclu-sion. Such a definition corresponds to the definition of monetary poverty under the relative or the absolute crite-rion, since a poverty line is the level of income or expenditure below which a person is considered to be living in poverty. Consequently, households are
UNDP_magazine_ENG_v10j.indd 55UNDP_magazine_ENG_v10j.indd 55 04.07.2011 17:40:1904.07.2011 17:40:19

CHAPTER 4. EXCLUSION FROM ECONOMIC LIFE 56
considered excluded on the basis of incomes if they live below the national poverty line. The relative poverty line in Ukraine is determined as 75 percent of the median level of aggregate expenditures calcu-lated per one adult. This line was equal to UAH835 per capita per month in 2009. In other words, if a household’s income (calculated per one adult) is lower than UAH835, this household is considered economically excluded on the basis of income level. Thus, in 2009, 26.4 percent of householders were considered as excluded. Exclusion due to poor housing condi-tions. The availability of suitable housing which is the fundamental
Unemployment in Ukraine, 2000–2010 (Average per Year)
2000 2005 2006 2007 2008 2009 2010
Number of unemployed registered by the state employment service, thousands
1,178.7 891.9 784.5 673.1 596.0 693.1 452.1
Number of unemployed according to ILO standards, thousands
2,655.8 1,600.8 1,515.0 1,417.6 1,425.1 1,958.8 1,785.6
Ratio of registered unemployment to actual unemployment, %
44 56 52 47 42 35 25
Source: State Statistics Committee of Ukraine.
4.1TABLE
Unemployment Levels by Age, 2010 (%)
Source: State Statistics Committee of Ukraine.
4.1FIGURE
human right of all depends on the level of incomes of individuals or households and their purchasing power. The more settled in an employment a person is, the more chances for a stable income he or she may have to access to satis-factory housing conditions. The key characteris tics of exclusion due to poor housing conditions are: • Absence of separate housing for a
family;• Dilapidated conditions of existing
housing (in need for major repair);• Insufficient size of living area or insuf-
ficient number of rooms;• Absence of basic amenities; • Absence of funds to maintain
housing and pay for utilities.
UNDP_magazine_ENG_v10j.indd 56UNDP_magazine_ENG_v10j.indd 56 04.07.2011 17:40:1904.07.2011 17:40:19

NATIONAL HUMAN DEVELOPMENT REPORT 2011 57
Exclusion from the Labour Market
The unemployed. The eradication of unemployment in the Soviet Union was considered as a big achievement. Employ-ment in the public sector was mandatory for all able-bodied citizens. However, a natural result of full employment was low produc-tivity of the labour force. Market transforma-tions led to dramatic changes in the area of employment. Between the Censuses of 1989 and 2001, the size of the active labour force shrank. The number of employed decreased by 8.7 million people and the share of the employed in the overall population went from 50 percent to 36 percent.1
The national legal definition of “unem-ployed” is stricter than that of the Interna-tional Labour Organization (ILO) as a result of different age limits (16–55 years of age for women and 60 years of age for men) and the need to confirm absence of personal income and to register at the state employment service. Even though all people have the right to use the informational and advisory services provided by this state employment service free of charge, not all unemployed persons as per ILO’s definition can obtain official unemployment status in Ukraine. For example, those searching for a job for the first time and those who do not have a profession, including graduates of general secondary schools, are not classified as unemployed, if, several times in a row, they refuse to partici-pate in professional training and reject paid jobs. The rural population faces additional barriers to obtain official unemployed status.2
Although generous unemployment benefits can undermine the motivation of the population to look for work and may impose additional pressure on the budget of a country, stricter requirements mean an increased risk of social exclusion for unem-ployed people. The gap between numbers of registered unemployed people and actually unemployed people amounted to around 50 percent during the period of economic growth but decreased in 2010. One quarter of the unemployed now have official unem-ployment status and can benefit from state support (Table 4.1). The unemployment level under ILO stan dards is at 8.1 percent among the economically active population of 15–70 years and 8.8 percent among those of working age, which means that almost each
1 Ministry of Statistics of Ukraine (1992).2 2009 was atypical from this point of view since the economic crisis affected types of economic activities in which
mostly men are employed.
4.1 10th participant of the labour market cannot find a job.
Traditionally, youth are referred to as the most vulnerable group in the labour market. The main barriers to inclusion that this group faces are absence or insufficient working expe rience and lack of experience in searching for a job. The unemployment level of youth aged 15–19 years in Ukraine is 2.7 times higher and of youth aged 20–24 years twice as high as the average for the whole population (21.8 percent, 16.5 percent and 8.1 percent, respectively) (Figure 4.1). Youth aged 15–24 years constitute 26 percent of the total number of the unemployed. Considering the importance of work for young people for their successful socialization, national legislation envisages additional measures to support the creation of jobs for them, but these measures have so far been mostly of an administrative and formal nature.
The unemployment level of women aged 15–70 years (and also aged 15–64 years) is somewhat lower than that of men. Under the national definition of the working age, unem-ployment levels do not have gender diffe-rences. However, among young age groups (15–29) and for people aged 40–49 years, the female unemployment level is higher than the male level, whereas unemployment among men is higher in other age groups. This means that women are discriminated in terms of recruitment when they are at active child-bearing age and pre-retirement . A lower retirement age for women then for men means that women in their 40s already see their prospects of finding employment decrease.
Unemployment level by settlement is analysed on the basis of the ILO method-ology which considers people working on personal subsidiary plots as employed under the conditions of partial sale of their home-grown products. Accounting for this form of employment means that overall unem-ployment levels of the rural population may be significantly lower than those of urban areas. Such work is only a temporary form of employment and cannot fully meet the needs of individuals or households in the long run.
Levels of exclusion from the labour market depend significantly on people’s educational levels (Table 4.2). The lowest level of unemp-loyment is observed among people with complete higher education regardless of
UNDP_magazine_ENG_v10j.indd 57UNDP_magazine_ENG_v10j.indd 57 04.07.2011 17:40:1904.07.2011 17:40:19
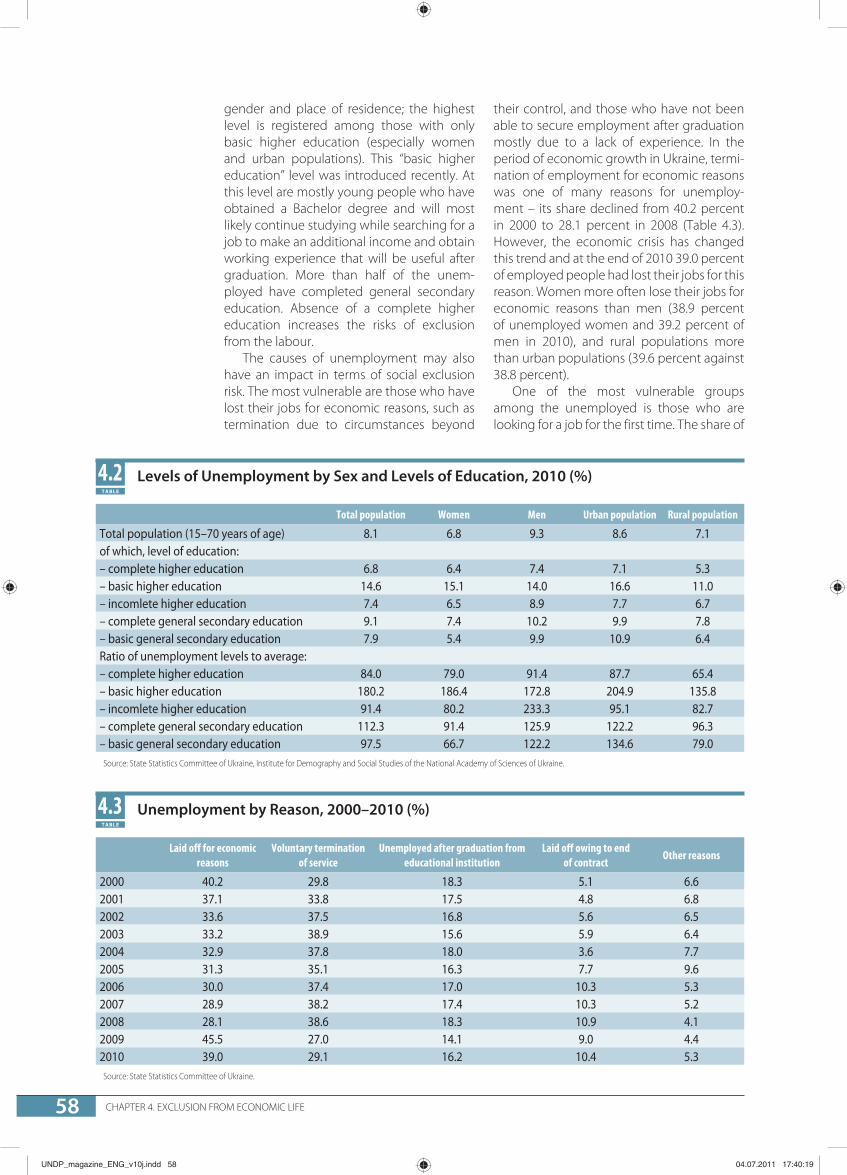
CHAPTER 4. EXCLUSION FROM ECONOMIC LIFE 58
gender and place of residence; the highest level is registered among those with only basic higher education (especially women and urban populations). This “basic higher education” level was introduced recently. At this level are mostly young people who have obtained a Bachelor degree and will most likely continue studying while searching for a job to make an additional income and obtain working experience that will be useful after graduation. More than half of the unem-ployed have completed general secondary education. Absence of a complete higher education increases the risks of exclusion from the labour.
The causes of unemployment may also have an impact in terms of social exclusion risk. The most vulnerable are those who have lost their jobs for economic reasons, such as termination due to circumstances beyond
Levels of Unemployment by Sex and Levels of Education, 2010 (%)
Total population Women Men Urban population Rural population
Total population (15–70 years of age) 8.1 6.8 9.3 8.6 7.1of which, level of education:– complete higher education 6.8 6.4 7.4 7.1 5.3– basic higher education 14.6 15.1 14.0 16.6 11.0– incomlete higher education 7.4 6.5 8.9 7.7 6.7– complete general secondary education 9.1 7.4 10.2 9.9 7.8– basic general secondary education 7.9 5.4 9.9 10.9 6.4Ratio of unemployment levels to average:– complete higher education 84.0 79.0 91.4 87.7 65.4– basic higher education 180.2 186.4 172.8 204.9 135.8– incomlete higher education 91.4 80.2 233.3 95.1 82.7– complete general secondary education 112.3 91.4 125.9 122.2 96.3– basic general secondary education 97.5 66.7 122.2 134.6 79.0
Source: State Statistics Committee of Ukraine, Institute for Demography and Social Studies of the National Academy of Sciences of Ukraine.
4.2TABLE
Unemployment by Reason, 2000–2010 (%)
Laid off for economic reasons
Voluntary termination of service
Unemployed after graduation from educational institution
Laid off owing to end of contract
Other reasons
2000 40.2 29.8 18.3 5.1 6.62001 37.1 33.8 17.5 4.8 6.82002 33.6 37.5 16.8 5.6 6.52003 33.2 38.9 15.6 5.9 6.42004 32.9 37.8 18.0 3.6 7.72005 31.3 35.1 16.3 7.7 9.62006 30.0 37.4 17.0 10.3 5.32007 28.9 38.2 17.4 10.3 5.22008 28.1 38.6 18.3 10.9 4.12009 45.5 27.0 14.1 9.0 4.42010 39.0 29.1 16.2 10.4 5.3
Source: State Statistics Committee of Ukraine.
4.3TABLE
their control, and those who have not been able to secure employment after graduation mostly due to a lack of experience. In the period of economic growth in Ukraine, termi-nation of employment for economic reasons was one of many reasons for unemploy-ment – its share declined from 40.2 percent in 2000 to 28.1 percent in 2008 (Table 4.3). However, the economic crisis has changed this trend and at the end of 2010 39.0 percent of employed people had lost their jobs for this reason. Women more often lose their jobs for economic reasons than men (38.9 percent of unemployed women and 39.2 percent of men in 2010), and rural populations more than urban populations (39.6 percent against 38.8 percent).
One of the most vulnerable groups among the unemployed is those who are looking for a job for the first time. The share of
UNDP_magazine_ENG_v10j.indd 58UNDP_magazine_ENG_v10j.indd 58 04.07.2011 17:40:1904.07.2011 17:40:19
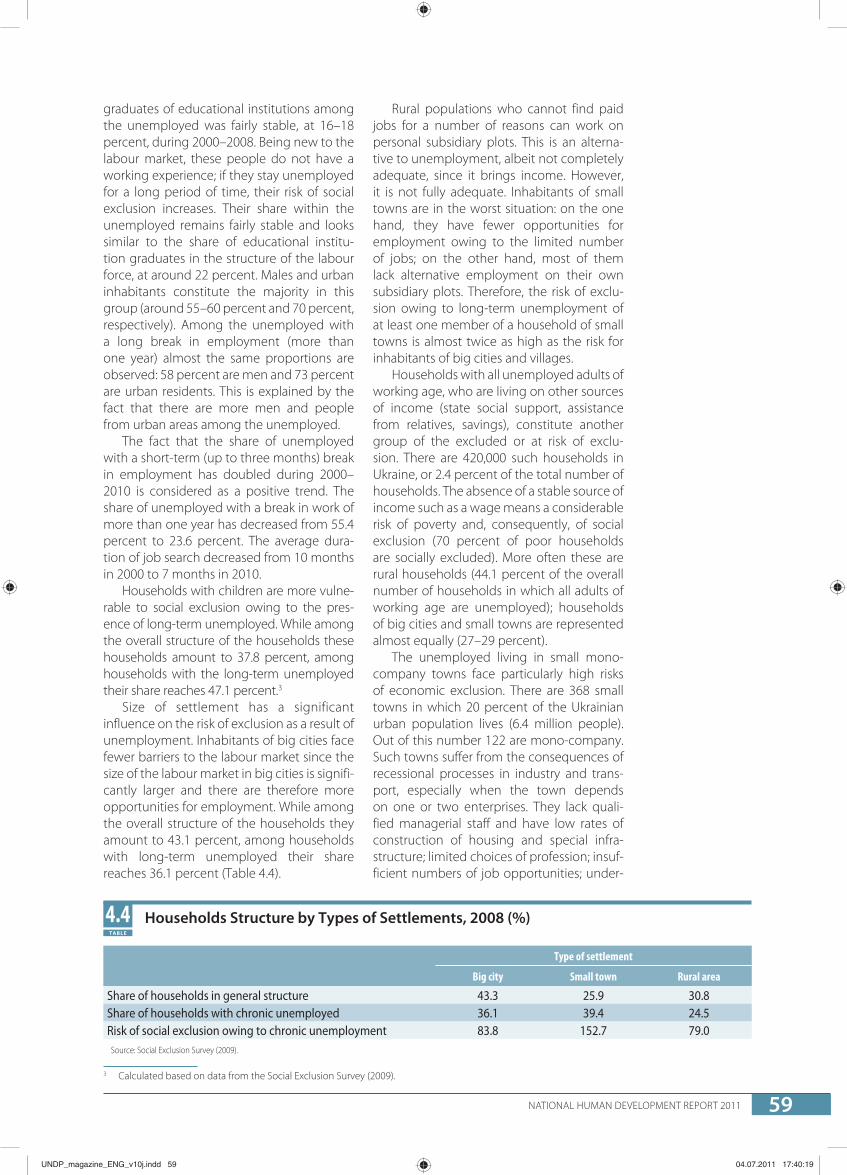
NATIONAL HUMAN DEVELOPMENT REPORT 2011 59
graduates of educational institutions among the unemp loyed was fairly stable, at 16–18 percent, during 2000–2008. Being new to the labour market, these people do not have a working experience; if they stay unemployed for a long period of time, their risk of social exclusion increases. Their share within the unemployed remains fairly stable and looks similar to the share of educational institu-tion graduates in the structure of the labour force, at around 22 percent. Males and urban inhabi tants constitute the majority in this group (around 55–60 percent and 70 percent, respectively). Among the unemployed with a long break in employment (more than one year) almost the same proportions are observed: 58 percent are men and 73 percent are urban residents. This is explained by the fact that there are more men and people from urban areas among the unemployed.
The fact that the share of unemployed with a short-term (up to three months) break in employment has doubled during 2000–2010 is considered as a positive trend. The share of unemployed with a break in work of more than one year has decreased from 55.4 percent to 23.6 percent. The average dura-tion of job search decreased from 10 months in 2000 to 7 months in 2010.
Households with children are more vulne-rable to social exclusion owing to the pres-ence of long-term unemployed. While among the overall structure of the households these households amount to 37.8 percent, among households with the long-term unemployed their share reaches 47.1 percent.3
Size of settlement has a significant influen ce on the risk of exclusion as a result of unemployment. Inhabitants of big cities face fewer barriers to the labour market since the size of the labour market in big cities is signifi-cantly larger and there are therefore more opportunities for employment. While among the overall structure of the households they amount to 43.1 percent, among households with long-term unemployed their share reaches 36.1 percent (Table 4.4).
3 Calculated based on data from the Social Exclusion Survey (2009).
Rural populations who cannot find paid jobs for a number of reasons can work on personal subsidiary plots. This is an alterna-tive to unemployment, albeit not completely adequate, since it brings income. However, it is not fully adequate. Inhabitants of small towns are in the worst situation: on the one hand, they have fewer opportunities for employment owing to the limited number of jobs; on the other hand, most of them lack alternative employment on their own subsidiary plots. Therefore, the risk of exclu-sion owing to long-term unemp loyment of at least one member of a household of small towns is almost twice as high as the risk for inhabitants of big cities and villages.
Households with all unemployed adults of working age, who are living on other sources of income (state social support, assistance from relatives, savings), constitute another group of the excluded or at risk of exclu-sion. There are 420,000 such households in Ukraine, or 2.4 percent of the total number of households. The absence of a stable source of income such as a wage means a considerable risk of poverty and, consequently, of social exclusion (70 percent of poor households are socially excluded). More often these are rural households (44.1 percent of the overall number of households in which all adults of working age are unemployed); households of big cities and small towns are represented almost equally (27–29 percent).
The unemployed living in small mono-company towns face parti cularly high risks of economic exclusion. There are 368 small towns in which 20 percent of the Ukrainian urban population lives (6.4 million people). Out of this number 122 are mono-company. Such towns suffer from the consequences of recessional processes in industry and trans-port, especially when the town depends on one or two enterprises. They lack quali-fied managerial staff and have low rates of construction of housing and special infra-structure; limited choices of profession; insuf-ficient numbers of job opportunities; under-
Households Structure by Types of Settlements, 2008 (%)
Type of settlement
Big city Small town Rural area
Share of households in general structure 43.3 25.9 30.8Share of households with chronic unemployed 36.1 39.4 24.5Risk of social exclusion owing to chronic unemployment 83.8 152.7 79.0
Source: Social Exclusion Survey (2009).
4.4TABLE
UNDP_magazine_ENG_v10j.indd 59UNDP_magazine_ENG_v10j.indd 59 04.07.2011 17:40:1904.07.2011 17:40:19

CHAPTER 4. EXCLUSION FROM ECONOMIC LIFE 60
developed town infrastructure and services; and very low income levels. Employment, as well as social inclusion, in such towns is criti cal issues to address.4
Unemployed people use a range of support mechanisms and services in their job search. In 2010, the most popular methods consist in applying to the state employment service (31.3 percent of the unemployed) and searching through informal social networks – relatives and friends (38.3 percent). Mass media and advertisements and direct contacts with employers are utilized less frequently – 18.2 percent and 10.2 percent, respectively. Private employment agen-cies are utilized very rarely (1.2 percent) (Figure 4.2).
Women and rural inhabitants apply to the state employment service more often when searching for a job (41.0 percent of the overall number of the unemployed vs. 37.5 percent of men). Men tend to rely more on personal
4 State Employment Service (2008).
Unemployment in Small Mono-company Towns: Inhabitant’s View
“Our town is small. There were 15,000 inhabitants here before. As of now there are 9,000. Young people leave the town and head towards big cities as youngsters do everywhere in Ukraine. They do this in order to get educated and obtain a decent job. Not even one factory of seven existing is operational. Children who are good at studying try to leave the town and settle in big cities. Those guys who still stay in Vilkovo can become either fishermen or gardeners, which is not too inspiring for them” (homeroom teacher, Vilkovoschool).
4.1BOX
Distribution of the Unemployed by Way of Finding Job, 2010 (%)
Source: State Statistics Committee of Ukraine.
4.2FIGURE
connections (44.4 percent). Urban and rural inhabitants mobilize personal connec-tions almost equally (38.0 and 39.0 percent), which reflects weak communication systems, limited access to information and low quality of social networks.
The unemployed who have lost faith and who are disoriented. Unemployed people who have lost faith are the most severely excluded of all. They need society’s assistance the most, since they are no longer looking for a job and face exclusion in many other areas as well.
During the period of economic growth, the share of those who had lost hope decreased from 5.3 percent to 1.1 percent of the economi cally inactive population. The economic crisis resulted in an increase of their numbers, so that at the end of 2009 this number had reached 200,000 people, higher by one-fourth than in the first half of 2008. Furthermore, the number of so-called “diso riented” people, who do not know where, and how to search for a job or set up their own business or who are not sure that it is possible to find an appropriate job, has increased. Similary to those who have lost faith in finding employment, the representa-tives of this group are also at risk of social exclusion if they decline entry or re-entry into the labour market. In 2010 the total number of people who had lost faith and were diso-riented amounted to 283,200, or almost 2.3 percent of those outside the labour market. Risks of ending up in this category are 2.5 times higher for rural than urban inhabitants.
UNDP_magazine_ENG_v10j.indd 60UNDP_magazine_ENG_v10j.indd 60 04.07.2011 17:40:1904.07.2011 17:40:19

NATIONAL HUMAN DEVELOPMENT REPORT 2011 61
Contrary to widespread stereotypes, men end up in the category of those who have lost faith and are disoriented 2.7 times more often then women. Interestingly, young people aged 25–34 years who are usually the most competitive in terms of their attitude towards the labour market consider themselves as having lost faith. There may be a number of reasons for this, and one of them is inflated wage expecta-tions. Women aged 40–49 years dominate among women who have lost faith, which once again proves the special vulnerability of pre-retirement age women in relation to the risk of social exclusion.
Low levels of employment. Employ-ment status is among the major factors determining quality of job, productivity of employment and level of earnings. There-fore, non-standard forms of employment, such as partial employment, and/or employ-ment under fixed-term labour contracts and self-employment could create a risk of social exclusion.5 Non-standard employment forms are an indispensable element of a fle xible labour market, creating new job opportu-nities for the population and promoting competitiveness of the econo my’s through labour force optimization. However, weak or absent state regulation of these forms of employment often results in limited social protection and a decrease in earnings.
Forced part-time employment or partial unemployment. The number of part-time employees amounted to 525,900 or 4.8 percent of the total number of perma-nent employees of large and medium-sized enterprises as of the end of 2010. Part-time employment has negative consequences as it does not ensure sufficient income and may drive people to search for additional jobs. Only a small share of people with part-time jobs has chosen this mode of employment deliberately, prioritizing their free time at the expense of a higher income. Mostly, people accept part-time work because they cannot find anything else. Almost three-quarters of part-time employees in Ukraine are women, who most likely have children or other family responsibilities restricting their full-time employment opportunities.
In some circumstances, such as reduc-tions in industry, employers reduce their employees’ work time with their consent or give them unpaid or part-time vacations. Part-time employment can be considered as an efficient alternative (from an economic 5 The EU monitors status of employment using such characteristics. See Fernández-Masías and Hurley (2008) and
European Foundation for the Improvement of Living and Working Conditions (2004).
Employment Problems of Orphaned Children
“When people see that I am from a boarding school, they try to find different reasons to deny me an employment.”
4.2BOX
Employment Problems of the Homeless
“They do not give you a job without registration, even a low-paid one. You also will get a dwelling under no conditions. Even if you agree to a job with the most harmful conditions at a factory, you will get a room in the dormitory after paying a big amount of money” (Oksana, Simferopol).
4.3BOX
Employment Problems of Immigrants
“The biggest problem is preparing documents. I would like to work legally in order to receive a pension afterwards and to pay taxes but the state does not want to accept me. Of course, I need assistance in this. I need such a document that would stop people extorting money from me” (Arthur, citizen of Azerbaijan (he is Armenian), Simferopol).
4.4BOX
and social point of view) to full employment, as it prevents massive layoffs of workers and keeps staff employed. A negative impact, however, is that it reduces incomes and undermines people’s confidence in their job stability. This decreases the social status and increases the risks of economic and social exclusion.
During the transition period, the share of part-time employment increased contin-uously. It peaked at 39.9 percent of staff employees of companies in 1998 (Figure 4.3). Later on, partially because of an improved economic situation and an increase in the demand for labour and partially because of legal restrictions to administrative leave, the share of part-time employment decreased quite rapidly. The lowest level of part-time employment (5.5 percent) was registered in 2007. The economic crisis of 2008–2009 resulted in an increase in forced part-time employment.
In total in 2010, 3.4 percent of employees (363,300 people) in Ukraine were on leave without preservation of wages (on the period of termination of jobs) and 13.6 percent (1,466,800) were shifted to part-time jobs due to economic reasons. Forced part-time employment was widespread in construc-tion (overall 61.4 percent, including those on administrative leave at 20.5 percent and those
UNDP_magazine_ENG_v10j.indd 61UNDP_magazine_ENG_v10j.indd 61 04.07.2011 17:40:1904.07.2011 17:40:19
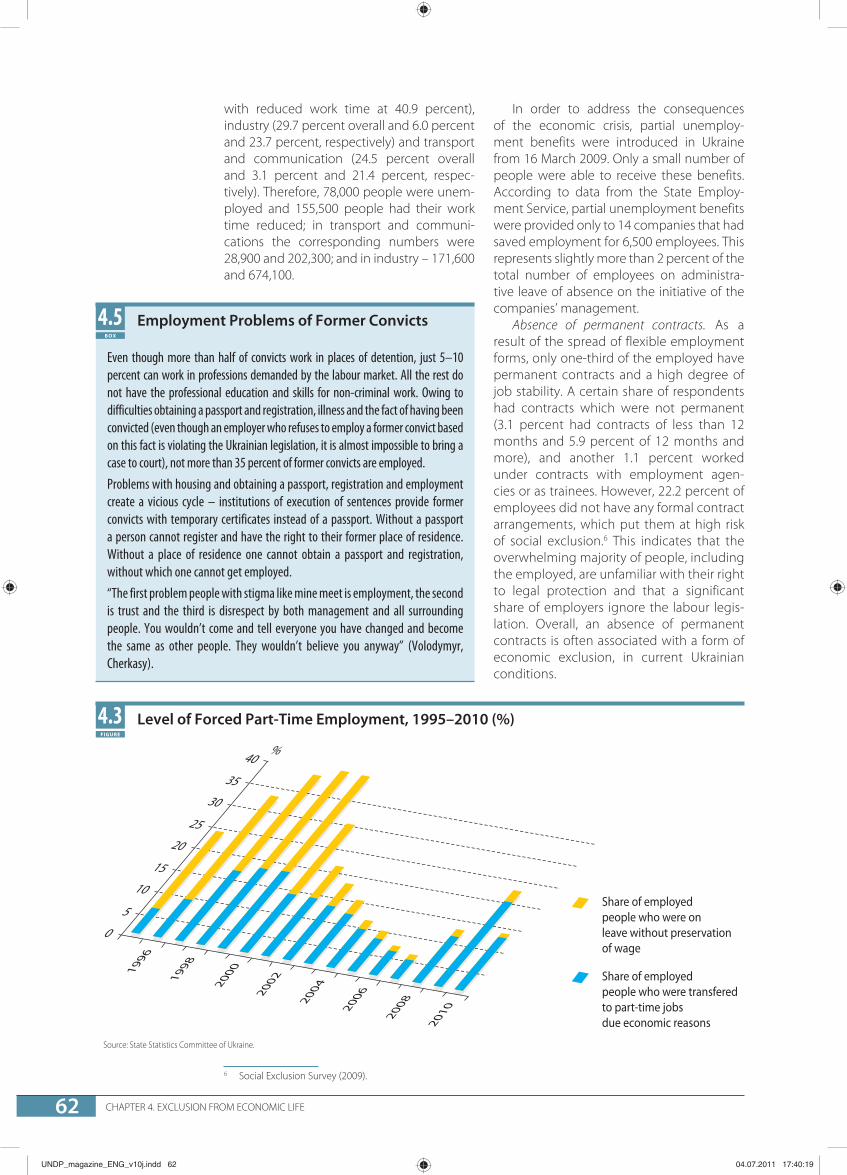
CHAPTER 4. EXCLUSION FROM ECONOMIC LIFE 62
with reduced work time at 40.9 percent), industry (29.7 percent overall and 6.0 percent and 23.7 percent, respectively) and transport and communication (24.5 percent overall and 3.1 percent and 21.4 percent, respec-tively). Therefore, 78,000 people were unem-ployed and 155,500 people had their work time reduced; in transport and communi-cations the corresponding numbers were 28,900 and 202,300; and in industry – 171,600 and 674,100. 6
6 Social Exclusion Survey (2009).
Employment Problems of Former Convicts
Even though more than half of convicts work in places of detention, just 5–10 percent can work in professions demanded by the labour market. All the rest do not have the professional education and skills for non-criminal work. Owing to difficulties obtaining a passport and registration, illness and the fact of having been convicted (even though an employer who refuses to employ a former convict based on this fact is violating the Ukrainian legislation, it is almost impossible to bring a case to court), not more than 35 percent of former convicts are employed.Problems with housing and obtaining a passport, registration and employment create a vicious cycle – institutions of execution of sentences provide former convicts with temporary certificates instead of a passport. Without a passport a person cannot register and have the right to their former place of residence. Without a place of residence one cannot obtain a passport and registration, without which one cannot get employed.“The first problem people with stigma like mine meet is employment, the second is trust and the third is disrespect by both management and all surrounding people. You wouldn’t come and tell everyone you have changed and become the same as other people. They wouldn’t believe you anyway” (Volodymyr, Cherkasy).
4.5BOX
Level of Forced Part-Time Employment, 1995–2010 (%)
Source: State Statistics Committee of Ukraine.
4.3FIGURE
In order to address the consequences of the economic crisis, partial unemploy-ment benefits were introduced in Ukraine from 16 March 2009. Only a small number of people were able to receive these benefits. According to data from the State Employ-ment Service, partial unemployment benefits were provided only to 14 companies that had saved employment for 6,500 employees. This represents slightly more than 2 percent of the total number of employees on administra-tive leave of absence on the initiative of the companies’ management.
Absence of permanent contracts. As a result of the spread of flexible employment forms, only one-third of the employed have permanent contracts and a high degree of job stability. A certain share of respondents had contracts which were not permanent (3.1 percent had contracts of less than 12 months and 5.9 percent of 12 months and more), and another 1.1 percent worked under contracts with employment agen-cies or as trainees. However, 22.2 percent of employees did not have any formal contract arrangements, which put them at high risk of social exclusion.6 This indicates that the overwhelming majority of people, including the employed, are unfamiliar with their right to legal protection and that a significant share of employers ignore the labour legis-lation. Overall, an absence of permanent contracts is often associated with a form of economic exclusion, in current Ukrainian conditions.
UNDP_magazine_ENG_v10j.indd 62UNDP_magazine_ENG_v10j.indd 62 04.07.2011 17:40:1904.07.2011 17:40:19

NATIONAL HUMAN DEVELOPMENT REPORT 2011 63
Self-employment and informal employ-ment. Self-employment in Ukraine is a widely spread legal form of income genera-tion. There were around 579 private entre-preneurs (“physical entities”) per 10,000 of persons registered in Ukraine in 2009. There is however a large portion of persons who work as self-employed but are not registered as such. According to statistical data, there were, in 2010 in Ukraine, a total of 4.6 million people (22.9 percent of the total employed population, almost half of employed rural inhabitants and 11.3 percent of employed urban inhabitants) who were employed in the informal sector. These people are not covered by the labour legislation and the country’s social protection system, and this creates barriers to their economic inclusion. One of the predominant economic activi-ties of those working in the informal sector is running a personal farm with partial sale of outputs on the market. 7 8
Employment in low-skilled jobs. As a result of shifts in the distribution of the employed among sectors, almost one-quarter of all employed people – more than half in rural areas – have unskilled jobs. Such work provides neither acceptable incomes nor proper social status and creates additional barriers to social inclusion for many groups.
Non-stability of jobs not only is under-mining confidence in the future but also represents a barrier to participation in public life. The duration of the term of service is one of the indicators of a stable and attractive
7 Social Exclusion Survey (2009).8 Social Exclusion Survey (2009).
job. At the same time, too long periods of employment in the same position may indi-cate either absence of career development or inability to change job. Half of respond-ents have worked in their current job for not less than five years; 12 percent of those have worked not less than 20 years in their current job (Figure 4.4). A total of 16.8 percent of respondents have been working for a short period, including 7.8 percent working for less than a year.
Less than half of respondents (48.8 percent) consider loss of job unlikely during the next six months. At the same time, 10.2 percent of respondents assessed the probability of loss of job as very high, 26.3 percent admitted that such a probability exists and 12.8 percent of respondents were undecided.7
Lack of savings. A significant share of the employed population does not have suffi-cient savings, which significantly increases the risk of poverty and social exclusion in the case of job loss. In response to the ques-tion “For how long will your savings be suffi-cient in terms of covering current expendi-tures while you search for a new job in case of job loss?”, only 2.5 percent of respondents claimed seven months or more. Another 8.1 percent claimed three to six months and 6.6 percent said two months. At the same time, 30.5 percent said their savings were sufficient for one month and 24.1 percent said they had no savings at all. A significant share of respondents (24.2 percent) was undecided.8 Even though respondents might not have
Distribution of Employed People by Duration of Service at Current Workplace, 2009 (%)
Source: Social Exclusion Survey (2009).
4.4FIGURE
UNDP_magazine_ENG_v10j.indd 63UNDP_magazine_ENG_v10j.indd 63 04.07.2011 17:40:1904.07.2011 17:40:19

CHAPTER 4. EXCLUSION FROM ECONOMIC LIFE 64
been fully honest (responses to questions related to incomes and savings are traditio-nally based towards undervaluation), the level of income from employment is clearly insuf-ficient, as almost all of it is spent on current expenditures and most employed persons cannot accumulate significant savings. Shortage of personal savings can mean that people who have lost their jobs can be forced to agree to any job just to obtain an income as soon as possible, given the lack of time to search for an appropriate job. This means that risk of social exclusion will not decrease even in the case of new employment.
Lack of respect at work. Not only the availa-bility of suitably paid jobs and corresponding status but also a favourable psychological climate at the workplace, particularly linked to the attitudes of colleagues and managers, are highly important for social inclusion. Almost half of employed respondents (47.9 percent) indicate that they do not feel continued respect at the workplace. At the same time, 7.3 percent claim that they feel respect from time to time only and 3.2 percent– never.9 In other words, 10.5 percent of employed respondents lack normal communication at work. In that case, the work does not fulfil its social inclusion function. 10 11
Gender inequality. Formally, the national legislation prohibits any forms of gender (or other) discrimination in the work place; at the same time, it envisages strengthened protec-tion of women who are mothers. There are also restrictions on engaging mothers of chil-dren up to 14 years in business trips, night work, work during the weekends, work on holidays and non-working days and after-hours work, etc. Often, these additional measures of legal protection for women on the labour market along with public beliefs about women’s role in the society result in their higher vulnerability in the labour market, fewer opportunities for career development, lower earnings, etc. One of the major reasons for higher unemployment levels among young women is the long period of maternity and child-rearing leave.
Even though a policy of “releasing” women from housework and engaging them in socially useful activities was declared and implemented during Soviet times, archaic stereotypes of the role and duties of women continue to dominate in present-day Ukraine at the expense of democratic and human
9 Social Exclusion Survey (2009).10 Institute of Demography and Social Studies of the National Academy of Sciences of Ukraine, Ukrainian Centre for Social
Reforms and UNFPA(2009).11 ILO (2004).
development progress. As the Family and Family Relationships Social and Demo-graphic Survey (2009) shows, wives (or other women in households) perform most of the housework in 70 percent of families.10 Archaic stereo types also directly limit opportunities for women’s professional development.
The share of women among legislators, senior managers in the public administra-tion, directors and managers is significantly lower than that of men (6.7 percent vs. 9.2 percent), while their share among repre-sentatives of the elementary professions is noticeably higher (25.4 percent and 22.8 percent, respectively). Even though women in Ukraine have opportunities for career advancement to the highest executive-level positions (women comprise two-thirds of professionals and experts) given their higher educational level, they realize these opportu-nities mostly in the area of education, health care and services, where higher education is a job requirement but earnings are relatively low. Women also face significant obstacles in their career advancement: 9.8 percent of respondents consider that they have higher chances of career advancement in compar-ison with male colleagues and 17.9 percent believe that it is easier to compete against female colleagues (Table 4.5).11
Opportunities for career growth for women in the public administration remain fairly limited. The share of women among civil servants of the highest (first) category is equal to 13.7 percent, of the second category 28.2 percent and of the fifth to seventh categories 70 percent or more (Figure 4.5). The level of women represen-tation among management and decision-making positions of local self-government is even lower: 6–13 percent of women have jobs in the first, second and third position categories; even in the fourth category the share of women is just 29.2 percent. To a large extent, this low representation is because many of the positions in the cate-gories mentioned are elective. This means that there are almost no women among leading local politicians.
To summarize, all the features of the so-called “glass ceiling” effect, which refers to situations where the advancement of a quali-fied person within the hierarchy of an organi-zation is stopped at a lower level as a result of some form of discrimination, are observed with
UNDP_magazine_ENG_v10j.indd 64UNDP_magazine_ENG_v10j.indd 64 04.07.2011 17:40:2004.07.2011 17:40:20

NATIONAL HUMAN DEVELOPMENT REPORT 2011 65
regard to women in Ukraine. Despite the official declaration of gender equality, women actu-ally face significant barriers to their inclusion in employment. These barriers also cause profes-sional and status segregation on the basis of gender and result in women experiencing higher social exclusion risks than men.
Exclusion due to Low Income
Absence of or limited access to mate-rial and social resources negatively affects a person’s opportunities to satisfy basic and other needs and to develop adequately. This often leads to multifa ceted pheno-menon, such as exclusion from social networks or circles. Therefore, in this Report, “poor” is equivalent to “excluded owing to low income”, since poverty is an economic condition of a person or a group which makes it difficult or impossible to satisfy the needs specific to a particular society (food, housing, education, medi-cine, culture, etc.).
4.2
Distribution of Respondents by Evaluation of Personal Career Opportunities in Comparison with Colleagues, 2009 (%)
In comparison with colleagues – men In comparison with colleagues – women
Smaller 10.6 6.6Equal 71.4 65.8Big 9.8 17.9Unknown 8.2 9.7
Source: Calculated based on data of the Social Exclusion Survey (2009).
4.5TABLE
Representation of Women within Authorities by Category, 2010 (%)
Source: State Statistics Committee of Ukraine.
4.5FIGURE
People with limited or absent material resources do not always feel themselves to be excluded since they consider exclusion to be a normal living condition. Feelings of exclu-sion appear when a person feels unsa tisfied, begins to challenge existing norms and values, rethinks aspirations and revalua tes existing needs.
The level of a person’s inclusion from economic, cultural, political and social life is related largely to his/her income level. Often, people’s expectations of material well-being do not match their income-earning oppor-tunities, which can result in behaviour and activities inconsistent with society’s moral values. In the worst case, this can lead to expansion of asocial groups and the emer-gence and deepening of social tensions.
On the basis of a poverty line defined at UAH835.00 per person per month in 2009, 26.4 percent of the Ukrainian popula-tion could be considered as economically excluded.
Households’ exclusion by income level depends on age. Children younger than 16
UNDP_magazine_ENG_v10j.indd 65UNDP_magazine_ENG_v10j.indd 65 04.07.2011 17:40:2004.07.2011 17:40:20

CHAPTER 4. EXCLUSION FROM ECONOMIC LIFE 66
years old (who are not yet able to work) are the most vulnerable to exclusion by income level: their risk of economic exclusion is 2.2 times higher than that calculated for working-age people. People of 80 years of age and older who are already unable to work face a risk of economic exclusion that is twice as high as that for those of working age. The share of economically excluded people decreases for both men and women starting from 35 years of age. The most favourable period of life in terms of economic inclusion is 55–64 years of age for both genders: people are at the peak in their career and also continue working after reaching retirement age (Figure 4.6).
Low pensions, which are the main source of income for the elderly, particularly for those aged 80 years and older, determine their monetary exclusion. As a result of their low financial standing, elderly pensioners are often limited in terms of access to adequate nutrition, medication and health care servi ces, cultural events, travel oppor-tunities, new clothes and home appliances. Limited opportunities to meet the most basic needs at this age can lead to feelings of insecurity and unfairness, and can cause pensioners to develop grievances against society, seeing it as unable to take adequate care of citizens. These feelings can generate to depression and other psychiatric disor-ders, which are related directly to wors-ening health. A vicious circle of exclusion is created, in which low incomes (such as a low pension level) are a starting point, followed by social, political, cultural and other forms of exclusion.
Gender and Age Pyramid of the Excluded due to Low Income, 2008 (%)
Source: Calculated based on data of the State Statistics Committee of Ukraine.
4.6FIGURE
Another important driver of exclusion by income level is the demographic composi-tion of a household, specificaly the presence of minor children. Multiple studies show that low levels of wages do not allow even both employed parents to ensure adequite stand-arts of life for their minor children. Economic exclusion of children is common to house-holds with many children as well as to those with fewer. In particular, 33.1 percent of fami-lies out of 6.5 million families with children have an income lower than the poverty level, according to 2008 data. The share of house-holds living below the poverty line in the 10.7 million of families without children is 19.7 percent. Therefore, households with children experience a 1.7 time higher risk of exclusion by income level than households without children.
The risk of exclusion is proportional to the number of minors in a household. In particu lar, the risk of ending up below the poverty line increases by 30 percent with the appearance of the first child, by 50 percent with the second child and by 60 percent with the third child compared with families without children (Figure 4.7).
Another important factor determining households’ exclusion by income level is the presence of children of up to three years of age. Families that have at least one child younger than three years of age experience almost twice as high a risk of exclusion from public life than childless households, based on data for 2008.
Even when both parents are employed and there are no other adults in the house-
UNDP_magazine_ENG_v10j.indd 66UNDP_magazine_ENG_v10j.indd 66 04.07.2011 17:40:2004.07.2011 17:40:20

NATIONAL HUMAN DEVELOPMENT REPORT 2011 67
hold who are unemployed, almost every fifth household is excluded due to income level. The risk of exclusion of families with children increases if they have at least one pensioner: the risk of obtaining certain goods and accessing servi ces increases by 1.3 times in comparison with the average household, while the presence of at least one unem-ployed person within a family with children increases the probability of exclusion by 1.5 times (Table 4.6).
Low incomes for families with children are a determining factor of such families’ exclu-sion from many spheres of life. Although general secondary education and health care services in state institutions are provided free of charge by law in Ukraine, school supplies such as notebooks, pens and some elements of health care, such as medications, medical equipment, laboratory studies, procedures, etc. are de facto covered by consumers of these services and depend on their finan-cial means. Owing to low incomes, house-holds with children save on adequate nutri-tion, clothes and footwear, preferring cheap goods; abstain from purchasing the neces-sary durable goods, such as furniture and household appliances; are unable to improve their living conditions and maintain housing in an adequate condition; neglect to under-take measures to prevent illnesses or access proper medical treatment; and are excluded from culture and leisure. Аs such, a significant number of families with children are fully or partially excluded of opportunities to be involved in many spheres of the society.
Often, households with low income cannot afford to buy the necessary amount of quality food, which negatively affects children’s health and leads to absence from school and school performance difficulties. This in turn negatively influences the level of a child’s knowledge and can create barriers to higher or other professional educational opportunities. Lack of adequate qualifica-tions and training can force a child to get a job that is elementary and often manual, bringing neither moral satisfaction, nor acceptable earnings. The unavoidable result will be exclusion owing to both low status in the labour market and low income.
Economic exclusion drive, among both parents and minors, developing feelings of unfairness and a loss of meaning, making them unwilling to make efforts to pursue changes in life and to strive for an improve-ment of their situation. Such moods impact on the immediate surroundings (the family) and have the most negative influence on chil-
Share of Excluded Households due to Low Income by Number of Children, 2008 (%)
Source: Calculated based on data of the State Statistics Committee of Ukraine.
4.7FIGURE
Risks of Exclusion due to Low Income of Households of Different Types against the Average, 2008 (times)
Type of households with children Risk of exclusion
All adults are employed 0.98Both employed and unemployed adults are present 1.49All adults are of working age 1.17There are adults of both working and retirement age 1.33
Source: Calculated based on data of the State Statistics Committee of Ukraine.
4.6TABLE
dren, who have still not yet fully develo ped and established their perso nalities. Since a child’s system of values and norms is shaped predominantly by its family, there are two possible reactions:• A child may develop his/her own mind-
set different from the family one. The child may come to the conclusion that it is necessary to work and study hard to achieve something in life. In such a scenario, a child in his/her adult years can be fully involved in public life and socially included.
• A child may develop a perception that there is no need to change anything in life and may accept the restrictions on personal satisfaction that are common to his/her family. In such a case, a child is destined to be socially excluded for the whole of his/her life.Only purposeful, psychologically strong
and resilient persons who were excluded in childhood are able to achieve high status and incomes as adults. To achieve their goals, they need strong motivation, will and skills. Others try to find alternative values, in parti-cular religious ones, to cope with their social exclusion. The majority of socially excluded
UNDP_magazine_ENG_v10j.indd 67UNDP_magazine_ENG_v10j.indd 67 04.07.2011 17:40:2004.07.2011 17:40:20

CHAPTER 4. EXCLUSION FROM ECONOMIC LIFE 68
people remain excluded as a result of a lack of conviction that opportunities for change exist and that they can effect such change, and a concurrent belief that their welfare is the responsibility of someone else. In other words, poverty reproduces poverty and exclusion reproduces exclusion.
However, and despite a decrease in the purchasing power of pensions and deprecia-tion in savings, households of pensioners are more “immune” to poverty. The level of their exclusion by income is relatively low for a number of reasons: 1) the minimum pension size is equal to the subsistence level; 2) house-holds of pensioners usually do not have indi-viduals who do not have their own income; and 3) opportunities exist for pensioners to make an additional income from employ-ment, especially during the first decade after retirement (Figure 4.8).
Risks of Exclusion of Childless Households due to Low Income against the Average, 2008 (times)
Source: Calculated based on data of the State Statistics Committee of Ukraine.
4.8FIGURE
Employment of family members helps preventing social exclusion. Households that comprise working-age people only are 1.8 times better protected from the risks of exclusion by income level compared with the country average. Such households have the lowest risk of exclusion by income level – they represent 34 percent of the average in the country. The highest risk (130 percent of the average and 382 percent of households composed of all working members) is expe-rienced by households with unemployed members. In such cases, the presence of chil-dren does not have a significant importance for exclusion by income level (Figure 4.9).
Exclusion owing to low remuneration levels is perceived by the employed as one of the most acute and as having the most nega-tive consequences in terms of exclusion in other areas. A job has to bring income suffi-cient to satisfy the needs of the employed person and his/her dependants. Conti-nuous inability to visit theatres, museums and cinemas, to travel, to access the neces-sary preventative medical assistance, etc., may lead to depression, low self-esteem and asocial behaviour. Exclusion of the employed from education, for example, prevents them from improving their qualifications which limits their career opportunities and chances of getting a better-paid job.
Higher education of family members is a strong tool for the prevention of social exclu-sion. Families without minors, and with all adults having higher education, experience a risk of exclusion five times lower than an average family.
Share of Households Excluded due to Low Income, by Status in the Labour Market, 2008 (%)
Source: Calculated based on data of the State Statistics Committee of Ukraine.
4.9FIGURE
UNDP_magazine_ENG_v10j.indd 68UNDP_magazine_ENG_v10j.indd 68 04.07.2011 17:40:2004.07.2011 17:40:20

NATIONAL HUMAN DEVELOPMENT REPORT 2011 69
The risk of exclusion of a family with minors is quite high (it exceeds the average by 23 percent), but the presence of at least one person with higher education reduces such a risk by almost half. The same correla-tion is recorded for childless families.
The educational level of the head of household has a significant impact on risks of exclusion, since in most cases the head is recognized as the one who brings in the major share of income to the home (Figure 4.11).
Probability of exclusion by income level is correlated negatively with the size of a settlement. In particular, the risk of exclu-sion by income level is 42 percent higher in rural areas compared with the average and
Risks of Excluded due to Low Income against the Average by Educational Level of the Household Head, 2008 (times)
Source: Calculated based on data of the State Statistics Committee of Ukraine.
4.11FIGURE
Risk of Exclusion due to Low Income against the Average by Presence and Number of People with Higher Education, 2008 (times)
Source: Calculated based on data of the State Statistics Committee of Ukraine.
4.10FIGURE
2.2 times higher than in big cities. Living in the capital decreases the risk of exclusion by 64 percent compared with the average, by 66 percent compared with small towns and by 75 percent compared with rural areas (Table 4.7).
Childless rural households have the lowest risk of exclusion by income level among all rural households (only 1 percent higher than the average), while the risk of exclu-sion of households with children exceeds the average by 71 percent (Table 4.8).
In rural areas, as in the country in general and in urban areas, the number of children in a household is negatively correlated with the income level of the family. When a child
UNDP_magazine_ENG_v10j.indd 69UNDP_magazine_ENG_v10j.indd 69 04.07.2011 17:40:2004.07.2011 17:40:20

CHAPTER 4. EXCLUSION FROM ECONOMIC LIFE 70
appears in a rural household, the risk of exclusion by income level is 1.4 times higher than the average; with the second child the risk becomes 1.9 times higher; and with the third child the risk becomes 2.5 times higher, according to 2008 data.
Thus, rural households have a higher risk of exclusion than urban households, which can be attributed to a number of factors. Urban areas offer better access and a wider selection of educational, medical, cultural, housing and other social services. Meanwhile, exclusion of inhabitants of rural areas is, not only, a result of exclusion from education or employment opportunities owing to under-
Risks of Exclusion due to Low Income against the Average by Size of Settlement, 2008 (times)
Type of settlement Risk of exclusion
Village 1.42Small town 1.05Big city 0.65Capital (Kyiv city) 0.36On average in Ukraine 1.00
Source: Calculated based on data ща the State Statistics Committee of Ukraine.
4.7TABLE
Risks of Exclusion due to Low Income of Different Types of Households against the Average by Settlement Type, 2008 (times)
Household typeRisk of exclusion
Urban area Rural area
Households with children, including those with: 0.97 1.71– One child 0.80 1.43– Two children 1.31 1.90– Three and more children 1.96 2.49Households without children, including those of: 0.60 1.01– Working-age people 0.46 0.83– Working and retirement-age people 0.78 1.31– Retirement-age people, including those of: 0.67 0.93 – 75 years of age and older 0.93 1.26Total 0.80 1.42
Source: Calculated based on data ща the State Statistics Committee of Ukraine.
4.8TABLE
Exclusion due to Income – Evidence from Orphaned Children
”We have no winter clothes and footwear. Well, we also don’t have summer clothes either […] But we don’t have money to buy bare essentials”; “[…] lonely, without housing, job […] how to live, what to eat”; “significant financial problems, we often starve”; “If we ate a baguette and drank milk a day, this was really good […] we lived in park for two weeks”; “[…] neither clothes, nor food […] visit friends to eat at least”; “After leaving [boarding school] there was no place to live, we spent nights at front doors. We experience many things”.
4.6BOX
developed infrastructure in such areas, but also is due to a lack of funds and time. Low incomes, obtained mostly through personal subsidiary plots and through own produc-tion, are insufficient even to cover the travel expenses needed to reach the closest town with more developed infrastructure. Absence of opportunities to access adequate jobs, cultural life, health care and housing services in rural areas contribute to the emergence among rural inhabitants of feelings of social isolation, hopelessness and exclusion from public life, arising mainly because of their place of residence.
Exclusion due to Poor Housing Conditions
Although access to housing is determined by economic considerations, in particular the purchasing power level, the importance of adequate housing and of providing citizens with housing is no longer just an economic issue – it has become a political one for already some time. A common practice in Ukraine is forced cohabitation of several generations in the same room: low incomes,
4.3
UNDP_magazine_ENG_v10j.indd 70UNDP_magazine_ENG_v10j.indd 70 04.07.2011 17:40:2104.07.2011 17:40:21

NATIONAL HUMAN DEVELOPMENT REPORT 2011 71
combined with the high cost of housing and a shortage of so-called social housing, prevent families from living separately. Housing was and remains one of the main preconditions of social inclusion: for most people renting is not a reasonable long-term alternative. This owes largely to the underdevelopment of the housing market. Therefore, lack of separate housing (at least a room in a house or apart-ment) is an indication of exclusion.
The absence of adequate housing directly affects various aspects of life, such as mental and overall health, working capacity and a person’s social security. There are two major problems in Ukraine related to housing: 1) availability of separate housing for individual households in urban areas; and 2) the level of comfort of housing in rural areas (housing with minimum amenities). Households also suffer from insufficient living space and absence of separate rooms for all members. Meanwhile, a significant number of house-holds cannot maintain their place of resi-dence or pay for utilities, as a result of low incomes. Therefore, the main characteristics of exclusion due to poor housing conditions are as follows: absence of a separate dwelling for a family; housing in poor condition; insuf-ficient living space or number of rooms; absence of amenities; and insufficient funds to maintain housing.
More than half the country’s households (55 percent) are excluded due to housing conditions. Around one-third (29.6 percent) of these are poor. The average age of the head of such households is 50 years. Around 39 percent of these households who face exclusion live in big cities, around 37 percent in rural areas and the rest in small towns.
Households experience exclusion mainly through shortage of funds for urgent repairs (around 26 percent), absence of basic ameni-ties (over 20 percent) and shortage of money to pay for communal services and keep the house warm during the heating season (over 16 percent). Therefore, households are excluded not only because they lack sepa-rate housing but also because housing is of low quality and funds to maintain it are short (Figure 4.12).
Absence of separate housing or insuf-ficient size of existing housing force people to live in an environment that is harmful to their emotional well-being. Such conditions have an especially negative impact on multi-generational families, with conflicts arising between those of different agesas a result of a lack of living space and privacy. Chil-dren who witness family conflicts subcon-
Living Conditions of Street Children
Street children live mostly on the streets, in railway stations, in bus stations (36 percent) and in temporary ill-fitted out housing (23 percent).“On the roof […] I don’t need a house. I am on the road all the time. Well, maybe I need a house in winter, when it’s too cold” (girl, commercial sex worker,16 years old).
4.7BOX
Living Conditions of Orphaned Children
“The endless story with documents […] they refuse to recognize me as an orphan […] but I was in an orphanage from four days old […] then I was in boarding schools […] I have never seen my mother.”“I was unregistered from the flat when my mother got imprisoned. […]They sent me to the boarding school. […] My aunt remained in the flat. […] She doesn’t want to register me now. She leases the flat.”
4.8BOX
Living Conditions of the Homeless
“We often spend nights in basements; it is very warm there because heating pipes are there. Sometimes we spend nights at the front doors of big houses on the outskirts of residential districts. There are also crash pads on roofs but it is too windy there and people started to lock roofs” (Oleg, Simferopol).“I lived on the streets for the whole year, I got food from dumps. It is difficult to live like this but it is possible. Street people advised me where I could find better food, in what places. I slept in hen houses or at front doors. I got ill with something, I cough all the time and my body is itching. I want to take a bath very much” (Enver, Simferopol).
4.9BOX
Living Conditions of Former Convicts
“Many of us have no place to live” (Eduard, Simferopol).“He got free but had no place to go. Such people don’t know how to live further on. State assistance is also needed. There is a need for places where a person like this could spend a night or live for some time” (social worker, Spodivannia charitable foundation, Zaporizhzhia).
4.10BOX
Living Conditions of Immigrants
“Our friend rented a flat for us and all eight of us live there together” (Nariman, citizen of Armenia, Zhytomyr).“We were promised this at the migration station. Living conditions are poor. They provide rations which are so horrible that there is nothing normal to eat. Shower rooms are not operational. Rooms are overcrowded” (Serge and KhindaValeri, citizens of Cameroon, Odesa).
4.11BOX
UNDP_magazine_ENG_v10j.indd 71UNDP_magazine_ENG_v10j.indd 71 04.07.2011 17:40:2104.07.2011 17:40:21

CHAPTER 4. EXCLUSION FROM ECONOMIC LIFE 72
sciously perceive such situations as normal and socially acceptable. Married couples postpone child-bearing until they are able to move to a separate apartment. Finally, frequent household conflicts contribute to divorces and family break-ups.
It is important for a comfortable life that each family member has a separate room, but this problem has not been resolved for many families in the country. More than one-third of households have a shortage of rooms and 15.8 percent have two and more people per room. On average, there are 0.98 rooms per person in Ukraine. More than one-third of households have less than one person per one room and 28.4 percent have one person (Figure 4.13).
Share of Households by Key Characteristics of Exclusion due to Housing Conditions, 2007 (%)
Source: Calculated based on data of the State Statistics Committee of Ukraine.
4.12FIGURE
Distribution of Households by Number of Persons per One Room (%)
Source: Calculated based on data of the State Statistics Committee of Ukraine.
4.13FIGURE
The availability of a sufficient number of rooms is also one of the main factors influ-encing the stratification of the population by housing conditions. According to the results of a module survey, all family types indi-cated that they suffered from an insufficient number of rooms. This concerns households with many children in both urban and rural areas (45.3 percent of households with many children in urban areas have an insufficient number of rooms in their house and 42.6 percent in rural areas).
A low share of the population (3.3 percent of households) lives in dormito-ries or in communal flats, mostly young families (average age of the head is 35–36
UNDP_magazine_ENG_v10j.indd 72UNDP_magazine_ENG_v10j.indd 72 04.07.2011 17:40:2104.07.2011 17:40:21
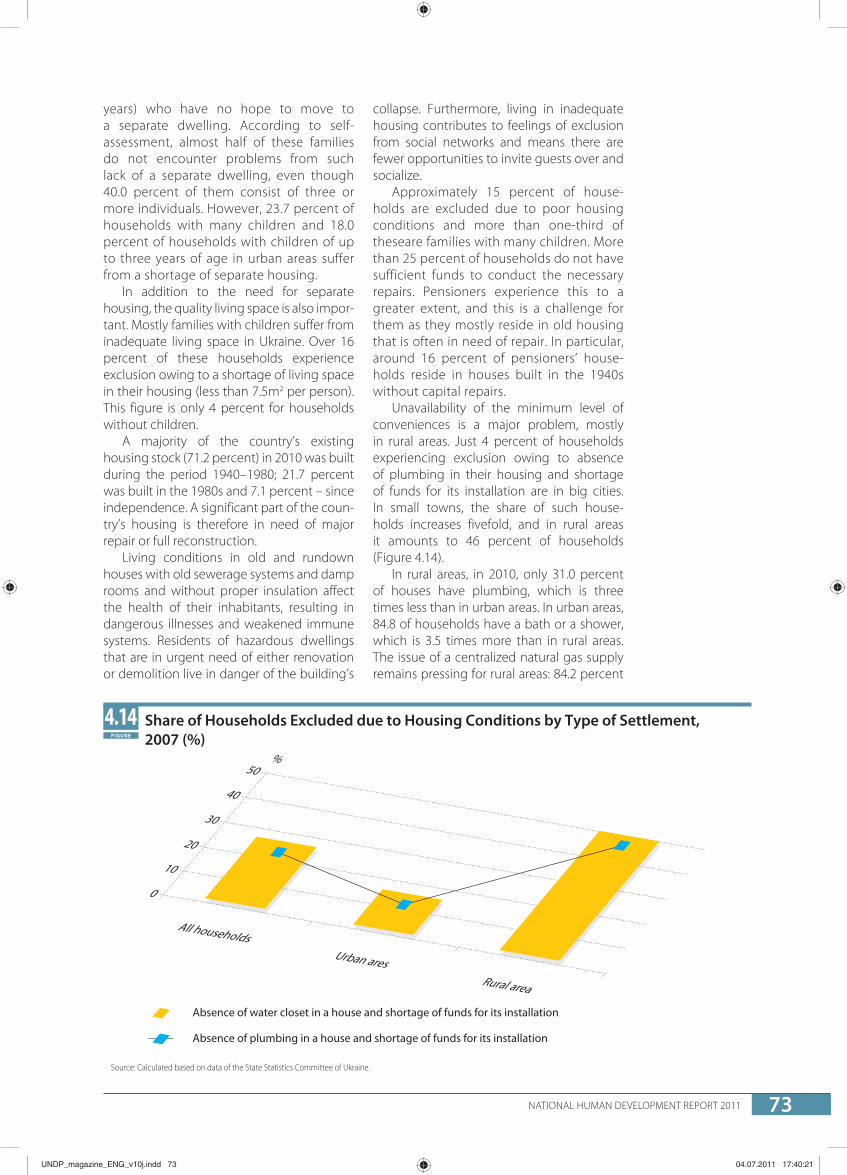
NATIONAL HUMAN DEVELOPMENT REPORT 2011 73
years) who have no hope to move to a separate dwelling. According to self-assessment, almost half of these families do not encounter problems from such lack of a separate dwelling, even though 40.0 percent of them consist of three or more individuals. However, 23.7 percent of households with many children and 18.0 percent of households with children of up to three years of age in urban areas suffer from a shortage of separate housing.
In addition to the need for separate housing, the quality living space is also impor-tant. Mostly families with children suffer from inadequate living space in Ukraine. Over 16 percent of these households experience exclusion owing to a shortage of living space in their housing (less than 7.5m2 per person). This figure is only 4 percent for households without children.
A majority of the country’s existing housing stock (71.2 percent) in 2010 was built during the period 1940–1980; 21.7 percent was built in the 1980s and 7.1 percent – since independence. A significant part of the coun-try’s housing is therefore in need of major repair or full reconstruction.
Living conditions in old and rundown houses with old sewerage systems and damp rooms and without proper insulation affect the health of their inhabitants, resulting in dangerous illnesses and weakened immune systems. Residents of hazardous dwellings that are in urgent need of either renovation or demolition live in danger of the building’s
collapse. Furthermore, living in inadequate housing contributes to feelings of exclusion from social networks and means there are fewer opportunities to invite guests over and socialize.
Approximately 15 percent of house-holds are excluded due to poor housing conditions and more than one-third of theseare families with many children. More than 25 percent of households do not have sufficient funds to conduct the necessary repairs. Pensioners experience this to a greater extent, and this is a challenge for them as they mostly reside in old housing that is often in need of repair. In particular, around 16 percent of pensioners’ house-holds reside in houses built in the 1940s without capital repairs.
Unavailability of the minimum level of conveniences is a major problem, mostly in rural areas. Just 4 percent of households experiencing exclusion owing to absence of plumbing in their housing and shortage of funds for its installation are in big cities. In small towns, the share of such house-holds increases fivefold, and in rural areas it amounts to 46 percent of households (Figure 4.14).
In rural areas, in 2010, only 31.0 percent of houses have plumbing, which is three times less than in urban areas. In urban areas, 84.8 of households have a bath or a shower, which is 3.5 times more than in rural areas. The issue of a centralized natural gas supply remains pressing for rural areas: 84.2 percent
Share of Households Excluded due to Housing Conditions by Type of Settlement, 2007 (%)
Source: Calculated based on data of the State Statistics Committee of Ukraine.
4.14FIGURE
UNDP_magazine_ENG_v10j.indd 73UNDP_magazine_ENG_v10j.indd 73 04.07.2011 17:40:2104.07.2011 17:40:21

CHAPTER 4. EXCLUSION FROM ECONOMIC LIFE 74
of housing in urban areas is provided with centralized gas supply whereas in rural area this figure is 52.4 percent. Modern tech-nology foresees an orientation towards other energy sources but this is not spread widely in Ukraine.
Even when rural residents have the finan-cial resources to maintane or improve their housing, they depend on the local admini-stration, since provision of rural population with utilities falls under the competence of village companies and village councils. Often, the local administration does not have the necessary technical capacity for the centrali zed provision of such services.
Almost half of rural inhabitants expe-rience exclusion due to the absence of amenities in their home and a shortage of funds to install them. Households with many children are most affected in this regard. According to data from the Ukrainian Demo-graphic and Health Survey,12 68.8 percent of households in urban areas and 5.7 percent of households in rural areas use a toilet which discharges water into the sewerage system, whereas 18.6 percent of households in urban areas and 79.6 percent of households in rural areas use a bunker with a cover. Such sanitary conditions increase the risk of serious infec-tious diseases. 13
A lack of sufficient financial resources to maintain one’s housing is becoming more
12 Ukrainian Centre for Social Reforms, State Statistical Committee of Ukraine, Ministry of Health of Ukraine and Macro International Inc. (2008).
13 Size of payment for housing and communal services is determined depending on the number of people in a household and the housing area.
critical for exclusion as the costs of housing and communal services are increasing at a higher rate than households’ incomes, which can be attributed mostly to a sharp increase in gas prices (Table 4.9). The most important factor of exclusion relates to the availability of funds to ensure a normal temperature in the house and to pay for housing and communal services.
The biggest issue faced by urban inhabi-tants is an insufficiency of funds to maintain their housing. Unlike in rural areas, where private houses dominate, urban residents who live in multi-apartment houses have to cover the costs of maintenance of the house and surrounding areas (these expen-ditures include more than 20 servi ces, which are provided by housing and utility companies). The amount of expenditures depends on the number of members in the household, the duration of its tenure and the type of ownership. Households with many children suffer most, since their payments are higher13 and they have fewer resources. Meanwhile, pensioners and families with many children residing in rural areas often do not have sufficient resources to cover heating expenses to maintain a normal temperature in their dwelling. Almost one-third of such families are unable to ensure a normal temperature during the heating season.
Share of Households Suffering from a Shortage of Funds to Maintain Housing, 2007 (%)
Type of householdShortage of funds to maintain normal
temperature in heating season
Shortage of funds for timely and full payment of housing and necessary services
for maintenance
Urban areas Rural areas Urban areas Rural areas
Households with children, including those with:– One child 12.6 18.4 16.4 12.8– Two children 15.3 16.8 20.5 11.8– Three or more children 18.3 30.3 34.4 24.8– Children up to three years of age 11.8 20.0 21.8 14.1– Adults of both working and retirement age 13.8 17.2 17.0 11.3– Adults of working age 13.1 20.1 17.4 14.3– All adults employed 13.9 19.9 17.9 12.3– Both employed and unemployed adults 12.7 17.2 17.1 13.1
Households without children, including those with:– All members employed 12.2 20.6 15.4 15.3– Allmemberspensioners 19.3 18.0 17.8 8.8– Lone pensioners 21.8 19.2 19.4 10.2
Source: Calculated based on data of the State Statistics Committee of Ukraine.
4.9TABLE
UNDP_magazine_ENG_v10j.indd 74UNDP_magazine_ENG_v10j.indd 74 04.07.2011 17:40:2104.07.2011 17:40:21
NATIONAL HUMAN DEVELOPMENT REPORT 2011 75
Conclusions
The issue of exclusion from a country’s economic life is a crucial one as it attracts a variety of other interlinked exclusions. Economic exclusion takes place when an individual cannot enter the labour market and perform economic activities to generate an income. Exclusion of an individual on the basis of housing conditions is a direct conse-quence of economic exclusion.
The following groups are among the groups with the highest risk of being unem-ployed: young people, especially graduates of educational institutions searching for their first job; women of active child-bearing age (20–29 years old) or of pre-retirement age (older than 40 years of age); those who have lost their jobs for economic reasons (structural unemployment); and those who have expe-rienced a long-lasting interruption in work. Risks of economic exclusion, through unem-ployment or lack of employment opportuni-ties, is significantly higher for rural inhabitants and inhabitants of small mono-company towns, people without higher education and representatives of almost all marginal groups (labour migrants, former convicts, homeless people, etc.). Those who have been in long term unemployment and have “lost faith” in finding work are particularly excluded. Risks of exclusion related to gender inequality in employment are reflected in the professional segregation of women into lower-paid types of economic activities. Non-standard forms of employment, such as partial employ-ment, employment under fixed-term labour contracts and self-employment are forms of employment which can, also, create exclu-sion risks.
26.4 percent of the Ukrainian population who are living below the official poverty line have an insufficient purchasing power and
can be considered as economically excluded. The main groups at risk of economic exclu-sion owing to low income are households with children, especially those with many children and with children of up to three years of age (regardless of their number and the presence of older children); households consisting only of pensioners, especially those aged 75 years and older; households with unemployed persons; and households with no persons with higher education.
Exclusion due to low income has special features for each of the most vulnerable groups, since priority needs are different for people of different ages and statuses. Low incomes of households with children create significant barriers to access to education and health care services as well as leisure and recrea tion. Low incomes of people aged 80 years and older, for whom pensions are the major source of income, mean limited capacity to satisfy their most important basic needs, such as adequate nutrition, proper medical assistance and social services. With at least one unemployed member, a household has to limit its food consumption; forgo opportunities to improve qualifications and skills or pursue a different profession; limit or cancel participa-tion in cultural events and travel; for go some necessary preventative or medical treatment, etc. The rural population, whose land plots’ production may not always be realized as cash sales, can also be severely excluded from the country’s public and social life.
Finally, more than half the country’s households are excluded due to housing conditions; around one-third of these are poor. Households experience exclusion mainly through shortage of funds for access to separate housing, urgent repairs, absence of basic amenities and shortage of money to pay for communal services and keep the house warm during the heating season.
UNDP_magazine_ENG_v10j.indd 75UNDP_magazine_ENG_v10j.indd 75 04.07.2011 17:40:2104.07.2011 17:40:21

CHAPTER 4. EXCLUSION FROM ECONOMIC LIFE 76
UNDP_magazine_ENG_v10j.indd 76UNDP_magazine_ENG_v10j.indd 76 04.07.2011 17:40:2104.07.2011 17:40:21

NATIONAL HUMAN DEVELOPMENT REPORT 2011 77
C H A P T E R
Exclusion from Health Care and Social Protection Systems, Social Networks and Means of Communication5
When real opportunities to satisfy needs in terms of social protection, health care and communications are absent or limited, some people can become socially excluded. One group of barriers to social inclusion is objective and does not depend on individuals. This includes such factors as underdeveloped social infra-structure or its non-uniform distribution across regions; inadequacy of communications infrastructure; and low quality of social services. Another group of barriers is specific to individuals or groups of people, and includes such characteristics as low individual incomes; physical disabilities; or personal views and beliefs.
Social exclusion is a relative category and it relates largely to the level of inequality in society. If inequality is significant, perceptions of social exclusion among vulnerable groups are sharper. Individuals may tend to blame the state for failing to protect them from economic and social hardships and exclusion. These feelings and expectations were often formed under the Soviet system as a result of its deep-rooted paternalistic orienta-tion. Such expectations of the state as a provider of unlimited support are difficult to justify in a market economy.Exclusion from the health care system. The health care system in Ukraine has not been changed organizationally since Soviet times. It is financed from budget revenues, predominantly taxes. Mandatory medical insurance has not been introduced. Despite constant growth in expenditure in this sector in absolute terms, the sector‘s ratio to GDP remains low. A resource intensive hospital infrastructure, combined with the low quality of services and wide-spread informal payments, and limited accessibility of services for some groups of population are some of the features of the current system. Exclusion related to health care has two aspects: restrictions of access to services and restriction of abilities to take part in day-to-day activity and exclusion as a result of poor health. There are four main barriers to inclusion in the health care system: 1) economic (insufficient household incomes to cover the necessary health care expen-ditures); 2) physical (medical institu-
tions, services and medications not within physical reach); 3) discrimina-tional (when services are available de jure but inaccessible de facto for some people); and 4) qualitative (low quality of services owing to a lack of highly qualified specialists and the necessary equipment). When a person has poor health, he or she may face multiple barriers to inclusion, such as discrimi-nation in employment and access to education; absence of specialized mobility equipment and infrastruc-ture adjusted to facilitate movement (or other actions) for individuals with limited physical ability; and prejudiced attitudes on the part of other people.Exclusion from the social protection system. The social protection system in Ukraine reflects a Soviet legacy. The system is broad and, so far, poorly targeted which results in an overburdening of the state budget due to the scale of social transfers. The population groups in need of social protection and social assistance are not covered adequately by the system owing to a lack of information about the social support programmes and the low size of social assistance. Due to the apparent ineffectiveness of the system, the popula-tion tends to be dissatisfied with its scope and quality.There is a wide range of barriers to accessing social protection, which include limited budget allocations that are insufficient to provide all types of assistance prescribed by legislation, low size of benefits and their unfair distribu-tion. Some legislative and policy barriers also limit access to social protection for
UNDP_magazine_ENG_v10j.indd 77UNDP_magazine_ENG_v10j.indd 77 04.07.2011 17:40:2104.07.2011 17:40:21

CHAPTER 5. EXCLUSION FROM HEALTH CARE AND SOCIAL PROTECTION SYSTEMS, SOCIAL NETWORKS AND MEANS OF COMMUNICATION78
some vulnerable groups. Providers often do not have sufficient capacity to deliver services effectively and efficiently or to customize them to the needs of specific vulnerable groups. Some groups and individuals are unaware of the social assistance programmes for which they are eligible, which represents another barrier to their inclusion. 1 Exclusion from social networks and means of communication. The political and economic transformation in Ukraine led to new forms of relationships between private and public organizations, groups and individuals and ultimately shaped the country’s social capital in terms of networks and norms of civic engage-ment. Social capital can be defined as the build up of relationships among actors
1 Spellerberg (2001).
(individuals, groups and organizations) that create the capacity to act for mutual benefit or a common purpose.1 A lack of opportunities to participate in the life of society can result in people loosing trust in political, public and economic institu-tions, which undermines their ability to solve problems. The social capital of a nation is built on the values of human dignity, respect and friendship, and takes into account prin-ciples of tolerance, willingness to help and mutual support. The establishment of social connections and the provi-sion of access to social networks and to means of communications are impor-tant. In this respect, many vulnerable groups face barriers to communication and inclusion into social networks.
Restrictions of Access to Medical Goods and Services Owing to Insufficiency of Funds, 2007 (%)
All h
ouse
hold
s
Urba
n ho
useh
olds
Rura
l ho
useh
olds
Hous
ehol
ds w
ith
child
ren
Hous
ehol
ds
with
out c
hild
ren
Funds are insufficient to pay for emergency medical services on paid basis (under condition whereby getting free services is difficult)
23.3 22.1 25.9 19.3 25.7
Funds are insufficient to pay for services of hospitals (under condition whereby getting free services is difficult)
24.1 24.1 24.2 19.6 26.9
Funds are insufficient to buy medications and medical devices prescribed by doctor 23.4 23.1 24.1 19.4 25.9Funds are insufficient to pay for services of a dentist (under condition of usage of cheap materials) or cheap prosthetic dentistry
21.1 21.4 20.4 18.6 22.7
Funds are insufficient to pay for services of in-patient departments (hospitals) without performing surgery (under condition of getting free services)
26.8 27.3 25.5 22.8 29.2
Source: State Statistics Committee of Ukraine.
5.1TABLE
Households with a Member Unable to Access Medical Services as a Share of Total Number of Households with Members in Need of Medical Services, 2010 (%)
Average in countryHouseholds
Urban Rural With children Without children
Access medical assistance and purchase medications and medical equipment
14.9 15.9 12.7 13.5 15.9
Purchase medications 11.4 11.9 10.2 10.4 12.0Purchase medical equipment 1.1 0.8 1.7 1.3 1.0Visit a doctor 6.9 7.0 6.7 7.7 6.4Visit a dentist 4.6 4.9 3.8 5.7 3.9Prosthetics 3.6 4.2 2.1 2.9 4.0Conduct medical examination 5.8 5.7 6.0 5.6 6.0Access treatment 3.3 3.4 3.2 3.3 3.4Accesstreatment in the in-patient department 3.1 2.9 3.7 2.9 3.3
Source: State Statistics Committee of Ukraine.
5.2TABLE
UNDP_magazine_ENG_v10j.indd 78UNDP_magazine_ENG_v10j.indd 78 04.07.2011 17:40:2104.07.2011 17:40:21
NATIONAL HUMAN DEVELOPMENT REPORT 2011 79
Exclusion from theHealth Care System
Limited availability and accessibility of health care services. Health is one of the basic human rights necessary for the realization of other rights. To ensure this right is observed, it is important to provide access to health care services for everyone without discrimination.
Although the Constitution of Ukraine guarantees the right to receive free of charge health care services in state and communal medical institutions, access to health care is de facto restricted by level of income, social status and place of residence. These barriers mean that the risks of deteriorating health conditions, reduced work capacity and early mortality are increasing.
Inequality of incomes and poverty are some of the most critical barriers to services’ access. Despite the guarantee of free health care services, many citizens are forced, in the case of illnesses, to pay out of their own pockets for medications, other necessities, hospital stays and even some medical services. Private hospital charges can reach such high levels that even those with a medium income level cannot afford them. A number of health care services provided by state institutions are claimed to have also become fee-based.
The wide-spread practice of patients paying for health care services in the cash directly to medical personnel decreases utili-zation of the health care system by some share of population. Poor people are often unable to pay for private doctors, who usually provide a higher quality of service than state-funded health care institutions, or to pay out of pocket to doctors in public clinics in order to receive higher-quality services.
According to survey data, in Ukraine in 2010, 14.9 percent of households with members who required medical assistance were not able to receive it, for a number of reasons.2 Respondents claimed “the cost of a visit” (37.3 percent) as the biggest barrier to accessing a medical doctor followed by the response “queues” (23.6 percent). Less significant barriers identified were “I did not know where to go” (18.7 percent) and “the distance to doctor/clinic/medical centre” (18.1 percent).3 4
According to HBS 2008 data, 80 percent of households who were unable to receive health care services, 99 percent of house-holds who were unable to visit a dentist and
2 State Statistics Committee of Ukraine (2010). 3 Social Exclusion Survey (2009).4 State Statistics Committee of Ukraine (2009).
5.1 96 percent of households who were unable to receive treatment in a hospital indicated the extremely high cost of health care serv-ices as the main reason. Lack or limited finan-cial resources are thus the main reason for exclusion from health care. Other barriers exist too: 10 percent of respondents pointed to an absence of specialists (16 percent in rural areas) and 9 percent named very long queues.
Almost one-quarter of households with members needing medical assistance claimed that they experienced a lack of funds to pay for emergency medical serv-ices. Almost the same share of households indicated that there was a lack of health care institutions or drug stores close to their place of residence (Table 5.1).
Barriers also relate to the purchase of medi-cations; in particular, in 2010 75.6 percent of households that were not able to access the necessary health care services were not able to purchase medications owing to their high cost or because they were not in stock (Table 5.2).
Access to health care services depends on type of residence. In rural areas, there is a chronic shortage of mobile services, qualified medical personnel, good roads and ambu-lances. Around 9,000 villages do not have any medical institutions. Rural health care institu-tions such as rural mobile clinics and medical and obstetric centres are understaffed, with a share of unfilled vacancies of over 20 percent.
For many people the distance to medical institutions is also a barrier. Two-thirds of households (62 percent) that do not have medical institutions or pharmacies close by are rural, which is three times higher than in urban areas. Furthermore, the costs of transportation related to medical assistance are often excessive for rural inhabitants, who have a lower level of monetary income compared with urban inhabitants.
In general, in 2009 14.2 percent of house-holds in the country claimed that there was a shortage of medical institutions close to their home and 18.7 percent of households had experienced a shortage of emergency medical services. Among these households who face shortages of emergency medical services, 76 percent are households from rural areas; in big cities, such households represent only 7 percent of the total.4 Remoteness of health care institutions in rural areas is often a result of irrational decisions as to their loca-tion. Around 6 percent of rural inhabitants
UNDP_magazine_ENG_v10j.indd 79UNDP_magazine_ENG_v10j.indd 79 04.07.2011 17:40:2204.07.2011 17:40:22

CHAPTER 5. EXCLUSION FROM HEALTH CARE AND SOCIAL PROTECTION SYSTEMS, SOCIAL NETWORKS AND MEANS OF COMMUNICATION80
have to travel 3–10km, if they need medical assistance. 5 6 7 8
High level of public distrust in the health care system is common for Ukraine. Around one-fourth of those interviewed (24.9 percent) strongly believe that the domestic health care system was not able to provide the necessary services. Only a very small group of respondents (6.1 percent) firmly believed in the system’s capacity to meet their needs.
Exclusion owing to poor health. A signi-ficant share of Ukraine’s population has health issues. Poor health conditions are influen ced by a wide variety of factors, such as an unhealthy lifestyle, bad habits, igno-rance related to personal health and hygiene,
5 Data from the Ministry of Health of Ukraine for 1990–2008.6 Social Exclusion Survey (2009).7 Social Exclusion Survey (2009).8 State Statistics Committee of Ukraine (2010).
Street Children – Challenges in Accessing Health Care
Each second individual (53 percent) among children and young people living on the street does not have a medical history sheet or does not know where it is. The vast majority believe that most likely they will face an unfriendly attitude on the part of medical personnel as their friends have had negative experiences when trying to get services.
5.1BOX
Children with Disabilities – Problems in Accessing High-quality Medical Services
Children with disabilities face difficulties related to regular hospitalizations; medical institutions not having the necessary equipment, medications and nutritional inputs; and the practical impossibility of obtaining regular and free of charge psycho-prophylactic and psychotherapeutic services, which are often needed not only by children with disabilities themselves but also by other family members.
5.2BOX
Problems Accessing Medical Services for the Homeless
“I often fall sick but we try to wash ourselves more often. The problem is to find a place to wash our clothes. This a big problem for us because scabies can nest in dirty clothes. We cannot get a medical examination” (Oleg, Simferopol).
5.3BOX
Health Issues of the Homeless
The following illnesses are widespread among the homeless: alcoholism (60 percent), drug addiction, mental disorders, tuberculosis (50 percent), hepatitis (37.5 percent) and HIV/AIDS.
5.4BOX
unfavourable environmental conditions and harmful working conditions.
The number of illnesses registered for the first time per 100,000 people increased by 11.7 percent during the 1990–2008 period, and the general morbidity level for this period increased 1.5 times, from 110,500 to 181,300 cases per 100,000 people.5 Around 70,000 illnesses diagnosed for the first time are registered in Ukraine annually. Currently, there are 1.8 illnesses per person on average. An analysis of indicators of the dynamics of primary and general morbidity in Ukraine during recent years shows that the level of registered pathologies among the popula-tion has increased and, correspondingly, so has the risk of deteriorating health conditions and working capacity.
More than 22 percent of Ukrainians consider their health condition bad or very bad, 38.7 percent average, 28.7 percent good, 6.0 percent very good and 4.0 percent excellent.6 A total of 24.9 percent of respon-dents answered affirmatively to the question “Do you have an old illness or severe injury which restricts your activities in any way?” (in this context, “old” means an illness that has caused problems for some time or has influenced well-being at any time).
According to the Social Exclusion Survey (2009), 11.6 percent of those with children of up to 18 years of age responded that their children had experienced restrictions to their physical activity for health reasons during the previous six months, including 2.6 percent who indicated that these restrictions were significant. A total of 8.7 percent of respondents said that their chil-dren had had chronic illnesses or health issues for more than six months.
People who have health issues appear to face most barriers in accessing medical (39.9 percent) and social protection services (19.8 percent). They face fewer barriers when they deal directly with state institutions (13.5 percent) and look for work (13.1 percent). An insignificant share of respondents with health issues face barriers to inclusion in educational institutions (3.0 percent).7
According to self-assessments of health, 34 percent of those interviewed had chronic illnesses or problems with health in 2008, as well as in 2009.8 The most widespread were hypertonia and heart disease – 33 percent of those with chronic illnesses aid had one of these two diseases.
UNDP_magazine_ENG_v10j.indd 80UNDP_magazine_ENG_v10j.indd 80 04.07.2011 17:40:2204.07.2011 17:40:22

NATIONAL HUMAN DEVELOPMENT REPORT 2011 81
Poor health and complications of chronic illnesses negatively affect people’s ability to live a full life. The majority of people with illnesses feel their negative long-term consequences.9 In particular, 15.3 percent of respondents feel their illnesses affect their everyday working capacity (in 2009 this was 15.0 percent), 31 percent (in 2009 – 32.3 percent) highlighted the impact on life activi-ties, i.e. ability to carry out physical work, participate in cultural events and live an active life.
Unavailability of necessary medical assis-tance, poor health and physical restrictions increase the risk of social exclusion related to poor health. It especially affects such groups of the population as persons with disabilities, people with socially dangerous diseases (HIV, tuberculosis) and chronically ill people.
Persons with disabilities are often excluded from full public life. They face a number of barriers whereby they can even be partially or totally refused their rights to education, free and “facilitated” movement, employment (even when they are fully quali-fied), access to information, appropriate medical services and political participation.10 The vast majority (77 percent) of those inter-viewed indicated the existence of discrimina-tion with regard to persons with disabilities:11 34 percent considered this discrimination undeniable and 43 percent felt it existed but were more moderate in their response. Of the remaining respondents, 17 percent believed that discrimination did not exist and 6 percent responded that it was difficult to answer this question. 12 13 14
Barriers to employment and reduced oppor-tunities to work and earn enough in a chosen profession. Persons with disabilities are not fully integrated into the labour market and most of them either remain unemployed or have stopped searching for a job. Among employed persons with disabilities, many have part-time jobs, earn wages lower than the minimum wage or are in positions that do not correspond with their education and qualification level. The majority of existing job vacancies recorded in the State Employment Service database that persons with disabili-ties can consider are those with the minimum wage.12 Sometimes, persons with disabilities prefer to work at home, but the number of home-based vacancies is fairly limited. As in 9 State Statistics Committee of Ukraine (2010).10 UN (2008a).11 National Assembly of Persons with disabilities (2008).12 Data from the Ministry of Labour and Social Policy.13 Ministry of Labour and Social Policy of Ukraine et al. (2008).14 Libanova (2009a).
many countries, it is almost impossible, in Ukraine, to find jobs for people with psychi-atric problems or intellectual disorders.13
Access to general programmes of tech-nical and professional orientation and voca-tional training is limited. The absence of specialized or adapted working places to include necessary modifications and accom-modations is a serious barrier to persons with disabilities in accessing the labour market. Such exclusion from economic life has a negatively effect on them, since they are not able to ensure a sufficient level of income and independent way of life in society.
Lack of access to education. Access to education for persons with disabilities is an acute issue. Without appropriate education, they are destined to be dependent on social protection and unable to fend for them-selves. The practice of educating children with disabilities within specialized institu-tions, not in mainstream classes together with their peers, is a significant barrier to their inclusion and has a range of negative consequences.14
In general, Ukraine lacks a system of inclusive education, which means creating the best environment for persons with disa-bilities, including children with intellectual disabilities, and also eliminating barriers to inclusion and breaking stereotypes. 36 percent of experts from non-governmental organization and mass media indicated that
Children with Disabilities – Challenges in Accessing Mainstream Education
“It is impossible to enrol a child with a disability in a kindergarten, where the child could be taken care of, in order go back to work.”“Owing to my disability I was refused the right to submit my application to be admitted to a university.”
5.6BOX
Limited Access to Labour Market for Persons with Disabilities
“Any protection of real home-based labour of persons with disabilities is absent, and in addition the earned wage often is not paid. By the way, the average wage for home-based labour is UAH60–200 per month. If an employer does not pay a wage to a person with disabilities, it is useless to complain to the police because this minimum amount is insufficient for the institution of a criminal case.”14
5.5BOX
UNDP_magazine_ENG_v10j.indd 81UNDP_magazine_ENG_v10j.indd 81 04.07.2011 17:40:2204.07.2011 17:40:22

CHAPTER 5. EXCLUSION FROM HEALTH CARE AND SOCIAL PROTECTION SYSTEMS, SOCIAL NETWORKS AND MEANS OF COMMUNICATION82
the state did not ensure inclusive education at all levels.15 16
Lack of accessibility is not a barrier specific to the education system. Even if a school accepts a child, he or she may not be able to attend because of an absence of transpor-tation. Sometimes, a school building itself is inaccessible. There are few health care insti-tutions that are equipped with ramps and have other adjustments that facilitate access of people with disabilities, while shops, phar-macies, educational and cultural institutions are often completely inaccessible by wheel-chair users and other groups of persons with disabilities.
Lack of access to health care. There is a wide range of barriers in the area of provi-sion to persons with disabilities of health care services needed owing to the nature of their disability. These services are important for rehabilitation, minimization of difficulties and prevention of the subsequent emergence of disability, especially for children and old people. 17 18
Inaccessible buildings, roads and infrastruc-ture. Lack of adaptation of buildings, roads, transportation, schools, housing, health care institutions, shops and work places is a major barrier to many persons with disabilities enjoying a full life in society. Existing informa-tional, communication, electronic and emer-gency services are insufficiently adapted and modified to meet the needs of persons with disabilities.
Lack of access to information. Sign language used by the deaf and hard of hearing; the Braille alphabet used by the blind; and other kinds, methods and formats of communication of persons with special needs are barely used in official communica-tions. Such practices as encouraging private enterprises to provide services to the wider public in forms that are understandable to and acceptable by persons with disabilities
15 National Assembly of Persons with disabilities (2008). 16 National Assembly of Persons with disabilities (2008). 17 Ministry of Health of Ukraine.18 International Coalition of Organizations “Stop TB Partnership” (2006).
Persons with Disabilities – Inaccessibility of Infrastructure
“I arrivedat the policlinic. How could I get in? They said, ‘Next time here will be a ramp.’ I went there one more time. Yes, there is a ramp. With the help of two doctors (!) I was able to go up the ramp to the reception desk but what next? The general practitioner was on the first floor and the neurologist was on the second”.16
5.7BOX
are yet to be introduced. For instance, the Government acknowledges the importance of sign language but, so far, slow progress has been recorded in encouraging it and supporting its usage.17
People living with tuberculosis or HIV/AIDS. The number of people sick with such socially dangerous diseases as tuberculosis and HIV/AIDS is growing rapidly. The tuber-culosis situation is especially concerning: its morbidity indicator increased from 31.8 per 100,000 population in 1990 to 68.5 in 2008 (2.2 times) and the mortality indicator from 8.1 to 16.8 persons (2.0 times). There are many factors in play that are influencing these increases: a decrease in the popula-tion’s standards of living; presence of a signif-icant number of people in the penitentiary system; insufficient financing of anti-tuber-culosis measures; and shortage of qualified medical personnel and volunteers.
Negative public attitudes towards tuber-culosis as a socially dangerous disease, given its socio-economic causes and conse-quences, affect perceptions of individuals with tuberculosis. This leads to cases of discrimination and stigmatization against this group in society.
A range of key barriers to the inclusion of people sick with tuberculosis in today’s society include:18
• Lack of compliance with legislative requirements relating to the protection of rights and meeting state obligations with regard to individuals sick with tuberculosis. On the one hand, this leads to the uncontrolled spread of the infection and refusals to get treatment and follow medical instructions. On the other hand, it leads to discrimination and stigmatization of infected people and their family members in community, in everyday life, in the workplace and so on;
• Limited levels of social support provided to people sick with tuberculosis, including an inability to obtain separate housing as envisaged by the current legislation;
• Lack of state licensing procedures allowing the provision of social services to individuals sick with tuberculosis by private agencies and NGOs;
• Absence of a state system of psycho-social adaptation for those sick with tuberculosis, leading to psychological disorders and cases of exclusion sick people from social networks;
UNDP_magazine_ENG_v10j.indd 82UNDP_magazine_ENG_v10j.indd 82 04.07.2011 17:40:2204.07.2011 17:40:22
NATIONAL HUMAN DEVELOPMENT REPORT 2011 83
• Absence of mechanisms of implementation and monitoring of state social policy in the area of overcoming tuberculosis; insufficient levels of execution of national and regional programmes on overcoming tuberculosis; insufficient awareness among civil servants responsible for decision-making at different levels of the state authorities and local self-government; absence of a favourable social and political environment in the country to address the illness (the public in general is not mobilized to overcome the epidemic);
• A deficit of medications;• Violation of the fundamental principle of
free of charge phthisiologic assistance for the population. Conditions in penitentiary institutions
are not contributing to the reduction of incidence of tuberculosis. Convicts are at risk of being infected with new dangerous diseases: incidence of tuberculosis is 25–30 times higher among people released from prisons than the average across the country. The majority of former inmates who are sick are not given the necessary medical exami-nation on time and do not receive adequate treatment. As a result, they become carriers of tuberculosis.
The size of the HIV epidemic is growing steadily in Ukraine. As of March 2011, starting from 1987, 185,197 HIV-infected citizens were registered officially in Ukraine, including 38,455 AIDS cases and 36,764 deaths from AIDS.19 People living with HIV/AIDS face discrimination at the workplace and in medical institutions, prisons, educational institutions and social services.
Exclusion facing people living with HIV in the area of medical services covers:20
• The fact that, once a person is HIV-infected becomes publicly known, this leads to a refusal to provide services and necessary professional assistance by medical workers, who provide various excuses such as absence of necessary equipment and medications; need for official registration with the local authorities; long queues to access services. According to data from sociological survey, 13 percent of respondents claimed that, during treatment, they faced problems when medical personnel found out they had HIV/AIDS;21 22 23 24
19 National AIDS Centre, Ministry of Health of Ukraine.20 Ministry of Health of Ukraine.21 Veritas (2007).22 UN (2008a).23 Veritas (2007).24 Veritas (2007).
Exclusion Faced by People Living with HIV in the Area of Medical Services
“Recently I visited a private dental clinic where a very good doctor refused to treat my teeth. We have a mutual friend, so I informed her about my status. But she told me frankly, ‘I am sorry, but you should understand that if anybody knows that I am assisting a HIV-infected person, then nobody will visit me anymore.’ She is not afraid to become sick but she is afraid that people will know.”22
5.8BOX
• Non-response of emergency medical assistance service to calls and refusals to send ambulances to places where people with HIV/AIDS live. Such failures to respond and provide medical assistance in a timely manner may lead to deaths;
• Challenges for women with HIV status when giving birth in medical institutions, when medical personnel try to do all the necessary procedures as quickly as possible so as to discharge them from hospitals as early as possible, arguing that this will minimize the risk of transmission of HIV. During their stay in maternity hospitals, 23 percent of HIV-infected pregnant women experienced discrimination.23 In most cases, this related to respondents being placed in worse conditions compared with other patients (21 percent). They were also forced to pay higher amounts for medical services (16 percent). A total of 9 percent of respondents mentioned a violation of confidentiality of their diagnosis. The same number (9 percent) mentioned that medical personnel, once informed of their HIV status, refused to provide services. Finally, 14 percent of HIV-infected pregnant women indicated that it was suggested that they terminate their pregnancy owing to their HIV-positive status.
• Violation of the requirements of voluntary testing and confidentiality as established by law. According to data from the survey, around one fourth of those interviewed (24 percent) said they had been HIV-tested but forced into it.24
• Information on the positive status of a child being disclosed and known about not only in the health care institution but also in pre-school and school institutions. In particular, 16 percent of HIV-infected
UNDP_magazine_ENG_v10j.indd 83UNDP_magazine_ENG_v10j.indd 83 04.07.2011 17:40:2204.07.2011 17:40:22
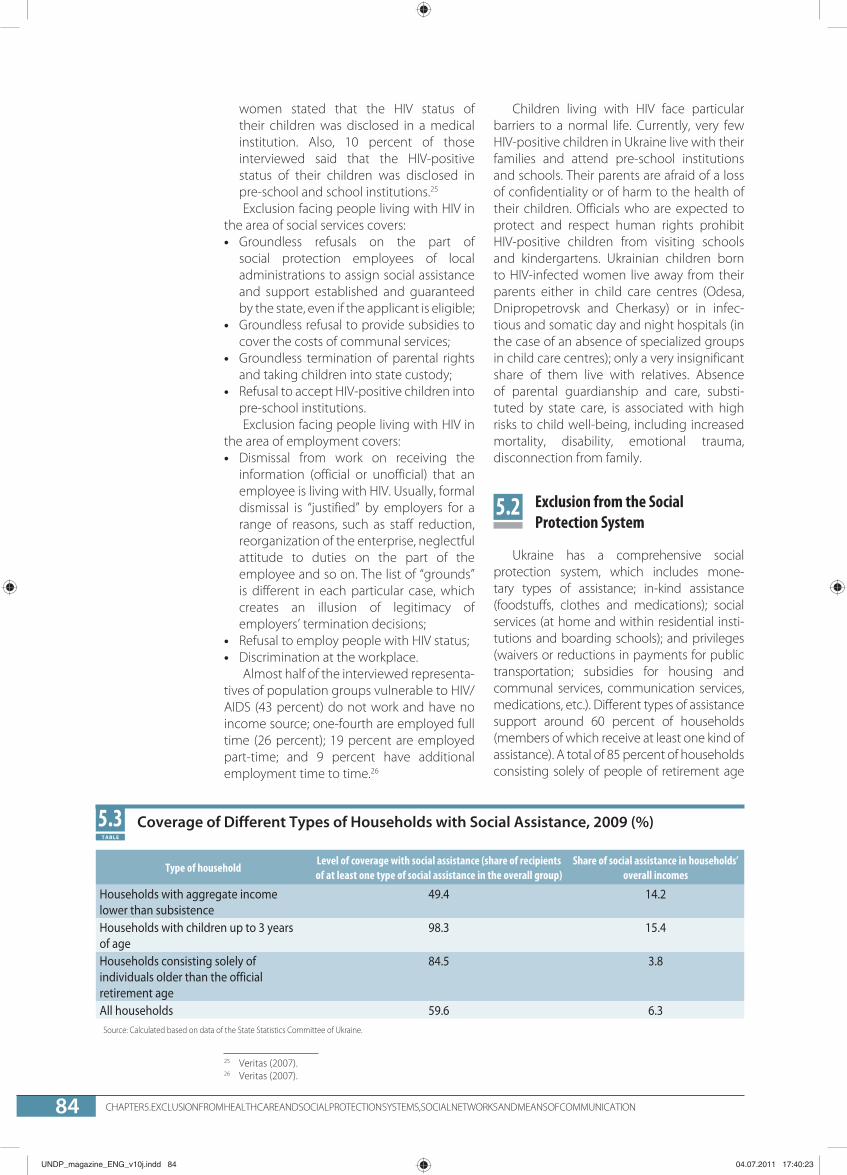
CHAPTER 5. EXCLUSION FROM HEALTH CARE AND SOCIAL PROTECTION SYSTEMS, SOCIAL NETWORKS AND MEANS OF COMMUNICATION84
women stated that the HIV status of their children was disclosed in a medical institution. Also, 10 percent of those interviewed said that the HIV-positive status of their children was disclosed in pre-school and school institutions.25
Exclusion facing people living with HIV in the area of social services covers:• Groundless refusals on the part of
social protection employees of local administrations to assign social assistance and support established and guaranteed by the state, even if the applicant is eligible;
• Groundless refusal to provide subsidies to cover the costs of communal services;
• Groundless termination of parental rights and taking children into state custody;
• Refusal to accept HIV-positive children into pre-school institutions.Exclusion facing people living with HIV in
the area of employment covers:• Dismissal from work on receiving the
information (official or unofficial) that an employee is living with HIV. Usually, formal dismissal is “justified” by employers for a range of reasons, such as staff reduction, reorganization of the enterprise, neglectful attitude to duties on the part of the employee and so on. The list of “grounds” is different in each particular case, which creates an illusion of legitimacy of employers’ termination decisions;
• Refusal to employ people with HIV status;• Discrimination at the workplace.
Almost half of the interviewed representa-tives of population groups vulnerable to HIV/AIDS (43 percent) do not work and have no income source; one-fourth are employed full time (26 percent); 19 percent are employed part-time; and 9 percent have additional employment time to time.26
25 Veritas (2007).26 Veritas (2007).
Children living with HIV face particular barriers to a normal life. Currently, very few HIV-positive children in Ukraine live with their families and attend pre-school institutions and schools. Their parents are afraid of a loss of confidentiality or of harm to the health of their children. Officials who are expected to protect and respect human rights prohibit HIV-positive children from visiting schools and kindergartens. Ukrainian children born to HIV-infected women live away from their parents either in child care centres (Odesa, Dnipropetrovsk and Cherkasy) or in infec-tious and somatic day and night hospitals (in the case of an absence of specialized groups in child care centres); only a very insignificant share of them live with relatives. Absence of parental guardianship and care, substi-tuted by state care, is associated with high risks to child well-being, including increased mortality, disability, emotional trauma, disconnection from family.
Exclusion from the Social Protection System
Ukraine has a comprehensive social protection system, which includes mone-tary types of assistance; in-kind assistance (foodstuffs, clothes and medications); social servi ces (at home and within residential insti-tutions and boarding schools); and privileges (waivers or reductions in payments for public transportation; subsidies for housing and communal services, communication services, medications, etc.). Different types of assistance support around 60 percent of households (members of which receive at least one kind of assistance). A total of 85 percent of households consisting solely of people of retirement age
5.2
Coverage of Different Types of Households with Social Assistance, 2009 (%)
Type of householdLevel of coverage with social assistance (share of recipients of at least one type of social assistance in the overall group)
Share of social assistance in households’ overall incomes
Households with aggregate income lower than subsistence
49.4 14.2
Households with children up to 3 years of age
98.3 15.4
Households consisting solely of individuals older than the official retirement age
84.5 3.8
All households 59.6 6.3Source: Calculated based on data of the State Statistics Committee of Ukraine.
5.3TABLE
UNDP_magazine_ENG_v10j.indd 84UNDP_magazine_ENG_v10j.indd 84 04.07.2011 17:40:2304.07.2011 17:40:23

NATIONAL HUMAN DEVELOPMENT REPORT 2011 85
and 98 percent of households with children of up to three years of age benefit from social assistance, subsidies and support (Table 5.3).
The main barriers to accessing the social protection system that result in the exclusion of certain groups of population include:• Insufficient funds for the full provision of
all types of assistance envisaged in the legislation;
• Insufficient rules and eligibility requirements for those in need of social assistance;
• Shortcomings in the capacity of the social services system, low quality of services provided by the labour and social protection offices and insufficient public awareness on the availability of social assistance;
• Marginal status of certain population groups (homeless people, labour migrants, some national minorities). 27
The level of exclusion from the social protection system depends on the specifics of the state programme and its targeting. In particular, child birth benefits and benefits to children up to three years old are accessed by almost all eligible families. At the same time, not all the poor by far benefit from the programme of assistance to low-income families. More than half of the poor does not
27 State Statistics Committee of Ukraine.
Matching of a Right for Assistance to Subjective Need for Such Assistance, 2008 (%)
Groups of households Share of households in need of assistance but not eligible for it in overall
number of households not eligible for assistance
All households not eligible for assistance but in real need of it 32.4By type of settlement:– Big city 27.5– Small town 32.2– Rural area 39.7By type of household:– Household with children 33.2– Household without children 32.0By number of children in a household:– One child 30.8– Two children 41.1– Three or more children 57.7By economic and demographic features:– All members are employed 32.1– All members are of retirement age 33.0– All members are of 75 years of age or above 31.0By level of well-being:– Poor 42.1– Not poor 29.6
Source: Calculated based on data of the State Statistics Committee of Ukraine.
5.4TABLE
benefit from any type of social assistance, thus is considered as excluded from the social protection system.
Programme eligibility requirements are major barriers to inclusion. To a large extent, these requirements are determined by the state budget, which depends on the coun-try’s financial capacity. In particular, there is a very low income threshold for eligibility. For example, the eligibility threshold for social assistance amounted to just 20 percent of the subsistence level in 2008. Therefore, just 5.7 percent of households with an average income that did not exceed subsistence level received assistance for low-income families.27
Each third household not eligible for state social assistance is in need of such assistance. These are, first of all, families with many chil-dren: 57.7 percent of such families which are not eligible for assistance need it (Table 5.4). Rural inhabitants need assistance to a greater extent (39.7 percent). Corresponding figures for urban inhabitants are 27.5 percent in big cities and 32.2 percent in small towns. This is explained by both the low incomes of rural inhabitants and the demographic structure of rural areas, in which senior age groups prevail. People are mostly in need of housing subsidies (80.2 percent) and assistance for low-income families (31.2 percent).
UNDP_magazine_ENG_v10j.indd 85UNDP_magazine_ENG_v10j.indd 85 04.07.2011 17:40:2304.07.2011 17:40:23

CHAPTER 5. EXCLUSION FROM HEALTH CARE AND SOCIAL PROTECTION SYSTEMS, SOCIAL NETWORKS AND MEANS OF COMMUNICATION86
Figure 5.1 shows how households of different types access social assistance. Households consisting of elderly people and households without children utilize their right to social assistance more rarely. Families with children, especially those with children of up to three years of age, access social assistance the most.
Out of all categories eligible for social assis-tance, only 26.3 percent have actually applied to the social assistance authorities. There are two main reasons why people do not apply for assistance: 1) there is no need for assistance as it is too small; and 2) it is impossible to present the necessary documents and complete the paperwork (Table 5.5).
The Social Exclusion Survey (2009) revealed that poor households have more problems
Share of Households Receiving Assistance among Those Entitled, 2009 (%)
Source: Calculated based on data of the State Statistics Committee of Ukraine.
5.1FIGURE
Reasons why Potential Users Did Not Apply for Assistance, 2009 (%)
Share of households Number of households
in UkraineNumber of households in survey (based on non-weighted data)
I do not have any need or its size is too small 32.8 163,458 104I do not have an opportunity or time to formalize full package of documents
31.8 158,392 109
I feel uncomfortable because of need to apply for assistance
8.3 41,466 31
I just plan to apply for assistance 18.7 93,041 54Other 8.4 41,993 26Total 100.0 49,8350 324
Source: Calculated based on data of the State Statistics Committee of Ukraine.
5.5TABLE
with preparing all the necessary documents to receive assistance in compari son with other households. Rural inhabitants and fami-lies consisting solely of elderly people have challenges with accessing the social assis-tance authorities.
Families with members with disabilities usually receive monetary assistance from the state; therefore, formally they cannot qualify as excluded from the system of social protec-tion. However, such families often have prob-lems with purchasing medications (63.3 percent), receiving rehabilitation services (46.7 percent) and accessing special treat-ment in hospitals (31.6 percent) (Table 5.6).
One of the barriers to inclusion in the social protection system is a low level of awareness of the population about the programmes,
UNDP_magazine_ENG_v10j.indd 86UNDP_magazine_ENG_v10j.indd 86 04.07.2011 17:40:2304.07.2011 17:40:23

NATIONAL HUMAN DEVELOPMENT REPORT 2011 87
Problems with Purchasing of Goods and Services for Recipients of Assistance (Persons with Disabilities from Childhood and Children with Disabilities), 2009 (%)
Types of good (service) Share of recipients of assistance who have problems with purchasing a particular good or service
Medications 63.3Rehabilitation in a specialized sanatorium 46.7Specialized treatment in a day and night clinic 31.6Foodstuffs 23.5Education 16.6Employment 14.8Medical services at home 14.2Car 12.4Means of rehabilitation 8.6Services for examination and support at home 8.2Special equipment 8.0
Source: Calculated based on data of the State Statistics Committee of Ukraine.
5.6TABLE
benefits and support available. In general, 8 percent of the population is not aware of any social assistance programmes. Aware-ness depends on the type of household. Just 3.4 percent of households with children and 9.6 percent of households without chil-dren are not aware of any social assistance programmes: this can be explained by the popularity of some types of child assistance in recent years.
Assistance to families with children. Public awareness of the main types of child assista nce is fairly high – 77.6 percent of households are aware of at least one out of three kinds of assistance (maternity grant, child birth benefit and benefit for children up to three years of age). The awareness level among households with children is much higher in comparison with that among households without children (Figure 5.2).
Almost 100 percent of families with chil-dren up to three years of age are aware
Awareness of the Population of Assistance for Children by Household Type, 2008 (%)
Source: Calculated based on data of the State Statistics Committee of Ukraine.
5.2FIGURE
of child benefits and support, which can be explained by multiple increases in child birth assistance from 2005, which was covered widely by the mass media. Since the conditions involved in receiving all of these kinds of child assistance are fairly simple, they are very popular among potential beneficiaries, that is, families with small children.
Place of residence has no impact on aware-ness of different kinds of child assista nce: the awareness level is approximately equal in urban and rural areas (78.3 percent and 75.9 percent, respectively).
Targeted types of assistance. There are some differences depending on place of residence in terms of levels of awareness of households of targeted types of assista nce, such as assistance to families with low incomes and housing subsidies. The highest share of the population aware of at least one of these programmes lives in rural areas –
UNDP_magazine_ENG_v10j.indd 87UNDP_magazine_ENG_v10j.indd 87 04.07.2011 17:40:2304.07.2011 17:40:23

CHAPTER 5. EXCLUSION FROM HEALTH CARE AND SOCIAL PROTECTION SYSTEMS, SOCIAL NETWORKS AND MEANS OF COMMUNICATION88
76.4 percent– and the lowest in big cities – 67.3 percent (Table 5.7).
At the same time, financial standing of households is not correlated with level of awareness of types of assistance for which households are eligible. In other words, even among very poor households that are eligible for state assistance, almost 30 percent do not know about the assistance for which they can apply.
Exclusion of the homeless. The homeless represent one of the most socially excluded groups. There are 800,000–900,000 of them in Ukraine according to estimates for 2007, including 10,000–30,000 in Kyiv.28 Over 80 percent of the homeless do not receive social assistance, since they often do not have iden-tification documents. This is especially critical for those of retirement age deprived of other ways of surviving: 45 percent of people of 56–65 years and 33 percent of people older than 65 years do not have documents.29 Often even those who have documents are not aware of their rights and are not ready to stay in queues and collect all the necessary documents. 30
28 Cultural Policy Institute.29 Centre of Perspective Social Studies (2007).30 Ukrainian Instituteof Social Studies (2010).
Population Awareness of Types of Targeted Assistance, 2008 (%)
Share of aware households in total number of households
Type of locality: – Big city 67.3– Small town 73.0– Rural area 76.4Living in poverty: *– Very poor 71.7– Poor (including very poor) 72.8– Not poor 71.2Total 71.6
Source: Calculated based on data of the State Statistics Committee of Ukraine.
Note: * The national poverty and extreme poverty lines were used – 75% and 60% of the median level of aggregate equivalent incomes.
5.7TABLE
The Homeless – Absence of Elementary Amenities and Necessary Information
“Living conditions are harsh because there are no hot meals, you want to take a bath but you have to content yourself with cold water and junk food” (Oksana, Simferopol).“I heard that there are places where the homeless obtain food, where they can wash themselves, cut their hair and nails and get medical services, but I didn’t manage to find them” (Enver, Simferopol).
5.9BOX
The vast majority of the homeless have subjective feelings of exclusion; over 80 percent of respondents expressed an interest in returning to normal life.
The main reasons behind homeless-ness are family problems (divorce, family conflict, orphanhood); loss of dwelling owing to imprisonment; drug addiction or alco-holism; and problematic real estate opera-tions (selling of apartment in order to buy a smaller one, selling of apartment after loss of a job, arrears in payments for utilities, selling of dwelling in order to open own busi-ness which turns out unprofitable). There-fore, exclusion of the homeless is a complex phenomenon. It deals with exclusion from all dimensions of public life: economic, cultural, political, social and health care-related.
The existing network of assistance to the homeless consists of centres for registration, houses for overnight stay, centres for reinte-gration and “social hotels”. This satisfies not more than 2–2.5 percent of people. Fewer than 18,000 homeless people received assist-ance in 2009.30
Exclusion of street children. Street children are children who live or work on the streets. Some of these live with their families (who are also living on the streets). Others do not live with their families; many of them live entirely on the streets of big cities without any family contact at all. They sleep in abandoned buil-dings, under bridges, in doorways or in public parks.
Efficient mechanisms for the reintegra-tion and inclusion of street children appear to be absent in Ukraine. The number and coverage of existing Government structures are insufficient to address their needs, and NGOs are not present in this field owing to lack of financing and the necessary state regulations. This situation could be improved if the state better supports NGOs, if a network of day-time stay institutions for street chil-dren was developed and if programmes to provide general education to street children was implemented. Under current conditions, street children often end up dependent on adults who exploit them as cheap labour and engage them in prostitution and crime.
Exclusion of Ukrainian labour migrants. Ukraine is one of the biggest countries “sending” labour in Europe. A total of 1.5 million Ukrainian citizens worked abroad in 2005–2008 – 5.1 percent of the working-age
UNDP_magazine_ENG_v10j.indd 88UNDP_magazine_ENG_v10j.indd 88 04.07.2011 17:40:2304.07.2011 17:40:23

NATIONAL HUMAN DEVELOPMENT REPORT 2011 89
population.31 The main destination countries for Ukrainian workers are Russia, Italy, the Czech Republic, Poland, Hungary, Spain and Portugal.
The majority of Ukrainian workers are excluded from the social protection system, since they live abroad illegally. Residence and work permits are obtained by approxi-mately one-third of labour migrants. Data on those with official migrant status show that most Ukrainian citizens work in the Czech Republic, Portugal and Spain; mean-while, the highest share of migrants without official status work in Poland and Italy. Just 34.5 percent of Ukrainians who work abroad have a contract with an employer in writing; however, even within this category 21.1 percent have no right to social protection in accordance with the contract. Right to social insurance is enshrined in the written contract in only half of cases, right to an annual vaca-tion in 9.4 percent and paid sick leave in just 3.6 percent. Those working in Russia are the least socially protected category of Ukrainian labour migrants.
The average duration of a working week for Ukrainians abroad is equal to 52.6 hours (just 12 percent worked for up to 40 hours a week). A total of 14.0 percent of workers faced situa-tions whereby their actual job differed from the promised one, 7.0 percent were passed from one employer to another, 11.9 percent worked in an unfavourable environment, 9.6 percent experienced delays or incomplete payments of wages and 4.4 percent were forced to perform unpaid overtime work.
Exclusion of children of Ukrainian labour migrants. Remittances significantly improve the access to goods and services of migrants’ households, including migrants’ children, thus reduce their vulnerability to economic exclusion. However, around half of labour migrants leave children of 14 years of age and older at home and around one-third chil-dren of 10–13 years of age. Parents’ departure usually has a negative impact on children’s emotional development, social relations and school performance and puts children at risk of social exclusion.
Often, migrants work abroad for years, returning from time to time for a short vaca-tion. Migration may result in the break-up of families and the emergence of a certain type of family with children, where one parent lives abroad without any contact with the family. In some instances, grandparents take care of the children of labour migrants.
31 Pozniak (2008).
To demonstrate their love, parents may bring home very expensive items and provide children with significant amounts of pocket money so they can enjoy luxuries often unavailable to their peers. But lack of parent control, free availability of money, peer pressure and low supervision can result in poor school performance, misbehaviour and conflict with the law.
In the absence of legal provisions outlining the parameters of social work with children of labour migrants, social services are provided by agencies at their discretion. Since children of labour migrants may exhibit behaviour inconsistent with society’s norms, commit crimes or end up without adult care or homeless, their needs vary. Children of labour migrants and people taking care of them need informational, legal and social assist-ance, particularly concerning the protection of children’s property rights. In some cases, they even need temporary material support when parents do not send them money for a long period of time.
Exclusion of the elderly. Almost all Ukrainian citizens of retirement age receive pensions. The guaranteed minimum pension is not lower than subsistence level, and it was 65 percent of the average pension in 2010. Given guaranteed pension payments, the issue of absolute poverty among pensioners has been addressed successfully (if the subsistence level is taken as the poverty line). However, social exclusion risks exist for pensioners and relate mostly to inequalities in terms of access to labour opportunities and the conditions determining pensions.
According to data from the Pension Fund of Ukraine, the average pension size in rural areas is 78 percent of that in urban areas. This is because rural inhabitants are employed mostly in agriculture, where the wage is almost twice as low as the average. More than 40 percent of the employed rural population of working age are employed informally (mostly on personal farms), which
Сhildren of Ukrainian Labour Migrants – Consequences of Lack of Parent Control
Robbery is a common crime by children of labour migrants, since prestige consumption often becomes a goal in itself, a cult, an obsession. The second most common reason is alcohol and drug dependence – at first children spend their pocket money, then this money is not enough. As a result, cases of crimes committed by children from secure families and families of labour migrants without absence of real material needs are becoming more frequent.
5.10BOX
UNDP_magazine_ENG_v10j.indd 89UNDP_magazine_ENG_v10j.indd 89 04.07.2011 17:40:2404.07.2011 17:40:24

CHAPTER 5. EXCLUSION FROM HEALTH CARE AND SOCIAL PROTECTION SYSTEMS, SOCIAL NETWORKS AND MEANS OF COMMUNICATION90
means they do not pay pension contribu-tions and can claim only social pensions (the minimum) in the future. Among the urban employed, just 10 percent work within the informal sector. These different levels of pension coverage and differences in wages mean the gap between urban and rural areas will increase further in the future.
Gender inequality is also present when determining pension amounts. A lower retire-ment age is set for women (55 years vs. 60 years for men). Even though this is consid-ered a privilege for women, in reality a lower retirement age means women are exposed to higher risks of poverty on retirement. Given their shorter employment period, the average pension for a woman is equal to just 68.5 percent of the correspondent pension for a man. According to data from the State Statis-tics Committee of Ukraine, the average wage of a woman was equal to 77.2 percent of that of a man in 2009. Given high mortality rates of men, working-age women constitute two-thirds of the overall number of pensioners, and many of them live alone. Therefore, the lower retirement age creates high risk of social exclu-sion of women in old age.
The majority of the population (69.6 percent) does not believe in the ability of the existing pension system to satisfy their needs. Even more people (71.8 percent) do not trust the existing state social protection system.
Another major characteristic of social exclusion of the elderly is their isolation and the impossibility of satisfying their needs in terms of communication, leisure, participation in the life of younger generations and inte-raction with people outside the family. Highly educated people who remain able-bodied (55–65 years of age) are pushed out of the labour market and do not have access to jobs that are appropriate to their qualifications.
Non-state forms of social assistance. Mutual assistance at the family level is traditional in Ukraine. Older generations try to support their adult children both financially and morally, primarily by taking care of grandchil-dren. This, to some extent, counteracts old people’s social exclusion and stimulates their need to feel useful. Often, old parents living in villages support their children living in cities by supplying them with foodstuffs grown on their subsidiary plots. The majority of the population (65.6 percent) thinks that parents more often support their children and just 14.0 percent think that children more often support their parents. 32
32 Social Exclusion Survey (2009)
Activities of non-governmental organiza-tions in the provision of social services are not that widespread in Ukraine. According to expert surveys, the non-state sector share of social protection does not exceed 10 percent. A total of 12.8 percent of respondents said that NGOs, controlled by the state or municipality, provide social services in their settlement; 47.6 percent said there were no such organizations; and 38.1 percent said they did not know anything about such organizations. A total of 13.4 percent of respondents provided information on reli-gious organizations supporting the poor in their settlement; 47.7 percent said there were no such organizations; and 37.5 percent said they know nothing about such organizations. A small group of respondents (5.3 percent) described an NGO with international funding in their settlement; 49.0 percent said there were no such organizations in their settlement; and 44.0 percent said they knew nothing about such organizations. Of those who said that some NGOs operated in their settlement,12.7 percent had utilized these services; 8 percent of those with religious organizations nearby had utilized these services; and 4.9 percent of those with an NGO with international funding had utilized these services.
Exclusion from Social Networks
People are social by nature and need to communicate and socialize with relatives, friends and colleagues. Exclusion from such interaction can be an outcome of both indi-vidual characteristics (desire for loneliness and lack of communication skills) and preju-diced attitudes of other people, who try to minimize interactions with certain groups based on characteristics such as their religion, ethnicity and health status.
In general, Ukrainians feel it is important to be respected by the people with whom they interact. Respect from relatives is the most valuable, for 96.7 percent of respon-dents. Respect from close friends is second (88.9 percent), followed by respect from neighbours (78.3 percent). Good attitudes of colleagues are valued by 73.1 percent of respondents, while 66.5 percent value management’s respect. Respect from chil-dren’s teachers is valued the least: less than half of respondents (47.7 percent) think respect from teachers is important.32
The majority of respondents of the Social Exclusion Survey (2009) (71.6 percent) have
5.3
UNDP_magazine_ENG_v10j.indd 90UNDP_magazine_ENG_v10j.indd 90 04.07.2011 17:40:2404.07.2011 17:40:24

NATIONAL HUMAN DEVELOPMENT REPORT 2011 91
close friends, i.e. people with whom they feel close, can talk about personal issues and can ask for help. However, 26.7 percent have no such friends. This shows that around one-quarter of the population is excluded from communication with friends.
Survey respondents and their close friends often have different material and social status. Close friends of 21.5 percent of respondents are persons with disabilities; 53.7 percent have friends who are much richer that they are; and 58.3 percent have much poorer friends. People with a post-graduate degree are close friends of 19.5 percent of respond-ents; 33.6 percent have friends of a different religion; and 32.5 percent have friends of another ethnic origin. Migrants from other parts of the country are close friends of 16 percent of respondents, while immigrants from other countries are friends of 8.7 percent of respondents. A total of 61.3 percent of respondents have friends belonging to a different age group. People who have poli-tical power are close friends of 10.9 percent of respondents. Such categories as people living with HIV and sexual minorities were observed among close friends in less than 1 percent of cases. This may be explained by both the low share of such categories of people in society and existing prejudices.
People spend their leisure time most often with their relatives: 68.2 percent of them said they do this almost every day. More than half of respondents (55 percent) spend their leisure time with their close friends a few times per month or more. Less frequently (around one-third of respondents said they do this seldom), people spend their leisure time with neighbours and other friends, including work colleagues (Table 5.8).
When people need to borrow money, they most often ask relatives (52 percent of cases) and friends (25 percent). In response to the question “Can the majority of people be trusted?”, respondents divided into two
Distribution of Population by Spare Time Activity (%)
Family/relatives Neighbours Close friends Friends, colleagues
Never 1.0 11.9 8.6 6.9Seldom 9.6 32.9 18.7 32.6Several times in a month 9.6 14.8 28.1 22.8Several times in a week 11.0 24.5 26.9 19.4Almost every day 68.2 15.1 10.5 14.3No answer 0.6 0.8 7.2 4.0Total 100.0 100.0 100.0 100.0
Source: Calculated based on data of the Social Exclusion Survey (2009).
5.8TABLE
Lack of Tolerance in Society towards Former Convicts
“Former convicts need psychological assistance very much because they feel themselves lost. Prison takes away your will to live. You get used to eating on schedule and you have shelter. When you are released, and achieve what you have dreamt about for so long, you start to lose understanding of what is happening around you. Prison takes away the feeling of insecurity. I know many examples of people committing crimes just after their release in order to come back to prison. This is very convenient for recidivists. This is an absolutely stupid punishment. There is no system of inclusion of former convicts in public life in our country. It is impossible to find a job. […] Psychological assistance is needed because everything has changed. How to adapt? I could not even recognize the town during this time” (Valeriy, Simferopol).
5.11BOX
large and almost equal groups: 47.5 percent responded positively and 40.2 percent– negatively.
Responses to the question “Who do you think would be the most undesirable neigh-bour?” help identify groups of the Ukrainian population who may be subject to preju-dices. People listed drug addicts (88 percent of cases), former convicts (65.4 percent) and sexual minorities (61.6 percent) as unde-sirable neighbours. People associate drug addicts and former convicts with high risks of crime, and negative attitudes towards sexual minorities are based mostly on traditional views on morality. People living with HIV are in next place (38.2 percent), followed by other groups (12 percent and less).
Exclusion from Means of Communication
It is impossible to imagine everyday modern life without communication, which can mean direct contact or long distance interaction with relatives and friends living in other settlements. Telephone, mail and ability to get physically to a different loca-
5.4
UNDP_magazine_ENG_v10j.indd 91UNDP_magazine_ENG_v10j.indd 91 04.07.2011 17:40:2404.07.2011 17:40:24
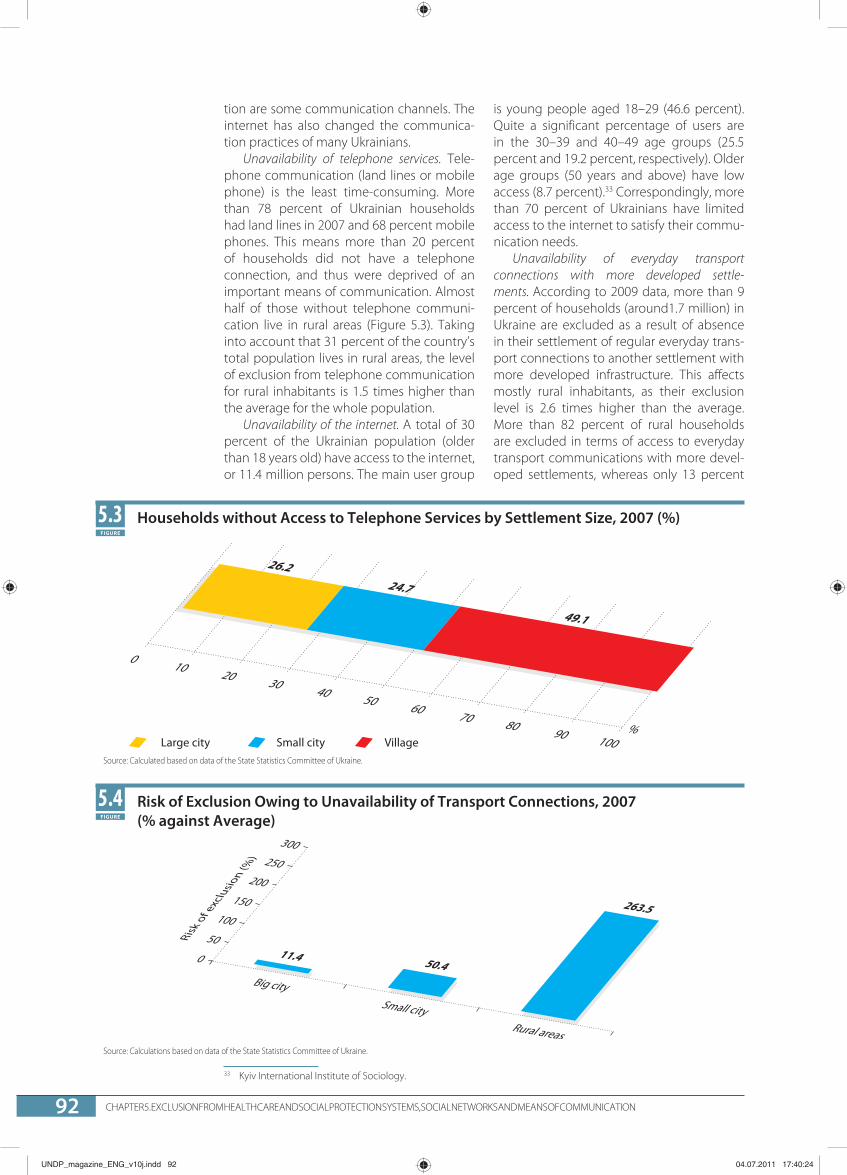
CHAPTER 5. EXCLUSION FROM HEALTH CARE AND SOCIAL PROTECTION SYSTEMS, SOCIAL NETWORKS AND MEANS OF COMMUNICATION92
tion are some communication channels. The internet has also changed the communica-tion practices of many Ukrainians.
Unavailability of telephone services. Tele-phone communication (land lines or mobile phone) is the least time-consuming. More than 78 percent of Ukrainian households had land lines in 2007 and 68 percent mobile phones. This means more than 20 percent of households did not have a telephone connection, and thus were deprived of an important means of communication. Almost half of those without telephone communi-cation live in rural areas (Figure 5.3). Taking into account that 31 percent of the country’s total population lives in rural areas, the level of exclusion from telephone communication for rural inhabitants is 1.5 times higher than the average for the whole population. 33
Unavailability of the internet. A total of 30 percent of the Ukrainian population (older than 18 years old) have access to the internet, or 11.4 million persons. The main user group
33 Kyiv International Institute of Sociology.
Households without Access to Telephone Services by Settlement Size, 2007 (%)
Source: Calculated based on data of the State Statistics Committee of Ukraine.
5.3FIGURE
Risk of Exclusion Owing to Unavailability of Transport Connections, 2007 (% against Average)
Source: Calculations based on data of the State Statistics Committee of Ukraine.
5.4FIGURE
is young people aged 18–29 (46.6 percent). Quite a significant percentage of users are in the 30–39 and 40–49 age groups (25.5 percent and 19.2 percent, respectively). Older age groups (50 years and above) have low access (8.7 percent).33 Correspondingly, more than 70 percent of Ukrainians have limited access to the internet to satisfy their commu-nication needs.
Unavailability of everyday transport connections with more developed settle-ments. According to 2009 data, more than 9 percent of households (around1.7 million) in Ukraine are excluded as a result of absence in their settlement of regular everyday trans-port connections to another settlement with more developed infrastructure. This affects mostly rural inhabitants, as their exclusion level is 2.6 times higher than the average. More than 82 percent of rural households are excluded in terms of access to everyday transport communications with more devel-oped settlements, whereas only 13 percent
UNDP_magazine_ENG_v10j.indd 92UNDP_magazine_ENG_v10j.indd 92 04.07.2011 17:40:2404.07.2011 17:40:24

NATIONAL HUMAN DEVELOPMENT REPORT 2011 93
of inhabitants of small towns and 5 percent of inhabitants of big cities are excluded (Figure 5.4).
Therefore, rural inhabitants are the most excluded from means of communication. Taking into account that rural inhabitants own fewer cars than urban residents, acces-sibility and affordability of public transport are very important to support their inclusion in many aspects of the life of society. Regular transport connections are required because hospitals, schools, kindergartens and busi-nesses may be located far away from places of residence.
A range of factors contribute to the lack of reliable public transport in rural areas: poorly developed infrastructure which is traditio-nally worse than in cities; underdeveloped networks of hard roads; poor condition roads; outdated bus fleets; and insufficient numbers of buses on routes. According to the Ministry of Transport and Communication of Ukraine, 113 settlements of Ukraine did not have hard roads as of the beginning of 2010.
Conclusions
In Ukraine 14.9 percent of households with members who required medical assis-tance were not able to receive it for a number of reasons, such as the high cost of medical services; absence of specialists; and absence of medical institutions close to place of residence. People with low incomes and rural inhabitants are the main population groups facing barriers to accessing the health care system. Around one-fourth of population does not believe that the national health care system is able to provide the necessary services.
Persons with disabilities, people with socially dangerous diseases (HIV, tubercu-losis) and chronically sick patients feel them-selves excluded, mostly as a result of their health.
The main factors excluding persons with disabilities from a full life in society are barriers to employment and reduced oppor-tunities to work and earn enough in a chosen profession; lack of access to education; lack of access to health care; inaccessible buildings,
roads and infrastructure; and lack of access to information.
The major reason for social exclusion of people living with HIV/AIDS or tuberculosis is a fear among healthy people of exposing themselves to the risk of being infected while communicating with them. Society’s preju-dices hinder understandings of the needs and desires of these groups and lead to their exclusion and isolation. Some people even treat these vulnerable individuals as socially dangerous.
Even though Ukraine’s population is well-covered with social protection, the poor are provided with an insufficient level of support as a result of the small size of the assistance and insufficient awareness of the opportuni-ties available to get help. Programme eligi-bility requirements are also barriers of exclu-sion from social protection system. Each third household not eligible for state social assist-ance is in need of such assistance. These are, first of all, families with many children (57.7 percent) and rural inhabitants (39.7 percent).
Labour migrants and the homeless are the most excluded from the social protec-tion system. Exclusion from social protec-tion for labour migrants is a consequence of limited access to employment oppor-tunities in Ukraine and a need to search for work beyond the country’s borders (i.e. economic exclusion). The homeless, mean-while, are subject to many forms of exclusion: economic, cultural and health-based, and often even self-exclusion from a normal social environment.
Such population groups as drug users, former convicts and sexual minorities expe-rience the highest risk of exclusion from social networks. These groups also experience soci-ety’s most prejudiced attitudes.
Exclusion from means of communica-tion is experienced mostly by rural inhabi-tants, because of underdeveloped trans-port and communication networks. More than 9 percent of households in Ukraine are excluded as a result of absence in their settle-ment of regular everyday transport connec-tions to another settlement with more deve-loped infrastructure.
UNDP_magazine_ENG_v10j.indd 93UNDP_magazine_ENG_v10j.indd 93 04.07.2011 17:40:2404.07.2011 17:40:24

CHAPTER 5. EXCLUSION FROM HEALTH CARE AND SOCIAL PROTECTION SYSTEMS, SOCIAL NETWORKS AND MEANS OF COMMUNICATION94
UNDP_magazine_ENG_v10j.indd 94UNDP_magazine_ENG_v10j.indd 94 04.07.2011 17:40:2404.07.2011 17:40:24

NATIONAL HUMAN DEVELOPMENT REPORT 2011 95
C H A P T E R
6 Multidimensional Aspects of Social Exclusion in Ukraine
Traditionally, researchers and policy-makers rely on economic indicators to measure social exclusion. Both the processes and the results of social exclusion are very complex, so indicators reflecting other, non-economic aspects should also be taken into consideration to present a comprehensive picture of its drivers and outcomes. A more complex model of social exclusion, which would include indi-cators from various fields, needs to be developed. Such indicators as access to education and health care; housing conditions; position in the labour market; communication opportunities; accessibility and availability of social infrastructure; and inclusion in political and socio-cultural processes should be taken into account along with standard measures of the population’s economic opportunities.
The sources that could be used in the multidimensional assessment of social exclusion in Ukraine are as follows: • The Household Budget Survey (HBS),
regulary conducted by the State Statistics Committee of Ukraine;
• The HBS separate module of self-assessment of availability of certain goods and services;
• Surveys of Economic Activity of the Population in Ukraine.
Based on the available data, the following quantitative indicators are used to identify and evaluate degree of social exclusion in Ukraine:1. Household in which all adults of
working age have low status in the labour market (unemployed, self-employed or household members working for free);
2. Unemployed for a long period of time (over 12 months), according to the ILO methodology;
3. The poor defined in accordance with the relative national criterion;
4. Households unable to ensure adequate nutrition during a year, according to self-assessment;
5. Households that experience a shortage of funds for visiting friends with presents or for inviting friends to visit, according to self-assessment;
6. Households that experience a shortage of funds for family vaca-
tions outside the home and not at the residence of their relatives, according to self-assessment;
7. Households that experience a shortage of funds for purchasing tickets to cinema (or theatre or concerts) one or twice a year, according to self-assessment;
8. Households with a share of social assistance and assistance from rela-tives that amounts to 33 percent of total income;
9. Households without access to education (owing to an absence of sufficient funds for professional education or of pre-school institu-tions close to the place of residence);
10. Households in which not even one member of 25 years of age or older has a professional education;
11. Households without access to medical assistance (owing to absence of a medical institution or pharmacy close to the place of residence, non-provision of a settlement with timely services by emergency medical services and impossibility of getting medical assistance or buying medications during a year);
12. Households that experience a shortage of funds for necessary paid emergency medical services, according to self-assessment;
UNDP_magazine_ENG_v10j.indd 95UNDP_magazine_ENG_v10j.indd 95 04.07.2011 17:40:2404.07.2011 17:40:24

CHAPTER 6. MULTIDIMENSIONAL ASPECTS OF SOCIAL EXCLUSION IN UKRAINE 96
13. Households living in poor conditions (in dormitories or communal flats with less than 7.5 m2 of living space per person, absence of a bathroom and lack of funds to install one);
14. Households without a telephone (home or cellular);
15. Households suffering from an absence of regular everyday trans-port communication from their settlement with a settlement with more developed infrastructure;
16. Households suffering from unavai-lability of social workers or social assistance;
17. Households that have not accessed paid services in the field of culture during a year;
18. Households that shift responsibility for their well-being fully or partially onto the state.
Since the vast majority of these indi-cators concern not separate indi-viduals but the households they are living in, the assessment of social exclusion is conducted at the level of the household (Annex 3).Only 8.5 percent of households have no exclusion characteristics. On the other hand, no households have all 18 characteristics. The maximum share of social exclusion characteristics is equal
to 14 and 15, although just several hundredths of 1 percent have such a large number of characteristics. The analysis allowed for an identification of acute exclusion, that is, households with five or more exclusion charac-teristics. At this level, social exclusion starts to show up clearly. The next level – critical exclusion – comprises households with seven or more exclu-sion characteristics.A multidimensional assessment of social exclusion also identifies the most vulnerable types of households and produces calculations of simple and partial risks.Previously conducted studies demon-strate that characteristics of living standards that are used to calculate monetary poverty indicators deter-mine to the greatest extent presence or absence of social exclusion charac-teristics. This allows to conclude that poor and socially excluded house-holds have the same structures and features, i.e. that the maximum risk of exclusion is experien ced by house-holds with children, households that include elderly people and house-holds with a double demographic and economic burden (with both children and elderly people at the same time).
Cumulative Share of Households According to Number of Characteristics of Exclusion
Source: Calculated based on data of the State Statistics Committee of Ukraine.
6.1FIGURE
UNDP_magazine_ENG_v10j.indd 96UNDP_magazine_ENG_v10j.indd 96 04.07.2011 17:40:2404.07.2011 17:40:24

NATIONAL HUMAN DEVELOPMENT REPORT 2011 97
Assessment of Acute Social Exclusion
A total of 37.7 percent of Ukrainian households, which differ in terms of their demog raphic composition, status in the labour market, education and place of resi-dence, experience acute social exclusion. The presen ce of people who cannot be employed (children and elderly people) is the most important factor of acute exclu-sion.
Risk of acute social exclusion is signifi-cantly higher in households with elderly people. In particular, the presence of at least one pensioner increases such risk by 15.5 percent and the absence of working-age people – by 42.2 percent. As the minimum pension is equal only to subsistence level, Ukrainian pensioners are certain to face barriers to social inclusion in non-monetary areas. Thus supporting the social inclusion of the elderly by increasing pensions and providing privileges in terms of subsidies for housing and utilities does not guarantee full (equal to that of working-age people) inclusion in public life. Since more than half of households that suffer from acute social exclusion include pensioners, adjustment of policy in relation to pensioners should be
6.1
considered a necessa ry (but definitely not sufficient) pre-condition in building society for all.
An extremely high risk of social exclu-sion (2.2 times higher than the average and 2.5 times higher compared with families consisting solely of working-age people) exists for families with many children and pensioners. However, the share of such households within the structure of those suffering from acute social exclusion is equal
Methodology of the Data File Composition
A separate self-assessment module in the HBS on the accessibility of certain goods and services, which is conducted one or two times per year, is the sole data source on a significant share of selected indicators. Subsequently, all calculations are based on 2007–2008 data with data corrected by structure of household expenditures in 2008. Surveys of the economic activities of the population serve as the data source on long-term unemployment (based on the ILO methodology). This indicator was added to the major data file through the necessary statistical procedures. As a result, data on presence or absence of 18 selected characteristics of social exclusion for all surveyed households were integrated into one data file. Then each household was assessed according to these characteristics. Ukrainian households were rated according to the number of exclusion characteristics – from households with not even one exclusion characteristic to those with 15 characteristics (the maximum number of characteristics).
6.1BOX
Households with Characteristics of Acute Social Exclusion by Number of Children and Pensioners, 2007 (%)
TotalIncluding
without children with 1–2 children with 3 or more children
Without pensioners 45,7 17,8 25,8 2,1At least one pensioner but number of pensioners less than number of adults
19,5 11,2 7,8 0,5
All are pensioners 34,7 34,7 0,0 0,0Total 100,0 63,8 33,6 2,6
Source: Calculated based on data of the State Statistics Committee of Ukraine.
6.2TABLE
Risks of Acute Social Exclusion of Households by Different Demographic Composition, 2007 (% Compared with Average)
TotalIncluding
without children with 1–2 children with 3 or more children
Without pensioners 85.5 75.1 90.6 166.9At least one pensioner but number of pensioners less than number of adults
101.0 98.5 100.9 219.9
All are pensioners 127.7 127.7 – –Total 100.0 102.3 92.8 186.7
Source: Calculated based on data of the State Statistics Committee of Ukraine.
6.1TABLE
UNDP_magazine_ENG_v10j.indd 97UNDP_magazine_ENG_v10j.indd 97 04.07.2011 17:40:2404.07.2011 17:40:24

CHAPTER 6. MULTIDIMENSIONAL ASPECTS OF SOCIAL EXCLUSION IN UKRAINE 98
to just 2.1 percent (of all families with many children 2.8 percent). This means a need for very targeted (almost individualized) inter-ventions directed at the inclusion of such families in public life.
In general, the fairly high risk of acute exclusion of families with children is a conse-quence, first, of low wages (when two working parents cannot protect one or two children from poverty) and, second, of absence of real employment opportunities for mothers of two to three children.
Unemployment and low educational levels of household members are significant factors in acute social exclusion.
Higher education is the most impor-tant factor determining social inclusion in Ukraine. In particular, the presence of at least one adult with higher education decreases the risk of acute exclusion by 2.7 times (compared with the average level by more than 2 times). The risk is decreased by 3.7 times if all adults in the household have higher education compared with households in which there are no persons with higher education, and by three times compared with the average. The data
confirm that just 11.8 percent of households living in conditions of acute social exclusion have persons with higher education; 88.2 percent of households suffering from acute social exclusion have no members who graduated from college or university.
Unemployment causes acute multifa-ceted exclusion. The presence of at least one unemployed person increases the risk of exclusion by 52.2 percent compared with households without unemployed persons, and the risk is increased by 2.2 times if all adults of a household are unemployed (39.4 percent and 97.4 percent increase in compa-rison with the average, respectively). Taking into account the fact that 17.6 percent of households suffering from five or more exclu-sion characteristics have at least one unemp-loyed person, social inclusion policies and interventions should focus on education, training and retraining, and employment.
There are significant differences in living conditions among settlements based on their size and type, which contributes to different levels of social exclusion of their residents. In particular, rural inhabitants are the most vulnerable group (risk of exclusion
Households with Characteristics of Acute Social Exclusion by Presents of Members with Higher Education and Unemployed Members, 2007 (%)
Total
Including
without unemployed
persons
at least one unemployed
person*all adults unemployed
No persons with higher education 88.2 68.2 15.6 4.4At least one person with higher education* 8.3 6.4 1.9 0.0All adults with higher education 3.5 3.4 0.1 0.0Total 100.0 78.0 17.6 4.4
* Number of unemployed persons or persons with higher education is less than the number of adult household members.
Source: Calculated based on data of the State Statistics Committee of Ukraine.
6.4TABLE
Risks of Acute Social Exclusion of Households by Presence of Members with Higher Education and Unemployed Members, 2007 (% Compared with Average)
Total
Including
without unemployed
persons
at least one unemployed
person*all adults unemployed
No persons with higher education 123.9 115.5 156.7 197.4At least one person with higher education* 45.2 40.2 77.6 –All adults with higher education 33.7 33.2 54.5 –Total 100.0 91.6 139.4 197.4
* Number of unemployed persons or persons with higher education is less than the number of adult household members.
Source: Calculated based on data of the State Statistics Committee of Ukraine.
6.3TABLE
UNDP_magazine_ENG_v10j.indd 98UNDP_magazine_ENG_v10j.indd 98 04.07.2011 17:40:2404.07.2011 17:40:24

NATIONAL HUMAN DEVELOPMENT REPORT 2011 99
is 2.5 times higher than that in big cities and 65.0 percent higher than the average). Rural inhabitants represent 48.3 percent of all excluded households. This can be attributed in particular to the fact that big cities have a better variety and accessibility of socio-cultural services, higher levels of develop-ment, labour markets with greater capacity and higher incomes of residents, which contribute to better social inclusion overall. Although it may be unrea listic to target the levelling off of living conditions between rural and urban areas in the short run, there is a clear need to reform health care, educa-tion and social protection systems which would improve access of the population and in particular of residents of rural areas to basic social services.
Assessment of Critical Social Exclusion
In total, 16.9 percent of households live in conditions of critical social exclusion (with seven or more characteristics of exclusion). Households in this category contain almost no differences in demographic composition with those suffering from acute exclusion: the share of families with minors is slightly higher and the share of families consisting exclu-sively of pensioners is somewhat lower.
However, the risks of households ending up living in conditions of critical exclusion are not the same as for the group suffering from
6.2
acute social exclusion. In particular, the risk of critical exclusion is very high for families with children: 2.7 times higher than the average in the country and 2.8 times higher than the risks facing families without children.
The difference in risks taking into account unemployment and educational level of household members is even higher. In partic-ular, the presence of at least one unemp-loyed person results in a 1.7 times higher risk of critical exclusion than the average and 2 times higher than risk for families without unemployed people. The presence of at least one unemployed person results in a high proba bility of acute exclusion turning into critical exclusion (18.4 percent). Households
Risks of Acute Social Exclusion by Settlement Type, 2007 (% Compared with Average)
Risk of acute social exclusion
Big city 63.3Small town 94.3Rural area 155.6
Source: Calculated based on data of the State Statistics Committee of Ukraine.
6.5TABLE
Households with Characteristics of Critical Social Exclusion by Number of Children and Pensioners, 2007 (%)
TotalIncluding
without children with 1–2 children with 3 or more children
Without pensioners 47.4 18.1 26.2 3.1At least one pensioner but number of pensioners less than number of adults
21.2 11.4 8.8 1.0
All are pensioners 31.4 31.4 0.0 0.0Total 100.0 60.8 35.0 4.1
Source: Calculated based on data of the State Statistics Committee of Ukraine.
6.6TABLE
Structure of Households with Acute Social Exclusion by Settlement Type, 2007 (%)
Source: Calculated based on data of the State Statistics Committee of Ukraine.
6.2FIGURE
UNDP_magazine_ENG_v10j.indd 99UNDP_magazine_ENG_v10j.indd 99 04.07.2011 17:40:2404.07.2011 17:40:24

CHAPTER 6. MULTIDIMENSIONAL ASPECTS OF SOCIAL EXCLUSION IN UKRAINE 100
expe riencing so-called “all family” unem-ployment, which is common in small mono-company towns, face even bigger barriers to social inclusion. Their risk of critical exclusion is 2.7 times higher than the average and 3.2 times higher than the risk of families with no unemployed people (and 28.0 percent higher than the risk of acute exclusion of such families). The probability of acute unem-ployment becoming critical is equal to 16.9 percent. Therefore, the presence of one or more unemployed persons is a very impor-tant factor in the critical exclusion of many households.
Taking into account the fact that house-holds with unemployed people amount to
almost one-fourth of families with seven or more characteristics of exclusion, employ-ment policy should be adjusted to address the goals of social inclusion in this regard.
The presence of individuals with higher education in households protects them almost completely against social exclusion, mainly because such individuals are highly competitive in the labour market, which results in their significantly higher than average levels of employment and income, high social status and confidence in the future. Even if those with higher education work in fields different from those in which they were trained or taught, their adaptability to different job requirements means they are
Households with Characteristics of Critical Social Exclusion by Presence of Members with Higher Education and Unemployed Members, 2007 (%)
TotalIncluding
without unemployed persons
at least one unemployed person*
all adults unemployed
None 92.1 66.7 19.3 6.1At least one* 5.8 4.3 1.5 0All adults 2.0 1.9 0.1 0Total 100.0 72.9 20.9 6.1
Note: * Number of unemployed persons or persons with higher education is less than the number of adult household members.
Source: Calculated based on data of the State Statistics Committee of Ukraine.
6.9TABLE
Risks of Critical Social Exclusion of Households by Different Demographic Composition, 2007 (% Compared with Average)
TotalIncluding
without children with 1–2 children with 3 or more children
Without pensioners 88.7 76.1 92.2 246.2At least one pensioner but number of pensioners less than number of adults
109.4 100.1 113.4 413.5
All are pensioners 115.5 115.5 – –Total 100.0 97.7 96.8 273.5
Source: Calculated based on data of the State Statistics Committee of Ukraine.
6.7TABLE
Risks of Critical Social Exclusion of households by Presence of Members with Higher Education and Unemployed Members, 2007 (% Compared with Average)
TotalIncluding
without unemployed persons
at least one unemployed person*
all adults unemployed
No persons with higher education 129.5 113.1 193.9 273.4At least one person with higher education* 31.9 27.3 61.8 –All adults with higher education 18.7 18.4 30.3 –Total 100.0 85.7 165.1 273.4
Note: * Number of unemployed persons or persons with higher education is less than the number of adult household members.
Source: Calculated based on data of the State Statistics Committee of Ukraine.
6.8TABLE
UNDP_magazine_ENG_v10j.indd 100UNDP_magazine_ENG_v10j.indd 100 04.07.2011 17:40:2404.07.2011 17:40:24

NATIONAL HUMAN DEVELOPMENT REPORT 2011 101
in high demand in the labour market. The risk of critical social exclusion of households with at least one person with higher education is 3 times lower (if all household members have higher education, the risk is 5.3 times lower) than the average and 4 times (6.9 times) lower than the risk facing families without people with higher education.
Critical exclusion is much more wide-spread in rural areas, especially in compa-rison with big cities: the risk calculated of rural inhabitants exceeds that for inhabitants of big cities by three times (and the average by 67 percent). The risk of critical exclusion is 7 percent higher than the risk of acute exclu-sion of the rural population. However, 52 percent of households suffering from seven or more characteristics of exclusion are rural inhabitants. In this context, providing rural inhabitants with proper access to medical, educational, communicational and trans-port services and installing modern ameni-ties in rural houses becomes a top priority.
Conclusions
A multidimensional assessment of social exclusion identifies the most vulnerable groups that cannot overcome barriers to social inclusion by themselves. It is clear that these groups need support from the state, local communities and civil society to achieve social inclusion.
Two levels of social exclusion have been identified. Acute exclusion occurs when households have at least five characteristics of exclusion among broader characteristics related to their lifestyle and conditions of living. Critical exclusion occurs when house-holds have at least seven of such social exclu-sion characteristics. Overall, 37.7 percent of all
households live in acute social exclusion in Ukraine and 16.9 percent are in critical social exclusion.
A typical household facing acute or criti cal social exclusion (has five or seven exclusion characteristics) lives in a rural area and consists of working-age people and one or two children. Usually, all adult members of such a household have complete general secondary education, and they can be employed or unemployed. In most of cases, their level of living is lower than the monetary poverty line.
Households with Characteristics of Critical Social Exclusion by Settlement Type, 2007 (%)
Source: Calculated based on data of the State Statistics Committee of Ukraine.
6.3FIGURE
Risks of Critical Social Exclusion by Settlement Type, 2007 (% Compared with Average)
Risk of critical social exclusion
Big city 54.1Small town 96.2Rural areas 167.0
Source: Calculated based on data of the State Statistics Committee of Ukraine.
6.10TABLE
UNDP_magazine_ENG_v10j.indd 101UNDP_magazine_ENG_v10j.indd 101 04.07.2011 17:40:2504.07.2011 17:40:25

CHAPTER 6. MULTIDIMENSIONAL ASPECTS OF SOCIAL EXCLUSION IN UKRAINE 102
UNDP_magazine_ENG_v10j.indd 102UNDP_magazine_ENG_v10j.indd 102 04.07.2011 17:40:2504.07.2011 17:40:25

NATIONAL HUMAN DEVELOPMENT REPORT 2011 103
C H A P T E R
7 Conclusions and Policy Recommendations for the Social Inclusion of All
Social inclusion policy should be informed by an objective analysis of drivers and outcomes of social exclusion. Policy priorities should be defined based on a thorough assessment of the acuteness and extent of exclusion. Once adopted, policy promoting social inclusion should be supported by adequate action plans and state funding.According to the results of the multidimensional assessment of the extent and scope of social exclu-sion, 16.9 percent of households in Ukraine are in a critical situation and face high risk of marginalization. More than half of them reside in rural areas. A typical household that faces acute or critical social exclu-sion is one that lives in a rural area and consists of working-age people and one or two children. Usually, all adult household members have complete general secondary education, and they are employed or unemployed. In most of cases, they live below the monetary poverty line.
The multidimensional assessment allowed also to identify the most vulne-rable population groups that cannot overcome barriers to social inclusion by themselves and need assistance from the state, local communities and civil society. Sometimes, the human rights of socially excluded groups are violated. For example, elderly people often cannot buy the necessary medica-tions and access adequate health care services owing to lack of funds; young people cannot cover tuition costs and continue their education for the same reason. Social exclusion is not a static pheno-menon; everyone is at risk of being left out of society. Vulnerable groups are indeed overrepresented among the socially excluded, but not everyone from these groups is excluded, and not all the excluded are from these groups. The determinants of social exclusion are linked to and reinforce one another. Exclusion in one area can trigger a series of exclusions in other areas. Multiple interventions implemented in a concerted manner are needed, reflecting the complexity and the dynamic nature of social exclusion. Therefore, social inclusion policies should include the following components:
• Measures to foster general economic and political reforms aimed at comprehensive improvement of the social and economic situation, sustai-nable economic growth, provision of all groups with access to basic social services and economic resources, etc.;
• Targeted measures aimed at elimi-nating the barriers to inclusion that specific groups face.
There is a need to adopt legislation on social exclusion. This should define “social inclusion” and “social exclu-sion” taking into account international standards and national specifics; estab-lish clear coordination and sequencing links among relevant legislative acts; and identify priority directions for the implementation of social inclusion policy.In addition to policies and specific interventions promoting social inclu-sion, the state should actively promote diversity and tolerance. There is a need to implement awareness-raising campaigns and revise educa-tion curricula, targeting children and youth in particular, to nurture their willingness and readiness to interact with individuals of different ethnic and religious backgrounds, view-points and lifestyles.
UNDP_magazine_ENG_v10j.indd 103UNDP_magazine_ENG_v10j.indd 103 04.07.2011 17:40:2504.07.2011 17:40:25

CHAPTER 7. CONCLUSIONS AND POLICY RECOMMENDATIONS FOR THE SOCIAL INCLUSION OF ALL104
Overcoming Exclusion from Political Life
Enhancing people’s trust in political insti-tutions is a key task, one which will define the success of the inclusion policy and will represent a cornerstone of any comprehen-sive social inclusion system. The majority of the population appears to have pessi-mistic expectations of political processes to be constant; laws and regulations adopted may often remain statements of good intent without any follow-up implementation and proper reporting. Traditions of cooperation and dialogue between the authorities and the population are not yet well developed. To address the barriers to political inclusion, it is necessary to:• Bring real legal practices in line with the
adopted laws;• Establish a practice of systematic clarifi-
cation of the authorities’ plans, by provi-ding to the population a clear and honest presen tation of expected results and possib le risks;
• Ensure connections between fundamental Government reforms and the population’s expectations by introducing a mandatory requirement to conduct public consulta-tions.In general, the population does not
appear to believe that opportunities exist to influence policy decisions. This results in low level of participation in political life. These trends are observed at both national and local levels. This is a consequence of the absence of a deve loped civil society on the one hand and the extremely limited legal culture in Ukraine on the other hand. Combined with corruption, this creates almost insumountable barriers for the majority of the population to influence any authority decision and monitor its proper execution. To facilitate public participation in decision-making and encourage more active involvement in the public life, it is important to:• Hold awareness-raising interventions to
familiarize the population with opportuni-ties to be involved in and monitor the acti-vities of the authorities;
• Popularize legal knowledge and societal rules of behaviour;
• Simplify the mechanism of registration of CSOs.The inclusion of all groups in political life
entails the mobilization of communities that do not currently realize their political rights. The most important right is the right to
7.1 vote in referendums and elections. Electoral activity is quite differentiated (by age, place of residence, educational level and gender) in present-day Ukraine. According to admi-nistrative data, people with the highest elec-toral activity are the elderly. Young people are less active, whereas men are more active than women. Ethnically, Ukrainians are the most electorally active groups, compared to Russians and other groups. In light of these findings, it is necessary to enhance the elec-toral activity of young people, women and ethnic minorities.
Extremely low representation of women at the highest levels of the legislature and the executive is often a result of prejudices among both the wider population and civil servants. In addition to measures addressing these prejudices, specific actions aimed at achieving gender parity within representa-tive authorities and at higher levels of the public administration should be imple-mented.
Inclusion of immigrants into the Ukrainian society is another challenge; neglecting this issue would be destructive to the poli-tical environment in general. Therefore, the following actions should be implemented:• Maximum legalization of immigrants, and
proactive support to the legalization process;
• Provision of immigrants with access to quality medical and educational services.
Overcoming Exclusion from Cultural Life and Education
State policy in the field of culture must not be limited to the management and care of establishments of culture, educa-tion and art which are public and communal pro perty. Rather, it must address various forms and genres of cultural, artistic and leisure activities offered by both the commercial and the not-for-profit sectors. It also has to cover modern culture and the electronic massmedia. The necessary legal, institutional, financial and administrative instruments of cultural policy should be introduced to ensure their dynamic develop-ment in accordance with the interests of Ukraine and its citizens. For this purpose, it is important to:• Establish optimal conditions for the preser-
vation and development of all national languages, cultures, religions and tradi-tions, and also the protection of historical monuments, above all those which are under threat of disappearance;
7.2
UNDP_magazine_ENG_v10j.indd 104UNDP_magazine_ENG_v10j.indd 104 04.07.2011 17:40:2504.07.2011 17:40:25
NATIONAL HUMAN DEVELOPMENT REPORT 2011 105
• Ensure the comprehensive development and functioning of the official Ukrai nian language and strengthen its role as a factor of social inclusion for citizens and groups of citizens of different nationalities and as a factor of consolidation of the Ukrainian nati on;
• Ensure that the Russian language and other ethnic minorities’ languages have their place in the educational system and can be used freely by their native speakers;
• Elaborate and implement Government programmes of protection and develop-ment of national culture;
• Stimulate scientific research on the his-torical heritage and cultural uniqueness of diffe rent social and ethnic groups;
• Create electronic databases of national cultu ral achievements in the areas of arts, music, song and architecture, including historical monuments; ensuring, in accor-dance with the legislation, free access to these databases, and assist in the produc-tion of electronic and published refe rence and information products on this basis ;
• Encourage cross-cultural dialogue and awareness raising through the education system, mass media and other commu-nicative resources of knowledge on his-tory, culture, religion and traditions of all culturally distinctive groups of the Ukrainian population for their mutual inte-ractive learning and understanding;
• Develop an atmosphere of tolerance, respe ct for values and collaboration of indi viduals and groups differing in ethnic, cultural, linguistic and religious origin;
• Respect the spiritual and cultural values of the multi-ethnic Ukrainian nation by pro-moting achievements in art, literature and culture by all nationalities in Ukraine;
• Create the conditions for overcoming the negative stereotypes and myths related to the nationally diverse groups of the Ukrainian population and to indivi duals belonging to these groups, in particular by distributing information about posi-tive expe riences in terms of their political, cultu ral and other forms of cooperation in ancient and modern history;
• Support studies on issues of cultural exclu-sion, improve statistics and conduct rele-vant targeted studies;
• Strengthen public oversight and state repor ting on the implementation of in-ternational obligations and principles of equal rights and opportunities for Ukrai-nian citizens in the field of culture; moni-tor cases of discrimination and exclusion
and also policies to overcome and prevent such situations.Overcoming exclusion in the field of
education can be achieved through equal access of the population to high-quality educational services to improve competitive-ness in the labour market. The main barriers to inclusion in education are limited avail-ability of material and technical equipment in a large number of educational institutions, limited staffing, inefficiency of the educa-tional institutions network and their inadapt-ability (physical access and teaching metho-dologies) to the requirements of persons with special needs.
Regional and inter-settlement differences in terms of quality of education should be reduced. In addition, a whole range of legal, organizational, economic, scientific and pedagogical issues need to be addressed to promote inclusion into education. There is a need to:• Optimize educational institutions’ net-
works at all levels, taking into account demographic realities and ensuring an increase in the quality of educational services;
• Equip all educational institutions with modern computers and internet connec-tions;
• Develop remedial educational prog-rammes and mechanisms to bring back to school children and young people who have ended up outside the education system;
• Develop and implement a series of measu-res on integrated socialization of pupils from boarding schools;
• Develop a system of targeted training of pedagogical personnel for school and pre-school educational institutions of rural areas and small and mono-company towns;
• Establish inclusive education for children and young people with special needs;
• Strengthen the responsibility of families and local authorities to prevent the viola-tion of children’s rights to complete gene-ral secondary education;
• Improve primary professional orientation and vocational training in senior grades of general secondary school.
Overcoming Exclusion from Economic Life
Overcoming social exclusion based on status in the labour market. Employment is one of the key forms of a person’s partici-
7.3
UNDP_magazine_ENG_v10j.indd 105UNDP_magazine_ENG_v10j.indd 105 04.07.2011 17:40:2504.07.2011 17:40:25

CHAPTER 7. CONCLUSIONS AND POLICY RECOMMENDATIONS FOR THE SOCIAL INCLUSION OF ALL106
pation in public life and is a pre-condition for his/her social inclusion in other areas. The importance of employment policy for social inclusion is reflected in EU Directives. In particular, Directive No. 17 sets a goal of full employment, high levels of quality and productivity at work, social solidarity and inclusion. This foresees, primarily, enhancing labour supply, inclusion and provision of support to as many people as possible in the field of employment. Policy actions should be developed taking into account the needs of vulnerable groups that are at risk of exclusion from the labour market (youth, women and the elderly).
To enhance the quality and productivity of the workforce and the employability of gradua tes of educational institutions, it is important to enhance the alignment of education and training programmes with the needs of the labour market, to decrease gaps between different segments of the labour market, to improve remuneration and taxa-tion mechanisms and to modernize the social protection system.
Ukraine’s European Choice, which corre-sponds to the national interests of social solidarity and inclusion, has to be supported through the establishment of the above-mentioned principles of policy on the labour market and employment. Motivating the population to engage in economic activities, overcoming unemployment and creating the conditions for decent work should be the priorities. Specific policy measures should cover: • Create new job opportunities, particular-
ly by promoting the development of so-cial entrepreneurship, i.e. private or self-governing organizations manufacturing goods and providing services (including those free of charge) for local communi-ties;
• Improve the existing legal framework and eliminate any provisions that create grounds for discrimination in terms of acces s to work or status of employment;
• Strengthen public oversight of comp-liance with labour and social legislation;
• Restructure employment towards enhan-cing the role of highly technological produc tion and knowledge-intensive services, improve working conditions;
• Improve labour market support services and enhance access to infor mational re-sources and communication on the labour market situation;
• Promote labour force mobility, including commuting and professional retra ining;
• Promote work-life balance and the prin-ciples of family-oriented policy among employers;
• Ensure genuine gender equality in labour rights. In particular enhance opportunities for the realization of women’s labour po-tential by increasing the retirement age to the level set for men; achive gender parity at the highest positions in the execu-tive and on election lists; raise awareness on principles of equa lity in work and the social rights of women and men; and intro-duce administrative liability for gender dis-crimination;
• Enhance job opportunities for rural popu-lations and inhabitants of small towns, inclu-ding the development of local social services and infrastructure, stimulation of commu-ting, transferring jobs from big cities.Overcoming social exclusion owing to low
incomes. Low remuneration levels and ineffi-cient income redistribution are the biggest challenges to overcoming social exclu-sion and poverty in Ukraine. Taking this into account, the focus of policy should be not only on alleviating absolute poverty but also on curtailing inequality and relative poverty. Policy actions should include:• Coordination of the reproduction and
stimulating functions of all types of soci al transfers, particularly the provision of mini-mum unemployment benefits to insu-red people at an amount not lower than subsis tence level for those who have lost ability to work;
• Revision of the standards used to define the minimum state social guarantees on a regular basis, including their indexation taking into account actual inflation levels;
• Utilization of economic stimuli instead of administrative enforcement to motivate emplo yers to hire non-competitive indivi-duals, particularly by establishing a spe-cial minimum wage size (75–80 percent of the general minimum) for employees younger than 18 years of age and also for a certain time period (3–6 months) for indi-viduals who are searching for their first job or who have had a significant break from employment;
• Adherence to social equity principles when redistributing state resources aimed at alleviating poverty; allocating to civil society and private sector a wider role in overseeing the spending of budget funds;
• Improvement of the legal framework and mechanisms of assistance to low-income families in order to enhance targeting and decrea se “errors of exclusion”, particularly
UNDP_magazine_ENG_v10j.indd 106UNDP_magazine_ENG_v10j.indd 106 04.07.2011 17:40:2504.07.2011 17:40:25

NATIONAL HUMAN DEVELOPMENT REPORT 2011 107
of the methodology for calculating the ag-gregated family income for the purpose of determining eligibility for targeted social assistance;
• Minimization of possible negative conse-quences of social protection programmes, such as a decrease in economic activities among the population and a strengthe-ning of the welfare mentality in society. These goals can be achieved by impo-sing relevant additional eligibility criteria for those of working age to participate in programmes and improving the system of soci al inspection, including its legal foun-dations;
• Introduction of a progressive taxation scale for personal incomes as the means to decrease social inequality.Overcoming social exclusion based on
housing conditions. Decent housing condi-tions along with income level determine full participation in public life. Policy in this area should aim to enhance the availability of housing and decrease the burden of the cost of housing and utility services on the family budget. Policy actions should ensure:• Development of a system of social and
temporary housing;• Improvement of the access to mortgages
(particularly for young families);• Stimulation of the development of the
long-lease housing market; • Improvement of housing infrastructure.
Overcoming Exclusion from the Health Care System
Policy to eliminate barriers to inclusion into the health care system should be aimed at ensuring equal access of the population to adequate medical services regardless of place of residence, income level or other aspects. The reform of the health care system must ensure a proper balance between state guar-antees and the available financial resources. It is necessary to conduct a structural reorgani-zation of the health care system based on the principles of primary care and a transfer from an administrative to a contractual model of health care provision.
The main directions of structural reforms of the health care system aimed at ensuring availability, accessibility and quality of health care should include:• Elimination of the fragmentation of health
care resour ces;• Ensuring structural, organizational, finan-
cial and economic separation of primary,
7.4
secondary and tertiary health care, with gradual increases in expenditures on pri-mary care for its further development, including of the institute of family doctors;
• Improvement of the material and techni-cal base of health care institutions;
• Reorganization of hospitals into indepen-dent not-for-profit municipal institutions;
• Optimization of the health care institution network;
• Revision of current procurement and supply management practices to ensure more effective use of financial resources;
• Employment of highly qualified managers within the health care system. The budget funding of the health care
system should be maintained within the minimum standards set by legislation and guaranteed by the state. Health care insu-rance must be introduced in a voluntary form to cover additional health care services for individuals who have sufficient means to pay for it. This will make it possible to alleviate the burden on the state-funded system to support more vulnerable groups.
To overcome the exclusion of the rural population from health care, it is recom-mended to:• Introduce incentives for health care
workers to provide better quality services in rural area;
• Reorganize inefficient rural hospitals into centres of primary care.
Overcoming Exclusion from the Social Protection System
There is, poor targeting of social assis tance and levels of protection of vulnerable groups appear to be insufficient. To address these shortcomings, the system of social support should be modernized and targeting of the majority of types of social assistance should be increased. This will allow for a reduction in support provided to relatively better-off fami-lies and a heightened focus on needy fami-lies. This will, in its turn, increase coverage of the poor population with social assistance, raising the amount of benefits and improving social equity in the distribution of state funds allocated to social support.
In order to improve the effectiveness of the social protection system, there is a need to establish a single database of recipients of all types of social assistance, as well as to inte-grate all social providers into a single network, aimed at the complex provision of social assist-ance to those in need. To improve the quality of social services, it is necessary to ensure
7.5
UNDP_magazine_ENG_v10j.indd 107UNDP_magazine_ENG_v10j.indd 107 04.07.2011 17:40:2504.07.2011 17:40:25

CHAPTER 7. CONCLUSIONS AND POLICY RECOMMENDATIONS FOR THE SOCIAL INCLUSION OF ALL108
the development of a market of social serv-ices, reform boarding-type institutions and develop community-based forms of service provision, introduce social contracting-out and quality standards of services. It is also necessary to reorganize the institute of social inspection, which should be assigned the responsibility to carefully monitor the socio-economic conditions of specific individuals and households and to initiate preventive actions against their poverty and social exclu-sion. The focus of social policy should be put on active measures of support, targeting able-bodied people in particular.
It is important to ensure the participa-tion of self-employed individuals in obliga-tory social insurance and to encourage their contribution to voluntary pension and medical insurance systems. These measures will contribute to a maximum inclusion of people in the social insurance system.
To improve communications for rural residents, it is necessary to ensure that local roads are constructed or repaired. These can be financed jointly by the state and local communities. Special transport routes for inhabitants of remote settlements should be introduced.
To decrease the level of social exclusion based on prejudice, it is important to:• Conduct educational and awareness-
raising interventions aimed at developing tolerant attitudes towards certain popula-tion groups (people with disabilities, the elderly, sexual minorities, people living with HIV,etc.);
• Establish criminal responsibility for any act of discrimination (during the hiring pro-cess, provision of medical or social services, etc.) based on prejudice.
Overcoming Social Exclusion of Certain Groups of Population
This Report identifies a number of socially excluded groups and barriers to their inclu-sion. Although the sectoral recommenda-tions provided above address some barriers to social inclusion, there is a need to develop and implement policy and programme inter-ventions responding to the needs of specific socially excluded groups and groups at risk of social exclusion. Recommendations targeting some vulnerable groups cover the following.
Orphaned children. Children and teena-gers deprived of parental care, especially those living in boarding schools, became the most unprotected and excluded population
7.6
groups in Ukraine during the socio-economic and political transformation. Boarding school-type institutions often have structured time schedules and activities which reduce opportunities for such children to make independent decisions on many important life issues. They operate in a manner that is detached from society, which may make it impossible for children to communicate and interact with the surrounding world. All this may result in challenging behaviour, poor socialization and low motivation to partici-pate in adult life and society. As such, children graduating from boarding schools are often unprepared for active involvement in society life and are less competitive in the labour market.
Boarding school-type institutions have challenges in terms of improving their methods of education and upbringing of children. Absence of housing remains one of the most important problems boarding school graduates encounter, despite their rights to housing declared by the state.
The following actions are necessary for the fully fledged inclusion of orphaned chil-dren into public life and the development of their social skills:• Provide them with opportunities to obtain
high-quality education and labour skills;• Ensure their enrolment in mainstream
schools with peers who live with parents;• Develop vocational education and oppor-
tunities for them to obtain a profession within the boarding school institution that will increase their chances of employment after graduation;
• Create a lifestyle within the institution that approximates as far as possible the “family lifestyle”;
• Develop the skills necessary for household life, including housekeeping;
• Implement social and psychological trai-ning, develop interpersonal communica-tion skills, skills for collective activities and skills for organization of an independent life;
• Develop social and personal mobility and the ability to evaluate life situations and make appropriate decisions;
• Develop healthy lifestyles without bad habits and implement physical training that will support adaptation to job require-ments;
• Create different models of family relation-ships: family groups within the orphanage, foster parent models, guardian families, etc.;
• Carry out systematic outreach and preven-tion work with vulnerable families, increase
UNDP_magazine_ENG_v10j.indd 108UNDP_magazine_ENG_v10j.indd 108 04.07.2011 17:40:2504.07.2011 17:40:25
NATIONAL HUMAN DEVELOPMENT REPORT 2011 109
the prestige of adoption of orphaned chil-dren;
• Solve housing and property challenges, particularly problems with the provision of social housing after a person’s graduation from boarding school.Families with many children. Families with
many children face a high risk of social exclu-sion. Many such families are living below the poverty line and the issue of adequate nutri-tion is critical. Numerous factors contribute to higher poverty levels among these fami-lies. Often, family members have to spend a significant amount of time taking care of chil-dren, which reduces their competitiveness on the labour market. Employers have low incentives to hire workers with significant family duties. Insufficient provision of this category of families with adequite housing conditions is also a critical issue.
Children from such families often demon-strate lower self-esteem in comparison with their peers from families with fewer children, which can negatively affect their future. In addition to socio-economic and psycholog-ical problems, such families also experience health issues.
To promote the inclusion of families with many children in public life, it is important to:• Ensure an improved financial situation for
families with many children, including in-creased targeted assistance, provided to such families, taking into account their in-come level;
• Assist in the employment of members of families with many children, stimulate their economic activity and self-employment;
• Provide employees who have three or more children with favourable conditions for combining labour activities with family duties;
• Assist in solving housing problems;• Ensure social comfort for families with
many children and enhance their mobility;• Improve availability and accessibility of
health care services for such families;• Improve informational and consultative
assistance for such families by enlarging the network and stimulating the activi-ties of social service centres, family centres, etc.;
• Promote and strengthen moral and family values and views on the social attractive-ness and prestige of families with many children.Persons with disabilities. People with disa-
bilities remain excluded from many areas of social life in Ukraine. Most of all, they suffer from careless or negative attitudes on the
part of other people. Therefore, implementa-tion of outreach, education and awareness-raising activities aimed at building tolerance towards persons with disabilities should be strengthened significantly. The society should be made aware that persons with disabilities have the same rights and ability to participate fully in society, including in the labour market, and therefore should be informed about the professional successes and labour capacity of persons with disabili-ties. Furthermore, it is necessary to develop the culture of perception of persons with disabilities as equal members of the society in such socially important spheres of life as public administration, management, manu-facturing, science, finance, etc. The media and the educational sector should play an important role to ensure this.
One important pre-condition for the social inclusion of persons with disabilities is the creation of opportunities for them to live independent lives and participate in all spheres of life, by providing equal access to infrastructure, transport, information and communication. Therefore, the following actions must be implemented:• Provision of a sufficient number of rehabili-
tation means;• Creation of an accessible information and
communication environment, including emergency services, in particular to ad-dress the needs of persons with impaired hearing or vision and people with intellec-tual disabilities;
• Creation of a barrier-free environment through the reconstruction of roads and residential and public buildings, inclu-ding secondary and higher education and health care institutions;
• Improvement of the accessibility of public transport for persons with disabilities;
• Ensuring accessibility of workplaces.Quality education increases the chances
of all individuals for a better life, but persons with disabilities often cannot access it. Children with disabilities should have the opportunity to obtain education in a mainstream school with their peers, if possible. This will stimulate the socialization of children and youth with disabili-ties and help them achieve better educational outcomes and acquire life and labour skills. Access for persons with disabilities to higher education can be ensured through the intro-duction of flexible curricula, training on an indi-vidual schedule, distance learning, etc.
Exclusion of persons with disabilities is closely related to their participation in the labour market. The following measures can
UNDP_magazine_ENG_v10j.indd 109UNDP_magazine_ENG_v10j.indd 109 04.07.2011 17:40:2504.07.2011 17:40:25
CHAPTER 7. CONCLUSIONS AND POLICY RECOMMENDATIONS FOR THE SOCIAL INCLUSION OF ALL110
involve persons with disabilities in the labour market:• Enable the adaptation of workplaces to
the needs of persons with disabilities (adaptation of the workplace, creating special jobs);
• Develop flexible forms of employment (homework, flexible working hours, etc.);
• Provide free access to a general curriculum for orientation and training;
• Overcome discrimination against persons with disabilities in employment through the elimination of separate vacancies for “general persons” and “persons with disabilities”.Immigrants. International experience
suggests that the following factors promote inclusion of immigrants: • Naturalization; granting citizenship to im-
migrants;• Scale of immigrants’ arrival in a host coun-
try: small groups of immigrants usually in-tegrate quickly into the recipient country and successful inclusion of the first groups of immigrants makes it easier to adapt to a host society for consequent contingents of immigrants from the same countries; large contingents of immigrants of the same ethnic origin that arrive in a short pe-riod of time usually form constant diaspo-ras following their own laws beyond the legislative framework of the host country;
• Proficiency in the language of the host country;
• Tolerance in society and harmony be-tween different population groups;
• Inclusion of immigrants in the economic life of society.Ukraine’s population is decreasing,
including its working-age population. As such, there is a need to prepare citizens to coexist with representatives of various ethnic groups. The first main component of state immigra-tion policy should be aimed at convincing the public that it is necessary to implement such a policy. The second component should involve interventions promoting tolerance and acceptance of immigrant groups in the Ukrainian society.
The following priority actions are recom-mended for policy in the field of immigration, ensuring inter-ethnic harmony and consoli-dation of the Ukrainian population:• Simplification of procedures to grant citi-
zenship to those already living in Ukraine;• Introduction of social advertising to en-
courage tolerance towards immigrants, elective lectures in higher educational in-stitutions and classes in schools on inter-
ethnic relationships, production of ap-propriate cultural television and radio programmes and publishing of popular lit-erature on the subject;
• Introduction of courses on the culture of different nationalities of Ukraine at the higher grades in schools to help pupils become acquainted with the culture, cus-toms and religious ceremonies of different ethnic groups of the Ukrainian population, including the most numerous groups of non-traditional immigrants;
• Provision of benefits to large and medium-sized enterprises that employ representa-tives of so-called “visible” minorities;
• Organization of Ukrainian language cours-es for immigrants.The state should also ensure vigorous
counteraction of racism and xenophobia, the eradication of so-called “skinhead” and other ultra-nationalist movements and control of the mass media with regard to publications fuelling inter-ethnic tensions.
Children of labour migrants. To prevent children left without parental care being orphaned, to decrease juvenile delinquency and to protect the rights of children, there is a need to identify families in which one or both of the parents have left to work abroad, taking into account the unwillingness of such families to disclose this information. There is a need to register these families in social services, even if there are no clear displays of deprivation.
The effective prevention or minimiza-tion of the negative consequences of labour migration for children requires a complex approach, promoting the horizontal collabo-ration of specialized institutional services and systems engaged in addressing child issues.
For instance, visa and registration units of the Ministry of Internal Affairs of Ukraine and consulate services of the Ministry of Foreign Affairs of Ukraine should register citi-zens leaving a country who have children of minority age, regardless of the declared goal of a trip, and, in case of necessity, provide information as requested by social services. Parents should be obliged to notify the juve-nile service before leaving. In rural areas, the village council should record such informa-tion. Registration of children of school or pre-school age should be performed by the schools or pre-school institutions. All infor-mation on children whose parents have gone abroad must be accumulated by local and regional family, children and youth departments with the assistance of child-hood protection inspectors. It is important to
UNDP_magazine_ENG_v10j.indd 110UNDP_magazine_ENG_v10j.indd 110 04.07.2011 17:40:2504.07.2011 17:40:25

NATIONAL HUMAN DEVELOPMENT REPORT 2011 111
strengthen the responsibility of custodians by formally fixing their rights and responsibili-ties through the establishment of temporary child custody for the period of the parents’ trip abroad.
To address the barriers to social inclusion of children of labour migrants, it is necessary to better focus the attention of social servi ces on these families, especially when both parents have left the country. Social services have to identify these children and parents or guardians; check out the correctness of documents on custody and care; if neces-sary, establish custody of a child and notify the school; find out how their basic material needs are satisfied and what conditions for education, development and leisure are in place; and, if needed, provide social support.
The Roma population. Policy for the inclu-sion of the Roma population should focus on improving their living conditions and preventing inter-ethnic conflicts between Roma and representatives of other ethnic groups. It will be more efficient if it takes into account the traditional specifics of a Roma lifestyle. The following aspects are especially important: 1) caste stratification and signifi-cant influence of Roma “elders” on social behaviour of communities; and 2) differences in the way Roma live (some live a settled life, for example in Transcarpatia; many have a nomadic lifestyle and have no desire to change this).
Taking into account the first aspect, the state should rely on Roma elders who are truly interested in positive social transforma-tions in their ethnic group and to ensure the neutralization of the negative influences of some elders whose position and activities are producing asocial behaviour of Roma (in this case, law enforcement bodies should play a leading role).
For Roma who live or want to live a seden-tary life, the following activities should be implemented in traditional permanent or temporary places of residence:• Construction of social housing (separate
household) for families and its free-of-charge provision but without the right to sell, give or alienate it in any other way;
• Targeted investments in the creation and development of social (including cultural) infrastructure of settlements;
• Creation of economic, material and techni-cal stimuli for Roma to conduct economic activities, such as the production of tra-ditional Roma crafts, the pursuit of other activities (e.g. growing vegetables, agri-cultural processing, etc.) and the participa-
tion of Roma in realisation of social hous-ing and other projects established for their benefit;
• Creation and organization of the work of pre-school institutions and also primary schools to prepare Roma children to pur-sue general and special secondary educa-tion with children of other nationalities.The policy aimed at the inclusion of Roma
who are not willing to live a sedentary life should include:• The study of traditional nomadic routes;• Creation of settlements of temporary and
permanent (mixed) residence with ad-equate social infrastructure, including boarding and regular schools for Roma children (adapted for work during the whole calendar year and especially in win-ter) in common stopping places for no-madic Roma. People living with HIV/AIDS. Policy for
the social inclusion of people living with HIV should create prerequisites for their full and harmonic integration into the society in all its essential functions and spheres. The key barrier relates to the stigma associated with HIV status, to discrimination and to violations of human rights in such important areas as health care, education and employment. Therefore, actions aimed at overcoming HIV-related stigmatization and reducing discrimi-nation to a zero level, along with legal protec-tion for those affected with HIV, should be at the centre of the policy of social inclusion.
Impact of such factors, as low awareness, fear, false stereotypes and prejudice, spread in society towards people living with HIV, should be addressed by activities in educa-tional and general informational spheres. The specific medical needs of people living with HIV include antiretroviral therapy and also substitution maintenance treatment for those with drug dependency. Both should be featured in the set of medical services offered by health care facilities throughout the country. Social services to support adher-ence to treatment, to ensure preventive care and social support as well as psycho-logical counselling should be fully present, in conformity with adopted standards. Also, for those living with HIV, who belong to the risk groups, it is essential to maintain re-socializa-tion programmes. Hence, the national HIV/AIDS programmes should include such serv-ices with sufficient budget.
Legal protection of people living with HIV and representatives of risk groups is absolutely essential in terms of both the effective fight against the epidemic and the social inclusion
UNDP_magazine_ENG_v10j.indd 111UNDP_magazine_ENG_v10j.indd 111 04.07.2011 17:40:2504.07.2011 17:40:25

CHAPTER 7. CONCLUSIONS AND POLICY RECOMMENDATIONS FOR THE SOCIAL INCLUSION OF ALL112
of these groups. Although Ukrainian legislation guarantees equal access to services regardless of status, and additional rights to people living with HIV, such people often find themselves legally unprotected, as laws concerning HIV/AIDS are not yet fully observed and enforced. Recommendations on building effective policy for social inclusion in this regard cover the development of mechanisms for moni-toring human rights inflictions and enforce-ment of legislation on HIV/AIDS.
Homeless people. As many homeless people as possible should be reintegrated into the society. To achieve this goal, the state and non-state service providers supporting the homeless should not be limited to provision of services such as night shelters, nutrition and medical assistance, but should also include interventions to help the homeless return to society and normal life. Re-socialization of homeless should include two stages: first, provision of assistance to satisfy basic needs (physiological); and second, actions aimed at social inclusion (facilitating employment, accessing education and qualifications, etc.).
The main directions of social inclusion policy for the homeless are the following:• Development of a network of social assist-
ance providers for homeless people which
should use complex strategies for their re-socialization;
• Elimination of provisions in legislative acts that may result in discrimination against the homeless;
• Strengthening of work of social services aimed at prevention of homelessness;
• Counteraction of the spreading of nega-tive stereotypes about the homeless in the mass consciousness.The barriers and challenges to social
inclusion facing vulnerable groups are complex and multidimensional. The recom-mended interventions should ensure social inclusion of vulnerable individuals and popu-lation groups in the political, cultural, social and economic life of the Ukrainian society. The process of elaboration of polices and the implementation of programmes of social inclusion should be supported by consulta-tion with representatives of these groups. The recommended actions, aimed at solving numerous and very complex problems, should be implemented by the Government together with local authorities, civil society and the private sector. The effectiveness of social inclusion policy and measures can only be ensured through a close collaboration of all members of the Ukrainian society.
UNDP_magazine_ENG_v10j.indd 112UNDP_magazine_ENG_v10j.indd 112 04.07.2011 17:40:2504.07.2011 17:40:25

NATIONAL HUMAN DEVELOPMENT REPORT 2011 113
References
Almashy, M. 2008. It is Topical: Tolerance. Kyiv.
Anand, S. and A. Sen. 2000. “The Income Component of the Human Development Index”.Journal of Human Development and Capabilities Vol. 1, No. 1.
Andrienko L. and O. Elisichenko. 2010. Modern Types of Social Inequality. Kyiv. http://www.rusnauka.com/1_KAND_2010/Psiholo-gia/12_57325.doc.htm
Armstrong, K.A. 2003. “Tackling Social Exclu-sion through OMC: Reshaping the Boun-daries of European Governance”. In T.A. Boerzel and R.A. Cichowski. The State of the European Union: Law, Politics and Society. Oxford.
Astakhov, V. ed. et al. 2007. Global Problems of Humankind as a Factor of Education systems’ Transformations. Materials of the Vth International Scientific and Applied Conference Seminar of Heads of HEI and Scien tific Researchers on the Problems of Education of the Region. Kharkov.
Atkinson, A.B., B. Cantillon, E. Marlier and B. Nolan. 2005. Taking Forward the EU So-cial Inclusion Process. Final report. http://www.ceps.lu/eu2005_lu/inclusion.
Balakireva, О.M. 2010. “Distinctive Features of Electoral Behavior of Voters during the Presidential Elections of 2010”. Ukrainian Socium No.1: 11–12.
Balakrishnan, R. 2005. Why MES with Human Rights? Integrating Macro Economic Strate-gies with Human Rights.
Barro, R. J. and J.W. Lee. 2010. A New Data Set of Educational Attainment in the World, 1950–2010. NBER Working Paper 15902. Cambridge, MA.
Beall, J. and L.-H. Piron. 2004. DFID Social Ex-clusion Review. London.
Bekker, G.S. 2003. Human Behaviour: Econo mic Approach. Chosen Papers on Economic Theory. Moscow.
Callan T., B. Nolan and C. Whelan. 1993. Re-sources, Deprivation and the Measurement of Poverty. Journal Soc. Pol. Vol. 22, No. 2.
Carothers, T. 2002. “The End of Transition Para-digm” .Journal of Democracy Vol. 13, No. 1.
Centre of Perspective Social Studies. 2007. So-cial Profile of the Homeless. Kyiv.
Centre “Our World”. 2005. Discrimination on the Grounds of Love. Kyiv.
Commission of the European Communities. 1993. Social Exclusion – Poverty and Other Social Problems in the European Commu-nity. Background Report. ISEC/B/11/93. Luxem burg.
D’Ambrosio, C. and C. Gradin. 2003. “Income Distribution and Social Exclusion of Chil-dren. Evidence from Italy and Spain in the 1990s”. Journal of Comparative Family Studies Special Issue on Family and Chil-dren Inequalities.
Degterenko, А.M. 2008. Ethnonational Aspect of Vital Activities of the Territorial Commu-nities of Ukrainian Northern Azov Region. Mariu pol.
Dekkers, G. 2003. Financial and Multidimen-sional Poverty in European Countries: Can the Former Be Used as a Proxy of the Latter? CEPS/INSTEAD IRISS Working Paper No. 2003–13.
Dollar, D. and R. Gatti. 1999. Gender Equality, Income and Growth: Are Good Times Good for Women? World Bank Policy Research Report on Gender and Development, Working Paper No.1. Washington, DC.
Drbohlav, D. 2004. Migration Trends in Selected EU Applicant Countries. Vol. II. Prague.
Eastern European Development Institute. 2008. Unheard Voices – Problems of Immi-gration of Human Rights and Liberties in Ukraine. Кyiv.
UNDP_magazine_ENG_v10j.indd 113UNDP_magazine_ENG_v10j.indd 113 04.07.2011 17:40:2504.07.2011 17:40:25
REFERENCES114
EC. 2004. Joint Report on Social inclusion. Offi-ce for Official Publications of the Euro-pean Communities. Luxembourg.
Economist Intelligence Unit. 2010. Democracy Index 2010: Democracy in Retreat. London.
European Foundation for the Improvement of Living and Working Conditions. 2004. Low Income and Deprivation in an Enlarged Europe. Dublin.
European Training Foundation. 2008. Ukraine: Labour Market Reviews. Project ENPI 08–14: Black Sea Labour Market Reviews.
Eurostat. 2000. European Social Statistics: Inco-me Poverty & Social Exclusion. 1st Report.KS–29–00–181-EN-C.
----------. 2003. European Social Statistics: Inco-me Poverty & Social Exclusion. 2nd Report.KS-BP–02–008-EN-C.
---------. 2010a. Combating Poverty and Social Exclusion. A Statistical Portrait of the Euro-pean Union 2010. Statistical books. Luxem-bourg.
---------. 2010b. The Social Situation in the Euro-pean Union 2009. Luxembourg.
Fernández-Masías, E. and J. Hurley. 2008. More and Better Jobs: Patterns of Employment Expan sion in Europe. ERM REPORT. Euro-pean Foundation for the Improvement of Living and Working Conditions. Dublin.
Förster, M. 2005. “The European Union Social Space Revisited. Comparing Poverty in the Enlarged European Union”. Journal of Comparative Policy Analysis Vol. 7, No. 1.
Freedom House. 2010. Freedom of the Press 2010. Broad Setbacks to Global Media Free-dom. Selected data from Freedom House’s annual Press Freedom Index. www.freedomhouse.org/uploads/pfs/371.pdf.
Fukuda-Parr, S. 2005. Human Rights Based Appro ach to Development – Is it Rhetorical Repackaging or a New Paradigm? HDR Net-work Issue 7.
Gaynor, C. and S. Watson. 2007. Evaluating DFID’s Policy on Tackling Social Exclusion: Baseline, Framework and Indicators. Lon-don.
Geyets, V. ed. 2009. Socio-Economic Situation in Ukraine: Consequences for People and the State. National Report. Кyiv.
----------. 2010. New Course: Reforms in Ukraine. 2010–2015. National Report. Кyiv.
Ghai, D. ed. 2006. Decent Work: Objectives and Strategies. Geneva.
Golovakha, Y. and N. Panina. 2008. Ukrainian Society 1992–2008: Sociological Monitoring. Kyiv.
Guboglo, М.N. 1976. Knowledge and Usage of the Second Language in Bilingual Envi-ronment (basing on Materials of Ethnoso-ciological studies). Outline of Reports Pre-sented at Meeting Dedicated to Results of Field Ethnographic and Antropological Studies 1974–1976. Dushanbe.
Gusev, А.B. 2007. Income and Housing Equali-ty of Citizens: Mechanism of Maintaining Social Stability. Problems of Management Theory and Practice No. 3.
Hale, H. 2005. “Regime Cycles: Democracy, Autocracy and Revolution in Post-Soviet Eurasia”. World Politics Vol. 58, No.1.
Hijab, N. and R. Zambrano. 2008. Gender Respon sive E-governance: Exploring the Transformative Potential. New York.
HRW. 2003. Women’s Work: Discrimination Against Women in the Ukrainian Labor Force. Kyiv.
Huntington, S. 1991. The Third Wave: Democ-ratization in the Twentieth Century. Nor-man.
Independent International Experts Commis-sion. 2010. A Reform Program for a New President of Ukraine. Proposals for Ukraine: 2010 – Time for Reforms. Co-Chairmen Anders A. and Paskhaver, O. Kyiv.
Institute of Demography and Social Stu dies of the National Academy of Sciences of Ukraine. 2007. Population of Ukraine: Socio- Demographic Problems of Ukrainian Vil-lage. Кyiv.
Institute of Demography and Social Studies of the National Academy of Sciences of Ukraine and UNICEF. 2010. Child Poverty and Disparities in Ukraine. Kyiv.
Institute of Demography and Social Studies of the National Academy of Sciences of Ukraine and Ukrainian Centre for Social Reforms. 2008. Marriage, Family, and Child-bearing Orientations in Ukraine. Кyiv.
UNDP_magazine_ENG_v10j.indd 114UNDP_magazine_ENG_v10j.indd 114 04.07.2011 17:40:2504.07.2011 17:40:25

NATIONAL HUMAN DEVELOPMENT REPORT 2011 115
Institute of Demography and Social Studies of the National Academy of Sciences of Ukraine, Ukrainian Centre for Social Re-forms and UNFPA. 2009. Family and Fami-ly Relationships in Ukraine: Current Situation and Development Tendencies. Кyiv.
Institute of Sociology of the National Acade-my of Sciences of Ukraine. 2008. Popula-tion of Ukraine: Births in Ukraine in the Con-text of Socio-Transformational Processes.Кyiv.
----------. 2009. Ukrainian Society in 1992–2009. Dynamics of Social Changes. Кyiv.
ILO.1998. Gender and Jobs: Sex Segregation of Occupations in the World. Geneva.
----------.2004. Breaking Through the Glass Ceiling : Women in Management. Geneva.
----------.2009a. Global Wage Report 2009. Gene va.
----------.2009b.World of Work Report: The Global Jobs Crisis. Geneva.
----------.2010. Global Employment Trends for Youth: Special Issue on the Impact of the Global Economic Crisis on Youth. Geneva.
IMF. 2010. Government Finance Statistics. Washington, DC.
International Coalition of Organizations “Stop TB Partnership”. 2006. Principles of Protec-tion of the Rights and Advocating Interests of Citizens of Ukraine under Conditions of Tuberculosis Epidemic.
Kabeer, N. 2006. Social Exclusion and the MDGs: The Challenge of “Durable Inequali-ties” in the Asian Context. Brighton.
Kaleniuk, І. 2008. Higher Education in the Glo-bal Environment. Higher School No. 9.
Kap, H. and J. Palme. 2009. Analysis of the Economic and Social Situation in Europe – Challenges for Social Inclusion Ahead. Stockholm.
Kieselbach, T. 2003. “Long-term Unemploy-ment among Young People: The Risk of Social Exclusion”. American Journal of Community Psychology Vol. 32, No.1–2.
Koroleva, Е. 2010. “Open Education as a Fac-tor of Overcoming Social Exclusion”. A Human Being and Education No. 2, Vol. 23.
Kotygorenko, V. 2004. Ethnic Antagonisms and Conflicts in Modern Ukraine: The Politologi-cal Concept. Кyiv.
Kremen, V. 2007.“Higher Education in Socio-Cultural Changes of the Present Time”.Higher Education of Ukraine No. 3, Vol. 26.
Kravchenko V. 2005. “Housing Problem – Naked Nerve of the Society”. Mirror of the Week Vol. 36, No. 411.
Kuras Institute of Political and Ethnic Studies of the National Academy of Sciences of Ukraine. 2008. Transcarpathian Region in Ethnopolitical Environment. Kyiv.
----------. 2009. Modern Ukrainian Politics. Analy tical Reports of the Kuras Institute of Political and Ethnic Studies of the National Academy of Sciences of Ukraine. Kyiv.
Lanjouw, J.O. 2000. Demystifying Poverty Lines.UNDP Discussion Paper. http://sitere-sources.worldbank.org/PGLP/Resources/LanjouwDemystifyingPovertyLines.pdf
Layte R., B. Nolan B. and C.T. Whelan. 2001. “Reassessing Income and Deprivation Approa ches to the Measurement of Pover ty in the Republic of Ireland”. Econo-mic and Social Research Institute Vol. 32, No. 3.
Lenoir, R. 1974. LesExclus: UnFrançaissur Dix. Paris.
Lezhnina, Y. 2010. Socio-Demographic Fac-tors Determining Risk of Poverty and Low-Income State Social Policy. Sociological Studies No. 3. Moscow.
Libanova, E. ed. 2006. Complex Demographic Forecast for Ukraine by 2050. Кyiv: Ukrainian Centre for Social Reforms.
----------. 2007. Human Development of Regions of Ukraine: Analysis and Forecast. Kyiv.
----------.2009a. “Assessing Human Develop-ment in Ukraine’s Regions”. Development & Transition: From Theory to Policy in Europe and the CIS Vol. 14, December.
----------. 2009b. Demographic Factors of Poverty . Kyiv.
----------. 2009c. Poverty and Unequal Opportu-nities of Children in Ukraine. Kyiv.
Maddison, A. 2010. Historical Statistics of the World Economy: 1–2008 AD. Paris.
UNDP_magazine_ENG_v10j.indd 115UNDP_magazine_ENG_v10j.indd 115 04.07.2011 17:40:2504.07.2011 17:40:25

REFERENCES116
Marlier, E., A.B. Atkinson, B. Cantillon and B. Nolan. 2007. The EU and Social Inclusion. Facing the Challenges. Bristol.
Meshkova, Т. and B. Zhelezov. Problem of Acces sibility of Education and Equality in Educa tional Opportunities in OECD Coun-tries.www.ecsocman.edu.ru/
Mincheva, L. and O. Vinnikov. 2009. A Map-ping Study of Civil Society in Ukraine. EU TACIS Programme for Ukraine.
Ministry of Education and Sciences of Ukraine. 2008. On Results of Development of the General Secondary and Pre-School Educa-tion in 2007/08 Academic Year and Tasks for 2008/09 Academic Year. Informational and Analytical Materials for the Final Board Meeting of the Ministry of Education and Sciences of Ukraine, 22 August 2008. http://www.mon.gov.ua/
----------. 2009. On Results of Development of the Secondary, Pre-School, and Out-of-School Education in 2008/09 Academic Year and Tasks for 2009/10 Academic Year. Infor mational and Analytical Materials for the Final Board Meeting of the Ministry of Educa tion and Sciences of Ukraine, 26 Augu st 2009. http://www.mon.gov.ua/
Ministry of Economy of Ukraine. 2010. Millen-nium Development Goals Ukraine 2010. Kyiv.
Ministry of Labour and Social Policy of Ukraine, Scientific and Research Institute of Social and Labour Relations and Na-tional Assem bly of People with Disabili-ties. 2008. National Report on Situation with People with Disabilities in Ukraine. Kyiv.
Ministry of Statistics of Ukraine. 1992. Social and Professional and Sectoral Structure of Ukrainian Population (According to the Data of 1989 Census). Kyiv.
Muffels, R.J.A. and D.J.A.G Fouarge. 2004. “The Role of European Welfare States in Explain ing Resources Deprivation”. Social Indicators Research Vol. 68, No. 3.
National Assembly of People with Disabili-ties. Ensuring Inclusion of Students through Building of Barrierless Educational Envi-ronment.Requirements to the Integrated Educa tional Institution. http://naiu.org.ua/
----------. 2008. Monitoring of Compliance of the National Legislation with UN Convention on the Rights of Persons with Disabilities.
Kyiv.www.mlsp.gov.ua/control/uk/pub-lish/article;jsessionid=9A9D8C855501394730F2490F584C5B60?art_id=90508&cat_id=35829
----------. 2009. Monitoring of Fulfilment of Rights of People with Disabilities. Kyiv.
North, D. 1990. Institutions, Institutio nal Change, and Economic Performance. Cambrid ge, New York.
OECD. 2005. Combating Poverty and Exclusion through Work. Policy Brief. www.oecd.org/publications/policybriefs
Osaulenko O. ed. 2004.Distribution of Popula-tion of the Largest in Number Nationalities through Gender and Age, Marital Status, Language Characteristics, and Educational Level According to the Data of All-Ukraine Census of 2001. Kyiv.
Ovtcharova, L. and D. Popova. 2005. Child Pover ty in Russia: Alarming Trends and Poli-cy Options. UNICEF. Moscow.
Piron, L.-H.and Z. Curran. 2005. Public Policy Responses to Exclusion. London.
Pirozhkov, S., E. Malinovskaia and A. Khomra. 2003. External Labour Migrations in Ukraine: Socio-Economic Aspect. Monograph, Council for National Security and Defense of Ukraine, National Institute of Problems of the International Safety. Kyiv.
Powell, W. and P. DiMaggio, eds. 1991.The New Institutionalism in Organizational Analysis. Chicago.
Pozniak O. ed. 2008. Migration Processes in Ukraine: Current Situation and Prospects. Uman.
Riley, J.C. 2001.Poverty and Life Expectancy. Cambridge.
Sen, A. 2000. Social Exclusion: Concept, Appli-cation and Scrutiny. Social Development Paper 1. Office of Environment and Social Development, ADB.
Spellerberg, A. 2001. Framework for the Measu rement of Social Capital in New Zea-land. Wellington.
State Employment Service of Ukraine. 2008. Round Table Devoted to Issues of Mono-functional towns.
State Statistics Committee of Ukraine. 2004. Sources for Means of Living of Ukrainian
UNDP_magazine_ENG_v10j.indd 116UNDP_magazine_ENG_v10j.indd 116 04.07.2011 17:40:2504.07.2011 17:40:25

NATIONAL HUMAN DEVELOPMENT REPORT 2011 117
Population According to the All-Ukraine Census of Population of Ukraine as of 2001. Kyiv.
----------. 2006. Basic Security of Ukrainian Popu-lation (Based on the Materials of Sampling Socio-demographic Survey). Kyiv.
----------. 2010. Self-Evaluation of Health and Level of Availability of Certain Types of Medi-cal Assistance in 2010. Kyiv.
----------. 2008a. Self-Evaluation of Households of Availability of Certain Goods and Services (Based on the Materials of Sampling Survey of Households in October 2007). Кyiv.
----------. 2010. Budget Household Survey. Kyiv.
Stewart, F., M. Barron, G. Brown and M. Hart-well. 2006. Social Exclusion and Conflict: Analysis and Policy Implications. Oxford.
Tolstych, N. 2003. “Social Exclusion in Present-Day Ukraine: Evaluation Trial”. Ukrainian Socium Vol. 1, No. 2: 81–85.
Townsend, P. 1979. Poverty in the United King-dom. Harmondsworth.
Troshchynsky, V. and О. Petroe. “Develop-ment of a Model for Assessment of the State Social Policy at the Regional Level”. Bulletin of the National Academy of Public Administration 207–244.
Tsakloglou, P. and F. Papadapoulos. 2001. “Identifying Population Groups at High Risk of Social Exclusion: Evidence from the ECHP”. In R. Muffels and P. Tsakloglou.eds. Social Exclusion in European Welfare States: an Empirical Study of Labour Market Inclu-sion and Social Exclusion in Panel Perspec-tive. Cheltenham.
Ukrainian Center for Social Reforms, State Sta-tistical Committee of Ukraine, Ministry of Health of Ukraine and Macro International Inc. 2008. Ukraine Demographic and Health Survey 2007. Calverton, MD.
Ukrainian Institute of Social Studies. Results of Questioning of Roma’s Community (Distri-bution of Responses to the Questions of the Questionnaire in Per Cent). Project: Prob-lems and Needs of Roma Population. Кyiv.
----------. 2010. Report on Collection of Informa-tion by Way of Case Studies. Kyiv.
UN. 1948. The Universal Declaration of Hu-man Rights. www.un.org/en/documents/udhr/.
----------. 2008a. From Exclusion to Equality. Reali zation of Rights of People with Disabili-ties.Kyiv.
----------. 2008b. Inclusive Education: The Way of the Future. International Conference on Education. 48th UN Session on Education, Science and Culture. International Confe-rence Centre, Geneva, 25–28 November 2008. www.ibe.unesco.org/.../General_Presentation-48CIE-4__Russian_.pdf
----------. 2010. Retooling of Global Develop-ment. Survey of the Global Economic and Social Situation, 2010. Department of Eco-nomic and Social Affairs. New York. http://www.un.org/ru/development/surveys/docs/wess2010.pdf
UNDESA. 2009. World Population Prospects: The 2008 Revision. New York.
UNDP. 2002. Human Development Report 2002. Deepening Democracy in a Fragmen-ted World. New York.
----------. 2003. Human Development Report 2003. Human Rights and Human Develop-ment. New York.
----------. 2005. Poverty Reduction and Human Rights. Practice Note.
----------. 2008a. Assessment of Vulnerability of People Living with HIV/AIDS in Ukraine. Kyiv.
----------. 2008b. Social Enterprise: A New Mo-del for Poverty Reduction and Employment Generation. An Examination of the Concept and Practice in Europe and the Common-wealth of Independent States. Bratislava.
----------. 2009. Poverty and Social Impact Analy-sis of the Economic Crisis in Ukraine. Kyiv.
----------. 2010a. Human Development Report 2010. The Real Wealth of Nations: Pathways to Human Development. New York.
----------. 2010b. Marginalised Minorities in Deve lopment Programming. A UNDP Resour ce Guide and Toolkit. Democratic Governance Group Bureau for Develop-ment Policy. New York.
----------. 2010c. Social Inclusion in Ukraine: Euro pean Choice and Social Sector Institu-tions. Kyiv.
----------. 2010d. Taxation.Issues Brief Gender Equality and Poverty Reduction. Issue 1 April 2010.
UNDP_magazine_ENG_v10j.indd 117UNDP_magazine_ENG_v10j.indd 117 04.07.2011 17:40:2504.07.2011 17:40:25
REFERENCES118
UNESCO Institute for Statistics. 2010. Corres-pondence on Education Indicators. Montreal .
Vakarchuk, І. 2008. “Higher Education of Ukraine – European Dimension: Situation, Problems, Prospects”. Higher School No. 3: 3–18.
Veritas. 2007. Report of the Project on Civil Moni toring of the Situation with Represen-tatives of the Vulnerable to HIV/AIDS Groups of Population in Odesa Region and Advoca-cy of Their Rights and Interests. Odesa.
Whelan, C.T., R. Layte and B. Maître 2002. “Mul-tiple Deprivation and Persistent Poverty in the European Union”. Journal of European Social Policy Vol.12, No. 2.
Whelan C.T., R. Layte, B. Maître and N. Nolan. 2001. “Income, Deprivation and Econo-mic Strain: An Analysis of the European Communi ty Panel”. European Sociological Review Vol. 17, No. 4.
World Bank. 2001. Engendering Development – Through Gender Equality in Rights, Resour-ces, and Voice. Washington, DC.
----------. 2008. Improving Intergovernmen-tal Fiscal Relations and Public Health and Educa tion Expenditure Policy: Selected Issues. Report #42450 UA. Poverty Over-coming and Economic Management Depart ment.Region of Europe and Cen-tral Asia. Poverty Reduction and Econo-mic Management Unit.Europe and Cen-tral Asia Region.
----------. 2010. World Development Indicators 2010. Washington, DC.
WHO. 2008. Human Rights, Health and Pover-ty Reduction Strategies. Health and Human Rights Publications Series Issue 5. Geneva.
----------. 2010. Trends in Maternal Mortality: 1990 to 2008. Estimates Developed by WHO, UNICEF, UNFPA and the World Bank. Gene-va.
Zdravomyslov, А. 1986.Needs, Interests, and Values. Moscow.
UNDP_magazine_ENG_v10j.indd 118UNDP_magazine_ENG_v10j.indd 118 04.07.2011 17:40:2504.07.2011 17:40:25

NATIONAL HUMAN DEVELOPMENT REPORT 2011 119
1A N N E X
Calculating the Human Development Indices: Graphic Presentation
UNDP_magazine_ENG_v10j.indd 119UNDP_magazine_ENG_v10j.indd 119 04.07.2011 17:40:2504.07.2011 17:40:25

120
UNDP_magazine_ENG_v10j.indd 120UNDP_magazine_ENG_v10j.indd 120 04.07.2011 17:40:2604.07.2011 17:40:26

NATIONAL HUMAN DEVELOPMENT REPORT 2011 121
A N N E X
2 Calculating the Human Development Index: Technical Note
The Human Development Index (HDI) is a summary measure of human development. It measures the average achievements in a country in three basic dimensions of human develop-ment: a long and healthy life, access to knowledge and a decent standard of living. The HDI is the geometric mean of normalized indices measuring achievements in each dimension.
Data sources• Life expectancy at birth: UNDESA1
• Mean years of schooling: Barro and Lee2
• Expected years of schooling: UNESCO Institute for Statistics3
• Gross national income (GNI) percapita: World Bank4 and IMF5
6 7
Creating the dimension indices. The first step is to create sub-indices for each dimension.Minimum and maximum values (goalposts) need to be set in order to transform the indica-tors into indices between 0 and 1. Because the geometric mean is used for aggregation, the maximum value does not affect the relative comparison (in percentage terms) between any two countries or periods oftime. The maximum values are set to the actual observed maximum values of the indicators from the countries in the time series, that is, 1980–2010. The minimum values will affect comparisons, so values that can be appropriately conceived of as subsistence values or as “natural” zeros are used. Progressis thus measured against minimum levels that a society needs to survive over time. The minimum values are set at 20 years for life expectancy, at 0 years for both education variables and at US$ 163 for per capita GNI. The life expectancy minimum is based on long-run historical evidencefrom Maddison6 and Riley.7 Societies can subsist without formal education, justifying the education minimum. A basic level of income
1 UNDESA (2009).2 Barro and Lee (2010).3 UNESCO Institute for Statistics (2010).4 World Bank (2010).5 IMF (2010).6 Maddison (2010).7 Riley (2001).
Goalposts for the Human Development Index
Dimension Observed maximum Minimum
Life expectancy 83.2 (Japan, 2010) 20.0Mean years of schooling 13.2 (US, 2000) 0Expected years of schooling 20.6 (Australia, 2002) 0Combined education index 0.951 (New Zealand, 2010) 0Per capita income (PPP US$) 108,211 (United Arab Emirates, 1980) 163 (Zimbabwe, 2008)
Example: Ukraine
Indicator Value
Life expectancy at birth (years) 68.6Mean years of schooling (years) 11.3Expected years of schooling (years) 14.6GNI per capita (PPP US$) 6.535
Note: Values are rounded.
UNDP_magazine_ENG_v10j.indd 121UNDP_magazine_ENG_v10j.indd 121 04.07.2011 17:40:2604.07.2011 17:40:26

122 ANNEX 2. CALCULATING THE HUMAN DEVELOPMENT INDEX: TECHNICAL NOTE
is necessary to ensure survival: US$ 163 is the lowest value attained by any country inrecorded history (in Zimbabwe in 2008) and corresponds to less than US$ 0.45 a day, just over a third of the World Bank’s US$ 1.25 a day poverty line.
Having defined the minimum and maximum values, the sub-indices are calculated as follows:
Dimension index = actual value – minimum valuemaximum value – minimum value (1)
For education, equation 1 is applied to each of the two subcomponents, then a geometric mean of the resulting indices is createdand, finally, equation 1 is reapplied to the geometric mean of the indices, using 0 as the minimum and the highest geometric mean of the resulting indices for the time period under consideration as the maximum. This is equivalent to applying equation 1 directly to the geometric mean of the two subcomponents. Because each dimen-sion index is a proxy for capabilities in the corresponding dimension, the transformation function from income to capabilities is likely to be concave.8 Thus, for income, the natural logarithm of the actual minimum and maximum values is used.
Aggregating the sub-indices to produce the Human Development Index. The HDI is the geometric mean of the three dimension indices:
( ІLife × ІEducation × ІIncome )1/3 1/3 1/3 (2)
Expression 2 embodies imperfect substitutability across all HDI dimensions. It thus addresses one of the most serious criticisms of the linear aggregation formula, which allowed for perfect substitution across dimensions. Some substitutability is inherent in the definition of any index that increases with the values of its components.
Life expectancy index = = 0,76968,6 – 2083,2 – 20
Mean years of schooling index = = 0,85611,3 – 2013,2 – 20
Expected years of schooling index = = 0,70914,6 – 2020,6 – 20
Education index = = 0,8190,856 × 0,708 – 00,951 – 0
Income index = = 0,568ln(6,535) – ln(163)ln(108,211) – ln(163)
Human Development Index = 0,769 × 0,819 × 0,568 = 0,7103
The methodology for calculating the Inequality-adjusted Human Development Index, the Gender Inequality Index and the Multidimensional Poverty Index can be found in UNDP’s Human Development Report 2010.
8 Anand and Sen (2000).
UNDP_magazine_ENG_v10j.indd 122UNDP_magazine_ENG_v10j.indd 122 04.07.2011 17:40:2604.07.2011 17:40:26

NATIONAL HUMAN DEVELOPMENT REPORT 2011 123
A N N E X
3 Share of Excluded Households of Ukraine by Characteristic (%)
Characteristic of exclusion %
1 Household in which all adults of working age have low status in the labour market 5.5
2 Unemployed for a long period of time (over 12 months) 1.8
3 Poor defined in accordance with relative national criterion 24.0
4 Households unable to ensure adequate nutrition for a year 4.1
5 Households that experience shortage of funds for visiting friends with presents or for inviting friends to visit
17.6
6 Households that experience shortage of funds for family vacations outside the home and not with relatives at their place residence
34.0
7 Households that experience shortage of funds for purchasing tickets to the cinema (or theatre or concert) once or twice a year
13.4
8 Households with a share of social assistance and assistance from relatives amounting to 33 percent of total income
1.7
9 Households without access to education 8.4
10 Households in which not one member 25 years of age or older has professional education
48.6
11 Households without access to medical assistance 39.2
12 Households that experience shortage of funds for paid emergency medical services 23.1
13 Households living in poor housing conditions 55.1
14 Households without a telephone (home or cellular) 21.5
15 Households suffering from absence of regular everyday transport communication of their settlement with another settlement with more developed infrastructure
12.6
16 Households suffering from unavailability of assistance from social workers or social assistance
7.7
17 Households that have not accessed services in the field of culture during a year 23.7
18 Households that shift responsibility for their well-being onto the state 34.0
UNDP_magazine_ENG_v10j.indd 123UNDP_magazine_ENG_v10j.indd 123 04.07.2011 17:40:2604.07.2011 17:40:26

UNDP_magazine_ENG_v10j.indd 124UNDP_magazine_ENG_v10j.indd 124 04.07.2011 17:40:2604.07.2011 17:40:26