ultimate strength of timber-deck bridges
TRANSCRIPT
26 Transportation Research Record 1053
Ultimate Strength of Timber-Deck Bridges
ANDRZEJ S. NOWAK and RAYMOND J. TAYLOR
ABSTRACT
Contained in this paper is a discussion on the procedures for evaluating the ultimate strength of timber deck bridges. Three structural systems are considered: sawed timber stringers, nailed laminated decks, and prestressed laminated decks. The load and resistance are treated as random variables. Their parameters are determined on the basis of material tests, load surveys, and analysis. The bridge performance is measured in terms of the reliability index. Various safety analysis methods are discussed. The procedures used in calculations were selected on the basis of accuracy, requirements for input data, and simplicity of use. System reliability models were used to include load sharing between deck components. Reliability indices were calculated for three structures. It has been observed that the degree of load sharing determines the safety level. Reliability is highest for the prestressed laminates. Sawed stringers can be considered as a series system in the system-reliability sense, with a rather limited redundancy. Therefore, the corresponding reliability indices are relatively low. Prestressed timber structures are reconunended. The major advantages are a better load distribution, a better control of wood deterioration, and a relatively low cost of application.
The use of wood in constructing bridges (note that timber bridges are conunon in many parts of North America) has various advantages and disadvantages. For example, the wood is generally available (especially in the northern and northwestern parts of the continent), is renewable (cut trees may be replaced by new ones) , is relatively light-weight, and has good dynamic damping properties. On the other hand (a) wood has a high degree of variation of strength (modulus of rupture), (b) its performance strongly
depends on the environment, (c) it deteriorates and drastically loses its strength under unfavorable conditions, (d) its load-carrying capacity decreases under prolonged load duration, and (e) it is vulnerable to fire. Therefore, it is desirable to control the strength and deterioration of timber structures. The new improved technology allows for a better control of the structural performance.
The strength of timber is usually controlled by a visual inspection; however, visual (or even mechanical) inspection does not allow for elimination of the variation in strength. Special structural systems may allow for a better load distribution so that weaker members take smaller loads and stronger members take larger loads. Deterioration can be controlled by chemical treatment, however, which may also serve as a protection against fire. However, bridge loading and load-carrying capacity (resistance) are random variables. Therefore, the bridge behavior cannot be predicted without uncertainty.
Safety analysis methods have been developed in the last 15 years <ll· The accuracy of the available procedures depends on the required data on load and resistance, computer capacity, and the level of effort. Application of the system-reliability theory reveals some hidden safety reserve in the structure. This is particularly useful in the evaluation of existing bridges. In this paper, safety analysis methods are applied to evaluate the ultimate
A.S. Nowak. Department of Civil Engineering, University of Michigan, Ann Arbor, Mich. 48109. R.J. Taylor. Ministry of Transportation and Conununications, Downsview, Ontario, Canada.
strength of timber deck bridges. The deck structure is treated as a system of interacting, partially correlated (in the statistical sense) members. Material properties are modeled using the available test data. The analysis is demonstrated on the examples of typical structures.
TIMBER DECK STRUCTURES
Three typical deck structures are considered in this paper: timber sawed stringers, nailed laminated deck, and prestressed laminated deck.
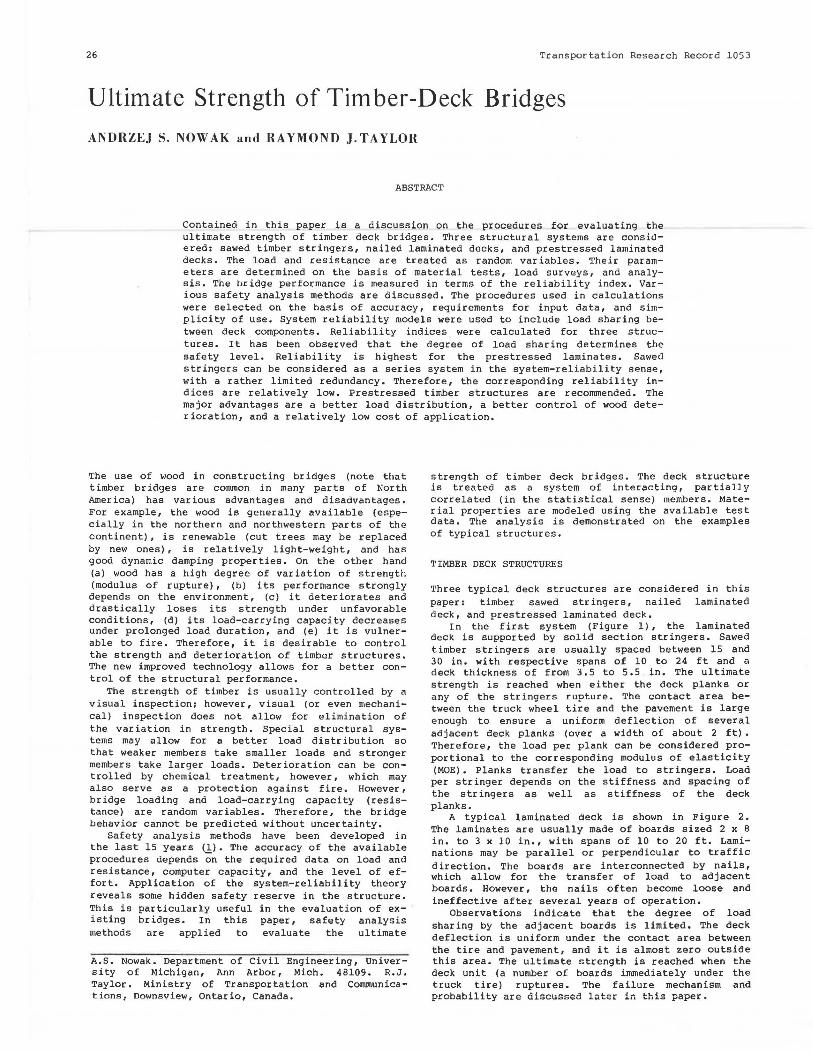
In the first system (Figure 1), the laminated deck is supported by solid section stringers. Sawed timber stringers are usually spaced between 15 and 30 in. with respective spans of 10 to 24 ft and a deck thickness of from 3.5 to 5.5 in. The ultimate strength is reached when either the deck planks or any of the stringers rupture. The contact area between the truck wheel tire and the pavement is large enough to ensure a uniform deflection of several adjacent deck planks (over a width of about 2 ft). Therefore, the load per plank can be considered proportional to the corresponding modulus of elasticity (MOE). Planks transfer the load to stringers. Load per stringer depends on the stiffness and spacing of the stringers as well as stiffness of the deck planks.
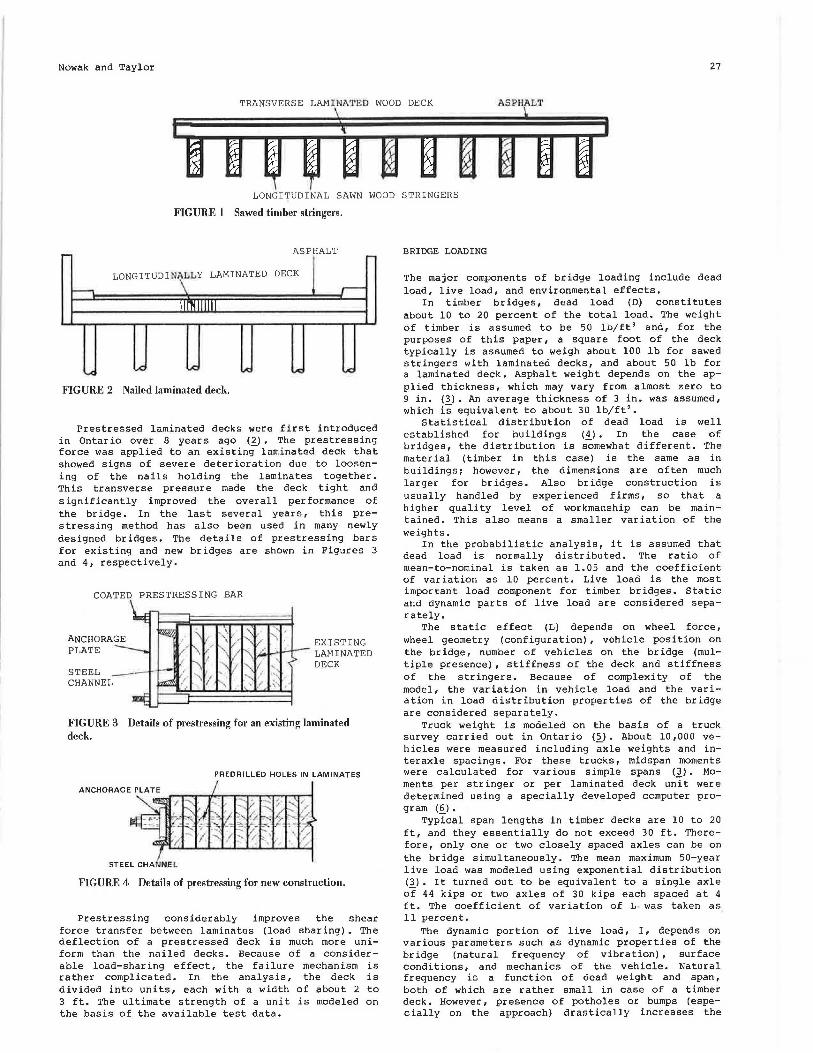
A typical laminated deck is shown in Figure 2. The laminates are usually made of boards sized 2 x 8 in. to 3 x 10 in., with spans of 10 to 20 ft. Laminations may be parallel or perpendicular to traffic direction. The boards are interconnected by nails, which allow for the transfer of load to adjacent boards. However, the nails often become loose and ineffective after several years of operation.
Observations indicate that the degree of load sharing by the adjacent boards is limited. The deck deflection is uniform under the contact area between the tire and pavement, and it is almost zero outside this area. The ultimate strength is reached when the deck unit (a number of boards inunediately under the truck tire) ruptures. The failure mechanism and probability are discussed later in this paper.
Nowak and Taylor 27
TRANSVERSE LAMI NATED WOOD DECK ASPHALT
LONGITUDINAL SAWN WOOD STRINGERS
FIGURE 1 Sawed timber stringers.
- ASPHALT ....
LONGITUDI'NALLY LAMINATED DECK
---. \ ,.--II Ill 1111
....c L.c: ..c:: ""' ...c ...c
FIGURE 2 Nailed laminated deck.
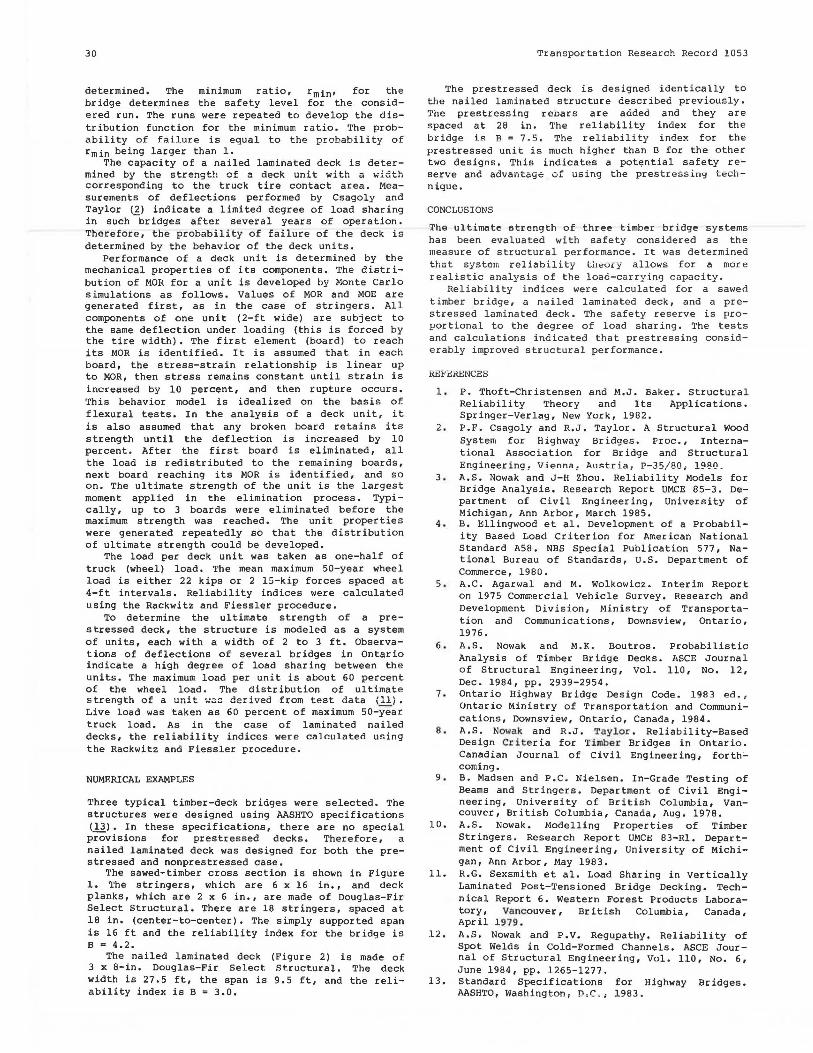
Prestressed laminated decks were first introduced in Ontario over 8 years ago (2). The prestressing force was applied to an existing laminated deck that showed signs of severe deterioration due to loosening of the nails holding the laminates together. This transverse pressure made the deck tight and significantly improved the overall performance of the bridge. In the last several years, this pres tressing method has also been used in many newly designed bridges. The details of pres tressing bars for existing and new bridges are shown in Figures 3 and 4, respectively.
COATED PRESTRESSING BAR
PLATE
STEEL CHANNEL
EXISTING LAMINATED DECK
FIGURE 3 Details of prestressing for an existing laminated deck.
PREDRILLED HOLES IN LAMINATES
STEEL CHANN EL
FIGURE 4 Details of prestressing for new construction.
Prestressing considerably improves the shear force transfer between laminates (load sharing). The deflection of a prestressed deck is much more uniform than the nailed decks. Because of a considerable load-sharing effect, the failure mechanism is rather complicated. In the analysis, the deck is divided into units, each with a width of about 2 to 3 ft. The ultimate strength of a unit is modeled on the basis of the available test data.
BRIDGE LOADING
The major components of bridge loading include dead load, live load, and environmental effects.
In timber bridges, dead load (D.) constitutes about 10 to 20 percent of the total load. The weight of timber is assumed to be 50 lb/ft' and, for the purposes of this paper, a square foot of the deck typically is assumed to weigh about 100 lb for sawed stringers with laminated decks, and about 50 lb for a laminated deck. Asphalt weight depends on the applied thickness, which may vary from almost zero to 9 in. (3). An average thickness of 3 in. was assumed, which is equivalent to about 30 lb/ft 2
•
Statistical distribution of dead load is well established for buildings <!>· In the case of bridges, the distribution is somewhat different. The material (timber in this case) is the same as in buildings; however, the dimensions are often much larger for bridges. Also bridge construction is usually handled by experienced firms, so that a higher quality level of workmanship can be maintained. This also means a smaller variation of the weights.
In the probabilistic analysis, it is assumed that dead load is normally distributed. The ratio of mean-to-nominal is taken as 1. 05 and the coefficient of variation as 10 percent. Live load is the most important load component for timber bridges. Static and dynamic parts of live load are considered separately.
The static effect (L) depends on wheel force, wheel geometry (configuration) , vehicle position on the bridge, number of vehicles on the bridge (multiple presence) , stiffness of the deck and stiffness of the stringers. Because of complexity of the model, the variation in vehicle load and the variation in load distribution properties of the bridge are considered separately.
Truck weight is modeled on the basis of a truck survey carried out in Ontario (~). About 10,000 vehicles were measured including axle weights and interaxle spacings. For these trucks, midspan moments were calculated for various simple spans (-2_). Moments per stringer or per laminated deck unit were determined using a specially developed computer program (£_) •
Typical span lengths in timber decks are 10 to 20 ft, and they essentially do not exceed 30 ft. Therefore, only one or two closely spaced axles can be on the bridge simultaneously. The mean maximum 50-year live load was modeled using exponential distribution <1>· It turned out to be equivalent to a single axle of 44 kips or two axles of 30 kips each spaced at 4 ft. The coefficient of variation of L was taken as 11 percent.
The dynamic portion of live load, I, depends on various parameters such as dynamic properties of the bridge (natural frequency of vibration), surface conditions, and mechanics of the vehicle. Natural frequency is a function of dead weight and span, both of which are rather small in case of a timber deck. However, presence of potholes or bumps (especially on the approach) drastically increases the

20
dynamic load. In colder regions, this may be caused by an uneven accumulation of snow and ice.
Observations carried out by the Ontario Ministry of Transportation and Communications indicate that dynamic load cannot be ignored in timber bridges (unpublished study). Even though AASHTO does not require the use of impact in the design, the new Ontario Highway Bridge Design Code (7) specifies dynamic load allowance at 70 percent of the value s pecified for other materials (steel or concrete) . In this study, it is assumed that the mean maximum statir. 1 ivP lrn•n (nR nPRr.rihPn nhnve) 01'.'l'."llrR simllltaneously with dynamic load equal to 10 percent of L for spans up to 10 ft, and 15 percent of L for spans up to about 30 ft. The coefficient of variation of I is assumed as 45 percent (3).
Other loads may be critical in some design cases. However, a simultaneous occurrence of a heavy truck with an extreme value of some environmental load (wind, earthquake, snow, ice, temperature) is unlikely. There are several load combination models available. Good results were obtained by use of "Turkstra 's rule" (3). Turkstra observed that the maximum of a load combination occurs when one load component takes on its maximum value while the other components are equal to their average values. In this paper, only dead load and live load combinations are considered.
PROPERTIES OF MATERIAL
The behavior of a bridge deck depends on mechanical properties of its components such as stringers, deck planks, nails, and prestressing rods. The most important characteristics of timber are the modulus of rupture (MOR) and the modulus of elasticity (MOE). The statistical models were developed on the basis of available test data including flexural tests of beams and prestressed units (~).There is a need for more data about the performance of nailed laminates, in particular as a function of time (deterioration). [Note that flexural tests were performed by Madsen at the Unive r s ity of British Columbia (9). The statistical models for MOR and MOE were developed by Nowak (10) .]
It has been observed that MOR is featured with a considerable scatter. Tests were performed foe thousands of specimens, 200 or 300 at a time, and each time, a different distribution function was obtained a Therefore, for each species and grade, MOR is described by a family of distribution functions. Models were developed to represent each family by a function (average function) and a coefficient of variation (of the mean value). The coefficient of variation serves as a measure of the scatter within each family.
A function representative for a family can be approximated by three lognormal distributions; one for the lower range of values, one for the center, and one for the upper tail. The parameters of representative functions (mean and coefficient of variation), and the corresponding coefficients of variation of the mean, are given in Table 1 for several species and grades.
The distribution functions of MOE were modeled in a similar way. It has been observed that, even though a considerable scatter is involved, the distribution function seems to be independent of the size, and depends on the species and grade only. This function can be represented by a lognormal distribution and the derived parameters are given in Table 2.
MOR and MOE are partly correlated in the statistical sense. In the analysis, the correlation is s imulated using the Monte Carlo technique. MOR is
Transporta tion Research Recor d 1053
TABLE 1 Parameters of MOR Dist ribut ion for Selected Species and Grades
Average Distributi on Function
Coefficient Species. of Coefficient of Grade, Mean Variation Variation of Size (in.) (psi) (%) the Mean(%)
Douglas-Fir Select 2x8 5,500 25 28
"L x l U !>,'.WU "LI JU 3x8 6,200 22.5 25 6 x 16 6,200 22.5 25
Grade l and 2 2 x 8 4,100 32 28 2 x 10 3,850 32.5 30 3 x 8 4,800 29 25 6 x 16 4,800 29 25
Hem-Fir Select 2x8 6,600 30.5 28
2 x 10 6,200 31. 5 30 Grade I and 2 2 x8 4,750 37.5 28
2 x 10 4,350 38 30 Spruce-Pine-Fir
Select 2 x 8 5,400 29.5 28 2 x 10 4,950 27.5 30
Grade I and 2 2x8 4,800 32.5 28 2 x 10 4,500 33.5 30
TABLE 2 Parameters of MOE Distribution for Selected Species and Grades
Average Distribution Function
Coefficient Species of Coefficient of and Mean Variation Variation of Grades (I o3 ksi) (%) the Mean(%)
Douglas-Fir Select 1. 50 20 20 Grade I and 2 1.29 21 20
Hem-Fir Select 1.65 18 20 Grade l and 2 1.50 20 20
Spruce-Pine-Fir Select 1.50 17 20 Grade I and 2 1.375 20 .5 20
treated as an independent variable. For a given value of MOR, the corresponding MOE is assumed to be lognormally distributed with the coefficient of variation equal to 20 percent and with the mean (JTMoE) expressed as
IOMOE = a1 MOR + a2 (1)
where a1 and a 2 are constants. If MOR is expressed in kips per in. 2 , then the
best fit for testing data is obtained for a 1 = 150 and a 2 = 700 ksi, for all sizes, species, and grades considered. The resulting MOE is also in kips per in. 2
•
The prestressed laminates were tested at the Western Forest Products Laboratory (11). Sawed timbers of 2 x 10 x 16 ft were made into units with widths of 1, 2, and 3 ft. The corresponding numbers of boards were 8, 16, and 24, respectively. Three species were considered: hem-fir, white pine, and red pine. The units were transversely prestressed by threaded reinforcing bars, spaced at 20 in.
The results of the ultimate strength tests indi~
cate a relatively small scatter for each species. The distribution function of MOR for the unit can be approximated by a normal distribution with the coefficient of variation ranging from about 15 percent

Nowak and Taylor
for 1-ft width to 8 percent for 3-ft width. The mean MOR is practically the same for all unit widths.
The theoretical model for MOR of prestressed units has been developed by Nowak and Taylor (.!!_) • The unit can be considered as a system of interconnected boards (elements). The system is parallel, because the unit fails only after all its components fail. It has been observed that individual boards retain their ultimate strength after the maximum stress is reached, and the strain can be increased by about 10 percent to 20 percent before the final failure occurs. Furthermore, rupture of a board is a very localized phenomenon, and its occurrence reduces the load-carrying capacity of the board only in the immediate neighborhood of the defect.
It can be assumed that the load-carrying capacity of the unit is equal to the sum of capacities of its components (boards). Flexural tests indicated that strengths of boards in the deck can be treated as independent variables. The distribution of the capacity for the unit can be derived from the strength distributions of the components. The number of boards in a unit varies from B to 24. Therefore, by using the central limit theorem of the theory of probability, the distribution of the unit capacity becomes normal, regardless of the distribution of components. The mean unit capacity is equal to the sum of means of components, and the coefficient of variation, Vu, is equal to
(2)
where v1 = the coefficient of variation of MOR for a component (single board), and n = the number of boards in a unit.
The comparison of the theoretical and observed parameters (means and coefficients of variation) for the pres tressed uni ts shows a good agreement. The results are presented in Table 3.
TABLE 3 Comparison of Theoretical and Observed Parameters of Prestressed Deck Units
Unit Width (ft)
2
3
Species
Hem-Fir White Pine Red Pine Hem-Fir White Pine Red Pine Hem-Fir White Pine Red Pine
Mean, Ratio of Theoretical to Observed Value
.98
.82 1.02 1.05 .75 .96
1.02 .87 .97
STRUCTURAL RELIABILITY ANALYSIS
Coefficient and Variation(%)
13 16 15 15 15 21
9 9 10 7 10 14 9 8 8 8 8 7
Reliability of the structure is the probability of performance without failure. There are various forms of failure: from minor limitations of use (e.g., cracking), local failures (exterior girder twisted by high trucks) , to overall collapse. This paper deals with failures that directly affect the loadcarrying capacity. The reliability models are developed for three systems of timber-deck bridges.
Probability of failure P'F) can be expressed as the probability of load effect (Q) being larger than load-carrying capacity or resistance (R)
PF = Prob (Q > R) (3)
Direct use of Equation l is not possible in practical situations because of numerical difficulties involved in computation of convolution functions. It
29
is convenient to measure structural safety in terms of a reliability index (B) defined as
where FN- 1 =the inverse of the standard normal distribution function (1).
Cornell developed-the following formula for B,
(5)
where
mR mean value of R,
mo mean value of Q, SR standard deviation of R, and SQ standard deviation of Q.
If R and Q are normally distributed, then
Rosenblueth and Esteva developed a simple logarithmic formula for B, which is expressed as
where VR = the coefficient of variation of R and v0 = the coefficient of variation of Q. If both R and Q are log normally distributed then PF can be calculated using Equation 6. However, in most practical cases, neither R nor Q are normal or lognormal.
There are various methods available for calculating B in a general case. Good results are obtained by using a procedure developed by Rackwitz and Fiessler !1). The method is based on normal approximations of nonnormal functions at the design point. An easy-to-use graphical variant of the procedure was developed by Nowak and Regupathy (12) •
The reliability index can also becalculated by Monte Carlo simulations. This is particularly efficient in cases of complicated distribution functions and partially correlated variables.
The aforementioned methods were used in the reliability analysis of bridge decks. Load distributions were generated by Monte Carlo simulations and then further calculations followed the Rackwitz and Fiessler procedure. In case of normal or lognormal distributions, either Equation 5 or 7 was used.
RELIABILITY OF BRIDGE DECKS
In the reliability analysis, it is assumed that the bridge fails when the whole span, or a large portion of a span, loses its load-carrying capacity. In practice, the deck supported by sawed stringers will fail after the rupture of a single stringer. It is impossible to transfer the load from the overloaded stringer to other ones. The degree of load sharing is considerably higher in deck planks or laminates where one broken element does not necessarily result in an overall failure. The situation is even better in the case of prestressed units. The load sharing results in a more uniform deflection of the deck. Failure occurs only after a large number of single boards reach their ultimate loads. In the analysis, it is assumed that the ultimate strength of a stringer bridge is reached when any of the stringers ruptures. This assumption was supported by the analysis performed by Nowak and Boutros (6).
The b.r idge structure was modeled as a system of finite strips (stringers with transverse deck planks) • The mechanical properties (MOR and MOE, partially correlated) of stringers were generated using the Monte Carlo technique. Stresses were calculated for mean maximum 50-year live load. For each stringer, the ratio of calculated stress to MOR was
30
determined. The minimum ratio, rmin• for the bridge determines the safety level for the considered run. The runs were repeated to develop the distribution function for the minimum ratio. The probability of f a ilur e is equal to the probability of rmin being larger than 1.
The capacity of a nailed laminated deck is determined by the strength of a deck unit with a width corresponding to the truck tire contact area. Measurements of deflections performed by Csagoly and Taylor (2) indicate a limited degree of load sharing in such-bridges after several years of operation. Therefore, the probability of failure of the deck is determined by the behavior of the deck units.
Performance of a deck unit is determined by the mechanical properties of its components. The distribution of MOR for a unit is developed by Monte Carlo simulations as follows. Values of MOR and MOE are generated first, as in the case of stringers. All components of one unit (2-ft wide) are subject to the same deflection under loading (this is forced by the tire width). The first element (board) to reach its MOR is identified. It is assumed that in each board, the stress-strain relationship is linear up to MOR, then stress remains constant until strain is increased by 10 percent, and then rupture occurs. This behavior model is idealized on the basis of flexural tests. In the analysis of a deck unit, it is also assumed that any broken board retains its strength until the deflection is increased by 10 percent. After the first board is eliminated, all the load is red is tr ibuted to the remaining boards, next board reaching its MOR is identified, and so on. The ultimate strength of the unit is the largest moment applied in the elimination process. Typically, up to 3 boards were eliminated before the maximum strength was reached. The unit properties were generated repeatedly so that the distribution of ultimate strength could be developed.
The load per deck unit was taken as one-half of truck (wheel) load. The mean maximum 50-year wheel load is either 22 kips or 2 15-kip forces spaced at 4-ft intervals. Reliability indices were calculated using the Rackwitz and Fiessler procedure.
To determine the ultimate strength of a prestressed deck, the structure is modeled as a system of uni ts, each with a width of 2 to 3 ft. Observations of deflections of several bridges in Ontario indicate a high degree of load sharing between the units. The maximum load per unit is about 60 percent of the wheel load. The distribution of ultimate strength of a unit was derived from test data (11). Live load was taken as 60 percent of maximum 50-year truck load. As in the case of laminated nailed decks, the reliability indices were calculated using the Rackwitz and Fiessler procedure.
NUMERICAL EXAMPLES
Three typical timber-deck bridges were selected. The structures were designed using AASHTO specifications (13). In these specifications, there are no special provisions for pres tressed decks. Therefore, a nailed laminated deck was designed for both the prestressed and nonprestressed case.
The sawed-timber cross section is shown in Figure 1. The stringers, which are 6 x 16 in., and deck planks, which are 2 x 6 in., are made of Douglas-Fir Select Structural. There are 18 stringers, spaced at 18 in. (center-to-center). The simply supported span is 16 ft and the reliability index for the bridge is B = 4.2.
The nailed laminated deck (Figure 2) is made of 3 x 8-in. Douglas-Fir Select Structural . The deck width is 27.5 ft, the span is 9.5 ft, and the reliability index is B = 3.0.
Transportation Research Record 1053
The prestressed deck is designed identically to the nailed laminated structure described previously. The prestressing rebars are added and they are spaced at 28 in. The reliability index for the bridge i s B = 7 . 5. The reliability index for the pres tressed unit is much higher than B for the other two designs. This indicates a potential safety reserve and advantage of using the prestressing technique.
CONCLUSIONS
The ultimate strength of three timber bridge systems has been evaluated with safety considered as the measure of structural performance. It was determined that system reliability theory allows f or a mor e realistic analysis of the load-carrying c apacity.
Reliability indices were calculated for a sawed timber bridge, a nailed laminated deck, and a prestressed laminated deck. The safety reser ve is proportional to the degree of load sharing. The tests and calculations indicated that prestressing considerably improved structural performance.
REFERENCES
1. P. Thoft-Christensen and M.J. Baker. Structural Reliability Theory and Its Applications. Springer-Verlag, New York, 1982.
2. P.F. Csagoly and R.J. Taylor. A Structural wood System for Highway Bridges. Proc., International Association for Bridge and Structural Engineering, Vienna, Aostr i a, P-35/ 80, 1980 ,
3. A.S. Nowak and J-H Zhou. Reliability Models for Bridge Analysis. Research Report UMCE 85-3. Department of Civil Engineering, University of Michigan, Ann Arbor, March 1985.
4. B. Ellingwood et al. Development of a Probability Based Load Criterion for American National Standard ASS. NBS Special Publication 577, National Bureau of Standards, u.s. Department of Commerce, 1980.
5. A.C. Agarwal and M. Wolkowicz. Interim Report on 1975 Commercial Vehicle Survey. Research and Development Division, Ministry of Transportation and Communications, Downsview, Ontario, 1976.
6. A.S. Nowak and M.K. Boutros. Probabilistic Analysis of Timber Bridge Decks. ASCE Journal of Structural Engineering, Vol. 110, No. 12, Dec. 1984, pp. 2939-2954.
7. Ontario Highway Bridge Design Code. 1983 ed . , Ontario Ministry of Transportation and Communications, Downsview, Ontario, Canada, 1984.
8 . A.S. Nowa k and R.J. Taylor. Reliability-Based Design Cri t eria for Timbe r Bridges in Ontario. Canadian Journal of Civil Engineering, forth'coming.
9. B. Madsen and P.C. Nielsen. In-Grade Testing of Beams and Stringers. Department of Civil Engineering, University of British Columbia, Vancouver, British Columbia, Canada, Aug. 1978.
10. A.S. Nowak. Modelling Properties of Timber Stringers. Research Report UMCE 83-Rl. Department of Civil Engineering, University of Michigan, Ann Arbor, May 1983.
11. R.G. Sexsmith et al. Load Sharing in Vertically Laminated Post-Tensioned Bridge Decking. Technical Report 6. Western Forest Products Laboratory, Vancouver, British Columbia, Canada, April 1979.
12. A.S, Nowak and P.V. Regupathy, Reliability of Spot Welds in Cold-Formed Channels. ASCE Journal of Structural Engineering, Vol. 110, No. 6, June 1984, pp. 1265-1277.
13, Standard Specifications for Highway Bridges. AASHTO, Wash i ngton, D.c., 1983.