ultramax sector analysis - times navigation sector_june... · ultramax vs old panamax relation the...
TRANSCRIPT

ULTRAMAX SECTOR ANALYSISTailor made for Messrs “Times Navigation”
A l l i e d S h i p b r o k i n g I n c .1
TABLE OF CONTENTS
INTRODUCTION 2
CHARACTERISTICS 4
PROFILE 7
MARKET 9
CARGOES 15
This presentation has been conducted by Allied Shipbroking Inc. to summarize the main features ofthe newly introduced Ultramax design.
After a brief reference to its distinctive traits that distinguish it from the old Panamax and theSupramax, the analysis concentrates on the Ultramaxes’ comparative advantages related to both themarket overall and the sector’s seaborne trade.
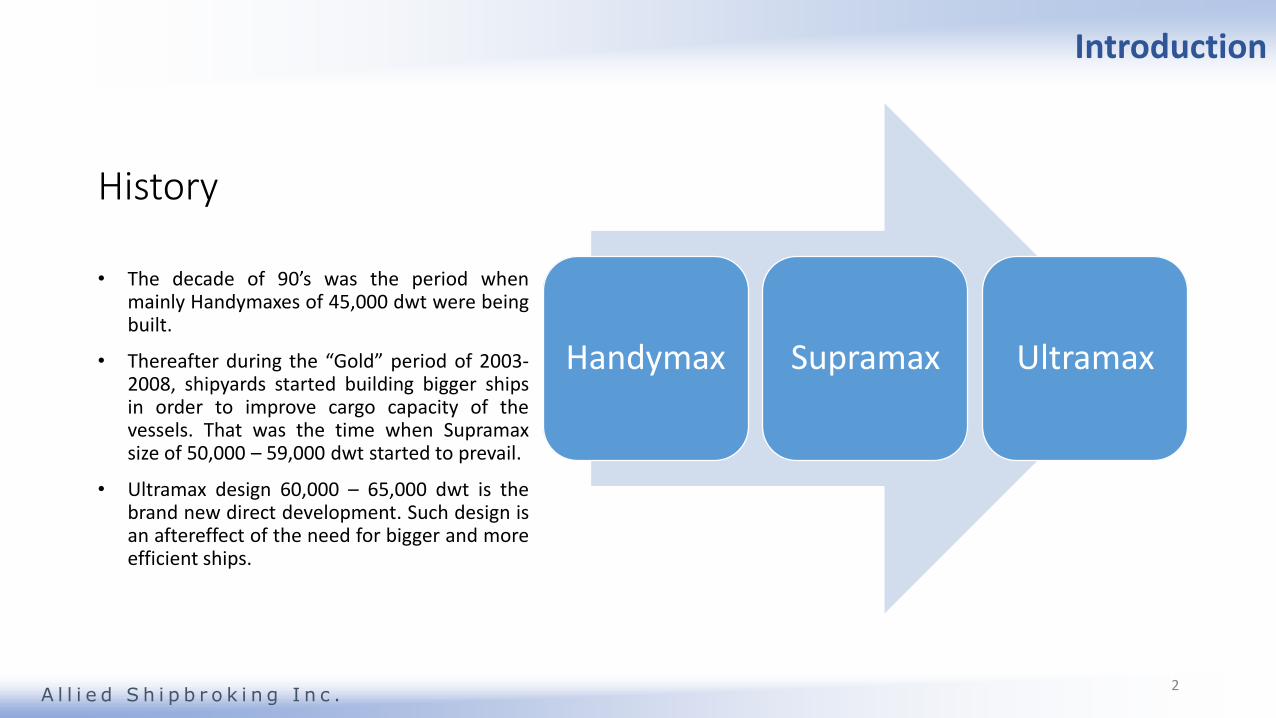
History
• The decade of 90’s was the period whenmainly Handymaxes of 45,000 dwt were beingbuilt.
• Thereafter during the “Gold” period of 2003-2008, shipyards started building bigger shipsin order to improve cargo capacity of thevessels. That was the time when Supramaxsize of 50,000 – 59,000 dwt started to prevail.
• Ultramax design 60,000 – 65,000 dwt is thebrand new direct development. Such design isan aftereffect of the need for bigger and moreefficient ships.
Handymax Supramax Ultramax
Introduction
A l l i e d S h i p b r o k i n g I n c .2

Ultramax VS Old Panamax relation
The design of Ultramax bulker resembles the one of the olderPanamax (64-69k Dwt), which was being built during 80’s-90’s. However, there are main differences between them,pointed out as follows:
• The Ultramaxes are geared in contrast to the majority ofthe gearless Old Panamaxes.
• The length overall (LOA) of the Ultramaxes is 199 mtrs,shorter than the 225mtrs of the Old Panamaxes.
• The Ultramax design is characterized by low fuel oilconsumption.
Introduction
A l l i e d S h i p b r o k i n g I n c .3

Dimensions• LOA: 199,99 mtrs
• Dwt: 63,500 ts
• Cargo Cap: 77,400 m3
Characteristics
A l l i e d S h i p b r o k i n g I n c .
• Breadth: 32,26 mtrs
• Draft: 13,3 mtrs
• Geared: 4 x 35t Cranes
• Service Speed: 14,3 knts
• Endurance: Abt 20,000 n.m.
• HO/HA: 5
4

Characteristics
A l l i e d S h i p b r o k i n g I n c .
Comparison table of Ultramax designs
Design Dwt Cargo Cap. M/E Speed Consumption Draft
Crown 63 63.500 77.400 MAN B&W 5S60ME-C8 14,25 kts 25,75 t/Day 13,3 mtrs
SDARI 64 64.000 78.000 MAN B&W 5S60ME-C8 14,5 kts 26,6 t/Day 13,3 mtrs
Daesun 62 62.000 75.600 MAN B&W 6S50ME-B9.2 14 kts 26,4 t/Day 13,3 mtrs
HHIC 64 63.700 77.500 MAN B&W 5S60ME-B8.2 14 kts 26,3 t/Day 13,3 mtrs
HMD 63 63.000 76.200 MAN B&W 5S60ME-B8.2 14,5 kts 29,9 t/Day 13,3 mtrsNe
w D
es
ign
sO
ld D
es
ign
s Design Dwt Cargo Cap. M/E Speed Consumption Draft
Crown 58 58.000 71.500 MAN B&W 6S50MC-C 14,3 kts 30,4 t/Day 12,95 mtrs
SDARI 57 57.000 71.500 MAN B&W 6S50MC-C 14,2 kts 30 t/Day 12,8 mtrs
STX 57 57.300 71.850 STX MAN B&W 6S50MC-C7 14,5 kts 35,4 t/Day 13 mtrs
SPP 59 59.000 75.000 MAN B&W 6S50MC-C 14,5 kts 37,2 t/Day 13 mtrs
5

Advantages• High fuel prices along with strict pollution regulations, enforced the building
of fuel efficient vessels, achieving the goal of 25,75t per day 14,25 knts. Newpropeller design, more efficient hull form and the Eco type main engine arethe main factors that contributed to such an achievement.
• Ultramax vessel has been designed ideally for Asian trade, as China and Indiaconstitute the major importers affecting global market, where the gears andgrabs are required at most of the ports. Ultramax’s LOA is 199 mtrs, which is10 mtrs longer than the one of Supramax and 25 mtrs shorter than same ofPanamax. Hence, every port that can host a Panamax can easily host anUltramax. Similarly, an Ultramax vessel can load or discharge almost in everyport where a Supramax does. Same advantages fortify the Ultramax vesselsuitable for African ports as well. Bearing in mind that Africa is a majorimporter of bagged cement and rice, gears and grabs are mandatory for thedischarging operation of such cargoes.
• Moreover, an Ultramax can compete with a Panamax in the lots of 60-70k ±10%, considering that the chartering of an Ultramax saves the costs of afloating crane (region $1,50/mt), which is inevitable for the gearlessPanamaxes.
• The operation of an Ultramax vessel in the Spot market highlights thecomparative advantages over a Supramax, as low fuel consumption alongwith increased cargo capacity results in optimum cost efficiency.
Characteristics
A l l i e d S h i p b r o k i n g I n c .6

Profile
A l l i e d S h i p b r o k i n g I n c .
• Ultramax sector is a new breed in the shippingindustry. The first Ultramax came into waterduring 2010, while over this period 138vessels have been delivered, in contrast toalmost 1910 vessels that constitute theSupramax Fleet.
• Approximately 470 Ultramaxes are expectedto be delivered till 2017. Despite the size ofthe current orderbook, Ultramax fleetcontinues to be much smaller than that ofSupramax which is its direct competitor.
*Supramax design includes vessels with Dwt: 50,000-59,999
*Ultramax design includes vessels with Dwt: 60,000-66,000
7
139
463
1908
115
0
500
1000
1500
2000
2500
Delivered On Order Delivered On Order
Ultramax Supramax
Ultramax & Supramax fleet

Profile
A l l i e d S h i p b r o k i n g I n c .
45
94
Shipyards – Vessels delivered
China
Japan
354
103
6
Shipyards – Vessels on order
China
Japan
Vietnam
• Japanese shipyards had initialized the production of the Ultramax design and that’s the reason whymost vessels of the current fleet have been built in Japan. For the time being there are no availableberths, while priority has been given to major Japanese Owners and Trading Houses. Nevertheless, theanalogy will change in the short-term future, as the current orderbook contains a 77% share of Chineseorders.
• It is worthmentioning that “Sinopacific Group” along with “CSSC-Chengxi Shipyard” were the pioneersin the Chinese Shipbuilding segment, as they were the first Chinese shipyards that started buildingUltramaxes, based on the designs “Crown 63” and “SDARI 64” respectively.
8
0
10
20
30
40
50
60
70
0
5.000
10.000
15.000
20.000
25.000
30.000
35.000
40.000
45.000
50.000
1992 1993 1994 1995 1996 1997 1998 1999 2000 2001 2002 2003 2004 2005 2006 2007 2008 2009 2010 2011 2012 2013 2014
USD
(M
ILLI
ON
S)
USD
/ D
AY
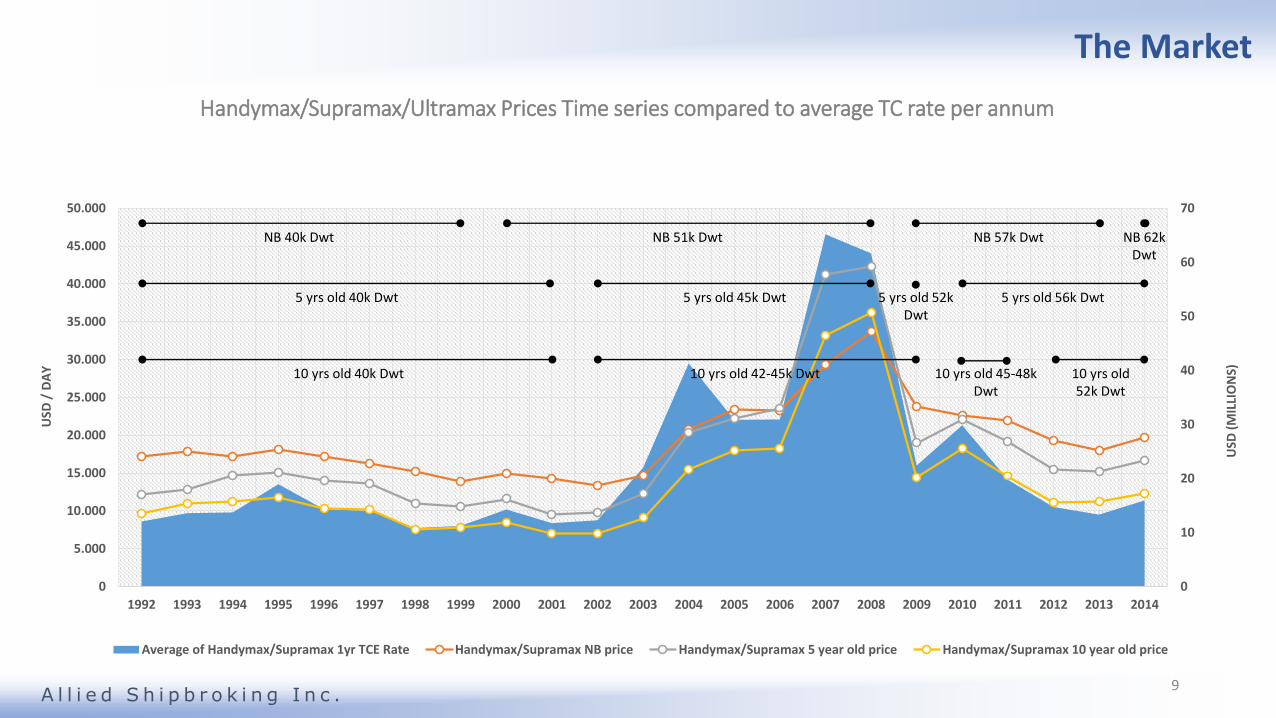
Handymax/Supramax/Ultramax Prices Time series compared to average TC rate per annum
Average of Handymax/Supramax 1yr TCE Rate Handymax/Supramax NB price Handymax/Supramax 5 year old price Handymax/Supramax 10 year old price
NB 62k Dwt
5 yrs old 56k Dwt
10 yrs old 45-48k Dwt
10 yrs old 52k Dwt
Handymax/Supramax/Ultramax sector
A l l i e d S h i p b r o k i n g I n c .
NB 40k Dwt
5 yrs old 40k Dwt
10 yrs old 40k Dwt
NB 51k Dwt
5 yrs old 45k Dwt
10 yrs old 42-45k Dwt
NB 57k Dwt
5 yrs old 52k Dwt
The Market
9

0
5
10
15
20
25
30
35
40
45
0
5.000
10.000
15.000
20.000
25.000
30.000
35.000
40.000
45.000
50.000
1992 1993 1994 1995 1996 1997 1998 1999 2000 2001 2002 2003 2004 2005 2006 2007 2008 2009 2010 2011 2012 2013 2014
USD
(M
ILLI
ON
S)
USD
/ D
AY
Deflated Handymax/Supramax/Ultramax Prices Time series compared to average TC rate per annum, based on 1992
Average of Handymax/Supramax 1yr TCE Rate Deflated Hmax/Smax NB prices based on 1992
Deflated Hmax/Smax 5 year old prices based on 1992 Deflated Hmax/Smax 10 year old prices based on 1992
5 yrs old 40k Dwt
10 yrs old 40k Dwt
5 yrs old 45k Dwt 5 yrs old 52k Dwt
5 yrs old 56k Dwt
10 yrs old 42-45k Dwt 10 yrs old 45-48k Dwt
10 yrs old 52k Dwt
Handymax/Supramax/Ultramax sector
A l l i e d S h i p b r o k i n g I n c .
NB 40k Dwt NB 51k Dwt NB 57k Dwt NB 62k Dwt
The FleetMarketThe Market
10

0
10
20
30
40
50
60
70
0
1.000
2.000
3.000
4.000
5.000
6.000
7.000
8.000
1992 1993 1994 1995 1996 1997 1998 1999 2000 2001 2002 2003 2004 2005 2006 2007 2008 2009 2010 2011 2012 2013 2014
USD
(M
ILLI
ON
S)
BD
I
Handymax/Supramax/Ultramax prices time series compared to average BDI per annum
Average BDI Handymax/Supramax NB price Handymax/Supramax 5 year old price Handymax/Supramax 10 year old price
5 yrs old 56k Dwt
10 yrs old 40k Dwt 10 yrs old 42-45 k Dwt 10 yrs old 42-45k Dwt
10 yrs old 52k Dwt
Handymax/Supramax/Ultramax sector
A l l i e d S h i p b r o k i n g I n c .
NB 40k Dwt NB 51k Dwt NB 57k Dwt NB 62k Dwt
5 yrs old 40k Dwt 5 yrs old 45k Dwt 5 yrs old 52k Dwt
The FleetMarketThe Market
11

0
5
10
15
20
25
30
35
40
45
0
1.000
2.000
3.000
4.000
5.000
6.000
7.000
8.000
1992 1993 1994 1995 1996 1997 1998 1999 2000 2001 2002 2003 2004 2005 2006 2007 2008 2009 2010 2011 2012 2013 2014
USD
(M
ILLI
ON
S)
BD
I
Deflated Handymax/Supramax/Ultramax prices time series compared to average BDI per annum, based on 1992
Average BDI Deflated Handymax/Supramax NB price based on 1992Deflated Handymax/Supramax 5 year old price based on 1992 Deflated Handymax/Supramax 10 year old price based on 1992
NB 40k Dwt
5 yrs old 40k Dwt
10 yrs old 40k Dwt
NB 51k Dwt NB 57k Dwt
5 yrs old 45k Dwt 5 yrs old 56k Dwt5 yrs old 52k Dwt
10 yrs old 42-45k Dwt 10 yrs old 45-48k Dwt
10 yrs old 52k Dwt
Handymax/Supramax/Ultramax sector
A l l i e d S h i p b r o k i n g I n c .
NB 62k Dwt
The FleetMarketThe Market
12

Handymax/Supramax/Ultramax sectorThe FleetMarketThe Market
Since 1992, as per our point of view, Shipping industry has gone through 2 completed economic cycles,with the last one beginning in the early 00’s. It is clear from deflated graphs, that 2001-2002 was thetrough phase, whenafter the 5-year recovery led to the peak of 2007-2008 and presently back again torecession phase.
The duration of the recession period cannot be predicted neither guaranteed - due to the variability ofmajor factors such as demolition, New Building activity, global economic growth, weather, oil prices, wars -but it seems that we may have passed already the second cruel trough phase.
According to graph “Deflated Handymax/Supramax/Ultramax prices compared to average BDI per annum,based on 1992”, we can ascertain that during 2013 NB Supramax / Ultramax prices were similar to thoseduring 2003, which represents a 10-year-old business cycle basis deflated asset values of ships. Havingsaid that, we understand that most probably we have already reached the bottom-line having “seen” thelowest prices during the last decade.
A l l i e d S h i p b r o k i n g I n c .13

NB orders & prices bottom out
The Market
A l l i e d S h i p b r o k i n g I n c .14
Sup
ply
exceed
s d
eman
d
High Charter market
Vessels’ prices
increase
NB orders & prices
peak
Low Charter market
Vessels’ prices soften
NB orders & prices increaseD
eman
d
exce
ed
s su
pp
lyDemolition
activity decreases
Demolition activity
increases

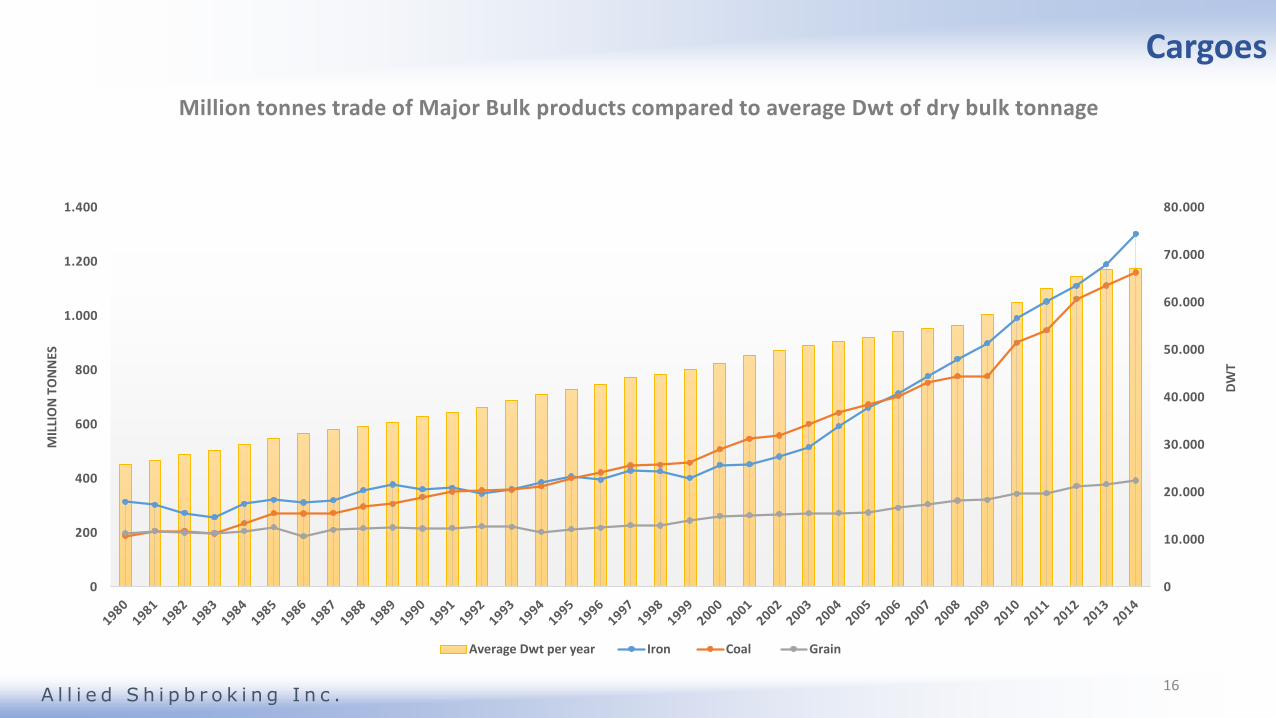
Ultramax CargoesBasic cargoes of Ultramaxes are:
• Coal
• Iron Ore
• Grain
Currently most South East Asian exporters seemto prefer 50 – 55k mt 10% cargo size, followingthe introduction of the Supramaxes, while 45k mt10% cargo size used to be chosen during previousyears due to the existence of the Handymaxesonly.
Same fact seems to take place nowadays, as thefrequency of bigger stems’ appearance isinfluenced by the appearance of the biggerUltramax design.
Cargoes
A l l i e d S h i p b r o k i n g I n c .15
Handymax/Supramax/Ultramax sector
A l l i e d S h i p b r o k i n g I n c .
The FleetMarketCargoes
0
10.000
20.000
30.000
40.000
50.000
60.000
70.000
80.000
0
200
400
600
800
1.000
1.200
1.400
DW
T
MIL
LIO
N T
ON
NES
Million tonnes trade of Major Bulk products compared to average Dwt of dry bulk tonnage
Average Dwt per year Iron Coal Grain
16
Cargoes

Handymax/Supramax/Ultramax sector
A l l i e d S h i p b r o k i n g I n c .
The FleetMarketThe Market
0
10.000
20.000
30.000
40.000
50.000
60.000
70.000
80.000
0
1.000
2.000
3.000
4.000
5.000
6.000
7.000
8.000
DW
T
BIL
LIO
N T
ON
NE-
MIL
ES
Billion tonne-miles of Major Bulk products compared to average Dwt of dry bulk tonnage
Average Dwt per year Iron Coal Grain
17
Cargoes

Iron ore seaborne trade
The Market
A l l i e d S h i p b r o k i n g I n c .
• Constitutes approximately 40% ofglobal major bulk trade*
• Main exporters: South America, ,India Australia, South Africa
• Main importers: Far East, Continent,North America
*Major bulk trade includes Iron ore,Grains, Coal, Bauxite and Phos. Rock.
18
Cargoes
Main exporters

Coal seaborne trade
The Market
A l l i e d S h i p b r o k i n g I n c .
• Constitutes approximately 40% ofglobal major bulk trade*
• Main exporters: North America,South Africa, Australia, SouthAmerica
• Main importers: Far East, Continent,South America *Major bulk trade includes Iron ore,
Grains, Coal, Bauxite and Phos. Rock.
19
Cargoes
Main exporters
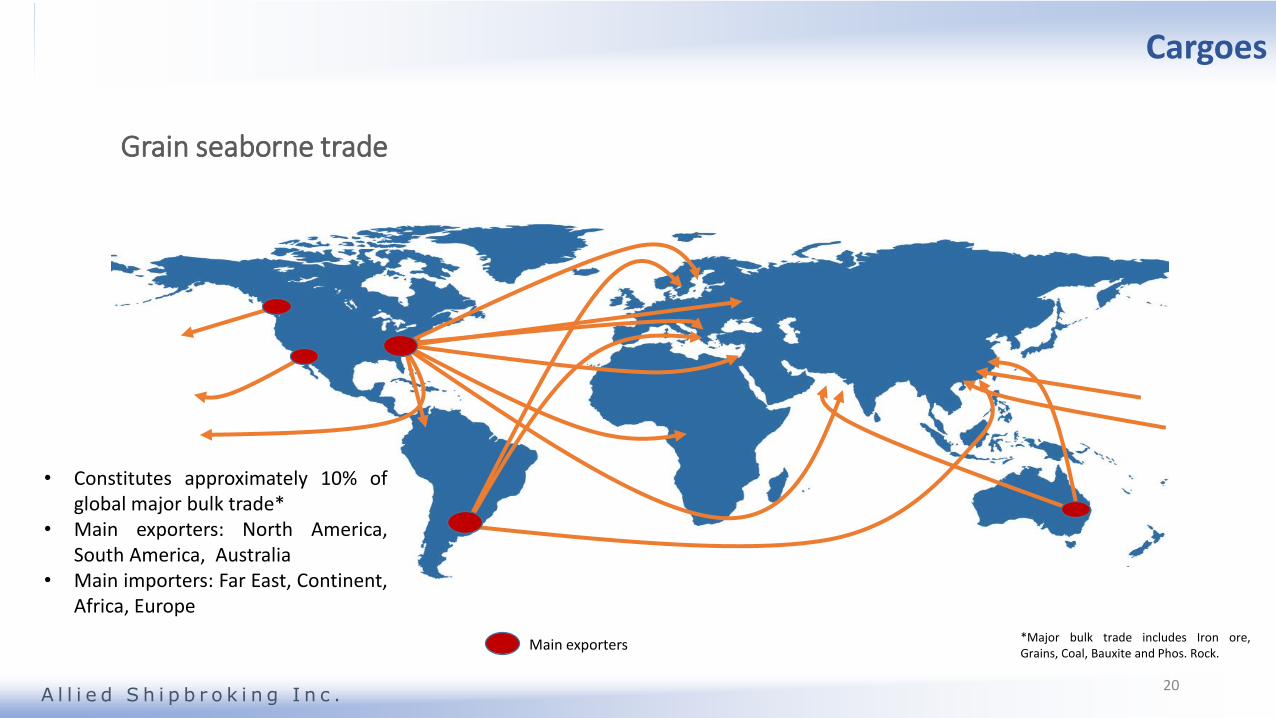
Grain seaborne trade
The Market
A l l i e d S h i p b r o k i n g I n c .
• Constitutes approximately 10% ofglobal major bulk trade*
• Main exporters: North America,South America, Australia
• Main importers: Far East, Continent,Africa, Europe
*Major bulk trade includes Iron ore,Grains, Coal, Bauxite and Phos. Rock.
20
Cargoes
Main exporters
Cargoes

LEGAL DISCLAIMER
-----------------------------------------
This report has been produced on information collected from various sources and whilst every care has been taken in
its preparation, it is presented for the sole and exclusive information of its recipients, in good faith and without any
guarantee from our part. None of the information contained in this report has been independently verified by any
member of “ALLIED SHIPBROKING INC”. Consequently no representation or warranty, express or implied, is
made in respect of the accuracy of the information contained herein. Neither our company nor its directors or
employees shall be in any way liable for any loss nor damage occurred to any party by the use of the information
and/or the comments contained in this report. Furthermore, no responsibility is accepted in respect of any errors or
inaccuracies which may be contained in this report. Whilst every care has been taken in the preparation of this report,
no liability can be accepted for any loss incurred in any way whatsoever by any person relying on the information
contained herein.
Dry bulk fleet profile
A l l i e d S h i p b r o k i n g I n c .